Abstract
An experiment-supported simulation process chain is set up to perform numerical forced response analyses on a transonic high-pressure compressor front stage at varying operating conditions. A wake generator is used upstream of the rotor to excite a specific resonance within the operating range of the compressor. Thereby, extensive aerodynamic and structural dynamic experimental data, obtained from state-of-the-art rig testing at the Transonic Compressor Darmstadt test facility at the Technical University of Darmstadt, are used to validate numerical results and ensure realistic boundary conditions. In the course of this, five-hole-probe measurements at steady operating conditions close to the investigated resonance enable a validation of the steady aerodynamics. Subsequently, numerically obtained aeroelastic quantities, such as resonance frequency, and damping, as well as maximum alternating blade stresses and tip deflections, are compared to experimental blade tip timing data. Experimental trends in damping can be confirmed and better explained by considering numerical results regarding the aerodynamic wall work density and secondary flow phenomena. The influence of varying loading conditions on the resonance frequency is not observed as distinctly in numerical, as in experimental results. Generally, alternating blade stresses and deflections appear to be significantly lower than in the experiments. However, similar to the aerodynamic damping, numerical results contribute to a better understanding of experimental trends. The successive experimental validation shows the capabilities of the numerical forced response analysis setup and enables the highlighting of challenges and identification of potential further adaptations.
Keywords:
axial compressor; transonic; aerodynamics; aeroelasticity; forced response; numerical; experimental 1. Introduction
Recent advances in modern aero engines aim for a reduction of exhaust gas emissions driven by the environmental challenges associated with climate change. This can be achieved, for instance, by a further increase in efficiency and a reduction in engine weight. In the course of this, the core engine size is reduced, and transonic rotor blisk designs are established in the high-pressure compressor front stages. Thus, the blade loading increases, and secondary flow phenomena are reinforced. Simultaneously, the blisk design is accompanied by a reduced overall structural damping, while thin transonic airfoils lower the stiffness of the blades. As a result, the aerodynamic forcing both within the passage as well as through reinforced blade-row interaction increases, and the rotor blades become progressively more susceptible to vibrations. The fluid-structure interaction is of major concern when further pushing the boundaries of the aerodynamic and structurally dynamic operability of modern jet engine compressors. Therefore, extensive research on aeroelasticity has already been conducted for many years, and the associated effects are much better understood and controllable. However, experimental and numerical tools to assess aeroelastic effects in the design phase still need to be developed further in order to enable the design of even higher-loaded advanced compressor stages while maintaining reliability and safety.
[⋯] advances can occur only through systematic and thorough analytical [and numerical] developments […] calibrated through laboratory, rig, and engine testing. There appear to be no short cuts.—Srinivasan, 1997 [1]
Accordingly, this paper outlines the systematic experiment-supported setup of a simulation process chain to perform numerical forced response analyses on a transonic high pressure compressor stage at varying operating conditions. Thereby, experimental data obtained from state-of-the-art rig testing are used to validate numerical results and ensure realistic boundary conditions within the numerical setup.
Experimental investigations are conducted at the Transonic Compressor Darmstadt (TCD) test facility operated by the Institute of Gas Turbines and Aerospace Propulsion at the Technical University of Darmstadt (TUDa). Corresponding numerical investigations are performed in collaboration with the KTH Royal Institute of Technology in Stockholm. The superordinated framework of this study is the European research project ARiAS (Advanced Research into Aeromechanical Solutions), with the goal of further investigating blade vibration phenomena. Within the scope of this project, the causes and effects of blade-row interaction on aeromechanical vibrations are characterised experimentally in order to explain underlying physical mechanisms further and, ultimately, to validate and enhance numerical prediction and design tools in industry and academia.
This study aims to highlight challenges and their potential causes occurring within a standard numerical forced response simulation process chain through comparison with high-quality experimental data at similar operating conditions. In the course of this, potential adaptations to the setup are mentioned and should enable an improvement in forced response prediction in future work. Furthermore, numerical results are used to improve comprehension of trends seen in the experimental data.
2. Methods
Experimental investigations are conducted at the TCD test facility at TUDa in order to obtain extensive aerodynamic and aeroelastic data on the forced response vibrations of a transonic high-pressure compressor blisk rotor. The obtained experimental data enable successive validation of numerical results within the setup of a forced response simulation process chain and provide realistic boundary conditions. Numerical forced response analyses are performed in varying operating conditions using the state-of-the-art software tool Ansys.
2.1. Experimental Investigation—Test Rig, Instrumentation, and Measurement Procedure
The TCD is an open-loop axial compressor test rig, at which extensive measurements are conducted for compressor cores representative of a transonic high-pressure compressor front stage in modern aero engines. A schematic of the test facility setup as well as a sectional view of the investigated compressor core are shown in Figure 1. Ambient air is sucked in and fed into a settling chamber through an inlet throttle and duct. Therein, several screens ensure a homogeneous inflow to the actual test section with the compressor core, which is followed by the outflow section, including a mechanical throttle with a safety bleed to control the operating condition by regulating back pressure and therefore mass flow as well as the total pressure ratio. Behind the test section and below the outflow section, the drive train is located, consisting of an electric 800kW-DC-motor, a gearbox, and a torquemeter.
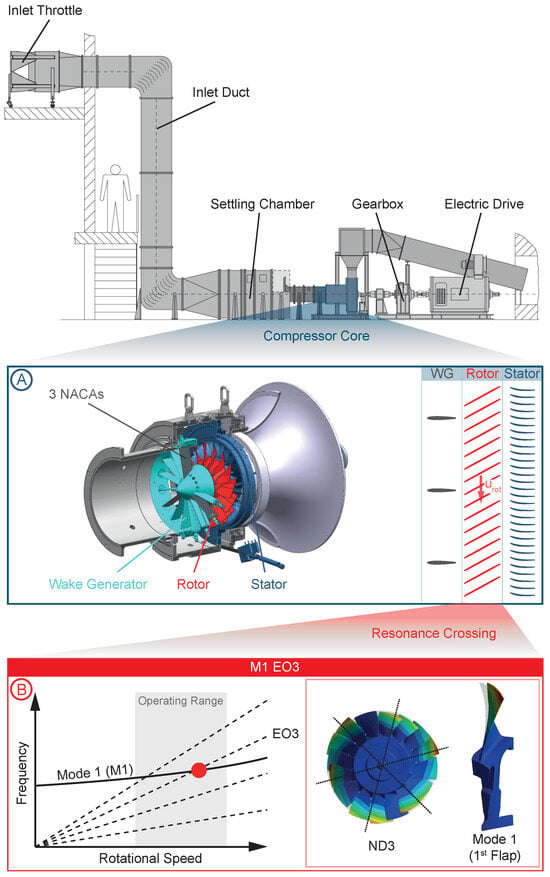
Figure 1.
Test rig and compressor core configuration (A) including the investigated resonance crossing and vibration mode shape (B).
The investigated compressor core is shown enlarged in Figure 1A. The modularly designed test section can generally either be set up as a 1- or 1.5-stage configuration and allows a flexible changing of the rotor, the casing, as well as the instrumentation. The investigated 1.5-stage ARiAS configuration consists of a wake generator (WG), a blisk rotor with 16 blades, designed by MTU Aero Engines and operated at transonic conditions, as well as a 3D-optimized stator with 29 vanes, designed within the Institute of Gas Turbines and Aerospace Propulsion at TUDa (see Bakhtiari et al. [2]) in collaboration with the German Aerospace Centre (DLR). For this study, the WG consists of three NACA airfoils in order to excite forced response vibrations of the first bending mode (M1) at an engine order three (EO3) crossing within the operating range, as illustrated in Figure 1B.
The test facility is extensively equipped with steady and unsteady instrumentation, capturing the aerodynamics and structural dynamics of the compressor stage, as outlined in detail by Klausmann et al. [3]. Within this study, the focus is on performance measurements to determine the operating condition close to resonance, five-hole-probe (5HP) measurements to obtain more detailed 1D and 2D information on the steady flow field and the excitation caused by the WG close to resonance, and blade tip timing (BTT) measurements to derive aeroelastic vibration quantities within the resonance.
The schematic compressor map in Figure 2 illustrates the operating conditions at which corresponding measurements are conducted. The 5HP measurements are performed in the rotor inlet and outlet plane at three operating points (OP) along two steady speed lines, reaching from near choke (NC) through peak efficiency (PE) to near stall (NS) conditions. Measurements at nominal design speed (N100) serve as a reference but are not further outlined in the course of this paper. The focus is on part-speed operation at 87% design speed (N87), which represents operating conditions close to the expected M1 EO3 resonance. At the conditions close to the resonance, steady measurements of the flow field are possible without compromising the structural integrity of the rotor due to resonant vibrations. Generally, the 5HP is capable of measuring the pressure at five radially and circumferentially distributed locations and enables a subsequent derivation of total and static pressure, Mach number, as well as radial and circumferential flow angle. In order to obtain 1D and 2D information on the flow field, the probe is radially traversed, and stationary components, such as the WG and stator, are circumferentially clocked relative to the fixed probe position, as illustrated in Figure 2A. The measurement grid covers one WG passage, or a 120° section of the flow path, respectively, consisting of several distinct radial and circumferential traverses.
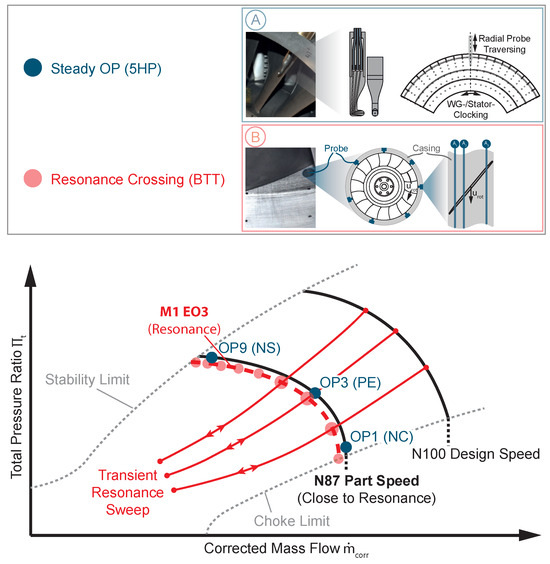
Figure 2.
Schematic compressor map illustrating conducted measurements with five-hole probe (A) and blade tip timing (B).
For the purpose of the BTT measurements, transient acceleration and deceleration manoeuvres, denoted as resonance sweeps (RS), are performed, crossing the M1 EO3 forced response resonance at nine predefined throttling conditions OP1 (NC) to OP9 (NS) of the compressor. In total, about 150 resonance sweeps are evaluated within this study, covering variations in operating conditions, de- and acceleration, WG-to-stator relative clocking position, and ambient conditions. The BTT system is a non-intrusive measurement technique used to monitor rotor blade vibrations and tip clearances in operation. It is based on capacitive probes flush-mounted in the rotor casing at several distinct circumferential and axial positions, as illustrated in Figure 2B. The system used at the TCD test facility was developed by MTU Aero Engines (see Zielinski and Ziller [4]). The number and distribution of probes are chosen with respect to specific mode shapes and nodal diameters of interest. Generally, the passing period of a blade tip between several probe pairs is recorded and compared to the expected time of arrival of a non-deflected blade. Based on the obtained difference, blade tip deflections are derived, and subsequently, aeroelastic quantities, such as resonance frequency, total damping, and maximum alternating blade stresses, are obtained through a post-processing procedure. Furthermore, derived quantities are obtained for each individual blade and therefore enable an assessment and consideration of the unintended structural mistuning of the investigated rotor.
In order to obtain performance data at resonance crossings without remaining stationary within the resonance, transient RS are performed with shaft accelerations low enough to assume quasi-steady conditions when crossing the resonance (compare Hackenberg and Hartung [5]). Hence, performance measurement systems, which exhibit low-pass behaviour and are therefore usually used for steady measurements only, could be considered. The obtained performance data within the resonance partially serves as boundary conditions in the numerical forced response analyses to subsequently ensure appropriate comparability between experiments and simulations.
2.2. Numerical Simulation Process Chain
The numerical investigations are carried out in collaboration with the KTH Royal Institute of Technology Stockholm, using recent state-of-the-art numerical software tools such as Ansys CFX for computational fluid dynamic simulations (CFD) and Ansys Mechanical for structural dynamic simulations. The Lichtenberg High Performance Computer (HPC) at TUDa is used for more elaborate simulations. The simulation process chain comprises multiple steady and transient fluid dynamic as well as structural dynamic simulations, which are implemented and coupled in the Ansys Workbench. The general simulation steps of a numerical forced response analysis are outlined in Figure 3. The fluid and structural dynamic simulations needed in order to numerically represent fluid-structure interaction within the aeroelastic phenomenon of forced response as well as exchanged quantities are illustrated.
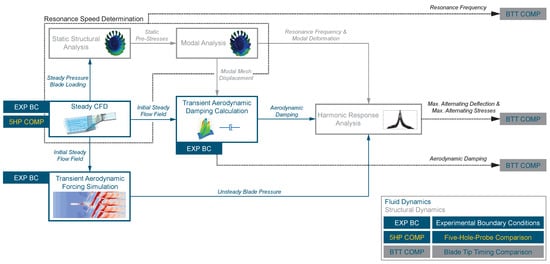
Figure 3.
Numerical simulation process chain.
Initially, a mesh convergence study and an investigation on the influence of varying boundary conditions are conducted on a single-passage steady CFD setup at N87 part speed close to resonance. Thereby, experimental performance data are used as boundary conditions in order to simulate comparable operating conditions. A successive comparison with experimental 5HP data (5HP COMP in Figure 3) leads to specific adjustments to the numerical settings and boundary conditions. The steady CFD setup is followed by a static structural simulation, which is based on a finite element (FE) model of the blisk section, including fillets and corresponding material properties, in order to obtain the stiffness matrix, including effects originating from centrifugal and steady pressure loads. Subsequently, within a modal analysis, the resonance frequency of the relevant mode and nodal diameter, as well as the corresponding modal deformation, are derived. The iterative resonance speed determination process starts at a steady N87 part speed condition close to resonance, obtaining a resonance frequency from the three previously described simulation steps, such as steady CFD and static structural and modal analysis. The resonance frequency is converted into the rotational speed of the rotor by taking the investigated EO3 into account. The rotational speed is then adjusted in the steady CFD setup accordingly. This results in a different steady pressure load applied to the blade surface within the static structural analysis, which in turn delivers a new resonance frequency from the modal analysis. This procedure is repeated iteratively until the deviation between resonance frequency, obtained from the modal analysis, and rotational speed, previously set in the steady CFD, is converged. Once the resonance rotational speed is determined, an aerodynamic damping calculation is conducted. For this purpose, a transient flutter analysis based on the Fourier transformation method in Ansys CFX is used. Thereby, the modal mesh displacement corresponding to the mode shape of the investigated M1 EO3 resonance, obtained from the modal analysis, is imposed on the blade surface CFD mesh, and the steady flow field is used as an initial condition. Simultaneously, a transient CFD simulation, based on the Ansys time transformation method, is performed to determine the aerodynamic forcing acting on the rotor, mainly caused by the upstream WG. In the course of this, the unsteady pressure on the blade suction and pressure sides is considered aerodynamic forcing and is obtained as the coefficients of the real and imaginary parts of the EO3 excitation frequency content of a corresponding Fourier decomposition. Finally, a harmonic forced response analysis of the blisk rotor is conducted, considering the previously derived aerodynamic damping and unsteady blade pressure, as well as resonance frequency and modal deformation, to obtain maximum alternating blade stresses and deflections.
The entire simulation process chain is carried out under varying operating conditions. Experimental boundary conditions (EXP BC in Figure 3) are considered within the steady CFD, transient aerodynamic damping, and transient aerodynamic forcing simulations. In Figure 4, a section view of the CFD domain and important numerical interfaces, as well as corresponding experimental measurement sections (ME) within the TCD test facility and relevant flow quantities, are shown. In order to properly capture the casing boundary layer at the CFD inlet (ME15), which develops between ME03 in the settling chamber (see Figure 1) and the CFD inlet (ME15), a separate pipe section steady-state simulation is performed at each operating condition, wherein experimental boundary conditions from ME03 are used at the inlet and from ME15 at the outlet. Subsequently, the quantities obtained at the pipe section outlet are imposed as an inlet boundary condition in the actual steady CFD simulation of the stage. A boundary layer rake in ME15 of the test rig enables validation of the simulated inlet casing boundary layer. The flow direction at the inlet is assumed to be normal to the plane. The average outlet static pressure from the stage exit in ME30 is considered an outlet boundary condition. For all CFD simulations, the SST turbulence model [6,7,8] is applied. A transition model is not considered as the boundary layer is assumed to be fully turbulent with a turbulence intensity of 4% at the stage inlet. Fillets and part gaps are not included. Within the initial mesh convergence and boundary conditions study, flow quantities at the rotor inlet (ME20) and outlet (ME21) are compared to 5HP data. The finally derived aeroelastic quantities, such as resonance frequency, aerodynamic damping, maximum alternating blade stresses, and tip deflections, are compared to experimental BTT data (BTT COMP in Figure 3), obtained in ME2X (rotor casing).
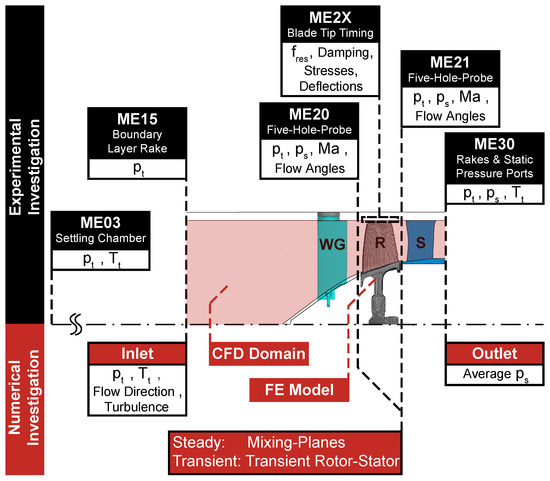
Figure 4.
Numerical domain and measurement sections within the test rig.
3. Results and Discussion
Initially, the steady aerodynamics are considered in terms of experimental characterization of the flow condition at the rotor inlet, representing aerodynamic forcing by the upstream WG, as well as the propagation of the wake through the rotor domain. Furthermore, numerical results are validated with steady 5HP data within the steady CFD setup at the beginning of the forced response simulation process chain (compare Figure 3). Subsequently, the results of numerical forced response analyses at varying operating conditions are discussed, and the obtained aeroelastic quantities are compared to experimental BTT data. In the course of this, the capabilities of the setup and especially the challenges, including the denomination of potential causes for deviations between numerical and experimental results, are highlighted.
3.1. Steady Aerodynamics
In order to assess steady aerodynamics and the aerodynamic forcing condition of the rotor, experimental (EXP) radial and circumferential profiles are derived from 5HP measurements. In Figure 5A, the corresponding measurement grid in the rotor inlet plane (ME20) is shown, consisting of several circumferential and radial traverses. Radial traverses with a finer circumferential spatial resolution are used within the expected wake region in ME20, whereas a circumferentially equidistant grid is used in ME21 (not shown here), since the propagation of the WG wake through the rotor domain, and as a result, its exact location at the outlet are unknown prior to the measurements. Circumferential traverses are measured at 20%, 50%, and 90% relative channel height, as shown in Figure 5B. Based on all traverses, an interpolation of the measured flow quantities on a common radially and circumferentially equidistant grid is performed in order to obtain 2D flow fields, as shown in Figure 5C.
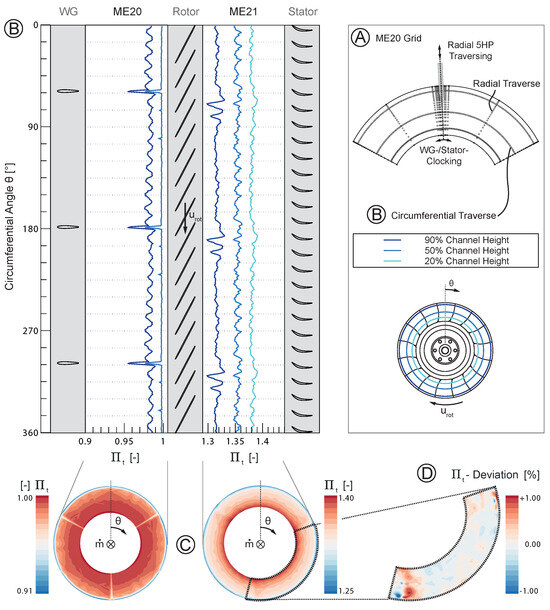
Figure 5.
Experimental total pressure ratio circumferential profiles and 2D flow fields at N87 PE.
Figure 5B outlines the circumferential distribution of the total pressure ratio in ME20 and ME21 (referring to the total pressure in ME03), including the stage vane rows. At 90% relative channel height, the mean level is lower due to the casing boundary layer influence. Additionally, an upstream influence of the stator vanes can be observed at 90% relative channel height in ME20. The number of fluctuation periods corresponds to the number of stator vanes. This might originate from an upstream influence of the stator potential fields and their interaction with the oblique shocks in the transonic rotor tip region at part speed and therefore reduced back pressure and mass flow. The influence of the WG wakes cannot be seen as clearly in ME21, considering the absolute values. A relative total pressure loss of about 3.5% is observed in ME20 within the wakes, while this is mitigated towards ME21 by a locally increased total pressure ratio of about 1% in the wake regions. In ME21, an increased total pressure ratio is seen in the wake region since the rotor locally experiences a decreased axial Mach number and, as a result, a positive incidence when passing through the wake regions, causing a locally increased blade loading and total pressure rise. Furthermore, the wake is shifted about 15° in the rotor rotational direction and its circumferential extent increases through the rotor domain. A localization of the wake region and its circumferential extent at the rotor outlet is enabled by deriving the deviation from the stator-passage-wise mean of the total pressure ratio, as shown in Figure 5D.
In order to set up the numerical forced response simulation process chain, the steady CFD setup is initially adjusted through comparison with experimental 5HP data regarding the global operating conditions within the compressor map as well as the flow field in ME20 and ME21. For this purpose, the reference steady speed line at N87 is simulated with an initial mesh and standard conditions at the inlet of the CFD domain (ME15 in Figure 4). The obtained PE operating point is then simulated again with experimental performance data at N87 PE as boundary conditions. Based on this operating point, a mesh convergence study is conducted, including a variation of the applied turbulence model. The resulting steady CFD setup, including a refined mesh, the chosen SST turbulence model, and experimental boundary conditions in ME15 and ME30, is used to calculate the numerical N87 speed line again. A comparison of the global operating conditions between the results obtained from the corresponding numerical setup and the experimentally measured speed line indicates a good agreement regarding the total pressure and temperature ratio, but with a shift towards higher corrected mass flows of about 1.5% to 2% in the numerical results. Furthermore, a comparison of radial and circumferential profiles with experimental 5HP data regarding total pressure ratio, Mach number, and flow angles shows that trends in the steady aerodynamics, especially in the total pressure loss within the wakes of the NACA airfoils, representing the aerodynamic forcing in subsequent forced response analyses, are captured. Nevertheless, offsets in the mean total pressure and Mach number level can be observed compared to the experiments. This leads to a further refinement of the CFD mesh, focusing on the tip clearance region, and the usage of a separate pipe section steady-state simulation to obtain the radial inlet total pressure and temperature profiles, considering the developed boundary layer, instead of constant quantities over the whole inlet plane, as described in Section 2.2. A comparison of the simulated inlet boundary layer and the measured boundary layer in ME15 indicates a very good numerical representation. Thus, an improvement of the steady CFD setup is achieved by specifically considering experimental boundary conditions and deriving adjustments based on a comparison of the steady aerodynamics.
In Figure 6, radial profiles of the total pressure ratio at N87 PE are exemplarily shown. Experimental 5HP results and numerical results (NUM) of the final adjusted steady CFD setup are compared. Additionally, the range of minimum and maximum total pressure ratios is included, representing the conditions within wake and passage. The experimental interpolated mean represents the circumferential mean of the 2D flow field data, obtained from the described interpolation of measured radial and circumferential traverses (compare Figure 5A) on an equidistant grid. A circumferential mean of the raw measured data points would result in an unrepresentative wake-dominated radial profile in ME20 since more grid points are placed within the wake region. A distinct cut in the experimental interpolated mean profile at 90% relative channel height in ME20 results from the measurement grid and the applied interpolation method. A slight overestimation of the wake strength, or losses, respectively, from midspan towards hub can be observed in the numerical results. Furthermore, a slight overestimation of the total pressure ratio in the tip region occurs, which might originate from an underestimation of the developed casing boundary layer, even though the EXP and NUM boundary layer profiles match in ME15. In ME21, a propagation of the overestimation in the tip region appears. It is noted that, due to an issue regarding the aerodynamic calibration of the 5HP in regions with high radial Mach numbers, EXP values below 20% relative channel height in ME20 are not representative.
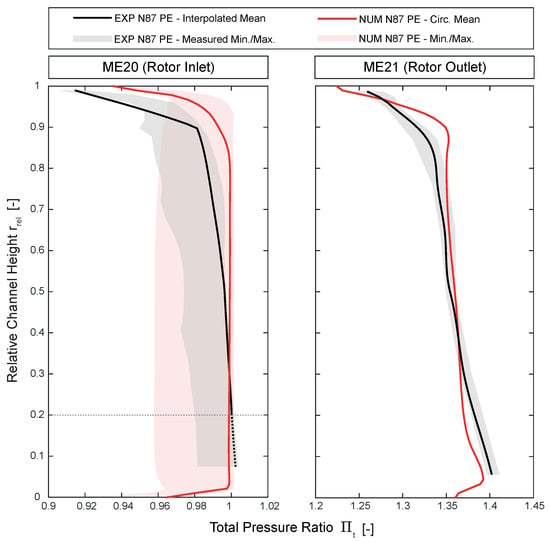
Figure 6.
Experimental and numerical rotor inlet and outlet total pressure radial profiles at N87 PE.
Highlighting potential adaptations regarding the general CFD setup, a further mesh refinement aiming for a well below 1 on all walls, especially on the NACA airfoils of the WG and within the rotor domain, as well as a finer resolution of the tip clearance region, should be targeted. Additionally, part gaps at the wake generator hub and shroud trailing edges should be modelled within the CFD domain by using a hybrid structured-unstructured mesh. Measured turbulence quantities at the stage inlet (ME15) could be beneficial with respect to proper boundary conditions for the applied turbulence model and hence the propagation of and interaction with boundary layers within the domain. Furthermore, modelling a variable-area outlet nozzle to control the back pressure could improve convergence behaviour, especially towards near-stall operating conditions (see Vahdati et al. [9]).
3.2. Forced Response Analyses
Based on the improved steady CFD setup, the entire numerical forced response simulation process chain, outlined in Figure 3, is conducted for the M1 EO3 resonance at varying operating conditions, and the obtained results are successively compared to experimental BTT data. In order to illustrate the investigated resonance crossings and the dependency of resonance frequency on the operating condition, a Campbell diagram based on experimental BTT data is derived, as shown in Figure 7. Therein, a critical frequency band within the operational rotational speed range of the compressor stage can be identified, which covers all loading conditions along a corresponding resonance line in the compressor map instead of one distinct crossing (compare Figure 1B). The resonance frequency of M1 EO3 appears to decrease towards operating conditions with increased loading.
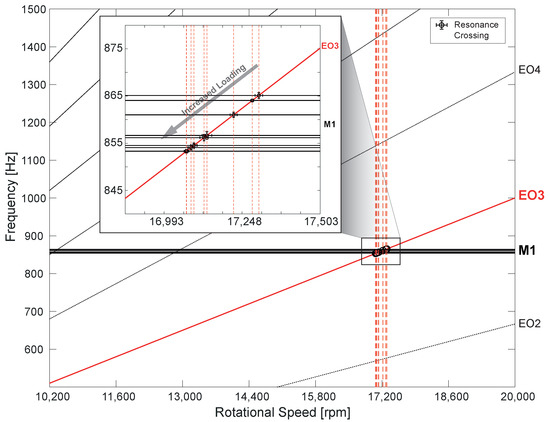
Figure 7.
Experimental Campbell diagram of M1 EO3 resonance crossings at varying loading conditions.
In the following, experimental and numerical results at different operating conditions are outlined in order to assess the dependency of the aforementioned aeroelastic quantities on the loading condition of the transonic blisk rotor and the corresponding numerical representation.
A comparison of the experimentally and numerically obtained resonance frequencies is shown in Figure 8. The experimental results include the data points of each performed resonance sweep (solid black points) and a trend through the mean values at nine distinct operating points (dashed black line), as well as the range between moving averages of maximum and minimum individual blade values (grey area). Values vary between the blades due to unintended structural mistuning on the investigated rotor, which is further discussed later. The results shown here confirm the dependency of the M1 EO3 resonance frequency on the operating condition, as previously outlined in Figure 7. The dependency seems to decrease with high loading conditions. Numerically obtained resonance frequencies seem not to be dependent on the corrected mass flow or operating condition, respectively, as seen in the experiments. However, considering the numerical results separately (see Figure 8A), a similar trend as in the experiments can be observed, but on a much smaller scale. It can be concluded that a varying mass flow and, therefore, a varying blade loading, depending on the operating condition, appear to have an influence on the resonance frequency. It seems to increase towards near-choke conditions. However, this cannot be the sole cause for variations due to changing operating conditions, since different mass flow and blade loading are considered in the simulations, but significantly larger dependencies appear in the experimental results.
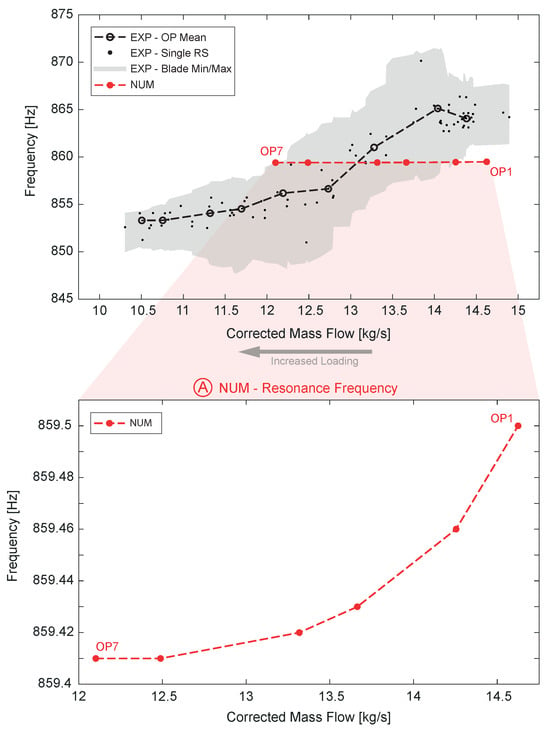
Figure 8.
Comparison of experimental and numerical resonance frequencies.
In addition, the numerical studies are conducted with standard literature material properties, such as Young’s modulus and Poisson’s ratio, of the used titanium alloy, which do not necessarily correspond to the exact values of the investigated blisk rotor. The influence of a varying Young’s modulus is investigated by comparing two different values from the literature for the same alloy. The proportionality of the resonance frequency to the square root of the Young’s modulus is thereby confirmed. Furthermore, it is shown in the simulations that the average blade surface temperature increases by about 6 Kelvin from OP1 towards OP6 at higher loading conditions, causing a decreased Young’s modulus and, as a result, an expected decreased resonance frequency of about 1.4 Hz. Even though this temperature range does not exclusively cause the trend in experimental frequencies, it has an influence that is not negligible with respect to the numerically obtained frequency range and does not consider material temperature variations.
The numerical resonance speed determination could be especially improved by considering the specific hot blade geometry and untwist, which are dependent on the operating condition. Yet, the hot blade geometry at the aerodynamic design point has been used for all investigations. This could be part of future work once a proper hot-transformation procedure is established, which could potentially even be applied to 3D scan data of the blisk, ultimately enabling numerical investigations of the real manufactured blade geometry. Furthermore, a proper determination of material properties and their temperature dependency, especially of the Young’s modulus, for the investigated blisk rotor is essential, since general values found in the literature for the corresponding material vary significantly. Based on the temperature dependency of relevant material properties, the blade temperature should also be considered within structural dynamic simulations.
Subsequently, the aerodynamic damping is calculated through transient blade flutter analyses on a two-passage rotor-only domain. The necessary inlet and outlet boundary conditions are extracted from previous steady CFD simulations. In order to prevent acoustic reflections on the inlet and outlet planes, which could artificially interfere with the work input of the flow into the blade (hence with the actual aerodynamic damping), corresponding planes are set as acoustically non-reflective. This functionality has recently been implemented in Ansys CFX, as described by Mueller et al. [10].
Corresponding experimental BTT and numerical results are shown in Figure 9. It is noted that damping obtained from the BTT system represents overall damping, including structural and aerodynamic damping, whereas only aerodynamic damping is derived within the transient blade flutter analyses. However, structural damping is assumed to be very small in blisk rotors. Similar trends are observed, whereas the numerically obtained damping is generally lower. Minimum damping occurs at near choke conditions, and maximum damping occurs around peak efficiency in both cases. The maximum damping region seems to be slightly shifted towards a higher mass flow rate in the simulations. However, decreased damping behaviour near stall cannot be representatively compared since corresponding operating conditions cannot not be simulated.
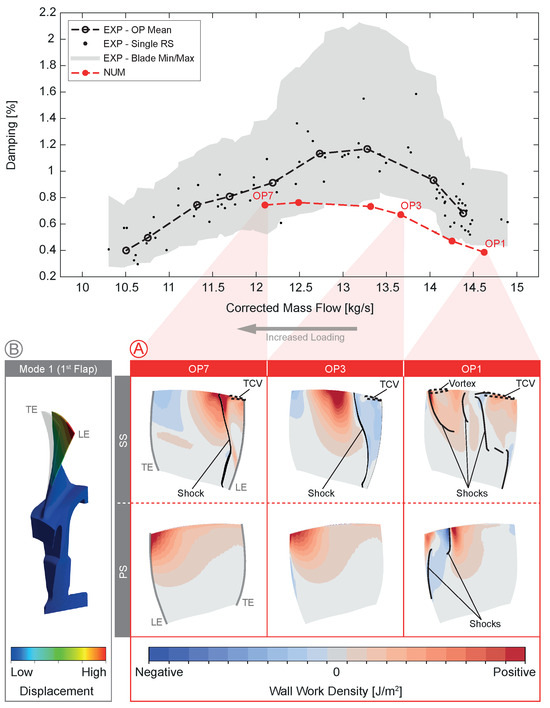
Figure 9.
Comparison and assessment of experimental and numerical damping including the distribution of aerodynamic wall work over the blade (A) for the investigated mode shape (B).
Nevertheless, trends are similar between experimental and numerical results, and deviations are relatively small, especially when considering blade-wise variations due to unintended mistuning in the experimental data. Based on these numerical results, observed trends can be assessed by considering the aerodynamic wall work density on the rotor blade surface. This quantity cannot be measured in experiments, but it provides important information on the origin of aerodynamic damping and its dependency on the loading condition. Generally, the aerodynamic damping is caused by the passage flow performing work on the moving blades, which is either extracting energy from the blade structure (corresponding to a positive aerodynamic wall work density in Figure 9), hence causing positive damping, or is causing an energy input into the blade reinforcing structural vibrations (corresponding to a negative aerodynamic wall work density). Positive aerodynamic wall work is most effective if it is performed in regions where maximum blade deflections occur and, hence, most structural kinetic energy is contained. In Figure 9A, the distribution of the average aerodynamic wall work density over one vibration cycle is shown on the rotor blade suction (SS) and pressure side (PS) for near choke (OP1), peak efficiency (OP3), and high loading conditions (OP7). Furthermore, the locations of shocks and vortices (e.g., tip clearance vortex, TCV) as well as the M1 vibration mode shape (see Figure 9B) are indicated.
At OP3, there is mainly positive damping on the PS related to regions of maximum modal displacement around the tip LE. A small area of negative damping occurs at mid-span, close to the LE. On the SS, the LE area is negatively damped. The shape of this area follows the shock position, where a switch to an area with pronounced positive damping appears. Another switch to a smaller area of negative damping appears close to the TE. Comparing this to other operating conditions, the region of pronounced positive damping on the SS at mid-span for OP3 moves upstream for an increased stage back pressure, or stage loading, respectively, as well as the negatively damped regions around LE and TE. The same effect can be seen on the PS. In turn, at OP1 with decreased stage back pressure, these regions seem to move downstream accordingly. This suggests the presence of an acoustic wave within the passage, which might originate from the LE or TE, whereas its phase is influenced by the stage back pressure. Thereby, the shock positions, secondary flow phenomena, such as the TCV, and the vibration mode shape are influencing the shape, size, and intensity, as well as the position of transitions between positively and negatively damped regions.
Hence, these numerical results suggest that the global aerodynamic damping results from the stage loading condition, or back pressure, respectively, governing the phase and therefore position of alternating positively and negatively damped regions, as well as shock positions and secondary flow phenomena, which are again dependent on the operating condition, influencing the shape, size, and intensity of these regions. Here, the location of the mentioned flow phenomena relative to the vibration mode shape seems to be important. As a result, the aerodynamic damping is lower at OP1 compared to OP3 due to the combination of the pronouncedly negatively damped region on the PS and the significantly less positively damped region on the SS. In turn, at OP7, the upstream moving pronounced positively damped regions, mainly on the SS but also on the PS, seem to displace the negative regions around the LE resulting in an overall slightly increased damping.
At loading conditions beyond OP7, the numerical setup used is not capable of reaching converged solutions; hence, a numerical investigation at these conditions is not possible within this study. However, based on the assumptions derived, the region of negative damping around the TE, which has already increased in size at OP7 compared to OP3, could move further upstream for an increased back pressure, displace the pronounced positive region, and cause a decreased overall aerodynamic damping towards near-stall conditions.
In order to potentially improve the numerical results of the aerodynamic damping calculation, further mesh refinement, especially in the tip clearance region, and a variation of the applied turbulence model should be considered. In addition, introducing a variable-area nozzle at the domain outlet, as mentioned before [9], could improve the numerical convergence and enable an investigation of the aerodynamic damping at near-stall conditions. Furthermore, the structural damping of the blisk rotor should be determined experimentally in order to enable the derivation of the pure aerodynamic damping from BTT data, which coincides with the damping obtained from the numerical simulations, for better comparability. In future studies, an investigation of different EO crossings causing vibrations at different mode shapes, e.g., the first torsional mode, should be conducted to further assess the assumptions made here regarding the influences on the aerodynamic damping originating from varying operating conditions.
Subsequently, the external unsteady aerodynamic forcing of the rotor, initiating corresponding forced response vibrations, is derived numerically. For this purpose, a transient blade row simulation with transient rotor stator interfaces is conducted, whereas unsteady effects are captured by applying the time transformation method in Ansys CFX. As a result, the unsteady pressure on the blades SS and PS are obtained as coefficients of the real and imaginary parts of the EO3 excitation frequency content of a corresponding Fourier decomposition.
Converged solutions are obtained for OP3, OP4, and OP6. Exemplary results for OP3 (PE) are shown in Figure 10. Since it is generally very challenging to experimentally measure unsteady pressures on the rotor blade surface in a high-speed rotating test rig, no experimental data are available to compare and validate numerical results within this simulation step.
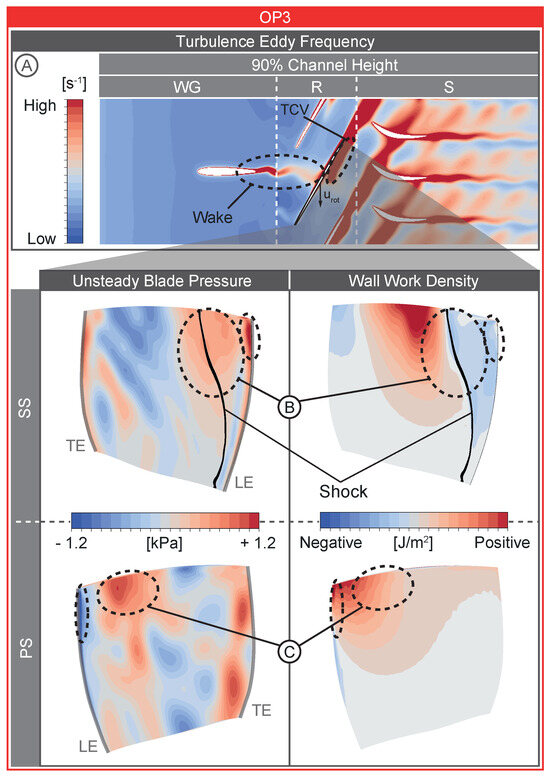
Figure 10.
Assessment of the aerodynamic forcing based on numerical results.
The blade-row interaction is captured by the numerical setup, as seen in Figure 10A. For this purpose, the turbulence eddy frequency is shown at 90% relative channel height. It enables the visualisation of loss regions, such as wakes and tip clearance vortices. Herein, the influence of WG wakes on downstream rotor blade aerodynamics can be clearly identified. Furthermore, vortex shedding is observed within the WG wake at this channel height. Additionally, the rear part of the tip clearance vortex, originating from the preceding blade, appears in the trailing edge pressure side region of each rotor passage. When evaluating the corresponding total pressure field at this channel height for several consecutive time steps, it can be observed that the upstream interaction of the oblique shock with the WG profile boundary layer leads to a thickening of the wake, contributing to the unsteadiness in rotor blade surface static pressure and therefore increased aerodynamic forcing. As the excitation of EO3 is investigated, the Fourier coefficients (real part) and (imaginary part) of the blade pressure are of interest regarding the unsteady aerodynamic forcing. In Figure 10B,C, the distribution of on the SS and PS is shown exemplarily. This generally needs to be compared to the aerodynamic wall work density (compare Figure 9A) and the vibration mode shape (compare Figure 9B), simultaneously, since regions with high blade pressure unsteadiness are not necessarily critical regarding forced response vibrations of a specific mode. High blade pressure unsteadiness is critical if high modal blade displacements and low aerodynamic wall work, hence damping, appear in the very same region. Such a critical region is highlighted in Figure 10B. This region is predominantly contributing to forced response vibrations in the investigated case. Furthermore, another region of comparably high blade pressure unsteadiness and high modal blade motion can be identified on the PS, as seen in Figure 10C. However, the positive aerodynamic wall work here dampens this excitation. But this region could potentially be more critical at near choke conditions due to the very low damping (compare Figure 9A OP1), ultimately resulting in higher forced blade deflections and stresses.
Obtained unsteady pressure distributions on the blade surface at different operating conditions are subsequently used to derive forced alternating blade stresses and deflections. Furthermore, explanatory approaches gained from the comparison of numerically obtained unsteady blade pressure and aerodynamic wall work density distributions are used to explain trends seen in experimental results for blade stresses and deflections.
Finally, taking the aerodynamic damping (compare Figure 9), the transient aerodynamic forcing (compare Figure 10), and the resonance frequency (compare Figure 8) with the corresponding vibration mode shape (compare Figure 9B) into account, harmonic forced response vibration stresses and deflections can be derived for the investigated blisk rotor at several operating conditions of the M1 EO3 resonance.
Results are compared to experimental BTT data, as outlined in Figure 11. Regarding the experimental results, maximum blade stresses (a) and tip deflections (b) are directly proportional and therefore show similar trends. Minima appear in the region around peak efficiency, with a slight shift towards a smaller mass flow rate in comparison to the damping (compare Figure 9). Stresses and deflections are mainly influenced by damping and aerodynamic forcing. Connections between the unsteady blade pressure and aerodynamic wall work, shown in the numerical results in Figure 10B,C, and their potential behaviour towards choke and stall conditions, based on the results in Figure 9, suggest increased aerodynamic forcing near choke and near stall, whereas unsteady flow instabilities occurring towards stall could additionally contribute to this. These explanatory approaches, based on numerical results, enable a better understanding of trends seen in the experimental data.
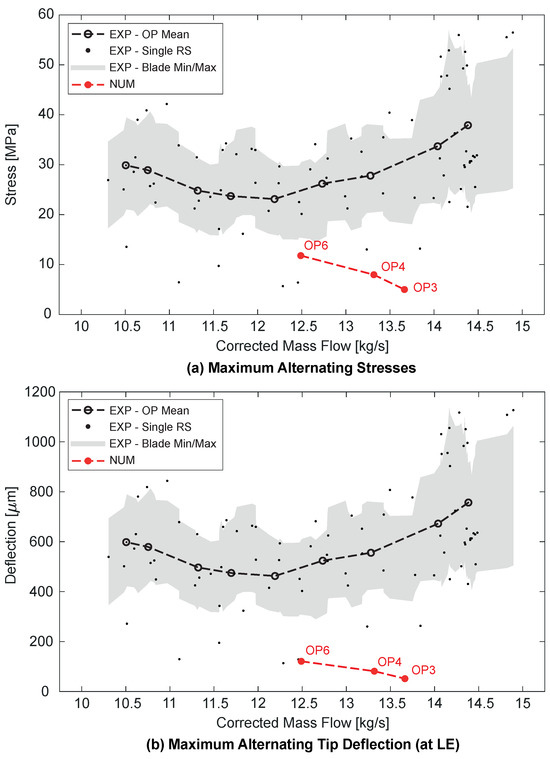
Figure 11.
Comparison of experimental and numerical maximum alternating blade stresses (a) and deflections (b).
It can be seen that the numerically obtained stress and deflection amplitudes are significantly lower than in the experiments, and trends seem to be shifted towards a higher corrected mass flow rate. Deviations in maximum alternating stresses range from a factor of 3 up to a factor of 10, whereas in maximum deflections, they range from a factor of 2 to a factor of 6. Since corresponding deviations in the aerodynamic damping are not in a similar order of magnitude and numerical values are even lower than in the experiments (compare Figure 9), there must be other sources for such deviations. The most probable causes for comparably low alternating blade stresses and deflections are potential additional forcing of M1 EO3 within the test facility as well as unintended structural mistuning of the investigated rotor, which are not considered in the numerical setup.
Additional forcing might originate from upstream and downstream geometries, such as, for instance, outlet guide vanes and instrumentation, which are not modelled in the CFD domain (compare Figure 4). This assumption is supported by the fact that M1 EO3 is also excited within other measurement configurations without a WG upstream of the rotor. However, this additional force might also originate from the rig drive train. Another possible cause might be an underestimation of the interaction between WG wakes and rotor blade aerodynamics in the course of numerical transient aerodynamic forcing simulations. This can either be due to the application of the time transformation method at the important interface between WG and rotor, which might lead to an artificial mitigation of the wake, or due to an underestimation of total pressure losses associated with the wake. However, a comparison of radial total pressure ratio profiles at steady N87 PE conditions close to resonance (compare Figure 6) suggests rather an overestimation of wake losses in conducted numerical simulations. In Figure 10A, an abrupt mitigation of the turbulence eddy frequency at the WG-R interface can be observed, suggesting that the applied transformation method causes an underestimation of the aerodynamic forcing.
Regarding the unintended structural mistuning of the investigated rotor, Figure 12 shows the individual blade resonance frequencies of M1 EO3 based on BTT data of all performed resonance sweeps. Additionally, the results of a static modal Ping-test (see Kuehhorn and Beirow [11]), conducted by BTU Cottbus, are included in order to see the difference in blade-wise deviations between the static cold and rotating hot systems. Generally, it can be seen that a structural mistuning is present. According to Whitehead [12], unintended structural mistuning can lead to a maximum amplification factor in deflection amplitudes of 2.5 in the case of the investigated rotor with 16 blades. This only represents the maximum possible amplification and does not consider the actual mistuning, but only the number of rotor blades. Furthermore, an amplification of the mistuned deflections compared to the tuned deflections is only expected for individual blades and represents the maximum occurring amplitude rather than the average mistuned amplitude over all blades. The average mistuned amplitude is expected to be even lower compared to the tuned case considered here, which entails even larger differences between numerical and experimental results.
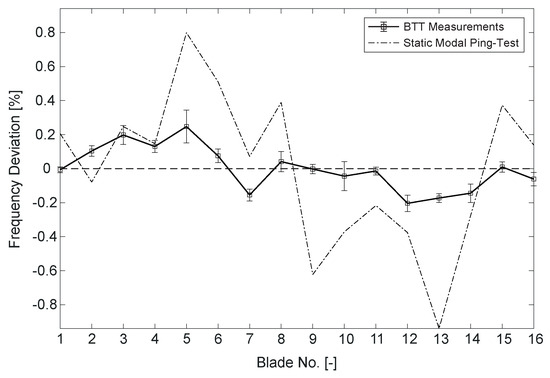
Figure 12.
Unintended structural frequency mistuning of the investigated blisk rotor.
To encounter low numerical blade stresses and deflections, the CFD domain (compare Figure 4) should be extended, additional upstream and downstream geometries, like outlet guide vanes, included, and corresponding forcing considered within the harmonic response analysis. Furthermore, a full-annulus simulation should be conducted, since thereby the number of interfaces at which numerical transformation methods are applied is reduced, which might benefit the better propagation of the wake influence into the rotor domain. Additionally, the unintended structural mistuning should either be taken into account within the harmonic response analysis by specifying individual blade eigenfrequencies obtained from BTT evaluations or by deriving a full 360° FE mesh of the blisk rotor based on 3D scan data of the real manufactured blisk, which will in turn be used within static structural, modal, and harmonic response analyses for better comparability to experimental results.
A numerical investigation should be conducted at a different resonance crossing, e.g., M2 EO8, where an additional external forcing at EO8 besides the intended forcing by the upstream wake generator is not seen in experimental results. Therewith, the assumption of an additional external forcing at EO3, e.g., originating from the rig drive train, causing significantly higher deflection amplitudes compared to the numerical results in the case considered here, could be validated.
4. Conclusions
A numerical forced response simulation process chain has been set up for the investigated 1.5-stage transonic axial compressor configuration based on boundary conditions, specifically measured at the TCD test facility, and improved through an extensive comparison with aerodynamic and structural dynamic experimental data. The implemented experiment-supported numerical forced response simulation process chain, comprising a resonance speed determination with steady state CFD, static structural and modal analysis, as well as aerodynamic damping calculation, transient aerodynamic forcing simulation, and a final harmonic response analysis, has been conducted at varying operating conditions for the M1 EO3 resonance. Numerically obtained vibration quantities have been compared to previously evaluated experimental BTT data. Thereby, experimental trends in the damping can be confirmed and better explained by considering numerical results regarding the aerodynamic wall work density and secondary flow phenomena. The influence of varying operating conditions on the resonance frequency has not been observed as distinctly in the numerical results. Generally, numerically derived alternating blade stresses and deflections appear to be significantly lower than in the experiments. However, similar to aerodynamic damping, numerical results have contributed to a better understanding of experimental trends.
The successive experimental validation has shown the capabilities of the numerical forced response analysis setup and enabled the highlighting of challenges and identification of potential further adaptations, which could be implemented in future work, in order to improve the approximation of the experimental setup and, as a result, the comparability between numerical and experimental results:
Regarding the general CFD setup:
- -
- A further mesh refinement with a target well below 1 on all walls and a finer resolution of the tip clearance region.
- -
- A modelling of part gaps at the WG hub and shroud trailing edges and between rotating and stationary components, e.g., at the hub between WG and rotor, as well as fillets.
- -
- An extension of the CFD domain and the inclusion of additional geometries located upstream and downstream of the compressor core.
- -
- A consideration of measured turbulence quantities at the domain inlet for varying operating conditions.
- -
- A modelling of a variable-area outlet throttle to control the stage back pressure and to improve the convergence behaviour, especially at near-stall conditions.
- -
- An implementation of a multi-passage domain or full-annulus simulation to further improve the convergence behaviour.
Regarding the resonance frequency:
- -
- A derivation and consideration of the hot blade geometry and untwist at varying operating conditions.
- -
- A proper determination of material properties and corresponding temperature dependencies of the investigated rotor.
Regarding blade stresses and deflections:
- -
- A variation of applied transformation methods at the WG-rotor-interface and the implementation of a full-annulus simulation to improve the propagation of wake influences and therefore the aerodynamic forcing on the rotor.
Regarding the damping:
- -
- An experimental determination of the structural damping of the investigated rotor to enable a comparison of pure aerodynamic damping between experiments and simulations.
Regarding frequency, stresses, and deflections:
- -
- A consideration of the unintended structural mistuning of the investigated rotor by either specifying individual blade eigenfrequencies from BTT data within the final harmonic response analysis or by deriving a full FE mesh of the blisk rotor from 3D scan data. Furthermore, the application of reduced order models, as described by Gutierrez Salas [13], could enable a proper consideration of unintended mistuning.
Author Contributions
Conceptualization, N.K., F.K., D.S. and M.G.S.; Methodology, N.K., F.K. and M.G.S.; Formal analysis, N.K.; Investigation, N.K. and F.K.; Writing—original draft, N.K.; Writing—review and editing, N.K., F.K., D.S., H.-P.S. and M.G.S.; Visualization, N.K.; Supervision, H.-P.S. and F.K.; Project administration, H.-P.S. and F.K; Funding acquisition, H.-P.S. All authors have read and agreed to the published version of the manuscript.
Funding
This research was funded by the European project EU-H2020 ARiAS (grant number 769346).
Data Availability Statement
Dataset available on request from the authors.
Acknowledgments
The authors gratefully acknowledge the support and helpful discussions with colleagues of the compressor and numerical simulation teams at TU Darmstadt as well as with the associates of the Unit of Heat and Power Technology at KTH Stockholm. In the course of the numerical studies, several simulations were performed on the Lichtenberg High Performance Computer (HPC) at TU Darmstadt. Furthermore, the authors would like to thank ANSYS® for providing us with licenses via their Academic Partner Program.
Conflicts of Interest
The authors declare no conflicts of interest.
Nomenclature
The following nomenclature is used in this manuscript:
| Latin | |
| Real part of first Fourier coefficient | |
| Imaginary part of first Fourier coefficient | |
| f | Frequency |
| Mass flow | |
| Mach number | |
| p | Pressure |
| r | Channel height |
| T | Temperature |
| u | Circumferential velocity |
| Normalised wall coordinate | |
| Greek | |
| Circumferential angle | |
| Pressure ratio | |
| Turbulence eddy frequency | |
| Subscripts | |
| Corrected | |
| Resonance | |
| Relative quantity | |
| Rotor | |
| Static quantity | |
| Total quantity | |
| Abbreviations | |
| 5HP | Five-hole probe |
| BC | Boundary condition |
| BTT | Blade tip timing |
| COMP | Comparison |
| EO | Engine order |
| EXP | Experimental |
| HPC | High performance computer |
| LE | Leading edge |
| M1 | Mode 1 (first flap/bending) |
| ME | Measurement section |
| N(100) | Rotor speed in percentage design speed |
| NC | Near choke |
| ND | Nodal diameter |
| NS | Near stall |
| NUM | Numerical |
| OP | Operating point |
| PE | Peak efficiency |
| PS | Pressure side |
| RS | Resonance sweep |
| SS | Suction side |
| TCD | Transonic compressor Darmstadt |
| TCV | Tip clearance vortex |
| TE | Trailing edge |
| TUDa | Technical University of Darmstadt |
| WG | Wake generator |
References
- Srinivasan, A.V. Flutter and Resonant Vibration Characteristics of Engine Blades. J. Eng. Gas Turbines Power 1997, 119, 742–775. [Google Scholar] [CrossRef]
- Bakhtiari, F.; Wartzek, F.; Leichtfuß, S.; Schiffer, H.-P.; Goinis, G.; Nicke, E. Design and Optimization of a New Stator for the Transonic Compressor Rig at TU Darmstadt; Deutscher Luft- und Raumfahrtkongress: Rostock, Germany, 2015; p. 370225. [Google Scholar]
- Klausmann, F.; Franke, D.; Foret, J.; Schiffer, H.-P. Transonic Compressor Darmstadt—Open Test Case. In Proceedings of the Global Power and Propulsion Society, Xi’an, China, 11–13 April 2021. GPPS-TC-2021-0029. [Google Scholar] [CrossRef]
- Zielinski, M.; Ziller, M. Noncontact Blade Vibration Measurement System for Aero Engine Application. In Proceedings of the 17th International Symposium on Airbreathing Engines, Munich, Germany, 4–9 September 2005. ISABE-2005-1220. [Google Scholar]
- Hackenberg, H.-P.; Hartung, A. An Approach for Estimating the Effect of Transient Sweep through a Resonance. J. Eng. Gas Turbines Power 2016, 138, 082502, GTP-15-1554. [Google Scholar] [CrossRef]
- Menter, F.R. Zonal Two Equation k-ω Turbulence Models for Aerodynamic Flows. In Proceedings of the 24th Fluid Dynamics Conference, Orlando, FL, USA, 6–9 July 1993. AIAA-93-2906. [Google Scholar] [CrossRef]
- Menter, F.R. Two-Equation Eddy-Viscosity Turbulence Models for Engineering Applications. AIAA J. 1994, 32, 269–289. [Google Scholar] [CrossRef]
- Menter, F.R.; Kuntz, M.; Langtry, R. Ten Years of Industrial Experience with the SST Turbulence Model. Turbul. Heat Mass Transf. 2003, 4, 625–632. [Google Scholar]
- Vahdati, M.; Sayma, A.I.; Freeman, C.; Imregun, M. On the Use of Atmospheric Boundary Conditions for Axial-Flow Compressor Stall Simulations. ASME J. Turbomach. 2005, 127, 349–351. [Google Scholar] [CrossRef]
- Mueller, T.R.; Vogt, D.M.; Fischer, M.; Phillipsen, B.A. On the far-field boundary condition treatment in the framework of aeromechanical computations using ANSYS CFX. Proc. Inst. Mech. Eng. Part A J. Power Energy 2020, 235, 1103–1118. [Google Scholar] [CrossRef]
- Kuehhorn, A.; Beirow, B. Method for Determining Blade Mistuning on Integrally Manufactured Rotor Wheels. U.S. Patent US 2010/0286934 A1, 20 September 2011. [Google Scholar]
- Whitehead, D.S. Effect of Mistuning on the Vibration of Turbo-Machine Blades Induced by Wakes. J. Mech. Eng. Sci. 1966, 8, 15–21. [Google Scholar] [CrossRef]
- Gutierrez Salas, M. Development of Accurate Reduced Order Models in a Simulation Tool for Turbomachinery Aeromechanical Phenomena. Ph.D. Dissertation, KTH Royal Institute of Technology, Stockholm, Sweden, 2018. [Google Scholar]
Disclaimer/Publisher’s Note: The statements, opinions and data contained in all publications are solely those of the individual author(s) and contributor(s) and not of MDPI and/or the editor(s). MDPI and/or the editor(s) disclaim responsibility for any injury to people or property resulting from any ideas, methods, instructions or products referred to in the content. |
© 2024 by the authors. Licensee MDPI, Basel, Switzerland. This article is an open access article distributed under the terms and conditions of the Creative Commons Attribution (CC BY-NC-ND) license (https://creativecommons.org/licenses/by-nc-nd/4.0/).