Article

Design of a 130 MW Axial Turbine Operating with a Supercritical Carbon Dioxide Mixture for the SCARABEUS Project †

by
Abdelrahman S. Abdeldayem
1,*,
Salma I. Salah
1,2,
Omar A. Aqel
1,
Martin T. White
1,3 and
Abdulnaser I. Sayma
1
1
Energy, Sustainability and Net Zero Research Centre, University of London, London EC1V 0HB, UK
2
Department of Mechanical Engineering, Centre for Renewable Energy, The British University in Egypt (BUE), Cairo 11837, Egypt
3
Thermo-Fluid Mechanics Research Centre, School of Engineering and Informatics, University of Sussex, Falmer, Brighton BN1 9RH, UK
*
Author to whom correspondence should be addressed.
This manuscript is an extended version of our paper published in the Proceedings of the 15th European Turbomachinery Conference, Budapest, Hungary, 24–28 April 2023.
Int. J. Turbomach. Propuls. Power 2024, 9(1), 5; https://doi.org/10.3390/ijtpp9010005
Submission received: 12 June 2023 / Revised: 19 November 2023 / Accepted: 28 December 2023 / Published: 2 February 2024

Abstract

:
Supercritical carbon dioxide (sCO2) can be mixed with dopants such as titanium tetrachloride (TiCl4), hexafluoro-benzene (C6F6), and sulphur dioxide (SO2) to raise the critical temperature of the working fluid, allowing it to condense at ambient temperatures in dry solar field locations. The resulting transcritical power cycles have lower compression work and higher thermal efficiency. This paper presents the aerodynamic flow path design of a utility-scale axial turbine operating with an 80–20% molar mix of CO2 and SO2. The preliminary design is obtained using a mean line turbine design method based on the Aungier loss model, which considers both mechanical and rotor dynamic criteria. Furthermore, steady-state 3D computational fluid dynamic (CFD) simulations are set up using the k-ω SST turbulence model, and blade shape optimisation is carried out to improve the preliminary design while maintaining acceptable stress levels. It was found that increasing the number of stages from 4 to 14 increased the total-to-total efficiency by 6.3% due to the higher blade aspect ratio, which reduced the influence of secondary flow losses, as well as the smaller tip diameter, which minimised the tip clearance losses. The final turbine design had a total-to-total efficiency of 92.9%, as predicted by the CFD results, with a maximum stress of less than 260 MPa and a mass flow rate within 1% of the intended cycle’s mass flow rate. Optimum aerodynamic performance was achieved with a 14-stage design where the hub radius and the flow path length are 310 mm and 1800 mm, respectively. Off-design analysis showed that the turbine could operate down to 88% of the design reduced mass flow rate with a total-to-total efficiency of 80%.

1. Introduction

Supercritical carbon dioxide power cycles (sCO2) are promising candidates for concentrated solar power (CSP) plants [1,2,3]. Supercritical CO2 power cycles operate between two pressure limits where both the heat addition and heat rejection pressures are higher than the critical point of the working fluid. Consequently, the compression process takes place in the supercritical phase using a compressor. The EU-funded SCARABEUS project [4] is investigating the applicability of transcritical power cycles operating with CO2 mixtures, where the working fluid is compressed in the liquid phase. This could result in enhanced power generation efficiency and bring the levelised cost of electricity (LCoE) of CSP plants to a competitive level within the renewable energy market [5]. Therefore, several sCO2-based mixtures have been proposed to increase the mixture’s critical temperature and hence allow for air condensation in a transcritical power cycle for dry regions where water cooling is not available [4,6].
According to the study presented by Tafur-Escanta et al. [7], blending CO2 with carbonyl sulfide (COS) increased the efficiency of the cycle to 45.05%, compared to 41.25% for pure CO2, while the specific investment cost decreased to 2621$/kWe for the blended CO2 cycle compared to 2811$/kWe for the pure CO2 cycle. The SCARABEUS consortium proposed hexafluorobenzene (C6F6), sulfur dioxide (SO2), and titanium tetrachloride (TiCl4) as possible candidate mixtures [8,9]. The effects of changing C6F6 and TiCl4 molar fractions on cycle performance were presented, considering safety and health characteristics [10,11]. The study revealed an absolute efficiency gain of 3% compared to pure CO2 cycles, whilst the optimum mixture molar fraction ranged from 10% to 20%. The cycle layouts were also simpler when using mixtures compared to pure CO2 cycles. Doping pure CO2 with 20% to 30% SO2 was investigated by Crespi et al. [9], which resulted in an optimised recompression cycle with an efficiency of 51% at 700 °C inlet temperature. This corresponds to an efficiency gain of 2% compared to the recompression cycle operating with pure carbon dioxide.
The SCARABEUS consortium has tested the thermal stability of the three candidate mixtures for operation at a turbine inlet temperature of 700 °C. According to the test results, titanium tetrachloride (TiCl4) did not thermally degrade at 700 °C. On the contrary, C6F6 showed signs of thermal degradation for temperatures above 600–625 °C. Unfortunately, the thermal stability of CO2/SO2 has not yet been confirmed after long exposure times, but the experimental investigation is currently underway. Previous studies in the literature have indicated that CO2/SO2 is thermally stable at temperatures above 700 °C [12]. In addition to thermal stability, environmental hazards were considered for the selected mixtures. TiCl4 has potential limitations due to its high reactivity with moisture in the air and the formation of HCl and TiO2, which are both hazardous to human health. For these reasons, and considering the cycle optimisation analysis, the current study aims to design the turbine flow path for a CO2-SO2 precompression cycle layout, which has demonstrated a superior performance compared to the other mixtures. It is worth mentioning that these mixtures are to be implemented for closed cycles developed for CSP applications. These power plants are strategically located in dry regions which are well-ventilated, effectively mitigating various threats, including the toxicity of SO2.
Research has determined that turbine performance influences the thermal efficiency of sCO2 cycles considerably [13,14,15]. A study by Novales et al. [13] estimated that sCO2 cycles can only compete with state-of-the-art steam cycles if turbine efficiencies are above 92%. They also estimated that a 1% efficiency change in the turbine could result in a 0.31–0.38% change in cycle efficiency. According to Brun et al. [15], a 1% decrease in turbine efficiency decreased cycle efficiency by 0.5%. Therefore, it is evident that the path to commercialisation of sCO2 cycles entails a better understanding of turbine design, yet it remains to be seen what effect CO2 mixtures have on the achievable performance.
Several authors have investigated the design of sCO2 turbines at different scales to reveal the critical design considerations and the expected efficiency ranges. Zhang et al. [16] conducted a CFD analysis on a 15 MW single-stage axial turbine, predicting a total-to-static efficiency of 83.96%. The study also demonstrated the significance of gas bending stresses on the turbine blades. However, the impact of adding additional stages to the turbine on the performance was not investigated. On the other hand, Shi et al. [17] predicted a total-to-total efficiency of 92.12% for a three-stage design for a 10 MW axial turbine. Moreover, they showed that the turbine can maintain 85% to 92% efficiency while operating at off-design conditions in the range of mass flow rate from 115 kg/s to 201.3 kg/s. Total-to-total efficiency above 90% was also predicted by Bidkar et al. [18] for four-stage and six-stage 50 MW and 450 MW axial turbines, respectively. Kalra et al. [19] designed a four-stage axial turbine for a 10 MW CSP plant. The study focused on practical considerations such as mechanical integrity, vibrational damping, sealing, shaft assembly, and operational transients. It highlighted the unique challenges imposed by sCO2 turbines, such as high torque requirements, small aerofoil fabrication, aero-design optimisation with mechanically safe blade design, and high cycle fatigue life of the rotor.
Schmitt et al. [20] designed the first stage of a sCO2 axial turbine by mean line design and 3D design using a STAR-CCM+ CFD package. They observed that both methods predict similar vane geometries, but mean line design overestimates the efficiency of the stage when compared to the CFD analysis. The reason for the discrepancy was attributed to the inadequacy of the Soderberg loss model to capture all primary losses. They also observed that the fluid’s high density at the turbine inlet results in short blades relative to the blade chord length, which promotes secondary flow and tip clearance losses.
To properly model the thermodynamic properties of the selected CO2 mixtures, Aqel et al. [21] investigated the effect of the choice of the equation of state (EoS) and its calibration on the turbine design accuracy. The uncertainty in mean diameter and blade height when using the Peng–Robinson EoS was 2.6% and 4.3%, respectively. However, most of the deviations stemmed from variations in the turbine boundary conditions as defined by the cycle model. This indicates that turbine designs for CO2/SO2 can be designed with reasonable accuracy, even with uncertainty in the fluid model. It is worth noting that the mixture modelling is most critical when modelling the thermodynamic cycle, and there is not a large sensitivity when considering the turbine in isolation because the turbine operates quite far from the critical point of the fluid where non-ideal effects are most significant. Specifically, the compressibility factor of pure CO2 at the turbine inlet conditions of 700 °C and 239 bar is 1.054, which indicates a behaviour close to ideal gas with less dependency on the equation of state and binary interaction parameters [11].
Turbine blades are generated using the preliminary mean line analysis, which can be used, along with a few assumptions, to generate the 3D blades for the CFD simulations and structural analysis. A conjugate aerodynamic–structural blade shape optimisation model can be conducted to improve the 3D blade design assumptions and align the design to the power cycle requirements [22]. Kalra et al. [19] followed a similar methodology in designing a four-stage sCO2 expander by generating a mean line flow path followed by a 3D numerical simulation and detailed rotor dynamic analysis.
In this paper, the flow path and aerodynamic design of a 130 MW axial turbine operating with an 80–20% molar composition of CO2/SO2 is presented. This design is initiated utilising mean line design and further refined using CFD simulation. Design constraints are introduced based on industrial experience to ensure design feasibility in terms of aerodynamic–mechanical integration. The proposed turbine design is evaluated under various operating conditions to enhance understanding of the aerodynamic performance at both design and off-design conditions. More details about the aerodynamic–mechanical design and integration of this turbine have been published in another publication [23].

2. Design Process

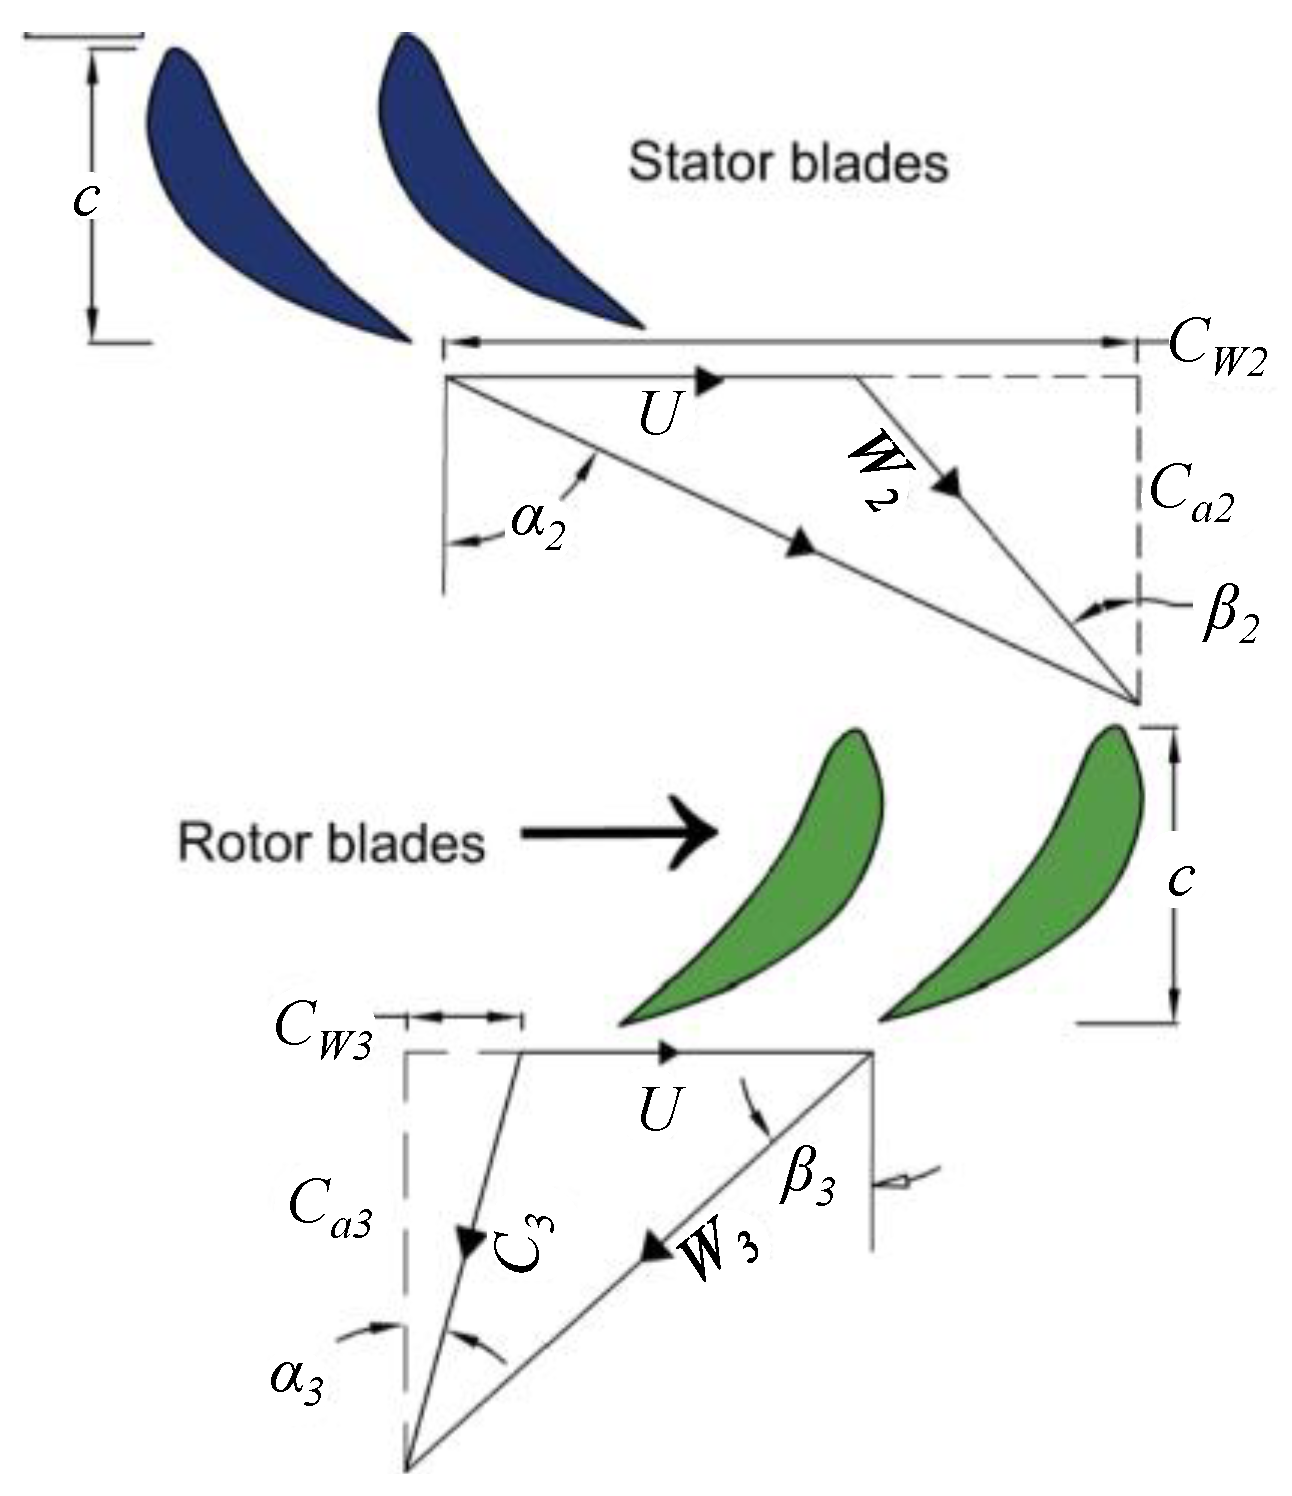
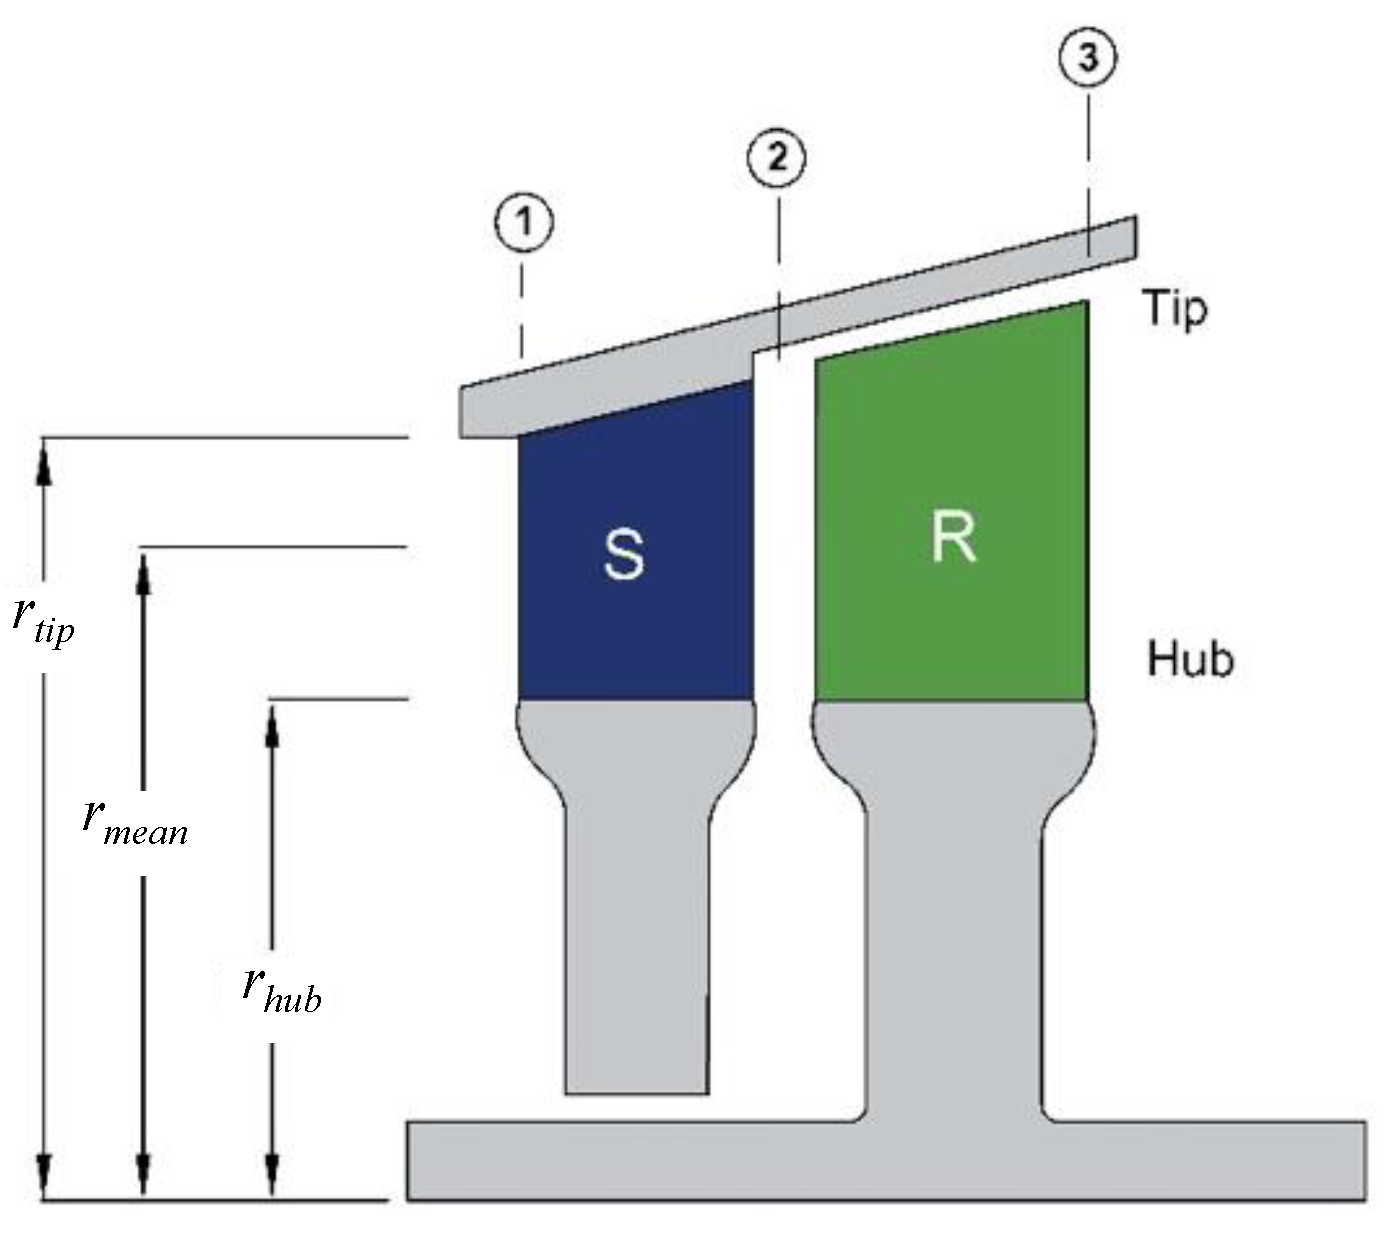
2.1. Meanline Design Model

An in-house mean line design tool is used to develop the turbine flow path [24,25]. Within the tool, the steady-state mass, energy, and momentum equations are solved to obtain the blade geometry, velocity triangles, and thermodynamic properties for all turbine stages. The design process starts by defining the boundary conditions, including the total inlet temperature, the total inlet pressure, the pressure ratio, the mass flow rate, and the inlet flow angle. Six decision parameters, presented in Table 1, are defined, which include the loading and flow coefficients ( ψ ,     ϕ ) , degree of reaction ( Λ ) , trailing edge thickness-to-throat ratio (t/o), pitch-to-chord ratio (s/c), and blade surface roughness. The values for ψ and ϕ are selected to allow for optimum turbine aerodynamic performance based on the Smith chart [26]. The trailing edge-to-throat ratio (t/o) is selected to reduce the trailing edge losses and is set based on the specified range in the literature as indicated in Table 1. The pitch-to-chord ratio is defined based on industrial recommendations.
The number of turbine stages and the number of rotor and stator blades are determined based on the defined boundary conditions and decision parameters. Practically, it is recommended to restrict the number of blades within the range of 35 to 100. This range ensures optimal aerodynamic design that meets both mechanical and rotor dynamic constraints. To ensure the mechanical strength of the blades, a static bending stress limit of 130 MPa is set, excluding any stress intensification factor (SIF). Additionally, a slenderness ratio, defined as the ratio of the total axial flow path length to the hub diameter, is required to be less than 9 to ensure structural integrity. The thermodynamic properties and velocity triangles can be obtained at each boundary for both the stator and rotor, as defined in Figure 1. Following that, the blade geometry can be obtained, including blade heights, annulus area, chord and axial chord length, blade pitch, and throat-to-pitch ratio (o/c), as shown in Figure 2 [24,25]. The mean line design model generates a 1D geometry for each stage, including the inlet/outlet angles, the stagger angle, the chord length, the throat opening, and the trailing edge thickness. The number of stages, the number of blades per stage, and the tip clearance values are also provided.
According to an analysis conducted by the authors in a previous work, the Aungier loss model [29] is one of the most suitable for sCO2 axial turbine design [25]. The mean line design tool has been previously verified against multiple cases from the literature. This includes cases involving air, CO2 and organic fluids as the working medium. A good agreement was obtained for both the geometric parameters as well as the total-to-total efficiency. A maximum percentage difference of 1.5% and 1.2% in the total-to-total and total-to-static efficiencies, respectively, was observed [30].

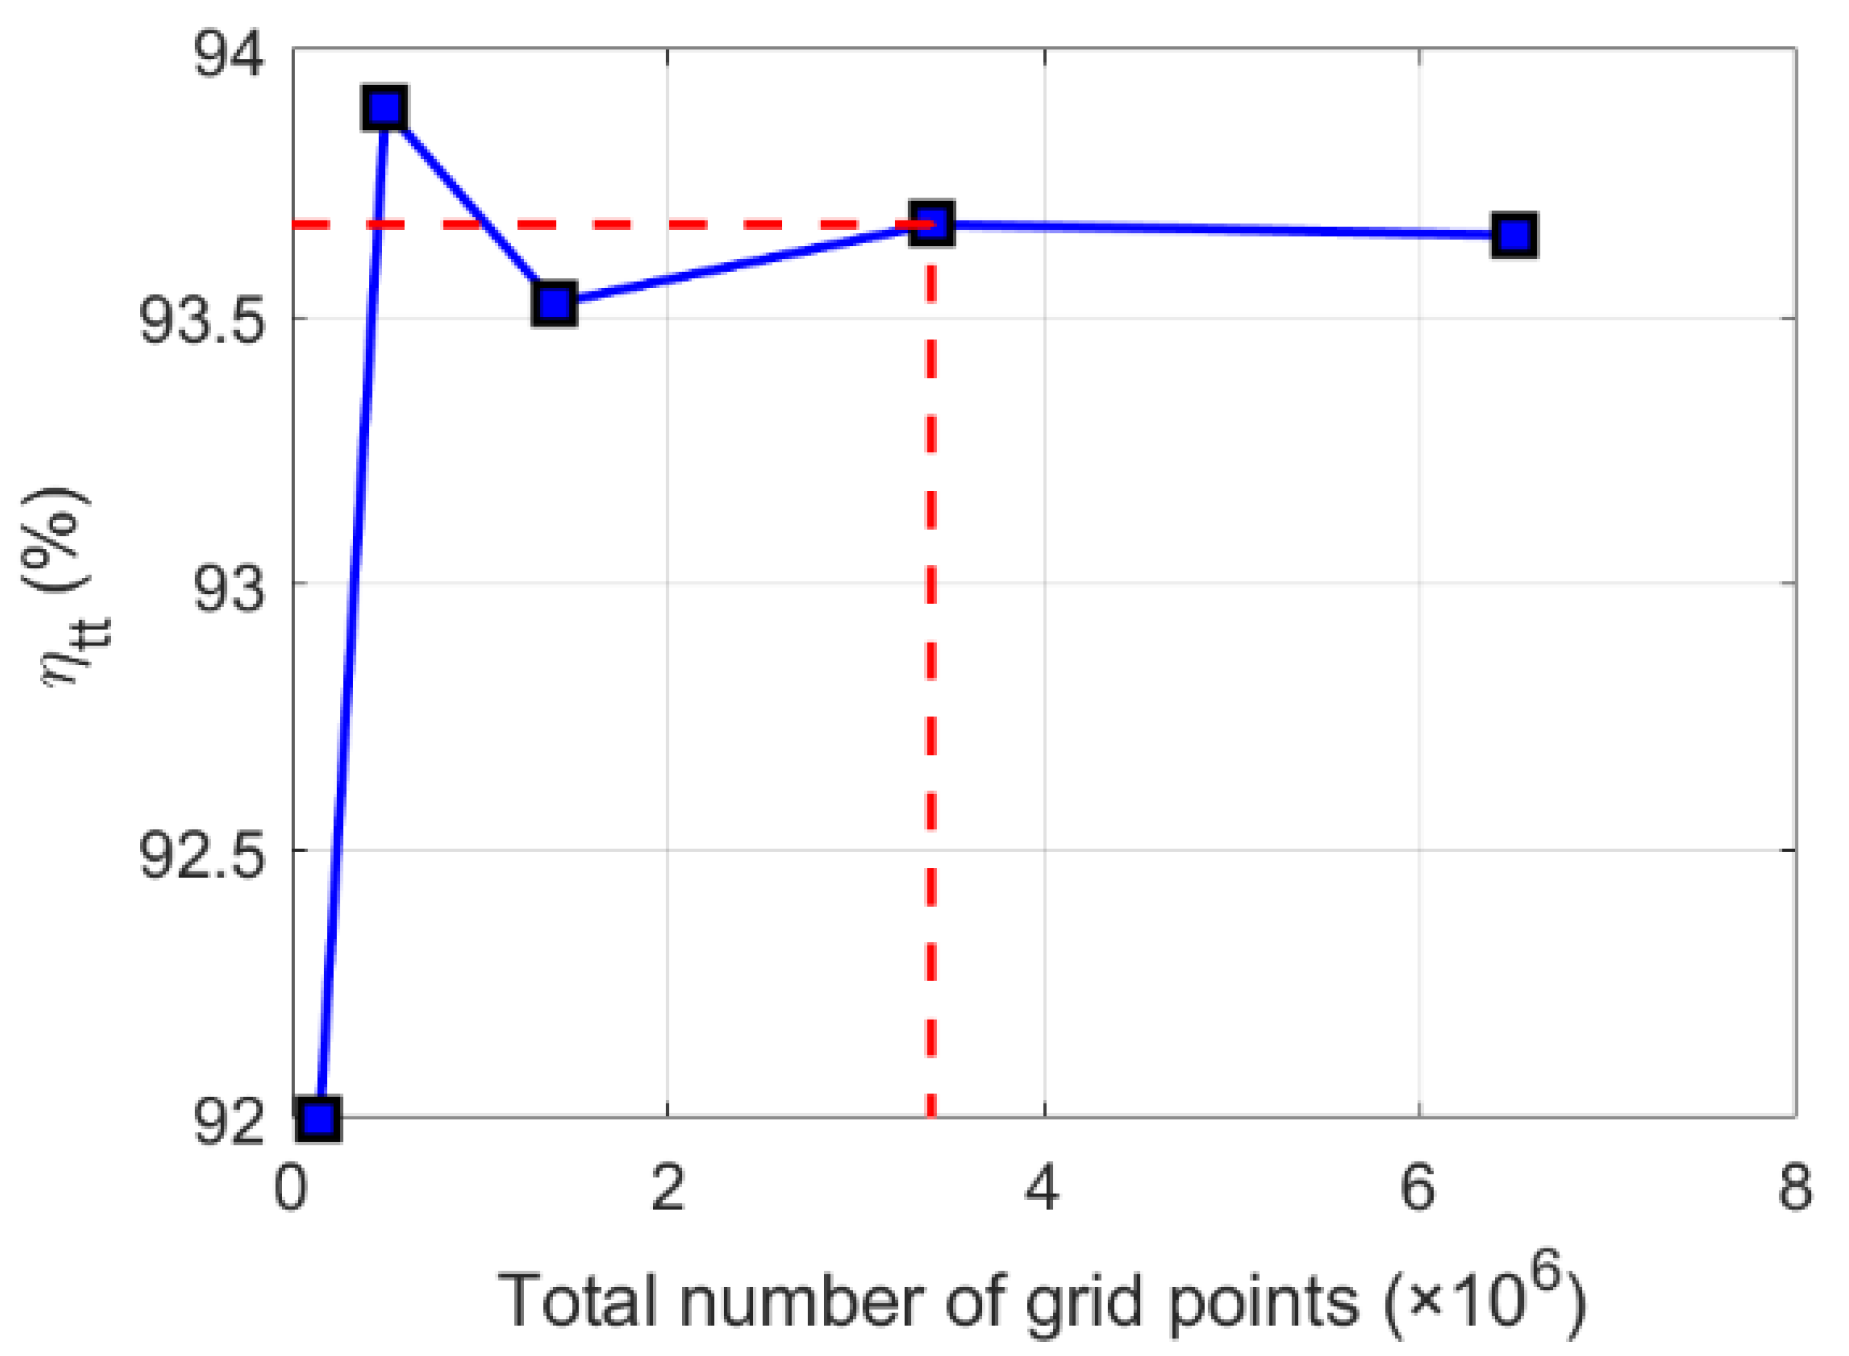
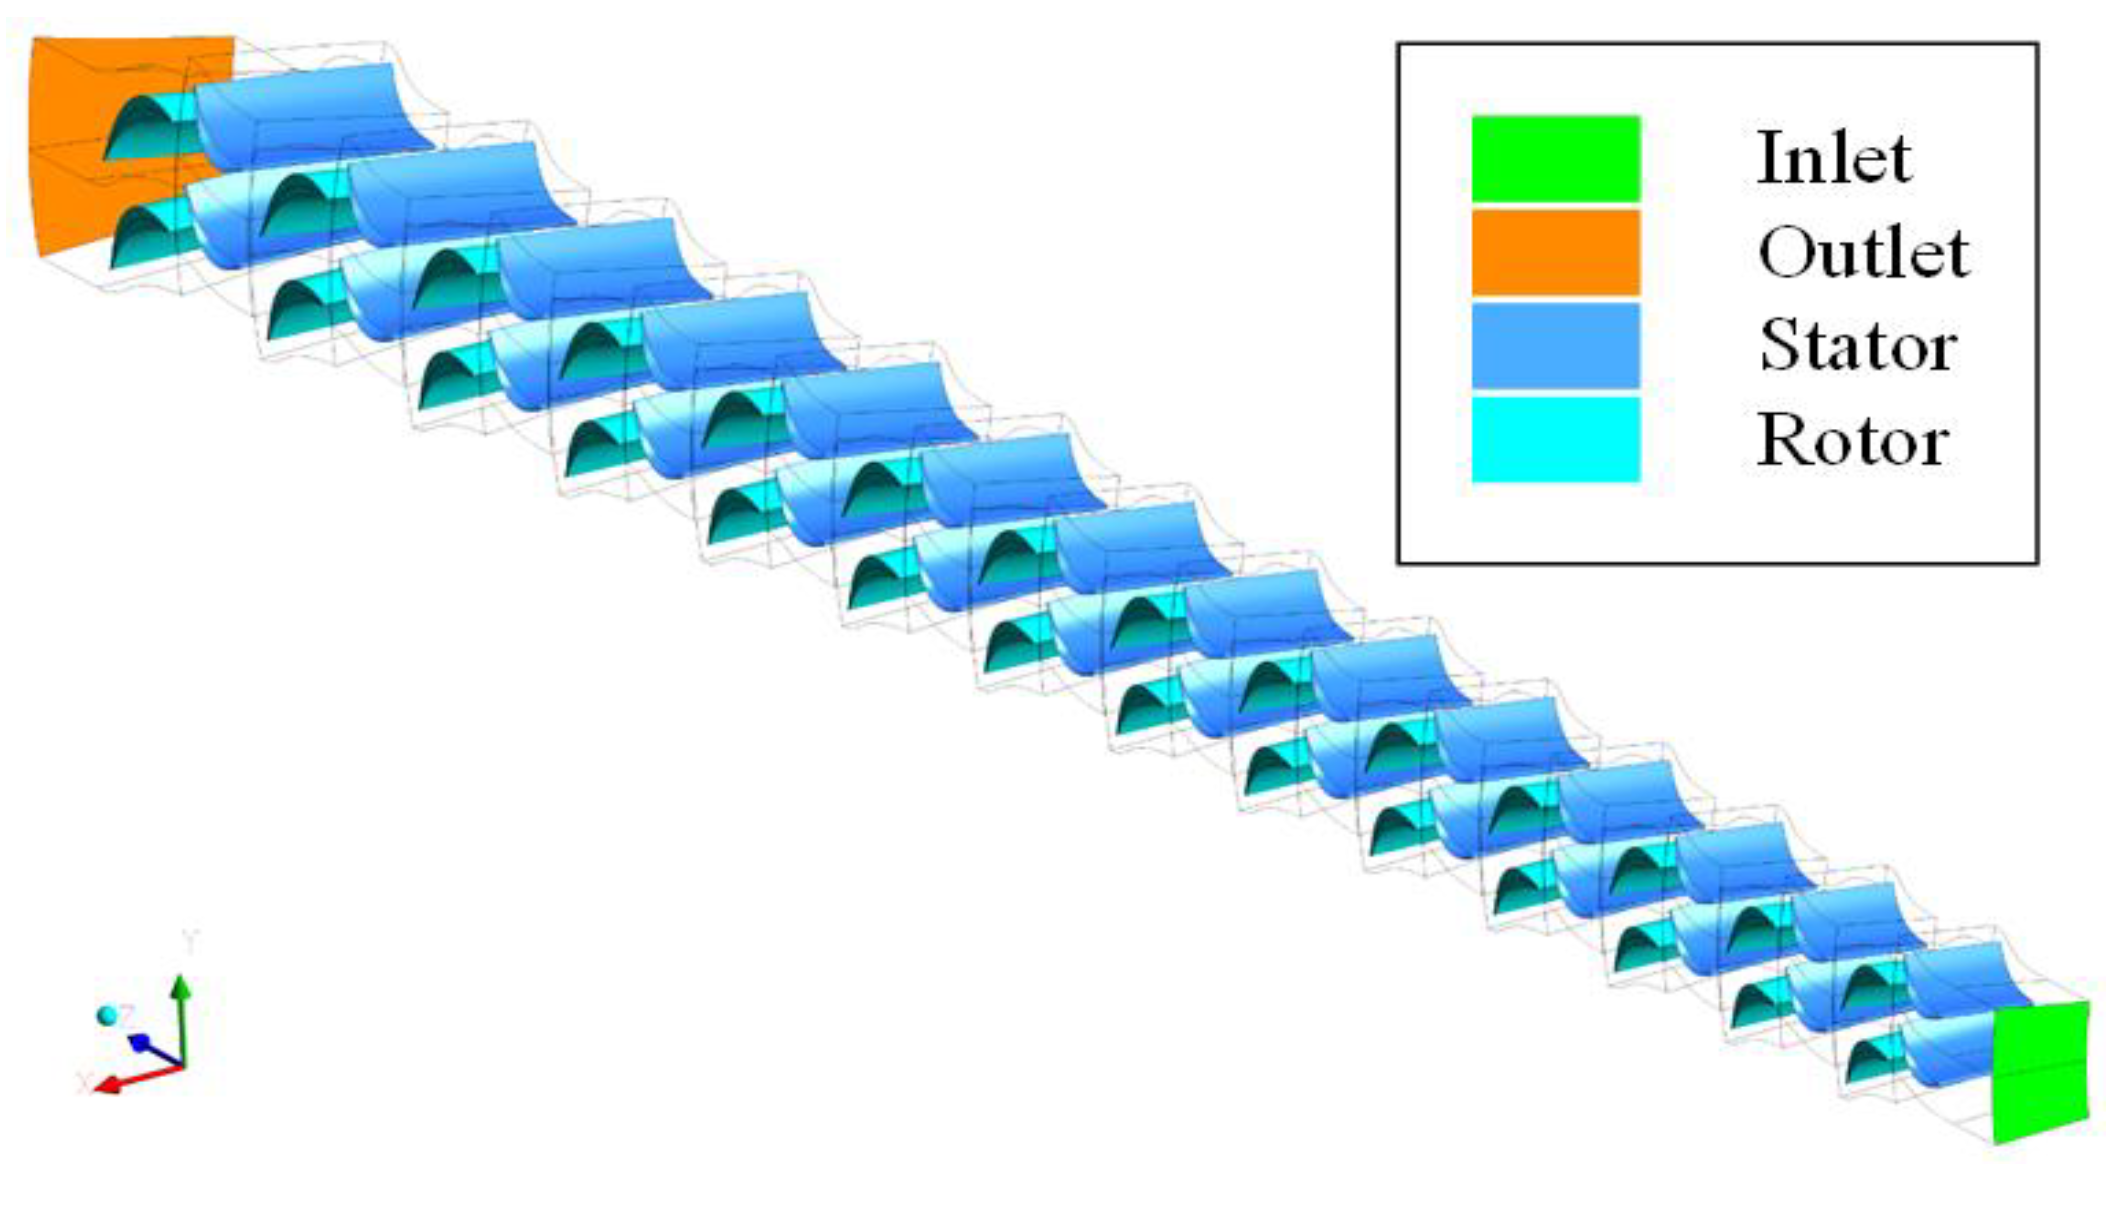
2.2. CFD Model Definition

CFD simulations are initiated by generating the 3D blades using the mean line design results in addition to making certain geometrical assumptions, which can be further evaluated and refined in subsequent design phases. These assumptions include the leading-edge thickness, inlet/outlet wedge angles, aerofoil curvature control points, and blade base fillet. The 2D aerofoil is extruded to form the 3D blade since the mean line design indicates relatively short blades. Specifically, the ratio of the blade height to the mean diameter ranges between 8% and 15%. The CFD results are compared to the mean line design model to verify the suitability of the applied mean line loss model. To ensure a suitable design, the predicted mass flow rate for the given pressure ratio is compared with cycle requirements and the 3D blade design assumptions are adjusted accordingly. The resulting 3D blade geometry is then evaluated using finite element analysis (FEA) to ensure that mechanical stresses are within the imposed limits. The blade base fillet can be modified to meet the stress constraints, along with adjusting the aerofoil thickness. Further improvements to the 3D blade geometry are achieved using blade shape optimisation with the goal of improving the performance while aligning with the cycle operating conditions and safety considerations.
A 3D steady-state multi-stage CFD model is set up for a single flow passage, as shown in Figure 3. The turbulence model is k-ω SST, which is widely considered for turbomachinery simulations [31]. Near the walls, a scalable wall function model is used, which employs equilibrium wall functions for high Reynold’s number flow. The CFD solver is ANSYS CFX (2020 R2). The interfaces between the stator and rotor blades are modelled using a mixing plane approach, where the pitch ratios are defined as the ratio between the number of blades in the downstream blade row and the upstream blade row.
In the proposed design, the ratio of the rotor to stator number of blades falls within the range of 0.893 to 0.914. This ratio is sufficiently close to unity, which ensures that modelling a single passage of each blade row has a minimal impact on the solution accuracy. The boundary conditions defined for this model are the total pressure and the total temperature at the inlet of the first stator blade, while the static pressure is defined at the outlet of the last rotor. The rotor blades are unshrouded with a tip clearance gap of 0.07% of the tip diameter for each stage.
Alongside design-point verification, an off-design CFD model is set up to assess turbine performance at different operating conditions. This model provides insights into the acceptable turndown capability, defining the operating range without a significant performance deterioration. The off-design simulations are set up by varying the inlet total pressure while maintaining a constant inlet total temperature and static outlet pressure. The results are presented using the non-dimensional form of the mass flow rate defined by Equation (1), where m ˙ is the mass flow rate, γ is the specific heat ratio, R is the ideal gas constant, T 01 is the total inlet temperature, D h is the hub diameter, and P 01 is the inlet total pressure.
m R e d = m ˙ γ R T 01 D h 2 P 01
The mesh quality has been controlled by controlling the global element size while maintaining y + values on the walls around 50 to best suit standard wall functions [32]. The required number of grid points is identified using a mesh independence study applied to a single stage to obtain efficiency tolerance within 0.02% compared to the finest mesh, as reported in Figure 4. This mesh size is then applied to the remaining stages. The total number of grid points per stage, in this case, ranges between 3.1 and 3.7 million points, while the total number of grid points of the domain is 47.3 million.
The thermophysical properties of the sCO2 mixtures are evaluated using SIMULIS [33]. The selected equation of state is Peng–Robinson in both mean line design and CFD simulations for its simplicity and accuracy [21]. The binary interaction parameters for the selected EoS were selected to match those used for the cycle analysis to ensure consistency in the thermodynamic properties obtained by both models [21,34]. The properties are introduced to the CFD models using look-up tables that cover the expected pressure and temperature ranges with the size of 500 × 500 points. The pressure range is set between 10 bar and 300 bar, while the temperature range is set between 400 K and 1200 K. The CFD model results have been checked to ensure that the property tables cover the global minimum and maximum values of the pressure and temperature within the solution domain.
It is worth noting that the CFD model has been verified against both numerical and experimental results available in the literature, as illustrated in the authors’ previous work [22,35]. A good agreement was observed between the proposed model and the published data in terms of the total-to-total efficiency and the stator/rotor loss coefficients. Compared to the results of a numerical CFD study of a 15 MW sCO2 turbine, the calculated deviation in the total-to-static efficiency was 0.2% [22]. Compared to the experimental results of a 140 kW axial air turbine, the obtained deviation in the total-to-total efficiency was 1% [35].

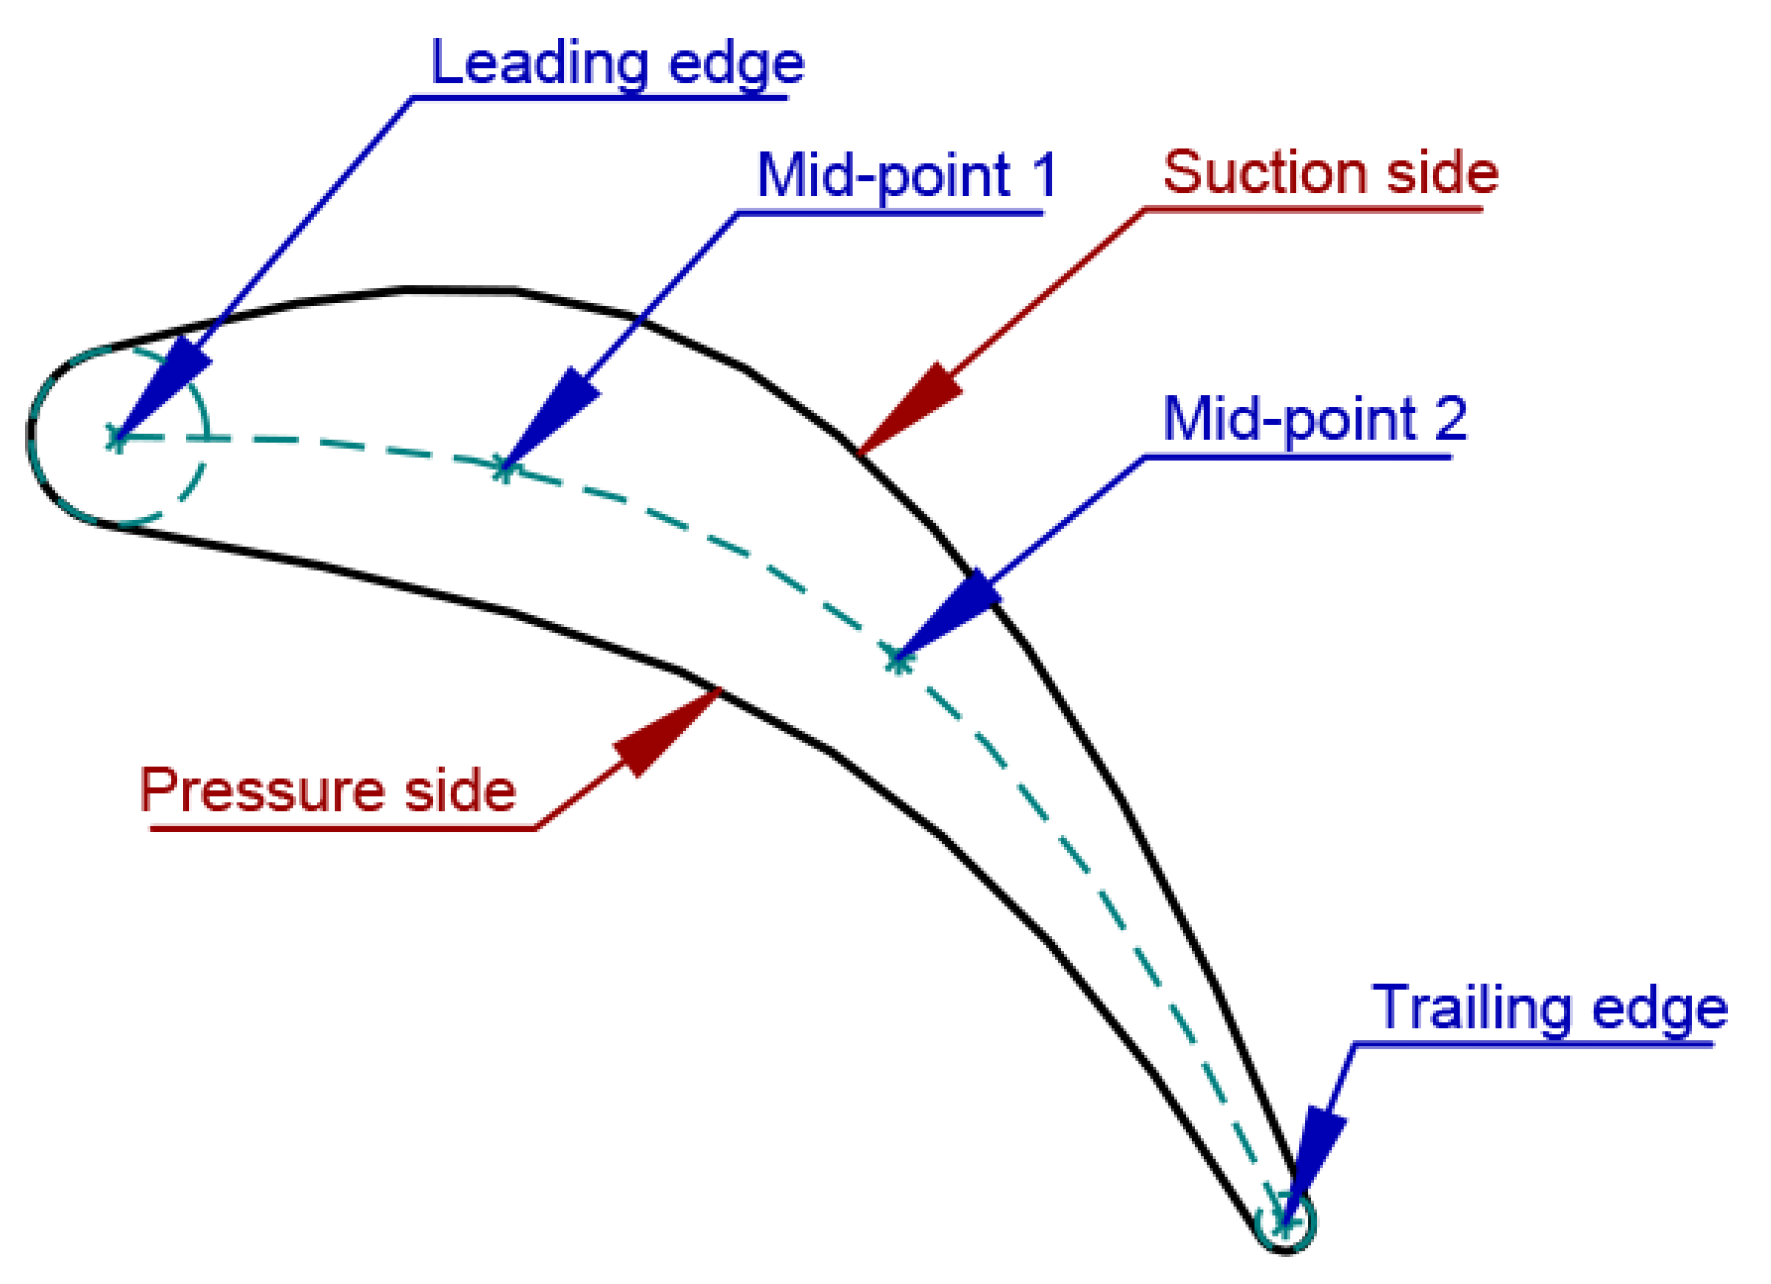
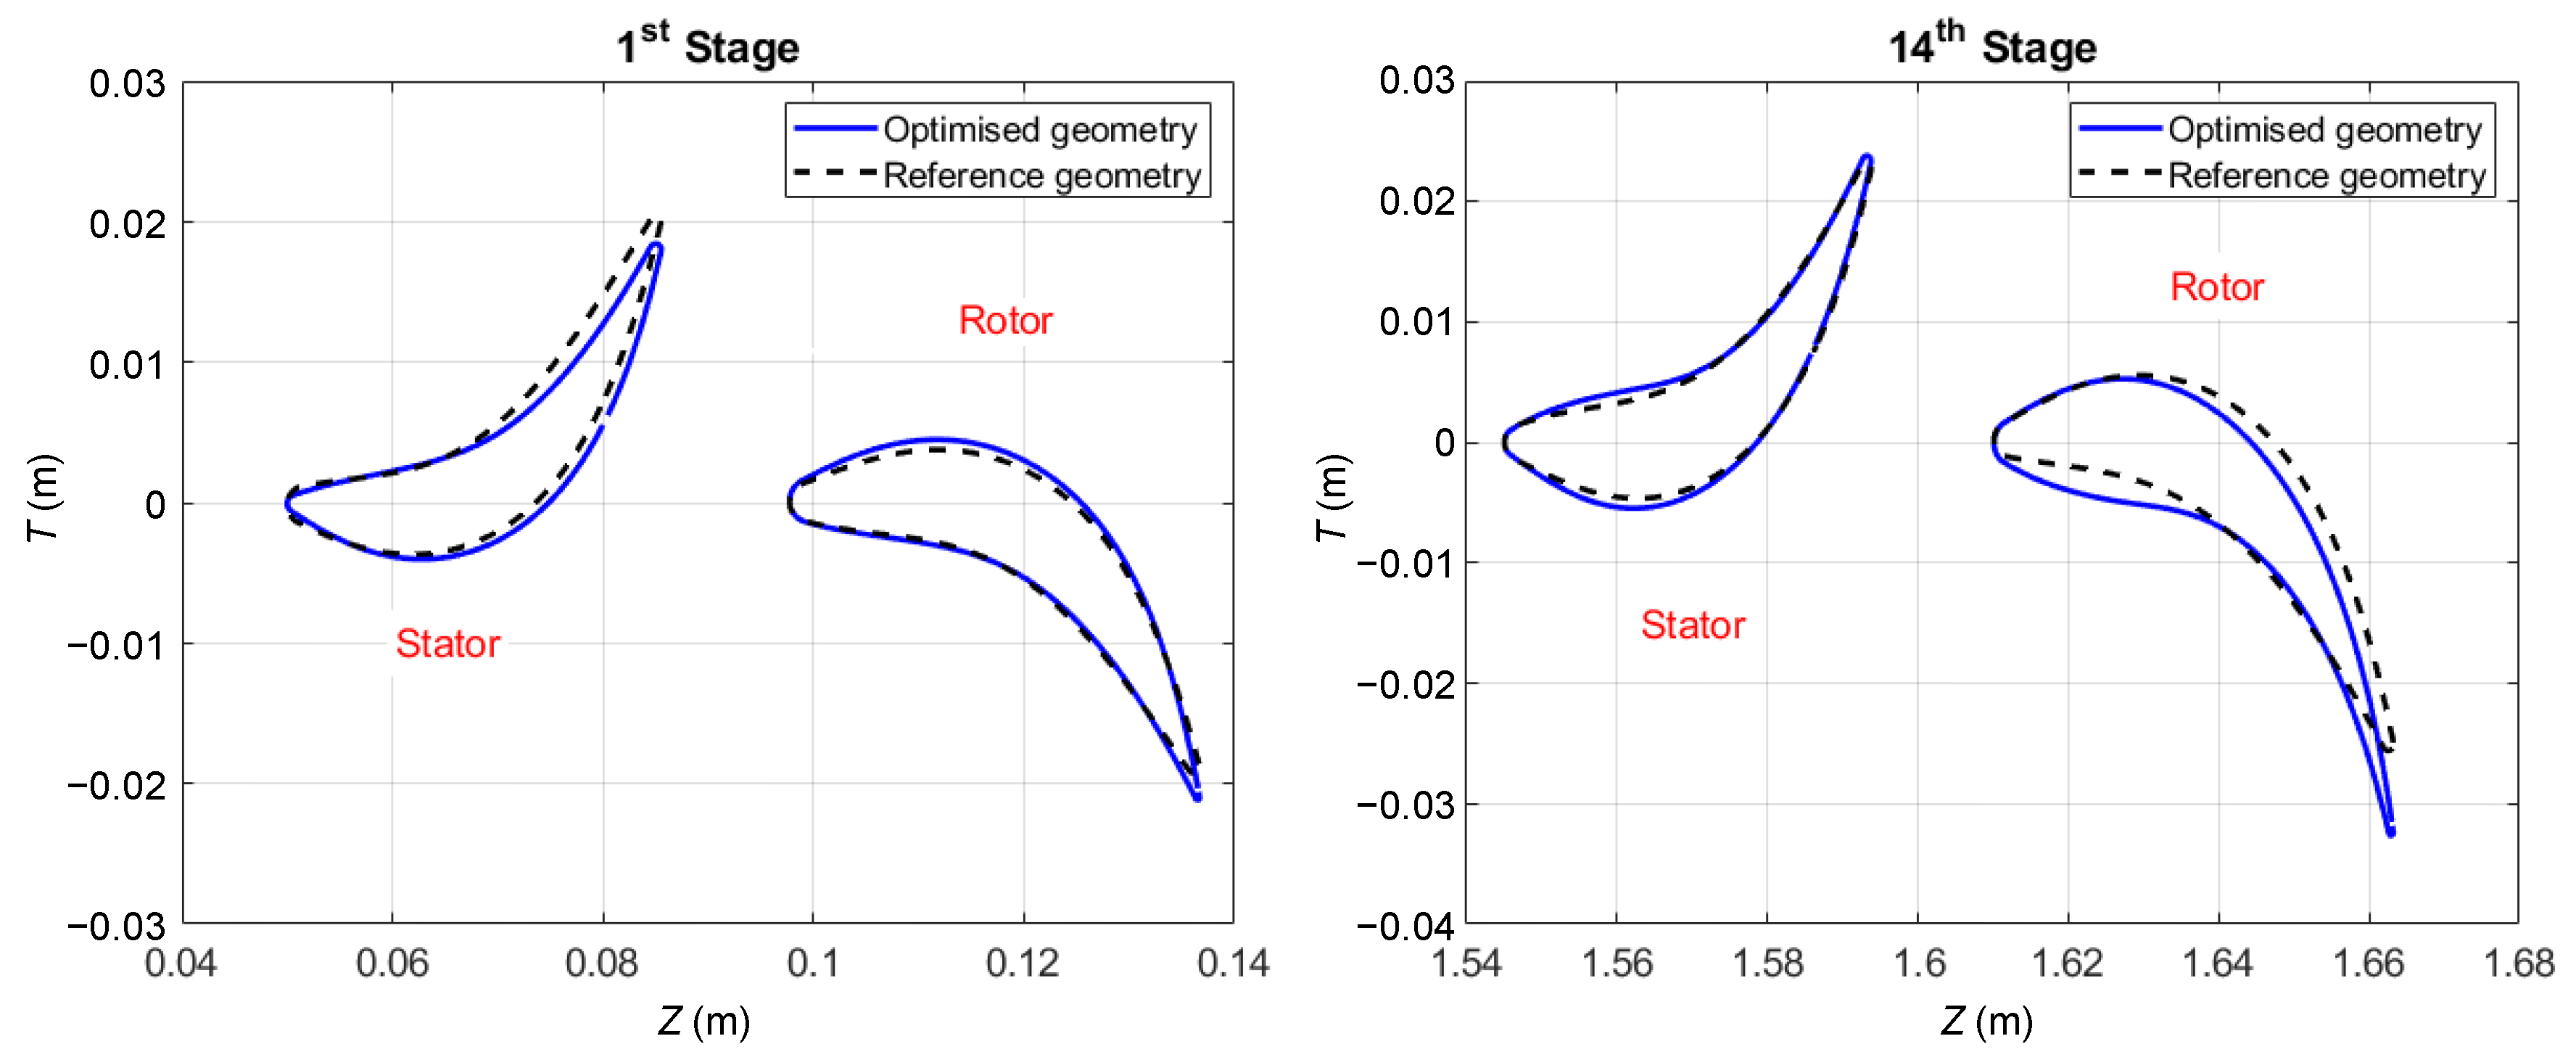
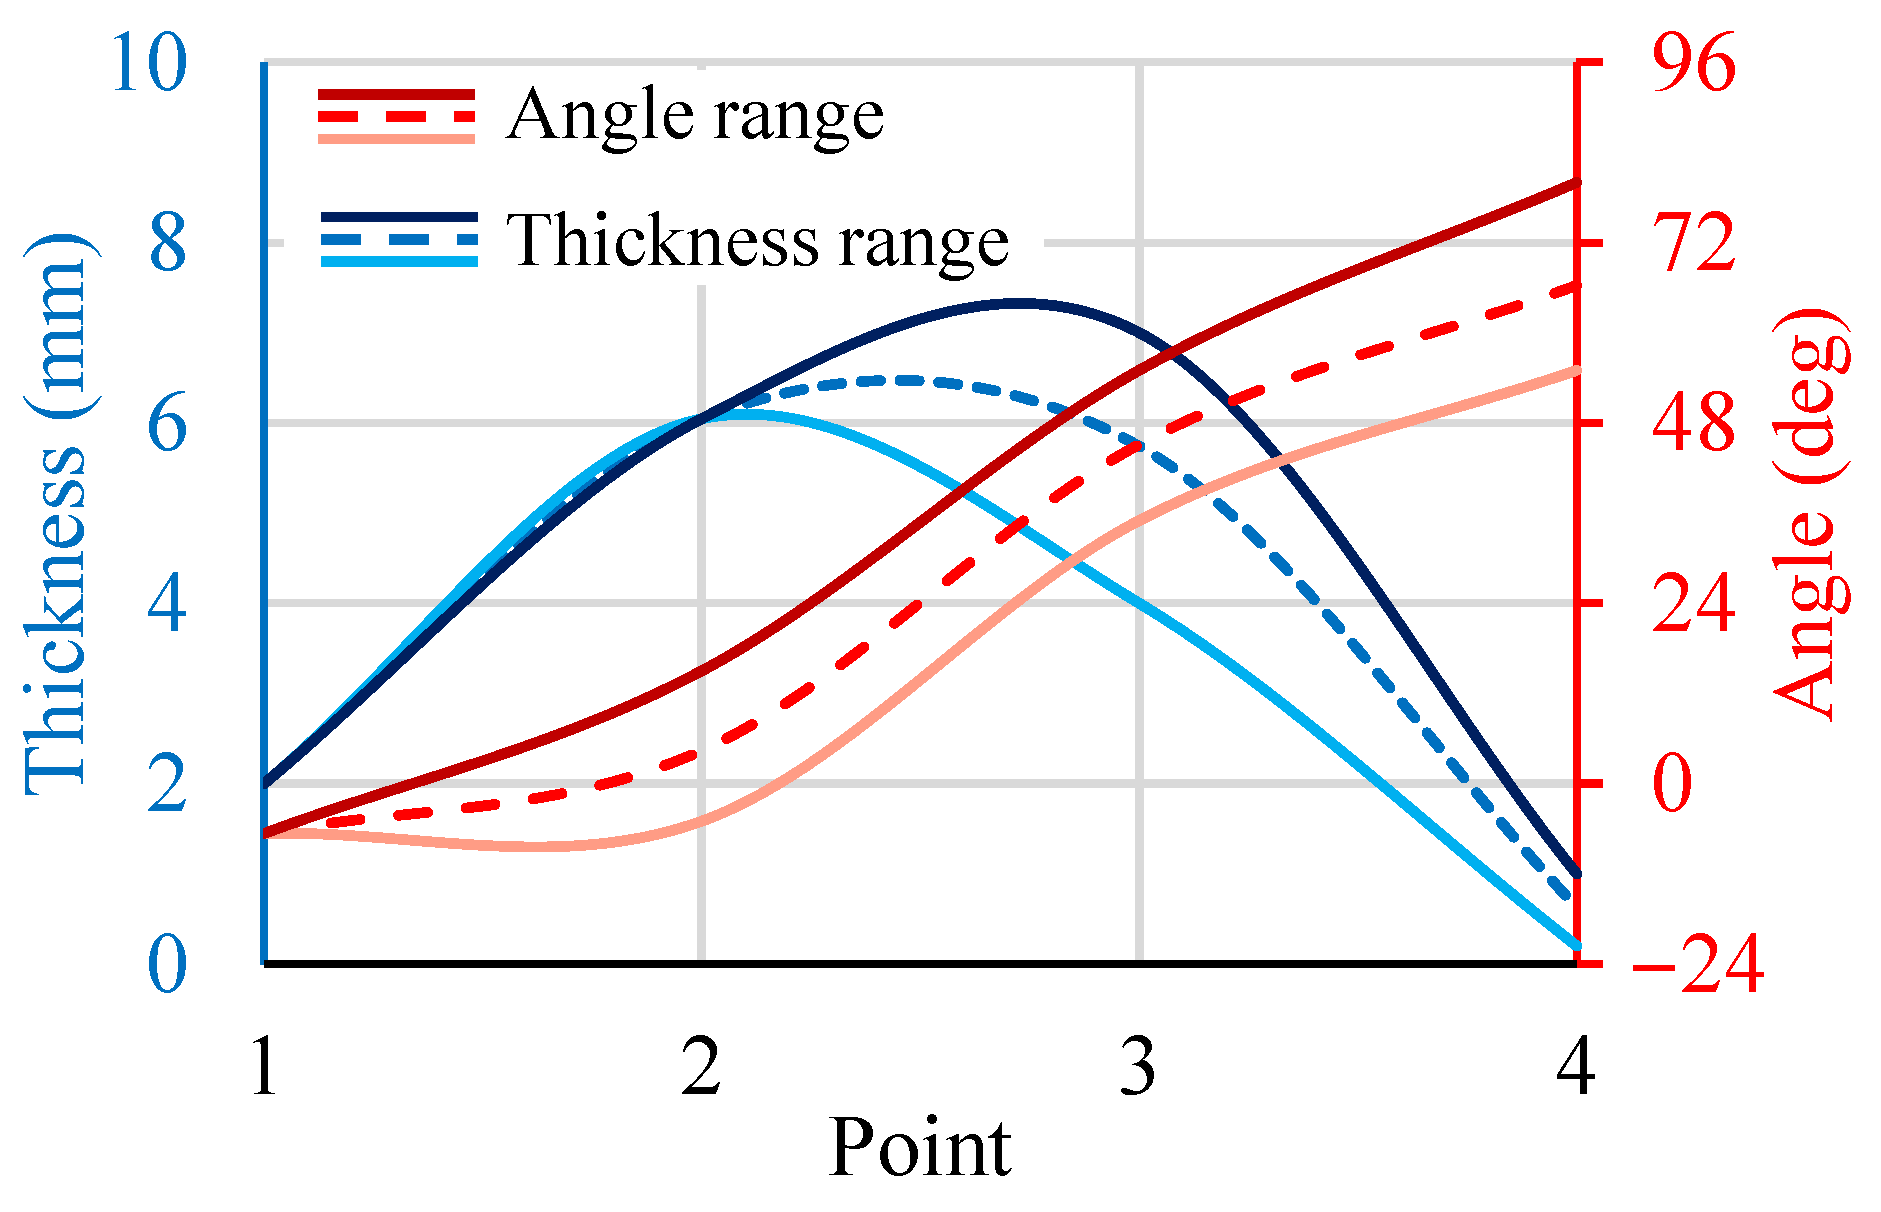
2.3. Blade Shape Optimisation

The 3D blade geometry can be further improved through blade shape optimisation, as explained by the authors in a previous publication [22]. The optimisation model uses a set of decision variables represented by the blade aerofoil angle and thickness distributions, while the objectives and constraints are introduced to maintain an efficient operation and a safe design. The search space is defined by selecting a certain range for the thickness and angle magnitudes at four different locations, specifically, the leading edge, trailing edge, and two mid-points, as shown in Figure 5. The range for each decision variable is defined around the reference value using manual iterations aimed at maintaining a reasonable aerofoil shape, as reported in Figure 6.
Within the optimisation model, the mass flow rate is confined to within 1% of the cycle design mass flow rate, and the maximum stress is kept under 260 MPa. This stress limit accounts for all stress and is not to be confused with the static stress limit imposed in the mean line design, as the former limit represents the peak equivalent stress while the latter limit is an average cross-section stress. A one-way link is set up between the CFD and FEA models, where the CFD flow results are transferred to the FEA model to define the aerodynamic loads. Due to the limited blade deformation, which is found to be within 0.2% of the blade height, there is considered limited added value in studying the effect of blade deformation on the flow field.
The optimisation process is carried out using a surrogate model to replace the physical CFD/FEA models during the optimisation iterations. The CFD/FEA models have been used to solve a set of learning points generated using a central composite design of experiment algorithm (CCDoE). These learning points are used to construct response surfaces for each output parameter. Although this methodology depends on the surrogate model accuracy, it allows for increasing the number of iterations during the optimisation process and achieving lower tolerance. Furthermore, the accuracy of the surrogate model can be improved by defining a set of refinement points that are solved using the actual CFD-FEA models until the required tolerance is reached. The details of the optimisation process are described in the authors’ previous work [22].

3. Results and Discussion

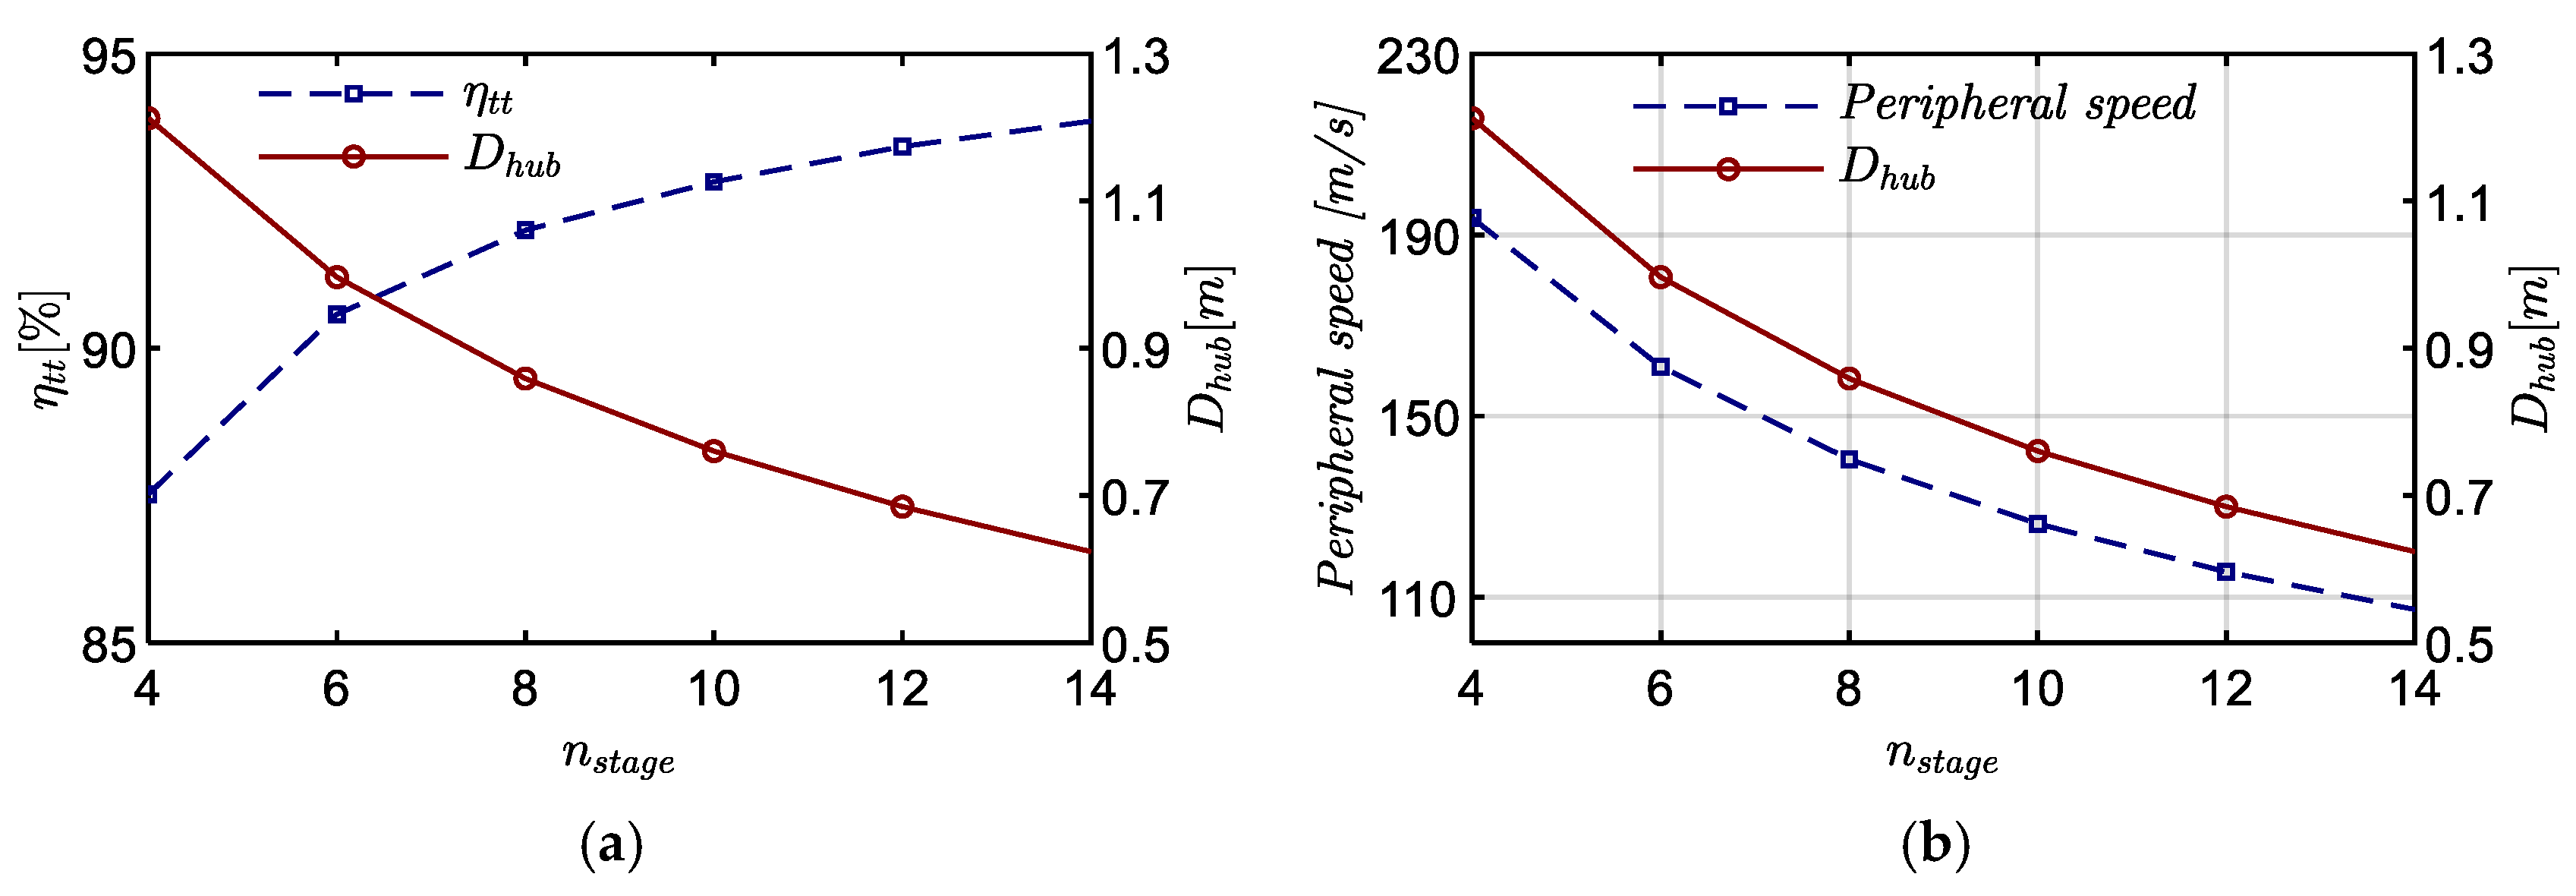
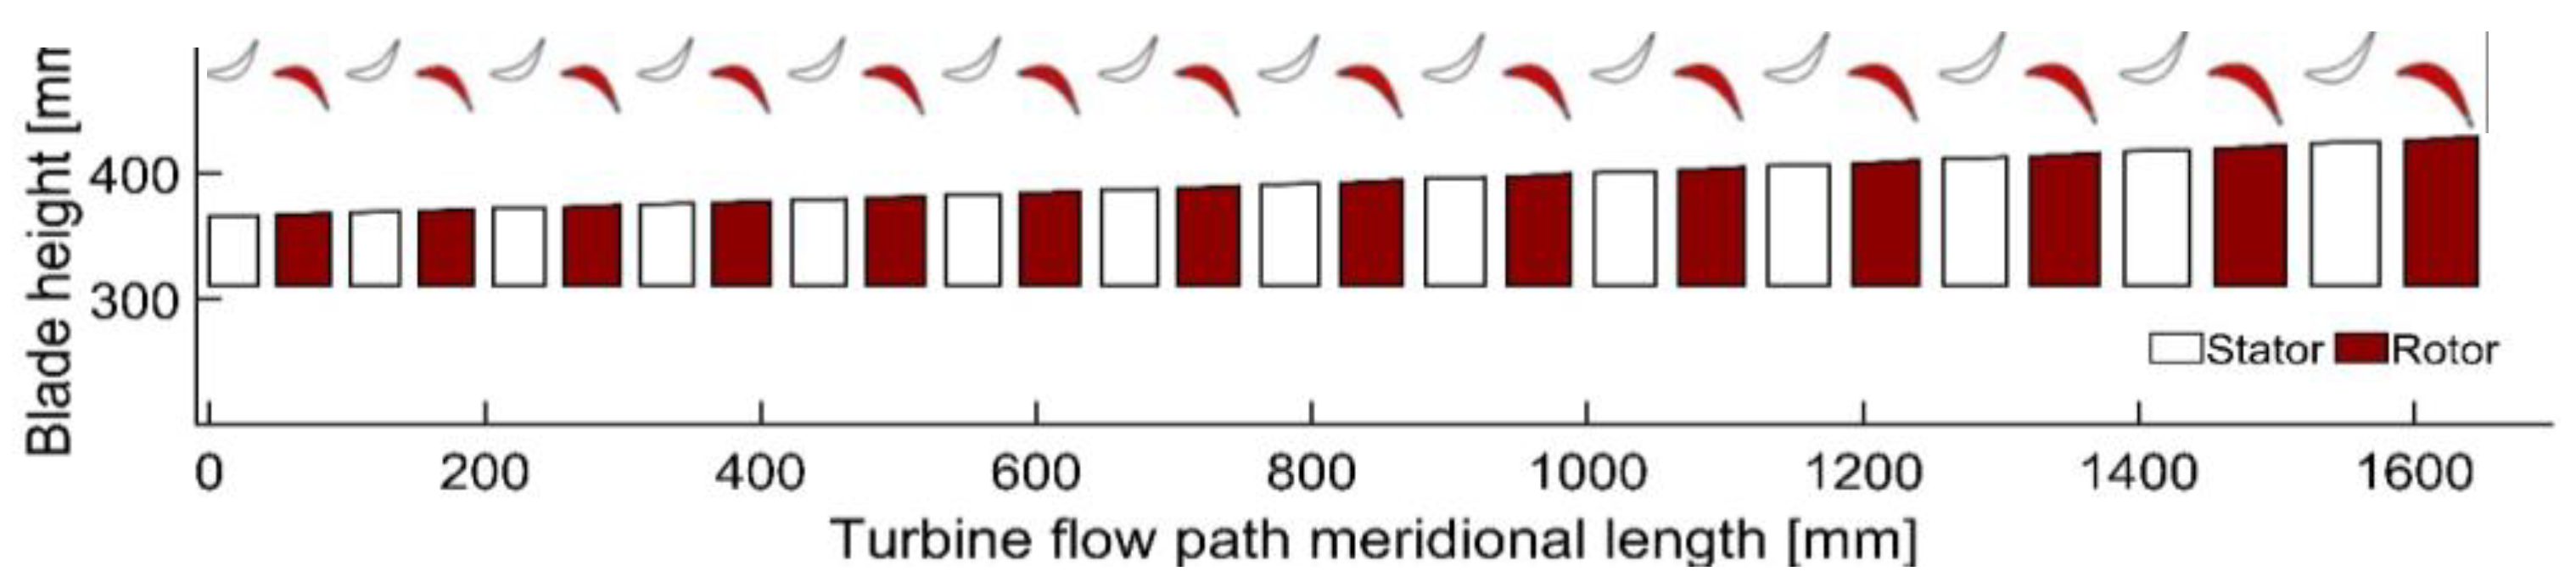
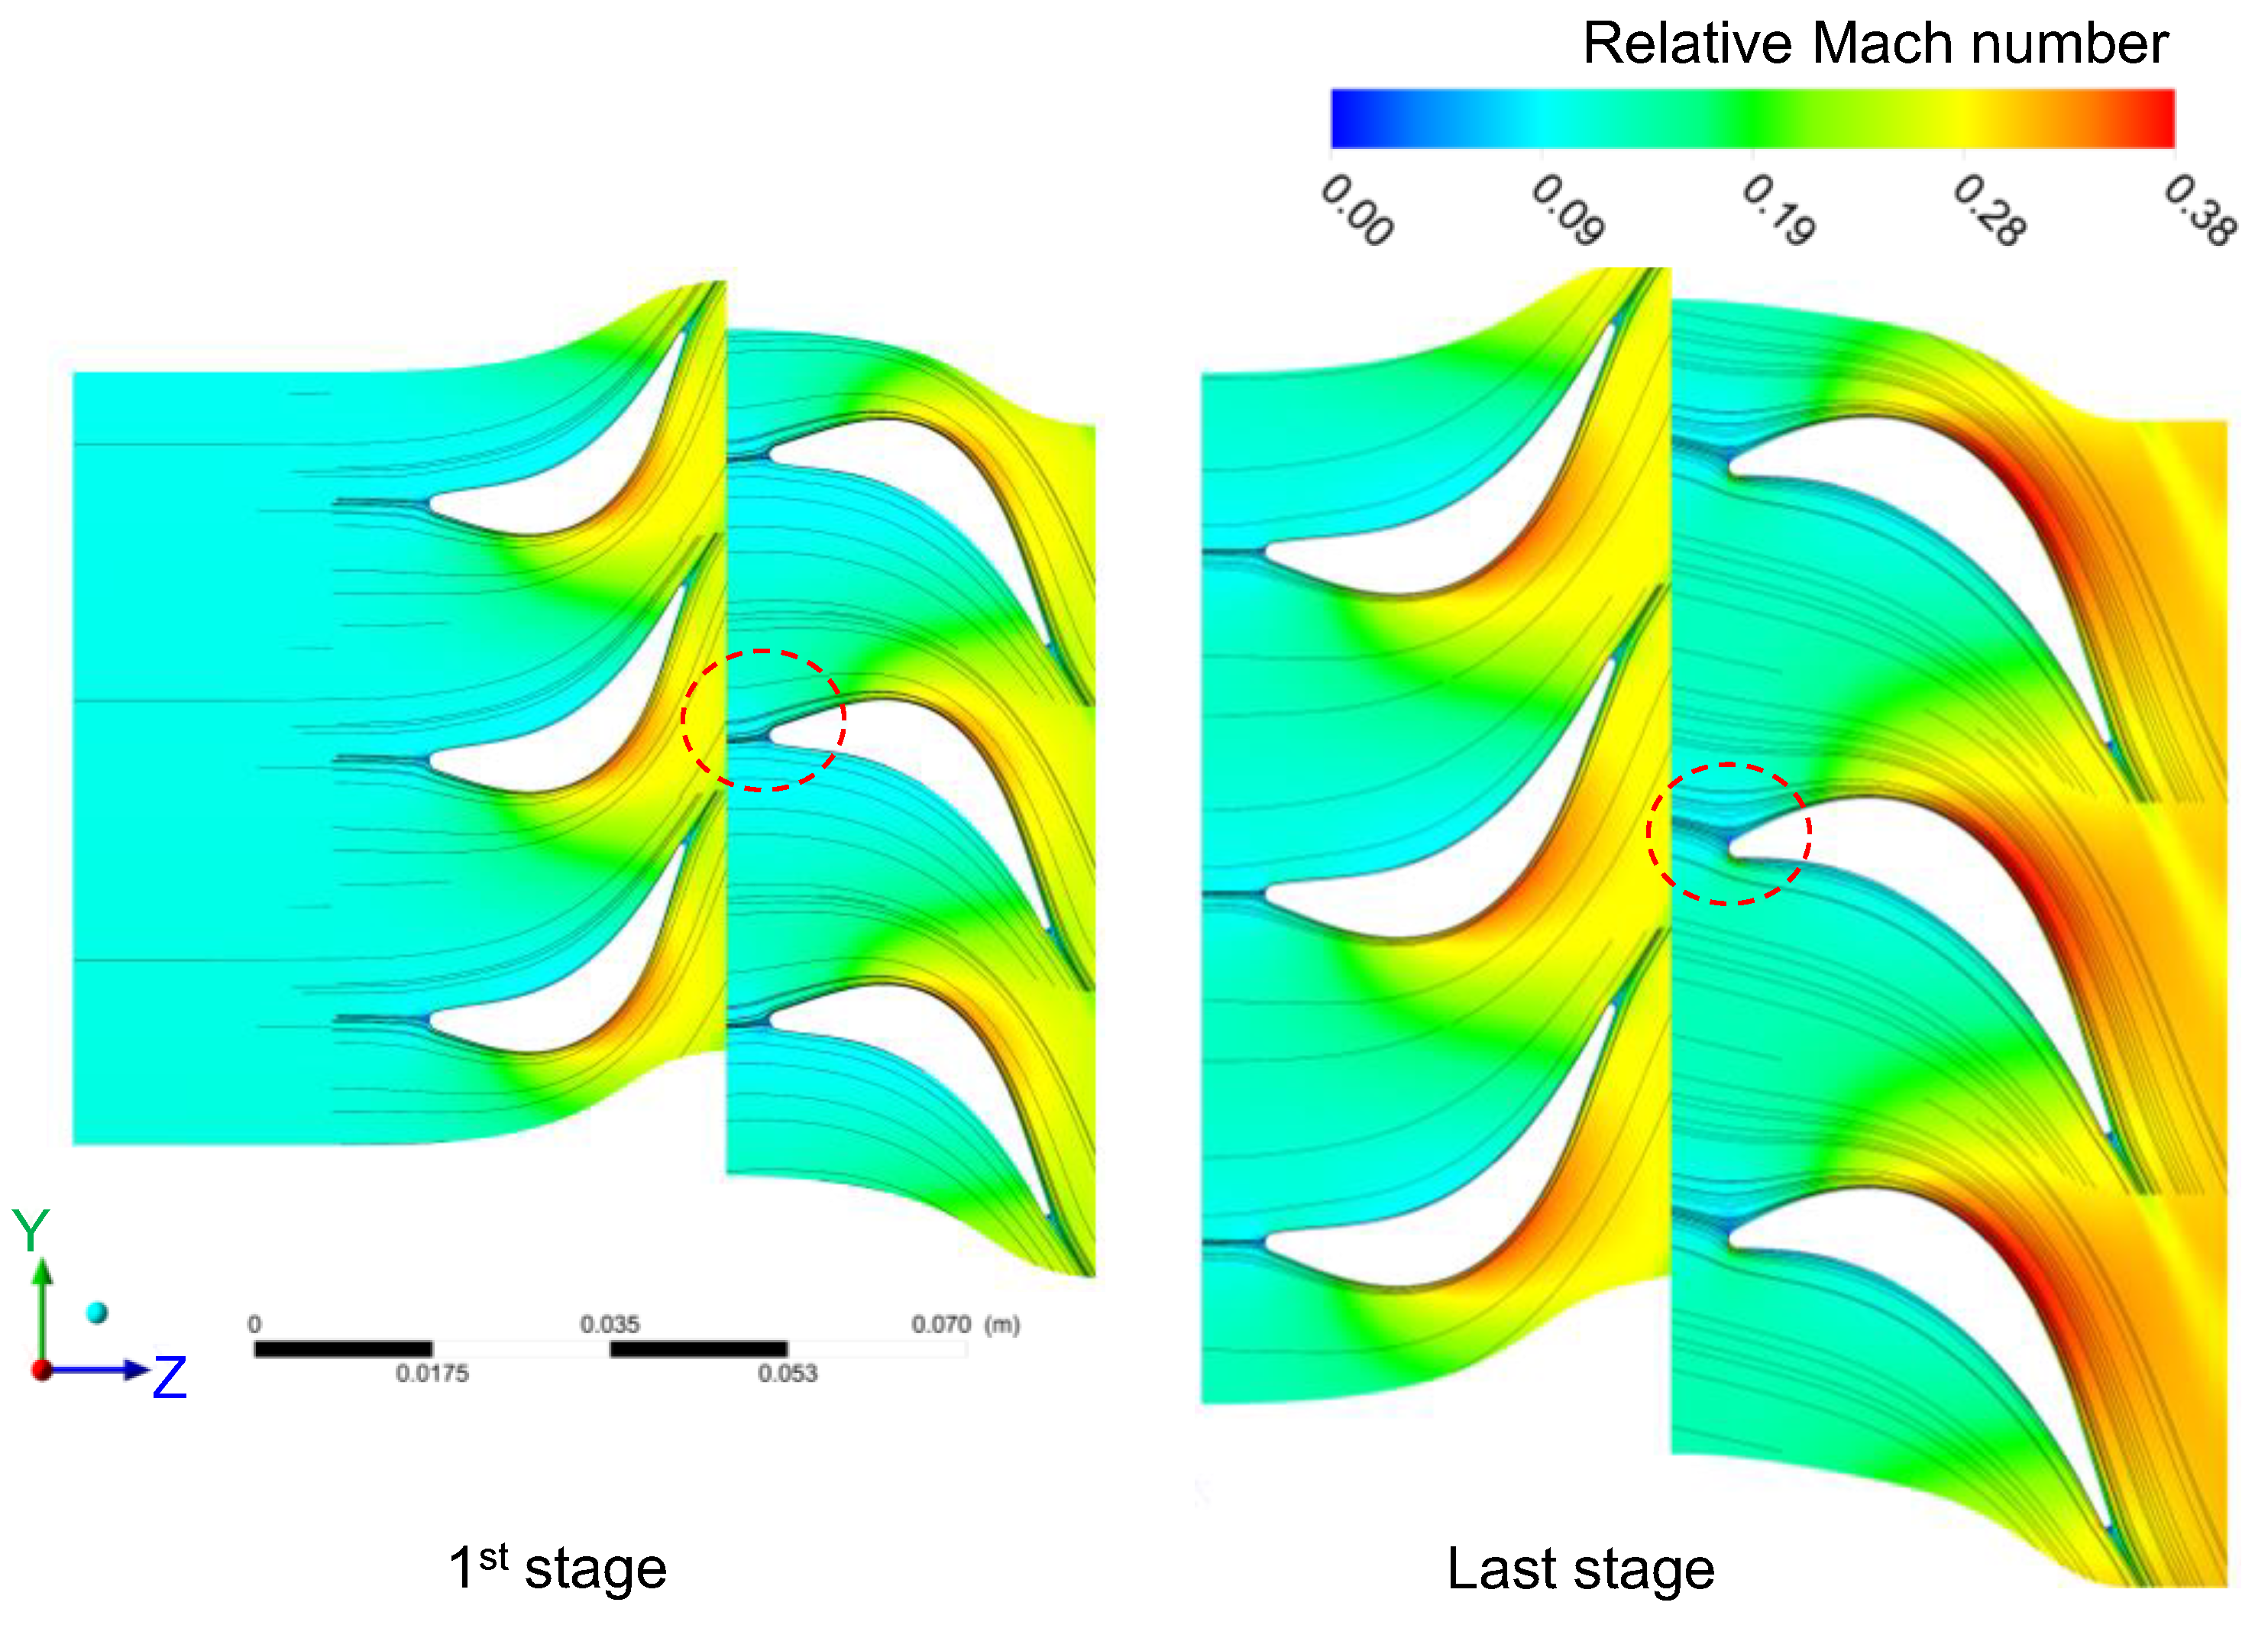
3.1. Flow Path Design

Different CO2 mixtures have been found to be promising to elevate the critical temperature of the mixture. According to design optimisation results previously obtained by the authors for the three proposed CO2 mixtures, it has been found that similar flow path geometries are achieved, regardless of the working fluid, although it was found that the chord length is larger for the TiCl4 designs compared to the SO2 and C6F6 designs due to higher bending stresses [22]. However, no significant impact of the working fluid was observed on the design process or the applied methodology. Among the mixtures, the CO2-SO2 mixture has been selected for further analysis based on considerations of thermal stability, health, and environmental factors, as discussed in the introduction.
The design process of a large-scale axial turbine is carried out based on the specified boundary conditions and cycle requirements outlined in Table 2. These conditions and requirements are specifically chosen for the SCARABEUS project. The turbine is designed to produce 130 MW of power, which corresponds to a cycle net output of 100 MWe for a concentrated solar power (CSP) plant. The turbine rotational speed is fixed at 3000 RPM to match the electrical grid frequency requirements (i.e., 50 Hz) since it is not practical to use a gearbox to decouple turbine and generator speeds at such power scales.
Initially, the aerodynamic performance of a four-stage design was investigated, which was intended to limit the peripheral speed of the shaft to 180 m/s. That design achieved a total-to-total efficiency of 87.5%, as evaluated by the mean line loss model. To enhance the performance, the number of stages has been increased, whilst constraints have been introduced to ensure the average rotor static bending stress is less than 130 MPa for all stages, for rotor blade counts ranging between 35 and 95, and for a slenderness ratio less than 9.
In view of the fact that turbine designs were evaluated at a constant rotational speed and loading coefficient of 3000 RPM and 1.0, respectively [25], the number of stages dictates the peripheral blade speed through the desired stage isentropic enthalpy drop. This, in turn, directly defines the hub diameter. Increasing the number of stages resulted in smaller peripheral speed, smaller hub diameter, and larger blade aspect ratio, yielding a higher total-to-total efficiency, as indicated in Figure 7. It has been observed that increasing the blade aspect ratio decreases the influence of secondary flow losses, as obtained using the Aungier loss model. This can be attributed to reducing the ratio between the endwall boundary layers to the flow path span. Additionally, reducing the hub diameter also contributes to a decrease in the tip diameter, even with the increased blade length. This leads to narrower tip clearance gaps, reducing the impact of associated losses on the overall stage losses [36].
The loss breakdown of the 4-stage, 9-stage, and 14-stage designs is shown in Figure 8, as obtained using the Aungier loss model. In this figure, the average enthalpy loss coefficient per stage is presented for the stator endwall (SEW), stator profile (SPF), stator trailing edge (STE), rotor endwall (REW), rotor profile (RPF), rotor trailing edge (RTE), and rotor tip clearance (RTC). It is clear from the figure that the endwall and tip clearance losses are significantly higher in the four-stage model, which is due to the large hub diameter, which leads to shorter blades and larger relative tip gaps.
As a result of such design factors, the number of stages can be increased up to 14 stages without exceeding the maximum rotor bending stress and slenderness ratio limits. Increasing the number of stages from 4 to 14 results in an increase in total-to-total efficiency of 6.3%, thus achieving a design total-to-total efficiency of 93.8%, as evaluated by the mean line loss models; this is due to the reduction in peripheral speed from 194 to 107 m/s and hub diameter reduction from 1.2 to 0.62 m. The 14-stage design has a flow path length of 1.8 m, although the total shaft length, including the bearing span and axial gaps, is larger. Further investigations of the rotor dynamic stability, torsional sizing, and dry gas seals have been conducted and published in a separate paper focusing on the integration of the aerodynamic and mechanical systems of the turbine [23]. These investigations have shown an acceptable rotor-dynamic stability for the proposed 14-stage design and acceptable shaft end torsional sizing, considering the market availability of a dry gas seal of a suitable diameter.
The meridional cross-section of the turbine flow path is shown in Figure 9, where the unfilled and filled shapes represent the stator and rotor blades, respectively. Representative geometrical parameters for the preliminary flow path, as obtained using the mean line design model, are reported in Table 3.
The CFD numerical results are compared to the cycle requirements, while several design parameters, such as the outlet wedge angle, the inlet/outlet fillet radius, and the suction side (SS) curvature control points, are manually adjusted to control the throat opening and the mass flow rate. The mean line design (MLD) results have been verified against the CFD results, as shown in Table 4. The obtained deviations in mass flow rate, power, and total-to-total efficiency are 0.51%, 1.38%, and 0.52%, respectively.
The mass flow averaged relative Mach number at the exit from each blade row is compared to the mean line design results, as shown in Figure 10. Overall, both models show the same trend where the Mach number increases as the pressure decreases because the speed of sound decreases at the low-pressure stages. A good coincidence is observed between the results from the two models; however, the velocities obtained using the CFD models tend to be slightly higher, specifically in the last stages, due to the cumulative deviation in the incidence angle.
The difference between the flow distribution of the first and last turbine stages at the design point is compared at mid-span in Figure 11. No local regions of supersonic flow, and hence no shock losses, exist. Both stages exhibit smooth streamlines without obvious separation regions at mid-span when operating at the design point, confirming the good coincidence between the flow angles and blade angles obtained using the mean line design. However, the stagnation point in the last stage is shifted towards the blade suction side, showing a larger incidence angle in the last stage compared to the first stage. This can be attributed to the cumulative deviation between the mean line design and CFD results, as shown in Figure 10.
The maximum equivalent von Mises stresses are evaluated for the first and last turbine stages. These stages are chosen because they represent the extreme design and operating conditions. To limit the peak stress values, adjustments can be made to the blade geometry, such as increasing the outlet wedge angle, increasing the base aerofoil thickness, increasing the whole blade thickness, or increasing the base fillet size. The effect of these parameters on the peak stresses obtained in the first turbine stage is summarised in Table 5, while similar trends are obtained for the last turbine stage.
It can be seen from the table that decreasing the throat opening by decreasing the outlet wedge angle decreases the mass flow rate as well as the peak stress values of both the stator and rotor. Decreasing the throat opening by 5% results in a decrease in the mass flow rate, power, and total-to-total efficiency by 5.8%, 4.7%, and 0.2%, respectively. However, the reduction achieved in the peak stresses is more significant where the stator and rotor maximum equivalent stress decreases by 25.2% and 16.8%, respectively.
Further improvements to the blade geometry are achieved through blade shape optimisation. This design phase seeks to improve the performance within the system constraints; however, the performance improvement achievable through blade shape optimisation depends on the reference geometry performance and the flexibility of the model constraints. A comparison between the reference and optimised stages is shown in Figure 12 for the first and last stages. The axis represents the axial (Z) and tangential (T) directions, while the radial direction is selected at mid-span. The results of blade shape optimisation have shown an increase in the total-to-total efficiency from 90.2% obtained for the initial blade model to 92.9% for the optimised geometry. The optimised geometry for the first stage shows only slight variations when compared to the last stage. This is because turbulence is much lower at the turbine inlet compared to the cumulative vortices and incidence effects that are present due to flow deviation within the final stage. As a result, the inlet wedge angle is significantly increased in the last stage from 15° to 26° to account for the larger flow angle deviation from the blade angle and reduce flow separation. This modification in the last stage has resulted in an increase in the total-to-total efficiency relative to the reference geometry, which is 0.65% larger than the improvement achieved in the first stage for the same reference blade assumptions.

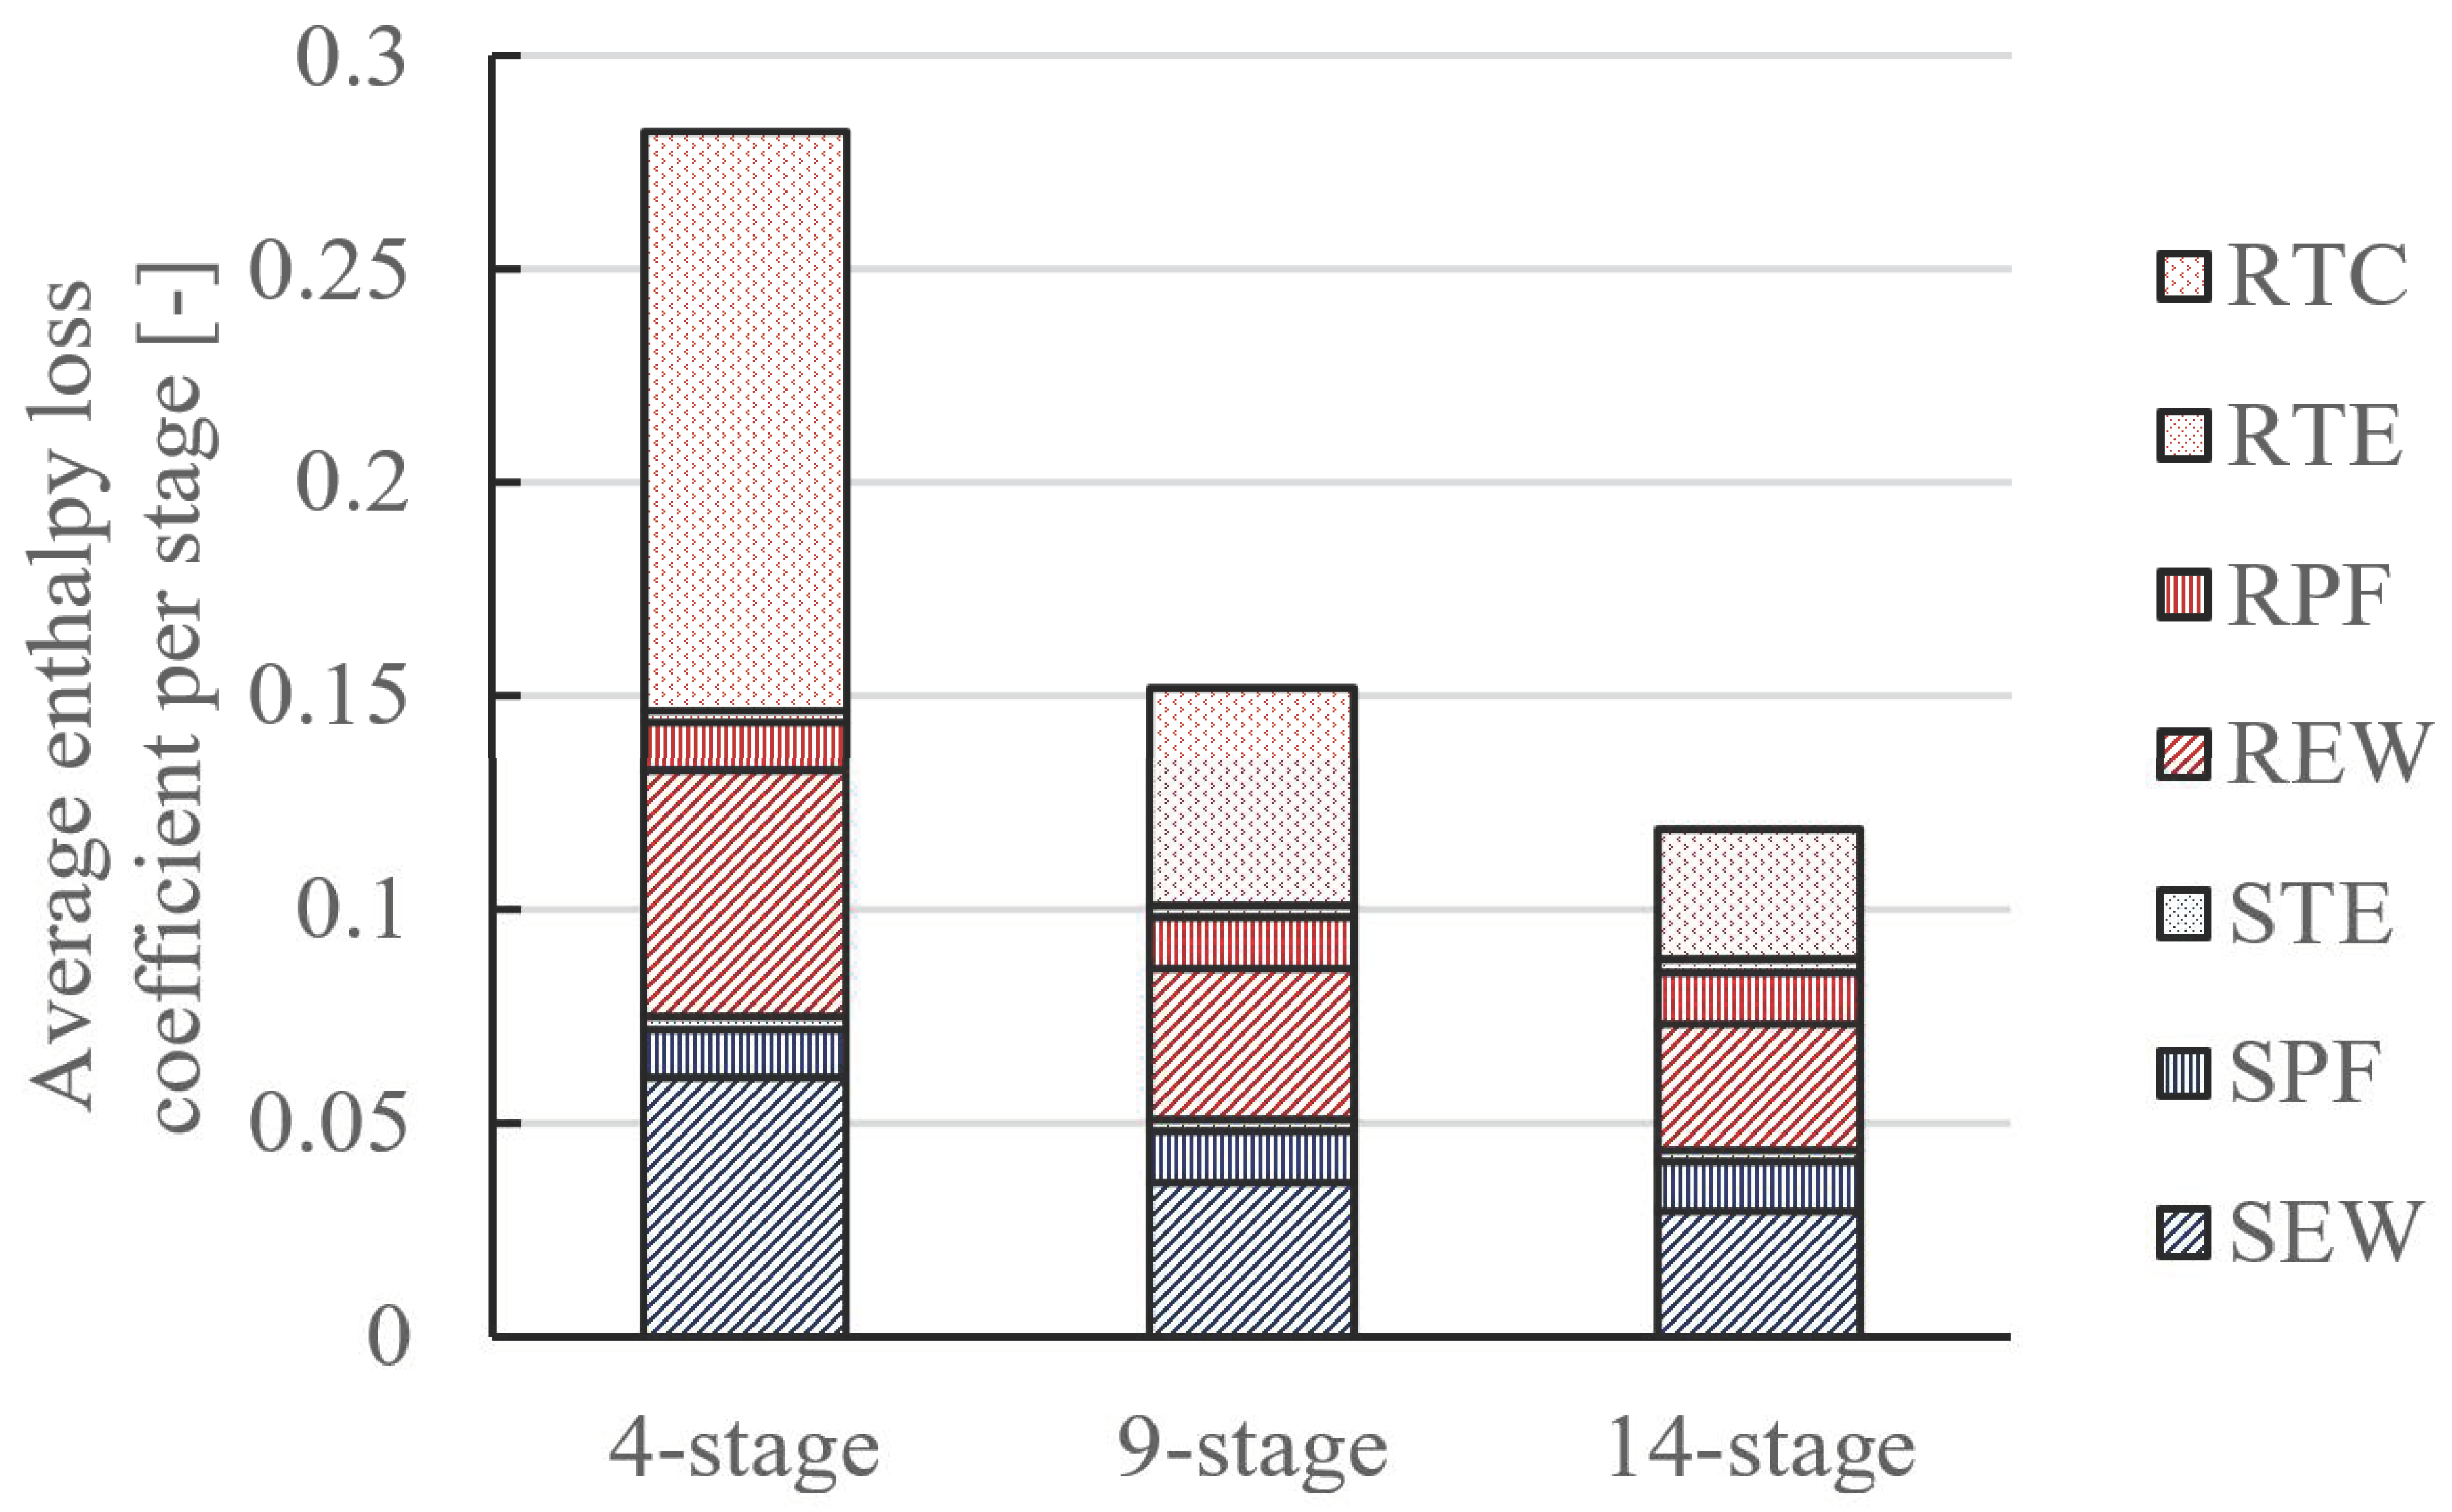
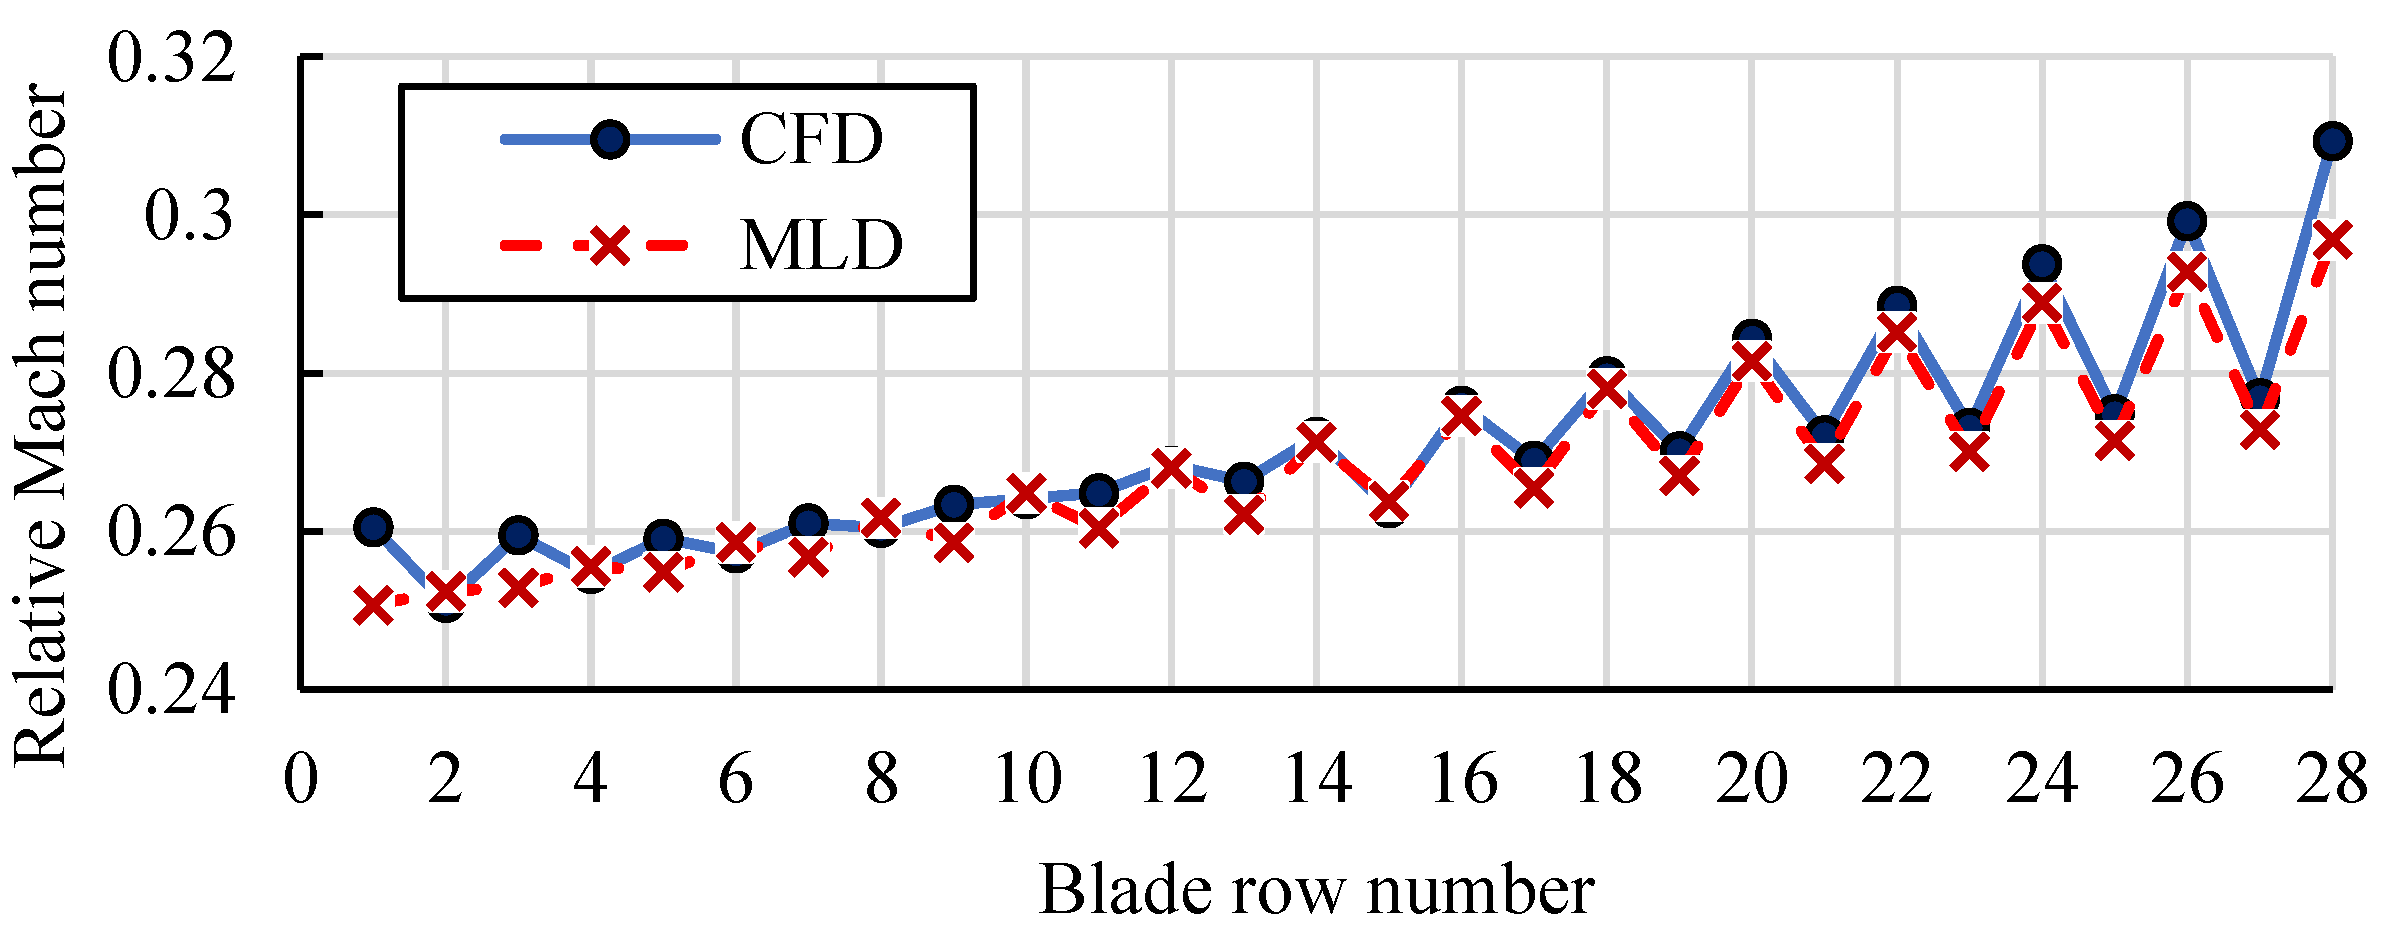
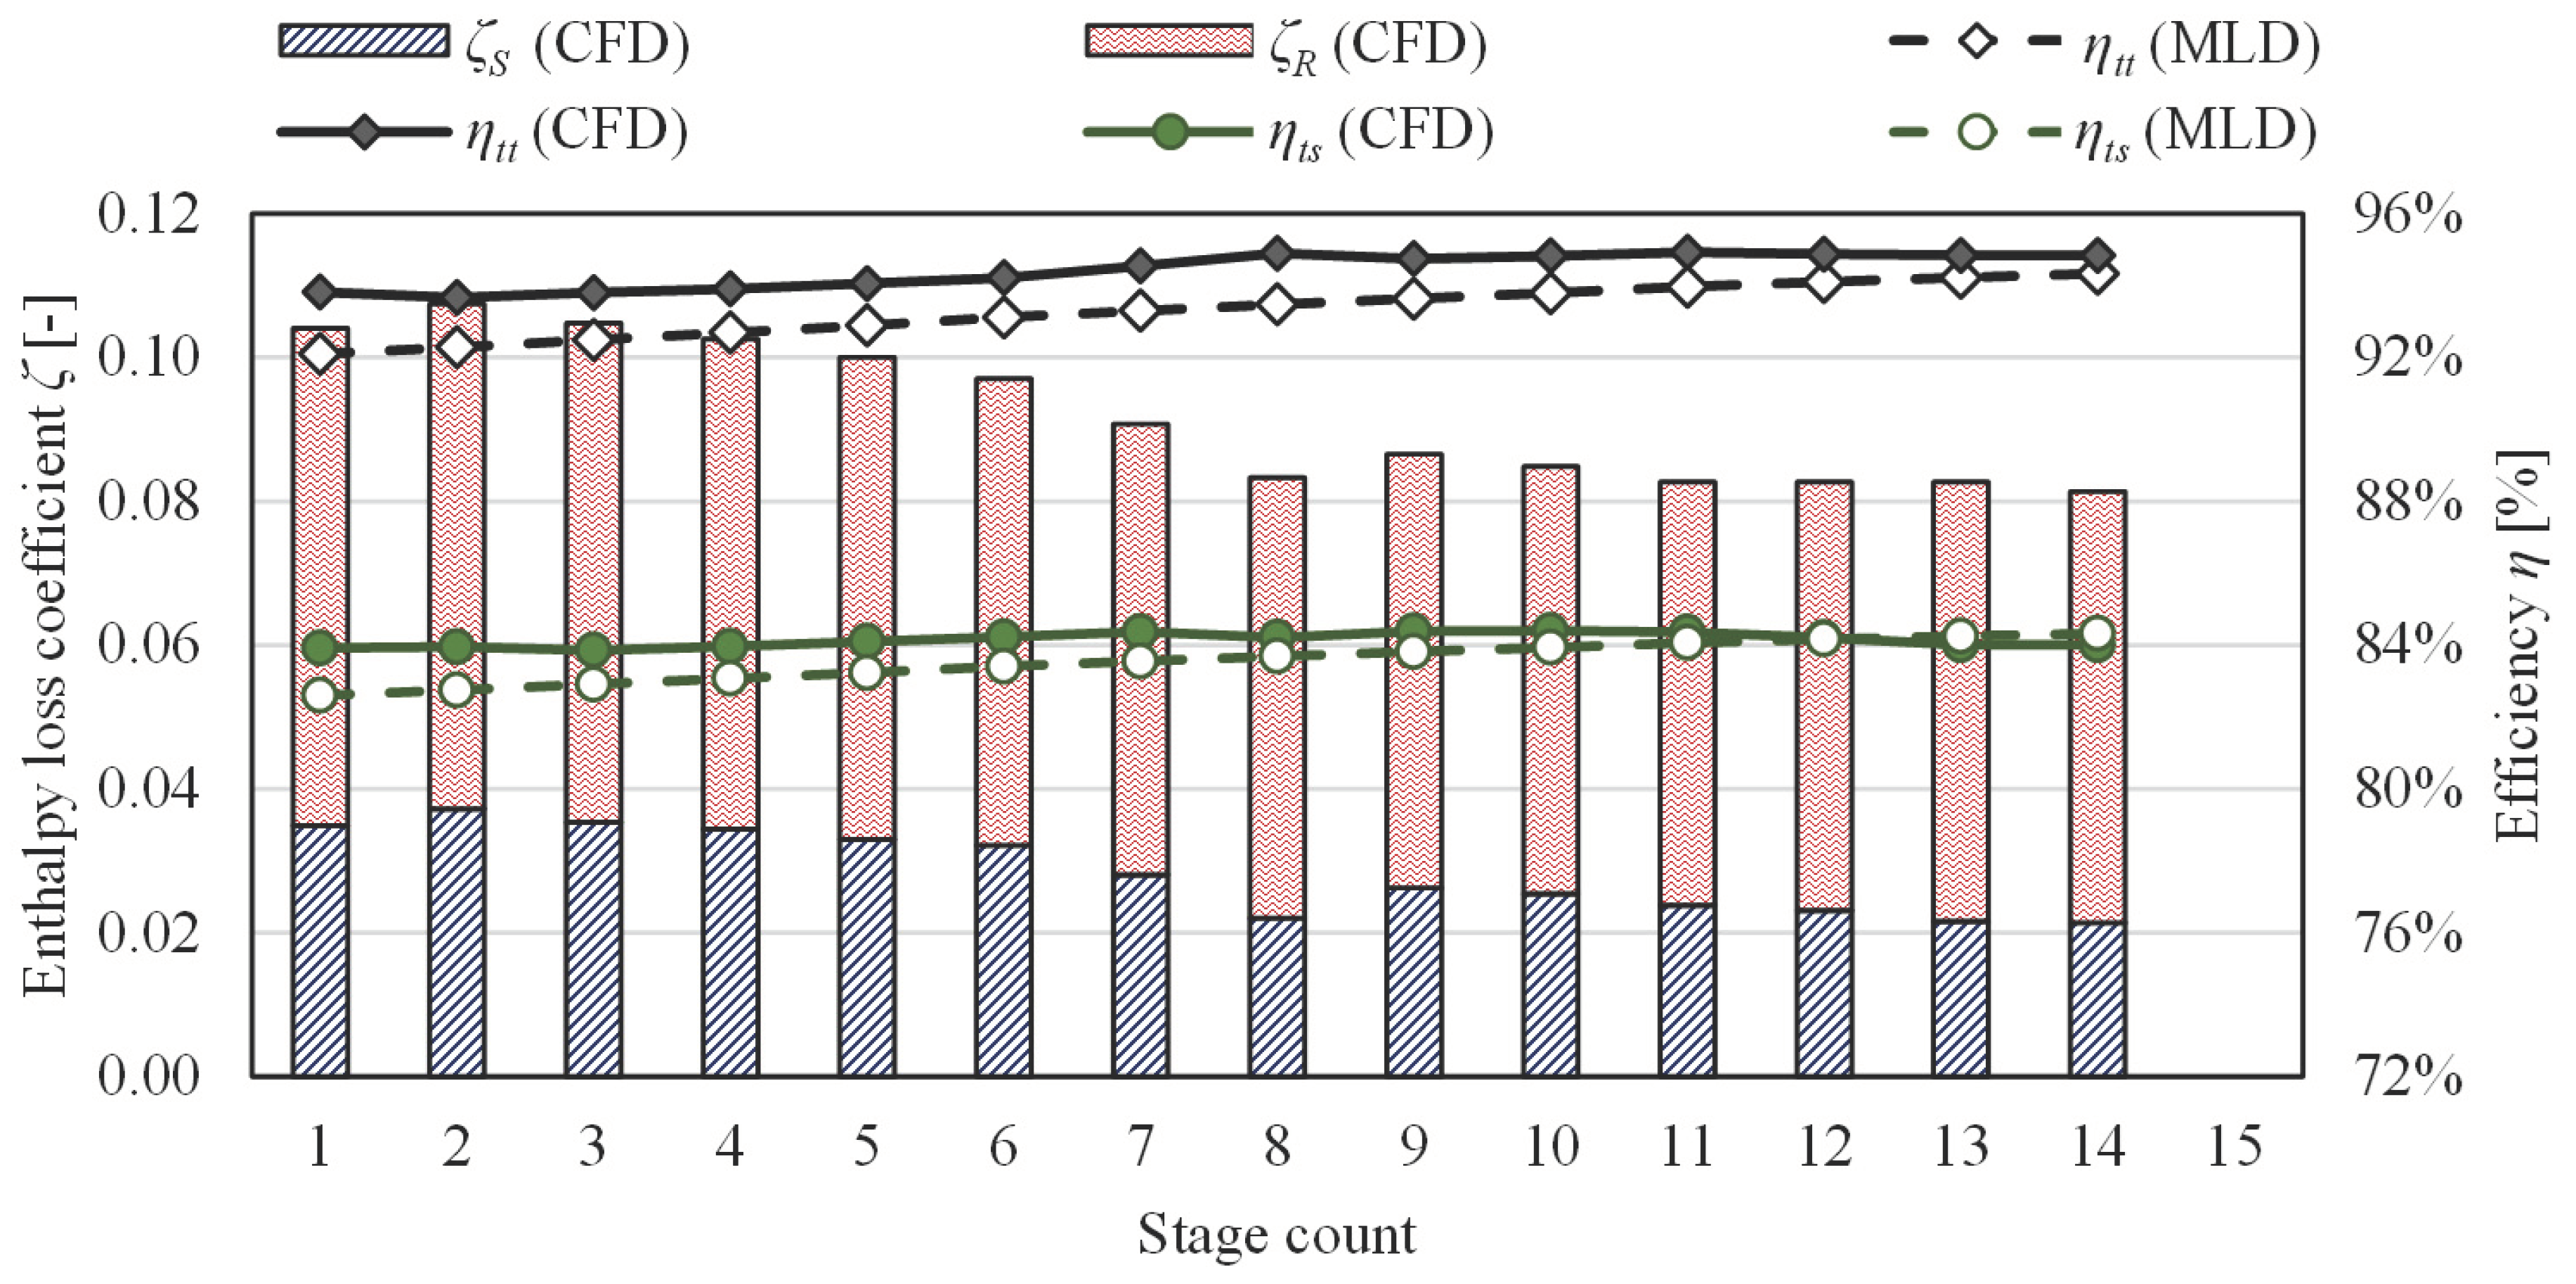
3.2. Evaluation of Design-Point Performance

The performance of each turbine stage is evaluated using both mean line design and CFD models, as summarised in Figure 13. A good agreement was obtained between both models for both total-to-total and total-to-static efficiencies; however, the mean line loss model predicts a lower total-to-total efficiency than the CFD for most of the stages, with an average difference of 1.2% across the stages. The overall trend indicates a slight increase in the total-to-total efficiency with the stage number. It can be observed that the difference between the total-to-total and total-to-static efficiency is high for each single stage, as reported in Figure 13, and low for the multi-stage calculation, as reported in Table 4. This is because the exit kinetic energy from a single stage is approximately equal to the exit kinetic energy from the whole turbine. However, the ratio between the exit kinetic energy and enthalpy drop is much lower for the multi-stage calculation compared to a single stage. As such, the difference between total-to-total to total-to-static efficiency due to the exit velocity is around 1% for the entire turbine, compared to 10% for a single stage.
Investigation of the loss breakdown structure of similar turbine stages has revealed that endwall losses are the predominant aerodynamic loss in turbines of this scale operating within sCO2 [25]. However, near the final turbine stages, where the blades are longer, and the boundary layers occupy a narrower portion of the flow path, the overall losses are lower. Similar to the total-to-total efficiency, the total-to-static efficiency decreases almost in unison with the shift in the total-to-total efficiency, which is because all the stages are designed with identical velocity triangles. To further understand the distribution of losses between the turbine stages, the enthalpy loss coefficients obtained using the CFD model results are plotted over the efficiency curves in Figure 13. Generally, the losses decrease with the stage number, which reflects the efficiency results shown in Figure 13. Moreover, the rotor losses are higher than the stator losses due to the blade rotation and tip clearance, which generates more turbulence. However, the last stator and rotor enthalpy loss coefficients are 39% and 13% lower than the first stage, respectively. This indicates that the rotor losses are more affected by the development of the flow field and cumulative flow angle deviation compared to the stator losses.

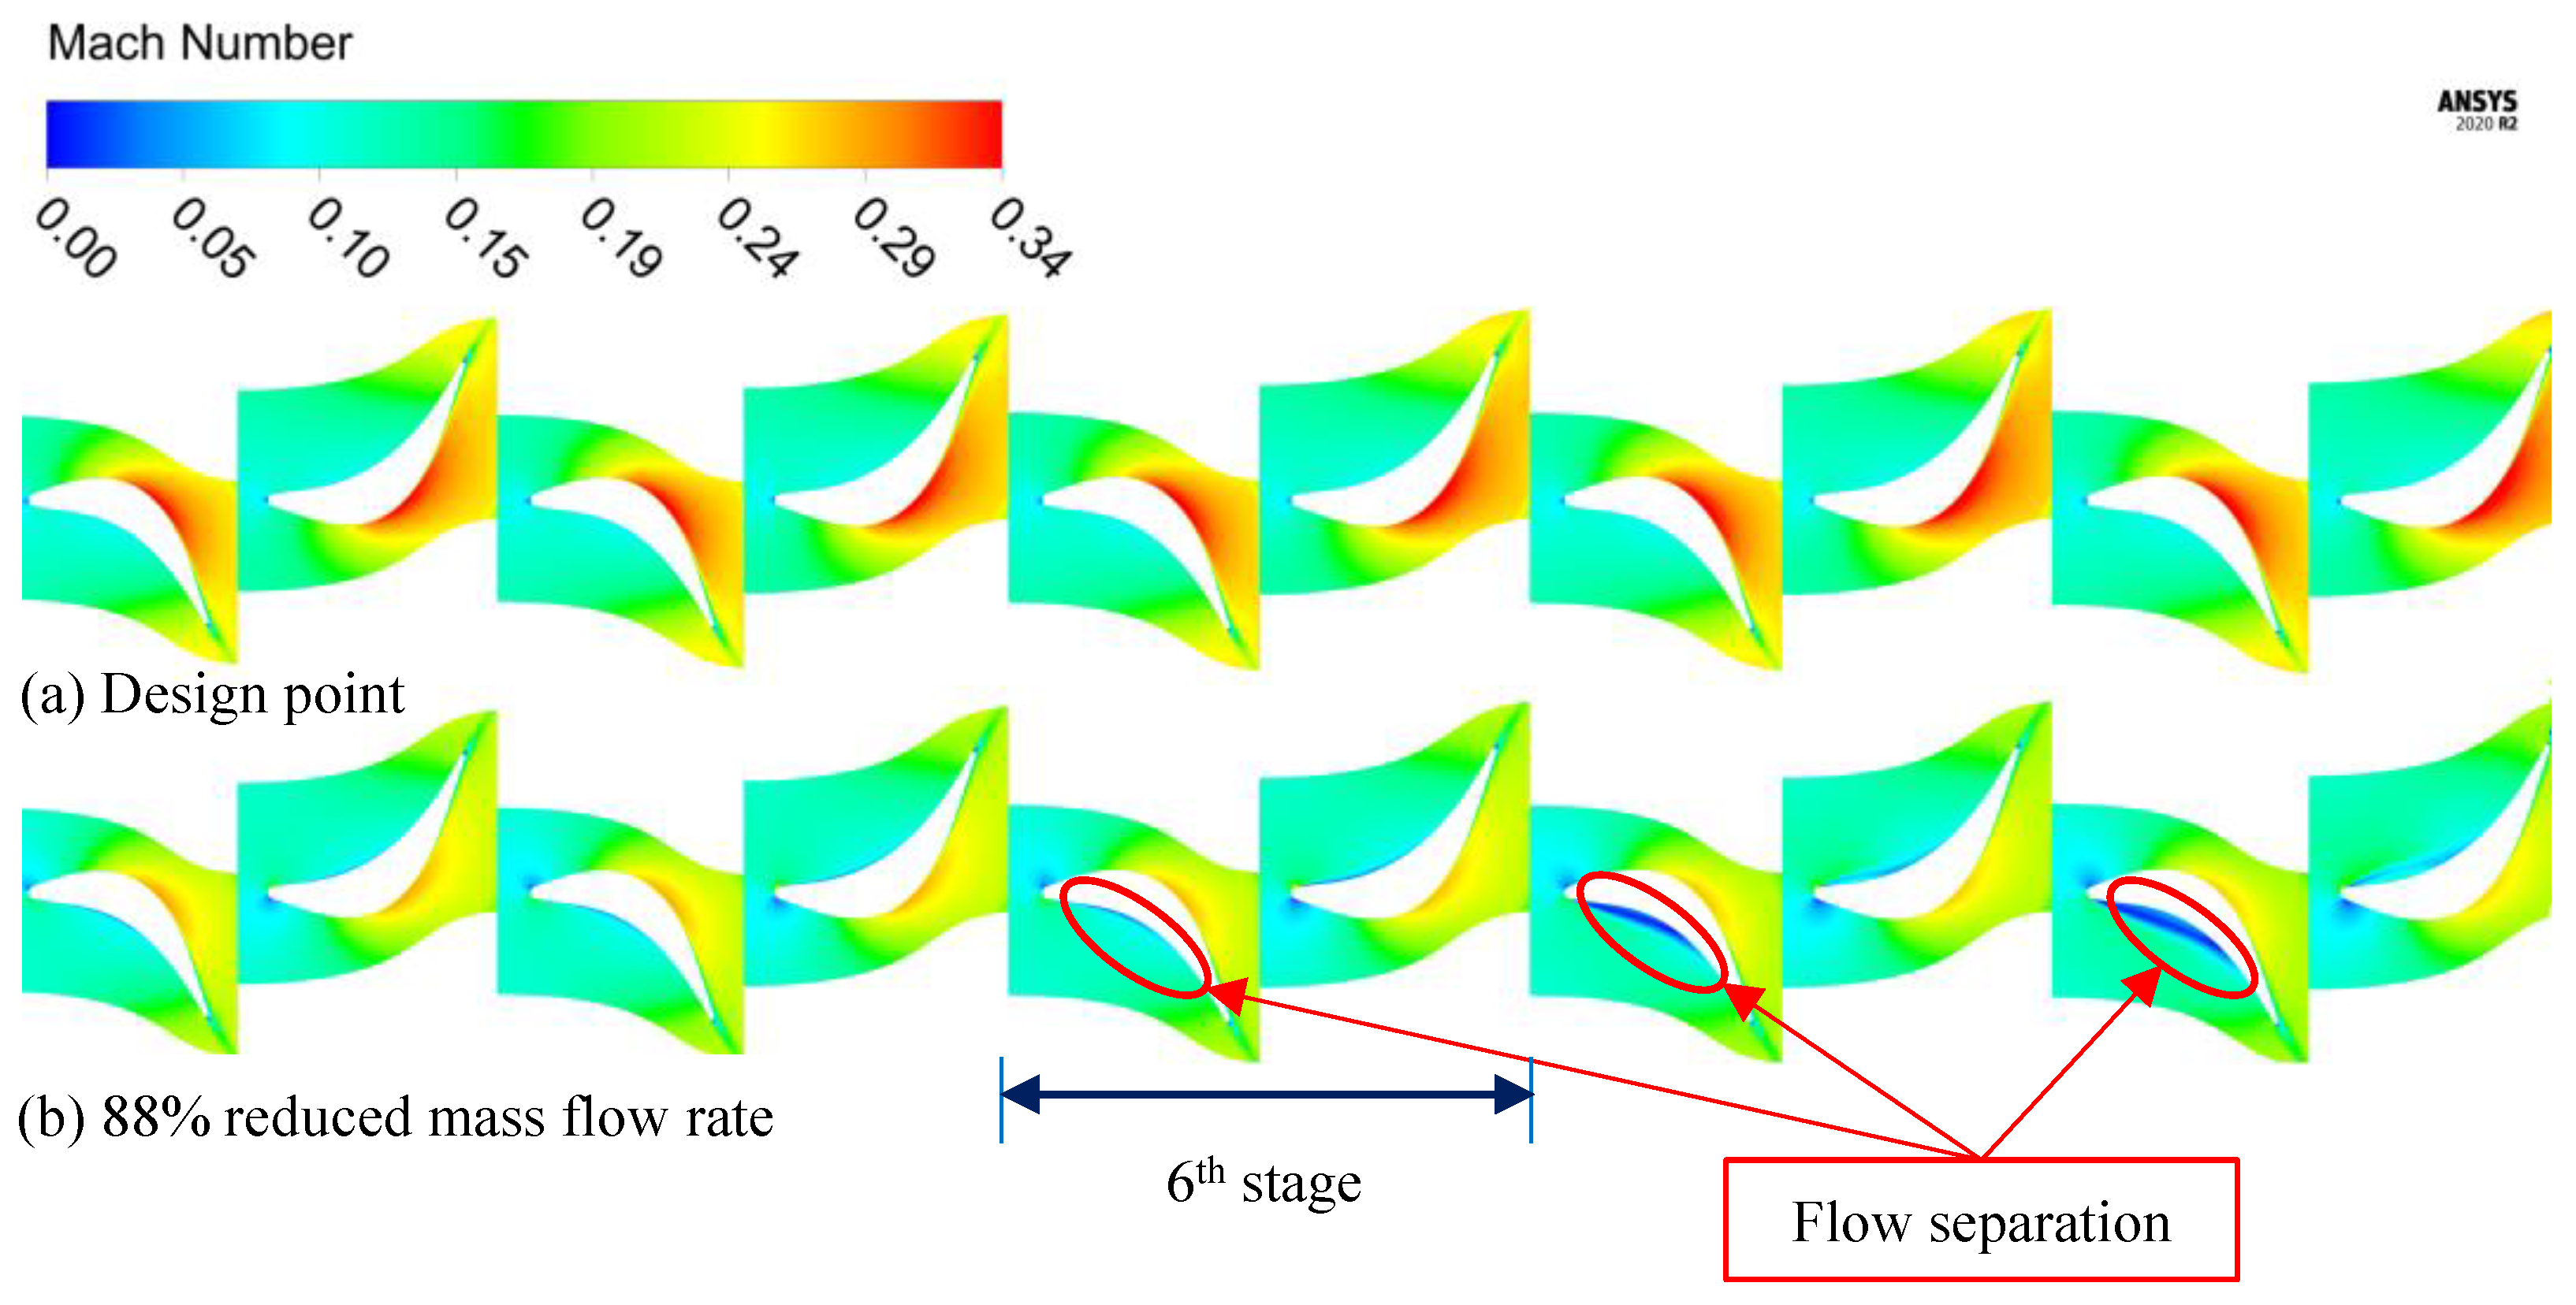
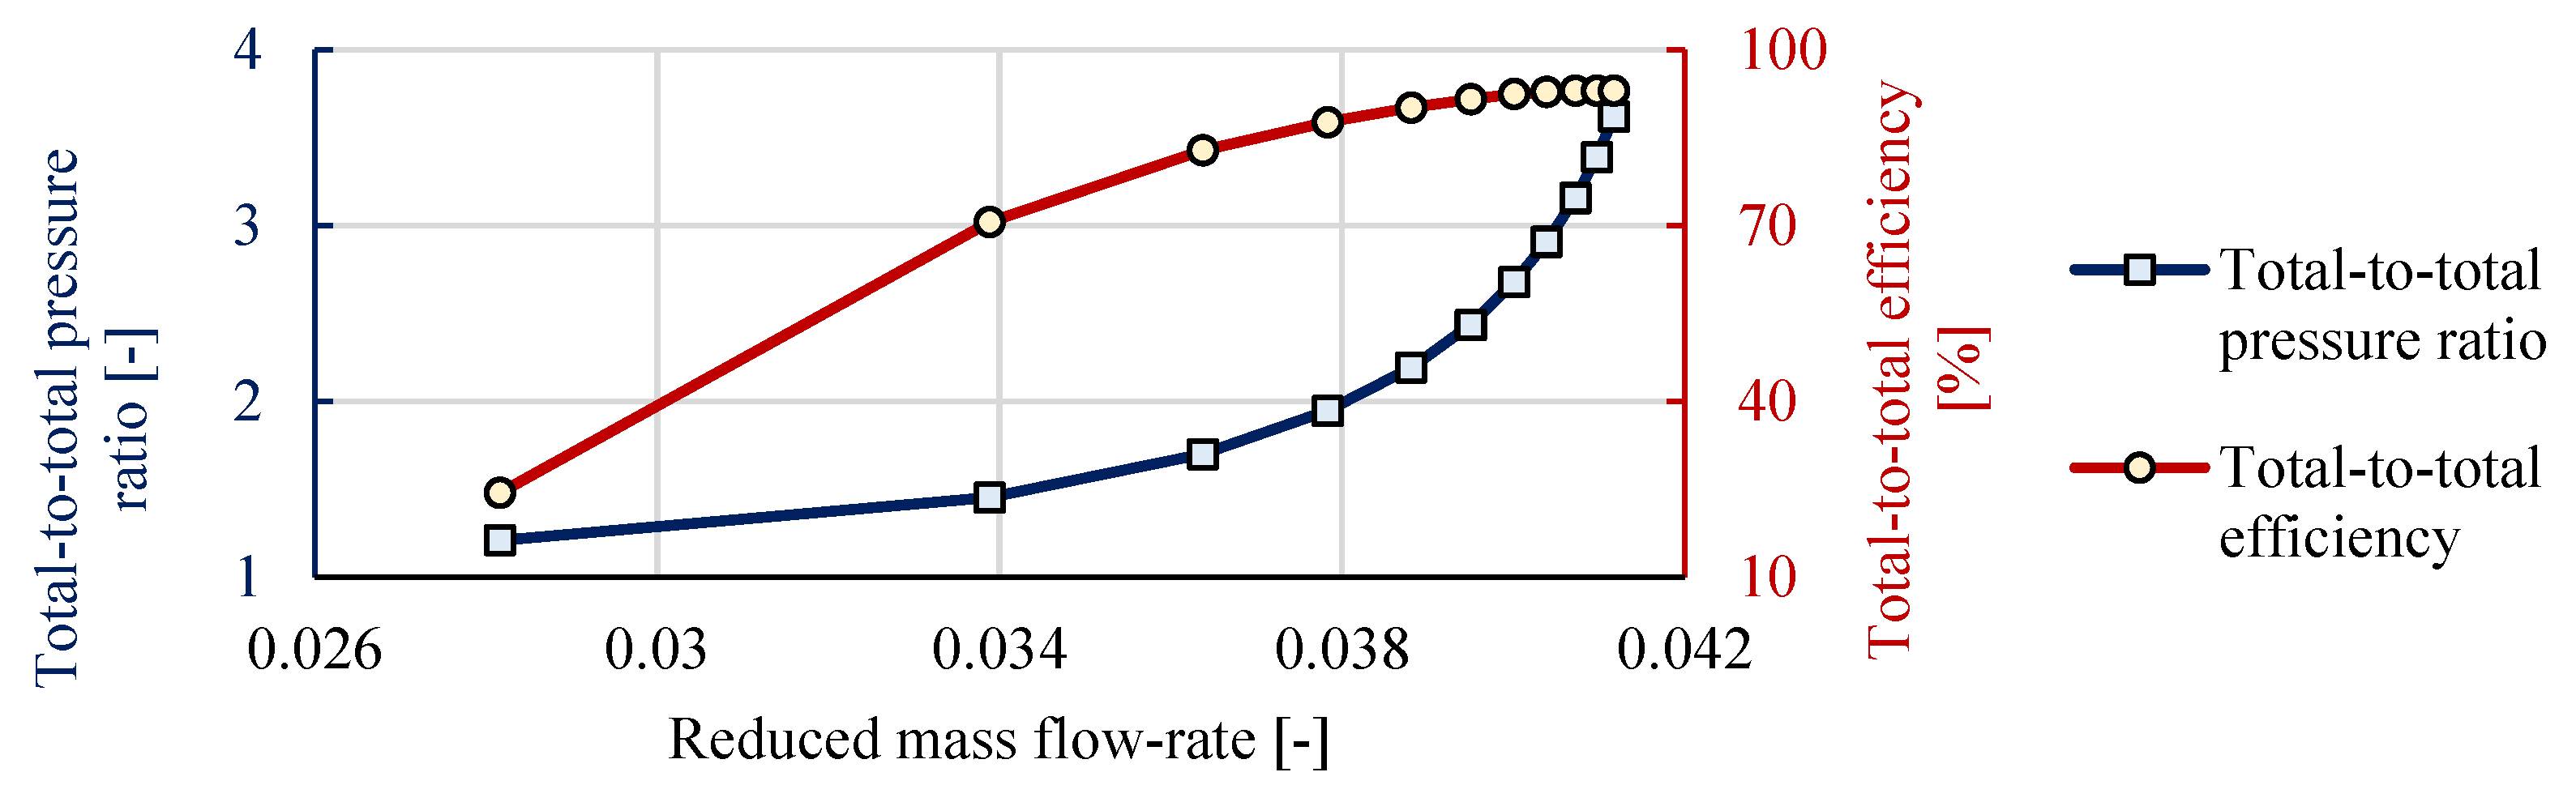
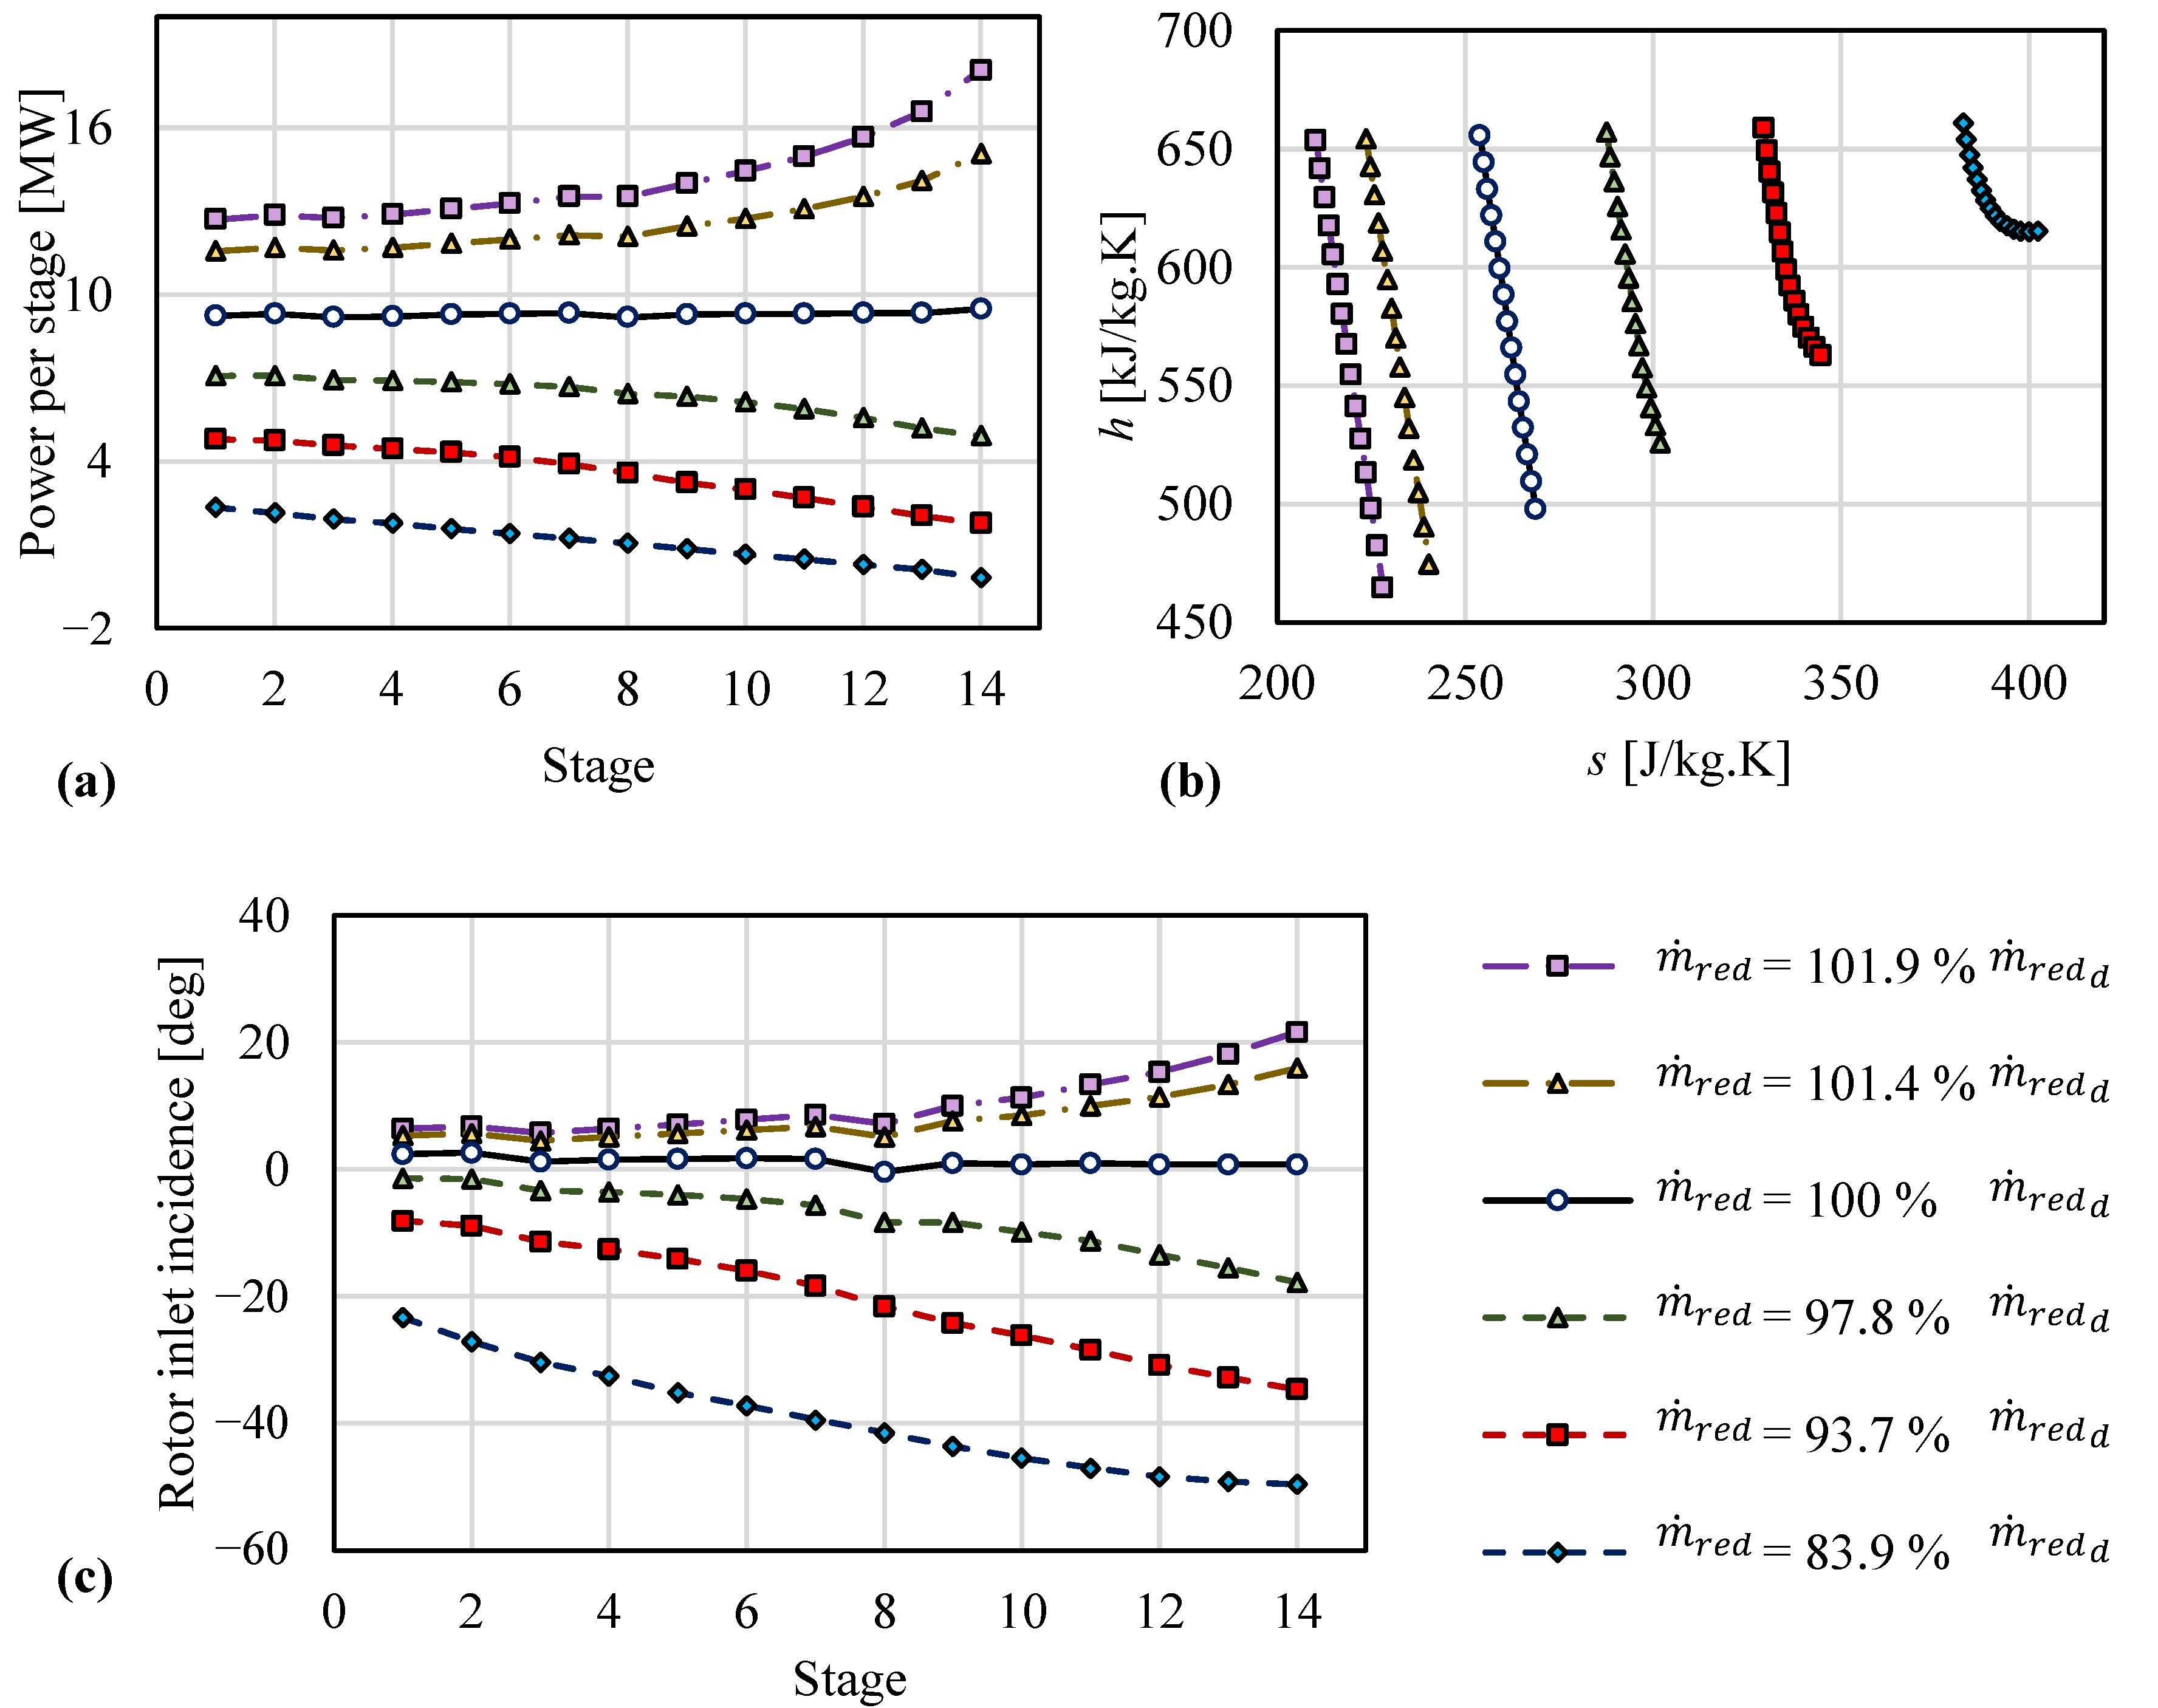
3.3. Off-Design Analysis

The performance of the turbine at off-design has been investigated using the CFD model, and the results are reported in Figure 14. The total-to-total efficiency is effectively constant between a reduced mass flow rate of 0.0395 and 0.0412. However, the efficiency sharply decreases at lower reduced mass flow rates. The off-design results have shown that the turbine can operate down to 88% of the design’s reduced mass flow rate with total-to-total efficiencies of over 80% and 81% of the design’s reduced mass flow rate with total-to-total efficiencies of over 60%. A further reduction in the mass flow rate leads to a poor performance or even negative power output, which indicates that the turbine requires external power to continue running at 3000 RPM.
The power produced by each stage at different off-design operating points is reported in Figure 15a. At the design point, the power produced by each stage is almost the same, as expected for a repeating stage design. However, a non-uniform power generation per stage is observed at higher or lower pressure ratios. At higher pressure ratio operating conditions, the stage power increases with stage number as a result of increasing absolute velocity magnitudes, which, assuming the same blade outlet angles, increases both axial and tangential components. When the velocity increases, the fluid density must also decrease, which further compounds this increase in velocity. As such the velocity and power increase from stage to stage until reaching a peak value for the last stage. In contrast, at low pressure values, the velocity decreases and density increases, leading to an accumulative velocity and power decrease until reaching a minimum power for the last stage. The performance at 83.9% of the reduced mass flow rate shows almost zero power output from the last stage, which means that this stage is no longer driving the turbine, which causes a sharp drop in overall turbine efficiency. The expansion diagram represented by the enthalpy–entropy plane is reported in Figure 15b, which reflects the observations of Figure 15a and indicates the excessive entropy generation for reduced mass flow ratios of 93.7% and 83.9% cases.
The flow deviation angle at the rotor inlet is shown in Figure 15c. The deviation angle at the design point is around zero, such that the incidence losses are minimised. At higher pressures, the deviation angle increases, especially for downstream stages; however, the efficiency drop is negligible because no flow separation occurs. At lower pressure ratios, the incidence deviation angles become much higher and negative (in the clockwise direction relative to the axial direction), causing flow separation and a significant deterioration in overall turbine performance.
The flow structure at 100% and 88% of the design reduced mass flow rate is represented by the Mach number distribution in Figure 16. At low reduced mass flow rates, flow separation is observed starting from the sixth turbine stage and propagating towards the final turbine stages as a result of increasing the incidence angle. It has been found that the location where separation first occurs moves further upstream towards the turbine inlet as the pressure ratio decreases. This explains the drop in efficiency and in stage power production at lower reduced mass flow rates, as shown in Figure 14 and Figure 15a.

4. Conclusions

This paper has presented the aerodynamic design of a 14-stage 130 MW turbine operating with a CO2/SO2 mixture. The design process was initiated by defining the aerodynamic and mechanical constraints along with the cycle requirements, which were used to obtain the basic flow path through mean line design.
The adoption of a multi-stage mean line design method, based on the Aungier loss model, was proven to be effective in predicting turbine performance with maximum deviations in efficiency of 1.5% compared to selected verification case studies. The results obtained from the mean line analysis demonstrated that increasing the number of stages from 4 to 14 yielded a significant improvement in total-to-total efficiency, increasing from 87.5% to 93.8%. The improvement was achieved by increasing the blade aspect ratio, which reduced the impact of secondary flow losses, and by reducing the tip diameter, resulting in lower tip clearance losses. However, this can introduce challenges related to shaft stability and high bending stresses due to smaller hub diameters, longer flow paths, and larger aspect ratio blades.
A good agreement was achieved between the mean line approach and the CFD results, from which it can be concluded that there is no specific impact of the working fluid on the design methodology, although the working fluid impacts the design assumptions and constraints. The difference between the total-to-total efficiency of the mean line design and the CFD model was less than 2%, providing confidence in the mean line design methodology for such turbines.
Blade shape optimisation played a crucial role in aligning the turbine boundary conditions with the cycle design conditions by ensuring that the mass flow rate remained within 1% of the cycle mass flow rate for the given pressure ratio. The optimisation process improved turbine total-to-total efficiency by 2.7%, from 90.2% to 92.9%, while maintaining acceptable stress levels. The performance analysis of the proposed turbine revealed that stage losses decrease with stage number because of the accompanying increase in blade height. The stator and rotor enthalpy loss coefficients of the last stage were found to be 39% and 13% lower than those of the first stage, respectively. Finally, the off-design analysis indicated the proposed turbine could run down to 88% of the design’s reduced mass flow rate with total-to-total efficiencies of over 80%.
Ultimately, this paper has demonstrated the suitability of the proposed methodology in designing an axial turbine for the proposed novel working fluid whilst achieving a total-to-total efficiency of 92.9% and meeting the necessary mechanical and rotor dynamic constraints.

Author Contributions

Conceptualisation, A.S.A., S.I.S., O.A.A., M.T.W. and A.I.S.; design methodology and analysis, A.S.A., S.I.S. and O.A.A.; writing original draft, A.S.A., S.I.S. and O.A.A.; review and editing, M.T.W. and A.S.A. All authors have read and agreed to the published version of the manuscript.

Funding

This work was supported by the European Union’s Horizon 2020 research and innovation programme under grant agreement No. 814985. Funder ID: 10.13039/100010661.

Data Availability Statement

Data supporting this study are available on request. Please contact the corresponding author.

Conflicts of Interest

The authors declare no conflict of interest.

References

  1. Abdeldayem, A.; Salah, S.; Aqel, O.; White, M.; Sayma, A. 2023 Design of a 130 MW axial turbine operating with a supercritical carbon dioxide mixture for the SCARABEUS project. In Proceeding of the 15th European Turbomachinery Conference, Budapest, Hungary, 24–28 April 2023; Paper n. ETC2023-133. Available online: https://www.euroturbo.eu/publications/conference-proceedingsrepository/ (accessed on 12 June 2023).
  2. White, M.T.; Bianchi, G.; Chai, L.; Tassou, S.A.; Sayma, A.I. Review of supercritical CO2 technologies and systems for power generation. Appl. Therm. Eng. 2021, 185, 116447. [Google Scholar] [CrossRef]
  3. Yin, J.M.; Zheng, Q.Y.; Peng, Z.R.; Zhang, X.R. Review of supercritical CO2 power cycles integrated with CSP. Int. J. Energy Res. 2020, 44, 1337–1369. [Google Scholar] [CrossRef]
  4. Binotti, M.; Marcoberardino, G.D.; Iora, P.; Invernizzi, C.; Manzolini, G. Scarabeus: Supercritical carbon dioxide/alternative fluid blends for efficiency upgrade of solar power plants. AIP Conf. Proc. 2020, 2303, 130002. [Google Scholar] [CrossRef]
  5. Meng, F.; Wang, E.; Zhang, B.; Zhang, F.; Zhao, C. Thermo-economic analysis of transcritical CO2 power cycle and comparison with Kalina cycle and ORC for a low-temperature heat source. Energy Convers. Manag. 2019, 195, 1295–1308. [Google Scholar] [CrossRef]
  6. Binotti, M.; Manzolini, G. Supercritical carbon dioxide/alternative fluids blends for efficiency upgrade of solar power plant. In Proceedings of the 3rd European Supercritical CO2 Conference, Paris, France, 19–20 September 2019; pp. 141–149. [Google Scholar] [CrossRef]
  7. Tafur-Escanta, P.; Valencia-Chapi, R.; López-Paniagua, I.; Coco-Enríquez, L.; Muñoz-Antón, J. Supercritical CO2 Binary Mixtures for Recompression Brayton s-CO2 Power Cycles Coupled to Solar Thermal Energy Plants. Energies 2021, 14, 4050. [Google Scholar] [CrossRef]
  8. Manzolini, G.; Binotti, M.; Morosini, E.; Sanchez, D.; Crespi, F.; Marcoberdino, G.D.; Iora, P.; Invernizzi, C. Adoption of CO2 blended with C6F6 as working fluid in CSP plants. AIP Conf. Proc. 2022, 2445, 090005. [Google Scholar] [CrossRef]
  9. Crespi, F.; de Arriba, P.R.; Sánchez, D.; Muñoz, A. Preliminary investigation on the adoption of CO2-SO2 working mixtures in a transcritical Recompression cycle. Appl. Therm. Eng. 2022, 211, 118384. [Google Scholar] [CrossRef]
  10. Crespi, F.; Martínez, G.; Rodriguez de Arriba, P.; Sánchez, D.; Jiménez-Espadafor, F. Influence of working fluid composition on the optimum characteristics of blended supercritical carbon dioxide cycles. In Proceedings of the Turbo Expo: Power for Land, Sea, and Air, Virtual, Online, 7–11 June 2021; American Society of Mechanical Engineers: New York, NY, USA, 2021; p. V010T030A030. [Google Scholar] [CrossRef]
  11. Crespi, F.; de Arriba, P.R.; Sánchez, D.; Ayub, A.; Di Marcoberardino, G.; Invernizzi, C.M.; Martínez, G.; Iora, P.; Di Bona, D.; Binotti, M. Thermal efficiency gains enabled by using CO2 mixtures in supercritical power cycles. Energy 2022, 238, 121899. [Google Scholar] [CrossRef]
  12. Schubert, D. Boron oxides, boric acid, and borates. In Kirk-Othmer Encyclopedia of Chemical; Wiley: Hoboken, NJ, USA, 2000; Volume 4, pp. 1–68. [Google Scholar] [CrossRef]
  13. Novales, D.; Erkoreka, A.; De la Peña, V.; Herrazti, B. Sensitivity analysis of supercritical CO2 power cycle energy and exergy efficiencies regarding cycle component efficiencies for concentrating solar power. Energy Convers. Manag. 2019, 182, 430–450. [Google Scholar] [CrossRef]
  14. Dostal, V.; Driscoll, M.J.; Hejzlar, P. A Supercritical Carbon Dioxide Cycle for Next Generation Nuclear Reactors. Ph.D. Thesis, Czech Technical University, Prague, Czech Republic, 2004. [Google Scholar]
  15. Brun, K.; Friedman, P.; Dennis, R. 7-Turbomachinery. In Fundamentals and Applications of Supercritical Carbon Dioxide (sCO2) Based Power Cycles, 1st ed.; Woodhead Publishing: Sawston, UK, 2017; pp. 147–215. [Google Scholar]
  16. Zhang, H.; Zhao, H.; Deng, Q.; Feng, Z. Aerothermodynamic design and numerical investigation of supercritical carbon dioxide turbine. In Proceedings of the Turbo Expo: Power for Land, Sea, and Air, Montreal, QC, Canada, 15–19 June 2015; American Society of Mechanical Engineers: New York, NY, USA, 2015; p. V009T036A007. [Google Scholar] [CrossRef]
  17. Shi, D.; Zhang, L.; Xie, Y.; Zhang, D. Aerodynamic design and off-design performance analysis of a multi-stage S-CO2 axial turbine based on solar power generation system. Appl. Sci. 2019, 9, 714. [Google Scholar] [CrossRef]
  18. Bidkar, R.A.; Mann, A.; Singh, R.; Sevincer, E.; Cich, S.; Day, M.; Kulhanek, C.D.; Thatte, A.M.; Peter, A.M.; Hofer, D.; et al. Conceptual designs of 50 MWe and 450 MWe supercritical CO2 turbomachinery trains for power generation from coal. Part 1: Cycle and turbine. In Proceedings of the 5th International Symposium-Supercritical CO2, San Antonio, TX, USA, 28–31 March 2016. [Google Scholar]
  19. Kalra, C.; Hofer, D.; Sevincer, E.; Moore, J.; Brun, K. Development of high efficiency hot gas turbo-expander for optimized CSP supercritical CO2 power block operation. In Proceedings of the Fourth International Symposium—Supercritical CO2 Power Cycles (sCO2), Pittsburgh, Pennsylvania, 9–10 September 2014; pp. 1–11. [Google Scholar]
  20. Schmitt, J.; Willis, R.; Amos, D.; Kapat, J.; Custer, C. Study of a supercritical CO2 turbine with TIT of 1350 K for Brayton cycle with 100 MW class output: Aerodynamic analysis of stage 1 vane. In Proceedings of the Turbo Expo: Power for Land, Sea, and Air, Düsseldorf, Germany, 16–20 June 2014; American Society of Mechanical Engineers: New York, NY, USA, 2014; p. V03BT36A019. [Google Scholar] [CrossRef]
  21. Aqel, O.; White, M.; Sayma, A. Binary interaction uncertainty in the optimisation of a transcritical cycle: Consequences on cycle and turbine design. In Proceedings of the 4th European sCO2 Conference for Energy Systems, Online Conference, 23–24 March 2021; pp. 164–176. [Google Scholar] [CrossRef]
  22. Abdeldayem, A.; White, M.; Paggini, A.; Ruggiero, M.; Sayma, A.I. Integrated Aerodynamic and Structural Blade Shape Optimisation of Axial Turbines Operating with Supercritical Carbon Dioxide Blended with Dopants. J. Eng. Gas Turbine Power 2022, 144, 101016. [Google Scholar] [CrossRef]
  23. Abdeldayem, A.; Paggini, A.; Diurno, T.; Orazi, C.; White, M.; Ruggiero, M.; Sayma, A. Integrated aerodynamic and mechanical design of a large-scale axial turbine operating with supercritical carbon dioxide mixtures. J. Eng. Gas Turbine Power 2023, 146, 021011. [Google Scholar] [CrossRef]
  24. Salah, S.I.; Khader, M.A.; White, M.T.; Sayma, A.I. Mean-line design of a supercritical CO2 micro axial turbine. Appl. Sci. 2020, 10, 5069. [Google Scholar] [CrossRef]
  25. Salah, S.I.; White, M.T.; Sayma, A.I. A comparison of axial turbine loss models for air, sCO2 and ORC turbines across a range of scales. Int. J. Thermofluids 2022, 15, 100156. [Google Scholar] [CrossRef]
  26. Smith, S. A simple correlation of turbine efficiency. Aeronaut. J. 1965, 69, 467–470. [Google Scholar] [CrossRef]
  27. Kacker, S.; Okapuu, U. A mean line prediction method for axial flow turbine efficiency. J. Eng. Power 1982, 104, 111–119. [Google Scholar] [CrossRef]
  28. Ainley, D.; Mathieson, G. A Method of Performance Estimation for Axial-Flow Turbines. Aeronautical Research Council. Reports and Memoranda; Her Majesty’s Stationery Office: London, UK, 1951; Available online: https://reports.aerade.cranfield.ac.uk/handle/1826.2/3538 (accessed on 11 June 2023).
  29. Aungier, R.H. Turbine Aerodynamics; American Society of Mechanical Engineers Press: New York, NY, USA, 2006. [Google Scholar]
  30. Salah, S.I.; Crespi, F.; White, M.T.; Muñoz, A.; Paggini, A.; Ruggiero, M.; Sánchez, D.; Sayma, A.I. Axial turbine flow path design for concentrated solar power plants operating with CO2 blends. Appl. Therm. Eng. 2023, 230, 120612. [Google Scholar] [CrossRef]
  31. Abdeldayem, A.; White, M.T.; Sayma, A.I. Comparison of CFD predictions of supercritical carbon dioxide axial flow turbines using a number of turbulence models. In Proceedings of the Turbo Expo: Power for Land, Sea, and Air, Virtual, Online, 7–11 June 2021; American Society of Mechanical Engineers: New York, NY, USA, 2021; p. V010T030A010. [Google Scholar] [CrossRef]
  32. Touil, K.; Ghenaiet, A. Simulation and analysis of vane-blade interaction in a two-stage high-pressure axial turbine. Energy 2019, 172, 1291–1311. [Google Scholar] [CrossRef]
  33. Baudouin, O.; Dechelotte, S.; Guittard, P.; Vacher, A. Simulis® Thermodynamics: An open framework for users and developers. In Computer Aided Chemical Engineering; Braunschweig, B., Joulia, X., Eds.; Elsevier: Amsterdam, The Netherlands, 2008; pp. 635–640. [Google Scholar]
  34. Morosini, E.; Ayub, A.; di Marcoberardino, G.; Invernizzi, C.M.; Iora, P.; Manzolini, G. Adoption of the CO2 + SO2 mixture as working fluid for transcritical cycles: A thermodynamic assessment with optimized equation of state. Energy Convers. Manag. 2022, 255, 115263. [Google Scholar] [CrossRef]
  35. Abdeldayem, A.; Salah, S.; White, M.; Sayma, A. A modified loss breakdown approach for axial turbines operating with blended supercritical carbon dioxide. J. Eng. Gas Turbine Power 2023, 145, 081002. [Google Scholar] [CrossRef]
  36. Coull, J.D. Endwall Loss in Turbine Cascades. J. Turbomach. 2017, 139, 081004. [Google Scholar] [CrossRef]
Figure 1. Geometry of a blade cross-section where C is the absolute velocity, W is the relative velocity, U is the blade linear speed, Ca is the absolute axial velocity, Cw is the absolute tangential velocity, α is the absolute velocity angle and β is the relative velocity angle.
Ijtpp 09 00005 g001
Figure 2. Axial flow turbine stage showing the stator (S) and the rotor (R) where r is the radius at hub, tip and mean sections.
Ijtpp 09 00005 g002
Figure 3. Numerical domain of the 14-stage design.
Ijtpp 09 00005 g003
Figure 4. Mesh study of the first stage out of the 14-stage design. The blue line shows the efficiency variation with the number of grid points while the red dashed line highlights the selected mesh point for the study.
Ijtpp 09 00005 g004
Figure 5. Blade aerofoil geometry as defined for the optimisation model. The green dashed line represents the aerofoil chord line.
Ijtpp 09 00005 g005
Figure 6. Exemplary range for decision variables of optimisation model search space.
Ijtpp 09 00005 g006
Figure 7. Effect of the number of stages ( n s t ) on (a) the total-to-total efficiency ( η t t ) and hub diameter ( D h u b ), and (b) peripheral speed for the CO2-SO2 mixture as evaluated by the mean line loss model.
Ijtpp 09 00005 g007
Figure 8. The loss breakdown of the 4-, 9-, and 14-stage models obtained using the Aungier loss model.
Ijtpp 09 00005 g008
Figure 9. Meridional view of the proposed 14-stage flow path design.
Ijtpp 09 00005 g009
Figure 10. Exit Mach number from each blade row obtained using the mean line design and CFD.
Ijtpp 09 00005 g010
Figure 11. Comparison between the flow field obtained for the 1st and 14th stages at the design point. The red dashed circles highlight the incidence angle for the different stages.
Ijtpp 09 00005 g011
Figure 12. Comparison between reference and optimised aerofoil for the 1st and 14th stages.
Ijtpp 09 00005 g012
Figure 13. Comparison between the MLD and CFD total-to-total and total-to-static efficiencies per stage, along with the enthalpy loss coefficients obtained using the CFD model results.
Ijtpp 09 00005 g013
Figure 14. The off-design performance maps of the proposed turbine design.
Ijtpp 09 00005 g014
Figure 15. Off-design evaluation per stage. (a) Power developed, (b) enthalpy–entropy diagram, and (c) the rotor inlet incidence angle as obtained at different operating inlet total pressures.
Ijtpp 09 00005 g015
Figure 16. Flow field obtained for the five mid-stages: (a) design point and (b) 88% of the design’s reduced mass flow rate.
Ijtpp 09 00005 g016
Table 1. Mean line model design criteria.
Design ParameterValueDesign ParameterValue
Surface roughness (mm)0.002 Degree   of   reaction   Λ 0.5
Stage   flow   coefficient   ϕ 0.5 [26] Trailing   edge - to - throat   ratio   t / o 0.05 [27]
Stage   loading   coefficient   ψ 1 [26] Pitch - to - chord   ratio   s / c 0.85 [28]
Table 2. Boundary and operating conditions.
ParameterValueParameterValue
DopantSO2Outlet static pressure (bar)81.24
Dopant molar fraction (%)20%Mass flow rate (kg/s)827
Turbine inlet total pressure (bar)239Rotational speed (RPM)3000
Turbine inlet total temperature (K)973
Table 3. Mean line turbine design data for the 1st, 7th, and 14th stages.
ParameterS1R1S7R7S14R14
Axial chord (mm)35.5338.9640.4344.2848.7553.12
Hub radius (mm)310.61
Inlet tip radius (mm)365.17366.54386.34387.54423.51425.21
Outlet tip radius (mm)366.17368.04387.21389.81424.74428.99
No. of blades585353484742
Tip gap (mm)-0.515-0.546-0.601
Table 4. Comparison between mean line design and CFD model results.
ParameterUnitMLDCFDDifference
m ˙ kg/s827.06822.90.51%
P o w e r MW131.9130.11.38%
η t t %93.8492.901.01%
η t s %93.0691.951.21%
Table 5. The effect of geometry tuning on the peak stresses and aerodynamic performance.
Model m ˙ (kg/s) P o w e r   ( M W ) η t t (%) σ S (MPa) σ R (MPa)
Reference geometry898.2210.0793.15445.70310.64
Increase outlet wedge angle (decrease throat opening 5%)846.469.6092.98333.28258.38
Increase the base aerofoil thickness (around 25%)873.389.7692.77272.13237.99
Increase the whole blade thickness (around 25%)848.729.4692.19269.86223.97
Increase base fillet radius from 1 mm to 2 mm890.159.8592.86238.36264.22
Disclaimer/Publisher’s Note: The statements, opinions and data contained in all publications are solely those of the individual author(s) and contributor(s) and not of MDPI and/or the editor(s). MDPI and/or the editor(s) disclaim responsibility for any injury to people or property resulting from any ideas, methods, instructions or products referred to in the content.

