1. Introduction
In many applications, the development objectives for turbo compressors are often difficult to achieve simultaneously. A maximum map width, highest possible pressure ratios with a maximum efficiency often lead to opposing design directions and a trade-off has to be found. While enhancements of manufacturing technologies and new materials continuously broaden the design space, it is unlikely that improvements of all objectives are achievable with classic impeller design methods. The consideration of component interaction and the introduction of new structures in the development and optimization process might enable new step changes. In this context, it is well known that structures in the casing (casing treatments, CTs) are useful to increase operating range. An early overview of CT possibilities for centrifugal compressors was presented by Fisher [
1] and an overview for axial machines was given by Hathaway [
2].
In modern automotive turbocharger compressors, it is common practice to include a CT in the form of an inducer recirculating bypass when operating range is paramount. Design examples and investigations of a recirculating bypass can be found, amongst others, in [
3,
4]. In jet engines and gas turbines, the application of CTs is uncommon at an industrial level, but many investigations including diverse design options and working principles are available in the literature.
While early attempts to design CTs were based on analytic considerations and test experiences, the progress in 3D CFD and optimization techniques enables new improvement possibilities. Good examples are the published CT simulation and test results by Streit [
5] and Brandstetter [
6]. The effect of the herein developed and investigated CT is limited to the blade tip region and it is supposed to only act if the rotor is highly throttled close to its operation limit. Therewith, it is possible to increase operating range while not influencing the efficiency in other regions of the compressor map.
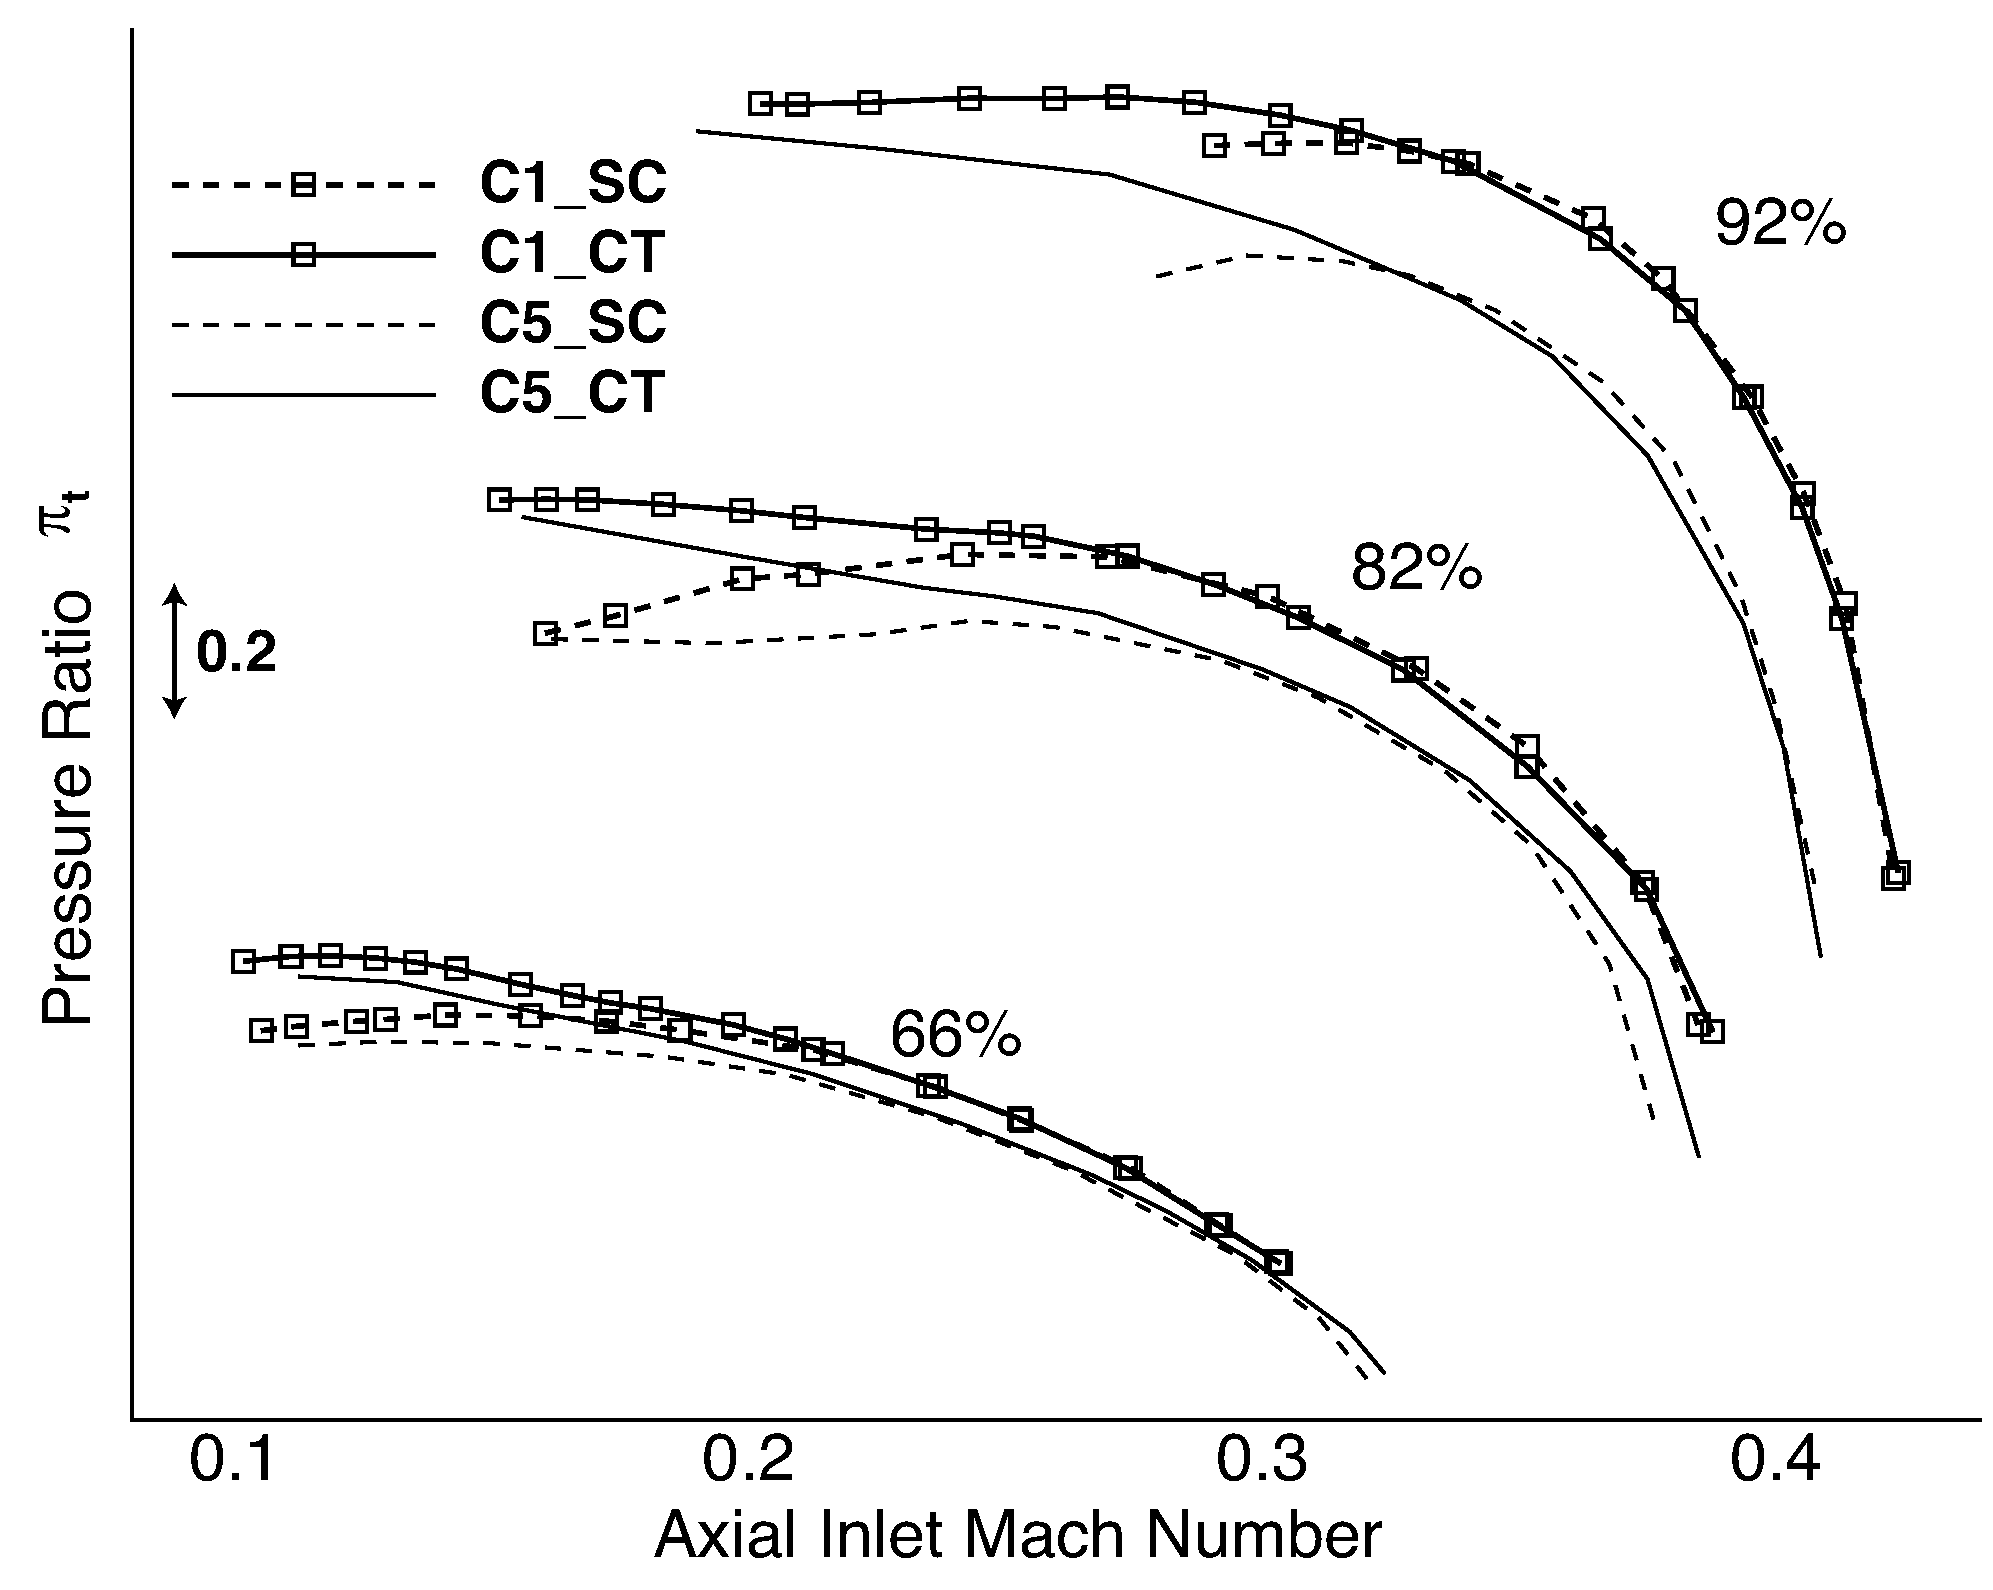
Based on this optimized design a CT is transferred and adapted from axial compressors and applied to a centrifugal compressor design with high ratio of inlet shroud to impeller outlet radius. The experimental setup and test results are presented in this paper. An overview of pressure ratio enhancements and map width change are visualized in
Figure 1. Experimental results of a compressor with smooth casing (SC) are compared to results achieved with the developed CT. Data are shown for a nominal (C1) and downscaled version (C5) of the same impeller. Pressure ratio is plotted against axial Mach number in the inducer, which allows an aerodynamic and design comparison of compressors with different size. The more commonly used corrected mass flow rate is dependent on compressor size resulting in a shift of compressor maps. Manufacturing and physical limits lead to deviations in the aerodynamic performance of the configurations, which are discussed below. In both cases (C1 and C5) pressure ratio is increased for low mass flow operation with the developed CT. Apart from that region, the compressor is unaffected by the CT. In addition, the CT enhances the operation limit of the investigated configuration. This is especially the case for high circumferential Mach numbers. Similar effects were reported by Brandstetter [
6] in his experiments with an axial compressor.
This paper presents:
the aerodynamic effectiveness of the investigated CT;
a performance comparison to an inducer recirculating bypass;
a detailed investigation of the underlying working principle; and
a study of its transferability to other impellers.
1.1. Characterization of Investigated Impellers
The centrifugal compressors under investigation are various automotive turbocharger compressors. In total, four different impeller configurations with outlet diameter mm were investigated (C1–C4). These were all equipped with the same vanless diffuser and scroll volute. In addition, a downsized version of C1 with outlet diameter mm was tested to demonstrate the scalability of the CT (C5). From the reference design C1, which is a typical automotive design in this diameter range, the inlet angle was reduced by up to 8° for the different configurations. The outlet angle was decreased by up to 10°.
In all cases, operating range is paramount for those automotive compressors and design tools tend to deliver designs with high inlet shroud to outlet radius, which was not varied in this study. Past experience shows that these designs tend to form a recirculation zone in the inducer when the compressor is further throttled from its nominal operating point. The result of this recirculation zone is a reduced efficiency (
) and a reduced work input coefficient (
). A comprehensive investigation and a modeling approach of inducer recirculation effects were published by Harley [
7].
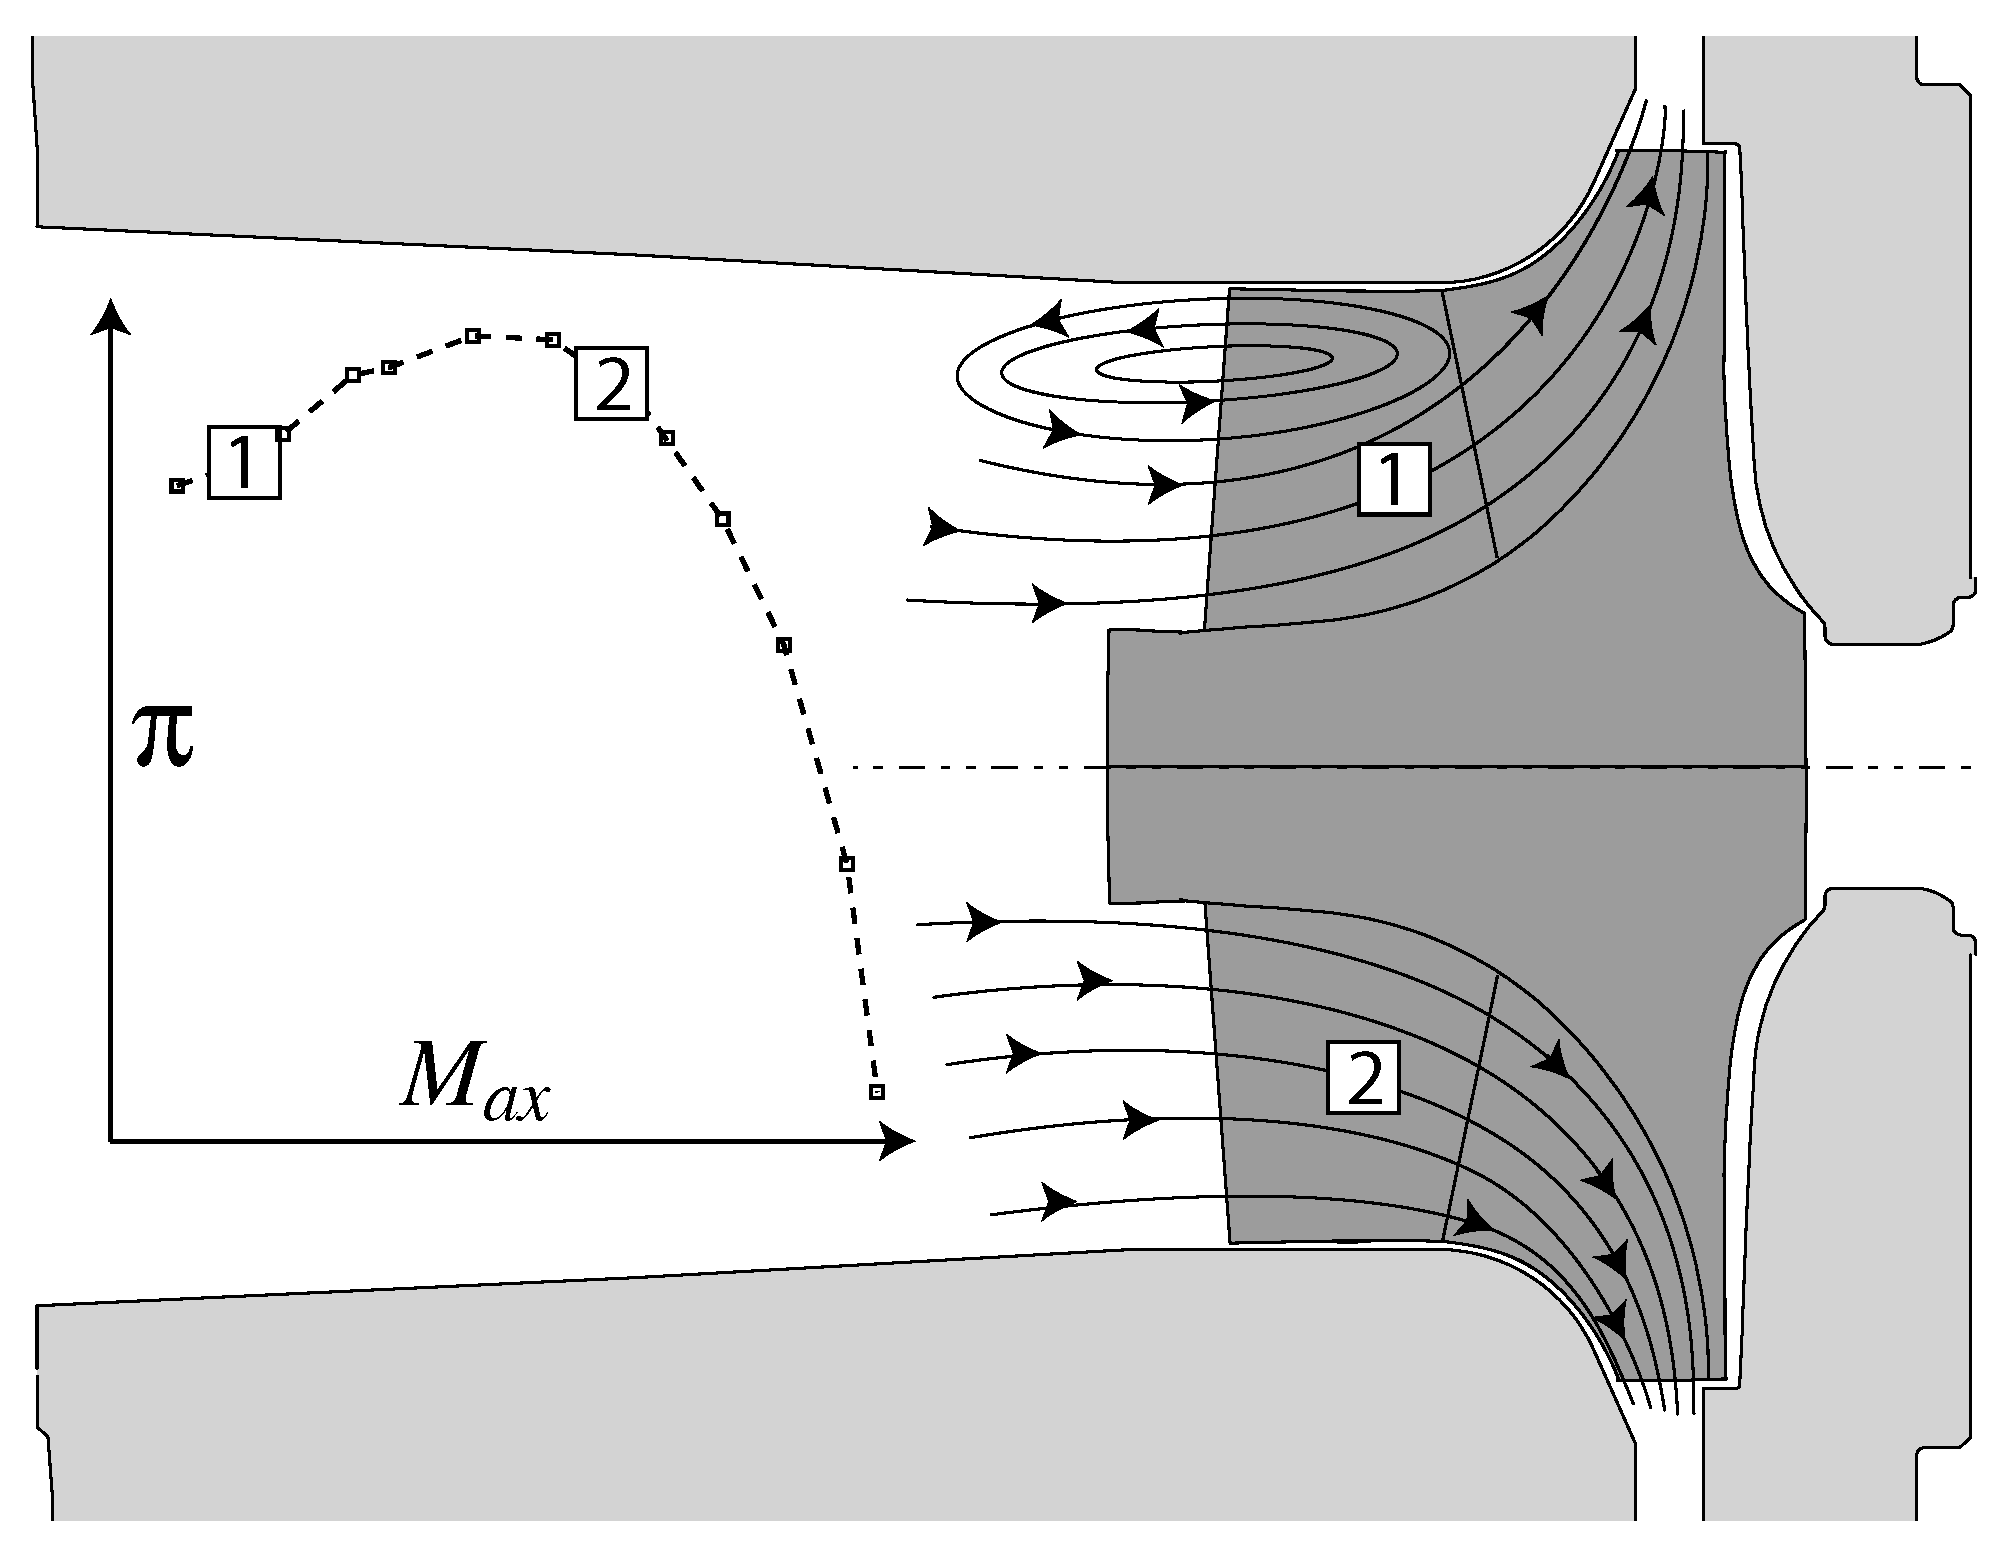
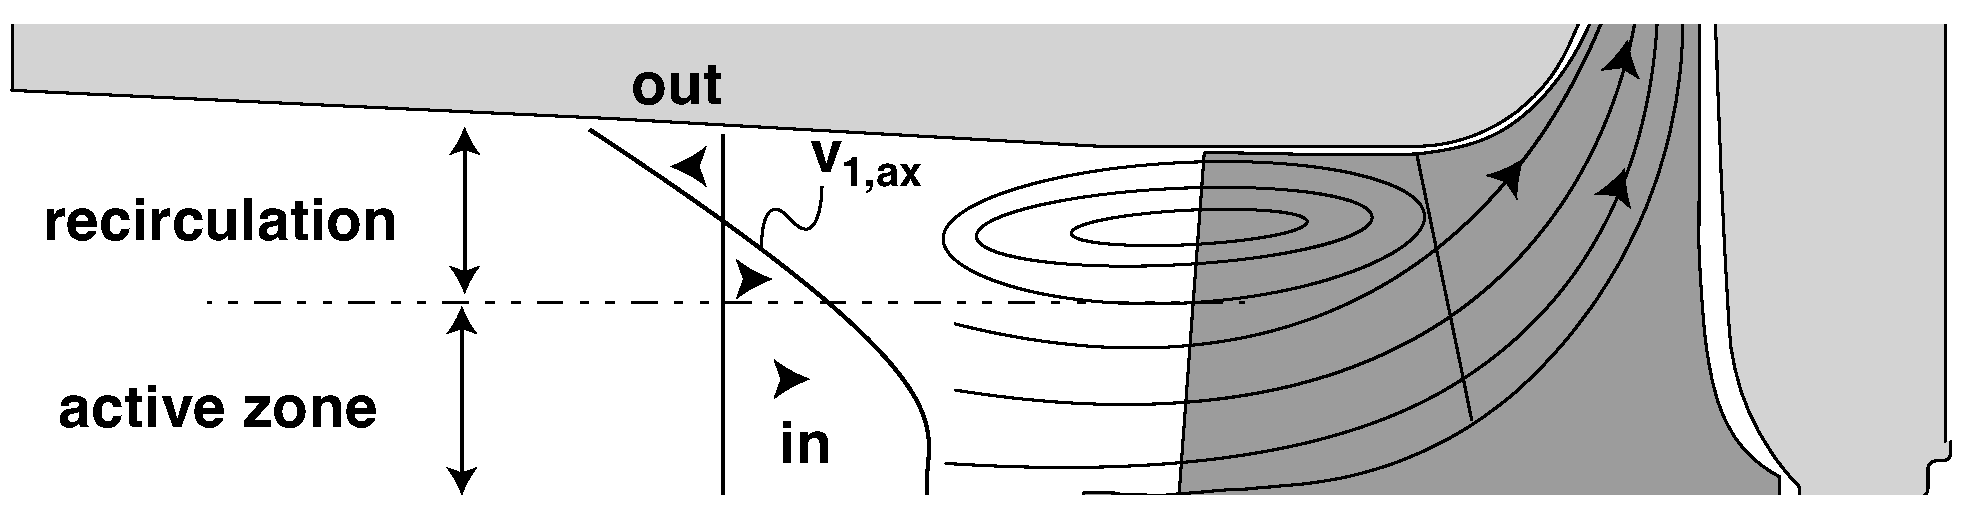
In
Figure 2, the recirculation is visualized schematically. The physical effect of inducer recirculation is a blockage of inducer area, loss generation and an energy transport from the impeller to the incoming flow. The result is a reduced meanline radius, an increased absolute velocity and an increased total temperature at the impeller inlet. Loss generation leads to a decreased total efficiency; the changes in meanline radius and absolute velocity contribute to an alteration of work input coefficient. Both result in a reduced compressor pressure ratio.
1.2. Casing Treatment Design for Centrifugal Compressors
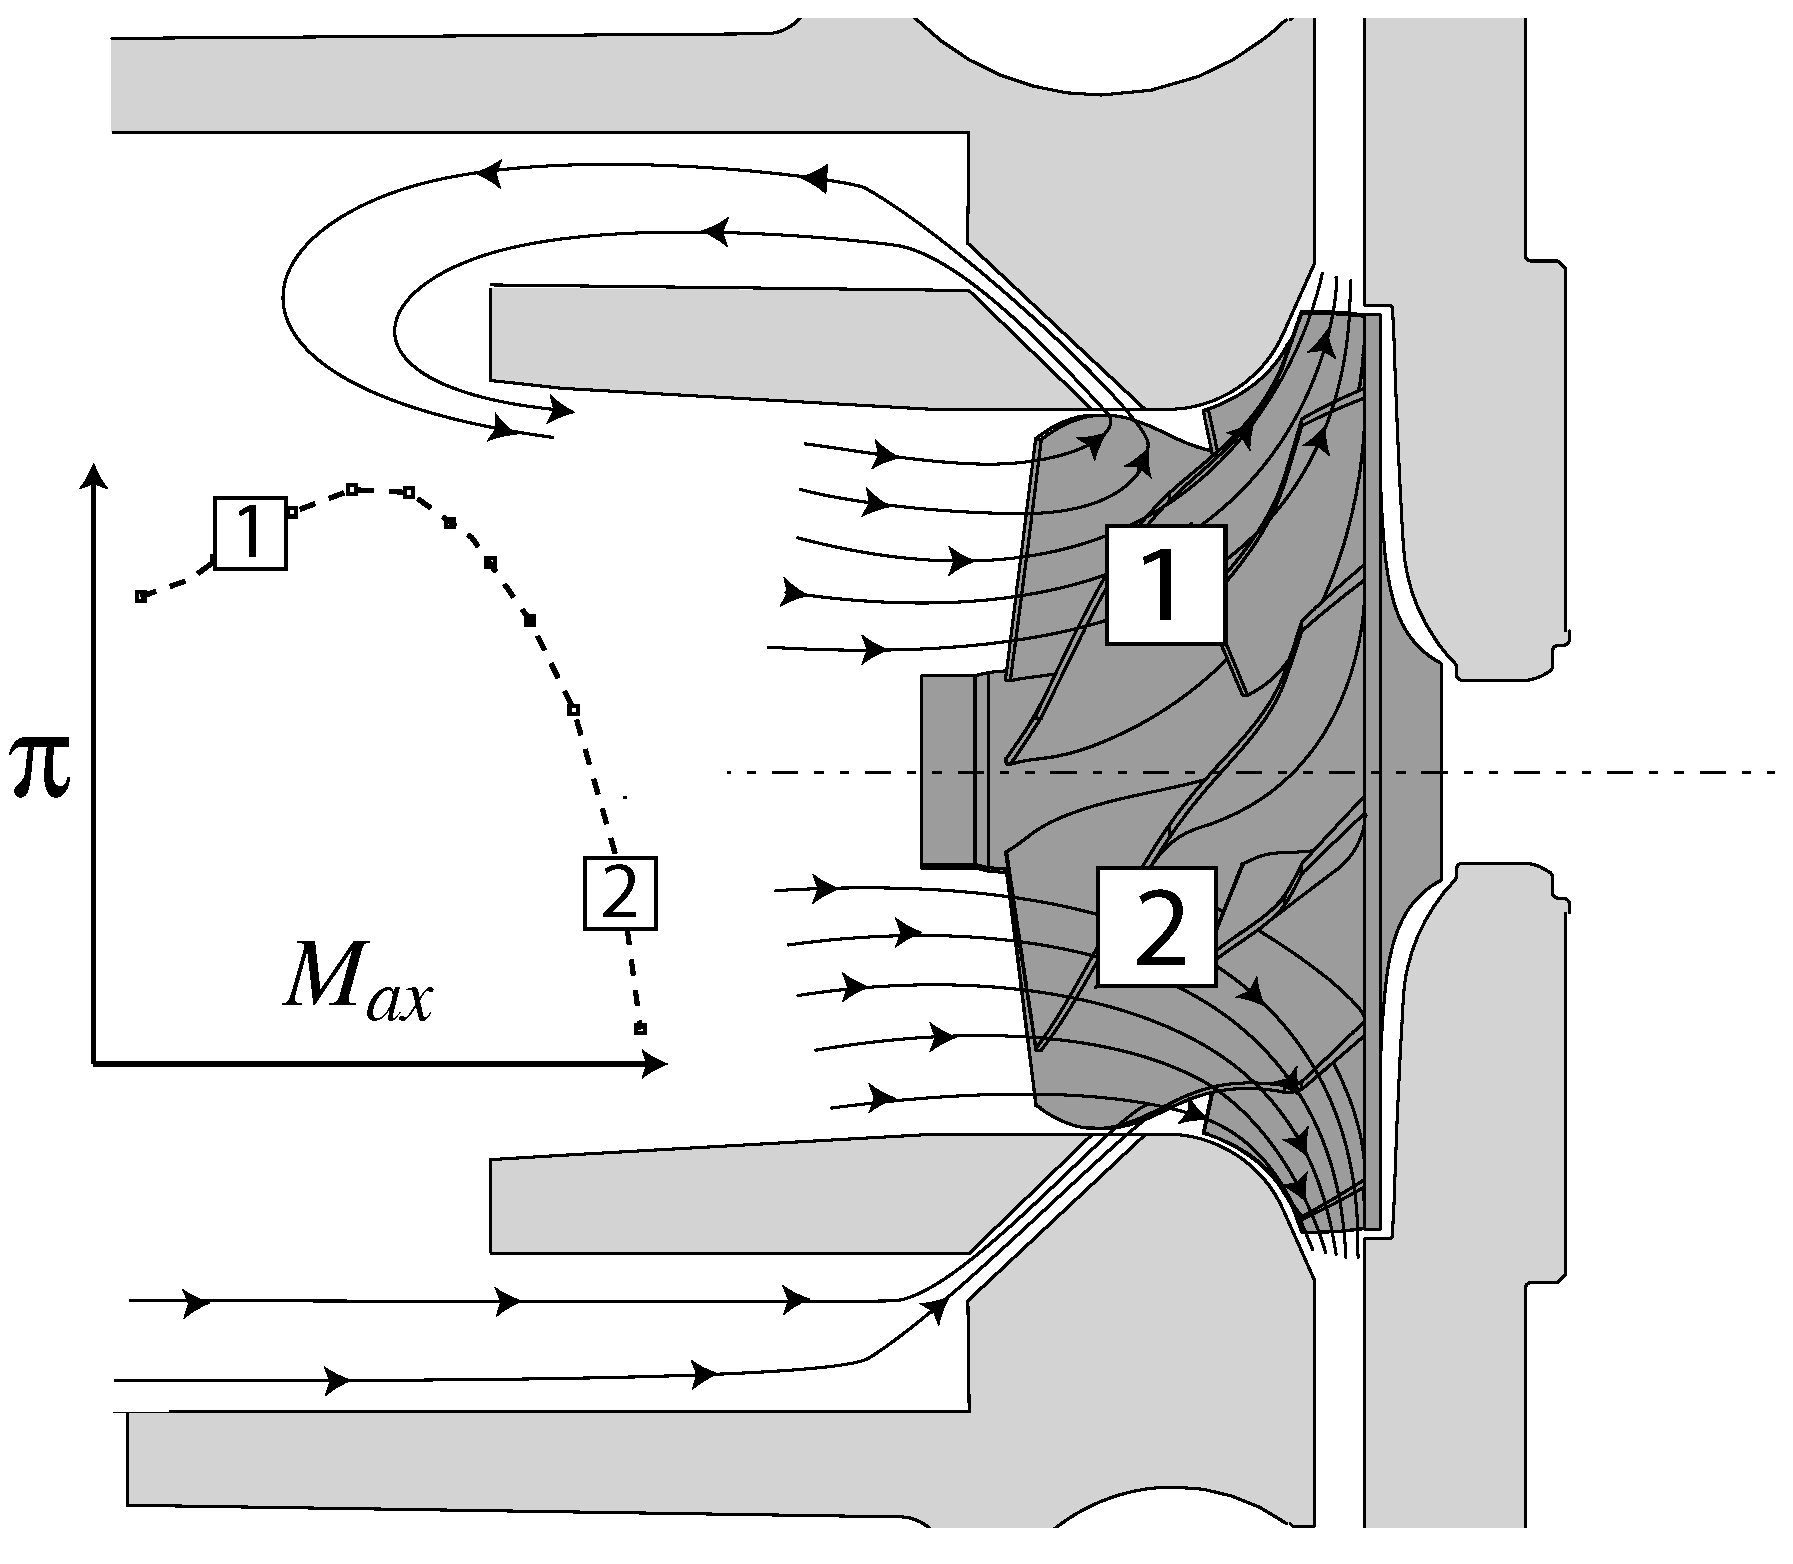
In automotive applications, it is common to use an inducer recirculation bypass. The working principle and the configuration used in this study are visualized in
Figure 3. For highly throttled operating points, flow is sucked into the bypass and injected in front of the impeller. Therewith, it is possible to manipulate the flow conditions at the blade tip region in the inducer. This leads to a reduced blockage and an aerodynamic stabilization of the compressor for low mass flow rates. Compressor pressure ratio is increased. On the other hand, friction losses in the bypass will lead to a reduced efficiency with this design.
For low throttling operating points and high rotational speeds, i.e., when the impeller is choked, static pressure at the inducer shroud is lower than at the inlet of the compressor. This effect is due to flow acceleration from the inducer to the smallest aerodynamic cross section in the impeller. At operating points close to choke, this results in an increase of dynamic pressure while simultaneously decreasing the static pressure. According to Japikse [
8], the inducer can be modeled with a two elements in series (TEIS) model. The model assumes an impeller passage to consist of two succeeding elements. The first element, the inlet portion of the blade channel, may have either nozzle or diffuser characteristics, depending on the incoming flow rate. The second element, the portion between throat and exit, is most often a diffuser independent of the flow rate. The static pressure difference at the shroud induces airflow. Air is sucked into the bypass in front of the impeller and injected to the rotor shroud. This can increase the choke mass flow rate. Both effects increase the operating range for low as well as for high mass flow rates.
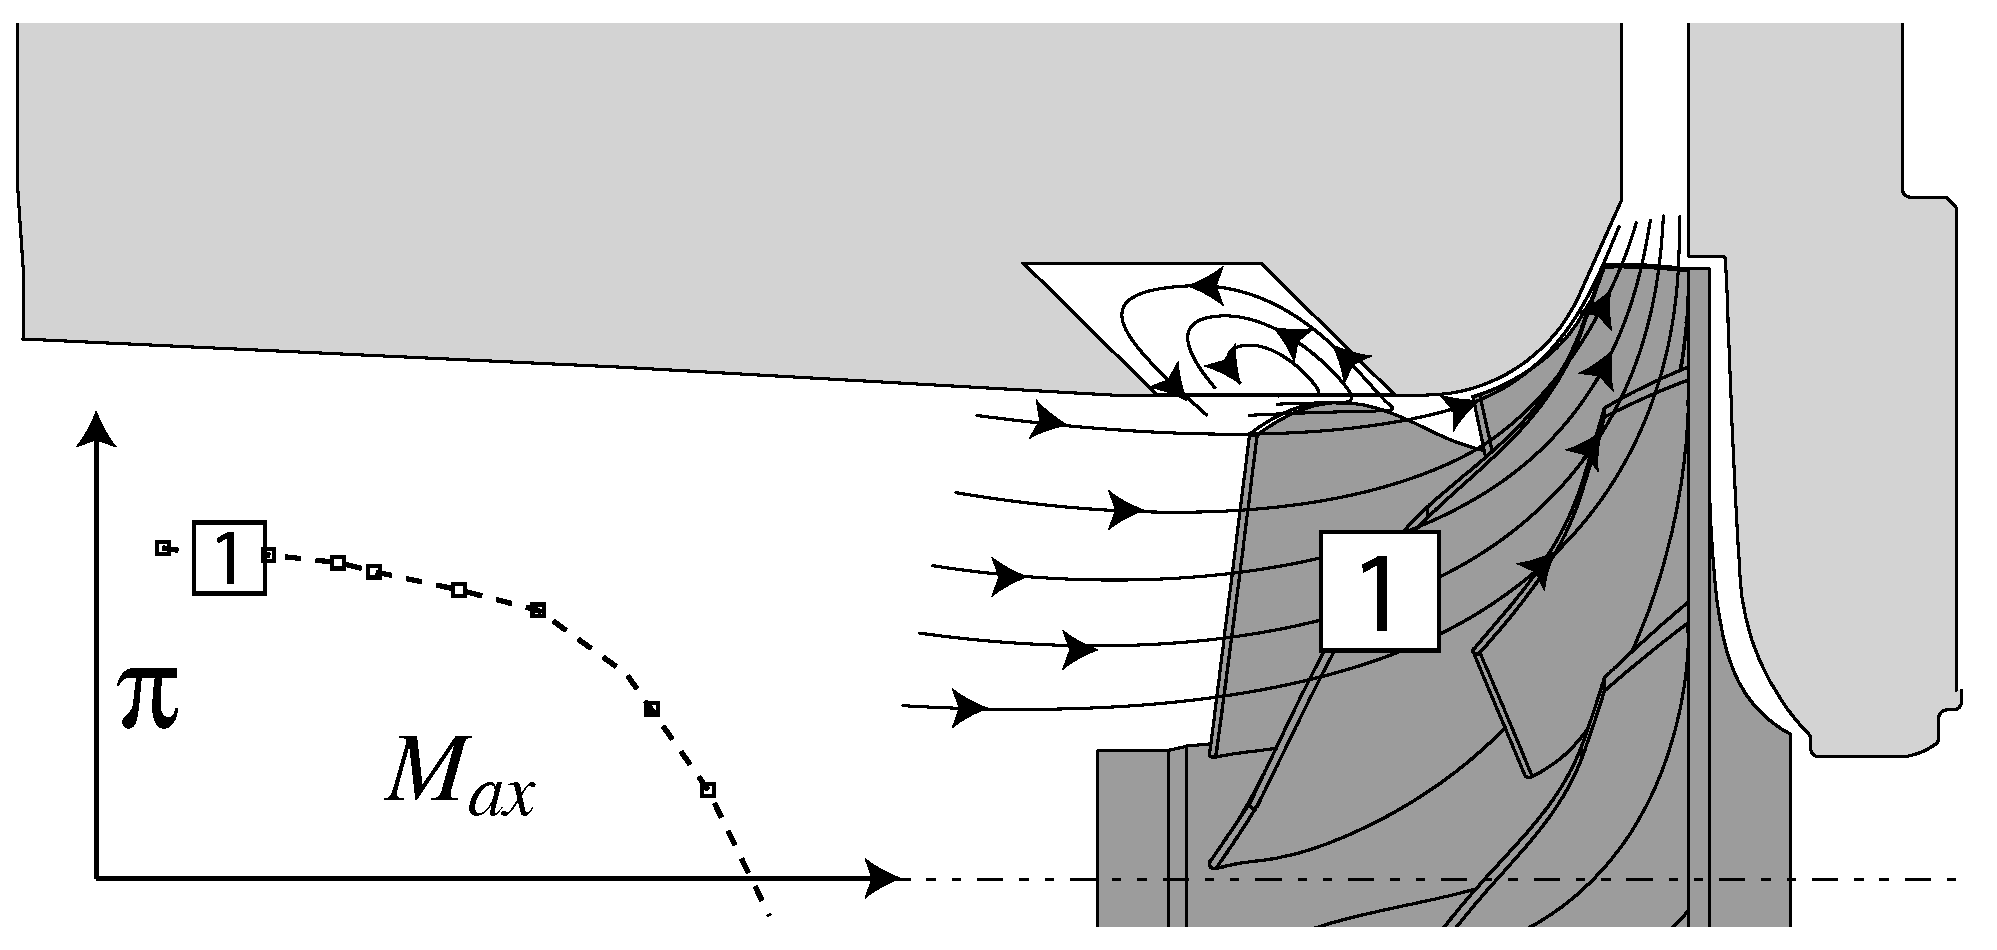
In
Figure 4, the developed CT with axial grooves is schematically visualized. This CT is adapted from high-pressure axial compressor investigations and is designed to only influence the flow in the upper 20% of the inducer tip region for highly throttled operating points. The CT consists of separated axial grooves, circumferentially inclined against the rotational direction of the impeller. The number of circumferential distributed grooves are a multiple of blade count and they are placed at the inlet region of the inducer. The grooves are designed to guide recirculating air with minimum losses. Fluid from the recirculating zone is extracted and deflected. Upstream of the blade tip, the flow is injected with positive axial momentum and counter rotating swirl. Periodic charging and discharging of the groove are induced by the pressure difference between pressure and suction side of the passing blades. The injected air at the suction side induces a short-time positive axial momentum and influences incidence angle, boundary layer development and tip leakage flow trajectory. Therewith, a reduction of blockage and a massive change in incidence angle at the impeller inlet is achieved. With this CT design, an increase of pressure ratio at low mass flow rates and a stabilization of the compressor, i.e., a delay of surge, can be achieved. The CT design was adapted for centrifugal compressors and the development for axial compressors was described by Wilke and Kau [
9] and Hembera et al. [
10]. The CT performs best with similar design parameters as those described for axial compressors. It is scaled to fit in the smaller centrifugal inducer of a turbocharger. The CT is placed above rotor tip in the inducer with an extent upstream to inject the flow in front of the blade tip. The casing treatment has an axial overlapping with the blade tip of 50%. A passage is covered by 6.3 axial grooves with an inclination angle of 45°. The number and inclination angle are analog to CT designs for axial compressors.
2. Numerical Modeling
The extent of recirculation in the inducer and its impacts for different configurations were investigated with steady state compressor map simulations. In addition, the working principle of the developed CT was analyzed with unsteady CFD.
2.1. Steady RANS
To provide the best possible comparison of experimental and numerical results while keeping the computational cost affordable, steady RANS simulations were carried out in a full 360° domain. The interfaces between stationary and rotating parts were realized as frozen rotor interfaces where the interfaces at impeller inlet and exit were placed a few millimeters up- and downstream of the blade edges, respectively. Inlet, impeller and the diffuser were meshed using
ANSYS turbo grid and the volute was meshed with
ANSYS meshing. The turbulent boundary layer was modeled with automatic adapting wall functions with blending functions in according to
ANSYS guid lines. The
wall resolution was 1–20. In between two blades, a minimum number of 40 pitchwise elements were used and 41 elements were included to resolve the blade spanwise. An additional 12 elements in radial direction resolved the blade tip gap. Mesh size and quality differed by a small amount for the investigated impellers but an overview of the minimum quality parameters and mesh sizes are given in
Table 1. While the minimum skewness angle at inlet, impeller and diffuser were not below 20° the minimum angle in the volute was 9°, but less than 1% of all cells were between 9° and 20°.
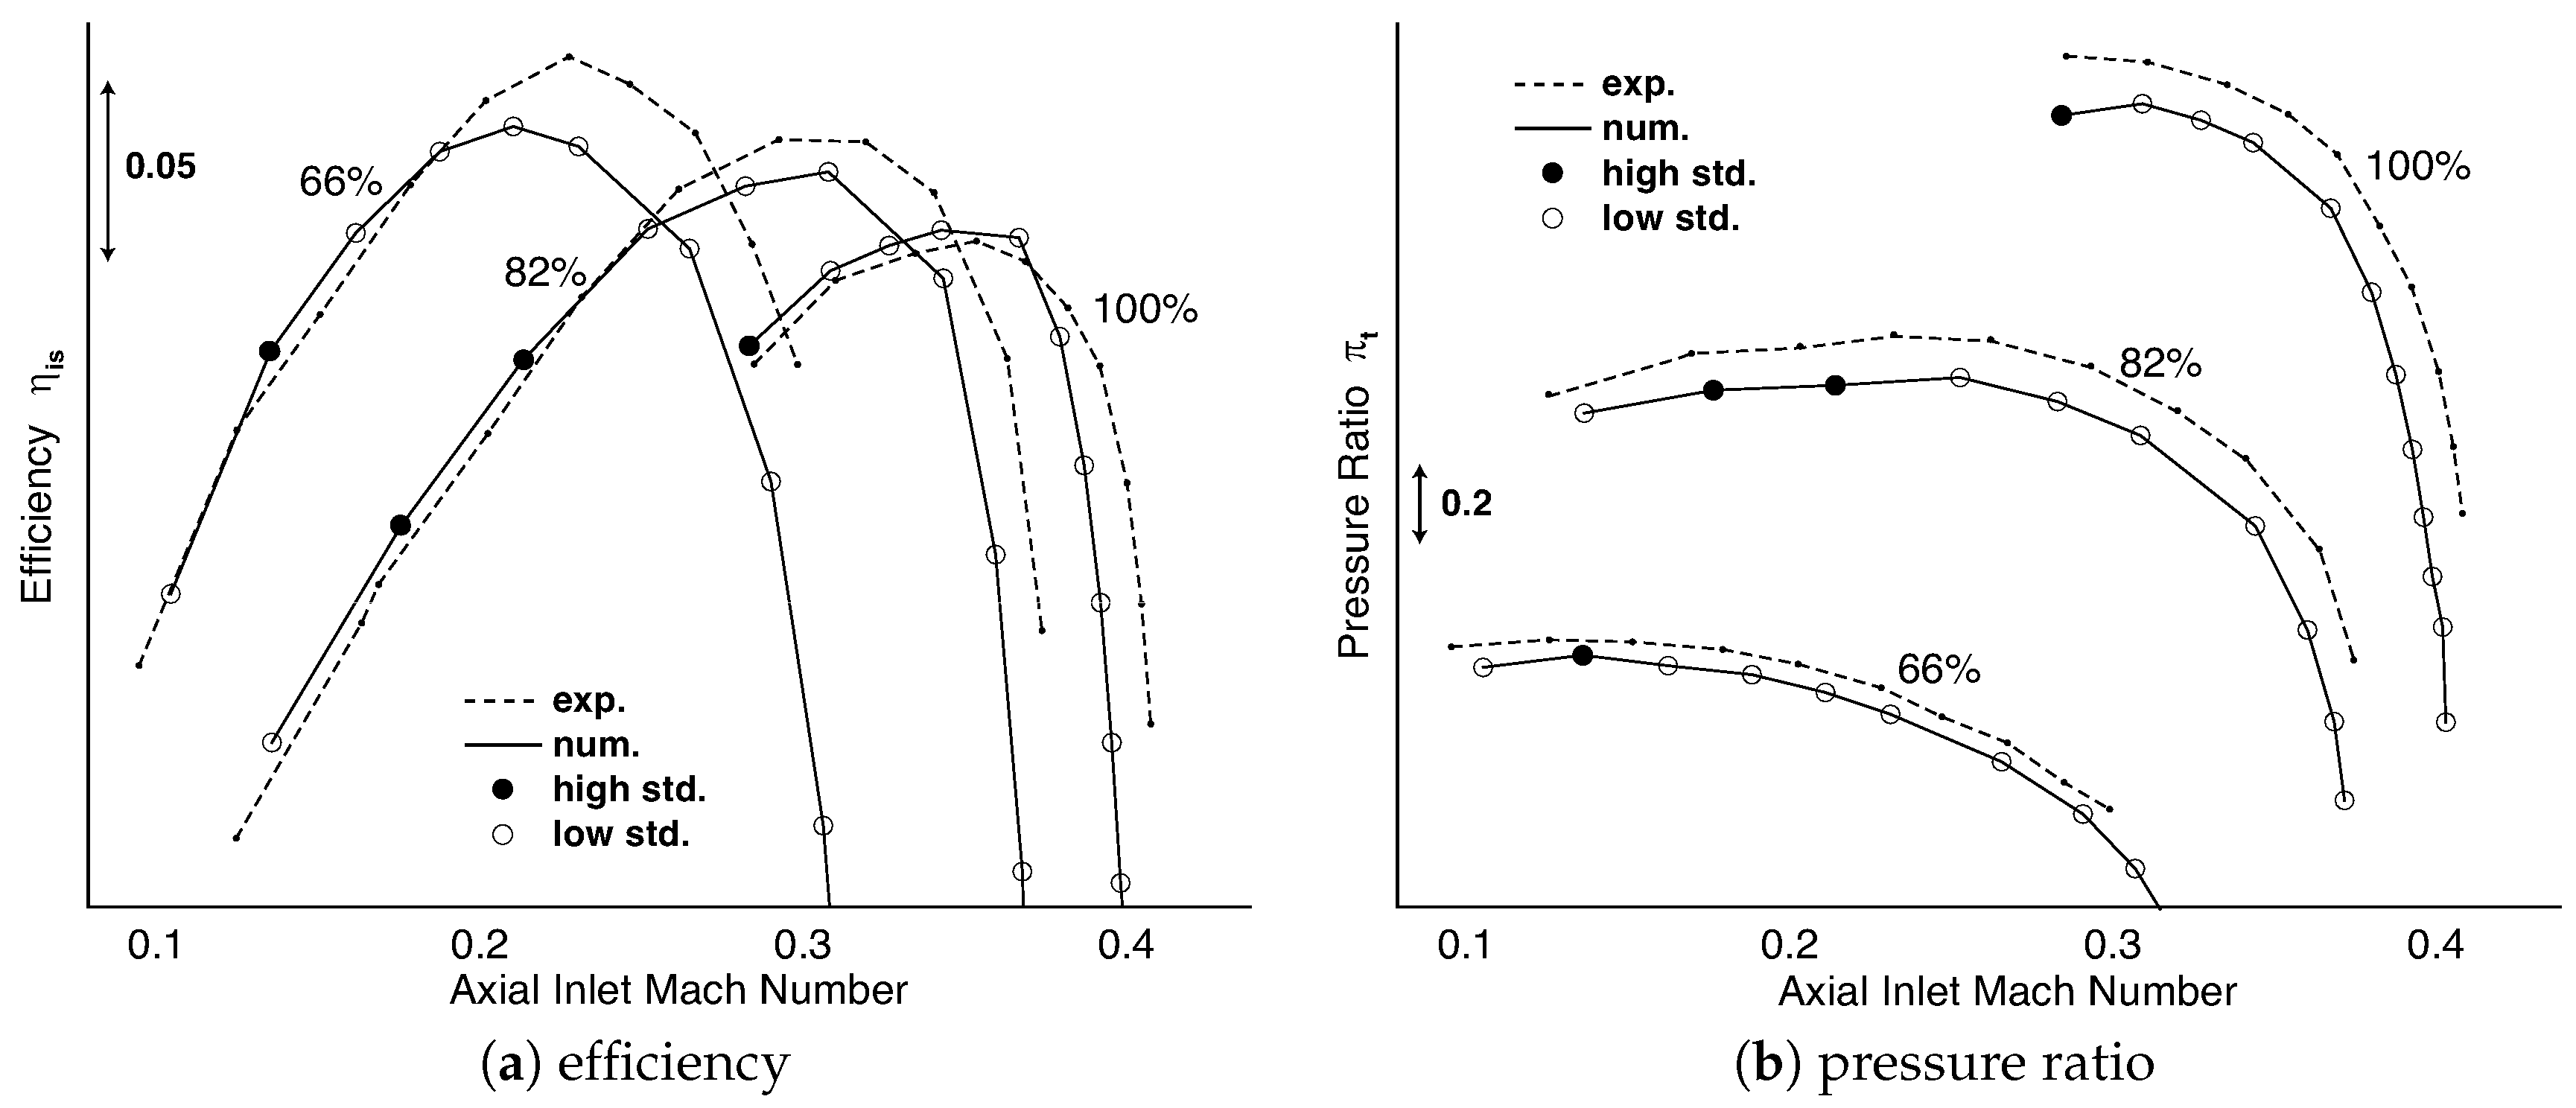
A grid independence study was performed for C1 at 82% rotational speed and at peak efficiency. According to Celik and Karatekin [
11], a grid convergence index was calculated. For total pressure ratio and efficiency, this GCI is smaller than 1%. Nevertheless,
Figure 5a,b indicates that the complete compressor map is shifted to lower pressure ratio and mass flow rates in comparison with experimental data. This might be due to an overestimation of blockage and tip gap sensitivity studies normally show a shift in pressure ratio and mass flow rate in this range. Therefore, one possible reason might be a smaller tip gap in the experiment, which is unfortunately very difficult to measure exactly during operation in such small machines. In addition, the back side of the impeller is not included in the numerical domain. Losses in that region scale with rotational speed, which leads to an overestimation of efficiency, especially for high rotational speed.
All simulations were carried out using ANSYS CFX Version 15. Calorically perfect gas was used to describe the fluid and a constant dynamic viscosity was assumed. The total energy model was applied to account for heat transfer throughout the flow. This is the standard model for flows with high Mach number and turbulent effects. The viscous work term in the total energy equation was not neglected in order to consider the influence of internal heating due to viscous friction. The turbulence was modeled via the SST turbulence model. SST reattachment modification and curvature correction were enabled. All walls were regarded as adiabatic with a no slip condition and no wall roughness. Total pressure was used at the inlet and close to choke operation static pressure was used at the outlet boundary condition. At peak efficiency and close to surge mass flow conditions were applied.
Convergence was monitored online. Besides residual monitoring (threshold is ), the results of 30 iterations were averaged and a standard deviation was computed. If the standard deviations of pressure ratio and efficiency fell below and mass fluctuates by less than [kg/s], the simulation was stopped immediately and treated as fully converged. Otherwise, a simulation was stopped after 200 iterations, because no convergence progress was expected. In those cases, flow instabilities led to fluctuations during the iteration process. Therefore, simulation results were averaged over several fluctuation periods during iteration process and only averaged solutions were evaluated. Those points had a standard deviation between and . To highlight these averaged results, they are marked in the corresponding figures.
Figure 5a,b provides a comparison of experimental and numerical results achieved. It is obvious that deviations exist and a variety of explanations could be listed (i.e., heat transfer in experiments, inaccurate modeling of friction/secondary flow structures in the CFD, unsteady effects, interaction of volute and impeller, inaccurate modeling of the impeller gap, etc.). Regardless of these deviations, it is reasonable to state that the trends in the compressor map are consistent and captured well. The CFD was only used to analyze the effect of the recirculating zone. The absolute effect might be overestimated due to the observed differences between simulation and experiment, but the trend was captured and used for analytic explanations.
2.2. Unsteady RANS
Since the CT under investigation consists of axial grooves and the working principle is mainly driven by an unsteady charge and discharge of the CT-volume, unsteady RANS was needed to simulate this design.
To limit computational cost, these unsteady RANS simulations were carried out without volute and as single passage simulations with periodic boundary conditions. The dimensions of adjacent domains (i.e., inlet and diffuser) were adapted as in the steady state setups. The connections between the stationary and rotating parts were realized as transient rotor–stator interfaces. The mesh resolution of the shroud and the inlet of the CT was similar and sliding mesh approach was used for the transient simulations. Cases with and without CT were simulated to have a direct comparison of these cases.
A second-order backward Euler scheme was used for time discretization. A small study was performed to identify the dependency of the global result on time step size. Therefore, three step sizes corresponding to an impeller rotation of 6°, 3° and 1.5° were used. The difference between those three was below 1% in efficiency and lower than 0.05 in pressure ratio. Based on these results, a time step was specified corresponding to a rotation of 3°.
A minimum of 50 impeller revolutions (120 time steps per revolution) was simulated until periodic behavior of mass, energy and momentum was achieved. Afterwards, 12 additional revolutions were simulated and averaged for post processing.
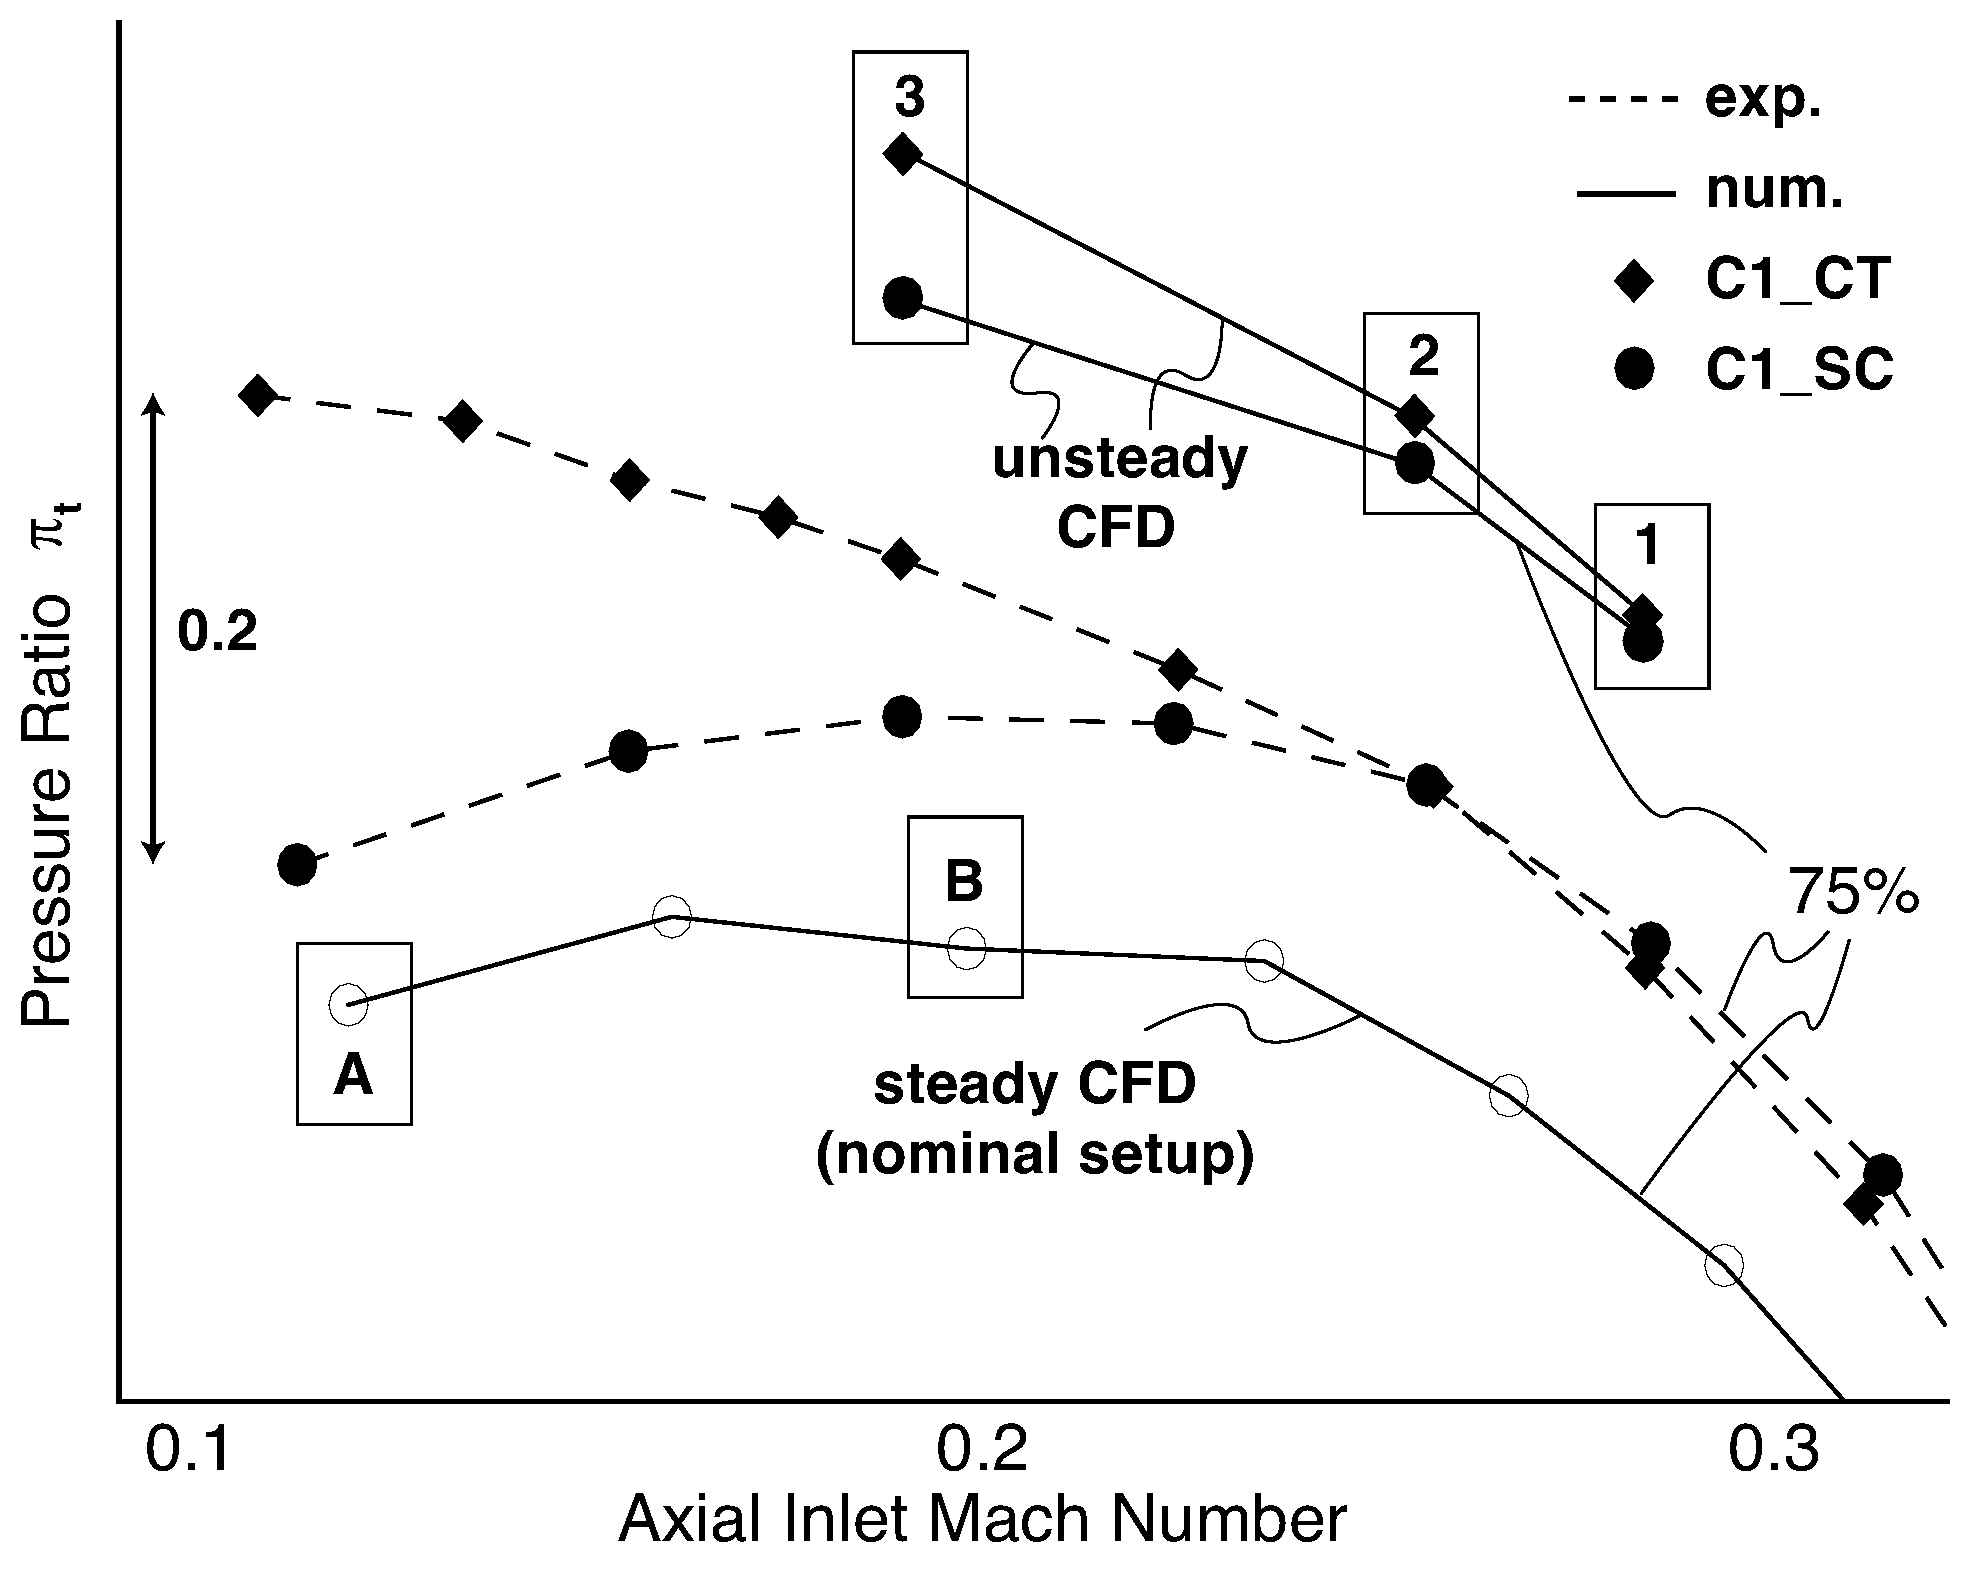
In
Figure 6, the outcome of the averaged unsteady RANS is shown in comparison to experimental data and steady state simulations. Pressure ratio of the unsteady simulations is higher, which can be explained by the absence of volute and corresponding losses. This trend was also noticed for other speed lines. The spread in pressure ratio between CT and smooth casing (SC) results esd well captured in comparison to experimental data. Therefore, these data were later used to explain the incidence situation for the rotor with and without CT. Steady state results with SC were used to show the work potential of the impeller and the impact of the recirculation zone.
3. Experimental Setup
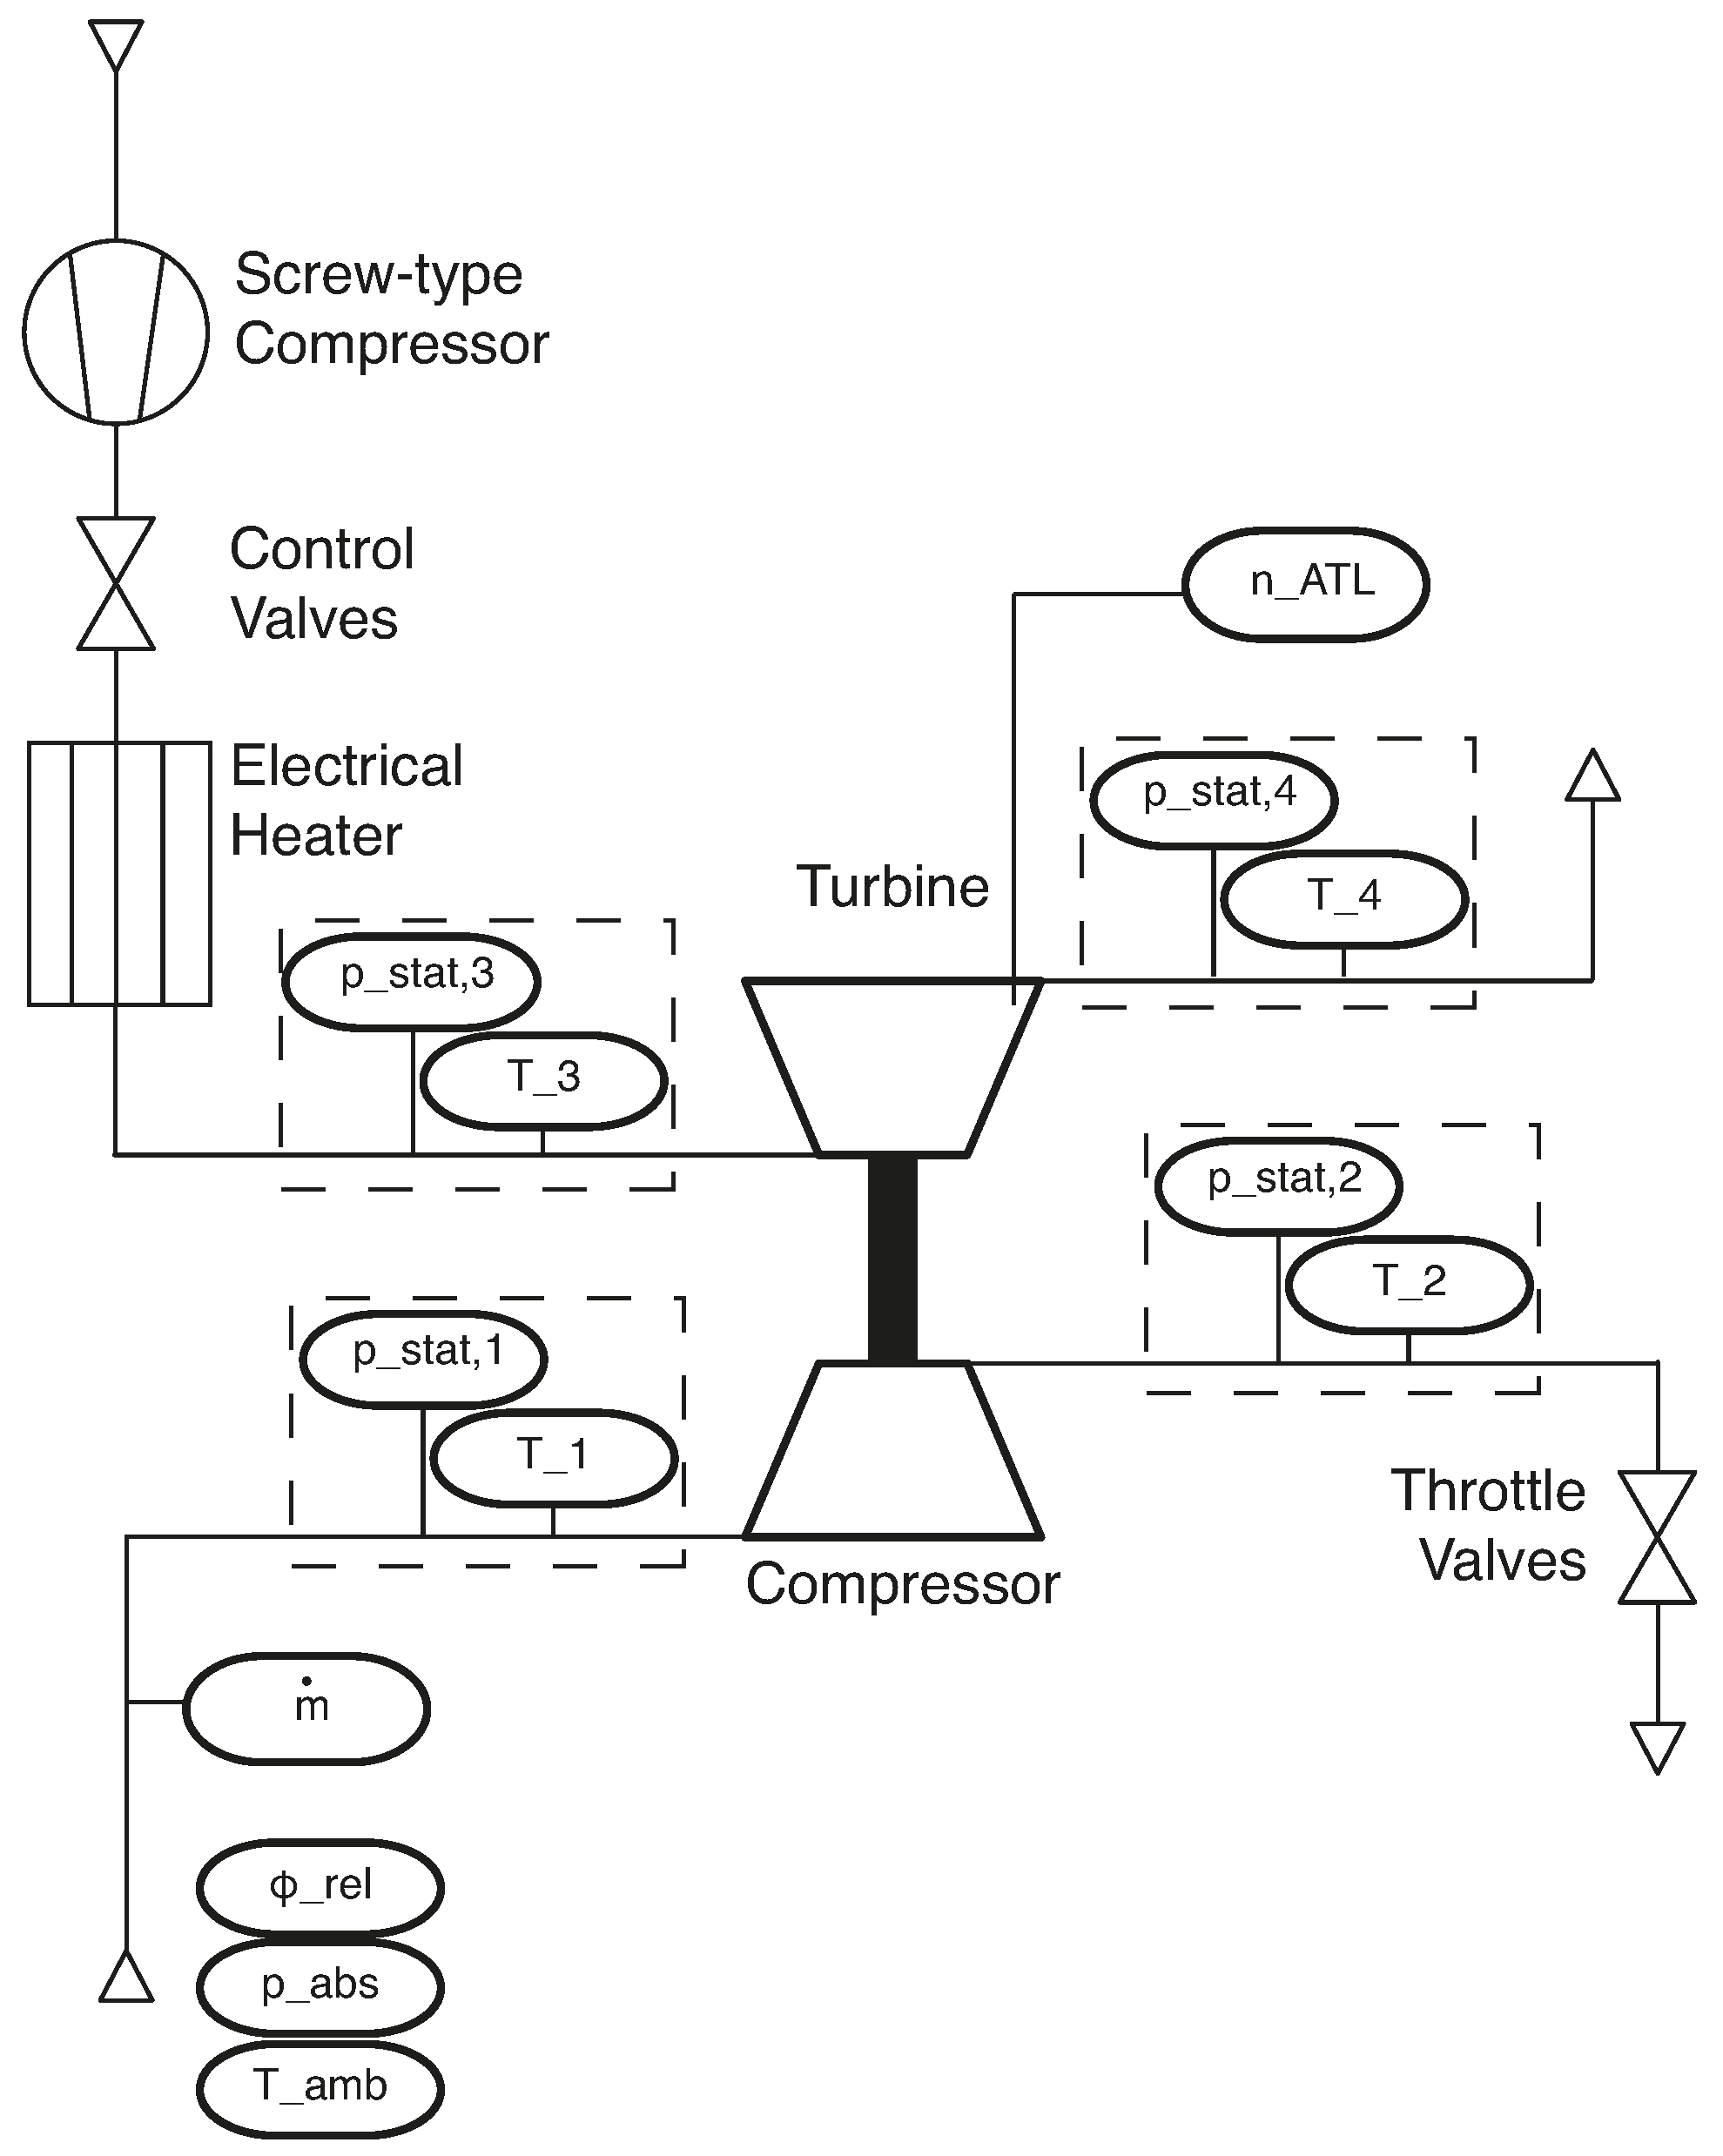
The turbo charger laboratory at TU Darmstadt is an open loop hot gas test rig. Turbine and compressor are aerodynamically decoupled and the turbine is driven by pressurized air, driven by a screw compressor, which delivers up to 0.3 kg/s mass flow rate at a maximum pressure of 4.5 bar. Additional enthalpy rise is provided by an electrical heater, ensuring a constant turbine inlet temperature of 573 K. Temperature and pressure measurements in front and behind the compressor are according to SAE J1826 [
12]. For total temperature measurements, three thermocouples type K are inserted per measurement plane and static pressure is determined with four circumferentially distributed holes (hole diameter d = 0.5 mm). The static pressure holes are connected to a high accuracy relative pressure sensor. An inductive sensor is used at the turbine wheel to measure the turbocharger speed. Therefore, the compressor flow near shroud is not influenced by invasive speed measurement techniques. The mass flow rate is measured upstream of the compressor via measuring orifices, which are designed and calibrated for different measuring ranges in order to ensure low uncertainty. The maximum uncertainty of mass flow rate is 0.9% of the measured value. An overview of the test setup and the measurement planes and values are visualized in
Figure 7.
The maximum measurement uncertainty for total pressure ratio is 0.65% of the measured value and for efficiency is 0.8%. This is based on measurement uncertainties of sensors and data process change, but mainly originates from extensive systematic studies and continuous repeatability tests including assembly.
The test facility provides online monitoring of compressor performance and all measured values. To guarantee steady state conditions, standard deviations of values are computed and monitored. Inlet as well as test cell conditions are controlled. The most difficult and therefore most uncertain value to measure is the onset of surge. Various surge criteria are set for compressor inlet temperature, compressor speed and outlet pressure. Moreover, the acoustic behavior is monitored by the operator, who stops measuring when surge rumble or unstable operation is evident.
4. Impeller Work Potential
As already shown in
Figure 1, the applied casing treatment has two distinct impacts on compressor performance. On the one hand, it increases pressure ratio at low flow conditions and, on the other hand, it helps to expand operating range, especially for high pressure ratios. An analytic consideration of both phenomena is given in this section.
4.1. Operating Range
The implications of inducer recirculation were already shown by Krämmer and Rautenberg [
13] and according to their experimental results it is possible to operate impellers in regions with positive slope, i.e., in regions where pressure ratio is rising when flow rate is increased (compare
Figure 1 and
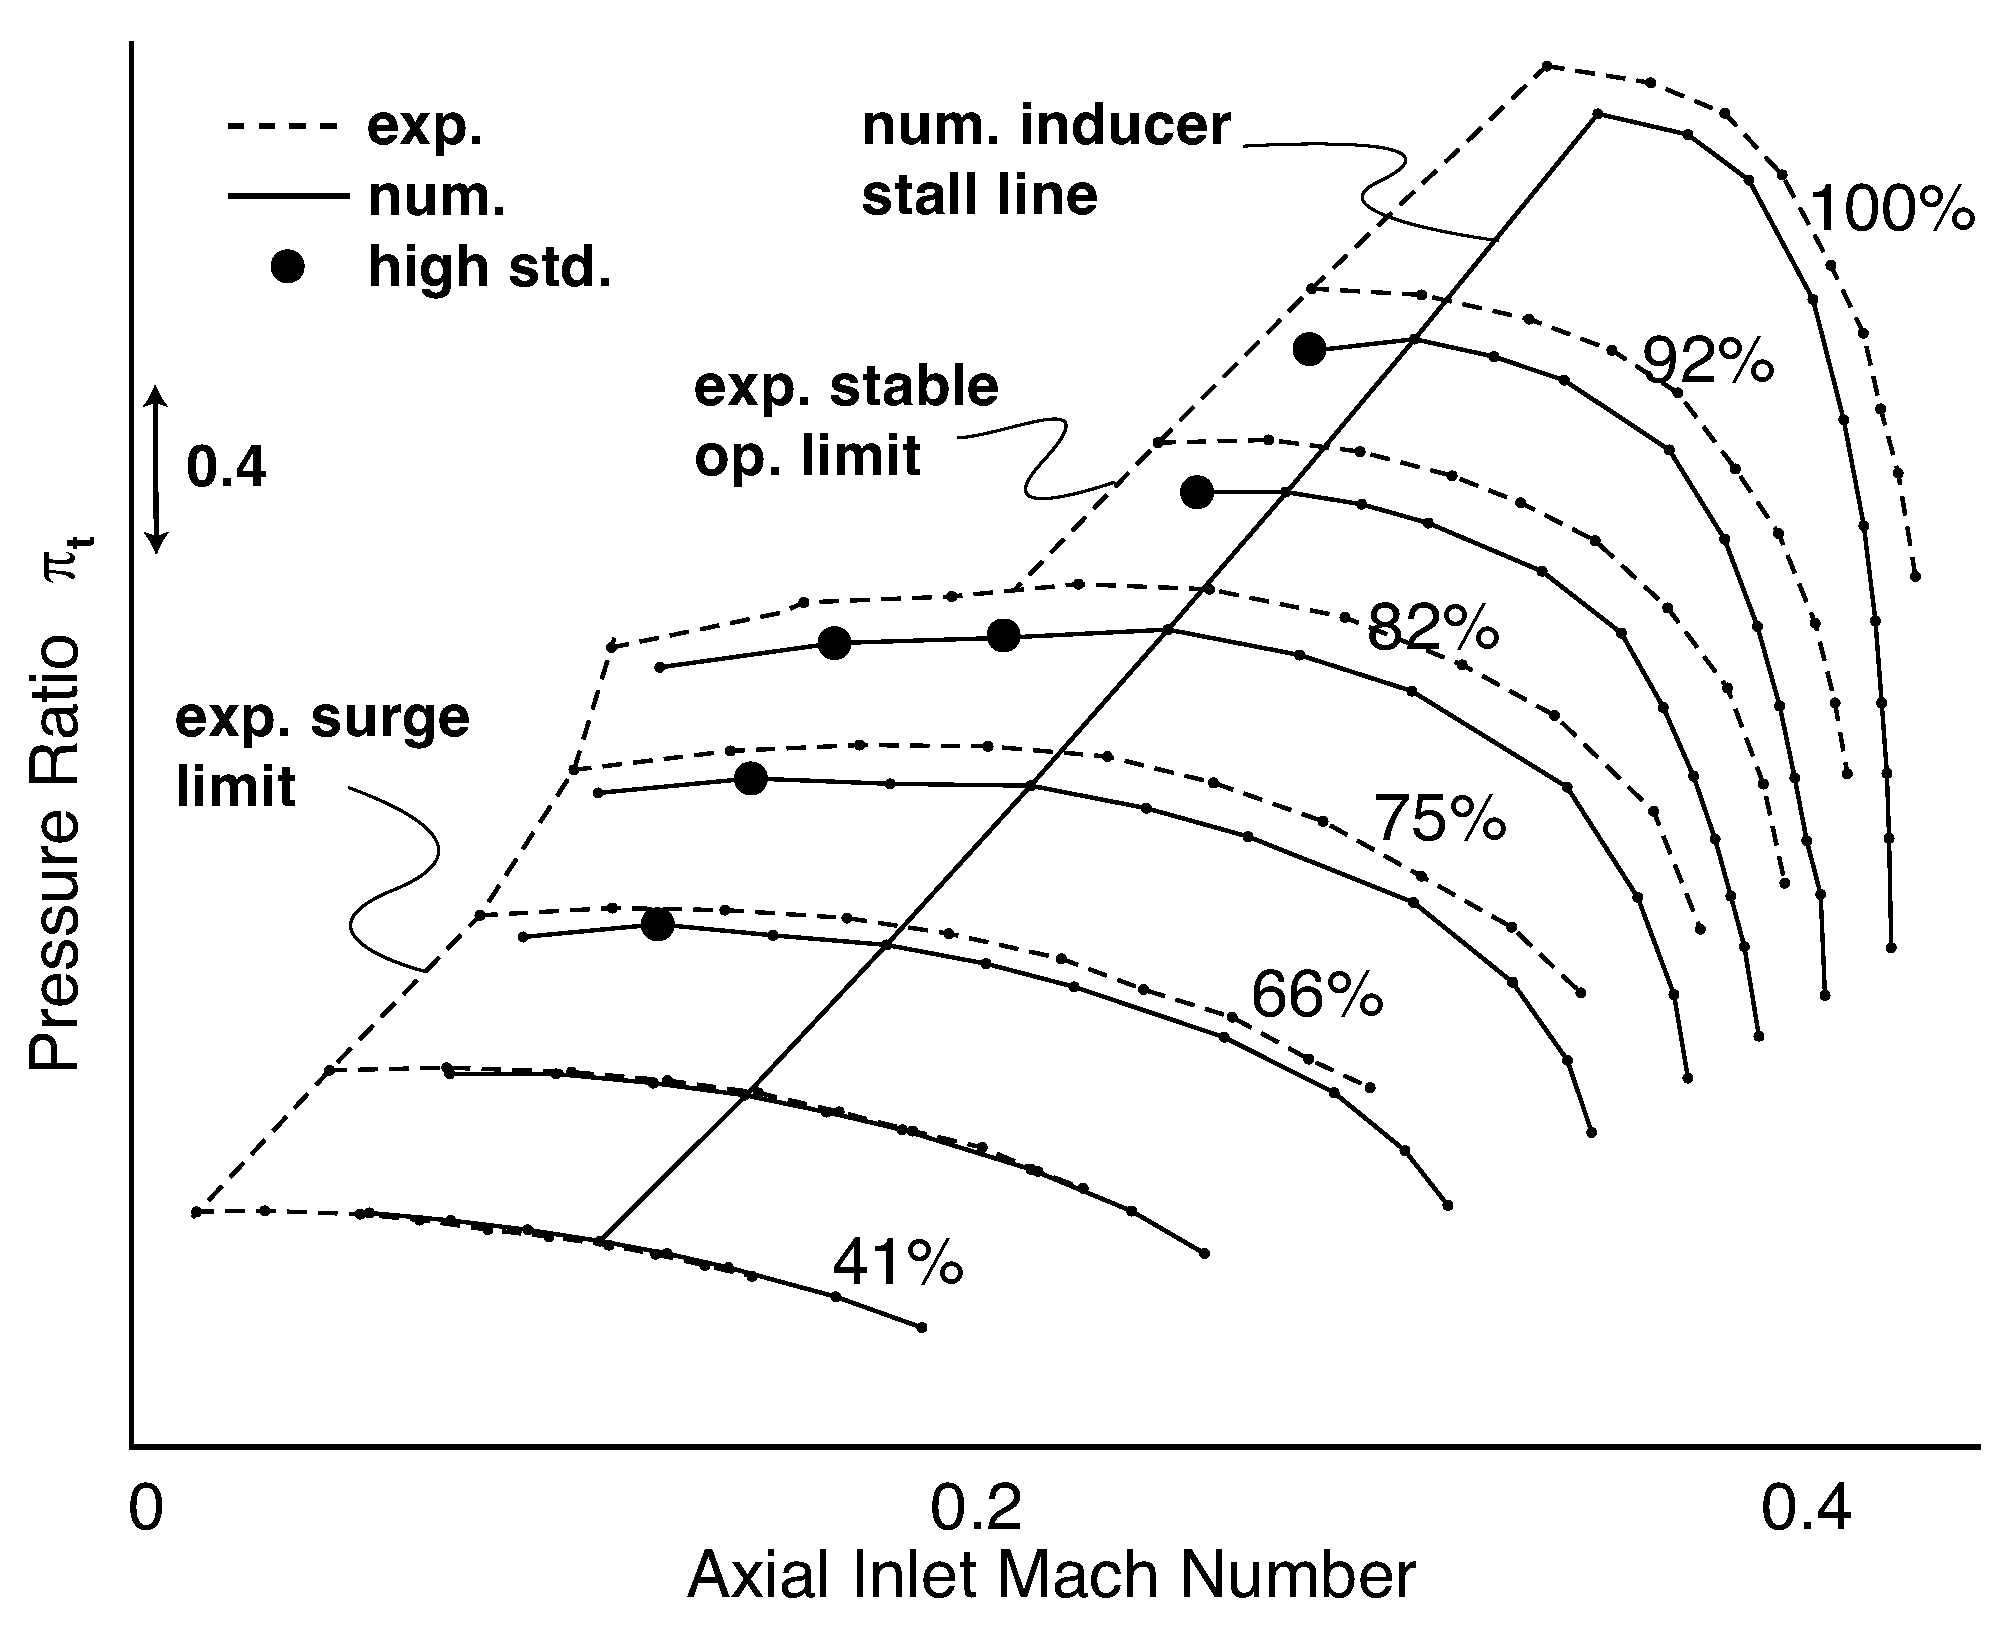
Figure 5b). While this is only possible at low pressure ratios, the stable operating range collapses for high rotational speeds. This behavior is design dependent, often reported and can be ascribed to inlet recirculation.
It is noticeable that, in the case of low pressure ratio, the compressor can be throttled until surge is occurring. A certain sign for compressor surge is considered to be a high fluctuating pressure ratio with a simultaneous increase in inlet temperature at measurement plane 1. If this is the case, it can be assumed that the flow behind the compressor is periodically discharging. Additionally, typical surge frequencies can be recorded. At high speed operation, no surge is detectable. Stall leads to high fluctuations and the compressor cannot be throttled further. For low speed operation, the compressor can be operated with rotating stall. In this case, surge is the phenomenon limiting compressor range.
The corresponding operating points were simulated with the described numerical setup and a comparable operating range could be achieved within simulations (see
Figure 5b and
Figure 8). The onset of inlet recirculation for those results were evaluated from simulations, as marked in
Figure 8. It can be concluded that the compressor is operating with a backflow region when mass flow is further reduced. This is consistent with the drop in efficiency for highly throttled low pressure operating points.
In the case of high pressure operating points, i.e., for high rotational speeds, it is not possible to throttle the compressor beyond this stall line. This is true for experiments and simulations. Fluctuations make it impossible to reach a steady state condition for those operating points in experiments and a converged solution cannot be reached. This might have several reasons, potentially infrastructure and design related, but it is evident that this behavior can be observed only for high pressure operation. Stall in the inducer already provokes high fluctuations and measurements must be stopped before the surge limit can be reached. Therefore, the limit of the compressor map at high speed is denominated with stable operating limit in contrast to the surge limit, experienced for low speed operation. Numerical results show that at the last stable operating point an inlet recirculation starts to form for all cases.
4.2. Pressure Ratio Potential
The impact of the recirculation zone and its size were further investigated with numerical results. Firstly, a blockage zone was defined as depicted in
Figure 9. It was assumed that the mass flow that enters the recirculation stays inside this zone and can be averaged around the circumference. Therefore, the recirculating mass flow was integrated from shroud to hub until outflow and inflow reached equilibrium. The rest of the span was considered as the active flow area. This procedure is similar to the one presented by Harley [
7].
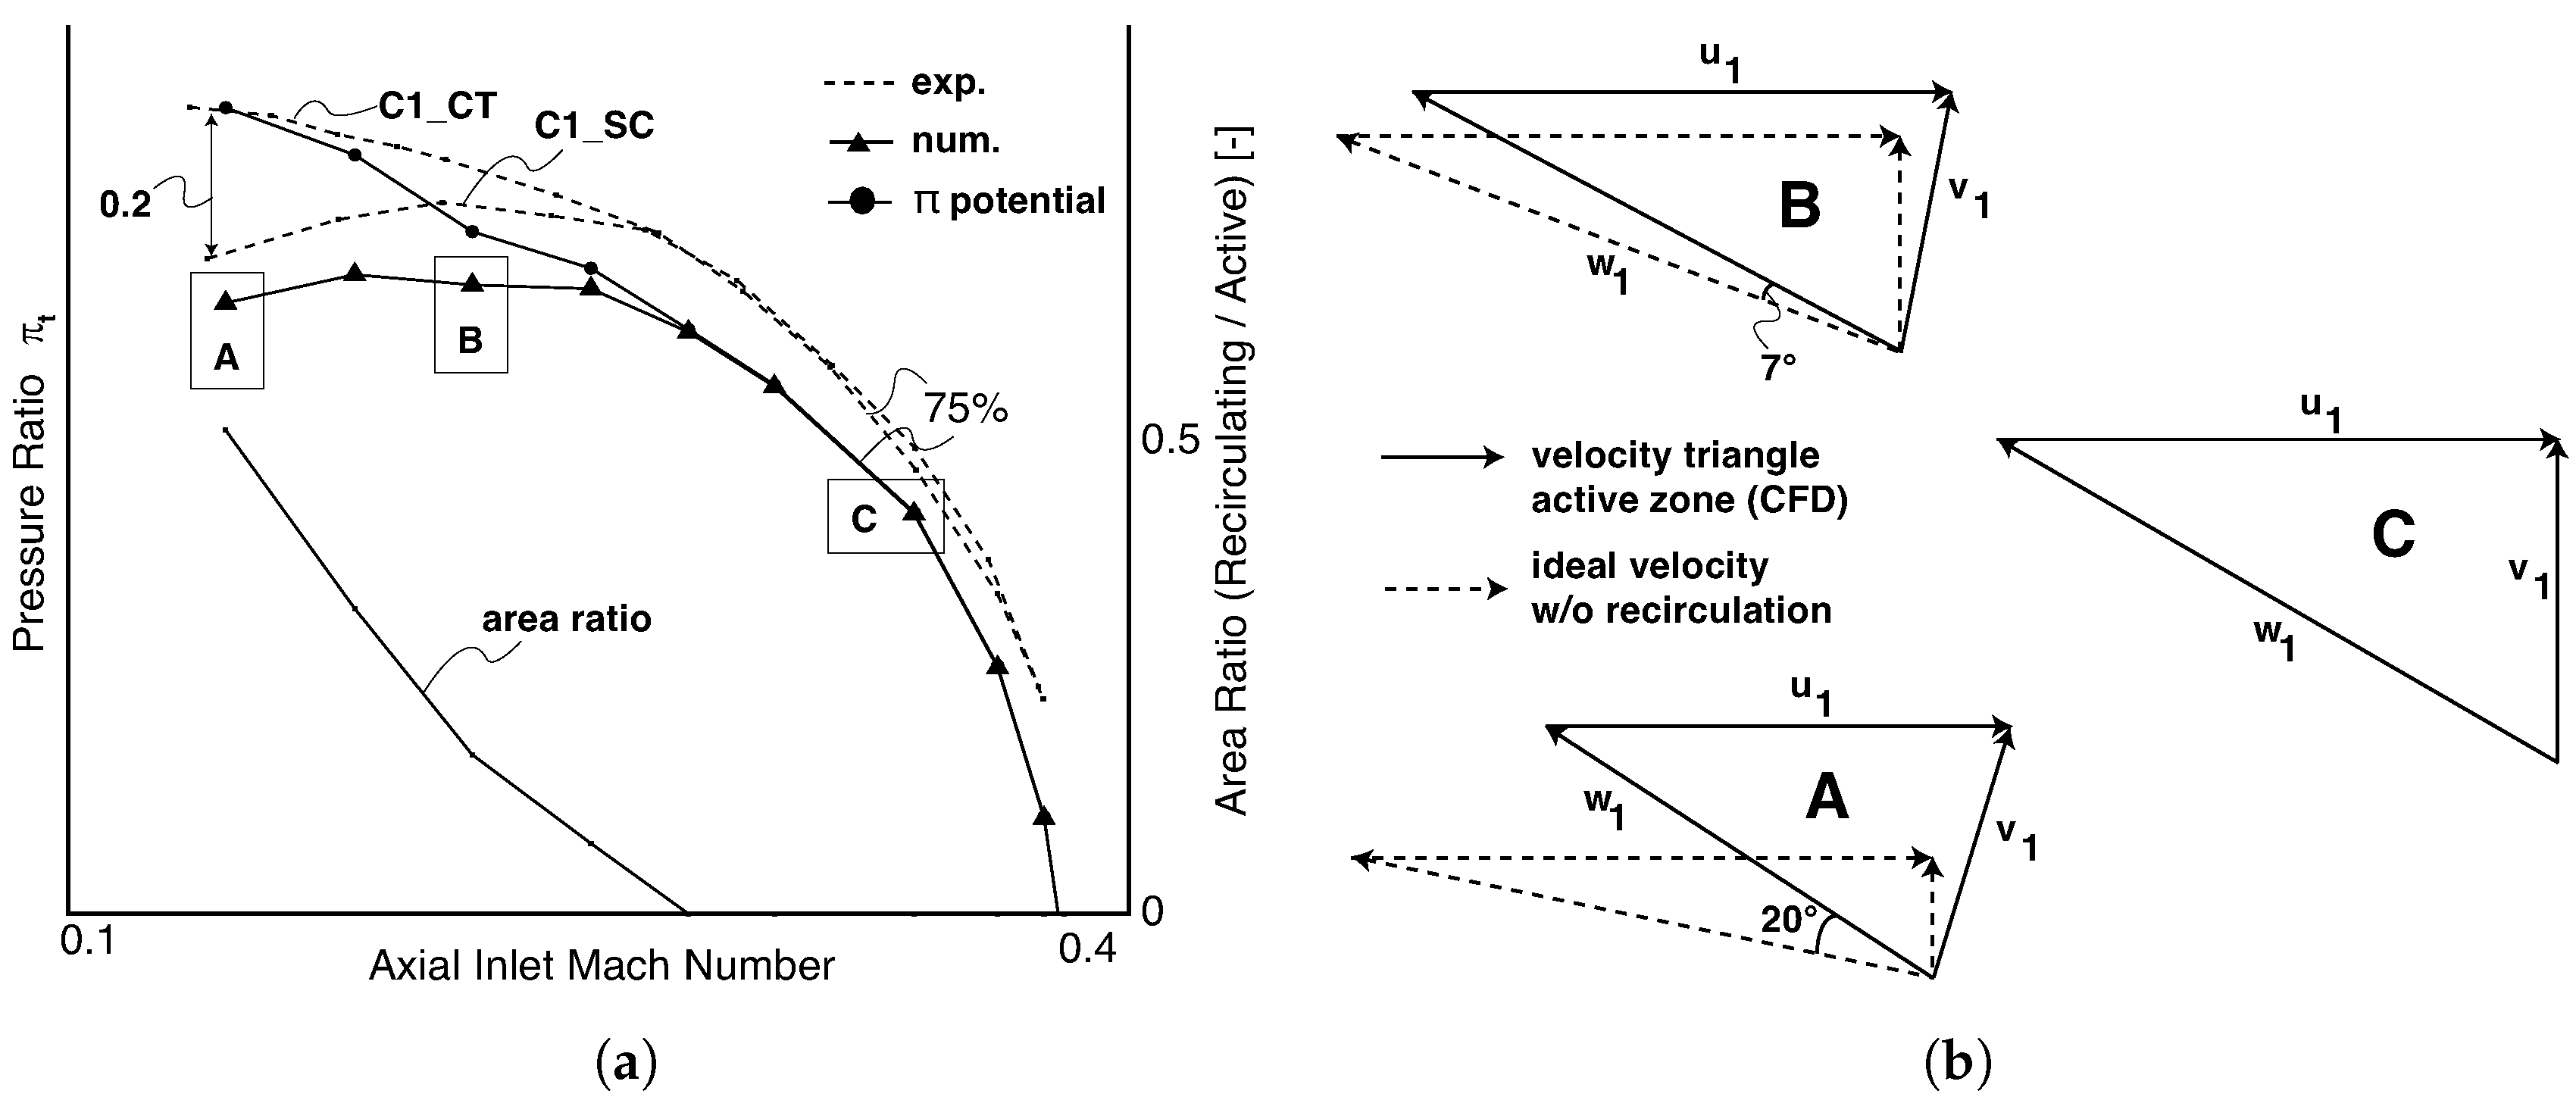
An example for the evaluation of blockage, i.e., recirculation zone, for low pressure ratio operation is given in
Figure 10a. The formation of the recirculation zone aligns with an increase in slope of the compressor speed line. As this effect increases, the compressor speed line tends to a positive slope. The recirculation zone grows to approximately 50%, implying that half of the inlet area is blocked. The evaluation of impellers C2–C5 show similar results for low pressure operation.
This massive recirculation zone changes the work input coefficient and decreases efficiency, as the energy added to the recirculating mass is lost. Both effects reduce pressure ratio and thus decrease the slope of the compressor speed line.
The impact on the work input coefficient can be shown by the change in velocity triangles at the inlet to the impeller. The blockage of the inlet area reduces the meanline radius. This leads to a reduced circumferential inlet velocity
. The reduced area increases the absolute inflow velocity
, as mass flow has to pass a smaller area. In addition, the recirculating mass is directed into the circumferential direction because an angular momentum is added to it by the impeller. This backflow induces part of the angular momentum to the absolute velocity of the active zone
. An overview of the change in flow triangles is shown in
Figure 10b. These triangles are evaluations from steady state CFD and the marked operating points in
Figure 10a are used. The mass weighted average of the absolute velocity
, circumferential velocity
and relative velocity
were evaluated in front of the impeller. The ideal velocity triangles were calculated with the corresponding mass flow rate (
Figure 10a) and mass weighted radius (meanline radius). The mass flow rate was used to determine an ideal
under the assumption of homogeneous inflow without swirl. Thereby, also an ideal meanline radius was calculated, representing the position at which half of the mass flow is passing below and above. The actual meanline radius is lower than the ideal one due to the recirculation zone. Together with the rotor rotation frequency, an ideal circumferential velocity
could be determined. Since the actual meanline radius is shifted towards lower radii, the circumferential velocity is lowered in comparison to an ideal situation. The ideal relative velocity
is a result of the ideal velocities
and
. A change in triangles for varying operating points and a comparison to ideal mean triangles are shown in
Figure 10b.
The work potential of the impeller with no inlet recirculation was estimated in terms of compressor pressure ratio with Equation (
1). Due to inlet recirculation, the total temperature in front of the impeller is increased in the case of throttled operation. An ideal efficiency potential was estimated by subtracting this amount of heat transferred in front of the impeller. This temperature increase from inlet boundary condition to the inlet of the impeller was evaluated using CFD results. In addition to an increase in efficiency, a much more dominant lever for the potential pressure ratio is the ideal work input. The ideal work input was estimated using the prescribed ideal flow triangles in front of the impeller. Thereby, two effects were considered. The mass flow redistribution due to inlet recirculation leads to a decreased incidence at low channel height and decreased meanline radius, resulting in a reduction of impeller work input. The second effect is the heating and acceleration of fluid in front of the impeller, which can be linked to losses and heat transfer.
The Euler equation (Equation (
2)) can be used to estimate the impact of the changed velocity triangle. The triangle of the active flow zone was evaluated from numerical results while, for reference, an ideal triangle was calculated with the assumption of no recirculation (cf.
Figure 10b).
With the evaluation of work potential and efficiency gain, it is possible to calculate a pressure ratio potential, the achievable pressure ratio for the investigated impeller without recirculation. This is shown in
Figure 10a and can be used to compare the result with the achieved pressure ratio gain caused by CTs.
5. Map Width and Efficiency Effects
In
Figure 1, the positive CT effects on compressor map is visualized. C5 is a downsized version of C1 (by a factor of 0.6). Because of manufacturing limitations, the downsized impeller C5 has higher relative tip clearance, bigger relative fillets and blade thickness could not be scaled accurately. The aerodynamic effect of these design limitations are clearly visible in
Figure 1. The increased relative tip clearance and reduced flow area due to bigger fillets and blade thickness lead to a reduced pressure ratio and choke mass flow rate. This effect is increased for high rotational speeds.
Despite the scaling limitations, the last stable operating point shows almost equal pressure ratio for C1 and C5 when the CT was applied. It was possible to increase the slope of the compressor speed lines with the CT. This effect is amplified for the downsized configuration. The reason for this amplified effect is a result of the increased blockage and losses in the tip region at the inducer of C5. Mainly the influence of an increased relative tip gap can be minimized with the CT. This highlights a potential application for the investigated CT, which is especially effective for small impeller configurations.
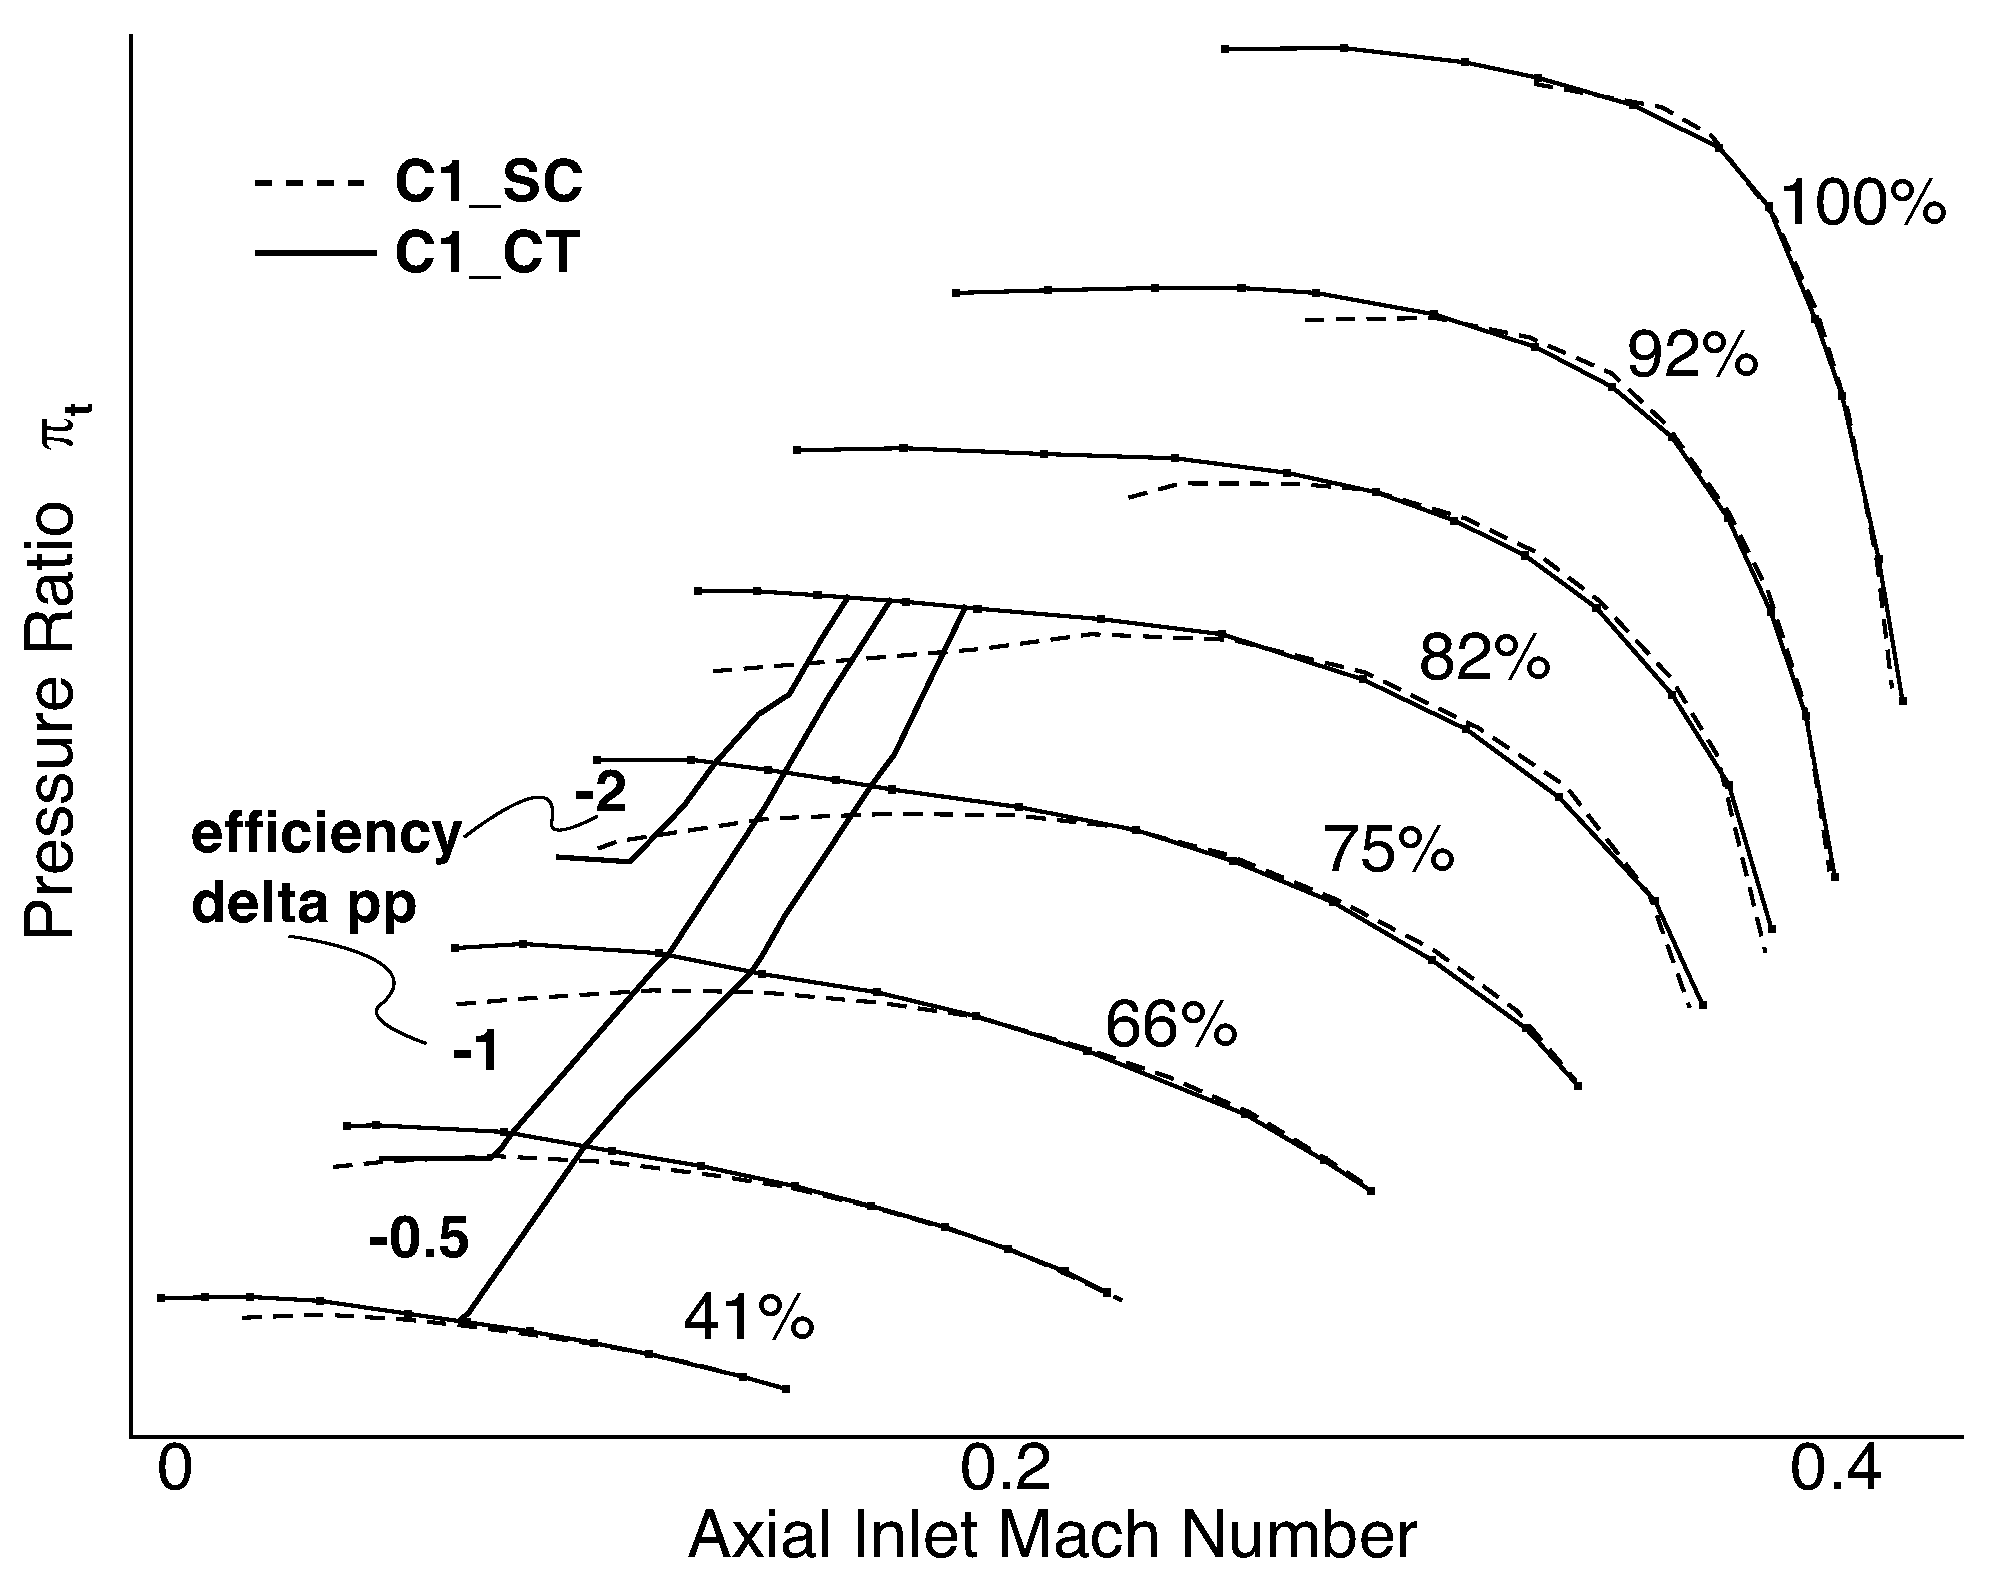
Figure 11 gives a complete overview of the positive CT effects on a compressor map. The CT reduces blockage and therefore losses due to recirculation at the blade tip. For high and nominal Mach number operating points, the deviation in efficiency between SC and CT is within measurement accuracy and cannot be quantified. This is coherent with the analytical approach, because recirculation only develops near stall, at low inlet Mach numbers. It underlines that the CT is only active if a recirculation is formed in the inducer. Losses corresponding to the CT are consisting mainly of friction losses in the CT at the wall and mixing losses when injecting fluid with high velocity into the main stream. When the CT is inactive, these losses are reduced to a value below measurement accuracy even for high rotational speed.
For low Mach number operation the CT increases pressure ratio and map width but efficiency is reduced by up to 2%. There are two counteracting mechanisms that determine the global effect the CT has on the flow. On the one hand, recirculation and the corresponding losses are reduced, increasing efficiency. On the other hand, friction losses in the CT and mixing losses of the CT and main flow are introduced. These losses scale with the activity of the CT and therefore increase if the compressor is further throttled (see
Figure 11).
5.1. Inducer Incidence and Working Principle
An analytical treatment of inducer recirculation effects and the corresponding work potential of impellers from a global point of view are shown in
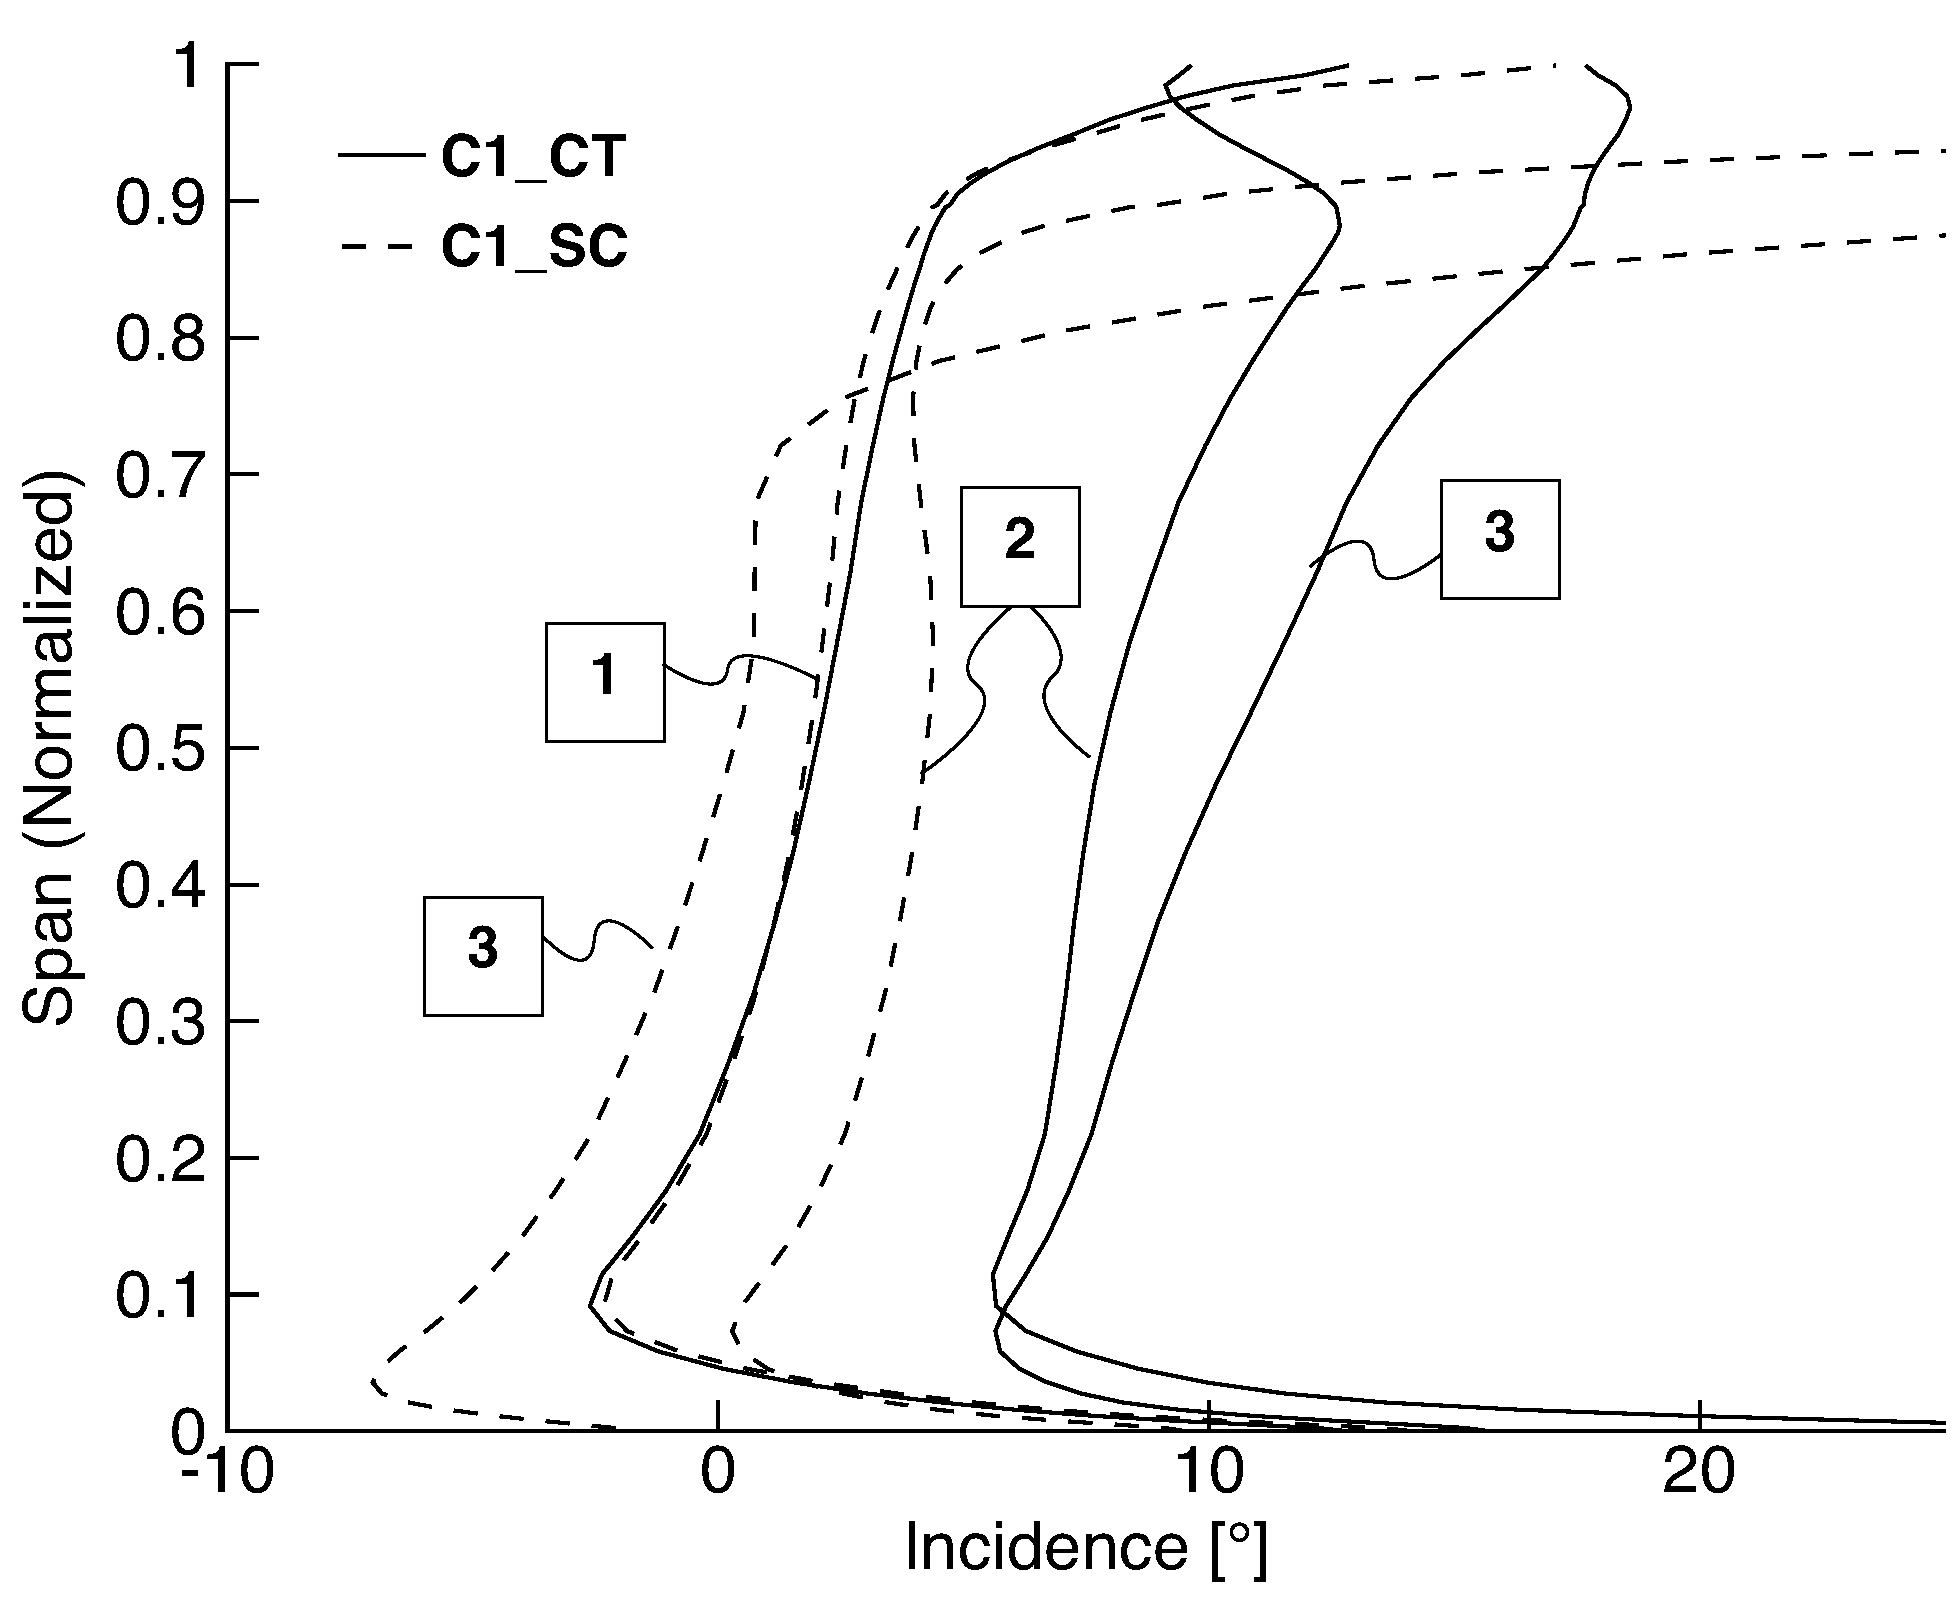
Figure 10a,b. To analyze the CT and its effects on inflow in detail over the whole blade span, unsteady RANS was used. The visualized Operating Points 1–3 in
Figure 6 were evaluated and the averaged incidence angle of the incoming flow is plotted in
Figure 12.
Operating Point 1 shows no recirculation and the CT is inactive, the incidence angle of SC and CT are equivalent. When the compressor is further throttled, the recirculation zone starts to form and massively increases incidence in this region. The CT actively influences the flow and reduces incidence. Therewith, the incidence over the whole span is affected. Absolute velocity is decreased while meanline radius is increased. The difference in incidence angle between CT and SC for Operating Point 2 at mid span equates approximately to the calculated analytical potential of Operating Point B in
Figure 10a,b (cf.
Figure 6). This effect increases towards the further throttled Operating Point 3. The results with smooth casing indicate that the incidence angle at hub and mid span is reduced for Operating Point 3. This is due to the massive redistribution of mass to lower span radii. The application of the CT in contrast increases the incidence in this region. These observations are consistent to the analytically calculated work potential. The CT reduces blockage and recirculation in the tip region of the inducer and thereby decreases incidence in this region. This not only enables a high work input coefficient at the shroud, but also increases the incidence angle at the blade hub. The difference in pressure ratio with the CT is almost equal to the analytically calculated one in
Figure 10a. The unsteady CFD result in
Figure 12 further confirms that the CT is able to minimize the recirculation zone in the inducer.
A potential increase in operating range is design dependent. Configurations with smooth casing tend to form part span stall in the shroud region. The recirculation decreases aerodynamic loading at mid span and hub. A CT suppresses this effect. Nevertheless, a compressor with CT might be affected by stall in other regions. Compressor range depends on the ability of the impeller to deliver and withstand a certain pressure ratio. The application of a CT therefore increases or decreases range depending on the detailed impeller design.
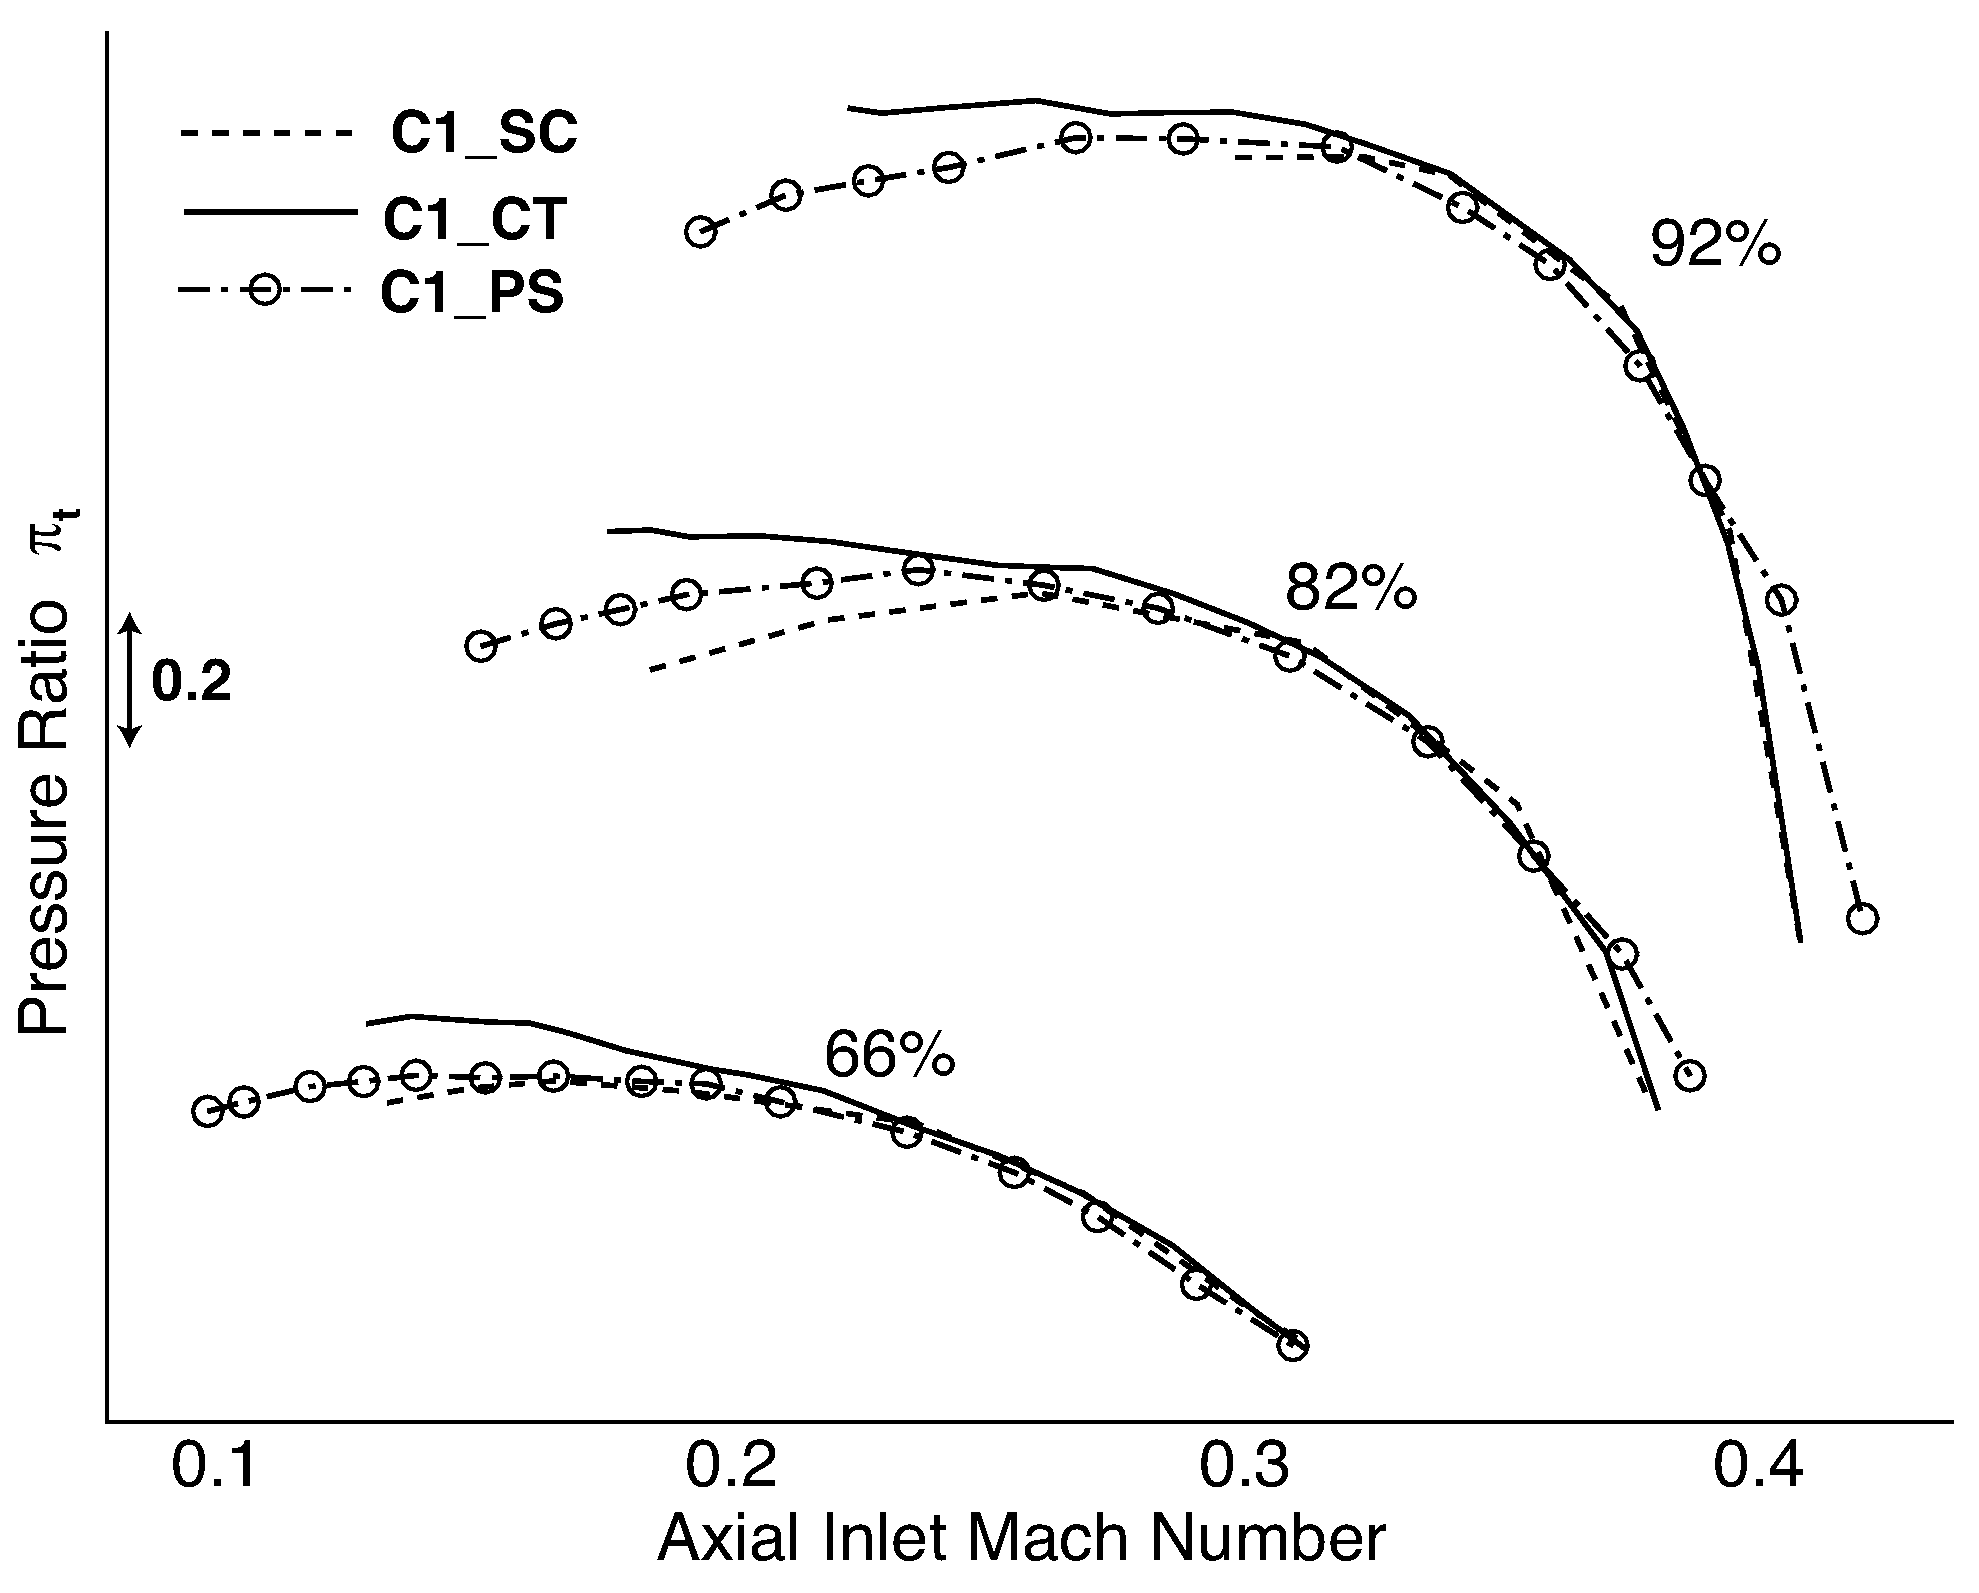
5.2. Comparison of CT and Inducer Bypass
The design of the investigated inducer recirculation bypass is visualized in
Figure 3. The working principle is based on static pressure difference between the flow at the impeller shroud and the impeller inlet. Depending on the position of the bleed and blow port relative to the impeller inlet and the compressor design, the pressure difference varies and therefore the impact of the bypass. The bleed position of the inducer bypass is designed according to Zheng et al. [
14], while the blow port is guided to the front of the inducer inlet. Often the blow port is located closer to the impeller and flow is injected radially, which is mainly due to acoustic considerations. The aerodynamic effect of this blow port variation were neglected in this study. Two operation modes must be distinguished. In the near stall region, the static pressure at the impeller inducer is higher than at the blow port upstream of the impeller, leading to a recirculation mass flow through the bypass. The shroud region of the impeller is unloaded. This leads to an aerodynamic impeller stabilization and increases compressor map width.
Near choke, the flow in the recirculation channel is reversed, increasing maximum mass flow rate. At operating points close to choke, impeller work input is only transferred to an increase in absolute velocity from the inducer to the smallest aerodynamic cross section. Simultaneously, the static pressure at shroud is decreasing, which leads to a reversed flow direction in the inducer bypass (TEIS model introduced by Japikse [
8] and mentioned above).
In comparison to the inducer bypass design, the CT only introduces a cavity. Therefore, bleed and blow ports are located at the same axial and circumferential position in the compressor housing. The flow recirculation is mainly driven by the blade loading and the pressure difference between pressure and suction side, respectively. As the pressure side of a blade passes the port of an axial slot, the pressure in the cavity is increased. On the suction side of the impeller blade, the flow in the cavity is redirected and pushed into the blade passage, with positive effects on the axial momentum of the boundary layer as well as on the near shroud flow. In contrast to the steady working principle of the bypass design, the unsteady charge and discharge of the CT depends on the number of blades and rotational speed.
In
Figure 13, a comparison of map enhancement with inducer bypass (PS) compared to casing treatment (CT) and smooth casing is presented. While the inducer bypass increases compressor map width massively to low Mach number operating points, pressure ratio is slightly effected in comparison to the CT application. In addition, the choke mass flow for high speed operation is increased by the inducer bypass. This region of the compressor map is unaffected by the CT.
5.3. Transferability of Results
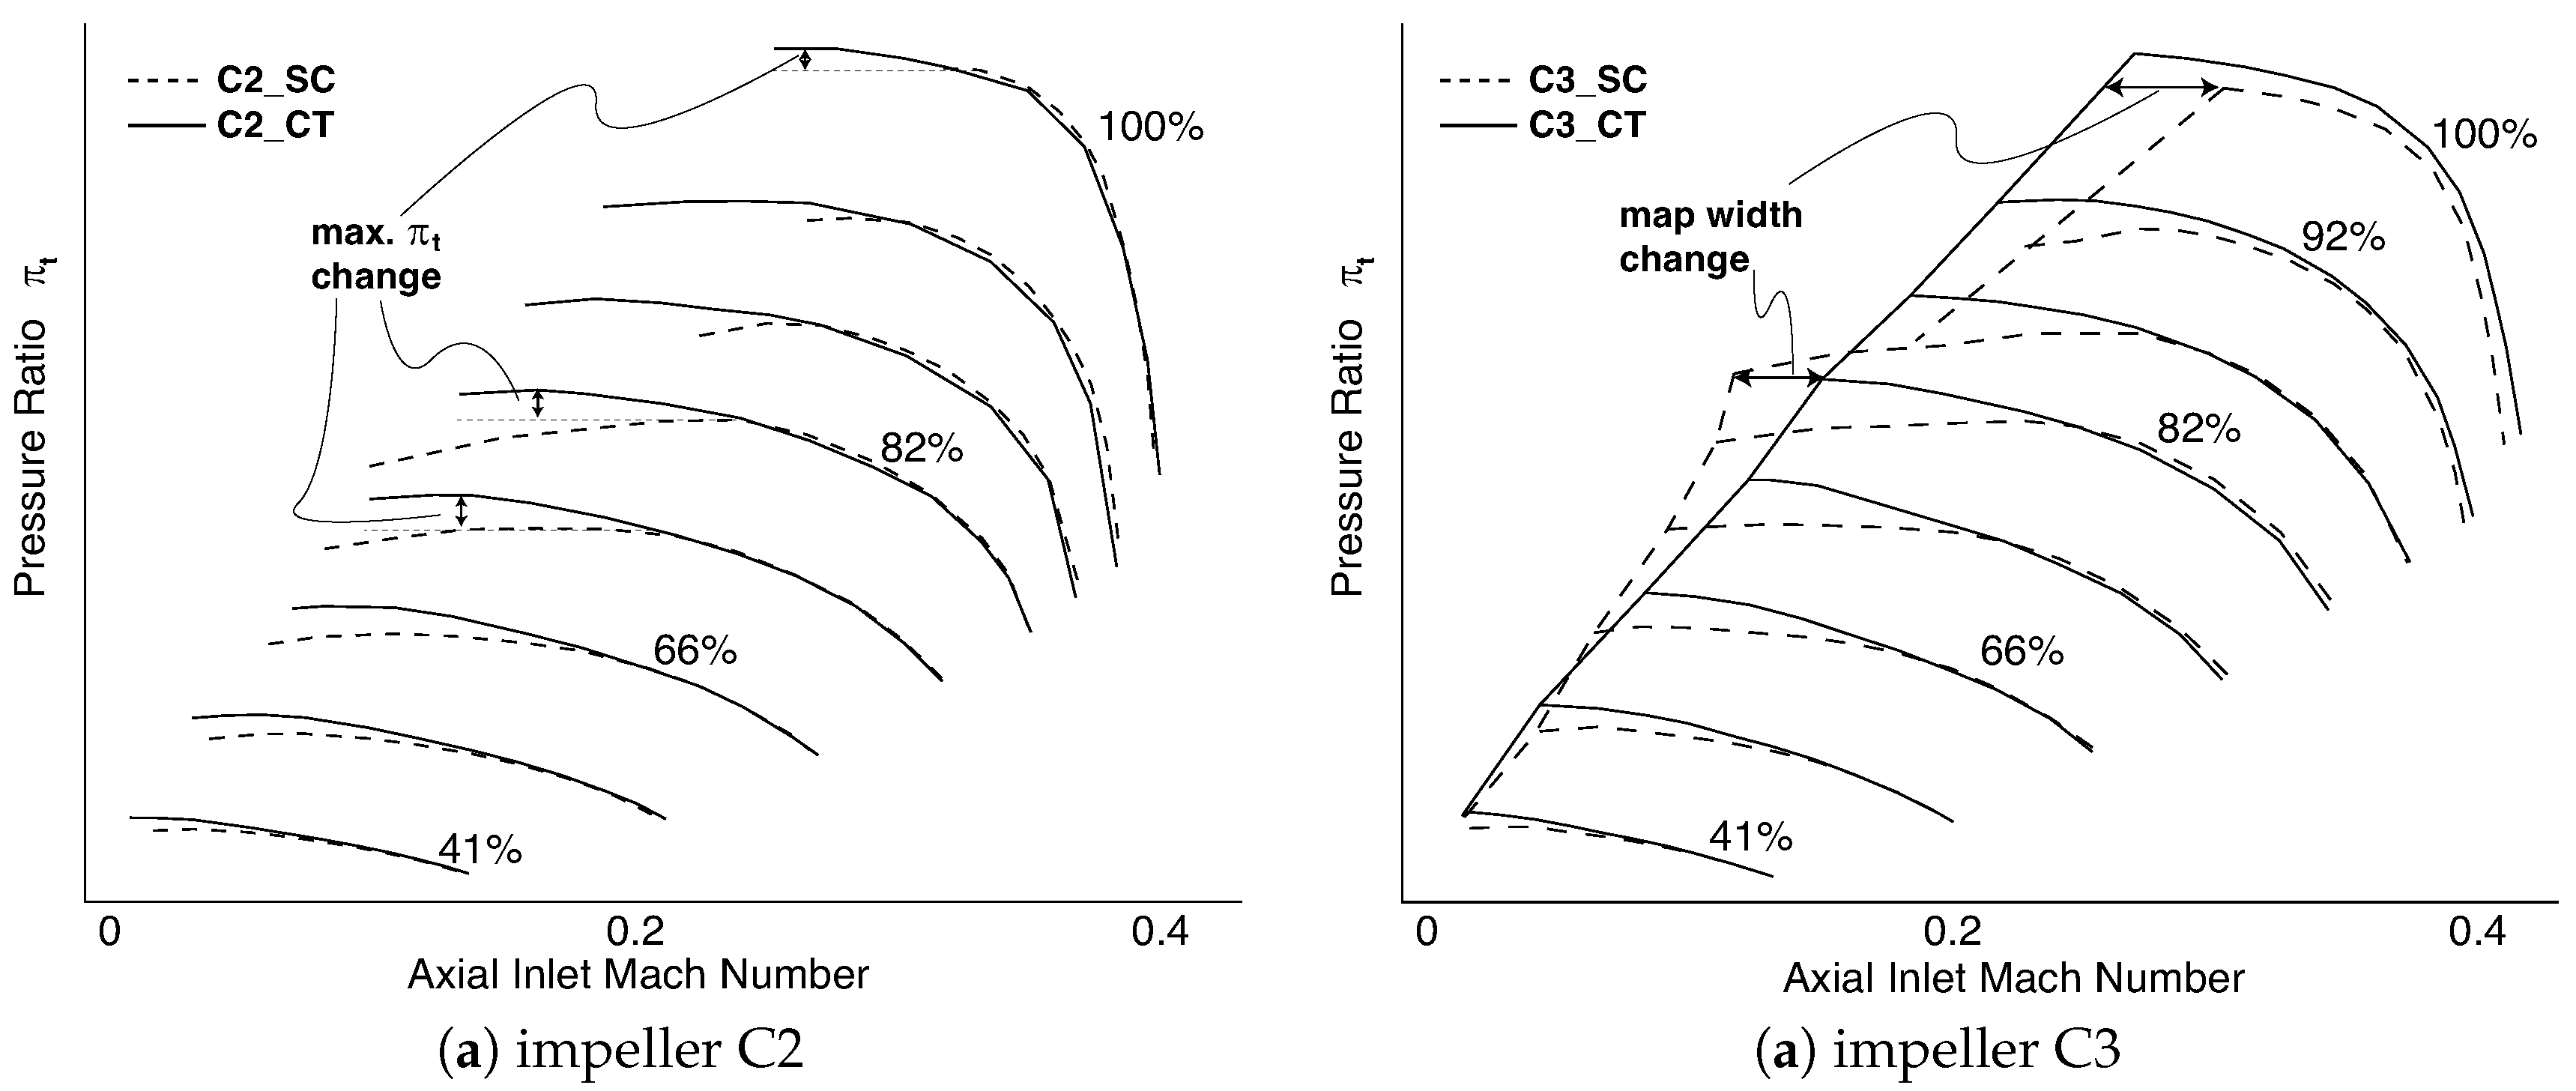
In
Figure 14a, an experimental comparison of the impeller C2 with smooth casing and with casing treatment is shown. The performance of the CT is comparable to that with impeller C1 (see
Figure 11). Pressure ratio enhancement, a slight shift of map width for low speed operation and an increase of stable operating range for high speed are similar to C1 observations.
A third impeller configuration is shown in
Figure 14b. In contrast to results of C1 and C2, the shift of surge limit at low speed operation is more distinct and towards higher mass flow rate. Therewith, the map width is decreased for C3 in the middle of the compressor map. For high pressure operation (i.e., high rotational speeds), the stable operating limit is again increased, but not with the same extent as for C1 and C2. The increase of pressure ratio from peak efficiency to throttled operating points are again clearly pronounced.
It can be concluded that all investigated impellers tend to form an inducer recirculation. In terms of pressure ratio, they all benefit from the application of the presented CT. A change in compressor range, stable operation and surge initiation is however difficult to transfer. At high speed operation, all investigated configurations benefit from the CT and show a more stable operation, leading to an increase of experimentally determined operating range. At low speed operation, nevertheless the influence on surge limit is not that clear.
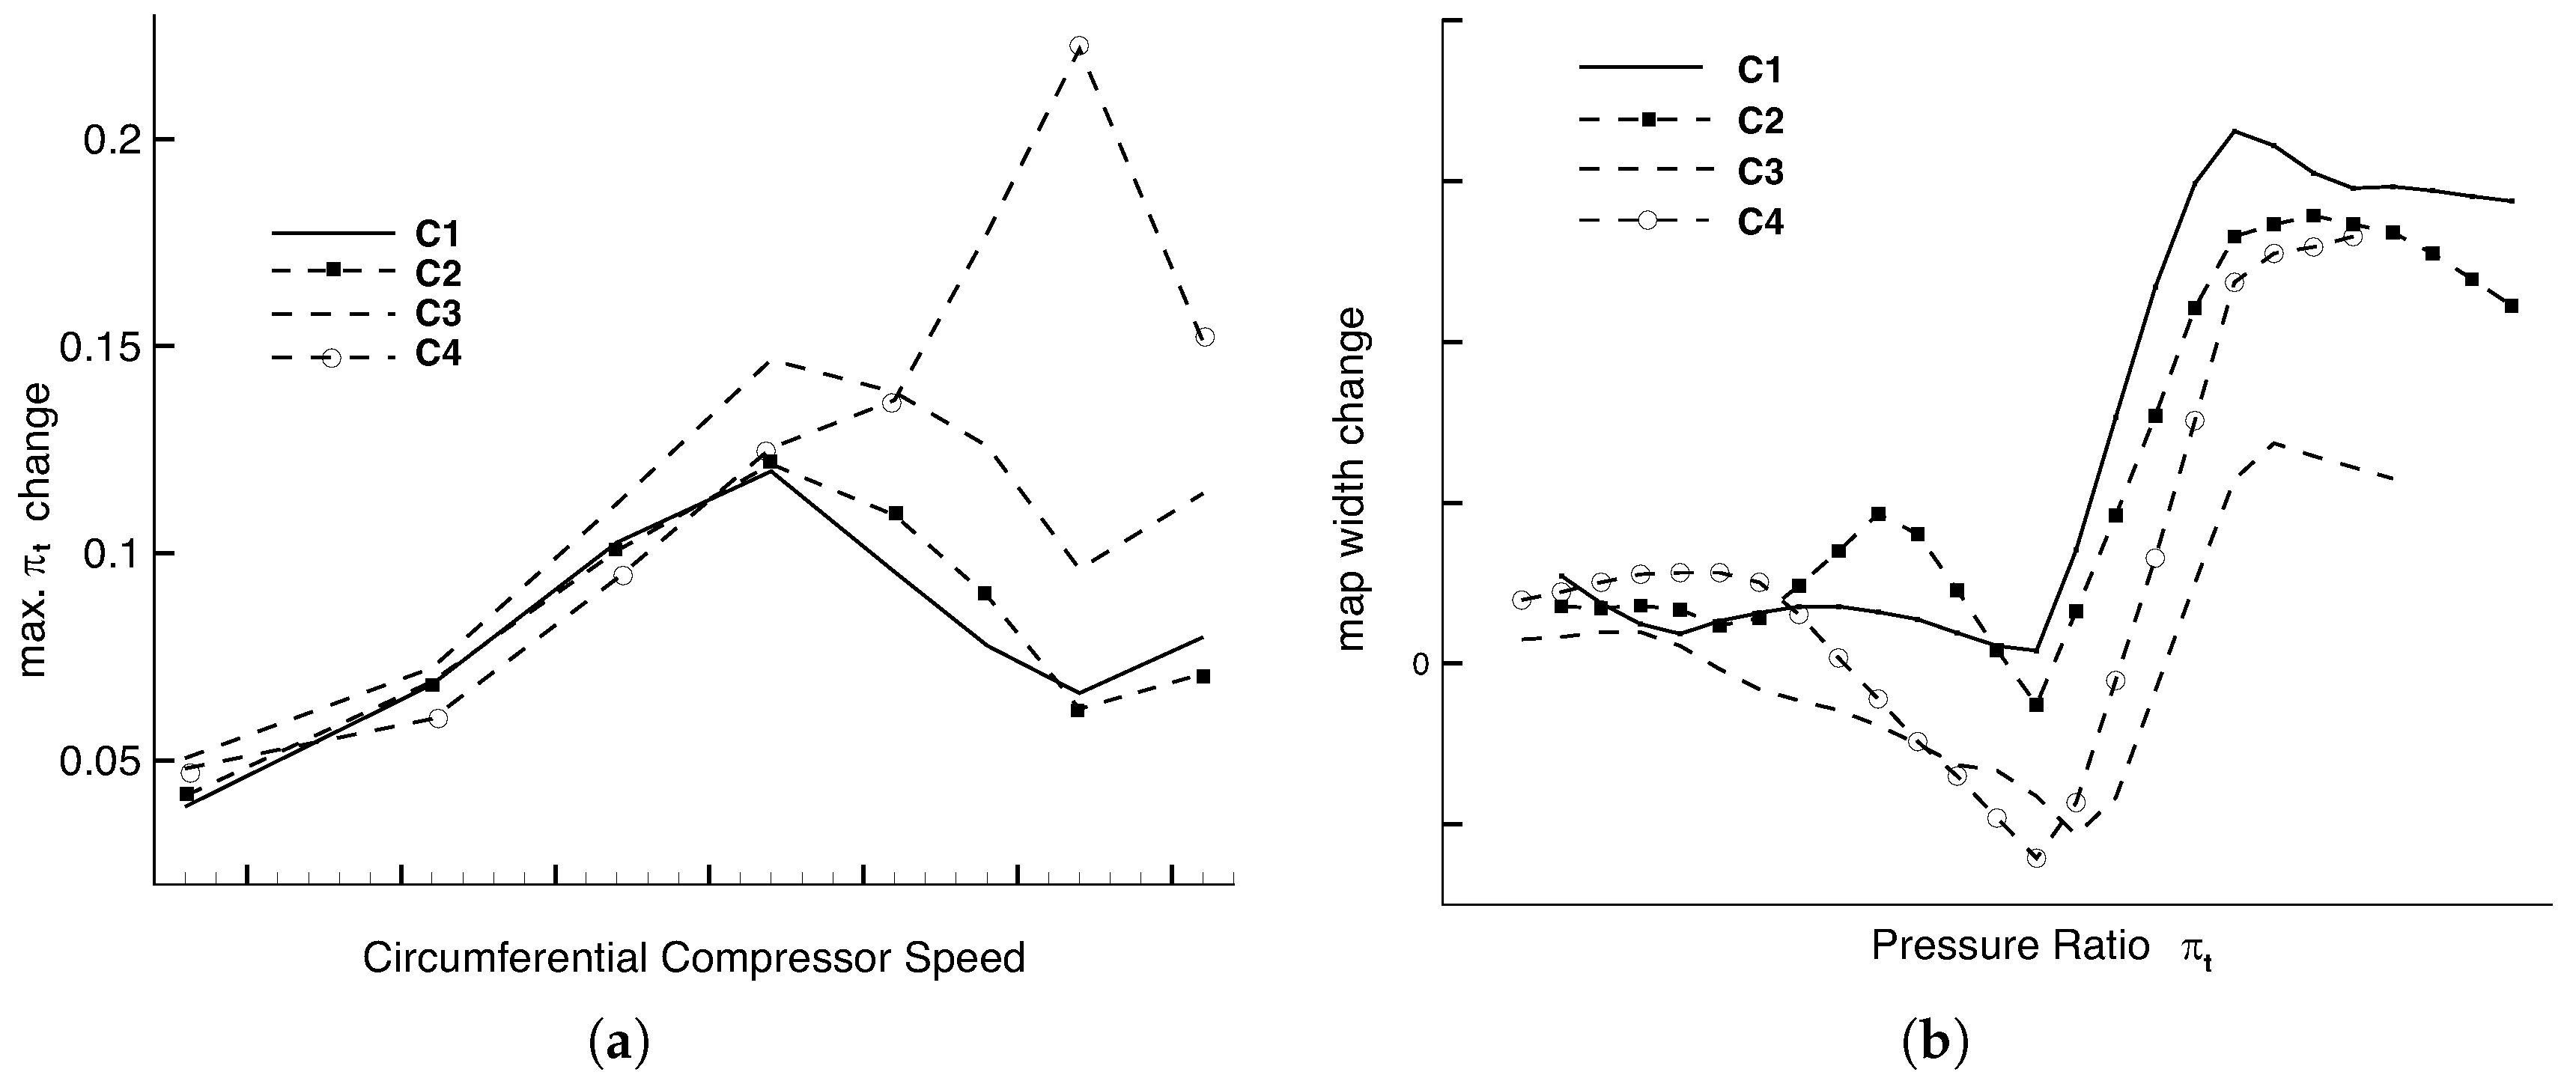
In
Figure 15a,b, a comprehensive overview of pressure ratio and map width change due to the application of the CT is visualized. The definition of pressure ratio and map width change is depicted in
Figure 14a,b. An increase in range in comparison to SC has a positive sign and a decrease negative. While pressure ratio can be increased for all investigated impellers throughout the complete compressor map, the application of the CT reduces map width in the middle of the compressor map for C2, C3 and C4 (cf.
Figure 14b). In the case of high rotational speed and a corresponding high pressure ratio, the stable operating range is increased and compressors benefit from the application of the CT. The pressure ratio is only enhanced slightly in this region. Performance variations might be explained by the design differences, but these detailed considerations are out of scope of this paper.
6. Conclusions
The impact of inducer recirculation, a phenomenon often experienced in modern turbocharger applications, was investigated in detail. Steady state CFD simulations were used to evaluate the work potential of this loss mechanism, which is prominent between nominal and surge operation. The redistribution of mass and the corresponding reduction in meanline radius in the inducer massively decreases the potential pressure ratio of centrifugal compressors. The evaluation of velocity triangles in the active flow zone was used to assess this potential.
In addition to the well known inducer bypass, the introduced casing treatment design provides a considerable method to reduce inlet recirculation and increase pressure ratio. Its effectiveness was investigated with unsteady RANS-simulations. A massive reduction in mass redistribution in the inducer leads to an increased incidence angle at hub and mid span. This induces an increased pressure ratio between nominal and surge operation. A comparison to the CFD based analytical work potential shows similar pressure ratio improvements.
The effect on efficiency was evaluated with experiments and the CT can be considered as inactive for nominal and high mass flow operation, i.e., no impact on compressor efficiency could be demonstrated in this region of the compressor map. For highly throttled operation close to surge, the CT is recirculating flow, and mixing as well as friction losses lead to an efficiency decrease of up to 2%.
The comparison to an inducer bypass is shown, which demonstrates the advantage of the CT in terms of pressure ratio enhancement close to surge. On the other hand, the inducer bypass is superior in terms of compressor map width increase.
Scalability of the CT is demonstrated with a downsized configuration and the transferability is shown with three additional compressor configurations. Depending on impeller design, the application of the CT reduces compressor range at low speed operation via shifting the surge limit to higher mass flow rates. At high speed operation, all investigated impellers profit from the application of the CTs and show an increased stable operating range.
Author Contributions
S.L. advised in the conceptual design of the casing treatment, did the analytic investigation of work potential and wrote the paper; J.B. was responsible for experimental investigations, designed the casing treatments and wrote the paper; H.-P.S. advised in the conceptual design and during the hole investigation; M.H. did the numerical simulations and post processing; and P.P. advised during the investigation.
Acknowledgments
The authors would like to thank BorgWarner Turbo Systems Engineering GmbH for provision of the necessary compressor hardware for testing, financial support as well as for their continuing technical assistance. The authors would also like to extend their thanks to ANSYS Inc. for the technical support during this research. Calculations for this research were conducted on the Lichtenberg high performance computer of the TU Darmstadt.
Conflicts of Interest
The authors declare no conflict of interest.
Nomenclature
The following nomenclatures are used in this manuscript:
| CT | Casing Treatment | | Work input coefficient |
| CFD | Computational Fluid Dynamics | | Isentropic total-to-total efficiency |
| constant pressure heat capacity | | Total Pressure Ratio |
| h | enthalpy | | rotational speed |
| p | pressure | Subscripts | |
| PS | inducer bypass/Ported Shroud | 1 | in front of the compressor |
| RANS | Reynolds-averaged Navier–Stokes | 2 | behind the compressor |
| SC | Smooth Casing | 3 | in front of the turbine |
| axial Mach number | 4 | behind the turbine |
| SST | Shear Stress Transport | abs | absolute |
| SC | Smooth Casing | amb | ambient |
| T | temperature | ax | axial |
| u | circumferential velocity | rel | relative |
| v | absolute velocity | stat | static |
| w | relative velocity (in the rotating frame of reference) | t | total |
References
- Fisher, F.B. Application of Map With Enhancement Devices to Turbocharger Compressor Stages. SAE Trans. 1988, 97, 1303–1310. [Google Scholar]
- Hathaway, M.D. Passive Endwall Treatments for Enhancing Stability; NASA/TM-2007-214409; NASA Center for Aerospace Information: Hanover, MD, USA, 2007.
- Sivagnanasundaram, S.; Spence, S.; Early, J. Map Width Enhancement Technique for a Turbocharger Compressor. J. Turbomach. 2014, 136, 061002. [Google Scholar] [CrossRef]
- Sivagnanasundaram, S.; Spence, S.; Early, J.; Nikpour, B. An Impact of Various Shroud Bleed Slot Configurations and Cavity Vanes on Compressor Map Width and the Inducer Flow Field. J. Turbomach. 2013, 135, 041003. [Google Scholar] [CrossRef]
- Streit, J.A.; Heinichen, F.; Kau, H.P. Axial-Slot Casing Treatments Improve the Efficiency of Axial Flow Compressors: Aerodynamic Effects of a Rotor Redesign. In Proceedings of the ASME Turbo Expo 2013: Turbine Technical Conference and Exposition, San Antonio, TX, USA, 3–7 June 2013; Volume 6A, p. V06AT35A018. [Google Scholar] [CrossRef]
- Brandstetter, C.; Wartzek, F.; Werner, J.; Schiffer, H.P.; Heinichen, F. Unsteady Measurements of Periodic Effects in a Transonic Compressor With Casing Treatments. J. Turbomach. 2016, 138, 051007. [Google Scholar] [CrossRef]
- Harley, P.; Spence, S.; Filsinger, D.; Dietrich, M.; Early, J. Meanline Modeling of Inlet Recirculation in Automotive Turbocharger Centrifugal Compressors. J. Turbomach. 2014, 137, 011007. [Google Scholar] [CrossRef]
- Japikse, D. Centrifugal Compressor Design and Performance, 1st ed.; Concepts Eti: White River Junction, VT, USA, 1996. [Google Scholar]
- Wilke, I.; Kau, H.P. A Numerical Investigation of the Influence of Casing Treatments on the Tip Leakage Flow in a HPC Front Stage. In Proceedings of the ASME Turbo Expo 2002: Power for Land, Sea, and Air, Amsterdam, The Netherlands, 3–6 June 2002; Volume 5, pp. 1155–1165. [Google Scholar] [CrossRef]
- Hembera, M.; Kau, H.P.; Johann, E. Simulation of Casing Treatments of a Transonic Compressor Stage. Int. J. Rotating Mach. 2008, 2008, 1–10. [Google Scholar] [CrossRef]
- Celik, I.; Karatekin, O. Numerical Experiments on Application of Richardson Extrapolation With Nonuniform Grids. J. Fluids Eng. 1997, 119, 584. [Google Scholar] [CrossRef]
- SAE. Turbocharger Gas Stand Test Code: J1826; SAE International: Warrendale, PA, USA, 1995; 1995-03. [Google Scholar]
- Kämmer, N.; Rautenberg, M. A Distinction Between Different Types of Stall in a Centrifugal Compressor Stage. J. Eng. Gas Turbines Power 1986, 108, 83. [Google Scholar] [CrossRef]
- Zheng, X.; Zhang, Y.; Yang, M.; Bamba, T.; Tamaki, H. Stability Improvement of High-Pressure-Ratio Turbocharger Centrifugal Compressor by Asymmetrical Flow Control-Part II: Nonaxisymmetrical Self-Recirculation Casing Treatment. J. Turbomach. 2013, 135, 0210071–0210078. [Google Scholar] [CrossRef] [PubMed]
© 2019 by the authors. Licensee MDPI, Basel, Switzerland. This article is an open access article distributed under the terms and conditions of the Creative Commons Attribution (CC BY-NC-ND) license (https://creativecommons.org/licenses/by-nc-nd/4.0/).

