Article

Characterization of Periodic Incoming Wakes in a Low-Pressure Turbine Cascade Test Section by Means of a Fast-Response Single Sensor Virtual Three-Hole Probe

von Karman Institute for Fluid Dynamics, Chaussée de Waterloo 72, 1640 Sint-Genesius-Rode, Belgium
*
Author to whom correspondence should be addressed.
Int. J. Turbomach. Propuls. Power 2019, 4(3), 26; https://doi.org/10.3390/ijtpp4030026
Submission received: 1 July 2019 / Revised: 5 August 2019 / Accepted: 7 August 2019 / Published: 15 August 2019

Abstract

:
This paper aims at evaluating the characteristics of the wakes periodically shed by the rotating bars of a spoked-wheel type wake generator installed upstream of a high-speed low Reynolds linear low-pressure turbine blade cascade. Due to the very high bar passing frequency obtained with the rotating wake generator (fbar = 2.4−5.6 kHz), a fast-response pressure probe equipped with a single 350 mbar absolute Kulite sensor has been used. In order to measure the inlet flow angle fluctuations, an angular aerodynamic calibration of the probe allowed the use of the virtual three-hole mode; additionally, yielding yaw corrected periodic total pressure, static pressure and Mach number fluctuations. The results are presented for four bar passing frequencies (fbar = 2.4/3.2/4.6/5.6 kHz), each tested at three isentropic inlet Mach numbers M1,is = 0.26/0.34/0.41 and for Reynolds numbers varying between Re1,is = 40,000 and 58,000, thus covering a wide range of engine representative flow coefficients (ϕ = 0.44−1.60). The measured wake characteristics show fairly good agreement with the theory of fixed cylinders in a cross-flow and the evaluated total pressure losses and flow angle variations generated by the rotating bars show fairly good agreement with theoretical results obtained from a control volume analysis.

1. Introduction

For the purpose of investigating the effects of unsteady wake–boundary layer interactions on the aerodynamic performance of (high-lift) low-pressure turbine airfoils in linear cascades, periodic wake generators placed upstream of the cascade and equipped with linearly moving or rotating cylindrical bars are commonly used. The use of cylindrical bars to simulate the wakes shed by turbomachinery blades was validated by Pfeil and Eifler [1], who showed that the structure of the far wake (xw/d > 80) of an airfoil and that of a cylindrical body of the same drag is almost identical. In their own work investigating unsteady wake–boundary layer interactions in low-pressure turbine cascades, Schulte and Hodson [2] have further shown that this also holds true for values of xw/d ranging between 40 and 80.
In order to simulate these rotor–stator interactions as accurately as possible, the flow coefficient ϕ (ratio between axial inflow velocity and peripheral velocity) as well as the reduced bar passing frequency fr (ratio between the characteristic convective time of the wake through the blade passage and the characteristic time between two consecutive wakes) need to be correctly matched with the values typically encountered in real-life low-pressure turbines. In high-speed wind tunnels, adjusting the flow coefficient and the reduced frequency requires a much higher bar speed and bar passing frequency than in low-speed wind tunnels. This explains why high-speed wind tunnels generally use spoked wheel-type wake generators with rotating bars [3,4,5], as opposed to squirrel cage-type wake generators with linearly moving bars typically used in low-speed wind tunnels [2,6,7]. For mechanical reasons, the latter wake generator type cannot achieve a sufficiently high bar speed to yield realistic flow coefficients in high-speed wind tunnels. However, the main downsides of spoked-wheel type wake generators are the non-parallelism between the rotating bars and the leading edge of the blades (with the exception of the central blade) due to the finite radius of the wake generator, as well as the limitation of the measurement domain to the mid-span region since the peripheral speed of the bars changes linearly with the radius. Consequently, when using spoked-wheel type wake generators, pitchwise periodicity is limited and hence measurements are mostly constrained to the central pitch of the linear cascade while spanwise periodicity/uniformity of the flow downstream of the rotating bars is also limited and hence measurements are mostly constrained to the mid-span region. In an effort to mitigate these constraints, the size (i.e., radius) of the wake generator should be maximized.
When performing measurements with a periodic wake generator, the total pressure losses measured downstream of the blade cascade are a combination of the losses of the blade profile itself as well as the total pressure losses across the row of rotating bars. Moreover, the tangential component of the drag force acting on the bars tends to turn the flow, therefore reducing the mean inlet flow angle at the inlet of the cascade. Consequently, in order to correctly assess the aerodynamic performance of low-pressure turbine blade profiles subjected to periodic unsteady inlet boundary conditions, the total pressure losses and flow angle variation caused by the rotating bars need to be accurately assessed. However, due to the high bar passing frequency (fbar = 2.4−5.6 kHz) and due to the small distance between the wake generator plane and the leading edge plane of a high-speed cascade, measuring the total pressure fluctuations and inlet flow angle variation downstream of the rotating bars with a conventional directional pneumatic probe is almost impossible without making any significant errors due to the low time response of such a measurement technique [2].
The work presented in this paper aims at evaluating the characteristics of the wakes periodically shed by the rotating bars of the wake generator, in terms of periodic inlet total pressure and periodic absolute inlet flow angle. The ultimate goal is to provide an accurate estimation of the total pressure loss and the inlet flow angle variation caused by the periodic wakes for a wide range of flow coefficients and to compare the obtained experimental results with the theoretical results obtained from a control volume analysis as described by Schulte and Hodson [2], Vera and Hodson [5] and Berrino et al. [7]. The theoretical analysis is based on the incompressible 2D momentum equation applied on a control volume around a single bar in the relative frame of reference, leading to an analytical solution for the total pressure losses and flow angle deviation across the wake generator. For more information, the reader is referred to the publication of Berrino et al. [7]. Due to the very high bar passing frequency obtained with the rotating wake generator, a fast-response pressure probe equipped with a single Kulite pressure sensor has been used. In order to measure the inlet flow angle fluctuations, an aerodynamic calibration of the probe allowed the use of a virtual three-hole mode, yielding yaw corrected periodic total pressure, yaw angle, static pressure and Mach number fluctuations. The results are presented for four bar passing frequencies (fbar = 2.4/3.2/4.6/5.6 kHz), each tested at three inlet Mach numbers (M1,is = 0.26/0.34/0.41) and Reynolds numbers (Re1,is = 40,000/50,000/58,000), thus covering a wide range of flow coefficients (ϕ = 0.44−1.60).

2. Experimental Setup

2.1. High-Speed Linear Cascade Facility

The experiments described in the present paper were carried out in the VKI S-1/C low-density high-speed wind tunnel. This facility is a continuous closed-circuit wind tunnel driven by a 615 kW axial compressor. A vacuum pump allows the variation of the air density inside the airtight facility, thereby lowering the internal absolute pressure level down to values smaller than 1/10th of the external atmospheric pressure. The air mass flow passing through the test section is, on the other hand, regulated by varying the rotational speed of the axial compressor and by further adjusting a by-pass valve. A cooler maintains the temperature close to ambient conditions (~285 K) and dry air is maintained at all conditions. This closed-loop facility gives the possibility to investigate the aerodynamic performance of up-scaled two-dimensional low-pressure turbine airfoils over a large range of independently adjustable exit isentropic Mach (M2,is up to 1.05) and Reynolds numbers (Re2,is = 2 × 10⁴–3 × 10⁵ based on the airfoil chord C = 0.02−0.10 m), allowing to cover a wide range of engine representative operating conditions. The test airfoil used for the present study is a low-pressure turbine profile with a low diffusion factor and low Zweiffel loading coefficient. The test section consists of a 17-blade linear cascade.
The high-speed spoked-wheel type periodic wake generator described in the introduction is used to simulate the presence of periodic incoming wakes. It consists of a brass disc equipped with molybdenum bars with a diameter of 1 mm, and it is driven by a 30 kW variable speed electrical motor able to rotate at up to 3500 RPM. The radius of the disc with bars is Rm = 0.45 m at blade mid-height and the number of bars fixed onto the rotating disc can be divisors of 96 (48/32/24/16/…), and for this measurement campaign, the number of bars was fixed at 96. Consequently, the wake generator can achieve a wide range of flow coefficients and reduced bar passing frequencies.

2.2. Instrumentation and Post-Processing

In the present study, the wake characteristics have been measured in the leading edge plane of the test cascade, located 24.89 mm downstream of the wake generator plane. The high bar passing frequencies (fbar = 2.4−5.6 kHz) combined with the close spatial proximity between the measurement plane and the wake generator plane (xmeas.−W.G./d ≈ 25) would lead to significant errors in the measurement of the time mean total pressure downstream of the bars if one was to use a conventional pneumatic (directional) probe [2]. For this reason, a directional probe with a single fast-response pressure sensor has been used in a virtual three-hole mode, as described by Mersinligil et al. [8] and by Dell’Era et al. [9,10].
The probe used in the present study is a Ø2.4 mm cylindrical probe with a single 5 PSI (34,500 Pa) Kulite absolute pressure transducer mounted in a recessed cavity with a Ø0.3 mm line at the tip of the probe stem. The resonance frequency of the line-cavity system is estimated at 33–35 kHz through FFT analysis of the raw signal time traces and through a classical Helmholtz resonator analysis. The temperature sensitivity of the Kulite sensor requires the calibration of the sensor in both temperature and pressure, with the outboard signal conditioning circuitry yielding two output signals, namely Vp (T, P) being primarily a function of the pressure and Vs (T, P) being mainly a function of the temperature. Hence, in order to achieve the static calibration of the sensor, a pressure calibration ranging from 7500 to 35,000 Pa (absolute) with intervals of 2500 Pa has been repeated for 7 temperature levels ranging between 5 and 35 °C with intervals of 5 °C, yielding a total of 91 calibration points. For each combination of pressure and temperature, the output signals Vp and Vs are acquired for 1 s on a 16-bit acquisition system at a sampling frequency of 100 kHz. After acquisition, the raw output signals Vp and Vs are time-averaged and the obtained calibration data are then fitted onto two separate polynomial surfaces as expressed in Equations (1) and (2). The resulting calibration surface fits are presented in Figure 1. The achieved 95% confidence interval uncertainty on the pressure read by the Kulite sensor is 52.7 Pa.
P = c 1 + c 2 V p + c 3 V p V s + c 4 V s + c 5 V s 2
T = c 6 + c 7 V p + c 8 V p V s + c 9 V s + c 10 V s 2
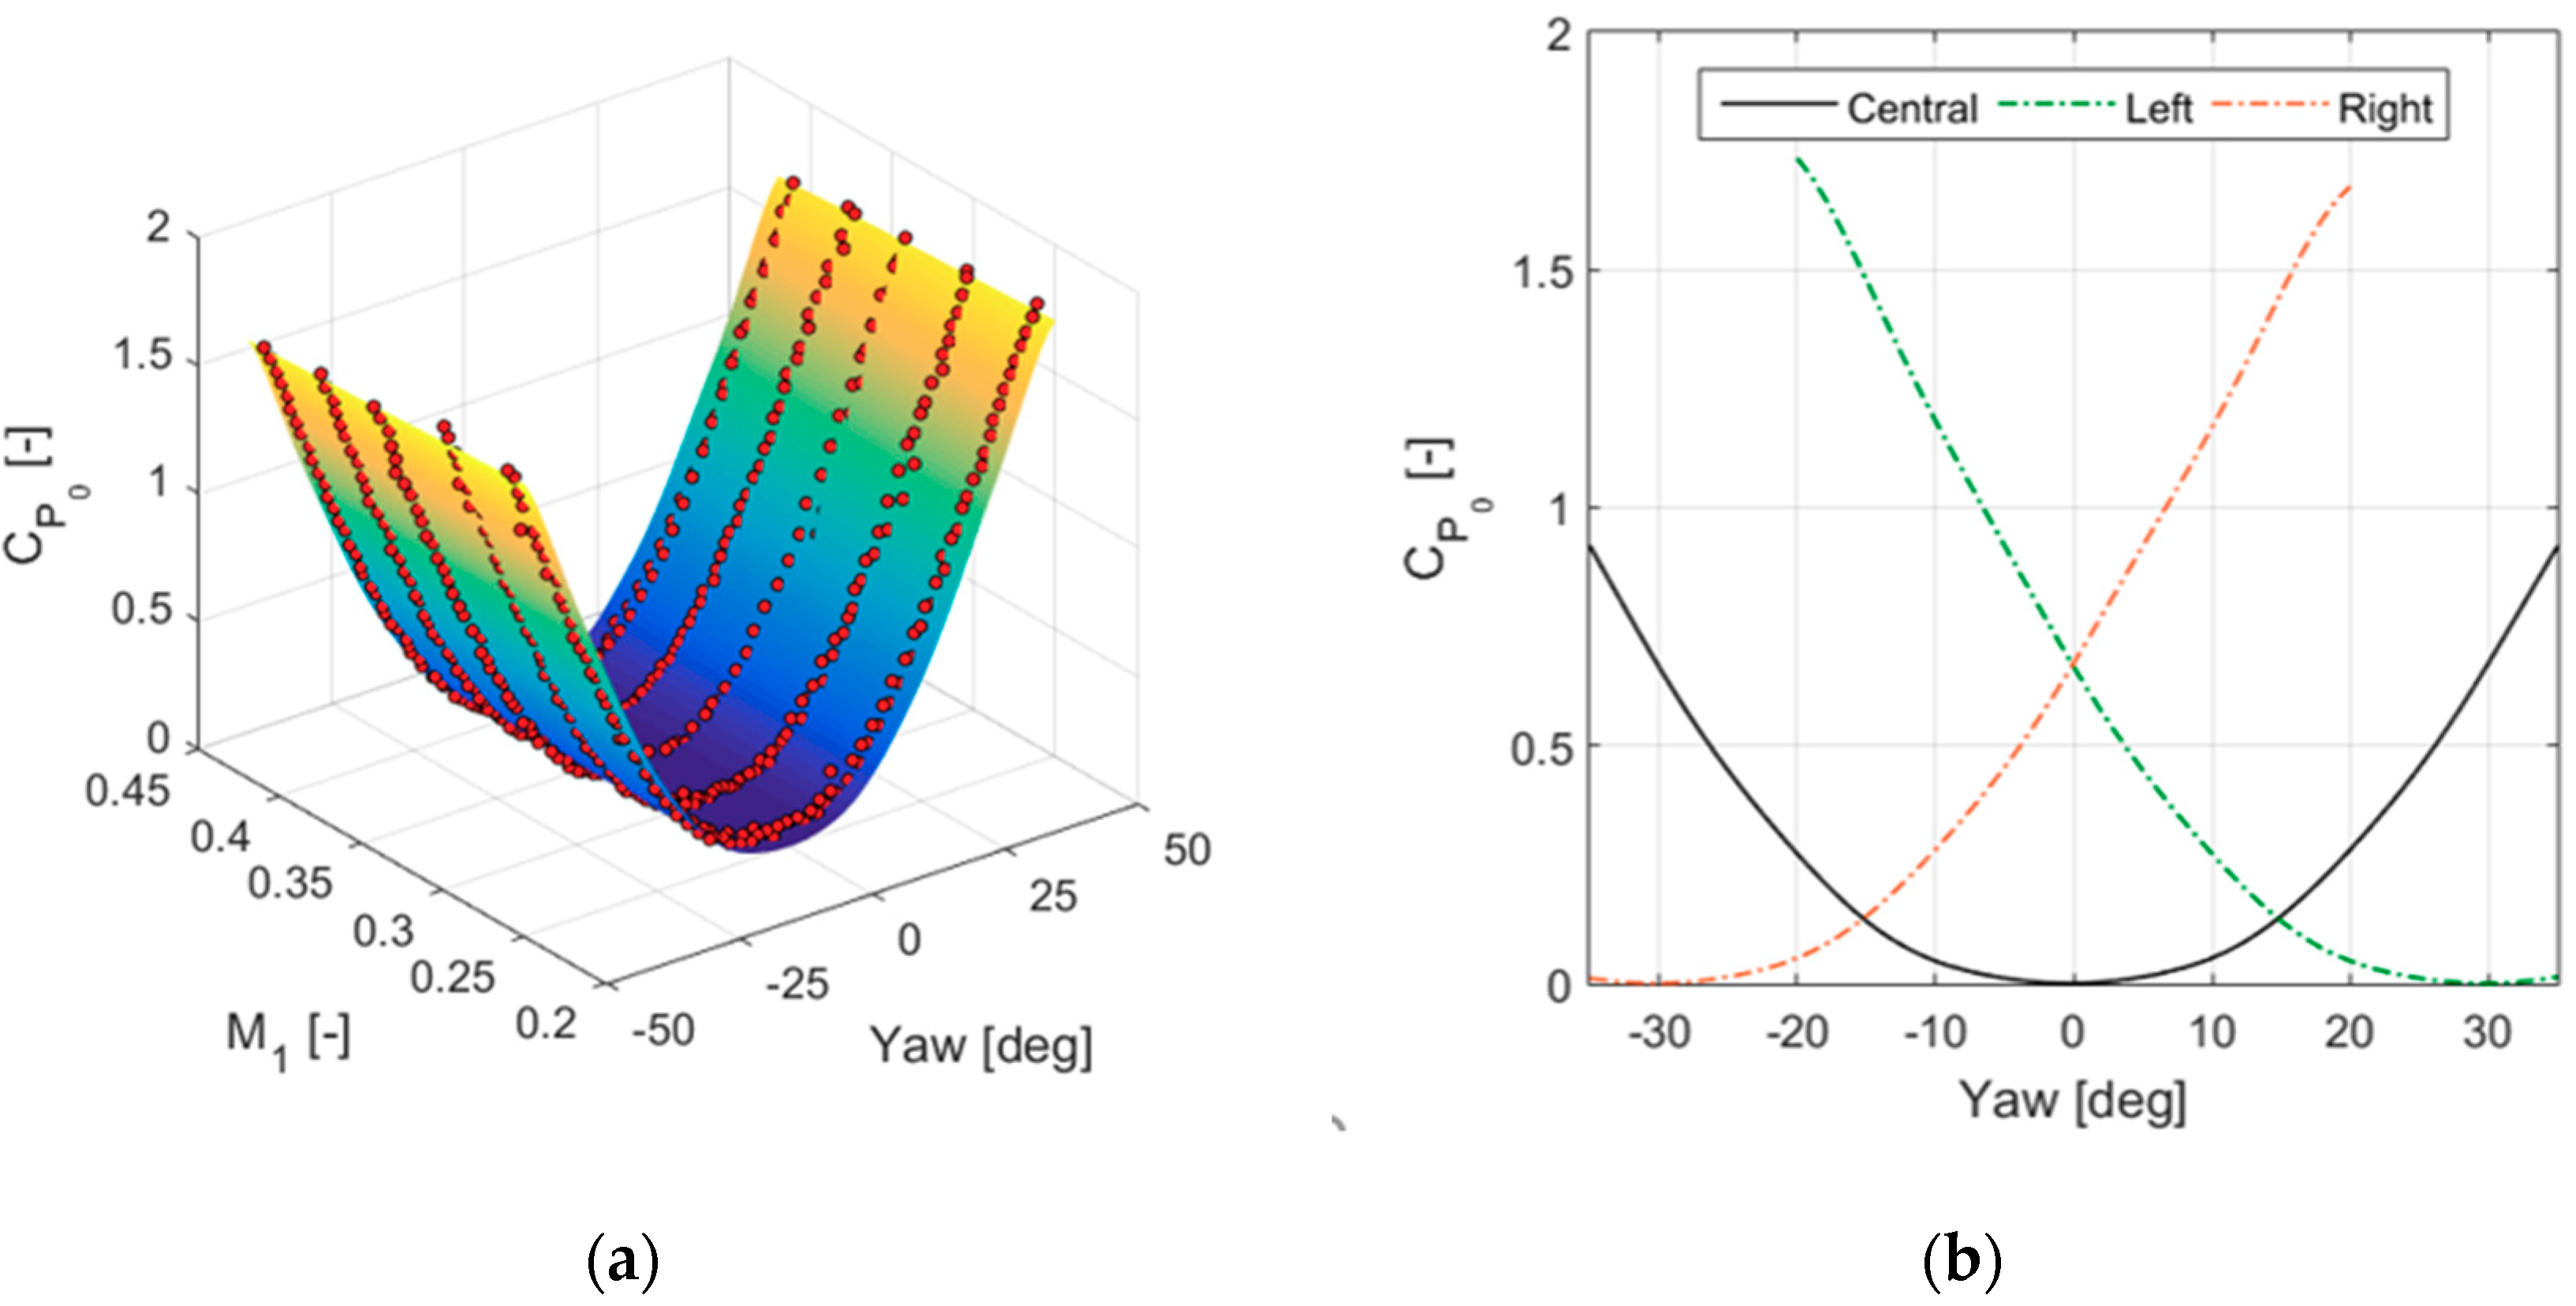
Following the static calibration of the sensor, an aerodynamic calibration of the probe performed in situ in the S-1/C wind tunnel aimed at determining the pressure recovery coefficient CP0 of the probe with respect to the yaw angle (yaw = −50:1:50 deg) and for five freestream Mach numbers (M1 = 0.25−0.42). For each angular position of the probe and for each Mach number, the output signals Vp and Vs are acquired for 4 s on a 14-bit acquisition system set to a sampling frequency of 250 kHz. After applying the static calibration of the sensor, the pressure recovery coefficient CP0 of the probe is computed using Equation (3), with Pp being the pressure measured by the probe, P0 the reference total pressure measured at the inlet of the test section and Ps the static pressure measured by wall-static pressure taps located in the same measurement plane as the probe. A surface is subsequently fit to the obtained calibration data, as shown in Figure 2a.
C P 0 ( Yaw ,   M 1 ) = P 0 P p ( Yaw ,   M 1 ) P 0 P s
Given that the operating conditions of the S-1/C wind tunnel (including the rotational speed of the wake generator) can be kept stable over a sufficiently long period of time, the aerodynamic calibration properties of this single sensor probe can be further exploited as if a conventional three-hole directional probe was used. By rotating the probe at two symmetric angular positions, the data recordings will be equivalent to those obtained from the left, right and central pressure ports of a conventional three-hole directional pressure probe although the time correlation between the three signals is lost in this configuration. As a compromise between sensitivity and calibration range, the angular displacement of the virtual left and right pressure ports is chosen as 30 deg for the present study. Given the aerodynamic calibration range of ±50 deg, the resulting virtual three-hole mode calibration range is limited to ±20 deg. In order to determine the angular characteristics of the virtual three-hole probe, the aerodynamic calibration data is shifted by the angular displacement of +30 deg for the left hole, and −30 deg for the right hole (Figure 2b), and the usual directional probe calibration coefficients Kyaw, Ktot and Kstat are then numerically reconstructed for each Mach number.
During the experiments with rotating bars and for each angular position of the virtual three-hole probe, the Vp and Vs signals are acquired for 4 s on a 14-bit acquisition system set to a sampling frequency of 250 kHz. After low-pass filtering the raw signals at 30 kHz in order to minimize high-frequency noise and the influence of the recessed cavity resonance peak, the filtered Vp and Vs signals are ensemble-averaged for each full wake generator rotation and subsequently phase-locked averaged for each bar passage. The static calibration of the sensor yields phase-locked averaged pressure values for each angular position of the probe and the angular calibration described here-above consequently yields yaw-corrected and phase-locked averaged total pressure, static pressure and flow angle distributions for each bar passage. The achieved 95% confidence interval uncertainty on the corrected total pressure is 78.4 to 92.2 Pa, and on the corrected flow angle 1.1 to 5.2 deg, mainly depending on the Mach number and resulting Reynolds number (the higher the Reynolds and Mach number, the lower the propagated uncertainty).

3. Results and Discussion

3.1. Matrix of Experiments

The experiments were carried out at ambient inlet total temperature (T01 ~ 285 K) and at the natural free-stream turbulence intensity of the wind tunnel at the inlet of the test cascade Tu = 0.8% [11]. The effect of varying free-stream turbulence intensity Tu on the bar wakes was not investigated in the present study in an effort not to further complicate an already complex problem. The measurements were performed for four rotational speeds of the spoked-wheel type wake generator (Ωrot = 1500−3500 RPM) with 96 bars installed, and for each rotational speed, three isentropic inlet Mach numbers ranging from M1,is = 0.26 to M1,is = 0.41 were tested, which are values typically encountered in mid to high subsonic low-pressure turbines. Due to time constraints, the Reynolds number effect on the bar wake characteristics was not investigated independently from the Mach number and all tests were carried out at (roughly) the same reference inlet total pressure (P0,ref = 11,300 ± 180 Pa). Hence, the Reynolds number based on the blade chord length only changes proportionally with the Mach number, ranging between Re1,is = 40,000 at M1,is = 0.26 and Re1,is = 58,000 at M1,is = 0.41.
Table 1 summarizes the matrix of experiments along with the obtained flow coefficients. A factor four is achieved between the lowest (ϕ = 0.44) and highest (ϕ = 1.60) achieved flow coefficient, ensuring a satisfactorily spread out experimental test matrix.

3.2. Characterization of the Incoming Wakes

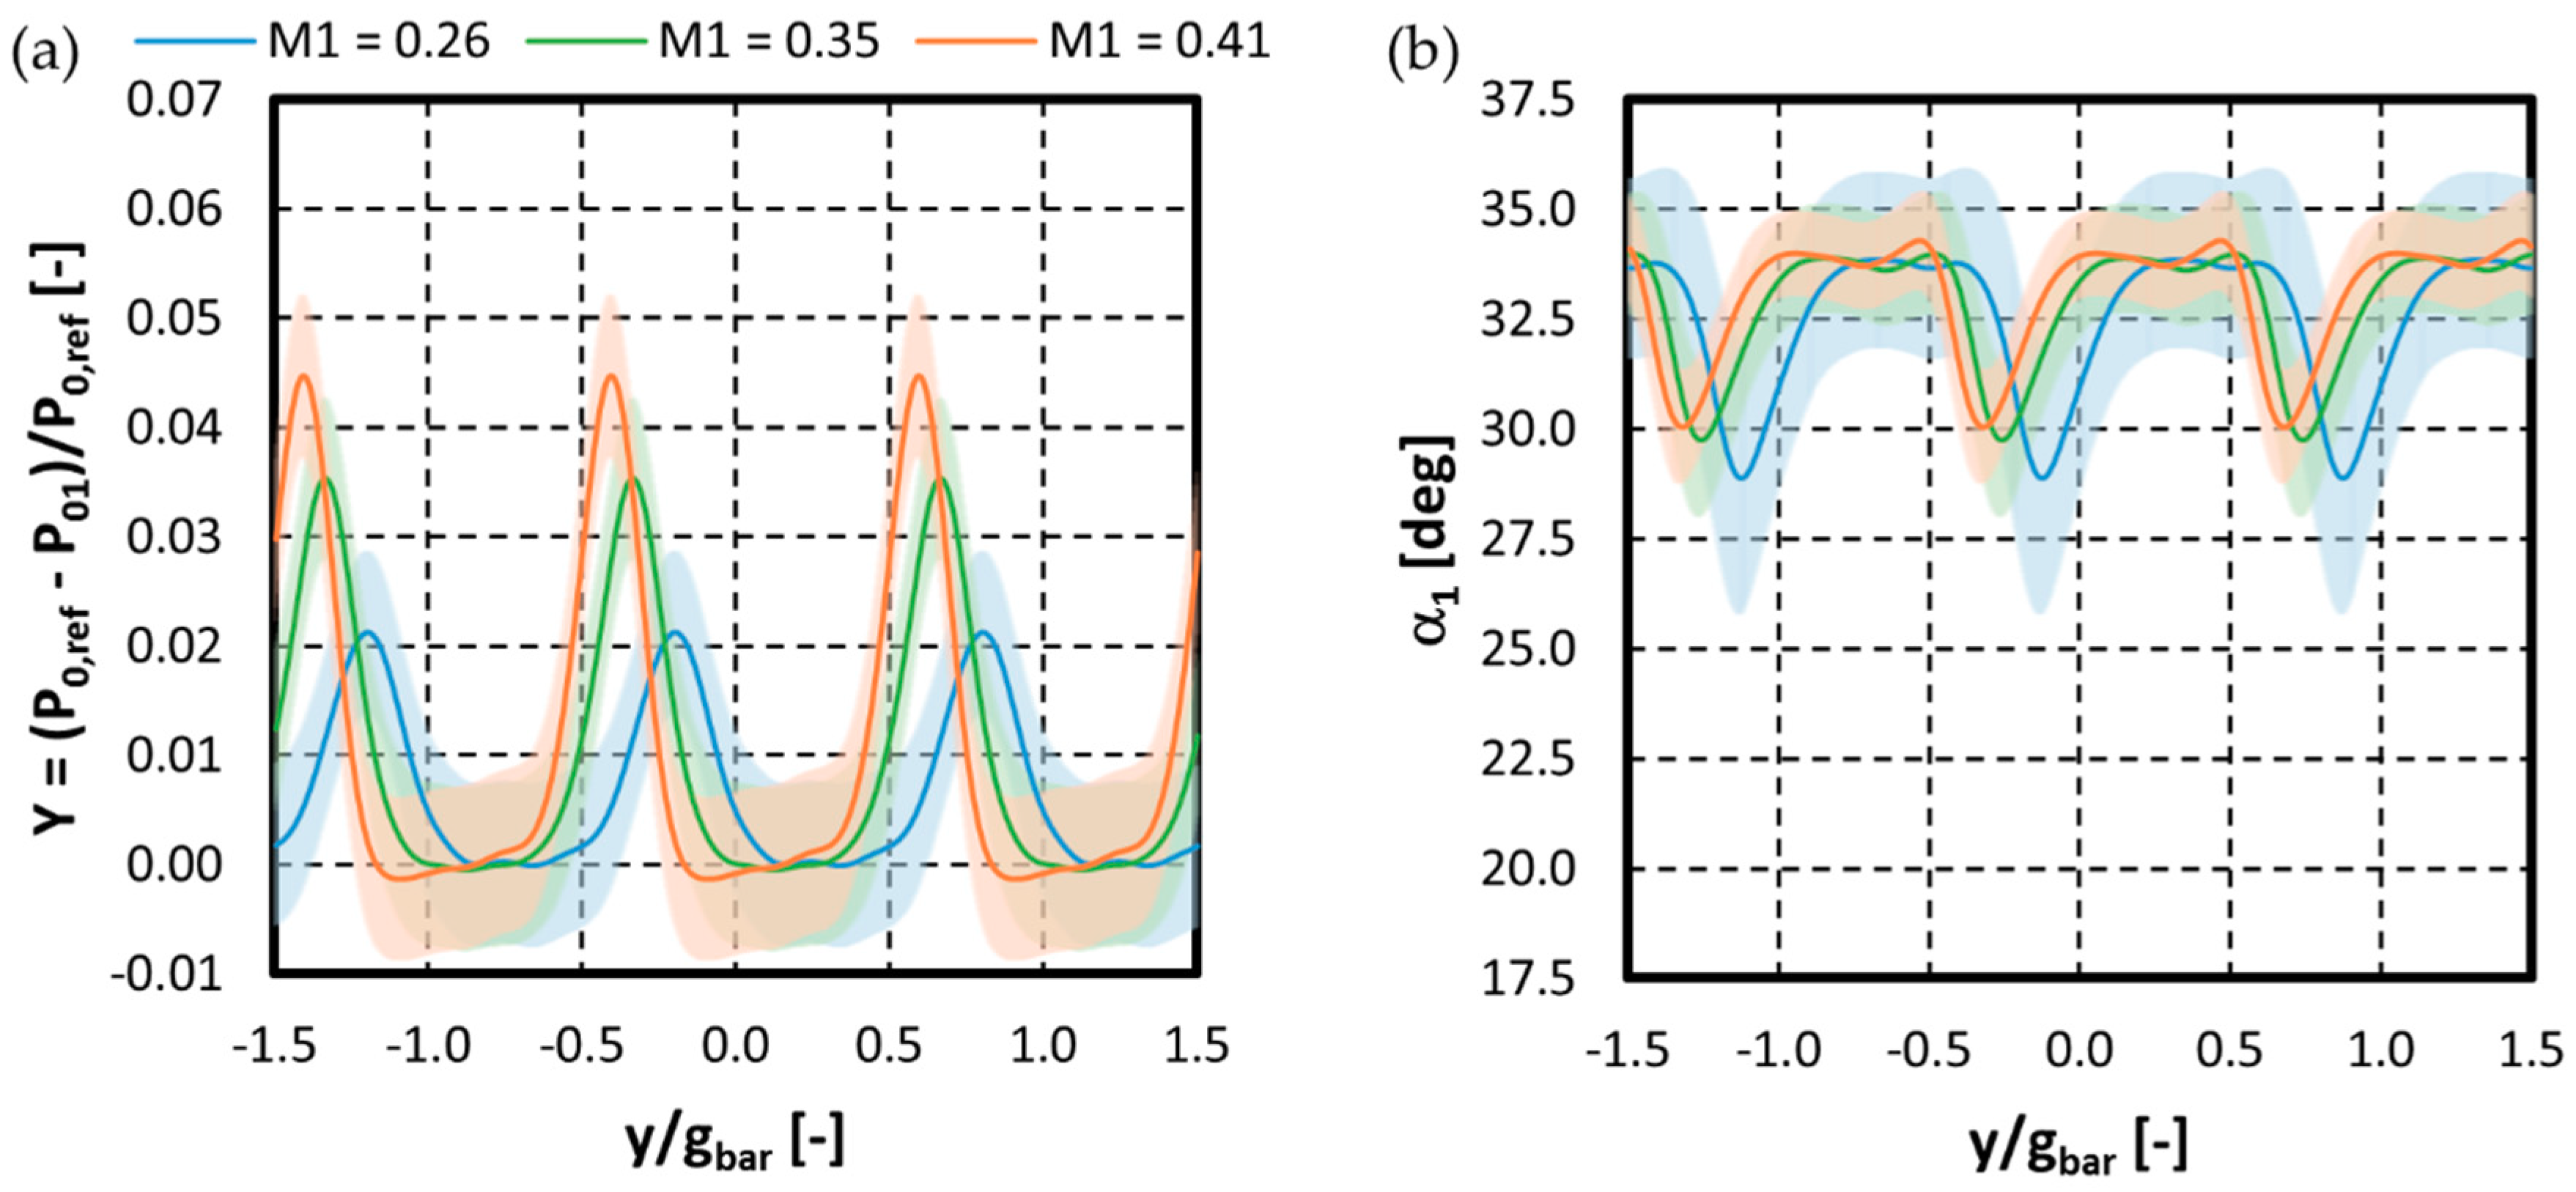
The phase-locked averaged total pressure and inlet flow angle wake profiles are presented for three isentropic inlet Mach numbers M1,is and for two wake generator rotating speeds Ωrot in Figure 3 and Figure 4. The abscissa represents the bar passages normalized by the bar pitch while the ordinate represents the total pressure deficit in the wake normalized by the reference total pressure measured upstream of the rotating bars (a) and the absolute inlet flow angle (b). The nominal inlet flow angle of the cascade for steady inflow conditions (without periodic incoming wakes) ranges between α1 = 34.8 and 34.5 deg depending on the inlet Mach number. For the sake of clarity and completeness, three bar passages are repeated and the 95% uncertainty intervals are also shown as colored bands around the obtained pressure and flow angle wake profiles.
From these plots, one can clearly observe that the normalized total pressure deficit Y = ∆P0/P0,ref in the wake increases as the Mach number and rotational speed of the wake generator increase. Conversely, the amplitude of the inlet flow angle variation inside the wake increases the wake generator speed increases, but decreases as the Mach number increases. For all investigated cases, one also notices that the inlet flow angle does not reach the nominal value of 34.8–34.5 deg in between wake passing events, suggesting an effect of the rotating bar rig on the mean inlet flow angle even between consecutive wake passing events.
For the two highest inlet Mach numbers (M1,is = 0.34 and 0.41), negative values of the normalized total pressure deficit can be locally observed for all rotating speeds, meaning that the total pressure measured by the probe can be locally slightly higher than the reference total pressure measured upstream of the rotating bars. Coton [4], Funazaki et al. [3] and Dong et al. [12] have related this phenomenon to absolute velocity overshoots at the junction of the wake and the freestream conditions. As this effect seems to be primarily depending on the inlet Mach number, a possible influence of the potential field of the blade cascade on the velocity profile of the wake is also a possible explanation for these local velocity overshoots, as explained by Arts [13]. Finally, an eventual small zero drift of the absolute pressure sensor during the experiment should also not be discounted, even though sensor zero drifts were periodically checked and corrected under zero flow conditions at various moments during the test campaign.
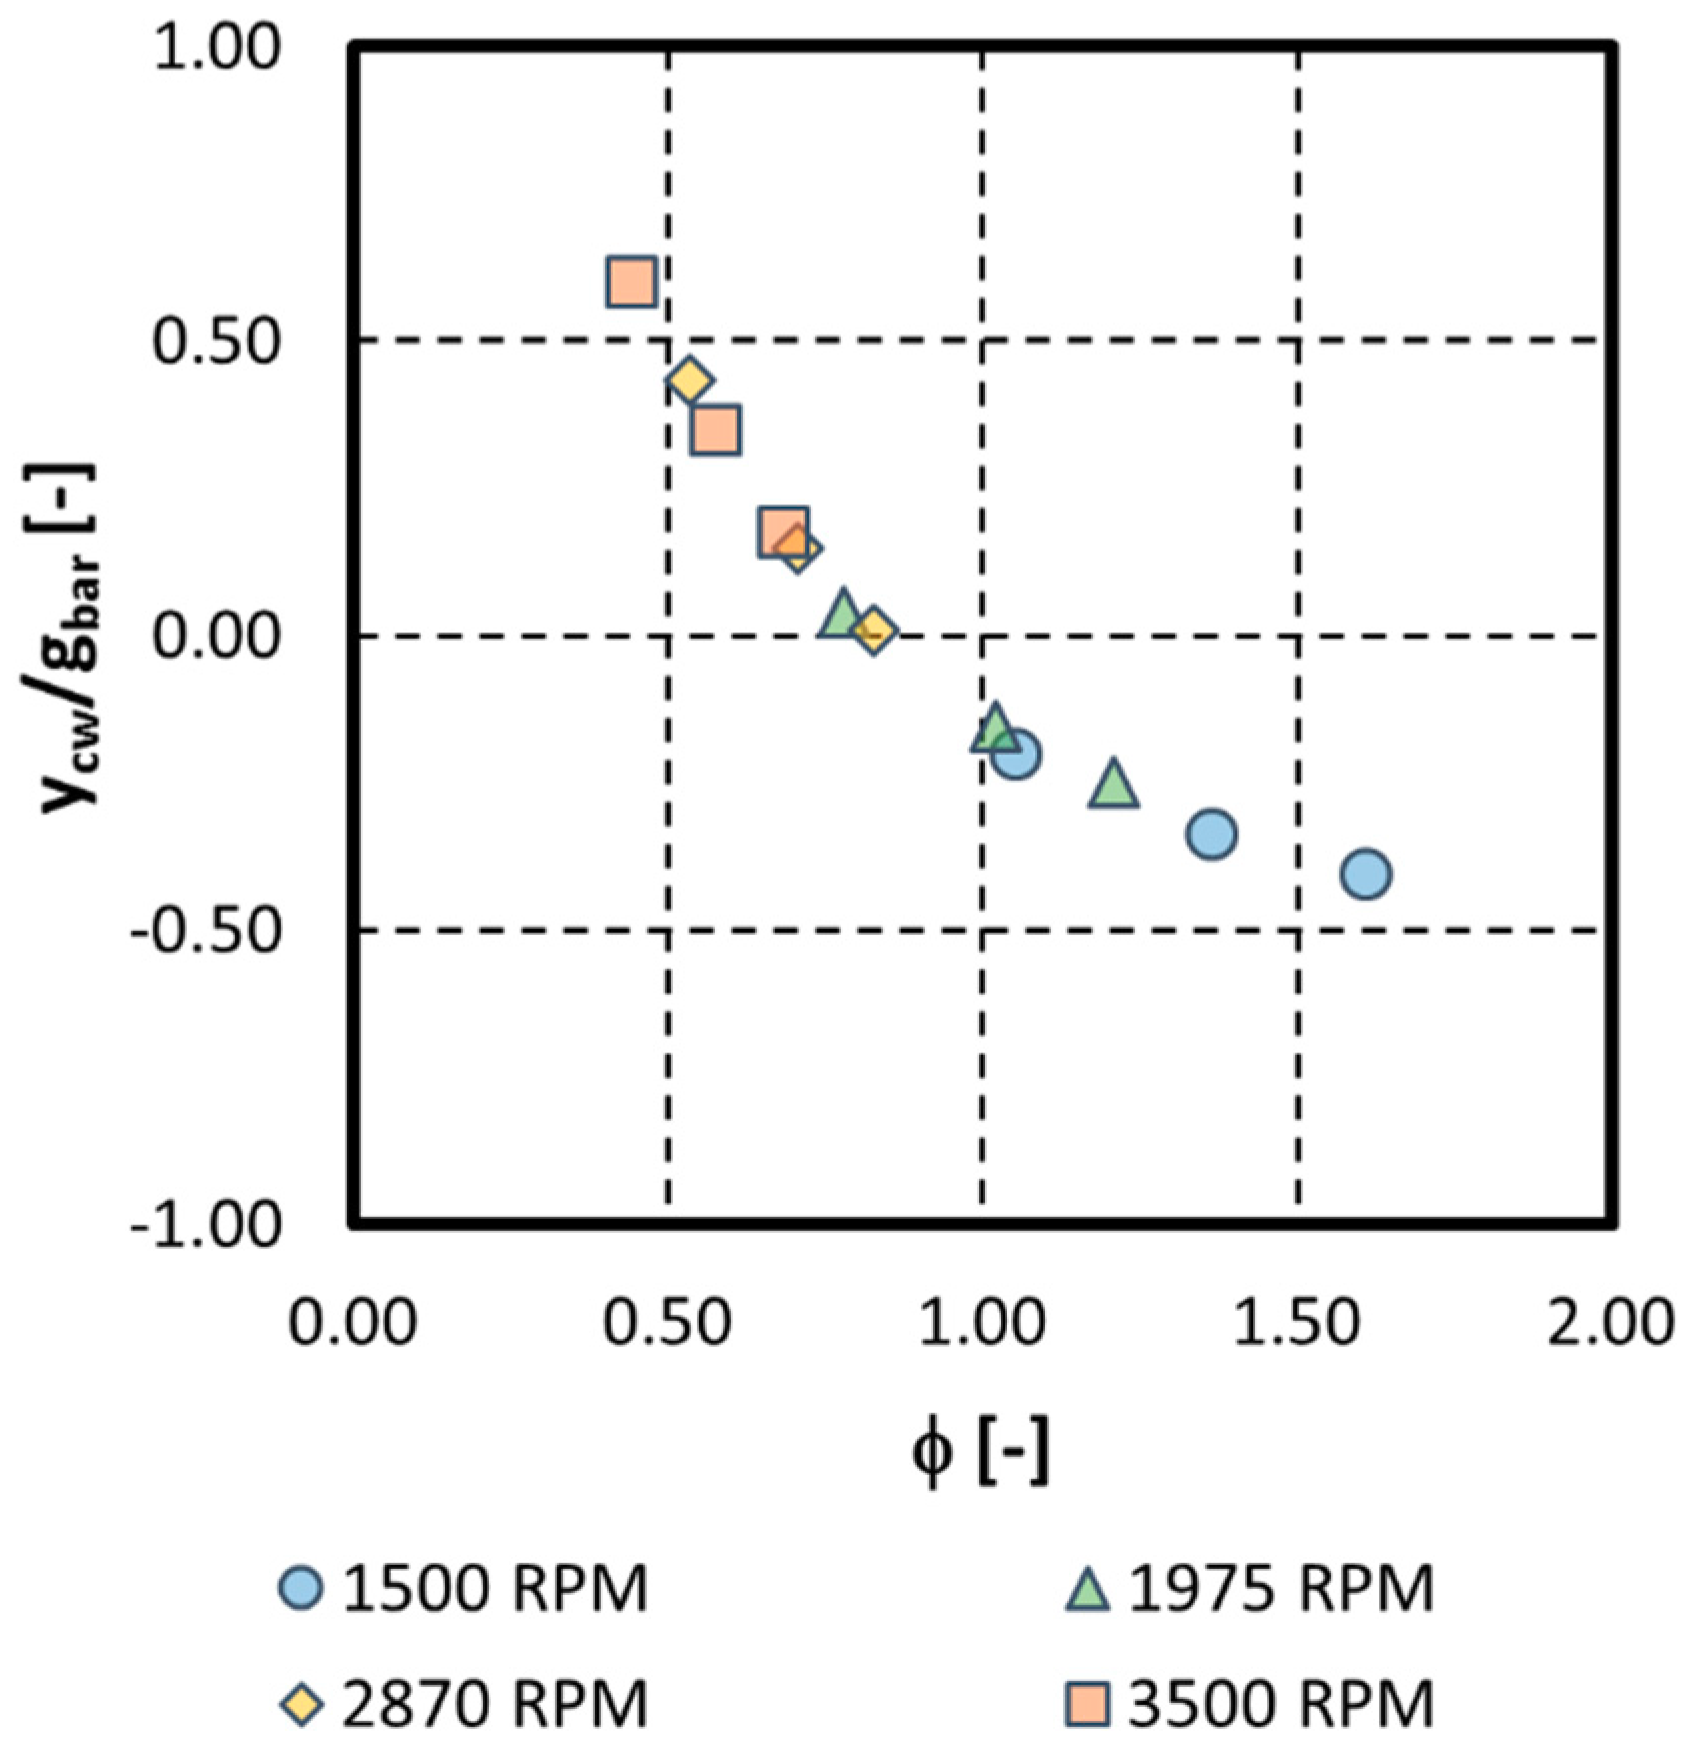
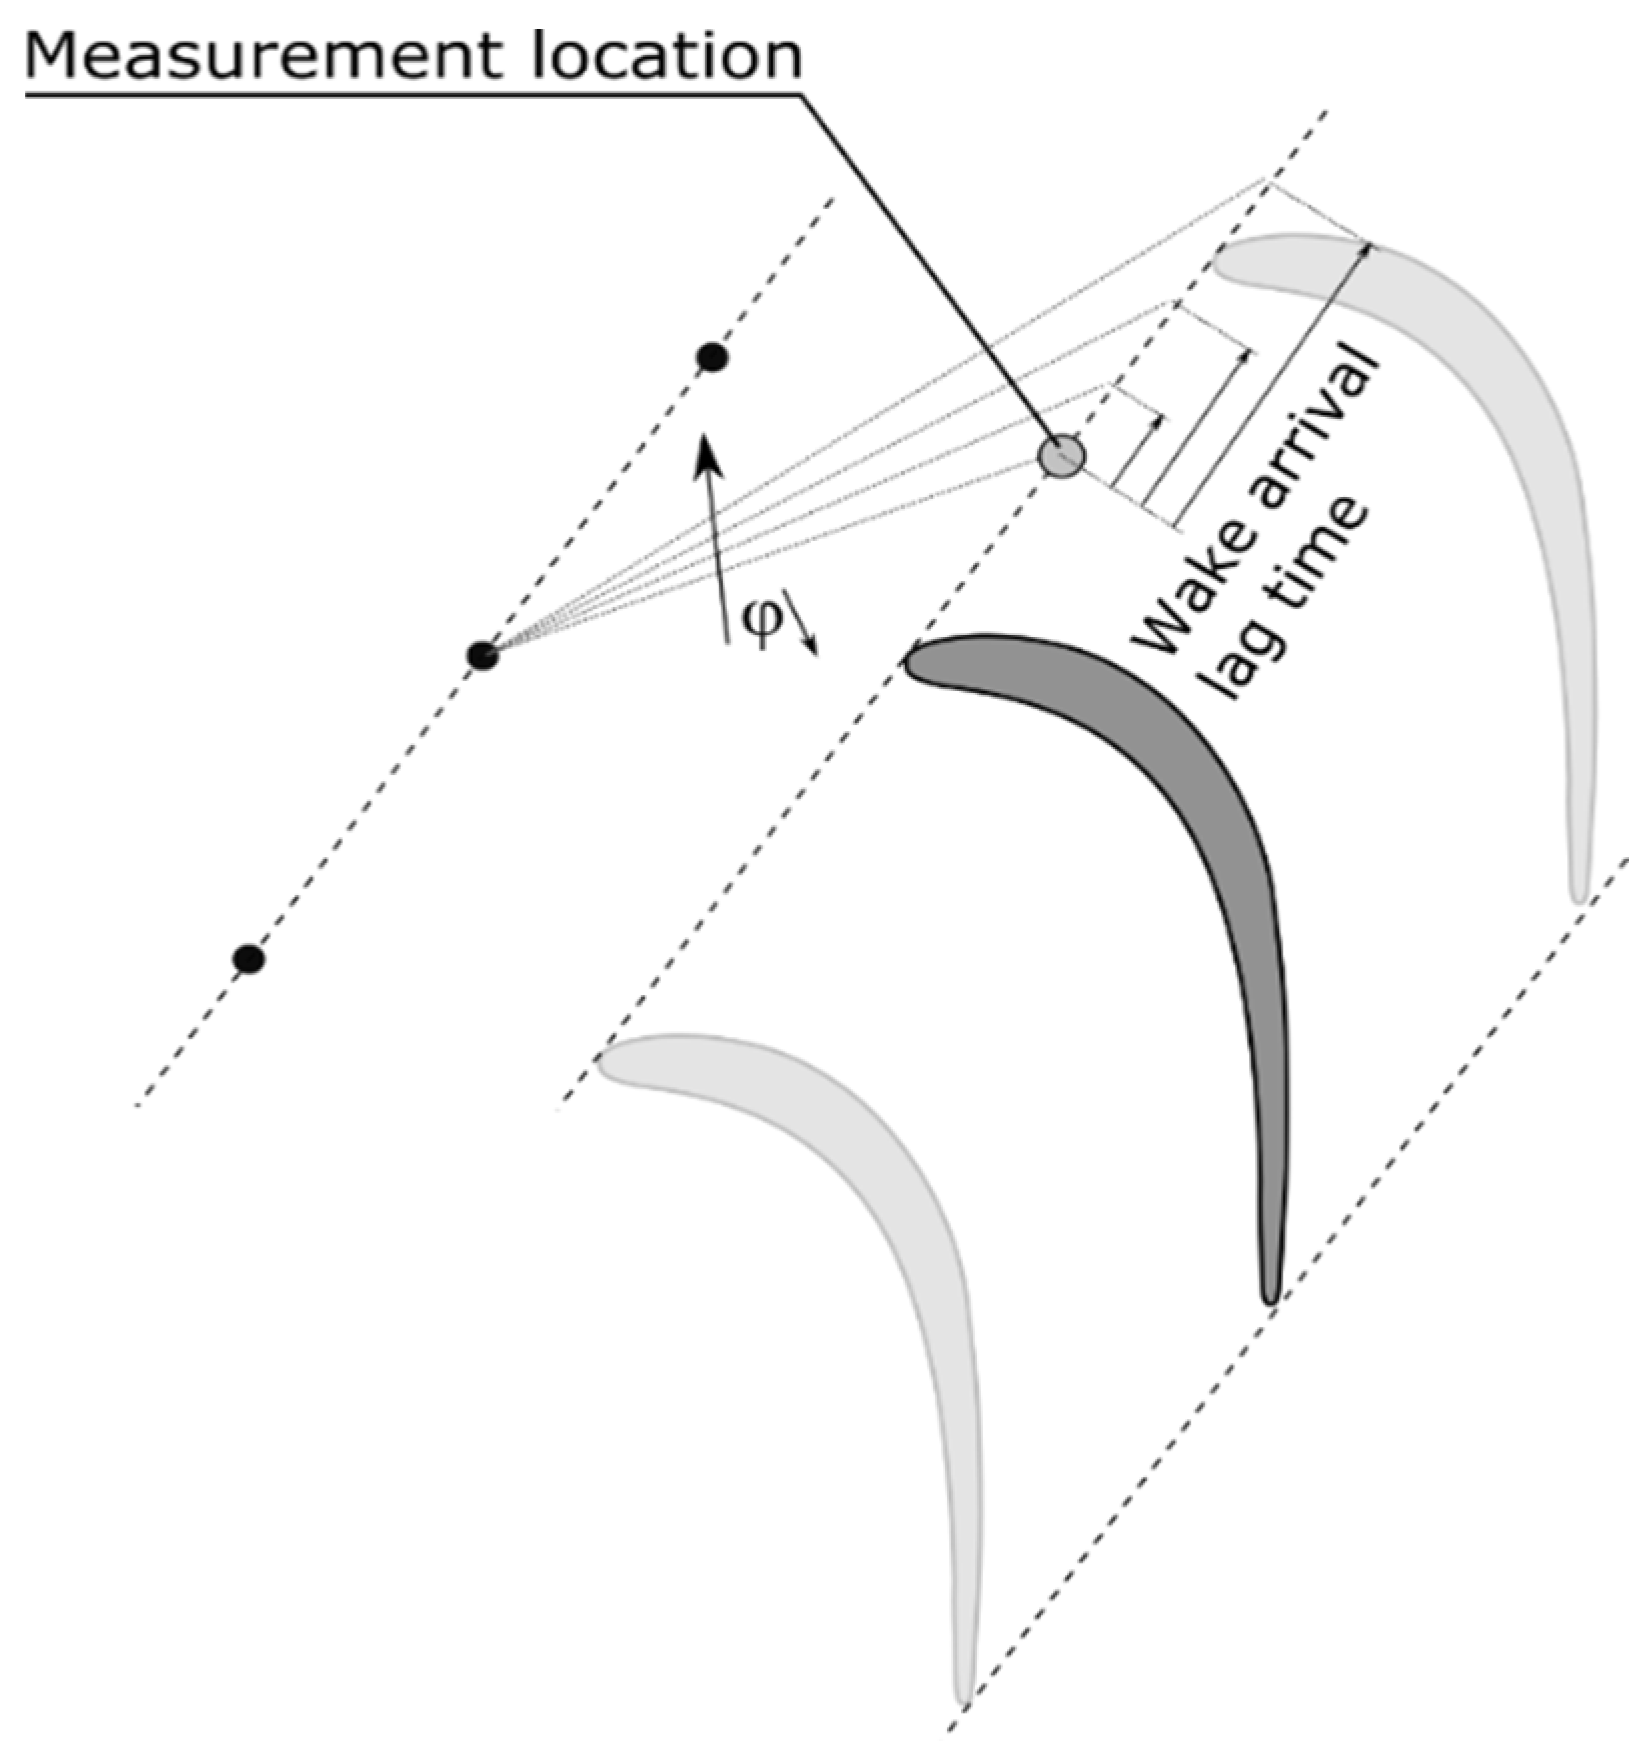
From the previous figures, one can observe that, as the flow coefficient decreases for higher rotational speeds and lower inlet Mach numbers, the position of the center of the wake (ycw) is shifting towards higher values of the normalized bar pitch y/gbar, as shown in Figure 5. This displacement is caused by a lag in the wake arrival time at the measurement location as the wake propagation length xw from the bar to the leading edge plane increases as the flow coefficient decreases (Figure 6).
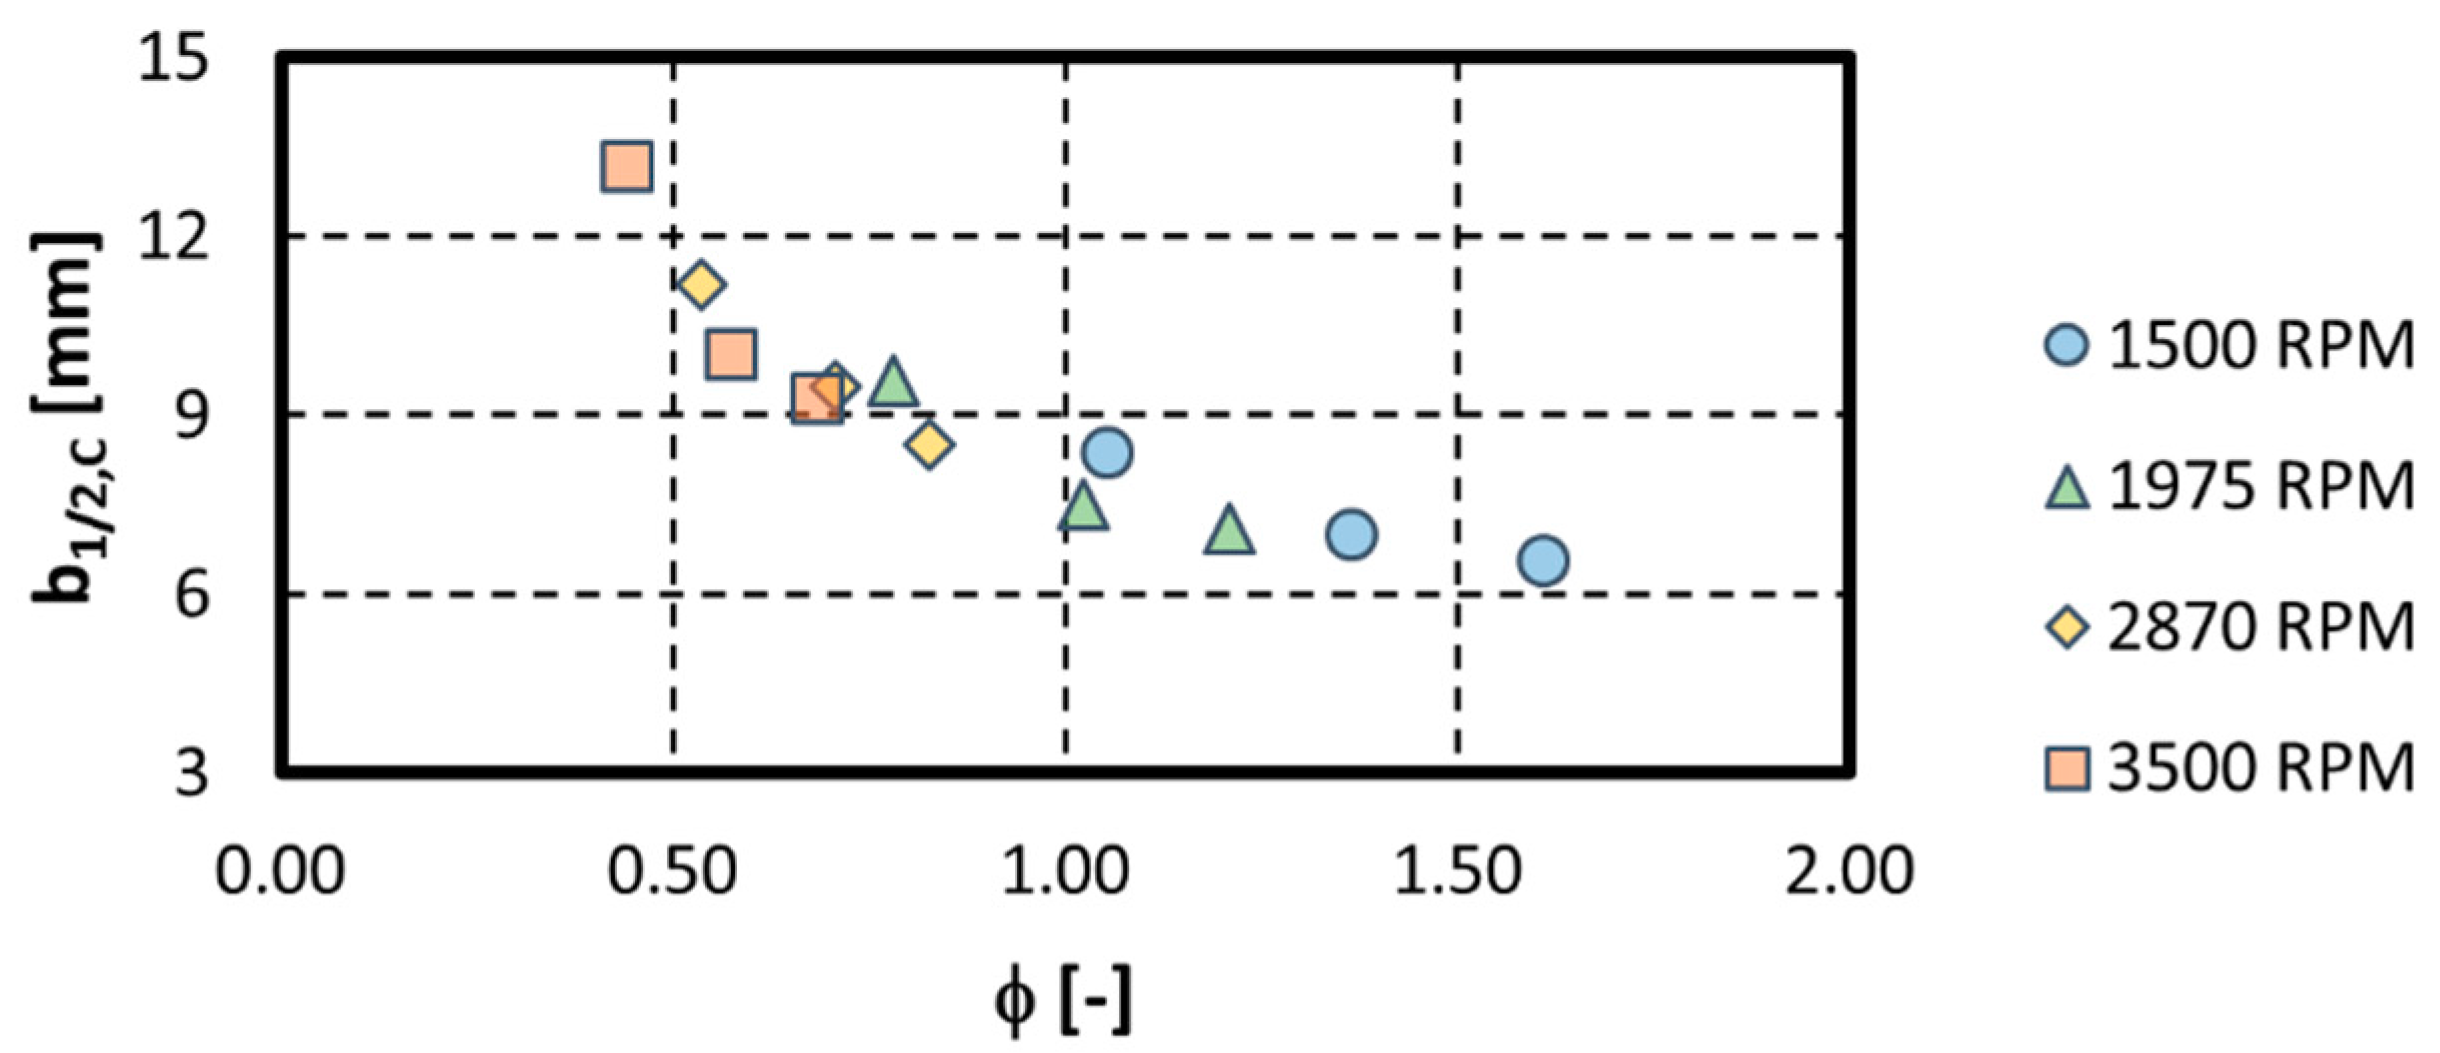
The wake profiles can be further characterized by the wake half-width b1/2, as described by Coton [4] and Dullenkopf et al. [14]. Two definitions of the wake half-width have been used. The first definition is the same as the one used by Coton [4] in his own characterization of incoming wake profiles. This wake half-width b1/2,C is evaluated by means of the normalized total pressure wake profiles measured by the probe and is a direct representation of the wake duration over one bar passing period. The wake half-width b1/2,C presented in Figure 7 increases monotonously with decreasing flow coefficient, indicating that the wake duration per bar passing event is mainly dependent on the inlet velocity triangle. This wake half-width definition is an important parameter for the wake-induced transition process since it corresponds to the part of higher unsteadiness during the wake passing period.
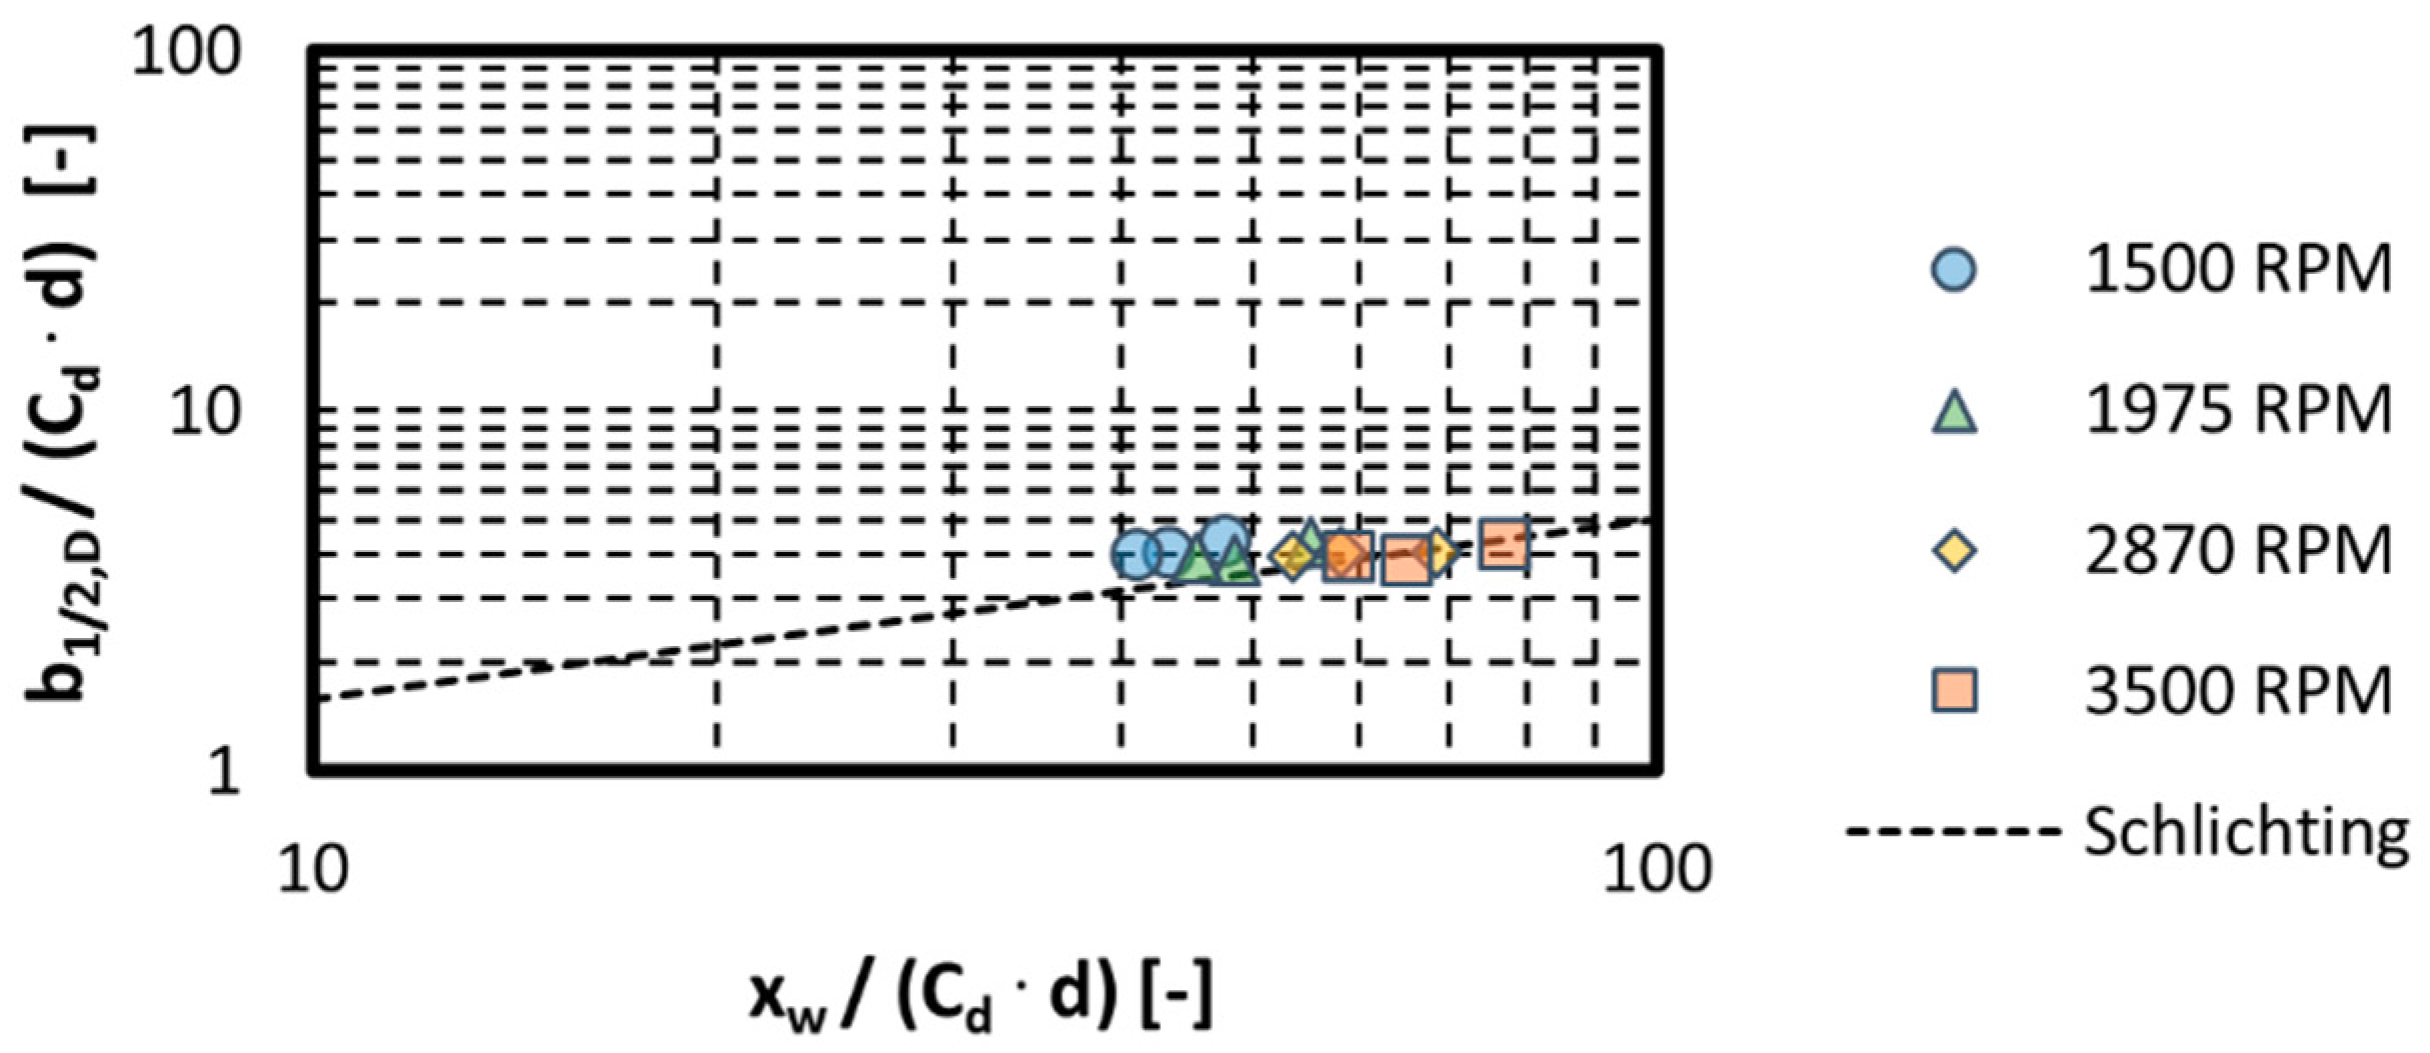
The second wake half-width b1/2,D is defined in the relative frame of reference in an effort to compare the obtained wake half-widths with correlations derived from measurements in the wake of fixed cylinders in a cross-flow [15]. This required a transformation of the absolute velocity to the relative frame and also required a projection of the obtained relative velocity profile onto a plane perpendicular to the wake axis. The obtained half-width b1/2,D is shown in Figure 8 as a function of the wake propagation length xw. The results, shown along with the correlation used by Schlichting [15], match the correlation defined by Equation (4) quite well, especially if one considers all the measurement uncertainties and the transformations required to obtain the quantities b1/2,D and xw. From this definition of the wake half-width, one can conclude that the wakes shed by the rotating bars of the wake generator present a very good similarity with typical wake profiles of fixed cylinders in a cross-flow, as shown by Dullenkopf et al. [14].
b 1 / 2 , D = 1 / 2 · ( x w   C d   d ) 1 / 2
Finally, another parameter that was used by Coton [4] to characterize the periodic incoming wakes is the velocity deficit ratio in the wake, Vdef = ∆Vmax/V. As shown in Figure 9, the velocity deficit ratio in the wake Vdef seems to be mainly dependent on the bar-relative Reynolds number Rebar, which is the same conclusion drawn by Coton [4]. The best fit of the velocity deficit ratio with respect to the bar-relative Reynolds number is given by Equation (5) and corresponds to the dashed line in Figure 9. It is interesting to note that the slope of the fit matches with the slope of 0.0146 obtained by Coton [4] in his own characterization of incoming wakes, thus giving more weight to the conclusion made here above.
V def   [ % ] = 0.015 · Re bar 0.255

3.3. Comparison with Theory and Discussion

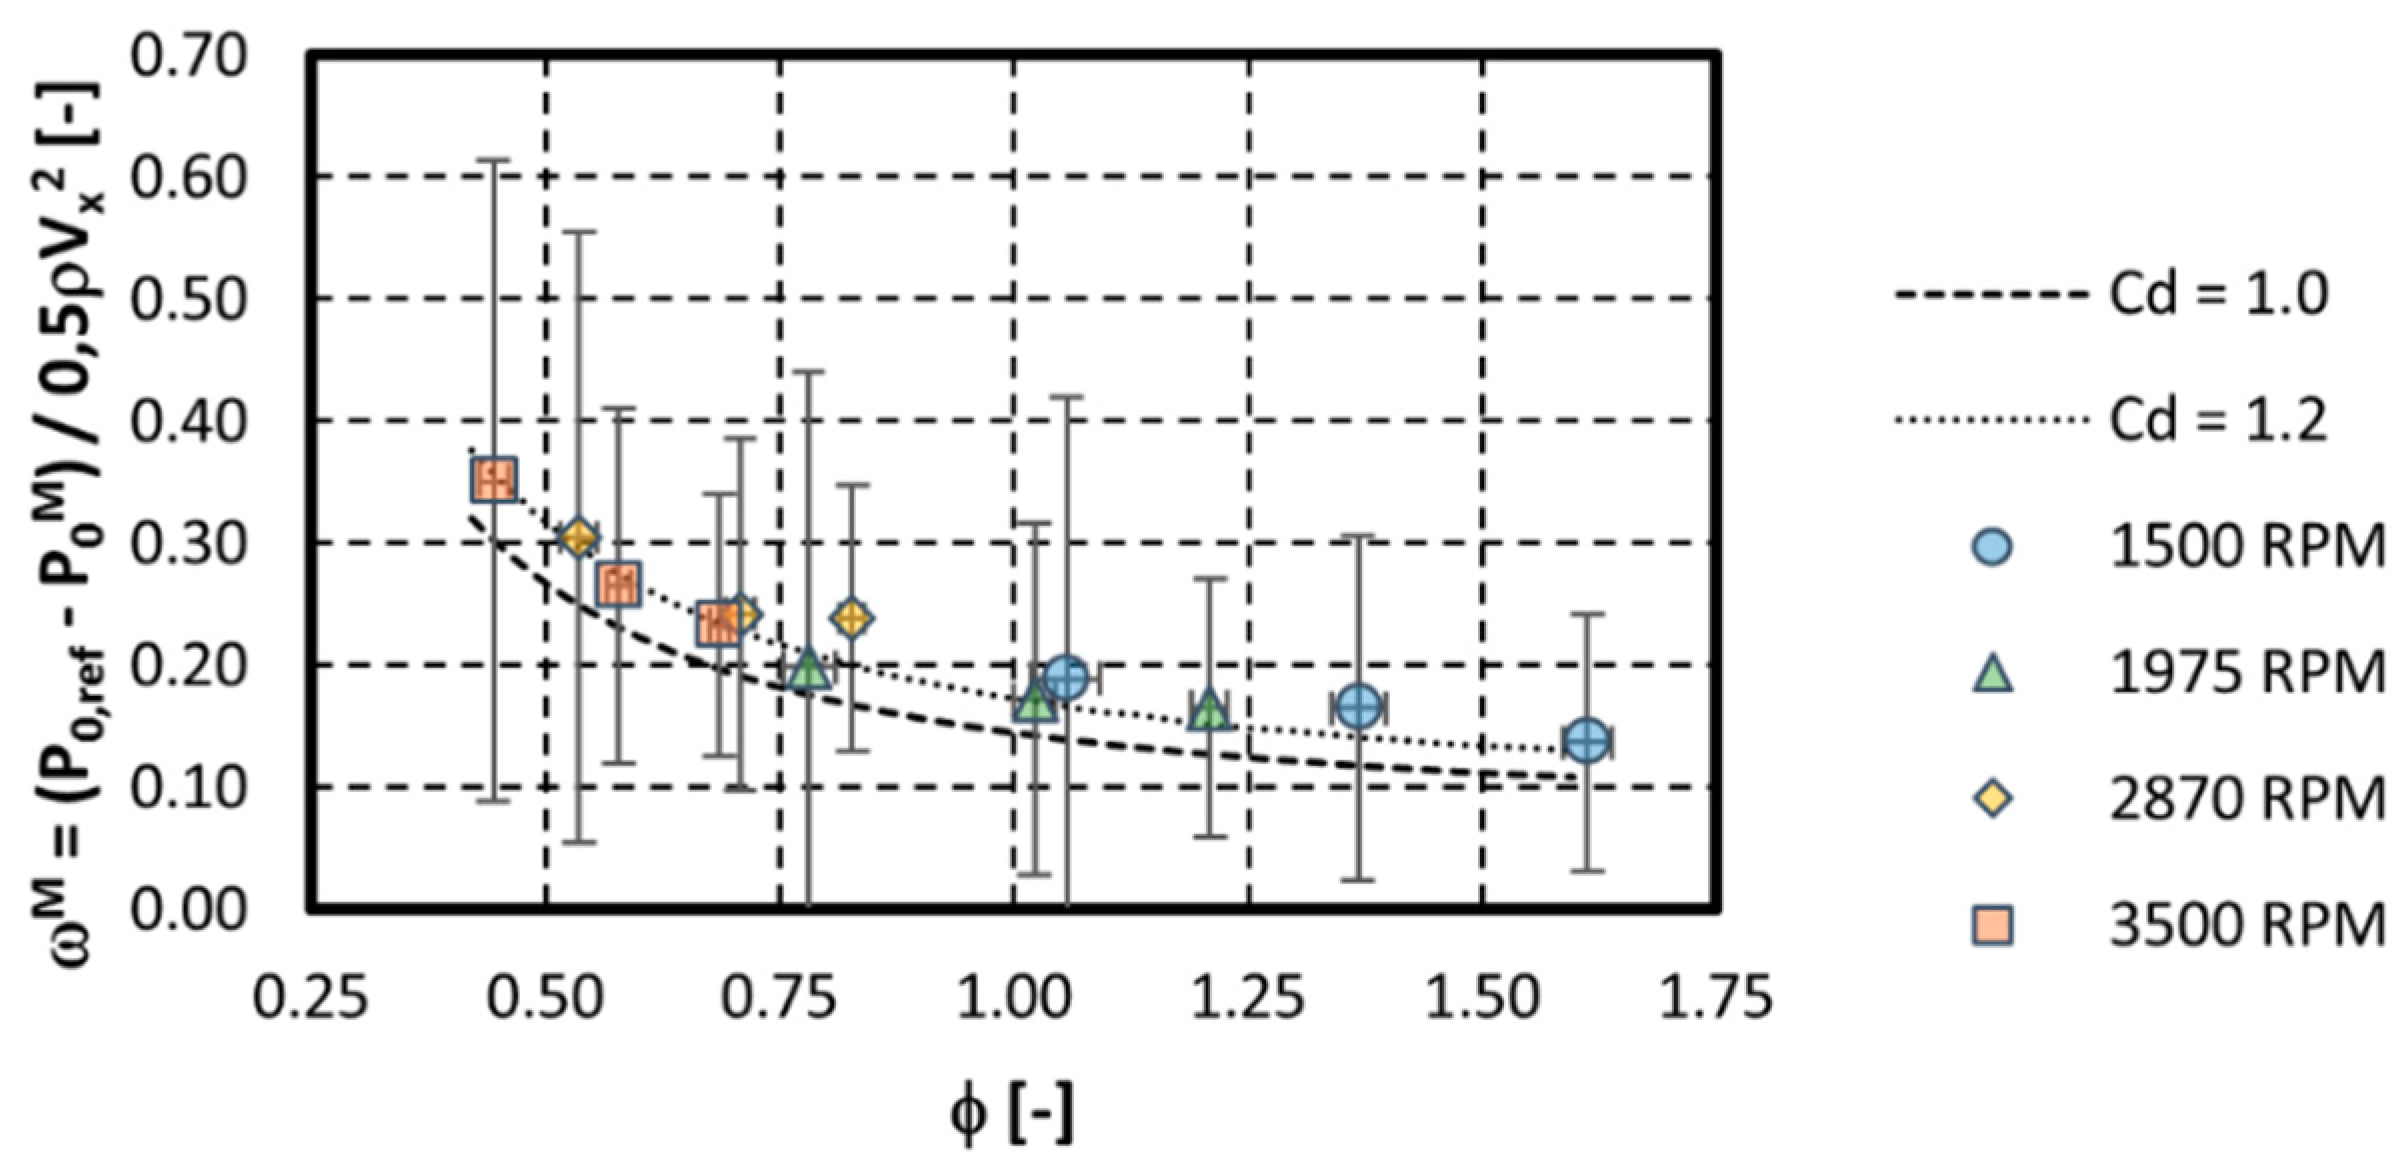
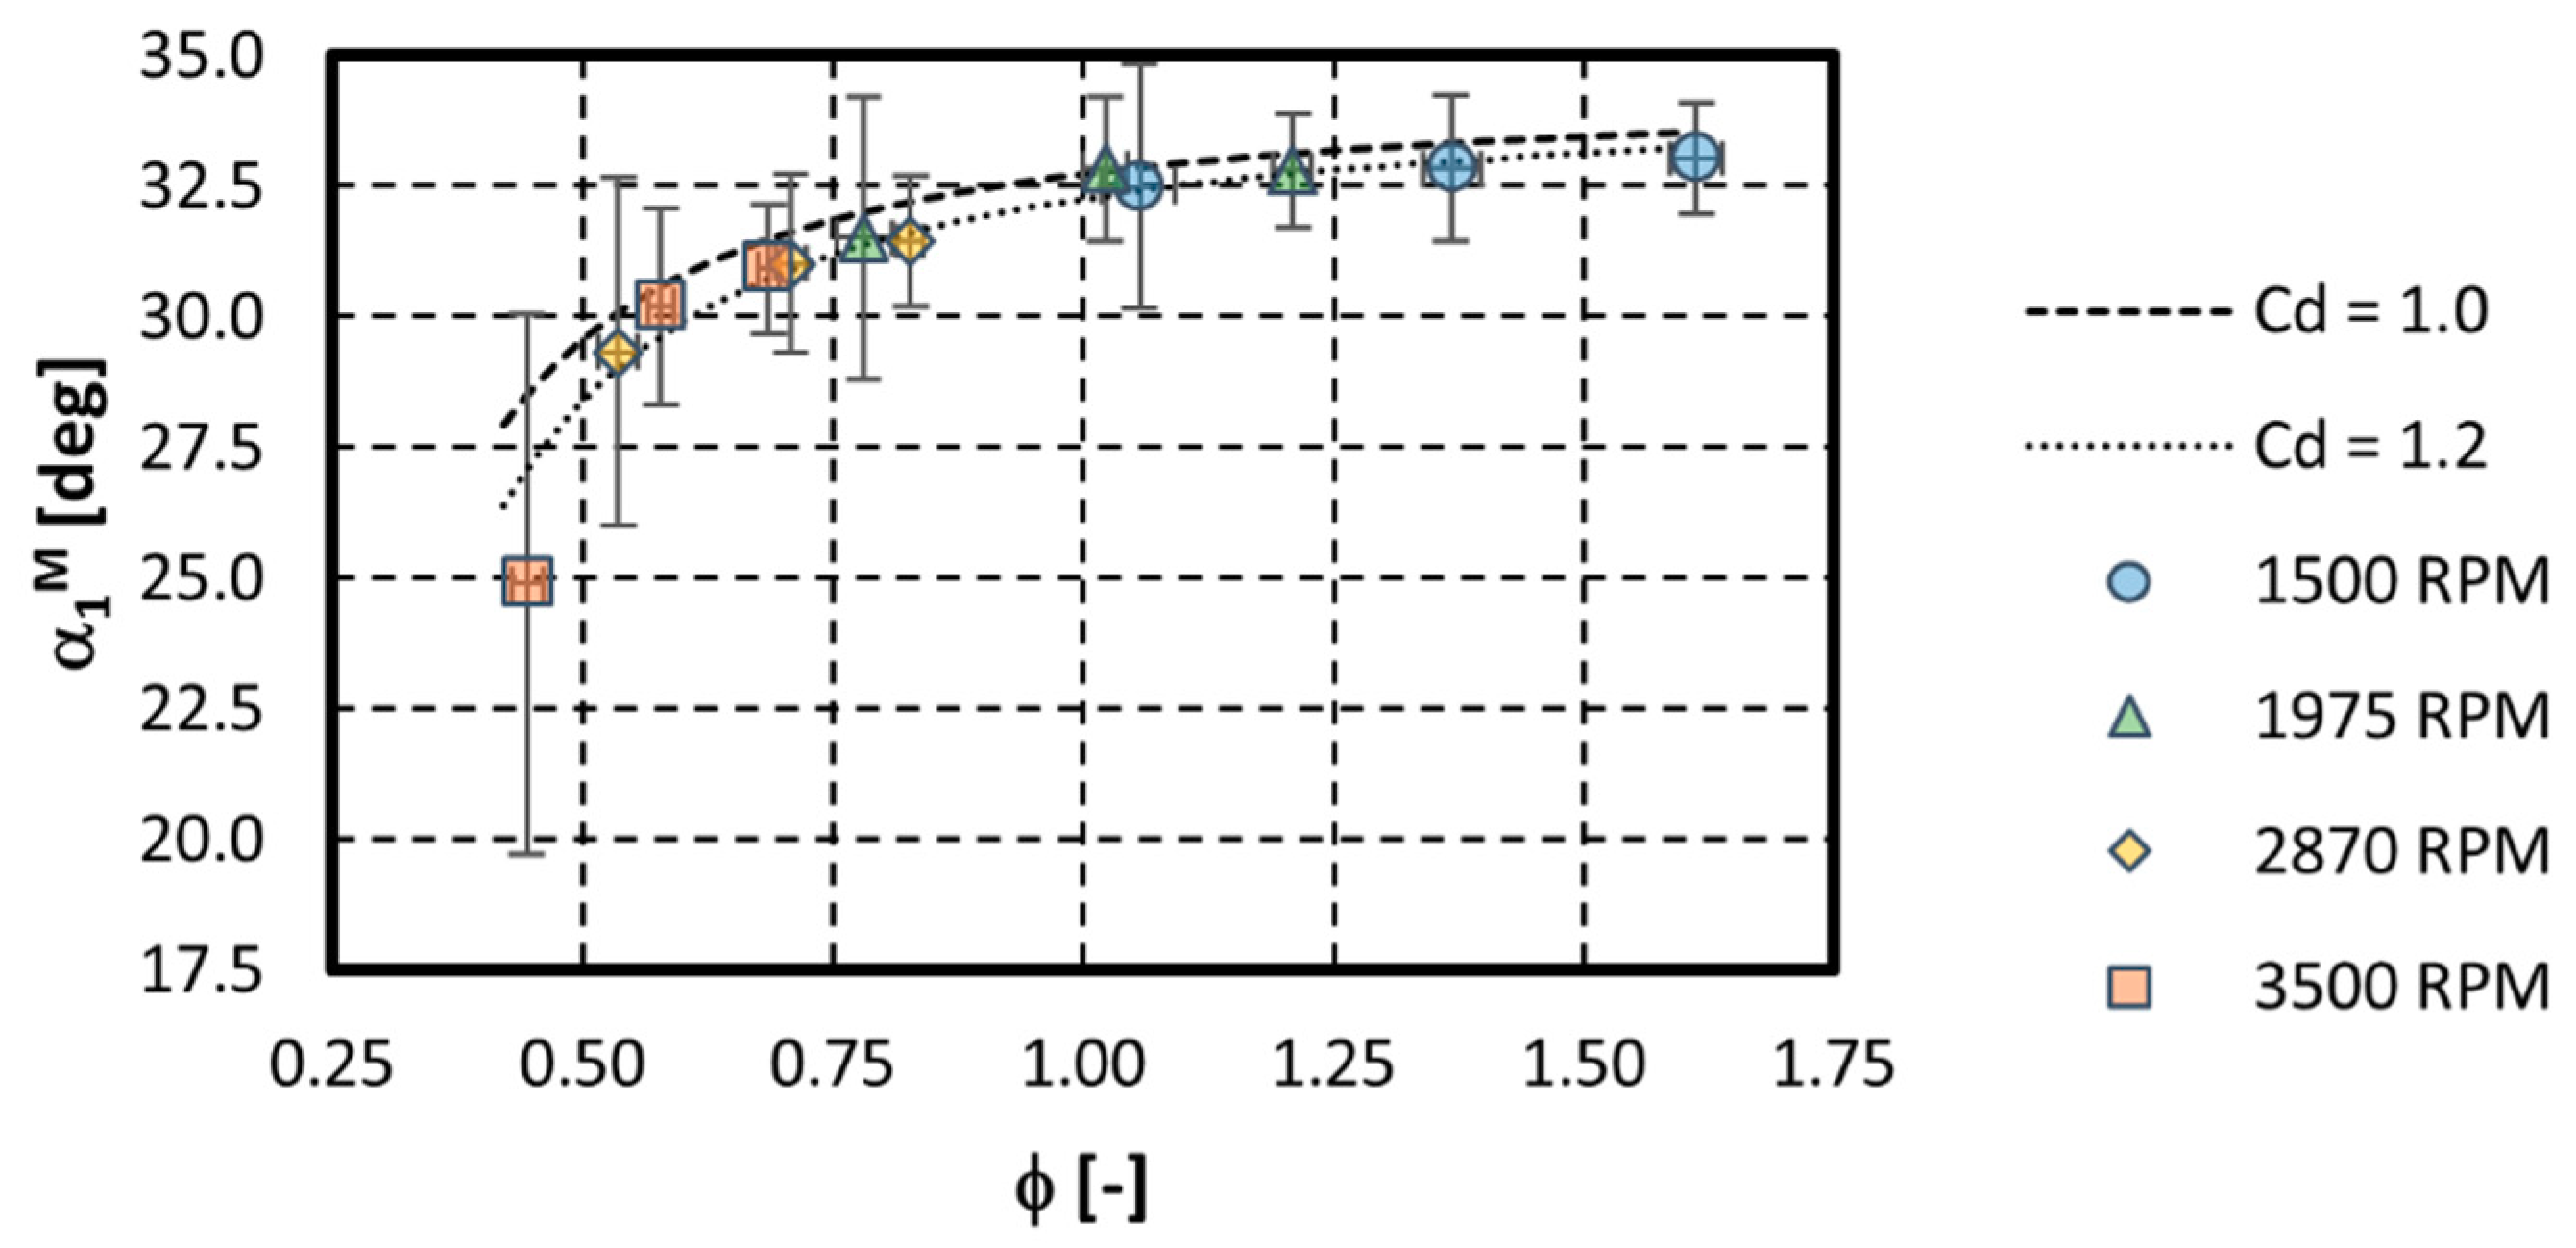
The phase-locked averaged total pressure and yaw angle fluctuations are mass-averaged over one bar pitch, yielding averaged total pressure loss coefficients ωM (Figure 10) and inlet flow angles α1M (Figure 11). The obtained results, plotted with their respective 95% uncertainty intervals and with respect to the flow coefficient ϕ, are compared with the theoretical results obtained from an incompressible control volume analysis for a cylinder drag coefficient Cd of 1.0. The reader is referred to Schulte and Hodson [2], Vera and Hodson [5] and Berrino et al. [7] for an in-depth derivation of the control volume analysis. A very good agreement in terms of overall trend can be observed between the experimental results and the theory, especially when the uncertainties of the measurements and their propagation across all transformed quantities are considered. The total pressure loss coefficient ωM increases with decreasing flow coefficient while the absolute inlet flow angle α1M decreases as the flow coefficient decreases.
From these results, one can conclude that the periodic incoming wakes have a significant effect on the mean inlet flow angle, especially for flow coefficients below ϕ = 1. The resulting mean negative incidence of the inlet flow, combined with the inherently highly turbulent content of the incoming wakes, will in turn have a significant impact on the aerodynamic performance of the downstream blade and on the separated-flow transition process.
The attentive reader will notice that an overall offset can be observed between the experiments and the theory (Cd = 1.0), especially when one considers the mass-averaged total pressure loss coefficient ωM. Even though the difference between both sets of results lies well within the achieved (propagated) uncertainty levels of the measurements, this offset merits some attention. The most straightforward reason for such an offset could be attributed to bias measurement errors such as the intrusive nature of the measurement technique leading to a blockage effect of the probe.
However, another plausible reason can be related to the experimental results obtained in a compressible flow regime (Mbar > 0.5) deviating from the incompressible control volume analysis described by Schulte and Hodson [2] and Berrino et al. [7]. Following Schlichting [15], empirical values for the drag coefficient of a cylinder in a crossflow are close to Cd = 1.0 for the investigated Reynolds number range based on the bar diameter and the bar-relative velocity (Rebar = 1000−1800). However, these empirical values were typically obtained at very low speed. In their own characterization of incoming wakes in a high-speed linear cascade, Vera and Hodson [5] measured cylinder drag coefficients of the order of Cd = 1.1−1.3 for a similar bar-relative Reynolds and Mach number range to the one covered in this study. They assumed that due to the high bar-relative Mach numbers achieved with high-speed wake generators (Mbar > 0.5), the drag coefficient Cd starts to divert from the lower empirical values of Cd typically found in the literature.
For the sake of completeness, theoretical results obtained with a cylinder drag coefficient of Cd = 1.2, chosen to best fit the obtained experimental results, are added in Figure 10 and Figure 11.

4. Conclusions

The use of a single sensor fast-response pressure probe in virtual three-hole mode to measure and characterize periodic unsteady incoming wakes has been presented. Following the rigorous static calibration of the fast-response pressure sensor and the angular calibration of the probe in a virtual three-hole mode, measurements were performed in a low-pressure turbine test section, downstream of a periodic wake generator with bars rotating at very high speed. Phase-locked averaged periodic unsteady total pressure wake distributions and inlet flow angle distributions over one bar passage were evaluated for four wake generator rotational speeds and for three isentropic inlet Mach numbers, covering a wide range of flow coefficients (ϕ = 0.44−1.60).
The obtained wake profiles were successively characterized in terms of wake half-width b1/2 and wake velocity deficit Vdef. The resulting wake characteristics were shown to be consistent with previous measurements and with theoretical correlations from wakes of cylinders in a crossflow, especially when one considers the measurement uncertainties and the transformations required to evaluate the wake characteristics. Finally, the mass-averaged wake total pressure losses and flow angle reductions with respect to the flow coefficient were shown to be consistent with theoretical results obtained from an incompressible control volume analysis.
As a conclusion, the spoked-wheel type wake generator used to simulate periodic unsteady wake–boundary layer interactions in the VKI S-1/C wind tunnel has been characterized in terms of instantaneous and averaged total pressure and flow angle (wake turbulence intensity profiles and the resulting characteristic length scales will be characterized in a future measurement campaign), and total pressure loss as well as inlet flow angle reduction values can now be estimated with confidence when assessing the aerodynamic performance of low-pressure turbine blade profiles in a high-speed, low Reynolds linear cascade test section with effects of periodic incoming wakes.

Author Contributions

Conceptualization, J.C. and T.A.; Data curation, J.C.; Formal analysis, J.C.; Funding acquisition, T.A.; Investigation, J.C.; Methodology, J.C.; Project administration, T.A.; Resources, J.C. and T.A.; Software, J.C.; Supervision, T.A.; Validation, J.C. and T.A.; Visualization, J.C.; Writing—original draft, J.C.; Writing—review & editing, J.C. and T.A.

Funding

The APC was funded by the Euroturbo Association.

Acknowledgments

The authors wish to acknowledge Safran Aircraft Engines (SAE) for the permission to present this paper.

Conflicts of Interest

The authors declare no conflict of interest.

Nomenclature

b1/2Wake half-widthVpPressure voltage output Superscripts
CChordVsSense voltage outputMMass-averaged
CaxAxial chordVAbsolute velocity
CdDrag coefficientVdefVelocity deficit ratio Subscripts
CP0Total pressure recovery =∆Vmax/V0Total conditions
dBar diameterxwWake propagation length1Inlet conditions
frReduced frequencyyTangential position2Outlet conditions
fbarBar passing frequencyycwWake centre positionbarRelative to the bar
gPitch isIsentropic
gbarBar pitch Greek symbolspRelated to the probe
MMach numberαFlow anglesStatic conditions
PPressureϕFlow coefficientxAxial
RmRadius at mid-span =V1,x/U
ReReynolds numberρDensity
TTemperatureωPressure loss coefficient
UPeripheral speed =∆P0/0,5ρ1V1,x
= (2π × (Ωrot/60)) × RmΩrotRotational speed

References

  1. Pfeil, H.; Eifler, J. Turbulenzverhaltnisse hinter rotierenden Zylindergittern. Forsch. Im Ing. 1976, 42, 27–32. [Google Scholar] [CrossRef]
  2. Schulte, V.; Hodson, H.P. Unsteady Wake-Induced Boundary Layer Transition in High Lift LP Turbines. J. Turbomach. 1998, 120, 28–35. [Google Scholar] [CrossRef]
  3. Funazaki, K.; Tetsuka, N.; Tanuma, T. Effects of Periodic Wake Passing upon Aerodynamic Loss of a Turbine Cascade Part I: Measurements of Wake-Affected Cascade Loss by Use of a Pneumatic Probe. In Proceedings of the International Gas Turbine & Aeroengine Congress & Exhibition, Indianapolis, IN, USA, 7–10 June 1999. [Google Scholar]
  4. Coton, T. Unsteady Wake-Boundary Layer Interaction on Advanced High Lift Low Pressure Turbine Airfoils. Ph.D. Thesis, Université de Liège, Liège, Belgium, 19 February 2004. [Google Scholar]
  5. Vera, M.; Hodson, H.P. Low speed vs. high speed testing of LP turbine blade-wake interaction. In Proceedings of the 16th Symposium on Measuring Techniques in Transonic and Supersonic Flow in Cascades and Turbomachines, Cambridge, UK, 23–24 September 2002. [Google Scholar]
  6. Schobeiri, M.T.; Öztürk, B. Experimental Study of the Effect of Periodic Unsteady Wake Flow on Boundary Layer Development, Separation, and Reattachment along the Surface of a Low Pressure Turbine Blade. J. Turbomach. 2004, 126, 663–676. [Google Scholar] [CrossRef]
  7. Berrino, M.; Simoni, D.; Ubaldi, M.; Zunino, P.; Bertini, F. Off-design performance of a highly loaded LP turbine cascade under steady and unsteady incoming flow conditions. In Proceedings of the ASME Turbo Expo 2014, Düsseldorf, Germany, 16–20 June 2014. [Google Scholar]
  8. Mersinligil, M.; Brouckaert, J.F.; Desset, J. Unsteady Pressure Measurements with a Fast Response Cooled Probe in High Temperature Gas Turbine Environments. J. Turbomach. 2011, 133, 081603. [Google Scholar] [CrossRef]
  9. Dell’Era, G.; Mersinligil, M.; Brouckaert, J.F. Assessment of Unsteady Pressure Measurement Uncertainty—Part I: Single Sensor Probe. J. Turbomach. 2016, 138, 041601. [Google Scholar] [CrossRef]
  10. Dell’Era, G.; Mersinligil, M.; Brouckaert, J.F. Assessment of Unsteady Pressure Measurement Uncertainty—Part II: Virtual Three-Hole Probe. J. Turbomach. 2016, 138, 041602. [Google Scholar] [CrossRef]
  11. Michálek, J.; Monaldi, M.; Arts, T. Aerodynamic Performance of a Very High Lift Low Pressure Turbine Airfoil (T106C) at Low Reynolds and High Mach Number with Effect of Free Stream Turbulence Intensity. J. Turbomach. 2010, 134, 061009. [Google Scholar] [CrossRef]
  12. Dong, Y.; Cumptsy, N.A. Compressor Blade Boundary Layers: Part 2—Measurements with Incident Wakes. J. Turbomach. 1990, 112, 231–240. [Google Scholar] [CrossRef]
  13. Arts, T. Aerodynamic performance of two very high lift low pressure turbine airfoils (T106C—T2) at low Reynolds and high Mach numbers. In Proceedings of the 5th European Conference for Aerospace Sciences, Munich, Germany, 1 July 2013. [Google Scholar]
  14. Dullenkopf, K.; Schulz, A.; Wittig, S. The Effect of Incident Wake Conditions on the Mean Heat Transfer of an Airfoil. In Proceedings of the Gas Turbine and Aeroengine Congress and Exposition, Brussels, Belgium, 11–14 June 1990. [Google Scholar]
  15. Schlichting, H. Boundary Layer Theory, 6th ed.; McGraw-Hill: New York, NY, USA, 1968. [Google Scholar]
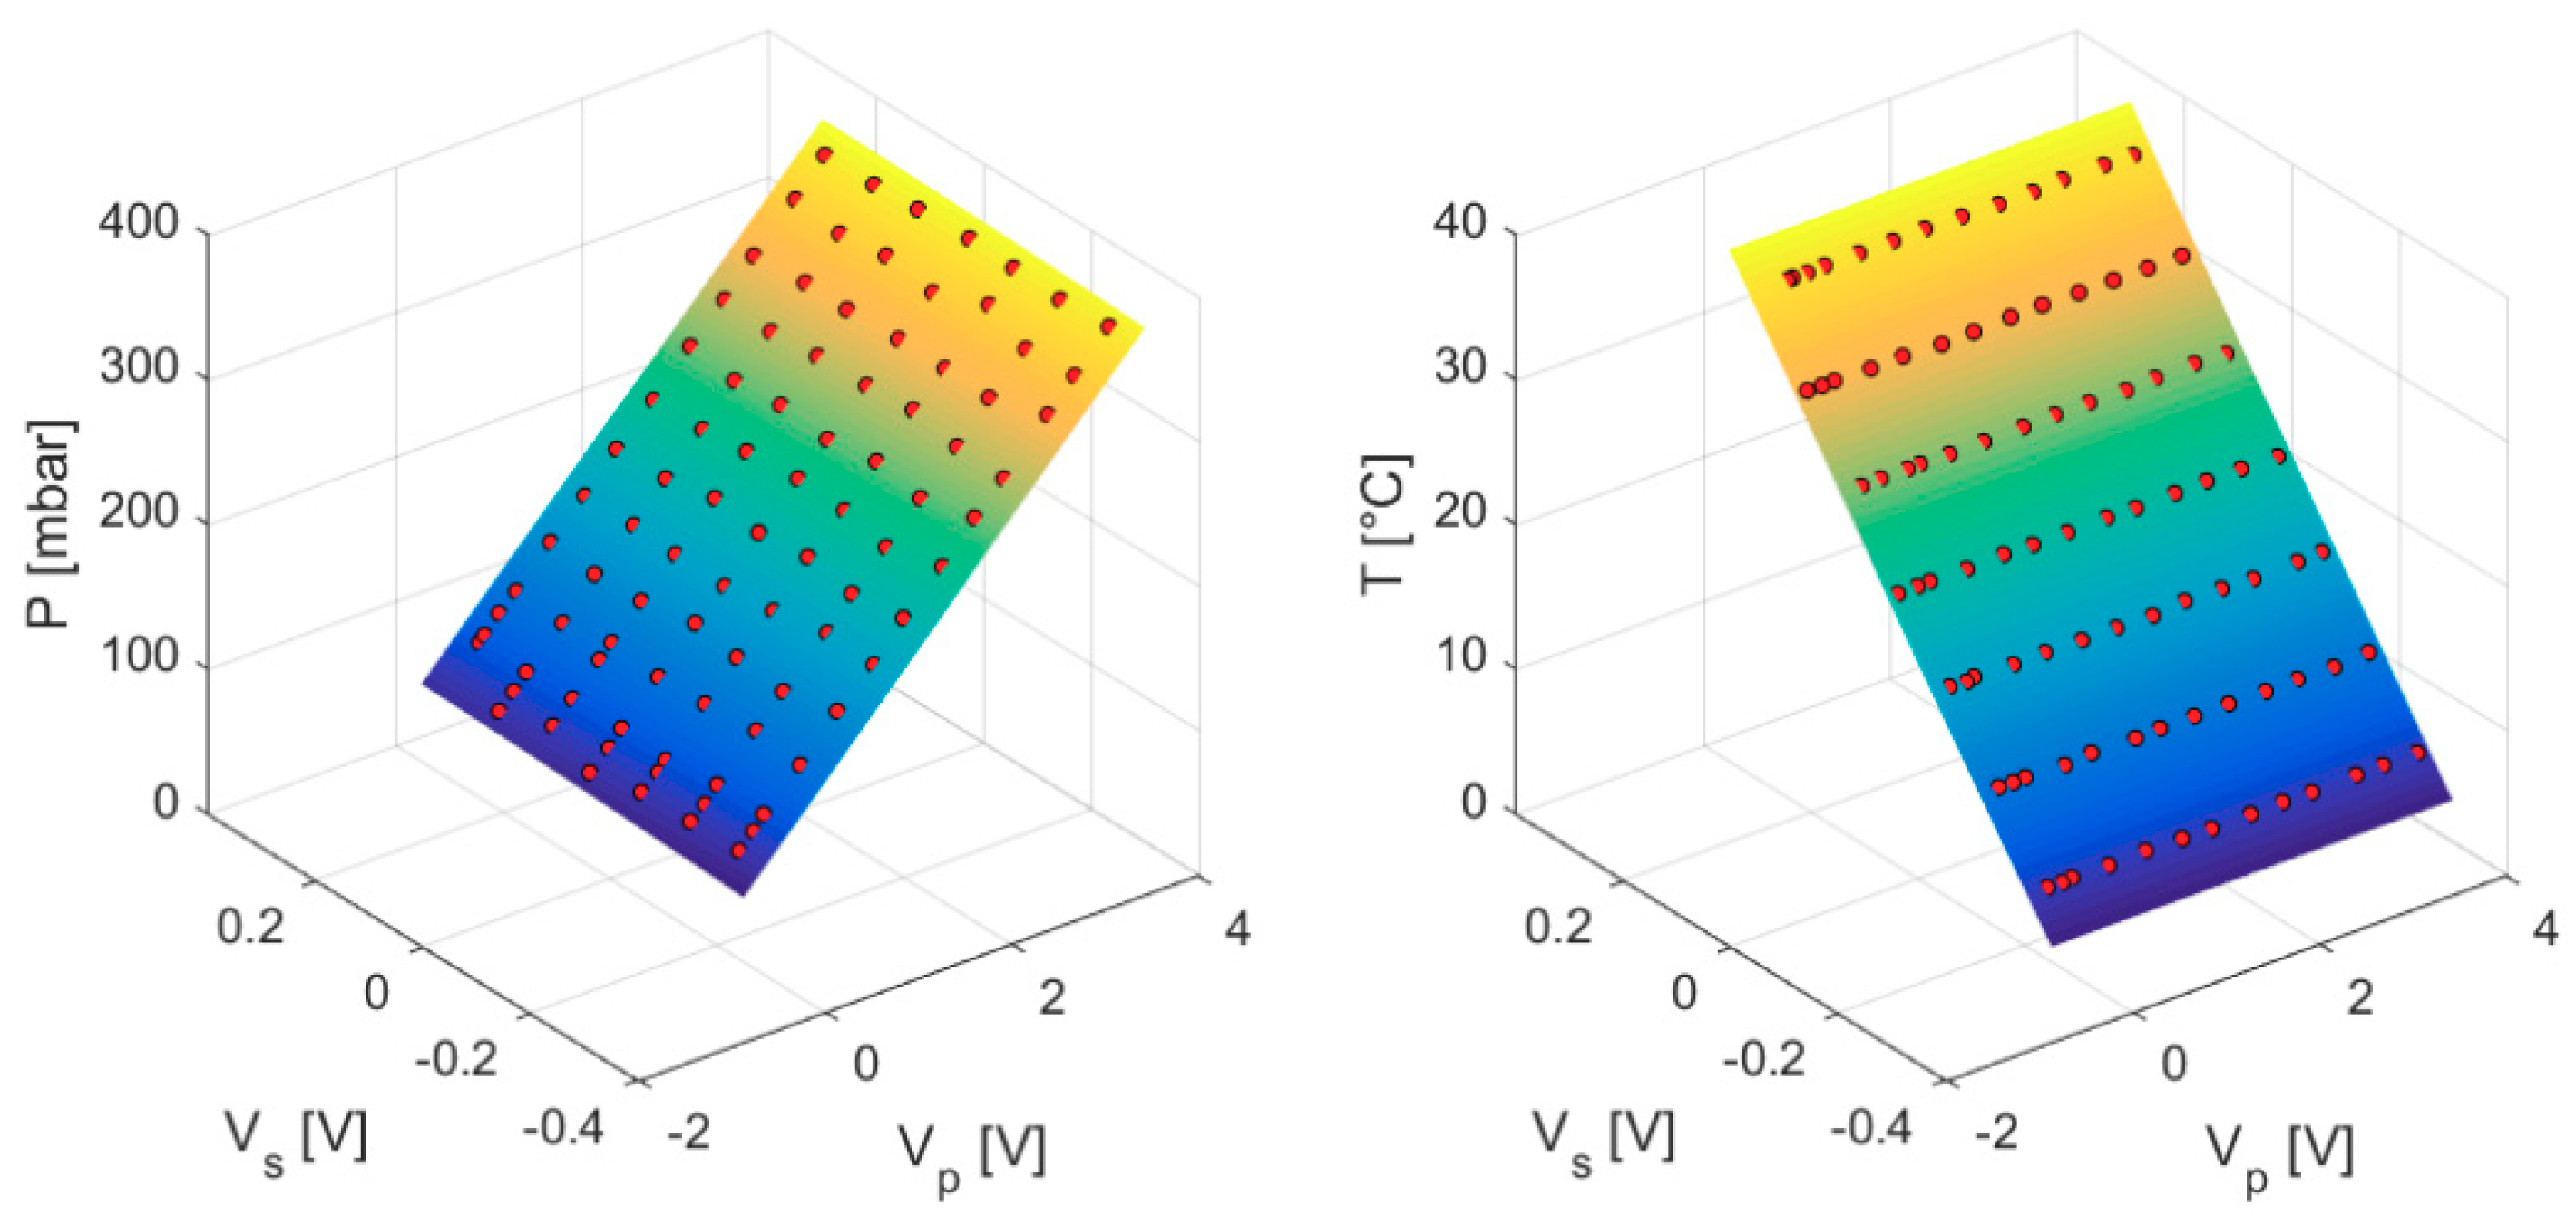
Figure 1. Pressure (left) and temperature (right) calibration surface fits for 5 PSI absolute pressure Kulite sensor; red dots indicate 91 calibration points.
Ijtpp 04 00026 g001
Figure 2. (a) Pressure recovery coefficient CP0 surface fit of a single sensor probe; red dots indicate 505 calibration points; (b) derived angular calibration for the virtual three-hole mode at M1 = 0.42.
Ijtpp 04 00026 g002
Figure 3. (a) Relative total pressure drop in the bar wake; (b) inlet flow angle variation in the bar wake; Ωrot = 1500 RPM at M1,is = 0.26 (blue), 0.34 (green) and 0.41 (orange) for 96 bars.
Ijtpp 04 00026 g003
Figure 4. (a) Relative total pressure drop in the bar wake; (b) inlet flow angle variation in the bar wake; Ωrot = 2870 RPM at M1,is = 0.26 (blue), 0.34 (green) and 0.41 (orange) for 96 bars.
Ijtpp 04 00026 g004
Figure 5. Normalized wake center location with respect to flow coefficient ϕ.
Ijtpp 04 00026 g005
Figure 6. Influence of flow coefficient ϕ on wake propagation length xw and on wake arrival lag time.
Ijtpp 04 00026 g006
Figure 7. Wake half-width b1/2,C with respect to flow coefficient ϕ.
Ijtpp 04 00026 g007
Figure 8. Wake half-width b1/2, D with respect to wake propagation length xw.
Ijtpp 04 00026 g008
Figure 9. Evolution of the velocity deficit ratio in the wake Vdef as a function of bar-relative Reynolds number Rebar.
Ijtpp 04 00026 g009
Figure 10. Evolution of the mass-averaged total pressure loss coefficient with respect to the flow coefficient; theoretical results are plotted for two cylinder drag coefficients: Cd = 1.0 and Cd = 1.2.
Ijtpp 04 00026 g010
Figure 11. Evolution of the mass-averaged absolute inlet flow angle with respect to the flow coefficient; theoretical results are plotted for two cylinder drag coefficients: Cd = 1.0 and Cd = 1.2.
Ijtpp 04 00026 g011
Table 1. Test matrix with resulting flow coefficients for the periodic wake generator with 96 bars.
ΩrotM1,is = 0.26M1,is = 0.34M1,is = 0.41
1500 RPM1.051.351.60
1975 RPM0.781.021.21
2870 RPM0.540.700.83
3500 RPM0.440.580.69