Quasi 3D Nacelle Design to Simulate Crosswind Flows: Merits and Challenges †


Abstract
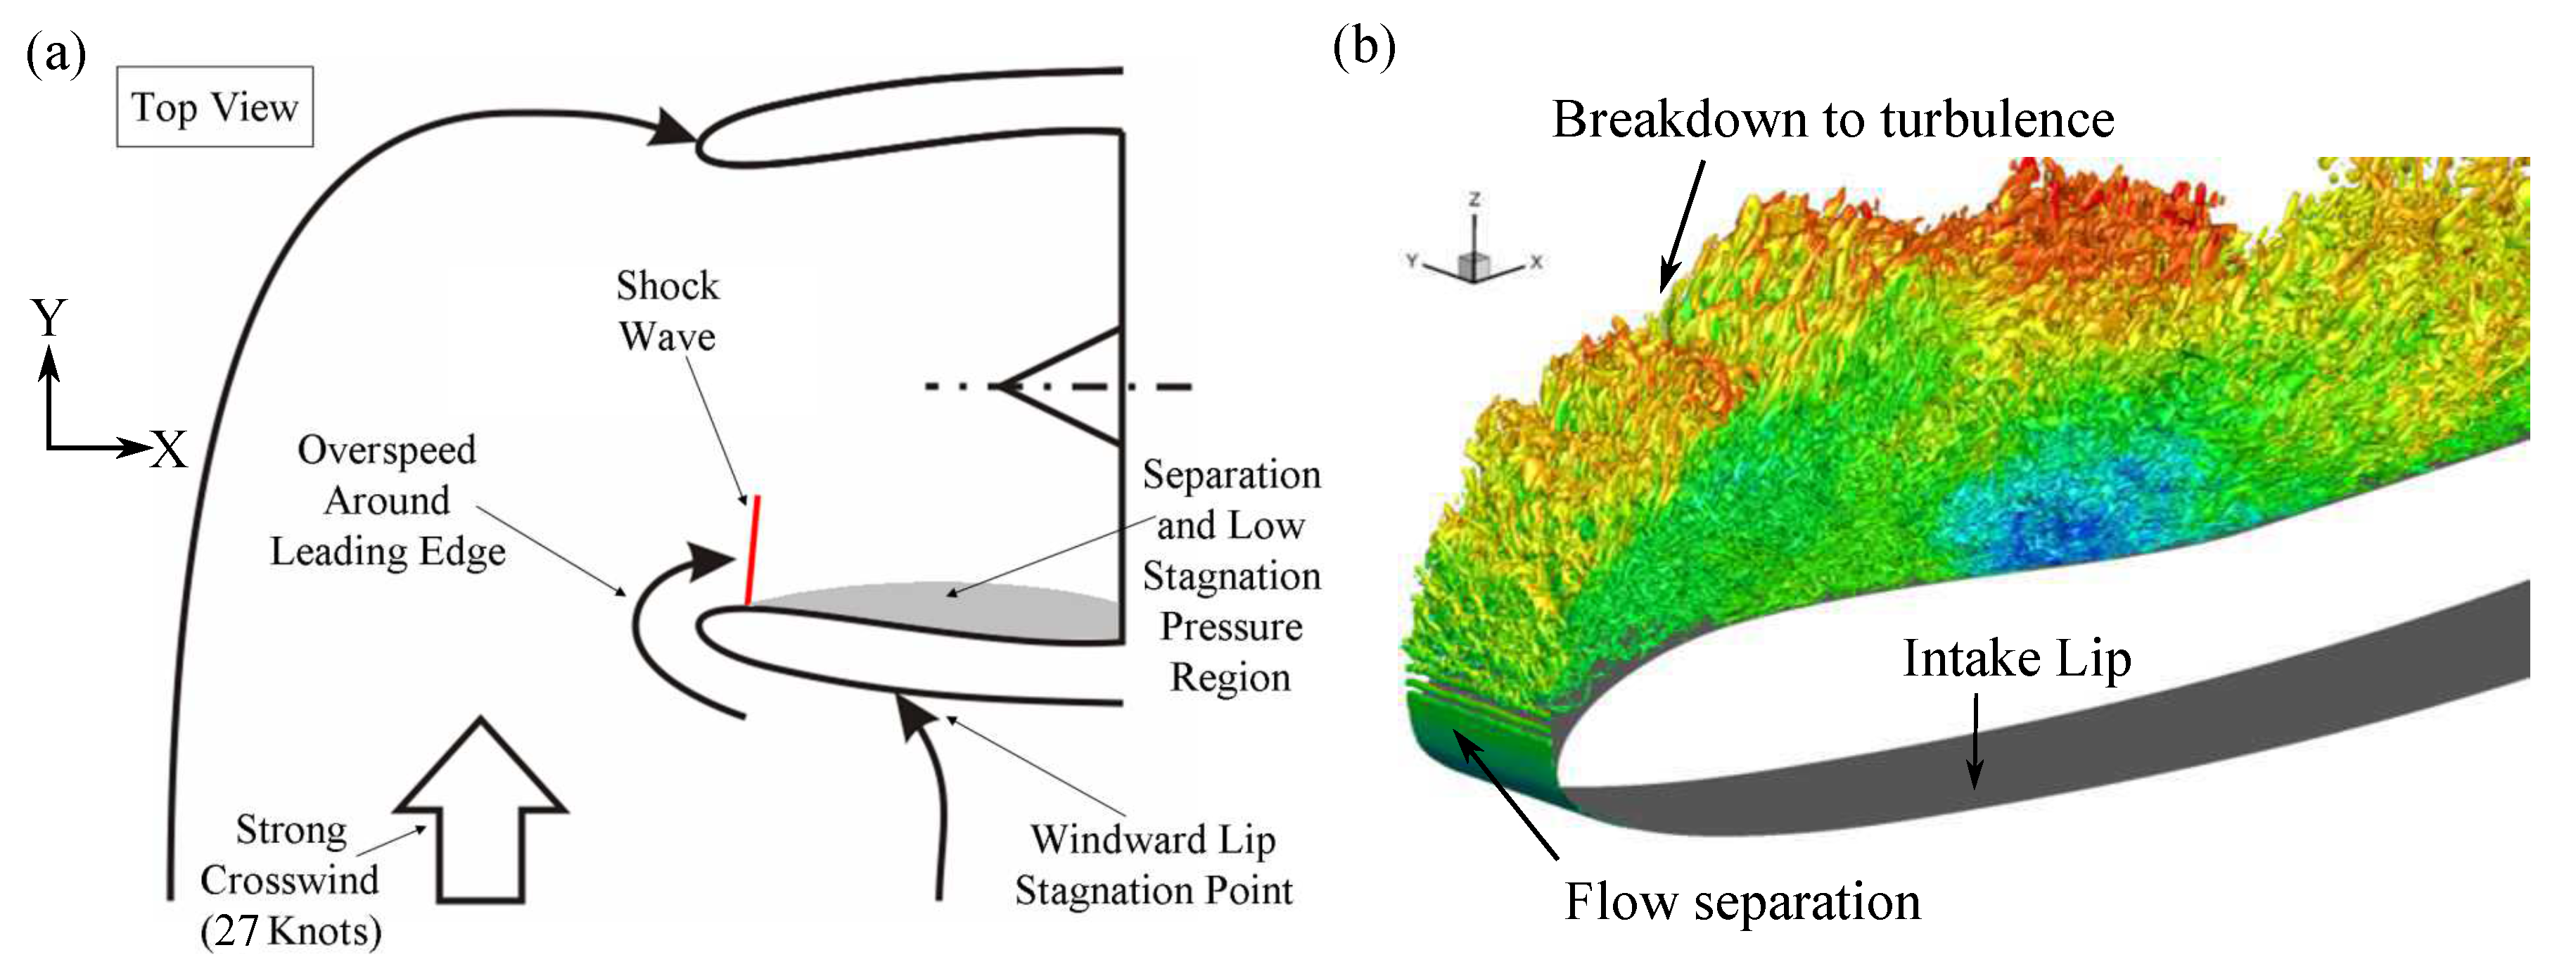
:1. Introduction
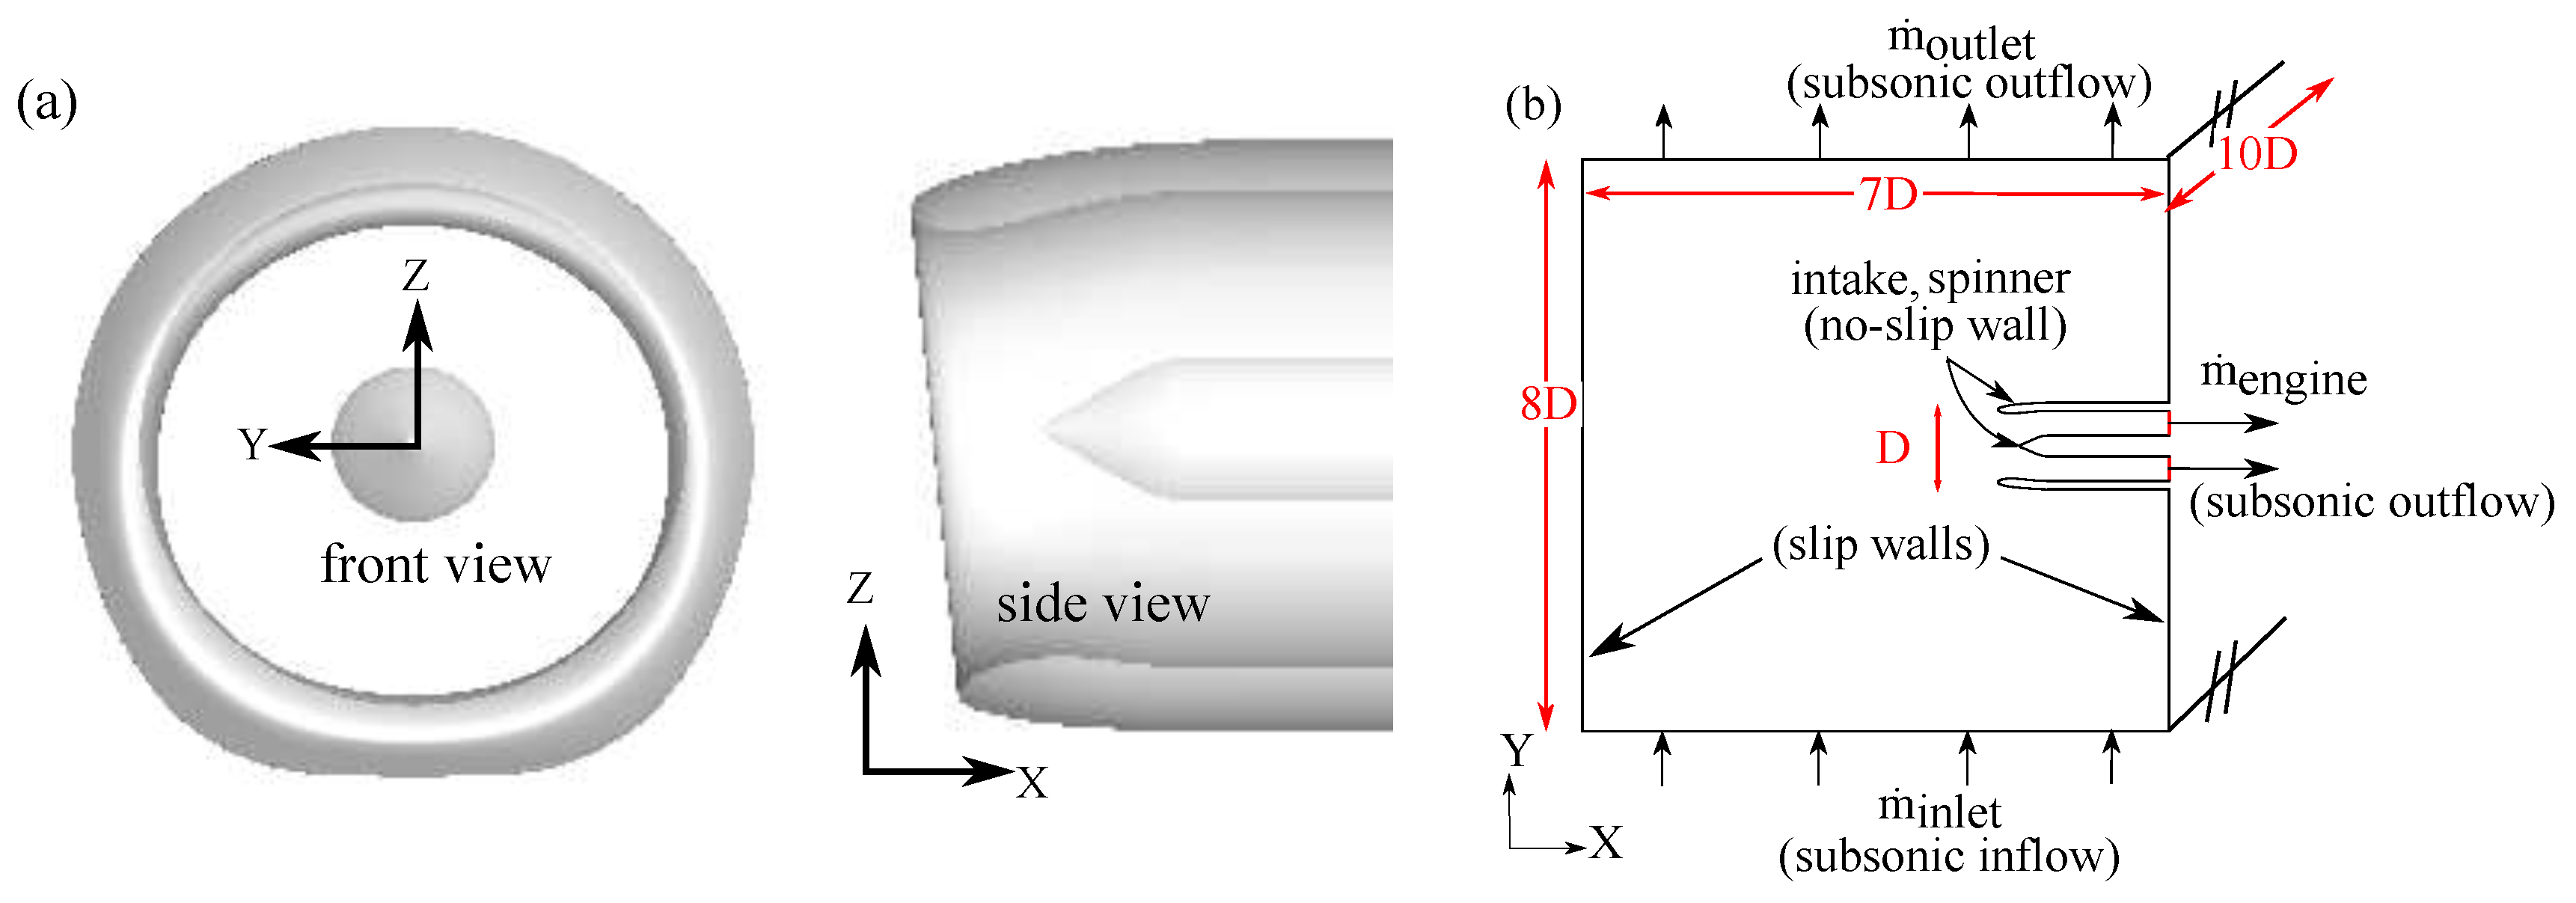
2. Numerical Methodology
3. Results
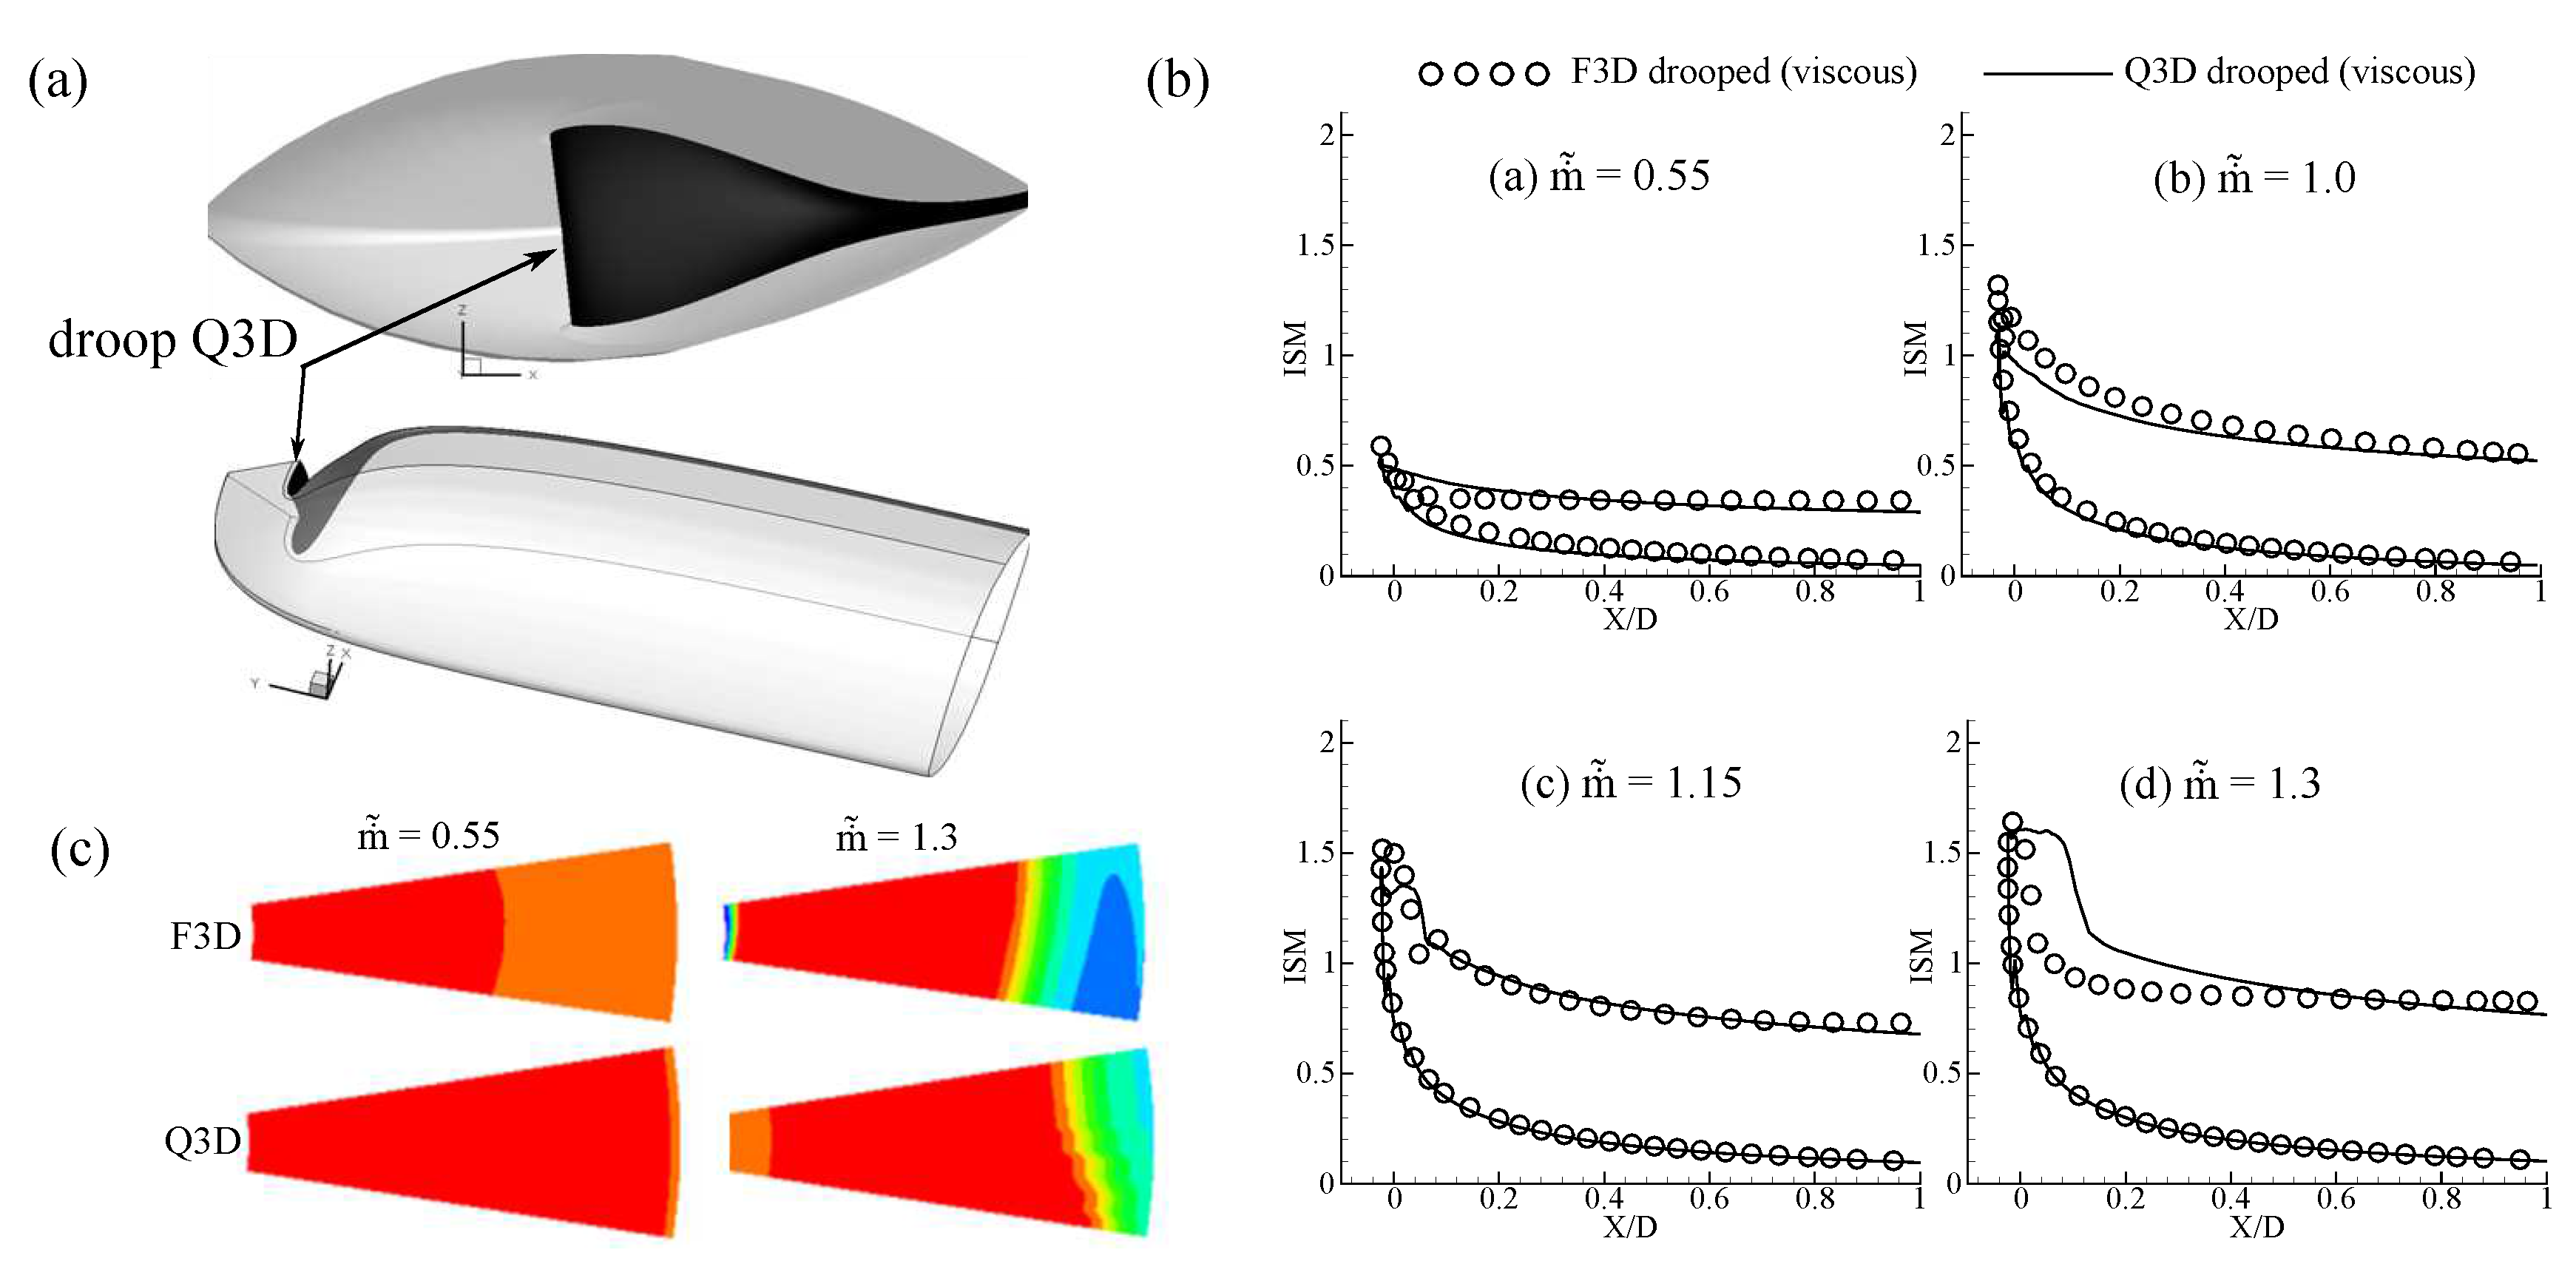
3.1. Full 3D Drooped Intake
3.1.1. Simplification of F3D Problem
3.1.2. Full 3D Axisymmetric Intake—Viscous Simulations
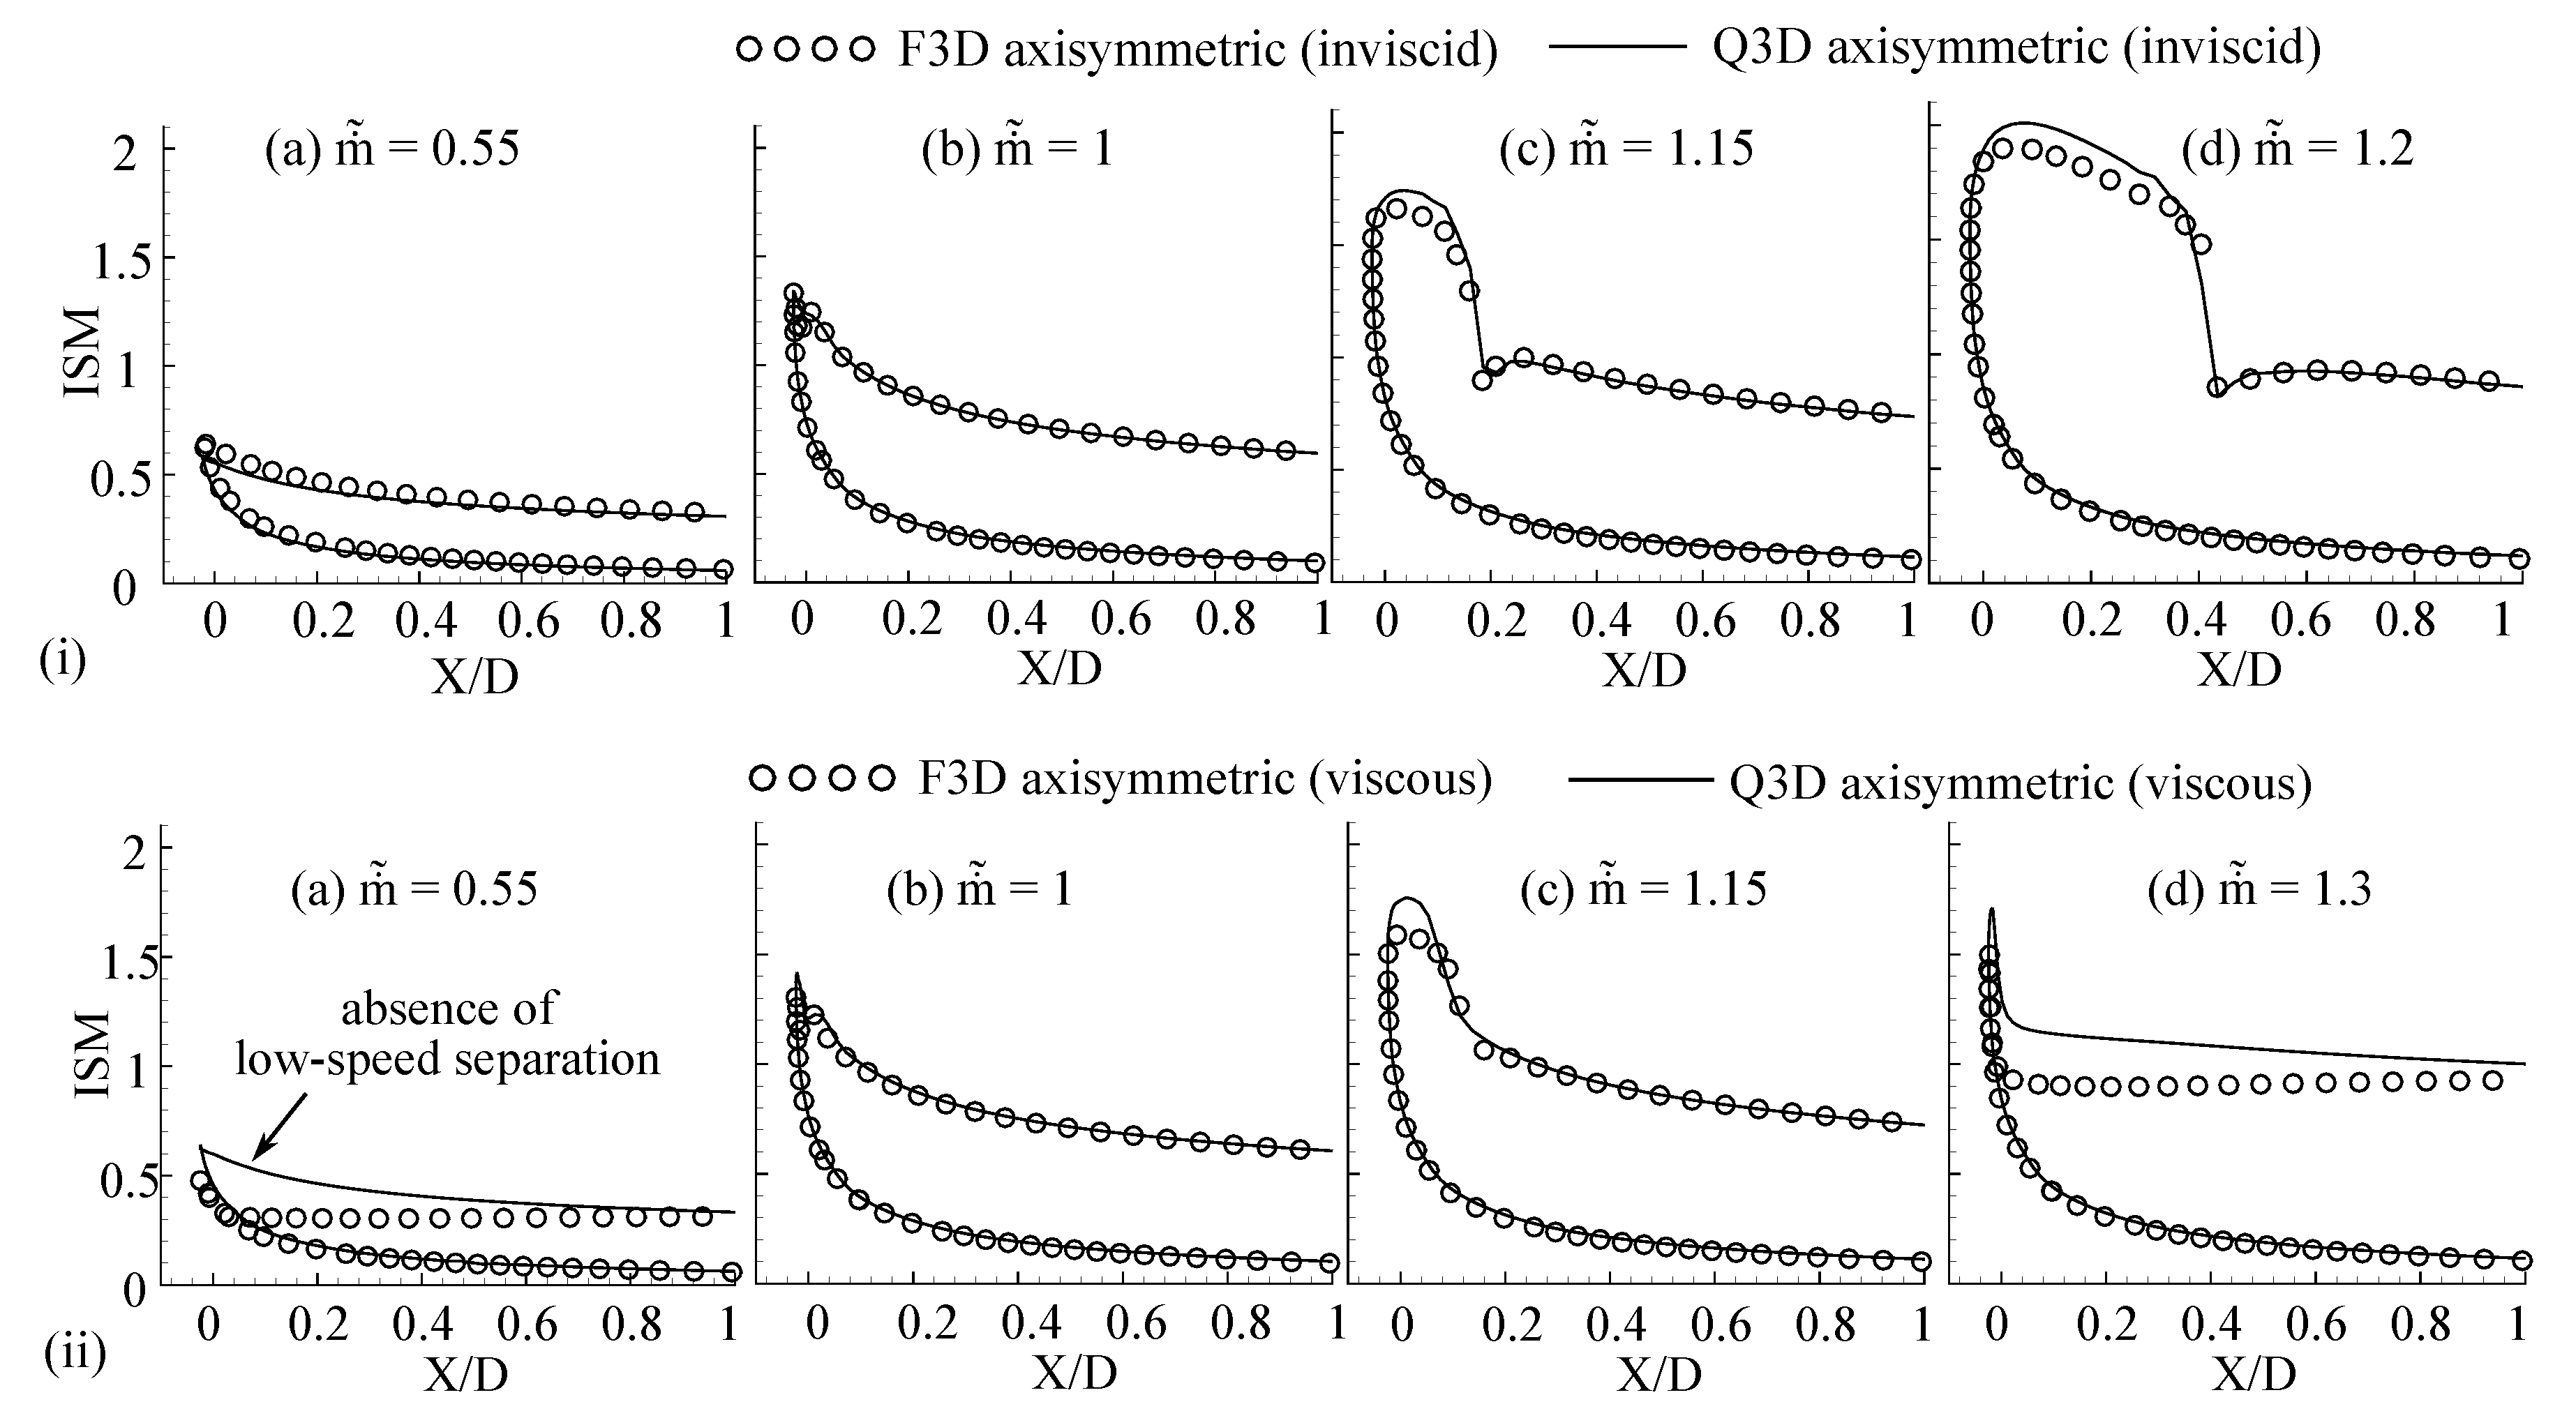
3.1.3. Full 3D Axisymmetric Intake–Inviscid Simulations
3.2. Quasi-3D Axisymmetric Duct
3.2.1. Extraction Procedure
3.2.2. Q3D Axisymmetric Duct Results—Comparison against F3D Simulations
4. Conclusions
Author Contributions
Funding
Acknowledgments
Conflicts of Interest
Nomenclature
| D | Nacelle lip thickness |
| Distortion coefficient | |
| Mass flow rate | |
| Reference mass flow rate | |
| Normalised mass flow rate, | |
| p | Static pressure |
| Stagnation pressure | |
| q | Dynamic pressure |
| Distance in wall units | |
| Isentropic Mach Number | |
| Quasi 3D | |
| Full 3D | |
| Spalart-Allmaras model | |
| Boundary Condition |
Appendix A
Appendix Q3D Drooped Duct Extraction
References
- Peters, A.; Spakovszky, Z.S.; Lord, W.K.; Rose, B. Ultrashort nacelles for low fan pressure ratio propulsors. J. Turbomach. 2015, 137, 021001. [Google Scholar] [CrossRef]
- Vadlamani, N.R.; Cao, T.; Watson, R.; Tucker, P.G. Towards Future Installations: Mutual Interactions of Short Intakes with Modern High Bypass Fans. J. Turbomach. 2019, 141, 081013. [Google Scholar] [CrossRef]
- Seddon, J.; Goldsmith, E.L. Intake Aerodynamics; AIAA Education Series; American Institute of Aeronautics and Astronautics: Washington, DC, USA, 1999. [Google Scholar]
- Wakelam, C.T.; Hynes, T.P.; Hodson, H.P.; Evans, S.W.; Chanez, P. Separation Control for Aeroengine Intakes, Part 1: Low-Speed Investigation of Control Strategies. J. Propuls. Power 2012, 28, 758–765. [Google Scholar] [CrossRef]
- Vadlamani, N.R.; Tucker, P.G. Eddy Resolving Simulations of Intake Under Crosswinds. In Direct and Large-Eddy Simulation XI; Springer: Berlin, Germany, 2019; pp. 523–529. [Google Scholar]
- Freeman, C.; Rowe, A.L. Intake Engine Interactions of a Modern Large Turbofan Engine. In Volume 1: Aircraft Engine; Marine; Turbomachinery; Microturbines and Small Turbomachinery; ASME: Indianapolis, IN, USA, 7–10 June 1999; p. V001T01A007. [Google Scholar]
- Hall, C.A.; Hynes, T.P. Measurements of Intake Separation Hysteresis in a Model Fan and Nacelle Rig. J. Propuls. Power 2006, 22, 872–879. [Google Scholar] [CrossRef]
- Colin, Y.; Aupoix, B.; Boussuge, J.; Chanez, P. Numerical Simulation of the Distortion Generated by Crosswind Inlet Flows. In Proceedings of the 8th International Symposium on Experimental and Computational Aerothermodynamics of Internal Flows, Lyon, France, 2–5 July 2007. [Google Scholar]
- Murphy, J.; MacManus, D. Ground vortex aerodynamics under crosswind conditions. Exp. Fluids 2011, 50, 109–124. [Google Scholar] [CrossRef]
- Carnevale, M.; Green, J.S.; Di Mare, L. Numerical Studies into Intake Flow for Fan Forcing Assessment. In Proceedings of the ASME Turbo Expo 2014, Dusseldorf, Germany, 16–20 June 2014. [Google Scholar]
- Wakelam, C.T. Aero Engine Intake Separation Control. Ph.D. Thesis, University of Cambridge, Cambridge, UK, 2009. [Google Scholar]
- Wakelam, C.T.; Hynes, T.P.; Hodson, H.P.; Evans, S.W.; Chanez, P. Separation Control for Aeroengine Intakes, Part 2: High-Speed Investigations. J. Propuls. Power 2012, 28, 766–772. [Google Scholar] [CrossRef]
- Vadlamani, N.R.; Tucker, P.G. Intake lip separation control using plasma actuators. In Proceedings of the 16th International Symposium on Transport Phenomena and Dynamics of Rotating Machinery, Honolulu, HI, USA, 10–15 April 2016. [Google Scholar]
- Oriji, U.R.; Tucker, P.G. Modular Turbulence Modeling Applied to an Engine Intake. J. Turbomach. 2013, 136, 051004. [Google Scholar] [CrossRef]
- Spalart, P.R.; Rumsey, C.L. Effective inflow conditions for turbulence models in aerodynamic calculations. AIAA J. 2007, 45, 2544–2553. [Google Scholar] [CrossRef]
- Cao, T.; Vadlamani, N.R.; Tucker, P.G.; Smith, A.R.; Slaby, M.; Sheaf, C.T. Fan–Intake Interaction Under High Incidence. J. Eng. Gas Turbines Power 2016, 139, 041204. [Google Scholar] [CrossRef]
- Ma, Y.; Vadlamani, N.R.; Cui, J.; Tucker, P. Comparative Studies of RANS Versus Large Eddy Simulation for Fan–Intake Interaction. J. Fluids Eng. 2019, 141, 031106. [Google Scholar] [CrossRef]
- Kalitzin, G.; Medic, G.; Iaccarino, G.; Durbin, P. Near-wall behavior of RANS turbulence models and implications for wall functions. J. Comput. Phys. 2005, 204, 265–291. [Google Scholar] [CrossRef]
- Watson, R. Large Eddy Simulation of Cutback Trailing Edges for Film Cooling Turbine Blades. Ph.D. Thesis, University of Cambridge, Cambridge, UK, 2013. [Google Scholar]


© 2019 by the authors. Licensee MDPI, Basel, Switzerland. This article is an open access article distributed under the terms and conditions of the Creative Commons Attribution (CC BY-NC-ND) license (https://creativecommons.org/licenses/by-nc-nd/4.0/).
Share and Cite
Yeung, A.; Vadlamani, N.R.; Hynes, T.; Sarvankar, S. Quasi 3D Nacelle Design to Simulate Crosswind Flows: Merits and Challenges. Int. J. Turbomach. Propuls. Power 2019, 4, 25. https://doi.org/10.3390/ijtpp4030025
Yeung A, Vadlamani NR, Hynes T, Sarvankar S. Quasi 3D Nacelle Design to Simulate Crosswind Flows: Merits and Challenges. International Journal of Turbomachinery, Propulsion and Power. 2019; 4(3):25. https://doi.org/10.3390/ijtpp4030025
Chicago/Turabian StyleYeung, Alex, Nagabhushana Rao Vadlamani, Tom Hynes, and Sumit Sarvankar. 2019. "Quasi 3D Nacelle Design to Simulate Crosswind Flows: Merits and Challenges" International Journal of Turbomachinery, Propulsion and Power 4, no. 3: 25. https://doi.org/10.3390/ijtpp4030025
APA StyleYeung, A., Vadlamani, N. R., Hynes, T., & Sarvankar, S. (2019). Quasi 3D Nacelle Design to Simulate Crosswind Flows: Merits and Challenges. International Journal of Turbomachinery, Propulsion and Power, 4(3), 25. https://doi.org/10.3390/ijtpp4030025