1. Introduction
Cycles employing supercritical carbon dioxide (sCO2) as working fluid are currently under development, and can be found in many publications. They can be employed in various layouts and applications using different heat sources, ranging from waste heat to nuclear reactors and solar power. Therefore, several universities, research institutes, and companies are putting effort into the research and development of efficient sCO2 cycles for electricity production. In some applications and under specific conditions, the sCO2 technology promises higher cycle efficiencies and smaller component sizes compared to steam cycles (Ahn et al. [
1]), with the turbomachines being one of the key components.
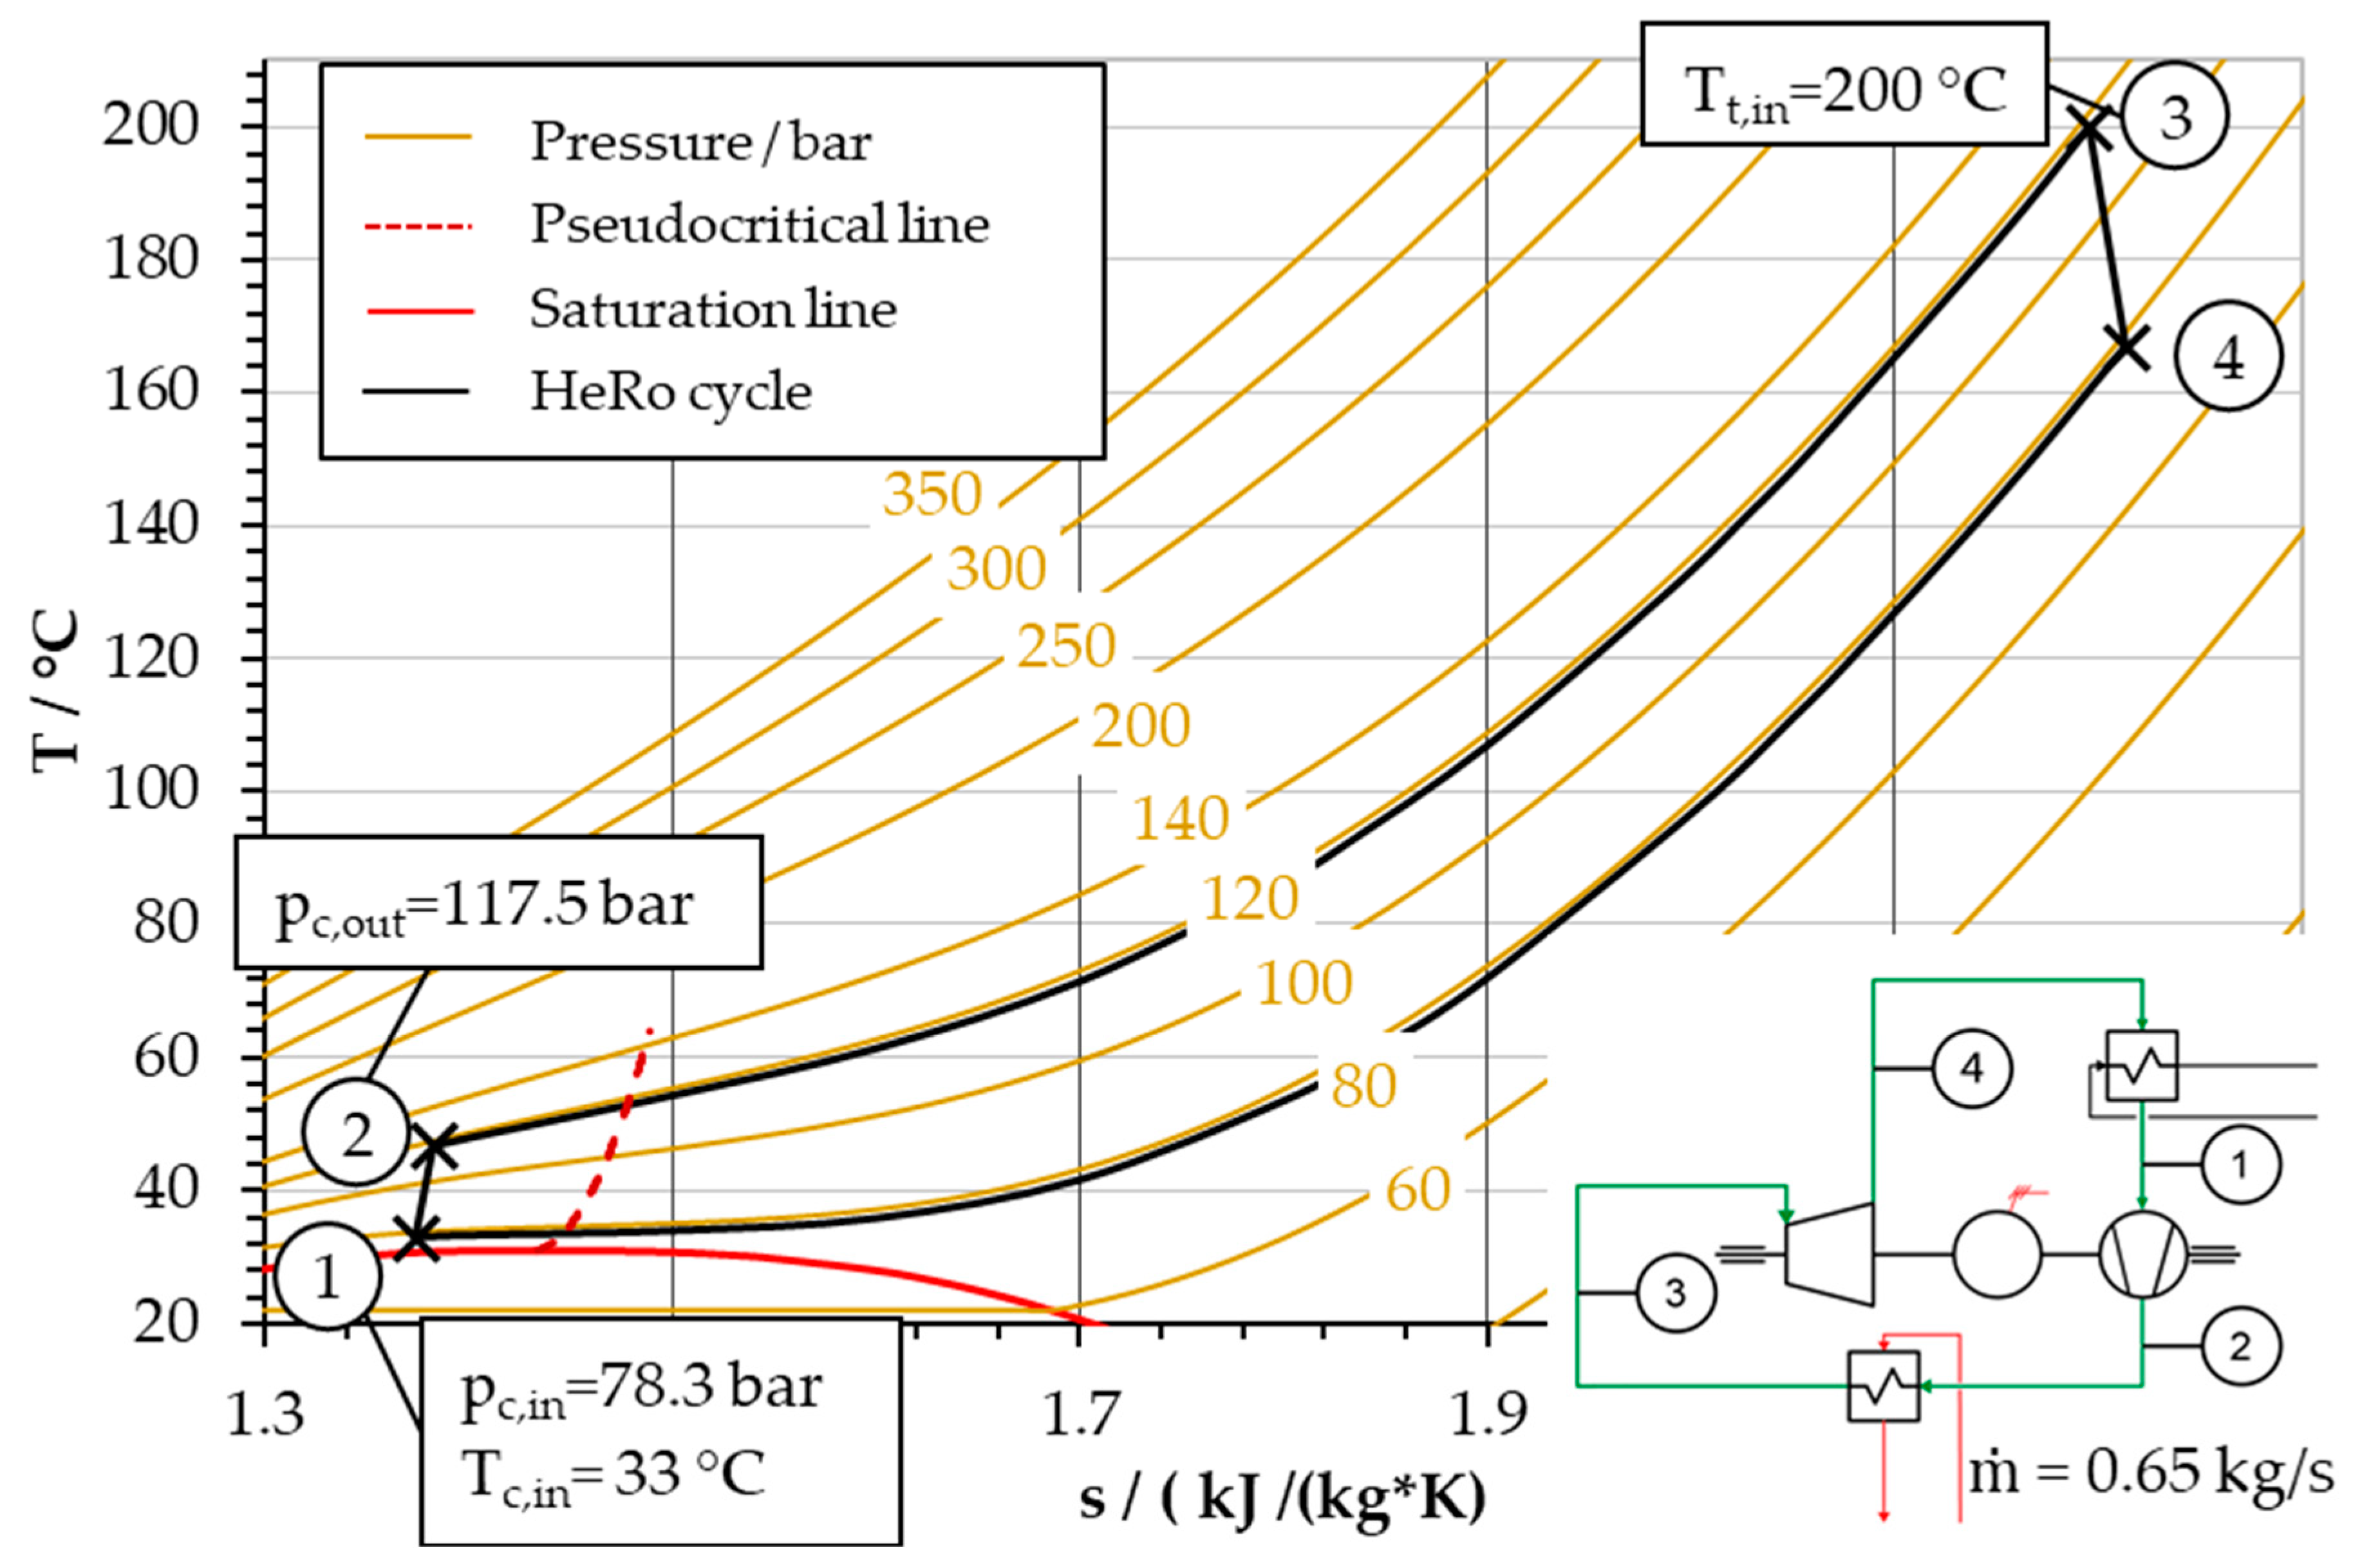
Within the sCO2-HeRo project, a system was developed to securely remove residual decay heat from nuclear fuel during a station blackout in a nuclear power plant. The system is supposed to be self-sustaining, self-starting, and very compact. To achieve these goals, it operates on sCO2 and consists of a simple Joule cycle with the thermodynamic parameters shown in
Figure 1.
Figure 1 shows a simplified sketch of the cycle and its nominal thermodynamic conditions within a T–s diagram. The pseudocritical line is indicated with a dashed line.
Figure 1 shows that the compressor inlet (point 1) lies close to the critical point and left of the pseudocritical line. Further, the sCO2 flow crosses the pseudocritical line in the cooler (from point 3 to 4). Fluid properties around the pseudocritical line thus have a considerable effect on the compressor operation. The project includes the development and testing of the turbomachine for sCO2. Its compressor features a radial impeller and a vaneless diffusor with outer diameters of 40 and 84 mm, respectively. The design speed of 50,000 rpm leads to a peripheral velocity of 105 m/s. For more information on the design and geometry of the compressor, please refer to Hacks et al. [
2], who describe the design of the turbomachine in detail and publish the whole compressor geometry. On the other hand, Hacks et al. present the results of the first compressor performance tests [
3]. The turbomachine tests showed quite stable operation behavior, even if the inlet conditions were moved across to the pseudocritical line. These observations contradicted expectation and were the motivation for having a closer look at the physical effects with respect to the fluid properties.
2. Carbon Dioxide Fluid Properties
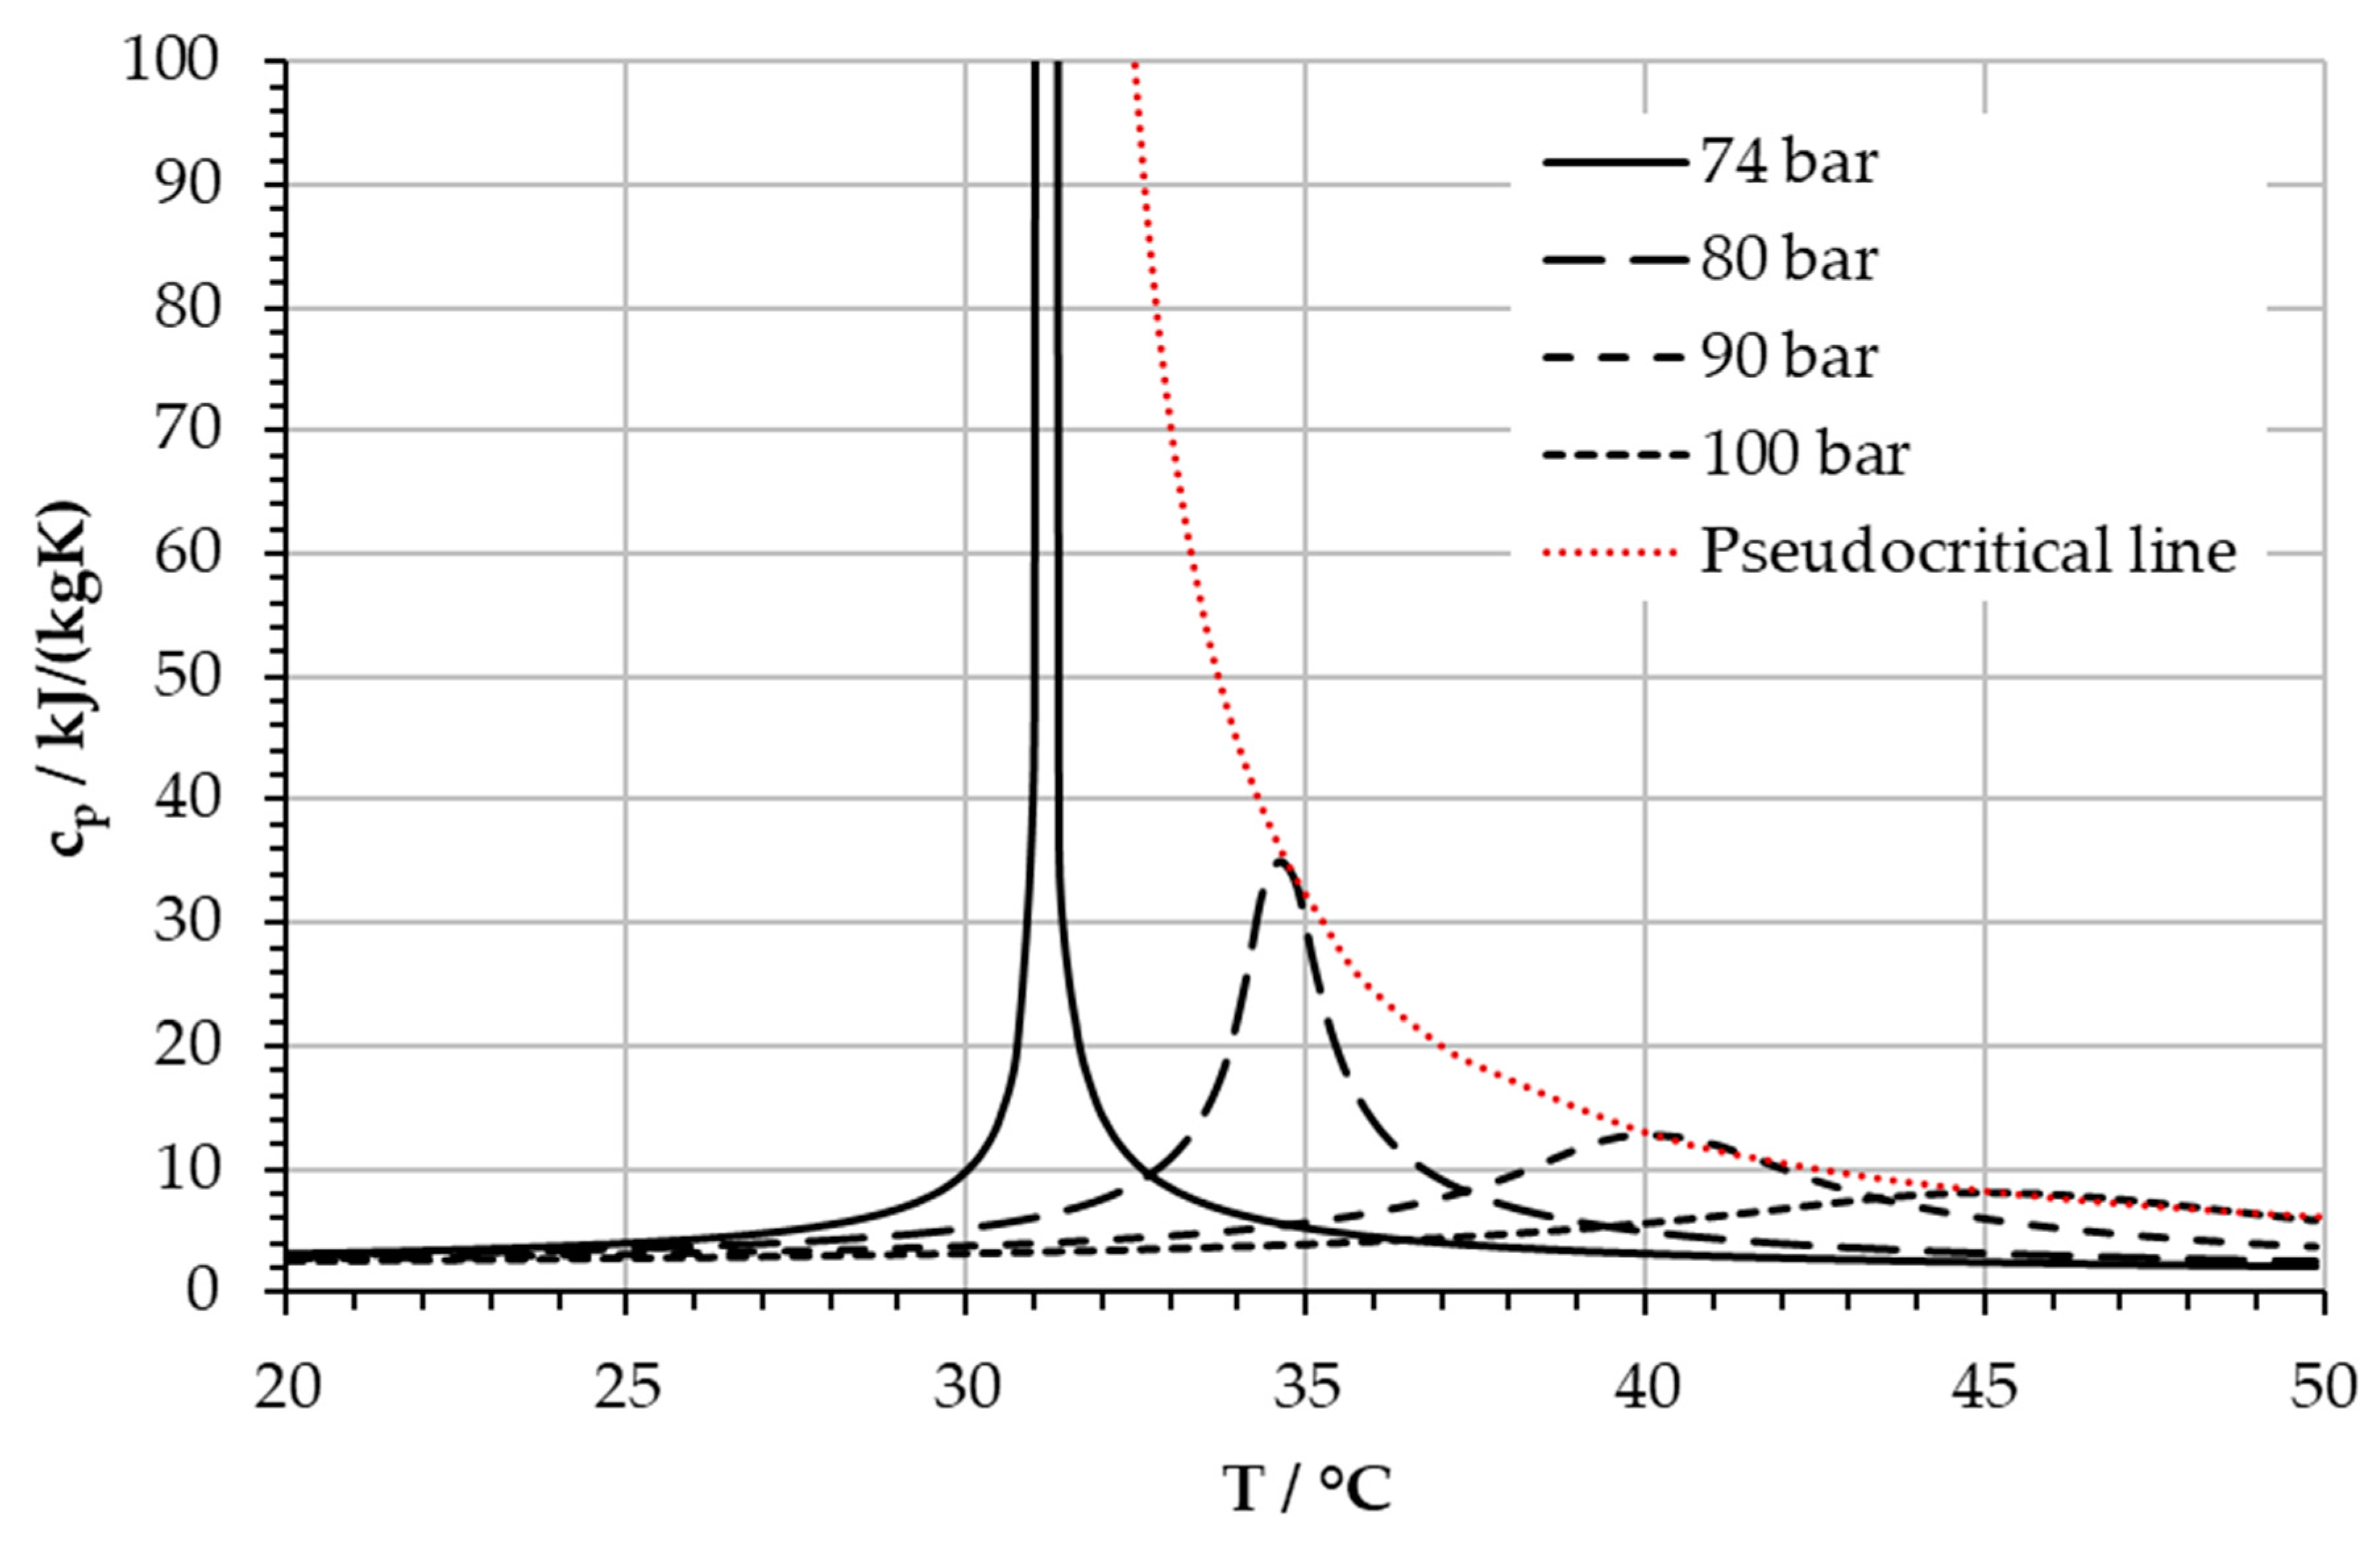
Common to all applications were the inlet conditions of the (main) compressor, which are usually chosen close to the pseudocritical line and especially close to the critical point to reduce compression work. The pseudocritical line, already indicated in
Figure 1 is shown in
Figure 2 connecting the points of partial derivatives of
cp for
p >
pcrit for which the relation (1) holds:
All fluid properties were taken from REFPROP 8.0 (NIST Standard Reference Database 23: Reference Fluid Thermodynamic and Transport Properties-REFPROP, Gaithersburg, MD, USA) (Lemmon et al. [
4]). The peak of isobaric heat capacity approaches infinity at the critical point at 31 °C and 73.8 bar (Kiran et al. [
5]). Starting from the critical point, both static temperature and static pressure increase along the pseudocritical line, while the local maximum of the heat capacity decreases until the peak becomes hardly visible at static pressures above 100 bar, or static temperatures above 45 °C.
Kiran et al. define the regions left and right of the pseudocritical line as liquid-like and gas-like (in a temperature–entropy or enthalpy–entropy diagram) [
5]. Fluid properties such as density and enthalpy show property changes intermediate to those of liquid and gas (not a peak) with large gradients from liquid-like to gas-like, which can cause difficulties in compressor operation and control. The gradients get lower the further pressure and temperature are away from the critical point. The maximum rate in property change (e.g., for density and enthalpy) approximately coincides with the pseudocritical line itself and thus with the maximum heat capacity. Further, considering the isobaric in
Figure 2, the local peak in heat capacity across the pseudocritical line requires a large amount of heat to be transferred to change the temperature by a few degrees (Wright et al. [
6]). Therefore, the peak of
cp at the pseudocritical line keeps the inlet conditions on either side of the pseudocritical line if the transferred heat changes.
3. Observations Based on Experimental Testing of the sCO2-HeRo
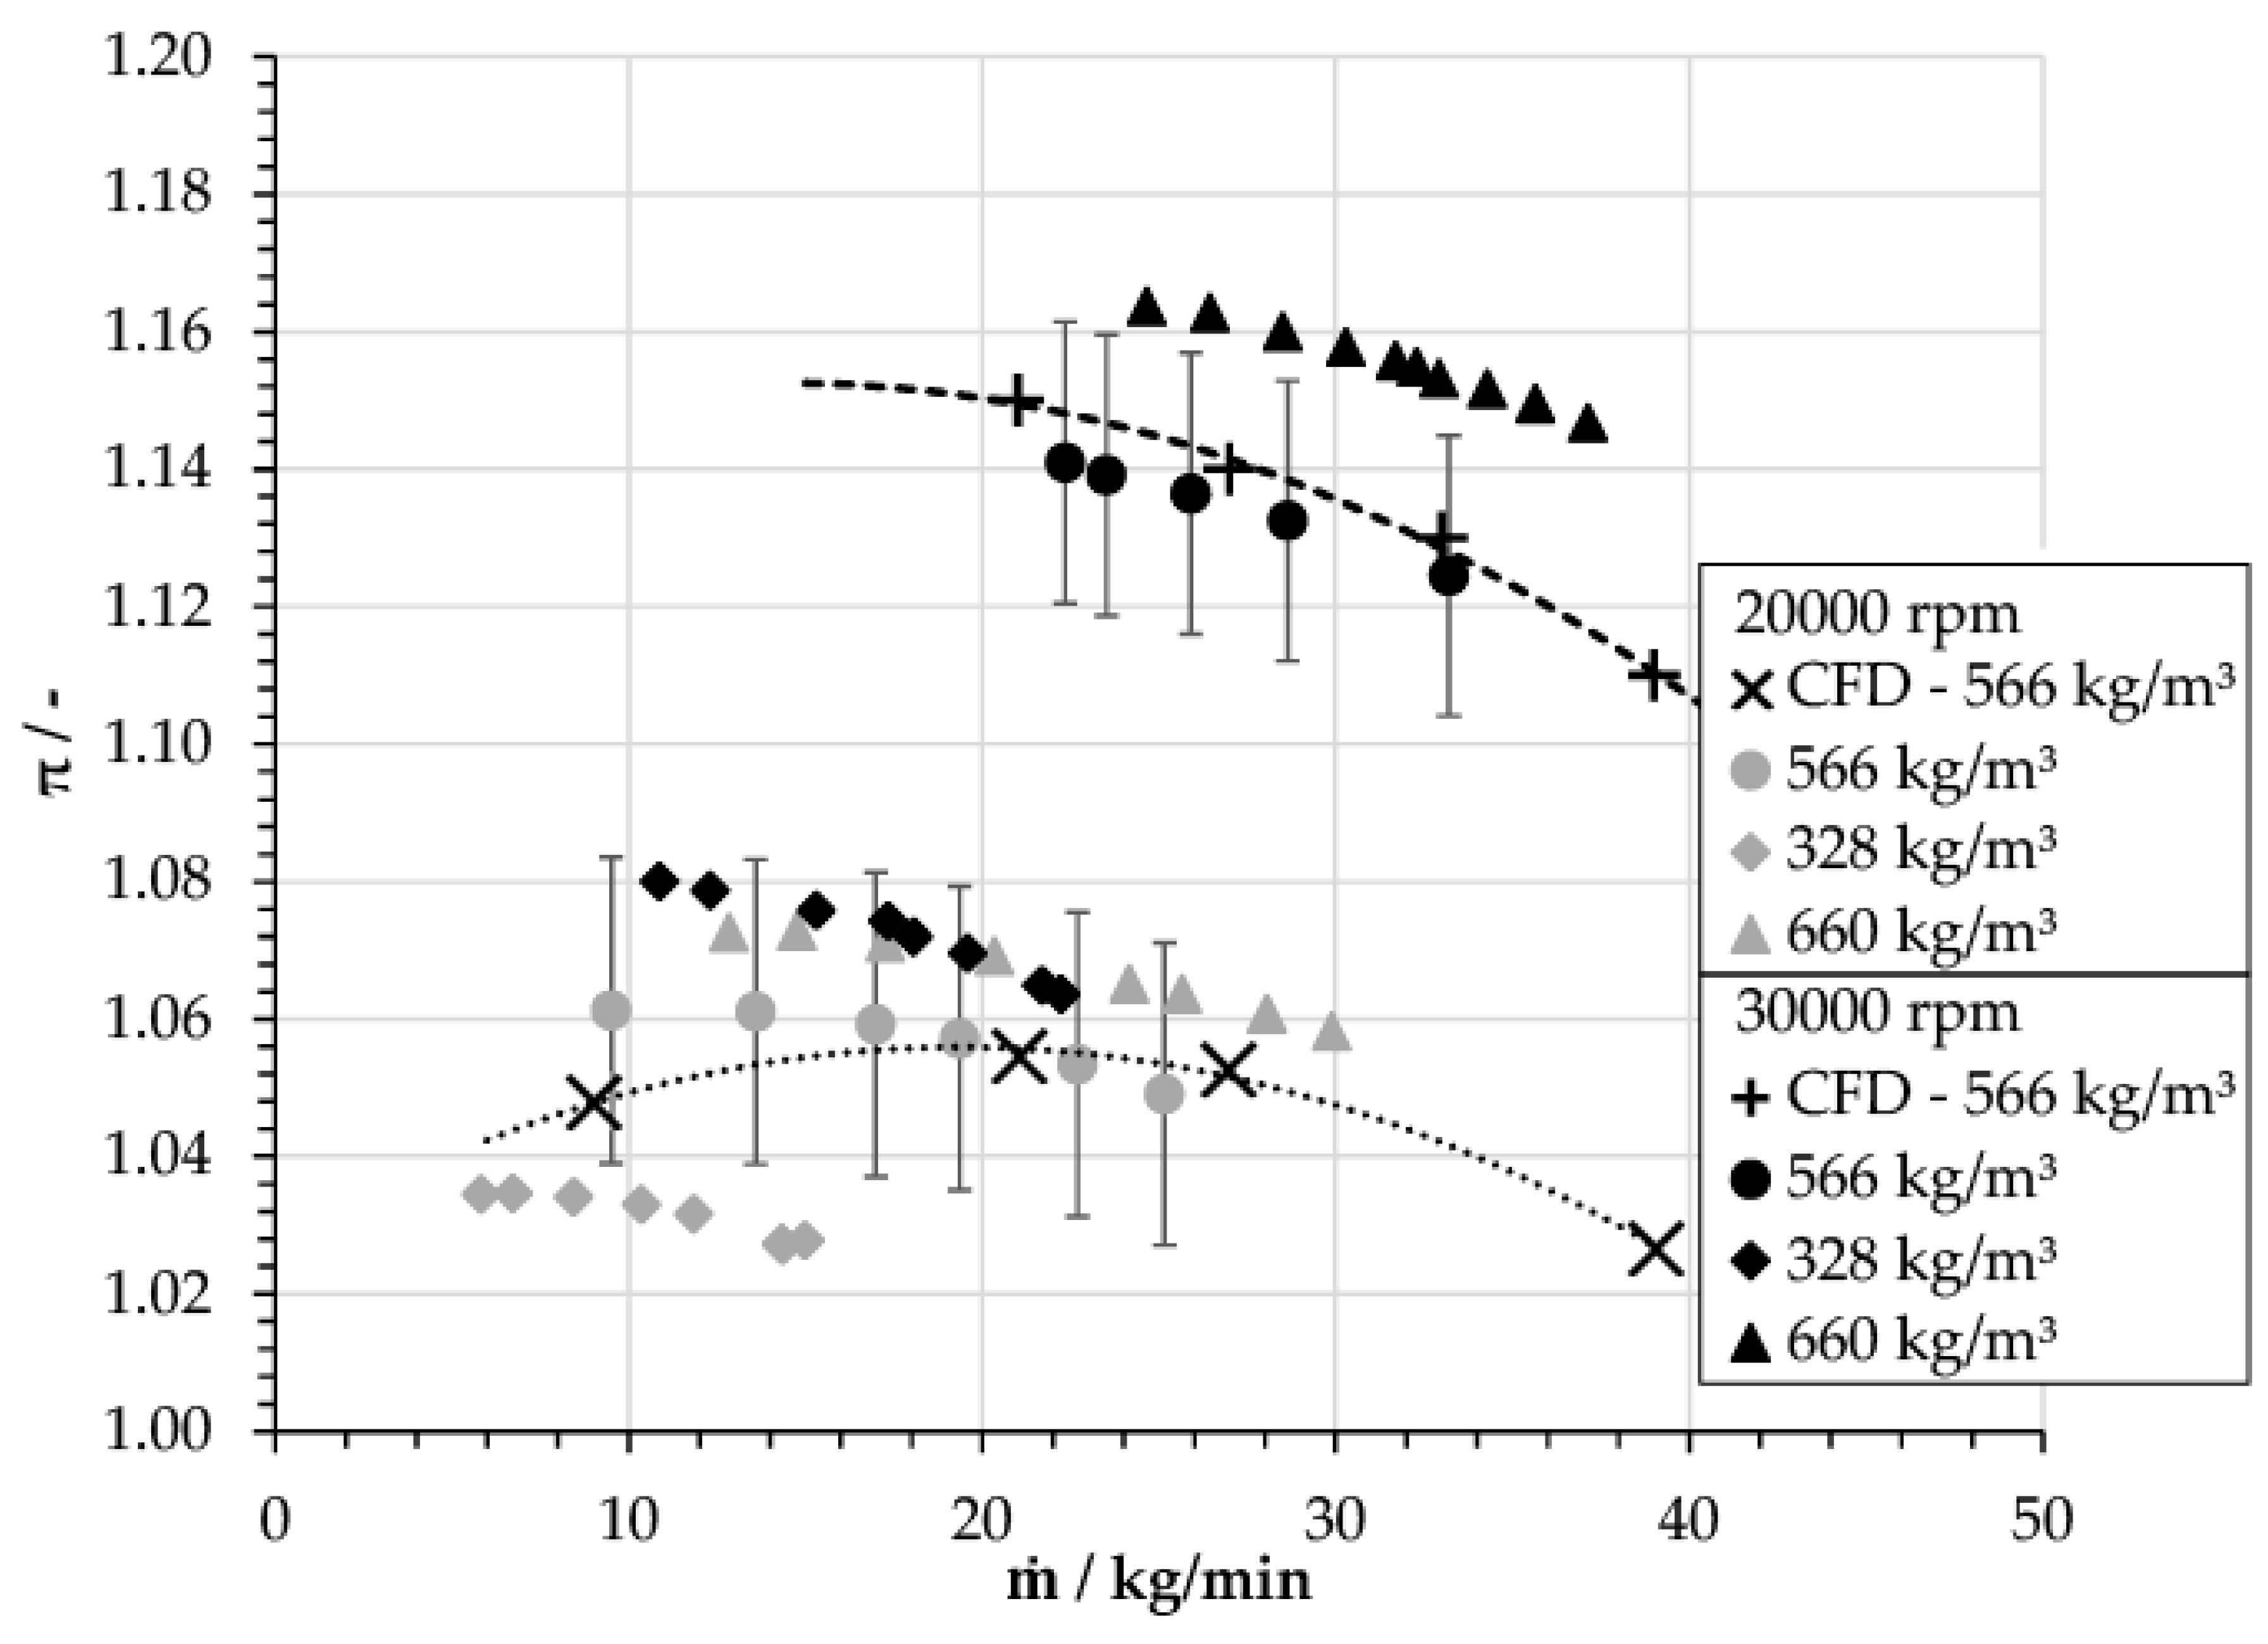
The performance test of the sCO2-HeRo compressor was conducted at several rotational speeds and inlet conditions. At each rotational speed, the static inlet temperature was adjusted by regulating the water flow rate through the cooler—thereby changing the cooling power—and finally tuning the static inlet pressure by inventory control. The results identified density as the main parameter of reference for the compressor inlet conditions. Therefore, tests were conducted for three different inlet conditions set by the static pressure and temperature and defined by the densities with 660 kg/m³ (79.3 bar and 31.5 °C, high inlet density case), 566 kg/m³ (78.3 bar and 33 °C, nominal inlet density case), and for 328 kg/m³ (77.3 bar and 34.5 °C, low inlet density case). Those conditions define inlet states left and right of the pseudocritical line. In
Figure 3, which shows the pressure ratio of the static outlet to inlet pressure π against the compressor inlet mass flow rate
ṁ, different markers indicate these states. Two rotational speeds are depicted, which respectively correspond to 40% and 60% of nominal rotational speed, thus leading to a relatively small pressure ratio while the nominal value is
π = 1.5 and
ṁ = 0.65 kg/s. It contains the performance measurements as well as the results from computational fluid dynamics (CFD) calculations for the nominal inlet density case, and shows the good agreement of measurements and CFD (Hacks et al. [
3]). The strong impact of the inlet density on the pressure ratio π is clearly visible, while the static inlet temperature changes were only modest with ±1.5 °C from the low or high inlet density case to the nominal case. More details about the test procedure and results are given by Hacks et al. [
3].
The test results reveal the expected strong influence of the inlet density on the operational point of the compressor. Therefore, the operational stability and controllability of the compressor need to be investigated with respect to the large dependency of density upon the inlet temperature.
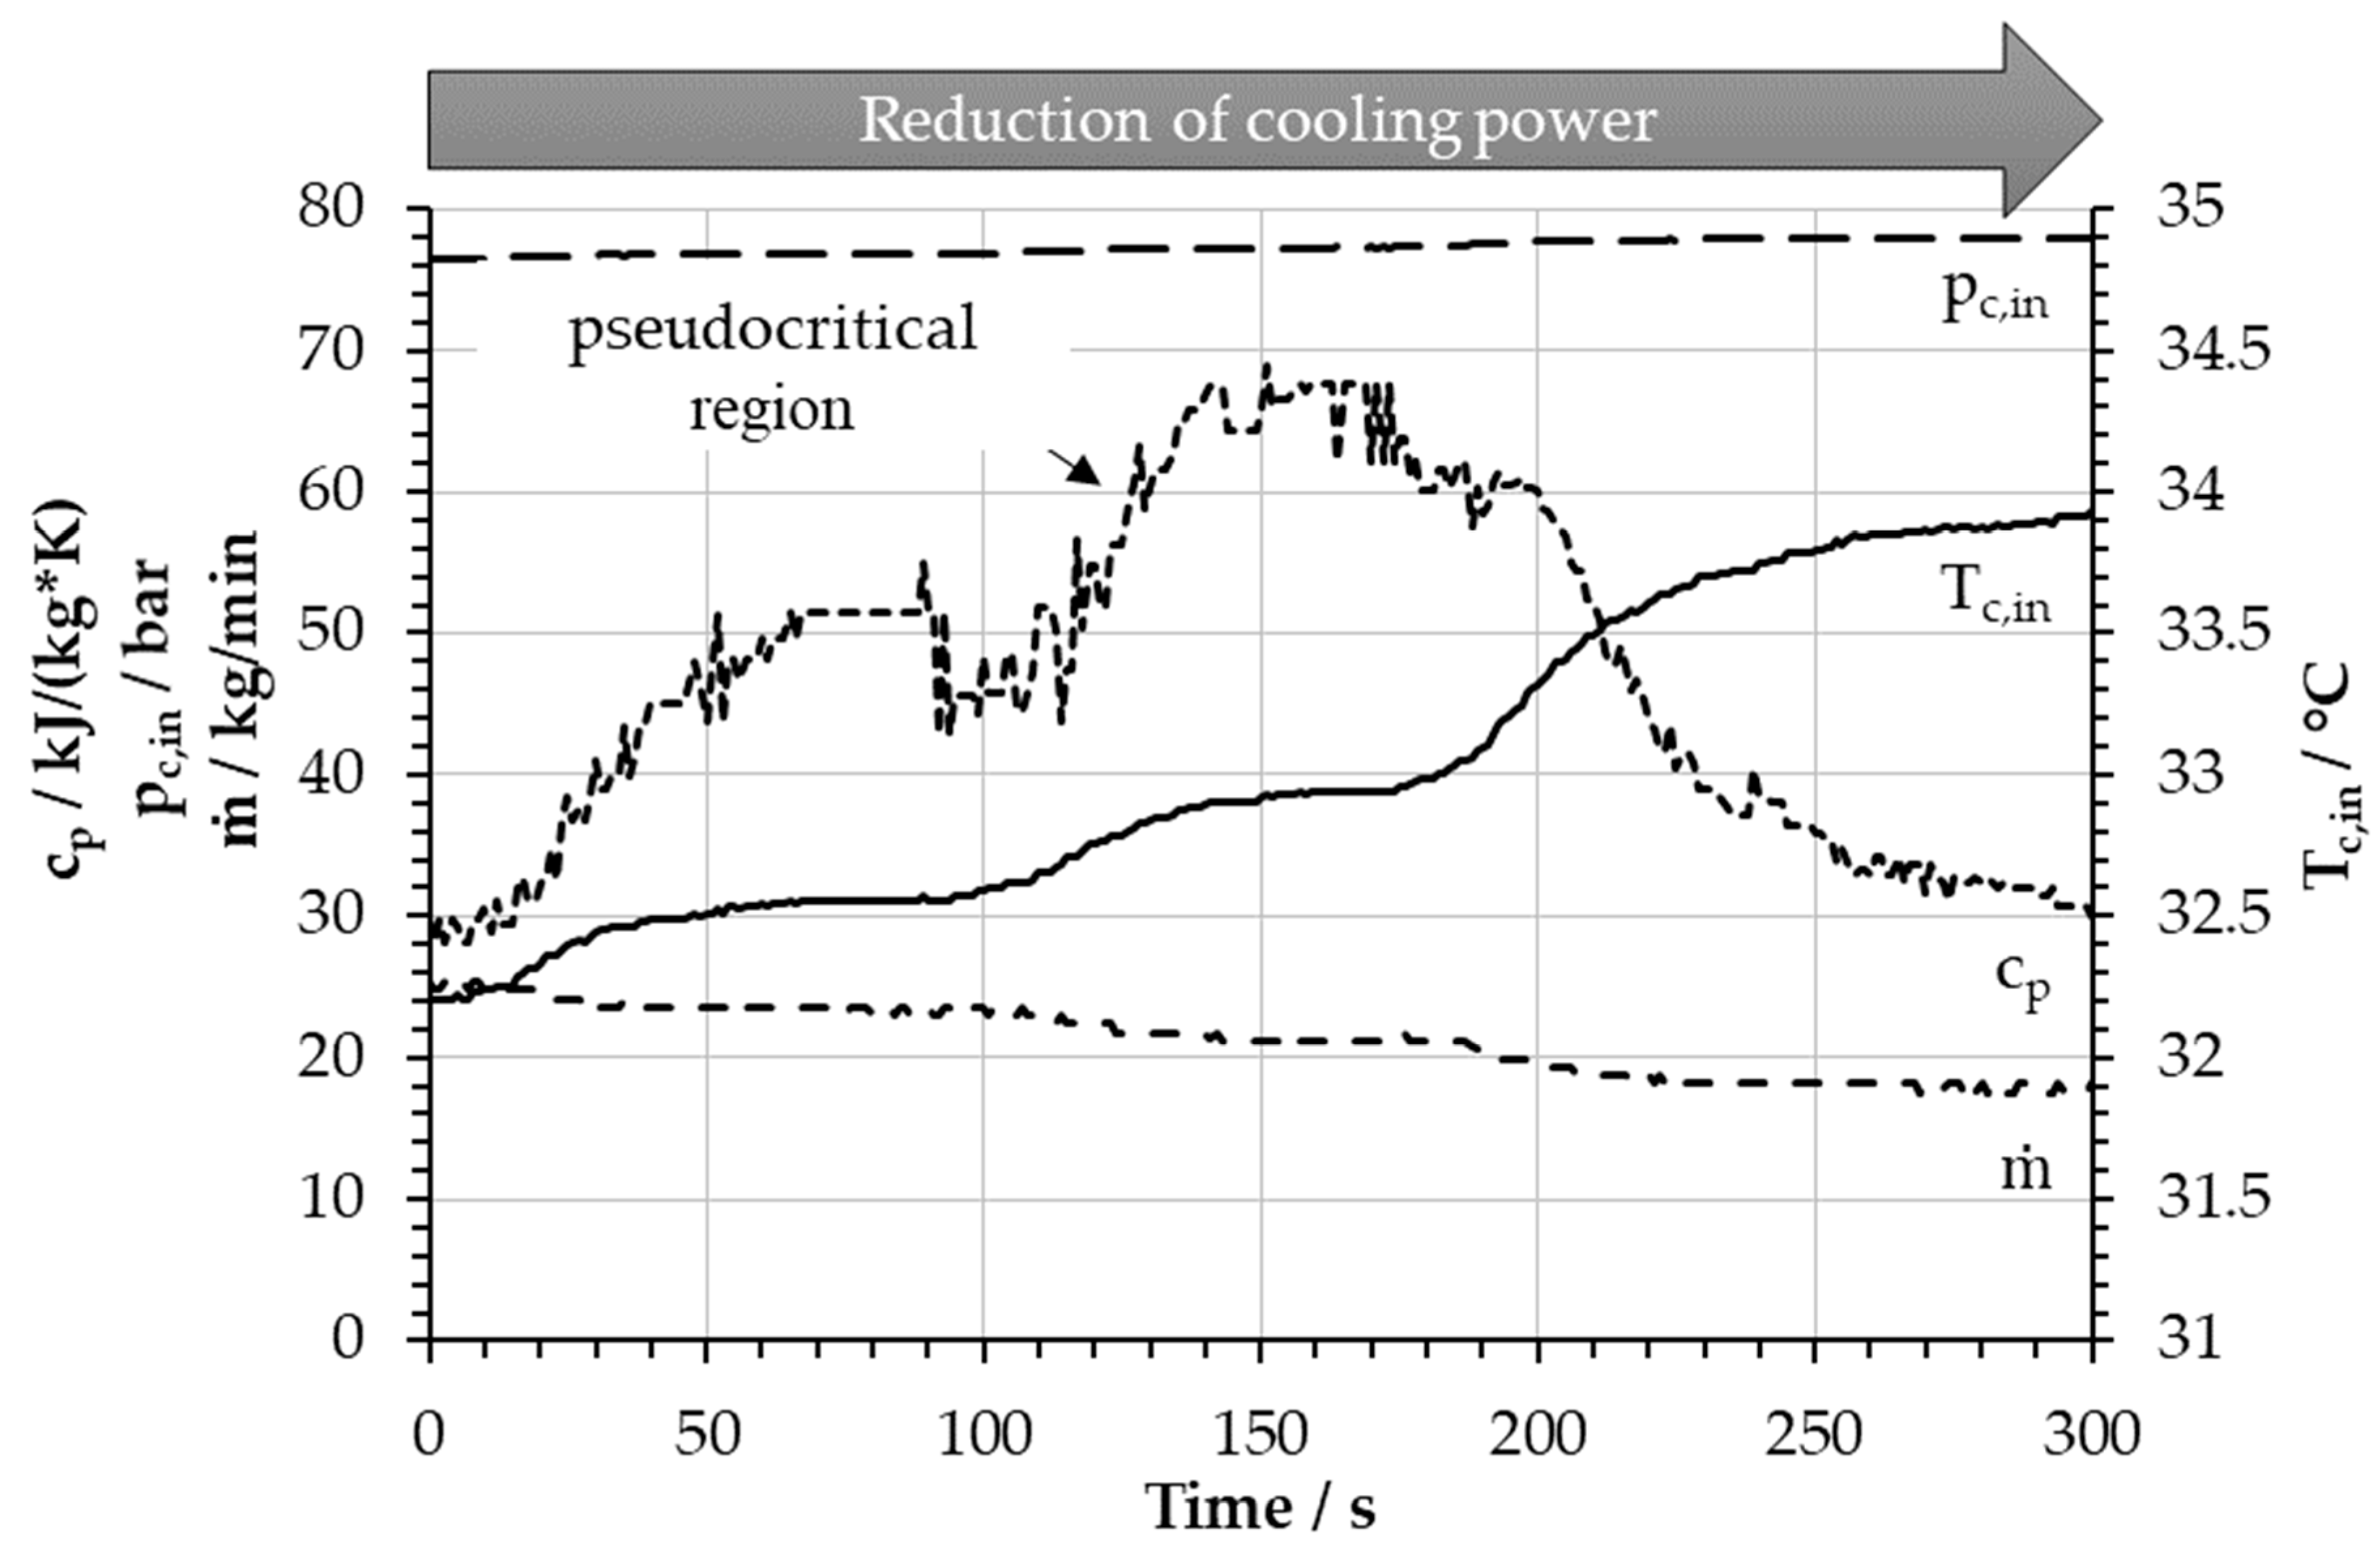
The recorded measurements in
Figure 4 exemplarily show the change of static inlet temperature
Tc,in, static inlet pressure
pc,in, inlet mass flow rate ṁ, and inlet specific heat capacity
cp derived from temperature and pressure measurements while crossing the pseudocritical line. They allow for investigation of the stability of the compressor operation related to the static inlet temperature, which was adjusted by regulating the cooling power while keeping the rotational speed constant, and no other measures to influence the inlet conditions were taken. During the reduction of cooling power, the isobaric heat capacity increased from
cp,0s = 30 kJ/(kgK) to a maximum of about
cp,150s = 70 kJ/(kgK) at 150 s, before it decreased again to about
cp,300s = 30 kJ/(kgK) at 300 s. The temperature in the whole 300 s increased by 1.7 °C. At around 150 s, the pseudocritical line was crossed, and in the approximately 50 s of the maximum of
cp, the temperature rise was only about 0.3 °C. Mass flow rate and pressure at the compressor inlet were also shown to point out existing cross-coupling effects due to simultaneous change of mass flow and pressure in the closed loop. During the 300 s, no sudden change of compressor pressure ratio was observed, despite the strong variations in compressor pressure ratio depending on the static inlet temperature observed in the performance test (
Figure 3). This suggests there exists a stabilizing effect which prevents sudden changes of compressor performance and is related to the shown temperature plateau.
4. Theoretical Analysis of the Fluid Property Behavior During the Change of Cooling Power for the Application in the sCO2-HeRo
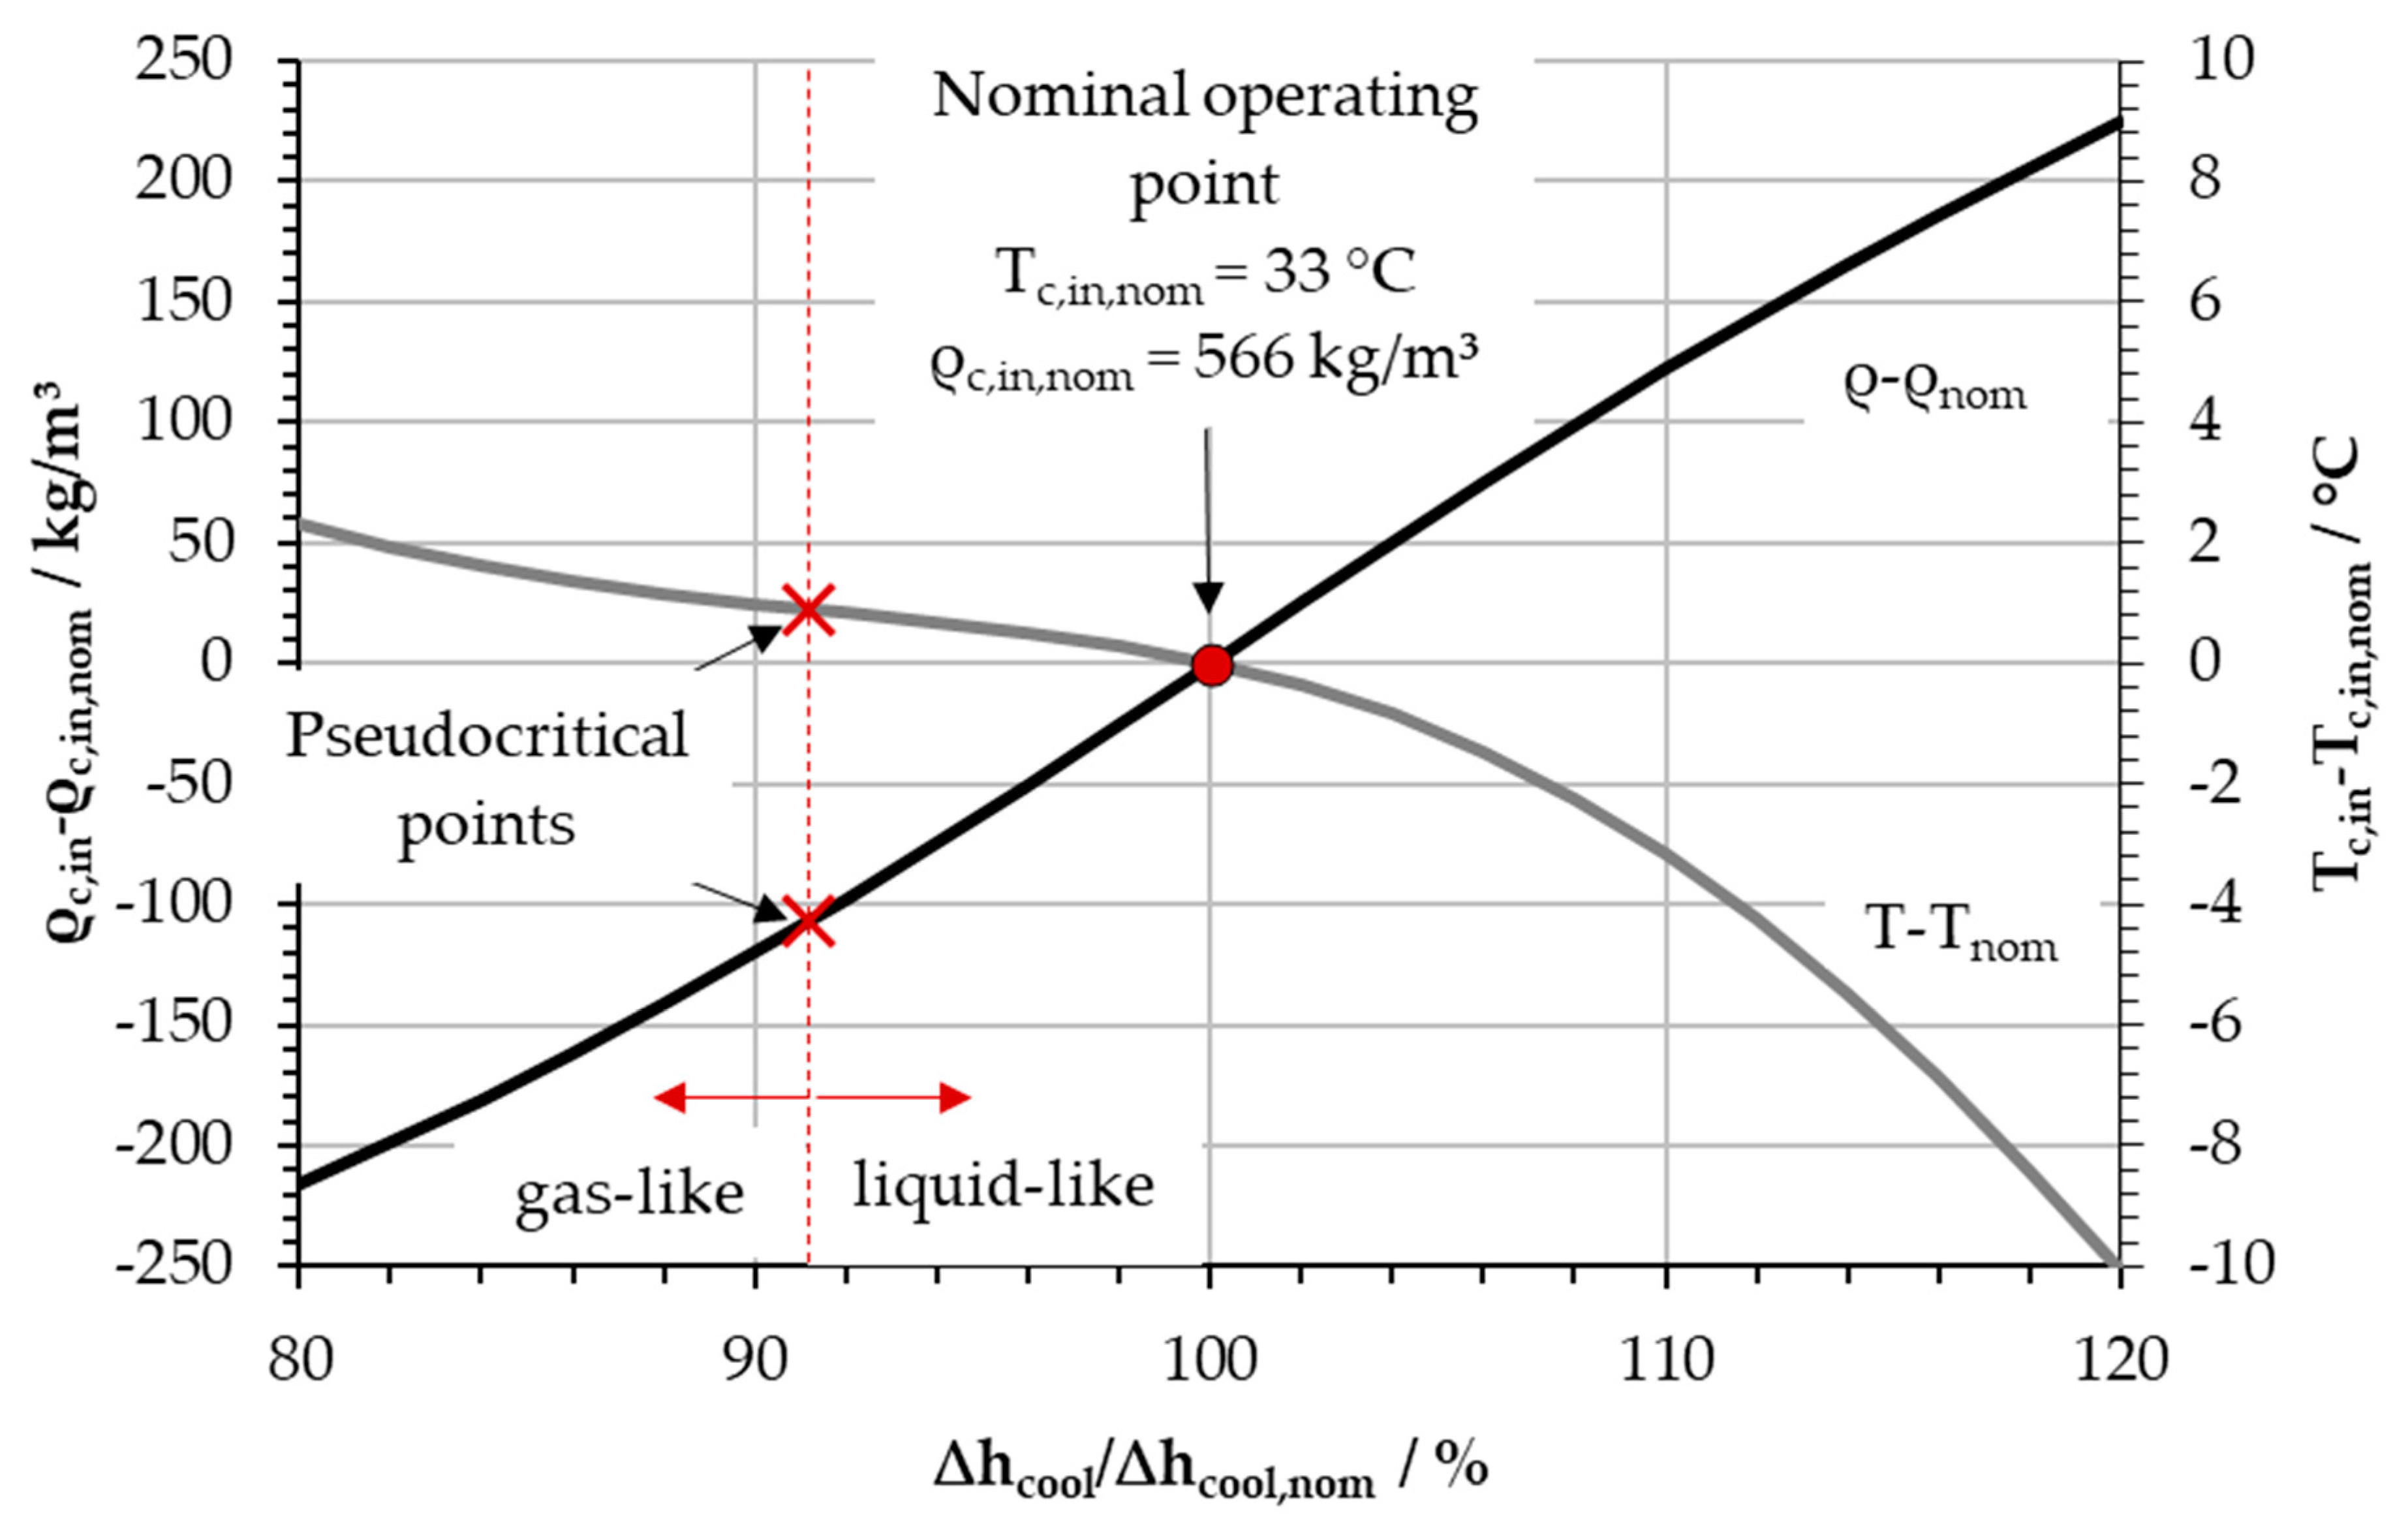
For analysis of the mentioned effect, the observation of
Figure 4 is reproduced with theoretical data in
Figure 5, which presents the change of compressor inlet density and temperature over the change of cooling power. The nominal conditions of the sCO2-HeRo cycle of static state
Tcool,in,nom = 167 °C and
pcool,in,nom =
pc,in,nom = 78.3 bar at the cooler inlet were applied, neglecting pressure losses in the cooler. The enthalpy drop ∆
hcool, which was used as an equivalent to cooling power for constant mass flow rate ṁ, is related to the nominal enthalpy drop ∆
hcool,nom in the cooler of 288 kJ/kg (=100%). The plateau around the pseudocritical temperature, which was already presented in
Figure 4 at around 150 s, is clearly visible and indicates a small temperature change across the pseudocritical region. Further, to decrease the compressor inlet temperature from 33 °C (nominal) by 1.5 °C, the cooling power must be increased by 6%, while it must be decreased by 18% to increase the temperature by 1.5 °C due to crossing the pseudocritical line, as can be seen in
Figure 5. The density (cooler outlet density) with respect to the enthalpy drop allows for comparison of both the density and temperature curve. While the slope of the temperature curve reduces around the pseudocritical temperature, the slope of the density curve is almost constant. Thus, there exists an almost linear correlation between specific heat rejection and the compressor inlet density. This supports stable cycle operation and relativizes the impact of small temperature changes around the critical point on cycle operation.
5. Explanation of the Observation by sCO2 Properties
The correlation of density and cooling power (or enthalpy difference for constant mass flow of sCO2), which shall be referred to as stabilizing effect, is based on the peak of specific heat capacity in the pseudocritical region. It prevents small fluctuations in the cooling power from causing large changes in the physical properties of the sCO2 at the compressor inlet, which the high gradients dependent on the static temperature suggest.
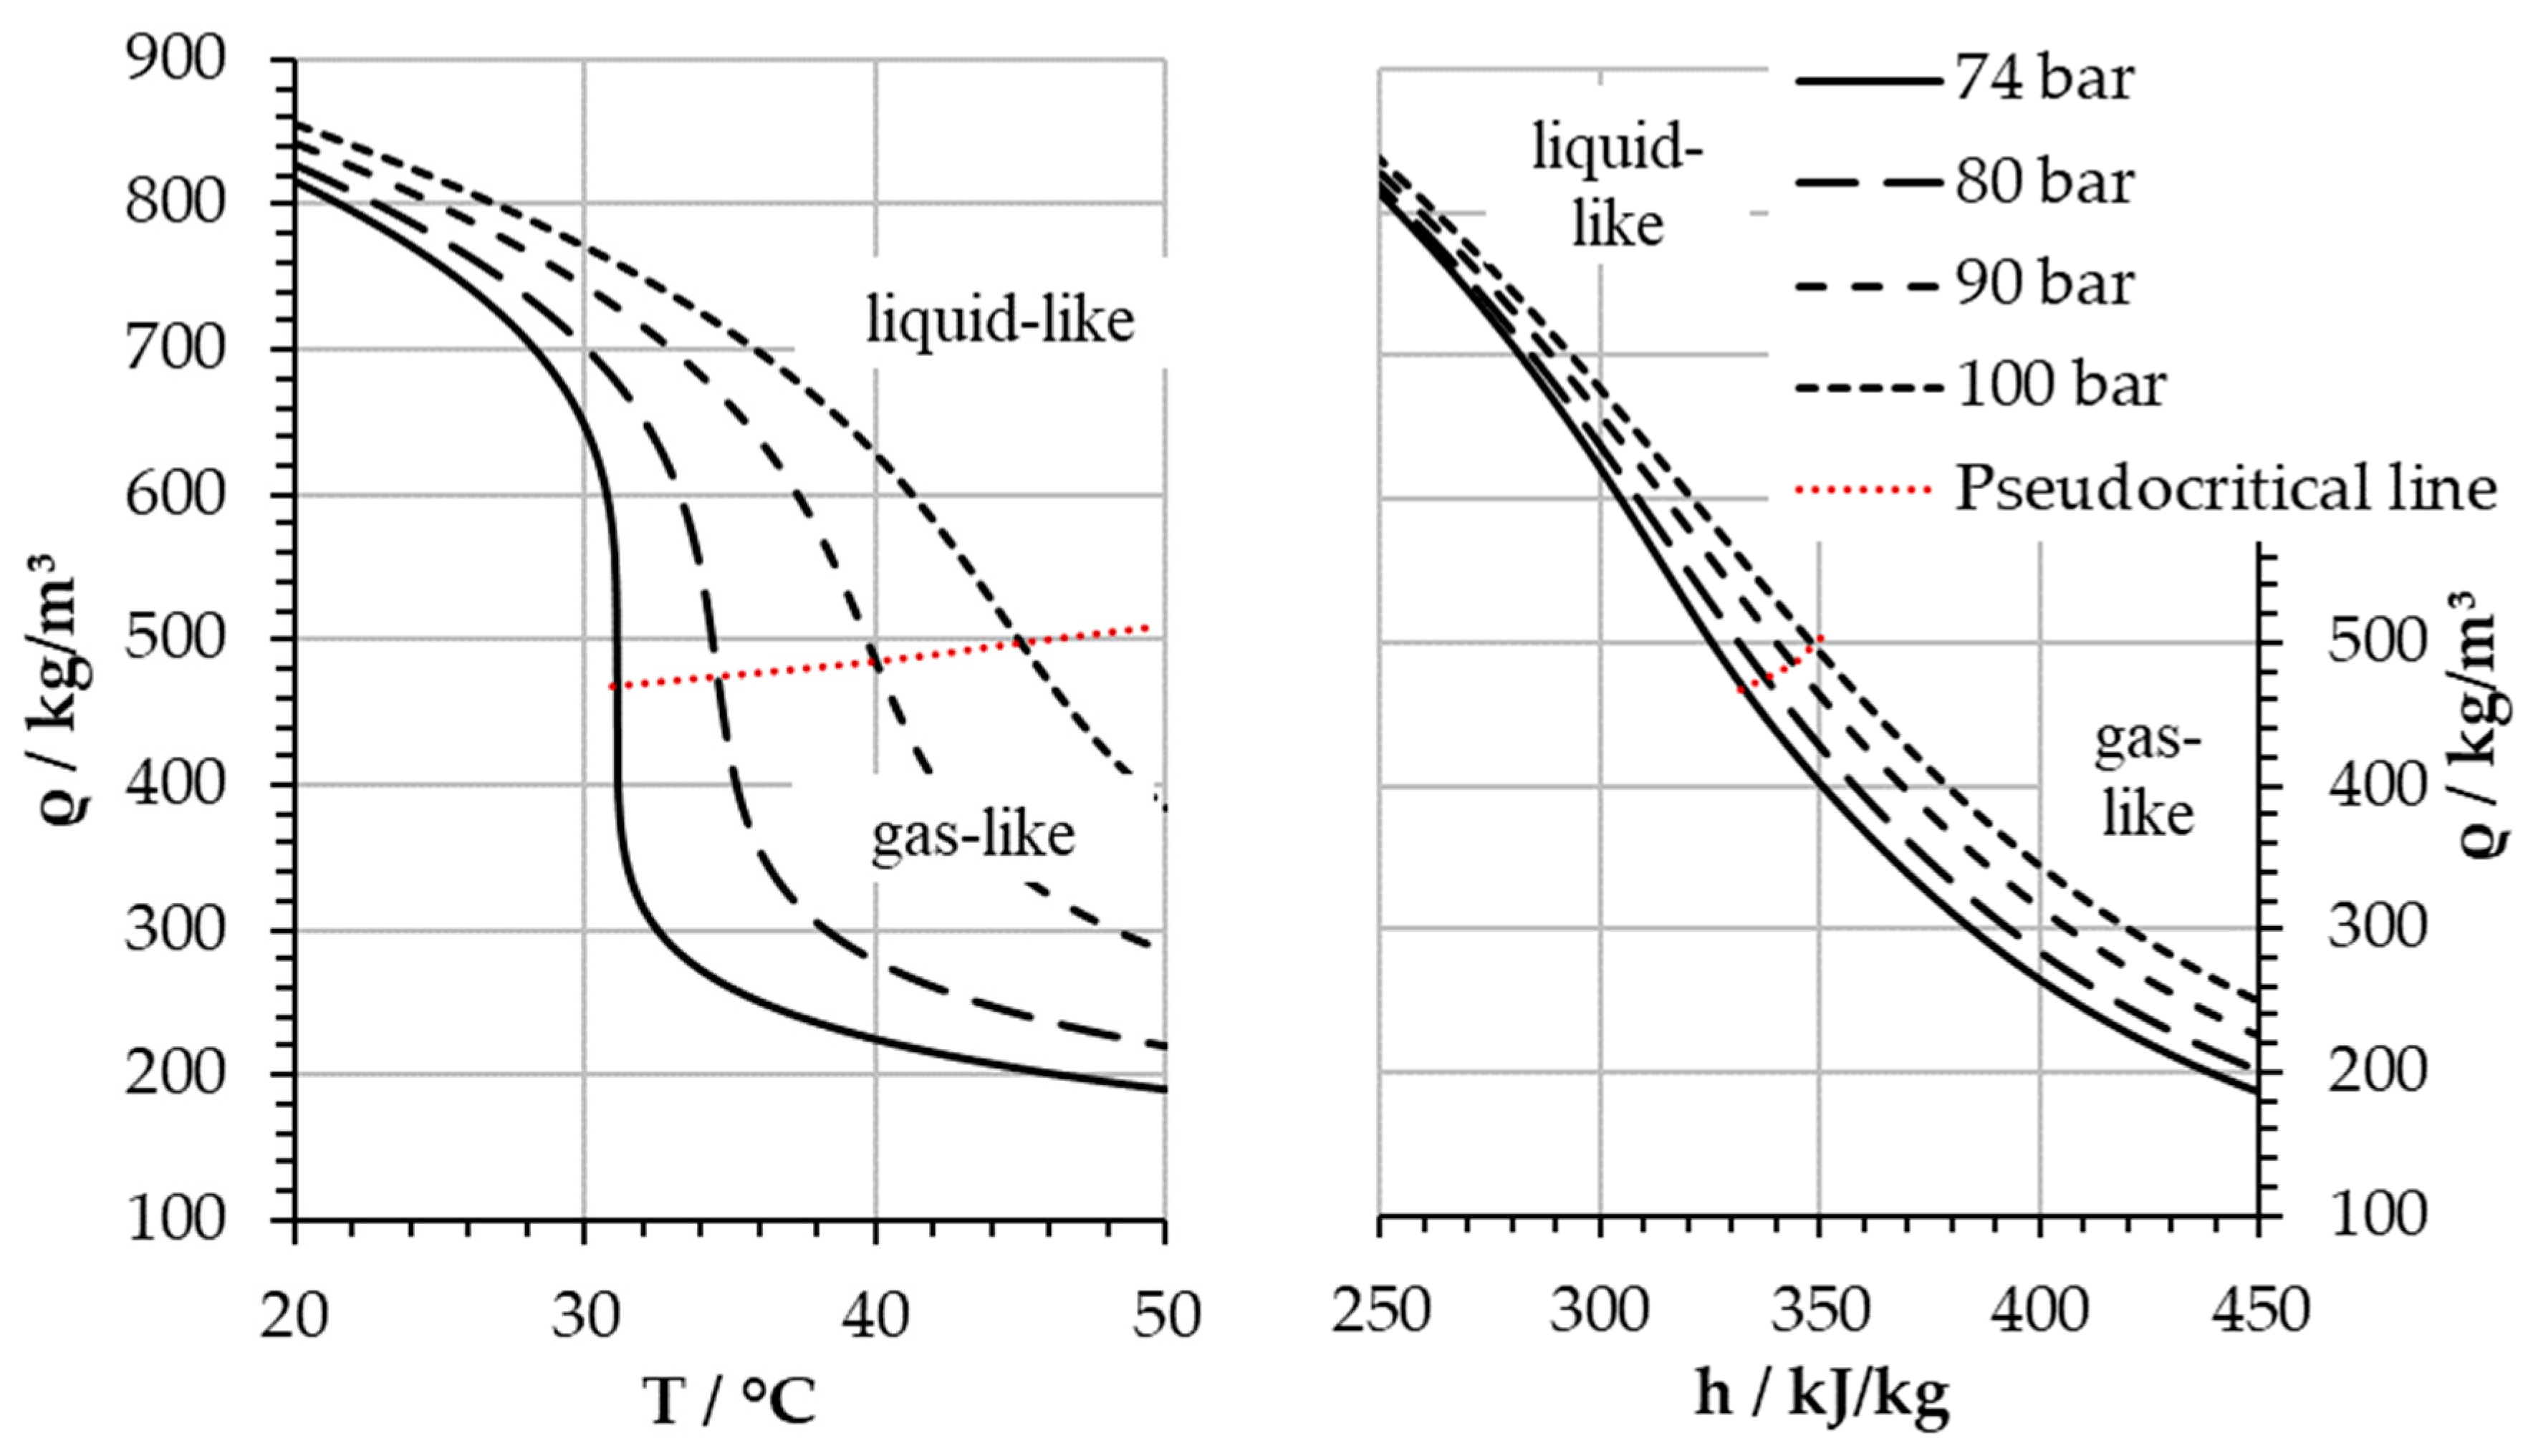
To gain further insight,
Figure 6 depicts the density along four isobars over temperature (left) and enthalpy (right) crossing the pseudocritical line. In the diagram on the left, the density drops rapidly along an isobar when moving from liquid-like to gas-like state. Conversely, such rapid changes are not visible when density is depicted over enthalpy. Further,
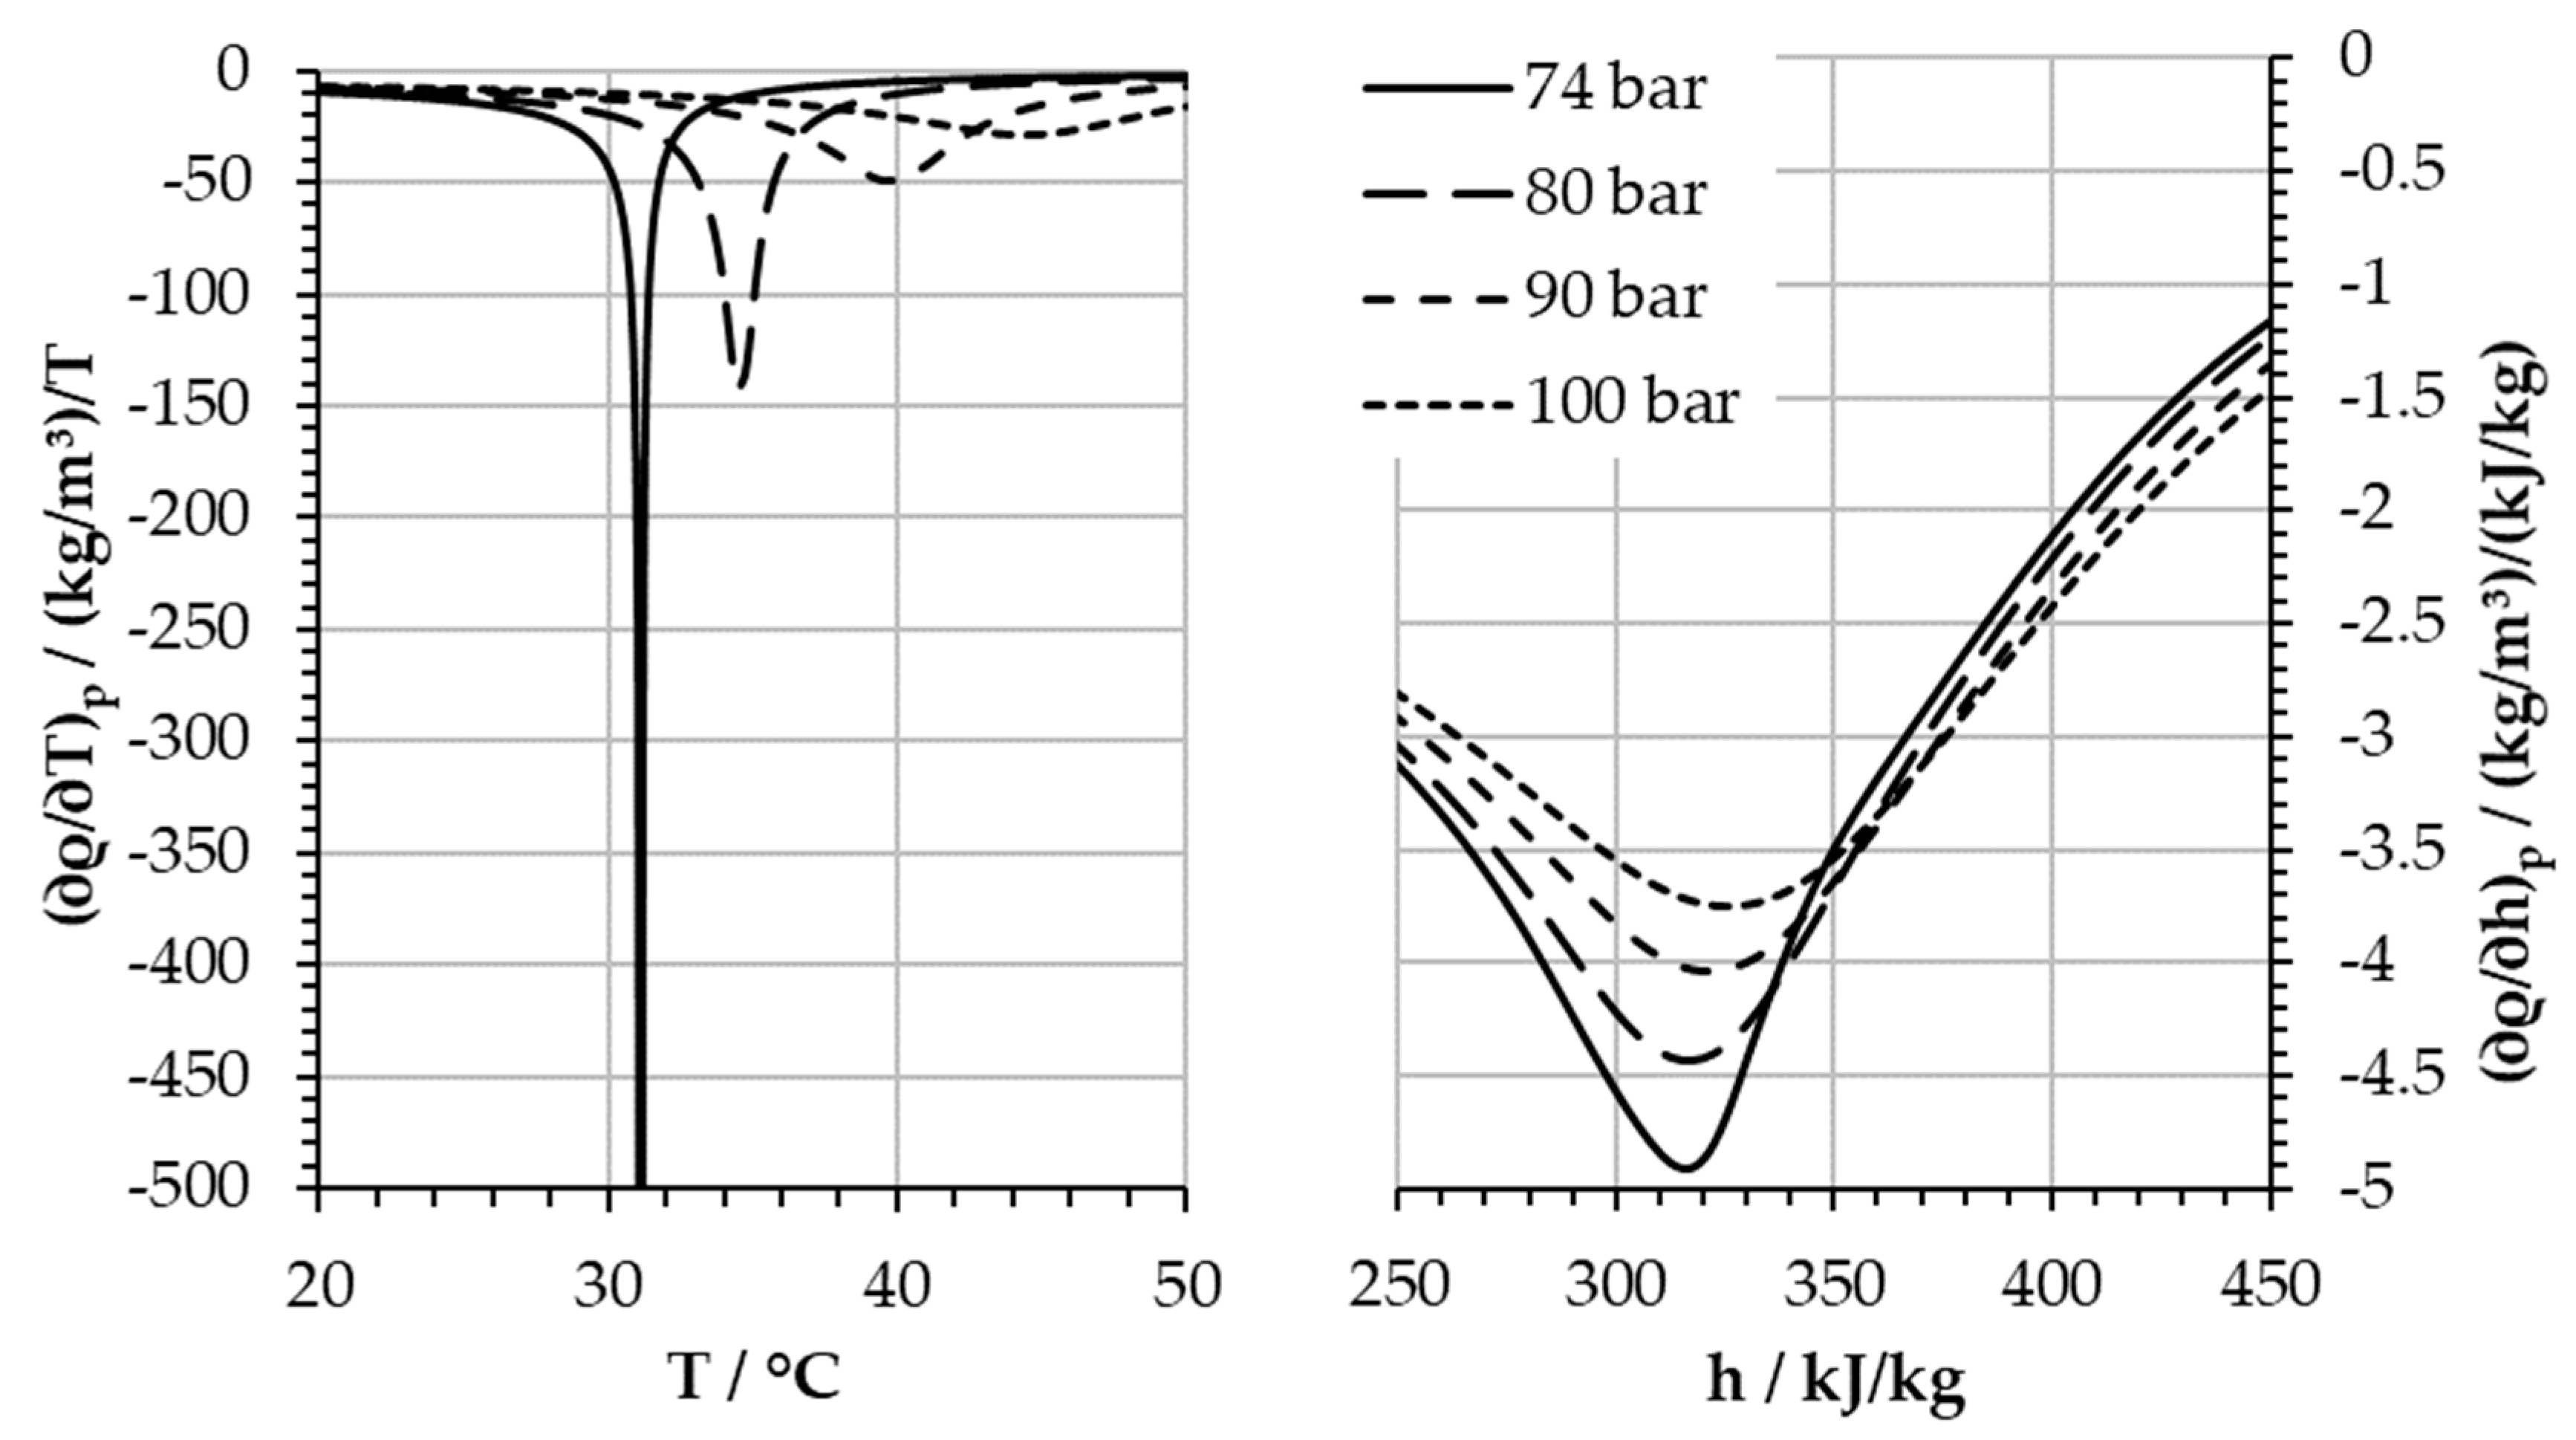
Figure 7 presents the gradients of the density with respect to the temperature (left) and enthalpy (right) along four isobars. Consistent to
Figure 6, the density gradients with respect to the enthalpy differ very little—maximally 4 (kg/m³)/(kJ/kg) for the whole depicted pressure range—and only slightly increase approaching the critical point. The density gradient with respect to temperature instead shows changes about 100-times higher in the region around the pseudocritical line. Further, the density close to the pseudocritical line is not only a strong function of temperature but also of pressure. Thus, the uncertainties of the pressure measurements have a strong impact if density is calculated from temperature and pressure. Instead, the pressure measurements have only low impact if the density is calculated from enthalpy and pressure. Therefore, the cooling power is an appropriate control parameter to define the inlet enthalpy and thus the inlet density into the compressor, even very close to the critical point.
6. Application Range
On the basis of the unrecuperated simple Joule cycle with low turbine inlet temperature analyzed in the previous paragraphs, we extended the investigations to a wider application range. The focus was on the effects of the pressure level and the enthalpy drop across the cooler. The evaluation of the application range allows us to specify the significance of the effect for different cycle layouts.
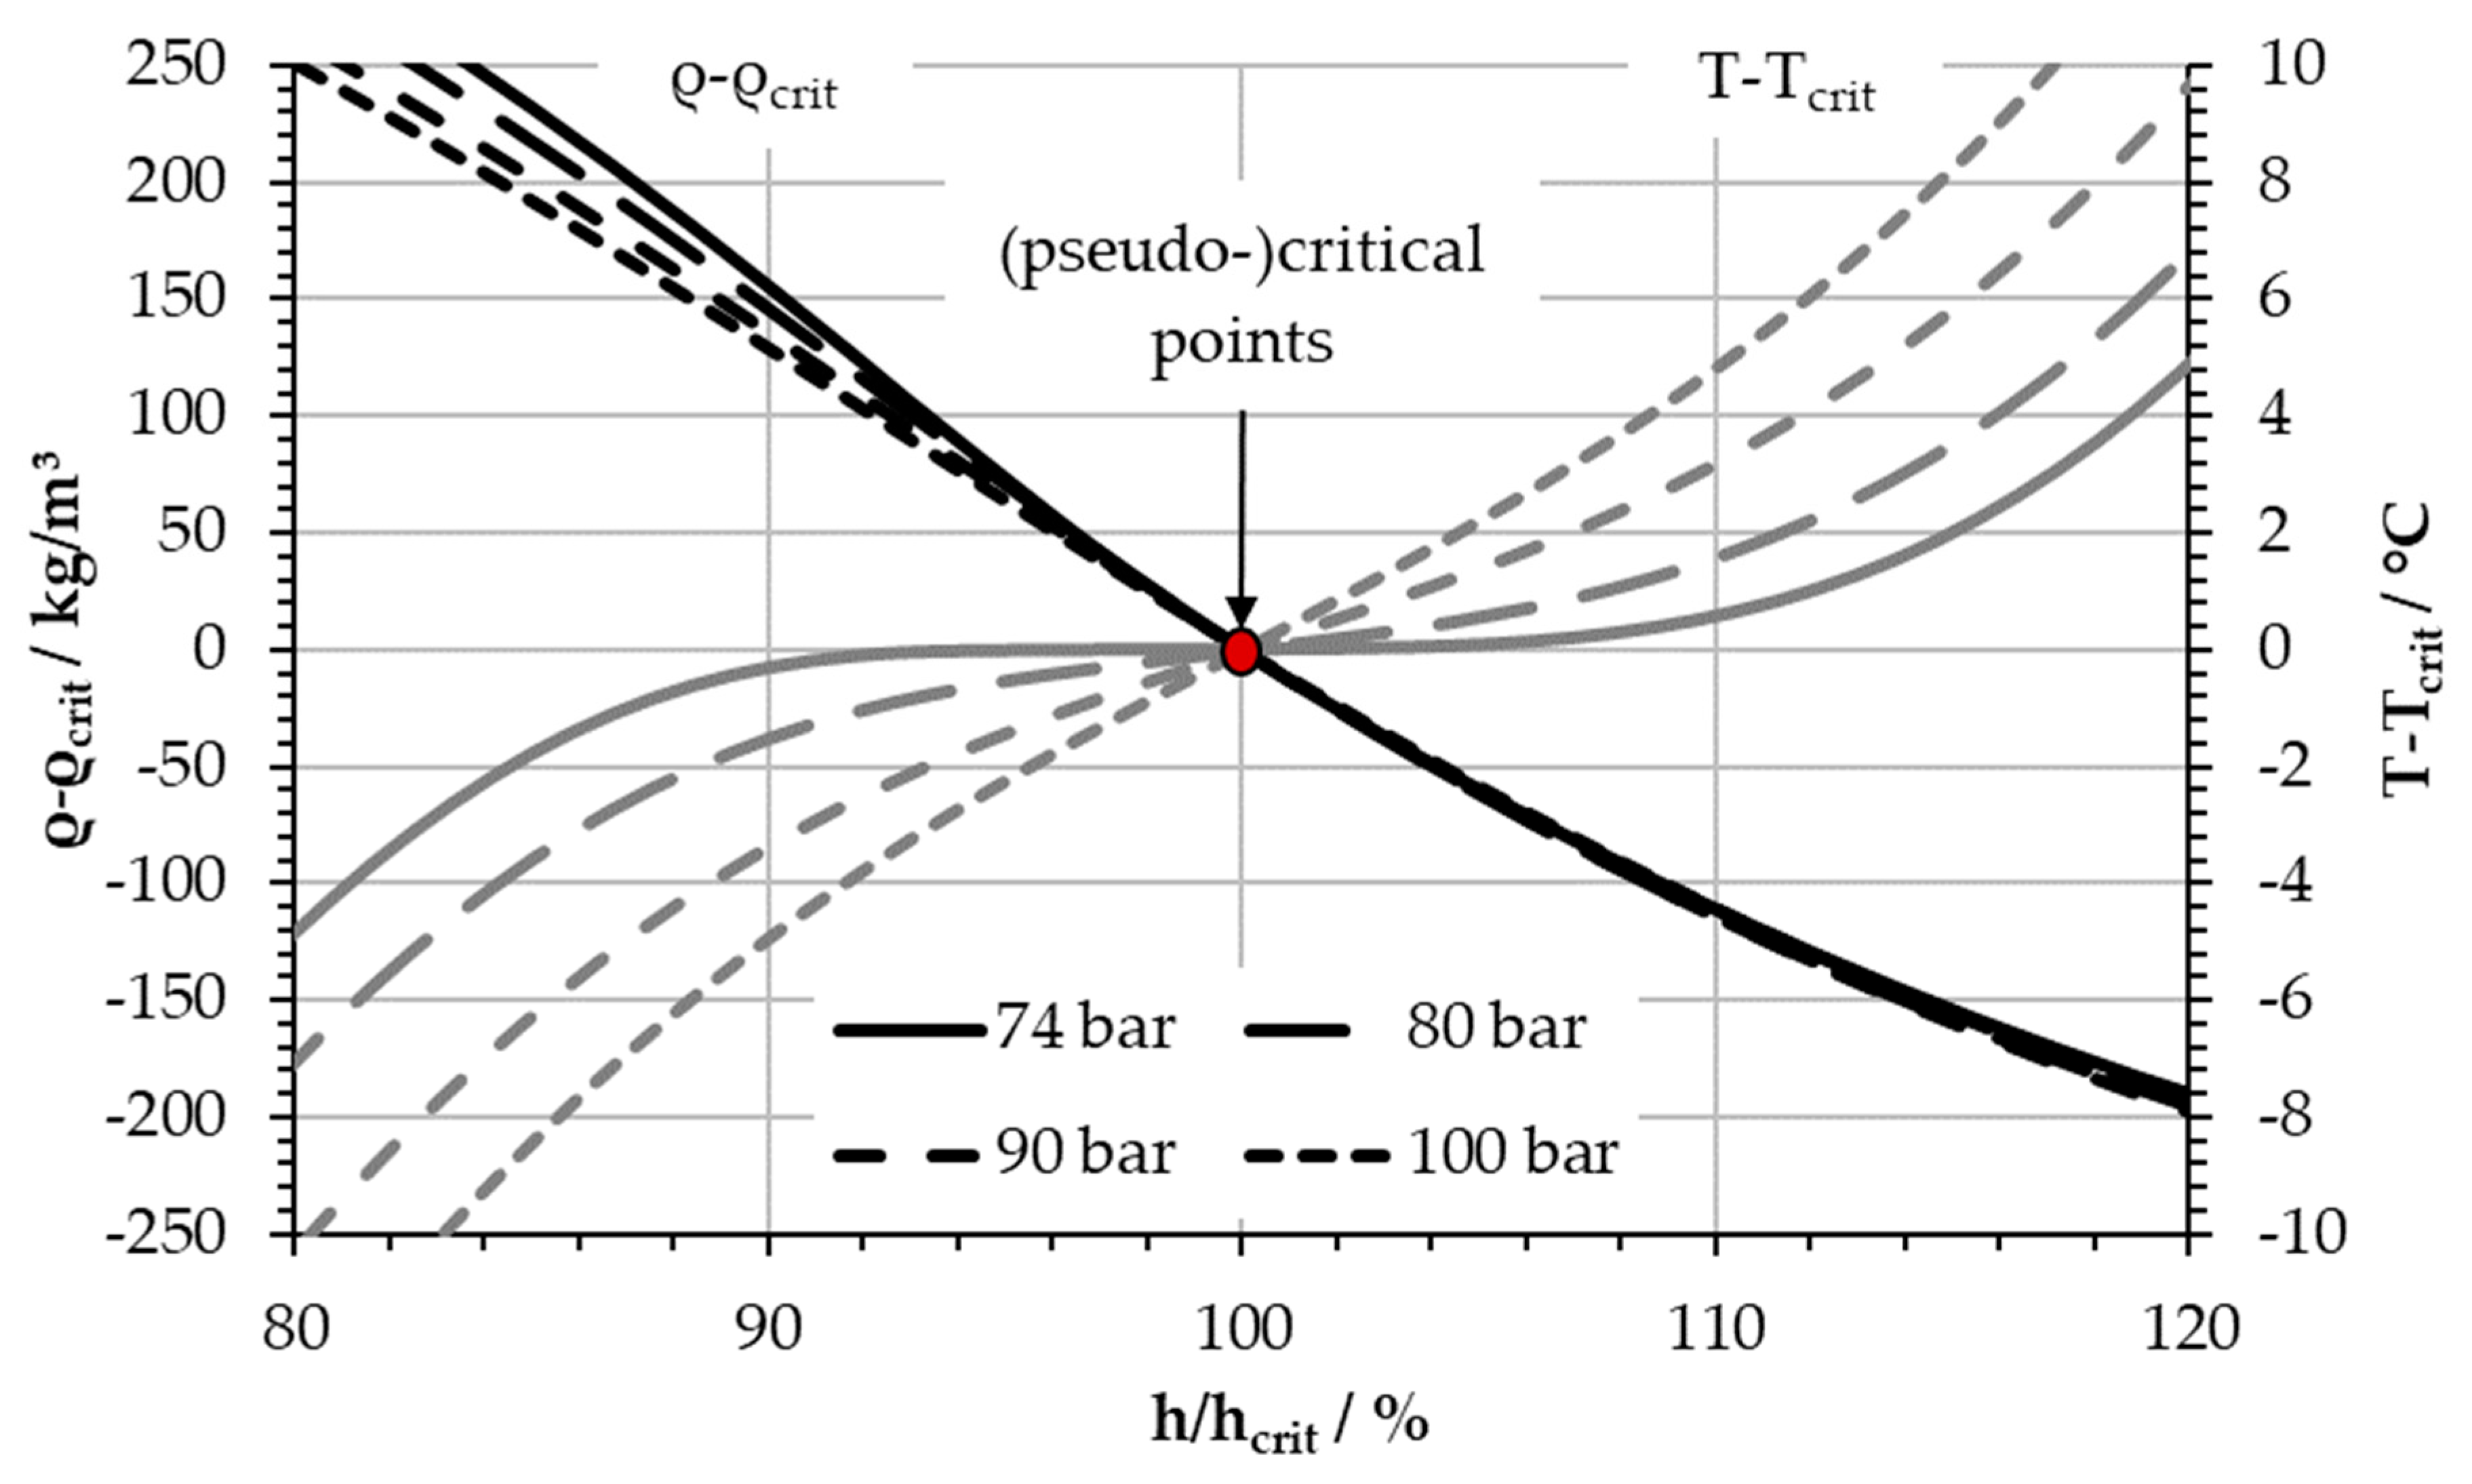
Figure 8 depicts the temperature and density as a function of enthalpy, related to the values at the (pseudo)critical point for different pressure levels. It presents temperature plateaus, which decreased with increasing pressure. At 100 bar the plateau is hardly visible. Thus, temperature measurement is inappropriate for control close to the critical point but becomes more suitable as a control parameter with rising pressure. At the same time the density curves have almost the same slope for all pressure levels. In the gas-like region (above
h/hcrit > 100%), the curves are especially close together. Further, the steepness of the density curves in the depicted enthalpy range slightly reduces with increasing pressure in the liquid-like region (
h/hcrit < 100%), which is consistent with
Figure 7. This suggests a generally increased operating stability of the compressor at higher pressure.
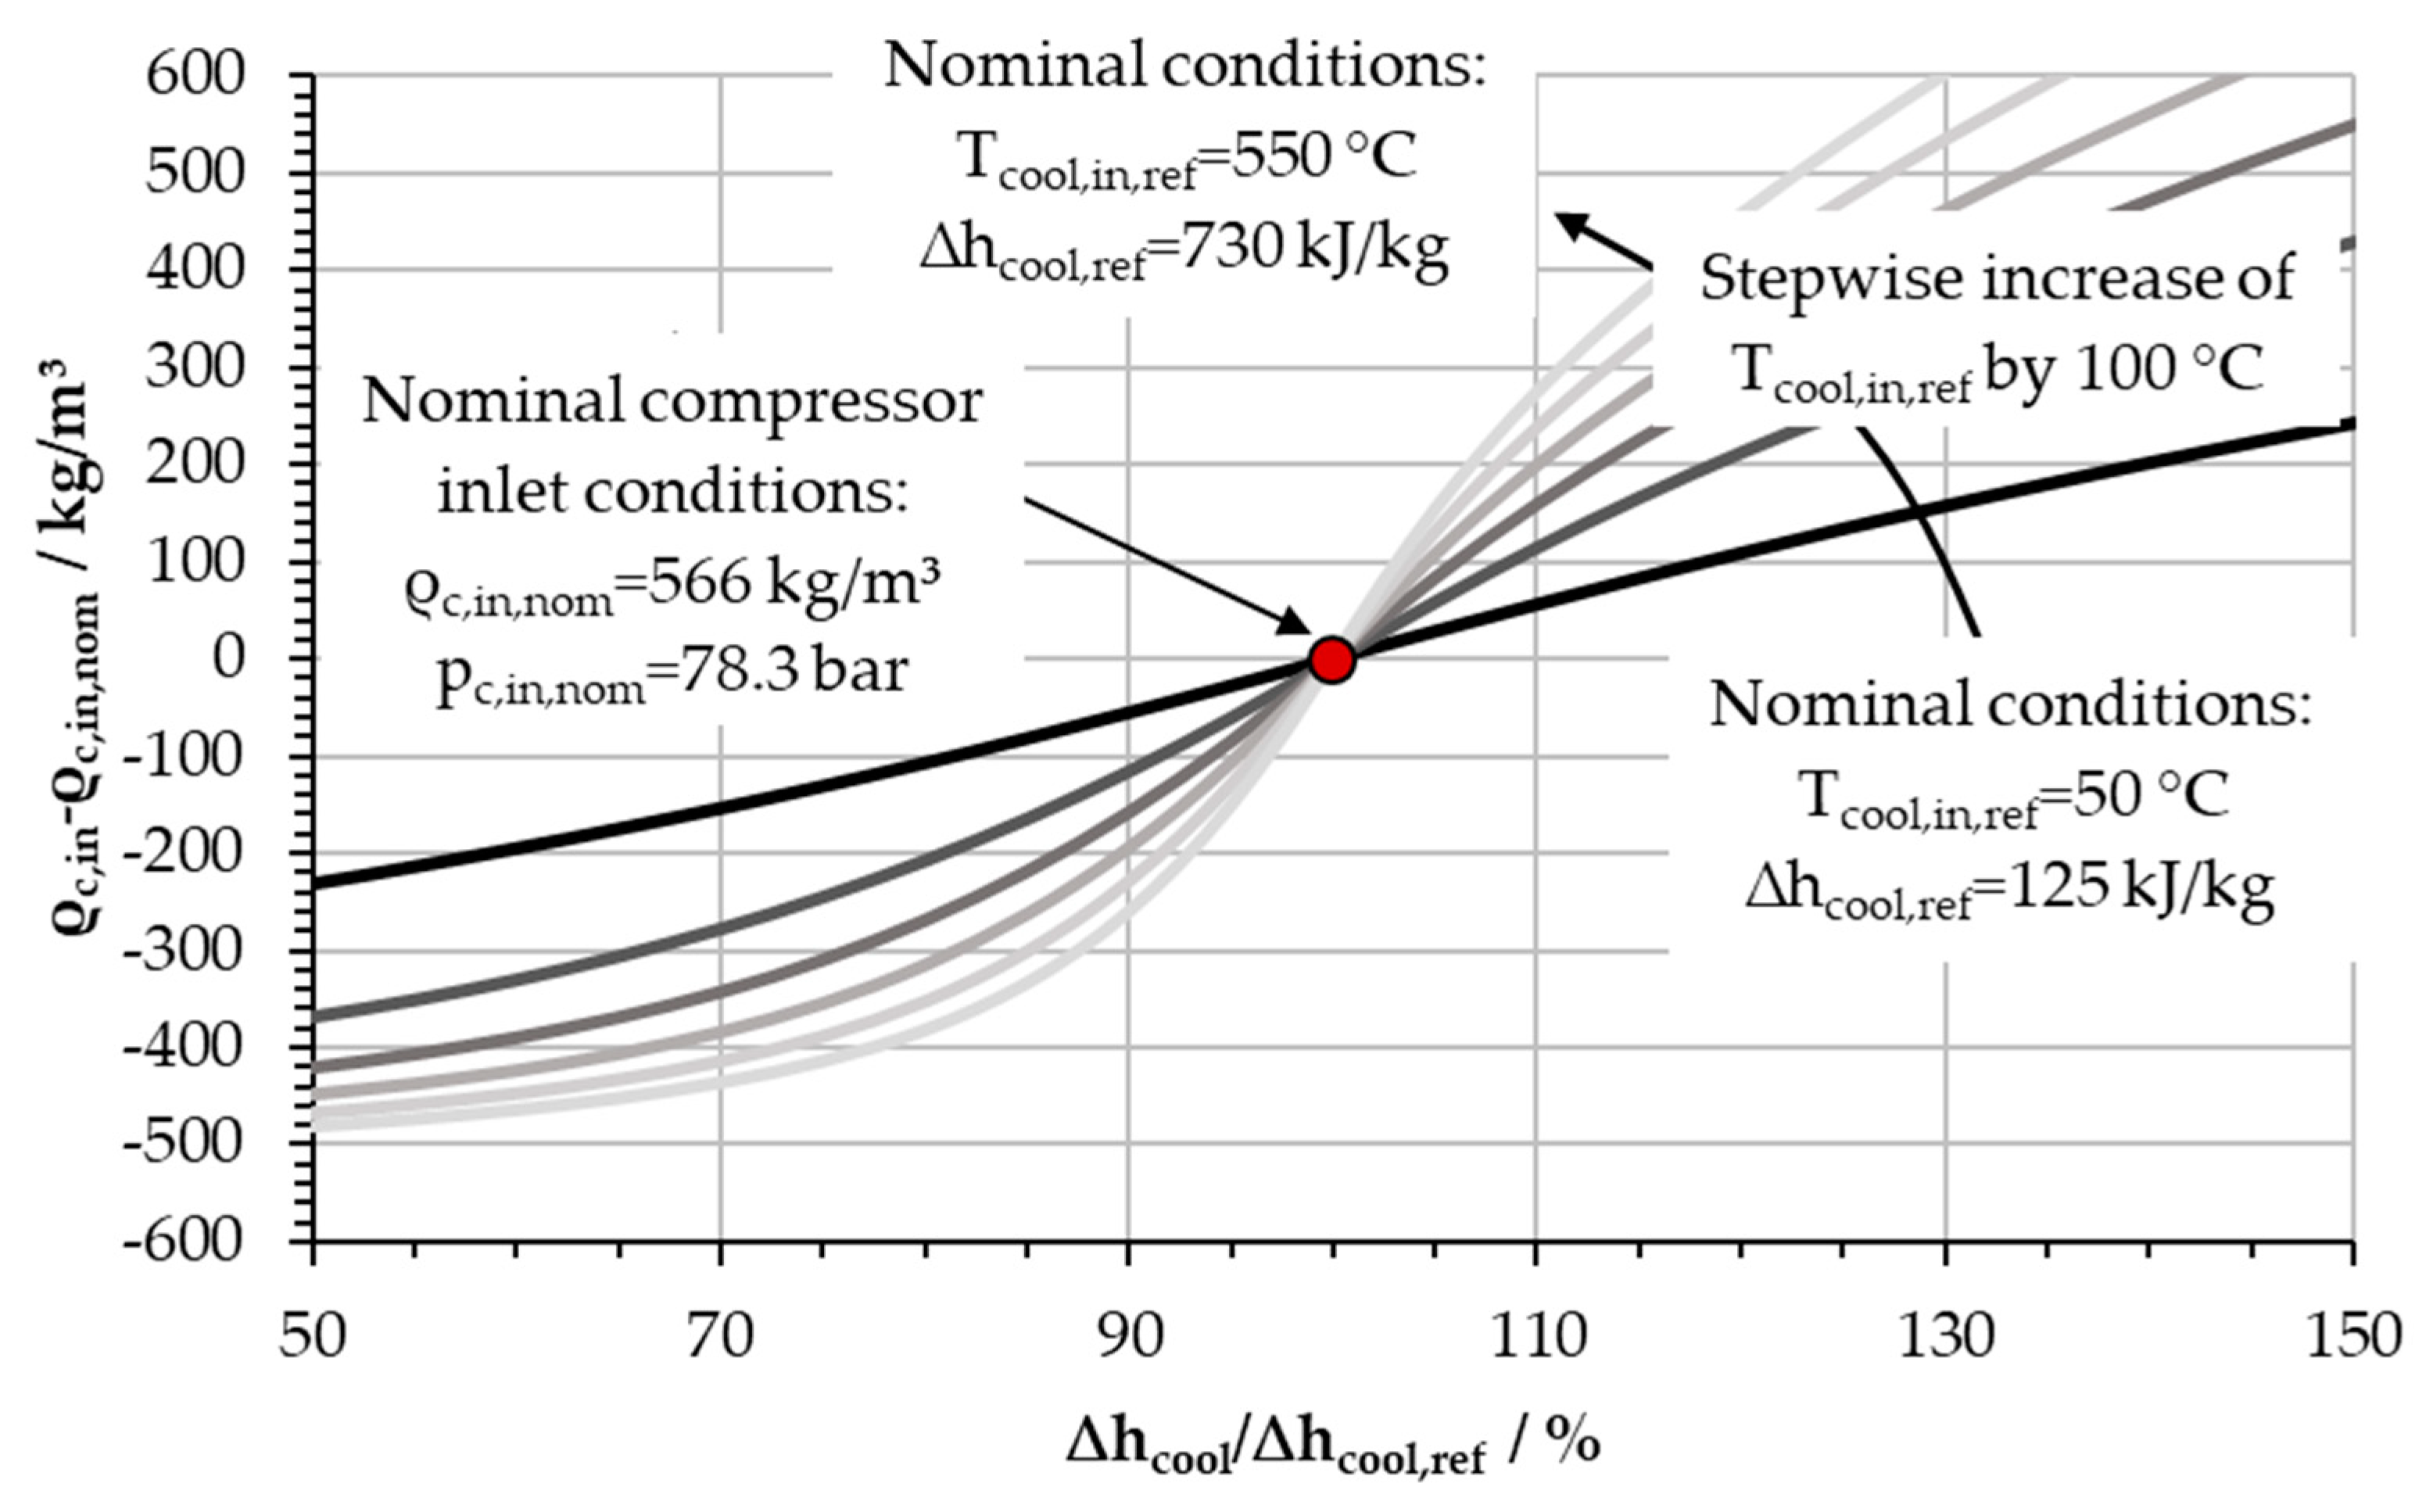
After the influence of the pressure level, the enthalpy drop in the cooler was also investigated.
Figure 9 shows the dependence of the density at the inlet of the compressor on the cooling power (or enthalpy difference for constant mass flow rate). The compressor inlet pressure
pc,in was always constant and the pressure losses in the cooler were neglected. For each inlet cooling temperature
Tcool,in,ref (each curve), a reference case was defined with the nominal inlet conditions of the compressor of
Tc,in,nom = 33 °C and
pc,in,nom = 78.3 bar. Based on these cases, the cooling power was changed, providing the results for
Figure 9. Thus, a higher cooler inlet temperature, which relates to a higher enthalpy change in the cooler, means a steeper slope of the curves around the nominal inlet conditions of the compressor (=100%) and indicates stronger variations of the compressor inlet density for the same relative change of cooling power. This suggests a more stable operation of the compressor for lower heat rejection in the upstream cooler.
7. Practical Cycle Application
To this point, recuperators or other measures to control the compressor inlet conditions were not explicitly included in the investigations, because the sCO2-HeRo cycle was taken as an example. However, sCO2 cycles need recuperators in order to be efficient (Ahn et al. [
1]). To be able to analyze different cycle layouts and apply the derived effect of the fluid properties and their influencing parameters also to recuperators, the cold side of the recuperator can be treated like a cooler. However, with sCO2 as the coolant, contrary to air or water, the overall behavior of the sCO2 cycle itself has an influence on the cooling power. Thus, according to
Figure 9, the influence of the whole cycle behavior on the compressor inlet conditions became higher if the cooling in the recuperator increased.
Further, there exist other methods for regulating compressor inlet conditions than by the change of cooling power only. Moisseytsev and Sienicki name three different methods to set the compressor inlet temperature, and conclude that the best option involves adjusting the cooling power by regulating the coolant flow (or temperature), combined with a cooler bypass, because it allows for fast regulation of the compressor inlet conditions [
7]. The flow through a cooler bypass does not pass the pseudocritical line, but it is mixed with the colder flow at the cooler outlet. Therefore, it is not affected by the fluid properties around the pseudocritical line itself. However, it needs to be adjusted according to the cooler exit conditions and desired compressor inlet conditions (e.g., in terms of inlet density). Therefore, exact knowledge of cooler exit conditions is required, asking for a precise control parameter, which is given by the cooling power.
The parameters which influence the significance of the stabilizing effect can be evaluated for different cycle layouts. A simple recuperated, a pre-compression, a re-compression, and a partial cooling cycle were investigated, as presented by Kulhanek and Dostal [
8]. Generally, the effect is only important to the main compressor, because this is the only one operating in liquid-like sCO
2. The effect helps to balance the outlet pressure of the main and re-compressor because of improved control of the main compressor. The significance for the main compressor is defined by its inlet pressure, which in pre-compression and partial cooling cycles is defined by the outlet pressure of the pre-compressor. Additionally, fluctuations in the cooling power of the cooler in front of the main compressor have less influence on the compressor inlet conditions if the cooling power is reduced. Thus, the effect is more significant for partial cooling cycles than for pre-compression cycles.
8. Discussion
This paper investigated compressor operation close to the critical point and the pseudocritical line based on experimental observations and theoretical considerations. As supported by the experimental investigations, the compressor inlet density is an important parameter to define the compressor performance related to the inlet conditions. The density and its gradients were studied with respect to temperature on the one hand, and with respect to enthalpy on the other. Based on this, the following conclusions for the operation of sCO2 cycles can be drawn.
The peak in heat capacity at the pseudocritical line requires a large enthalpy change in order to cause a significant change in the fluid properties which define the performance of the compressor (e.g., the density). This leads to an almost linear coupling of density and enthalpy, resulting in a small influence of fluctuations in cooling power on the compressor performance even close to the critical point. This is thus referred to as the stabilizing effect. Therefore, the compressor can be reliably controlled by the cooling power independent of the compressor inlet conditions to achieve goals such as a constant compressor outlet pressure or cycle mass flow.
High gradients of fluid properties with respect to static temperature in the vicinity of the critical point and the strong dependency on the accuracy of the pressure measurement make the temperature an improper measurement for compressor inlet conditions. It becomes more suitable for higher pressure and operating points further away from the critical point.
The density is defined as a characteristic parameter for the compressor performance, and its use for the definition of other fluid properties close to the critical point showed lower dependency on the pressure measurements. Therefore, it is much more suitable to measure the density instead of the temperature to define the compressor inlet conditions.
Regarding the significance for cycle applications, the stabilizing effect is only important to the main compressor operating in liquid-like sCO2. The smaller the cooling power of the upstream cooler and the lower the inlet pressure, the higher the significance. Thus, it is more advantageous in partial cooling cycles than in the pre-compression cycles. It further helps to control mixing of sCO2 flows, either for a bypass of the main cooler or balancing of the outlet pressure of main and re-compressors.
Author Contributions
Conceptualization, A.J.H., S.S., and D.B.; investigation, A.J.H.; methodology, A.J.H.; project administration, D.B.; supervision, D.B.; visualization, A.J.H. and S.S.; writing—original draft, A.J.H.; writing—review and editing, S.S. and D.B.
Funding
This project received funding from the Euratom research and training program 2014–2018 under grant agreement No. 662116. The APC of this paper was funded by Euroturbo.
Conflicts of Interest
The authors declare no conflict of interest. The funders had no role in the design of the study; in the collection, analyses, or interpretation of data; in the writing of the manuscript, or in the decision to publish the results.
References
- Ahn, Y.; Bae, S.J.; Kim, M.; Cho, S.K.; Baik, S.; Lee, J.I.; Cha, J.E. Review of supercritical CO2 power cycle technology and current status of research and development. Nucl. Eng. Technol. 2015, 47, 647–661. [Google Scholar] [CrossRef]
- Hacks, A.J.; Schuster, S.; Dohmen, H.J.; Benra, F.K.; Brillert, D. Turbomachine design for supercritical carbon dioxide within the sCO2-HeRo.eu project. J. Eng. Gas. Turbines Power 2018, 140, 121017. [Google Scholar] [CrossRef]
- Hacks, A.J.; Vojacek, A.; Dohmen, H.J.; Brillert, D. Experimental investigations of the sCO2-HeRo compressor. In Proceedings of the 2nd European supercritical CO2 Conference, Essen, Germany, 30–31 August 2018. [Google Scholar] [CrossRef]
- Lemmon, E.W.; Huber, M.L.; McLinden, M.O. NIST Standard Reference Database 23: Reference Fluid Thermodynamic and Transport Properties-REFPROP; Version 8.0; National Institute of Standards and Technology, Standard Reference Data Program: Gaithersburg, MD, USA, 2007. [Google Scholar]
- Kiran, E.; Debenedetti, P.G.; Peters, C.J. Supercritical fluids: Fundamentals and Applications; Springer Science & Business Media: Dordrecht, The Netherlands, 2008; Volume 366. [Google Scholar] [CrossRef]
- Wright, S.A.; Fuller, R.; Noall, J.; Radel, R.; Vernon, M.E.; Pickard, P.S. Supercritical CO2 Brayton cycle compression and control near the critical point. In Proceedings of the 2008 International Congress on Advances in Nuclear Power Plants-ICAPP’08, Anaheim, CA, USA, 8–12 June 2008. [Google Scholar]
- Moisseytsev, A.; Sienicki, J.J. Controllability of the supercritical carbon dioxide Brayton cycle near the critical point. In Proceedings of the 2008 International Congress on Advances in Nuclear Power Plants-ICAPP’08, Anaheim, CA, USA, 8–12 June 2008. [Google Scholar]
- Kulhanek, M.; Dostal, V. Supercritical carbon dioxide cycles thermodynamic analysis and comparison. In Proceedings of the Supercritical CO2 Power Cycle Symposium, Boulder, CO, USA, 24–25 May 2011. [Google Scholar]
© 2019 by the authors. Licensee MDPI, Basel, Switzerland. This article is an open access article distributed under the terms and conditions of the Creative Commons Attribution (CC BY-NC-ND) license (https://creativecommons.org/licenses/by-nc-nd/4.0/).

