Article

Development of a One-Dimensional Model for the Prediction of Leakage Flows in Rotating Cavities Under Non-Uniform Tangential Pressure Distribution †

1
Department of Industrial Engineering, University of Florence, 50139 Firenze, Italy
2
Centro Ricerche e Attività Industriali (CReAI), 51100 Pistoia, Italy
3
Pierburg Pump Technology Italy S.p.A., 57123 Livorno, Italy
4
Pierburg Pump Technology France S.p.A., 57974 Thionville, France
*
Author to whom correspondence should be addressed.
This paper is an extended version of our paper in Proceedings of the 13th European Turbomachinery Conference on Fluid Dynamics & Thermodynamics ETC13, Lausanne, Switzerland, 8–12 April 2019; Paper No. 388.
Int. J. Turbomach. Propuls. Power 2019, 4(3), 19; https://doi.org/10.3390/ijtpp4030019
Submission received: 13 May 2019 / Accepted: 7 July 2019 / Published: 15 July 2019

Abstract

:
Regenerative pumps are characterized by a low specific speed that place them between rotary positive displacement pumps and purely radial centrifugal pumps. They are interesting for many industrial applications since, for a given flow rate and a specified head, they allow for a reduced size and can operate at a lower rotational speed with respect to purely radial pumps. The complexity of the flow within regenerative machines makes the theoretical performance estimation a challenging task. The prediction of the leakage flow rate between the rotating and the static disks has the greatest impact on the prediction of global performance. All the classical approaches to the disk clearance problem assume that there is no relevant circumferential pressure gradient. In the present case, the flow develops along the tangential direction and the pressure gradient is intrinsically non-zero. The aim of the present work is to develop a reliable approach for the prediction of leakage flows in regenerative pumps. A preliminary numerical simulation on a virtual model of a regenerative pump where the disk clearance is part of the control volume has been performed for three different clearance aspect ratios. The outcome of that campaign allowed the authors to determine the behavior of the flow in the cavity and choose correctly the baseline hypotheses for a mathematical-physical method for the prediction of leakage flows. The method assumes that the flow inside of the disk clearance is two-dimensional and can be decomposed into several stream-tubes. Energy balance is performed for each tube, thus generating a system that can be solved numerically. The new methodology was tuned using data obtained from the numerical simulation. After that, the methodology was integrated into an existing one-dimensional code called DART (developed at the University of Florence in cooperation with Pierburg Pump Technology Italy S.p.A.) and the new algorithm was verified using available numerical and experimental data. It is here demonstrated that an appropriate calibration of the leakage flow model allows for an improved reliability of the one-dimensional code.

1. Introduction

In the automotive field, secondary systems are often equipped with small turbomachines that elaborate small flow rates and guarantee a high pressure rise, thus positioning the machine in the low specific speed region. Considering that reduced weight and size are also necessary, regenerative pumps become competitive with respect to radial pumps. Regenerative pumps (also known as side channel pumps or peripheral pumps) are characterized by low specific speed values. If specific speed is calculated with n in r p m , Q in m 3 s and H in m , typical values for regenerative pumps are between 2 and 11, as reported in [1]. These pumps combine the high pressure rise of positive displacement pumps with the flexible operation of centrifugal pumps. Although side channel pumps are characterized by a slightly lower peak efficiency with respect to centrifugal turbomachines, it must be underlined that in the optimal range of application they represent a compact solution that guarantees a stable performance close to the design point at a lower rotational speed with respect to centrifugal pumps. The latter conclusion was originally underlined by Brown [2] and was confirmed (for pumps characterized by a higher diameter with respect to the one analyzed in this work) by Mosshammer et al. [3].
Regenerative pumps are characterized by the presence of an impeller equipped with plane blades and of a vaneless diffuser. The flow enters the impeller at the lower radius and is energized while passing through the blade channel, and then is purged towards the side channel at a higher radius, thus reducing its velocity along a helical trajectory and increasing the pressure level. Considering that the impeller elaborates the fluid several times through helical trajectories, the machine realizes an internal multistage configuration from which regenerative pumps take their name. A one-dimensional tool called DART (Design and Analysis tool for Regenerative Turbomachinery) aimed at providing preliminary design parameters for a flat-blade pump has been developed by the Turbomachinery and Combustion Research group of the Department of Industrial Engineering (DIEF) of the University of Florence (Italy) with the support of the Modeling R&D Department of Pierburg Pump Technology. The DART code is based on the momentum exchange theory described in [4,5] and has been verified using available experimental and numerical data [6]. Although Gülich [1] demonstrated the high dependence of regenerative pump efficiency on the dimension of leakages in off-design conditions, the original version of the DART neglects the leakage flows’ effect on the main-flow, thus providing inaccurate data when manufacturing uncertainty makes the dimension of the disk clearance relevant.
The aim of this work is to develop a methodology to correctly evaluate the leakage flow through a stationary and a rotating disk in presence of tangential pressure non-uniformity and to implement it into the DART code. To comply with that aim, a theoretical study of the problem is performed and a new approach (partially based on the one originally proposed in [7]) is presented. The new method was implemented in Matla ® and was tuned using data obtained from the numerical simulation of a virtual prototype of regenerative pump where the disk clearance is part of the control volume. In the second part of the paper, the implementation of the new method in DART is described and the new version of the code is verified using the available experimental and numerical data. The obtained results show that the new methodology allows for an improved prediction of regenerative pump performance.

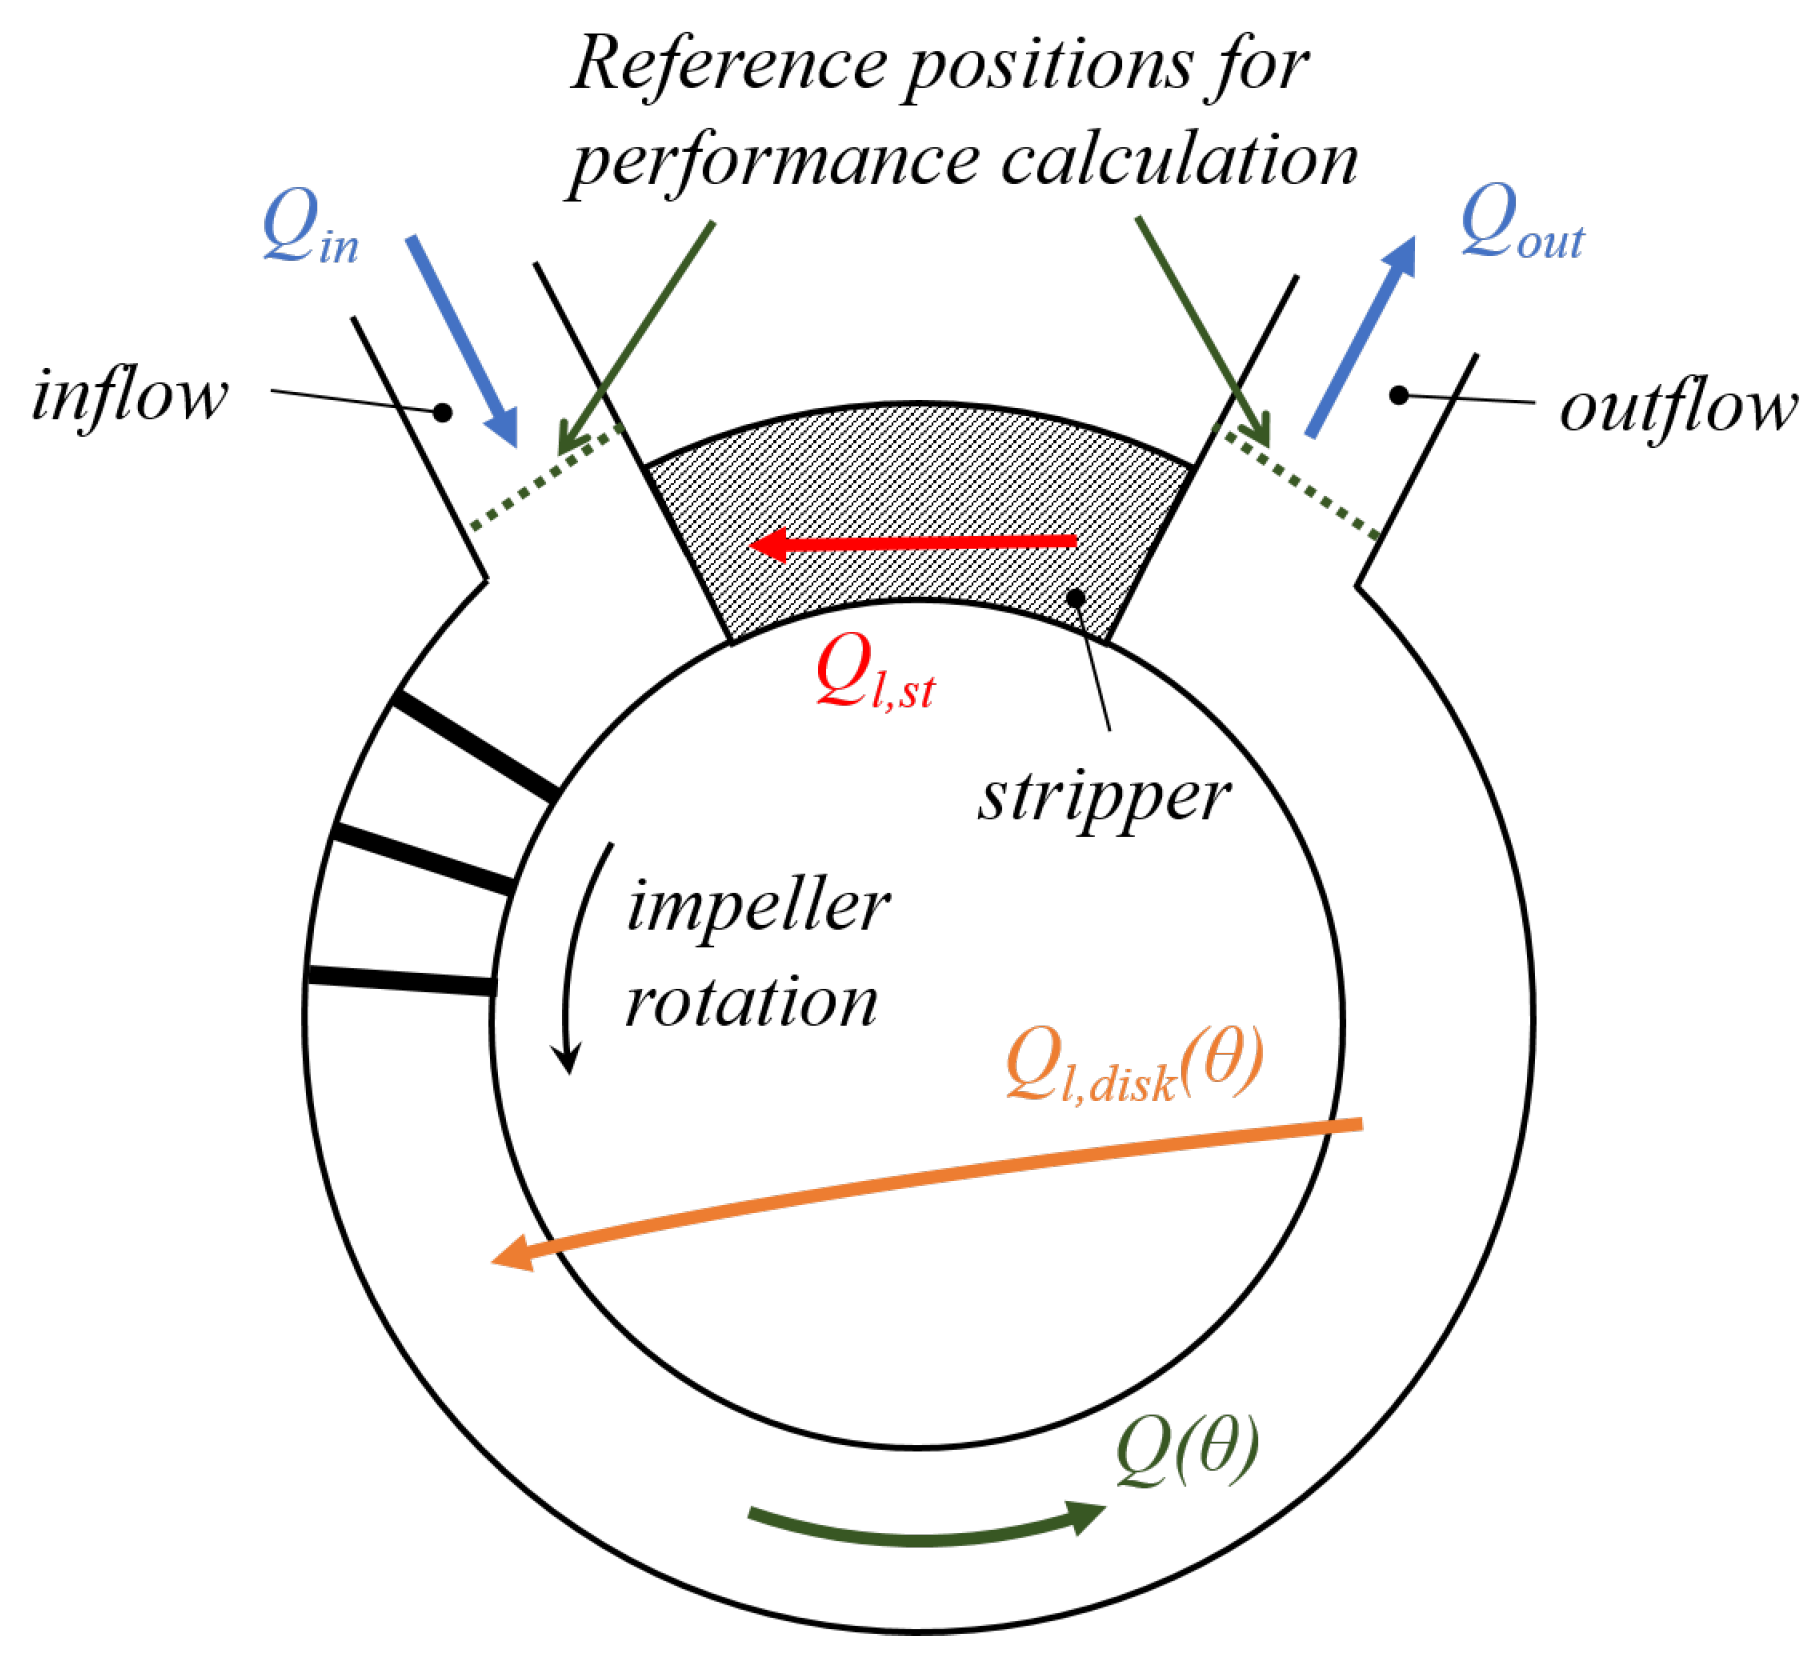
2. Description of Leakage Flows in Regenerative Pumps

To allow for the relative motion between casing and impeller, a gap between these two parts is needed. This gap allows the fluid at a higher pressure level (close to the outlet section) to flow towards lower pressure zones, as outlined in Figure 1. The models based on the works by Batchelor [8] and Stewartson [9] are very important to describe the behavior of the leaked flow between the rotating and the stationary disks, but are only partially useful in the present case since they usually deal with radially inward and outward flows in side cavities (i.e., [1,10] for centrifugal pumps). In regenerative pumps, the outer ring of the clearance is characterized by a tangential pressure gradient that drives the leakage flow ( Q l , d i s k ( θ ) in Figure 1) along streamlines that could be approximated as chords between two points along a circumferential position. This particular kind of leakage flow transforms the pump in a machine with tangentially-variable flow rate. As a consequence, the overall efficiency is reduced because the already pumped fluid returns to lower pressure and part of the energy is wasted. Furthermore, performance evaluation becomes more complex because the evolving mass–flow is a function of the tangential pressure distribution and vice versa. The present configuration was studied by Balje [7], but in his work only the estimation of total leaked flow is presented and no information about the distribution of the leakage flow is available. Then, for a correct calculation of the performance, it is necessary to correctly estimate the leakage flow rate distribution with a specifically-developed model.
The aim of the present work is to extend the method suggested by Balje to accurately evaluate the tangential distribution of leakage flow rate. To do that, it is necessary to better understand the phenomena inside of the cavity between the rotating disk and the casing. Since no previously performed experimental analyses are available to show the main physics of this cavity flow, a preliminary CFD study was performed on a regenerative pump specifically designed to work in our range of interest.

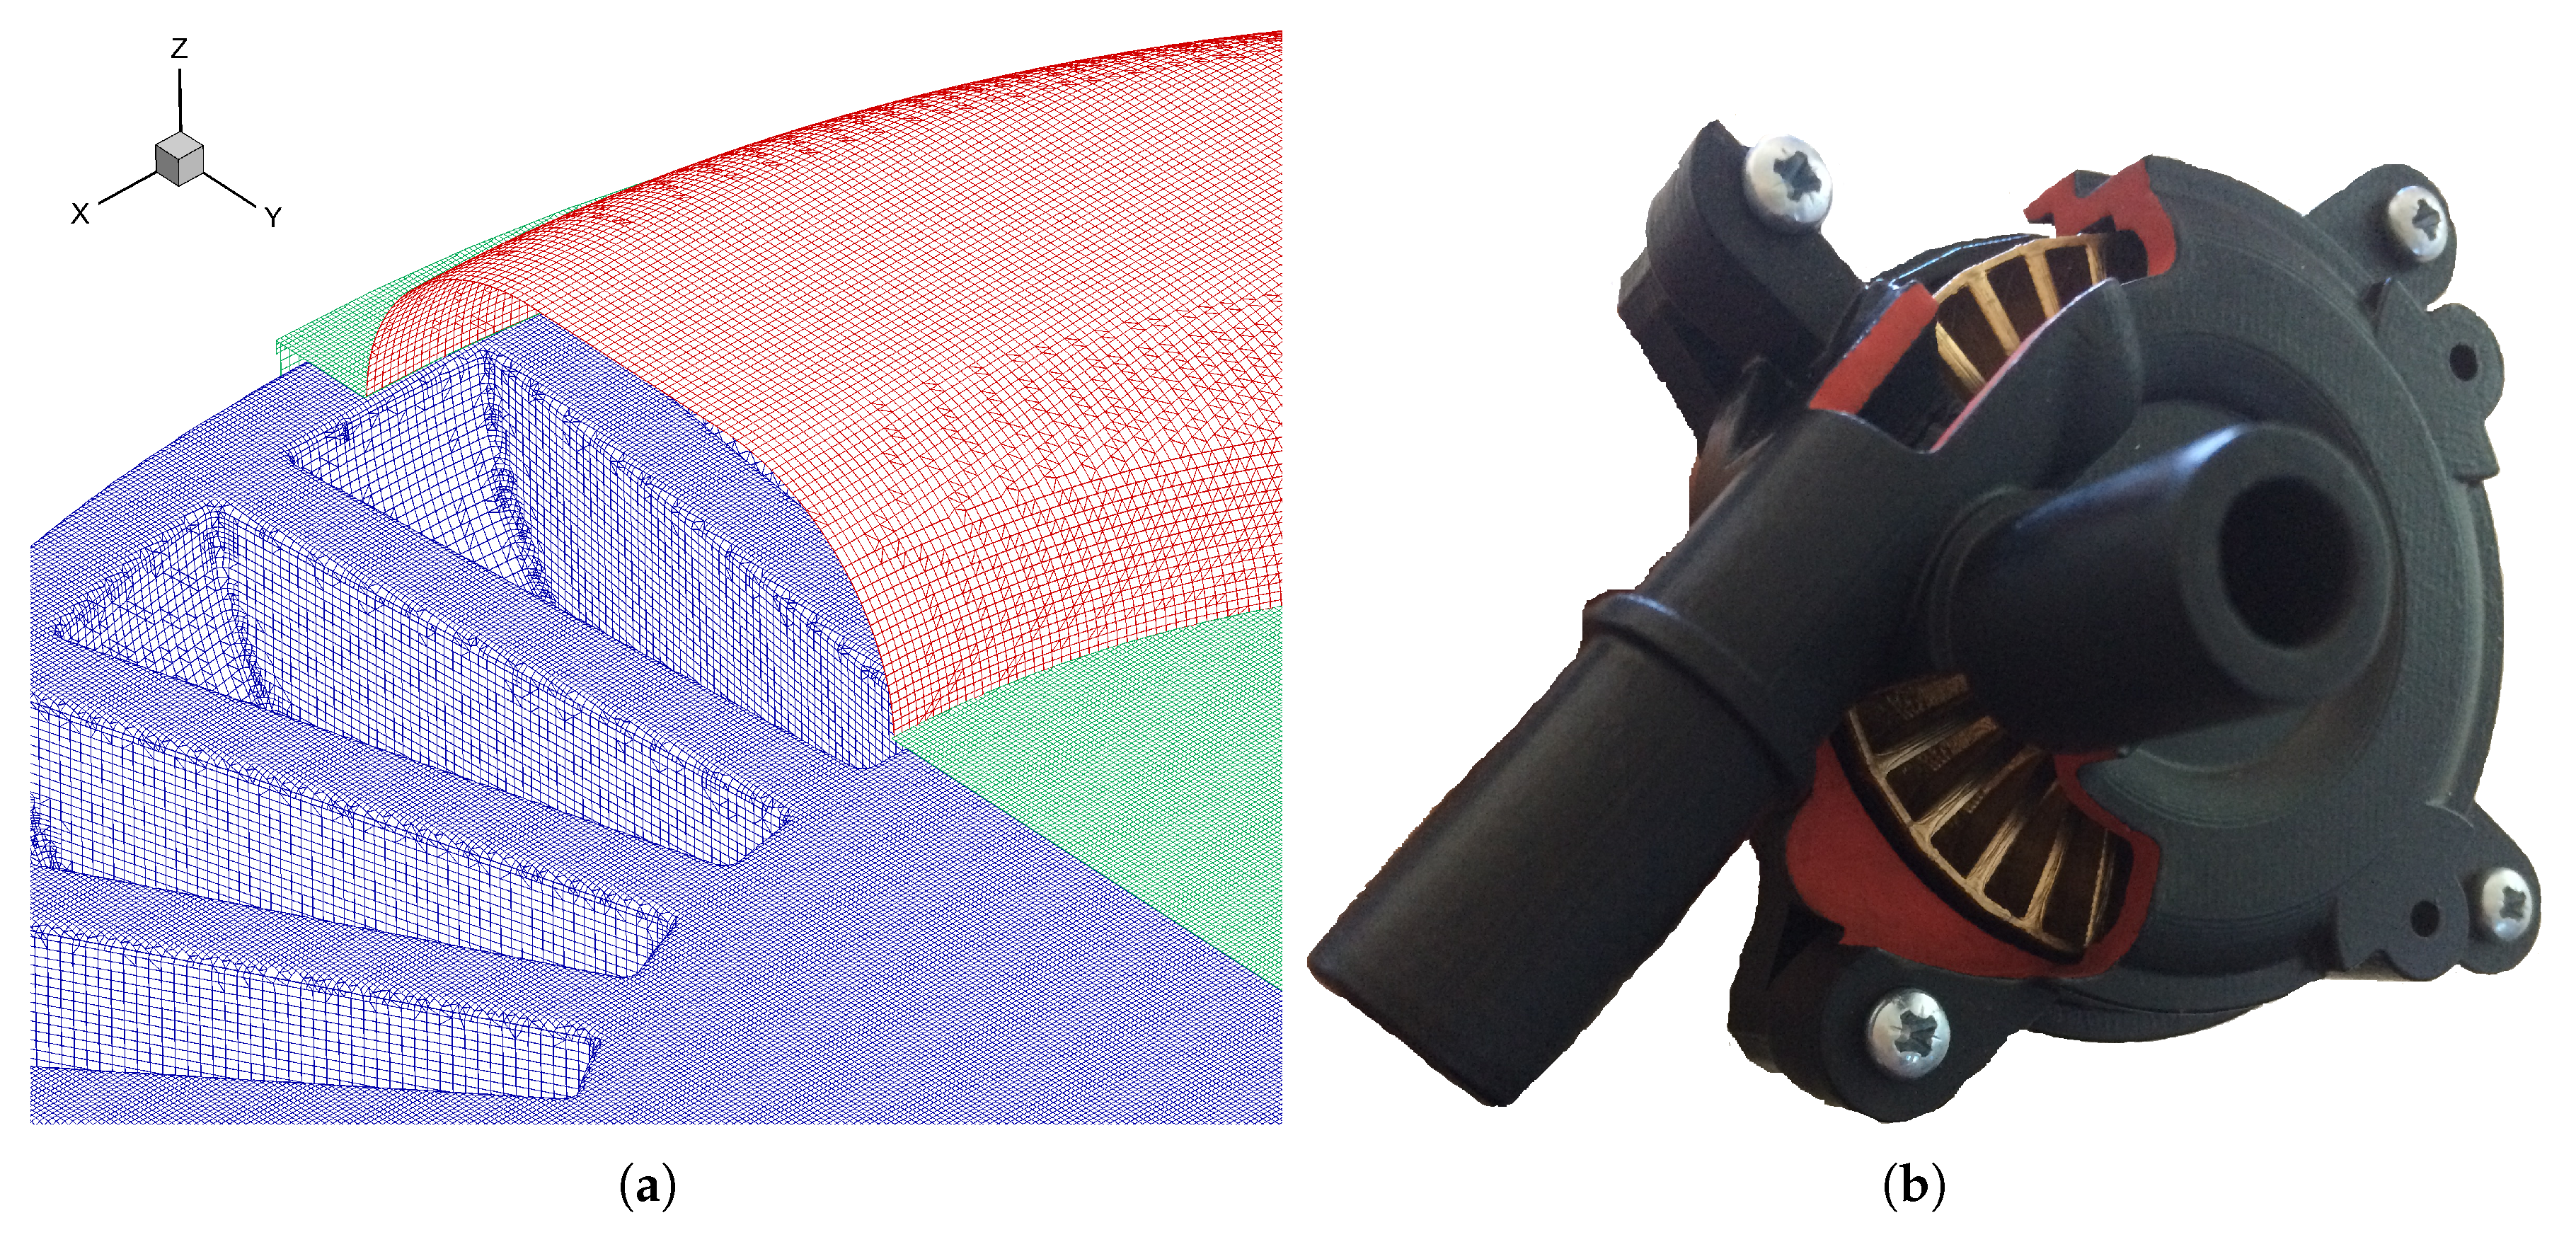
2.1. Details about the Three-Dimensional Simulations

The virtual model used for the Computational Fluid Dynamics (CFD) activity consists in a single-sided regenerative pump characterized by blades of semi-circular shape. A prototype was realized and a photograph can be seen in Figure 2b. The main parameters of the machines are reported in non-dimensional form with respect to the blade height in Table 1.
The domain is composed by the impeller, the side channel, inlet and outlet ducts and both stripper and disk cavities. The outlet duct is extended about 10 diameters downstream of the pump. Such an elongation of the outlet duct is necessary for avoiding the formation of flow recirculation on the outlet section due to the presence of residual swirl under some operating conditions. Three different values for the dimension of the disk clearance were considered. For the investigated cases, the radial clearance at the rotor tip has the same value considered for the disk clearance.
The computational grid used for the three-dimensional RANS simulations of the pump is generated with the meshing tool of the commercial software Pumplinx ® . Attention is dedicated to the refinement of the critical region of the stripper leakage and of the cavity. The overall grid is composed by about 14.8 M elements. Such grid resolution is appropriate to make the problem grid-independent according to the authors of [11,12], who performed grid sensitivity studies on similar machines. A detail of the grid is reported in Figure 2a, where the surface meshes of the impeller (in blue), of the side channel (in red) and of the stationary wall (in green) are visible.
The three-dimensional numerical campaign was carried out using the Pumplinx ® solver. Air is treated as an ideal gas while the dependence of the viscosity on temperature is calculated using Sutherland’s law. Second-order accurate discretization is used for the continuity and the momentum equation while first-order accurate discretization is used for the energy equation and turbulence modeling. The realizable κ ϵ model [13] is used as turbulence closure. The selected turbulence closure demonstrated to be reliable for the prediction of performance of regenerative pumps, as shown by Quail et al. [11]. At the maximum flow rate simulated, the average y + is always below 5 (compatible with the y + -independent approach used).
The frozen-rotor approach was chosen. The impeller is frozen in a symmetrical position with respect to the stripper, with the maximum closure of this latter by the vanes. This position was chosen to compare the results with DARTs predictions, since such configuration is assumed for the estimation of the leakage flow. It was verified that a change in the relative positioning between impeller and static parts does not modify substantially the obtained results. For all the simulations, mass–flow rate and total temperature were imposed on inlet section while static pressure was defined at the outlet. For the calculation of the pressure rise of the machine, the reference sections are in correspondence of the inlet and outlet sections of the model. Although the simulations include fluid’s compressibility, it was observed that for the investigated cases density variations are negligible, thus confirming that CFD data can be compared with DART results.

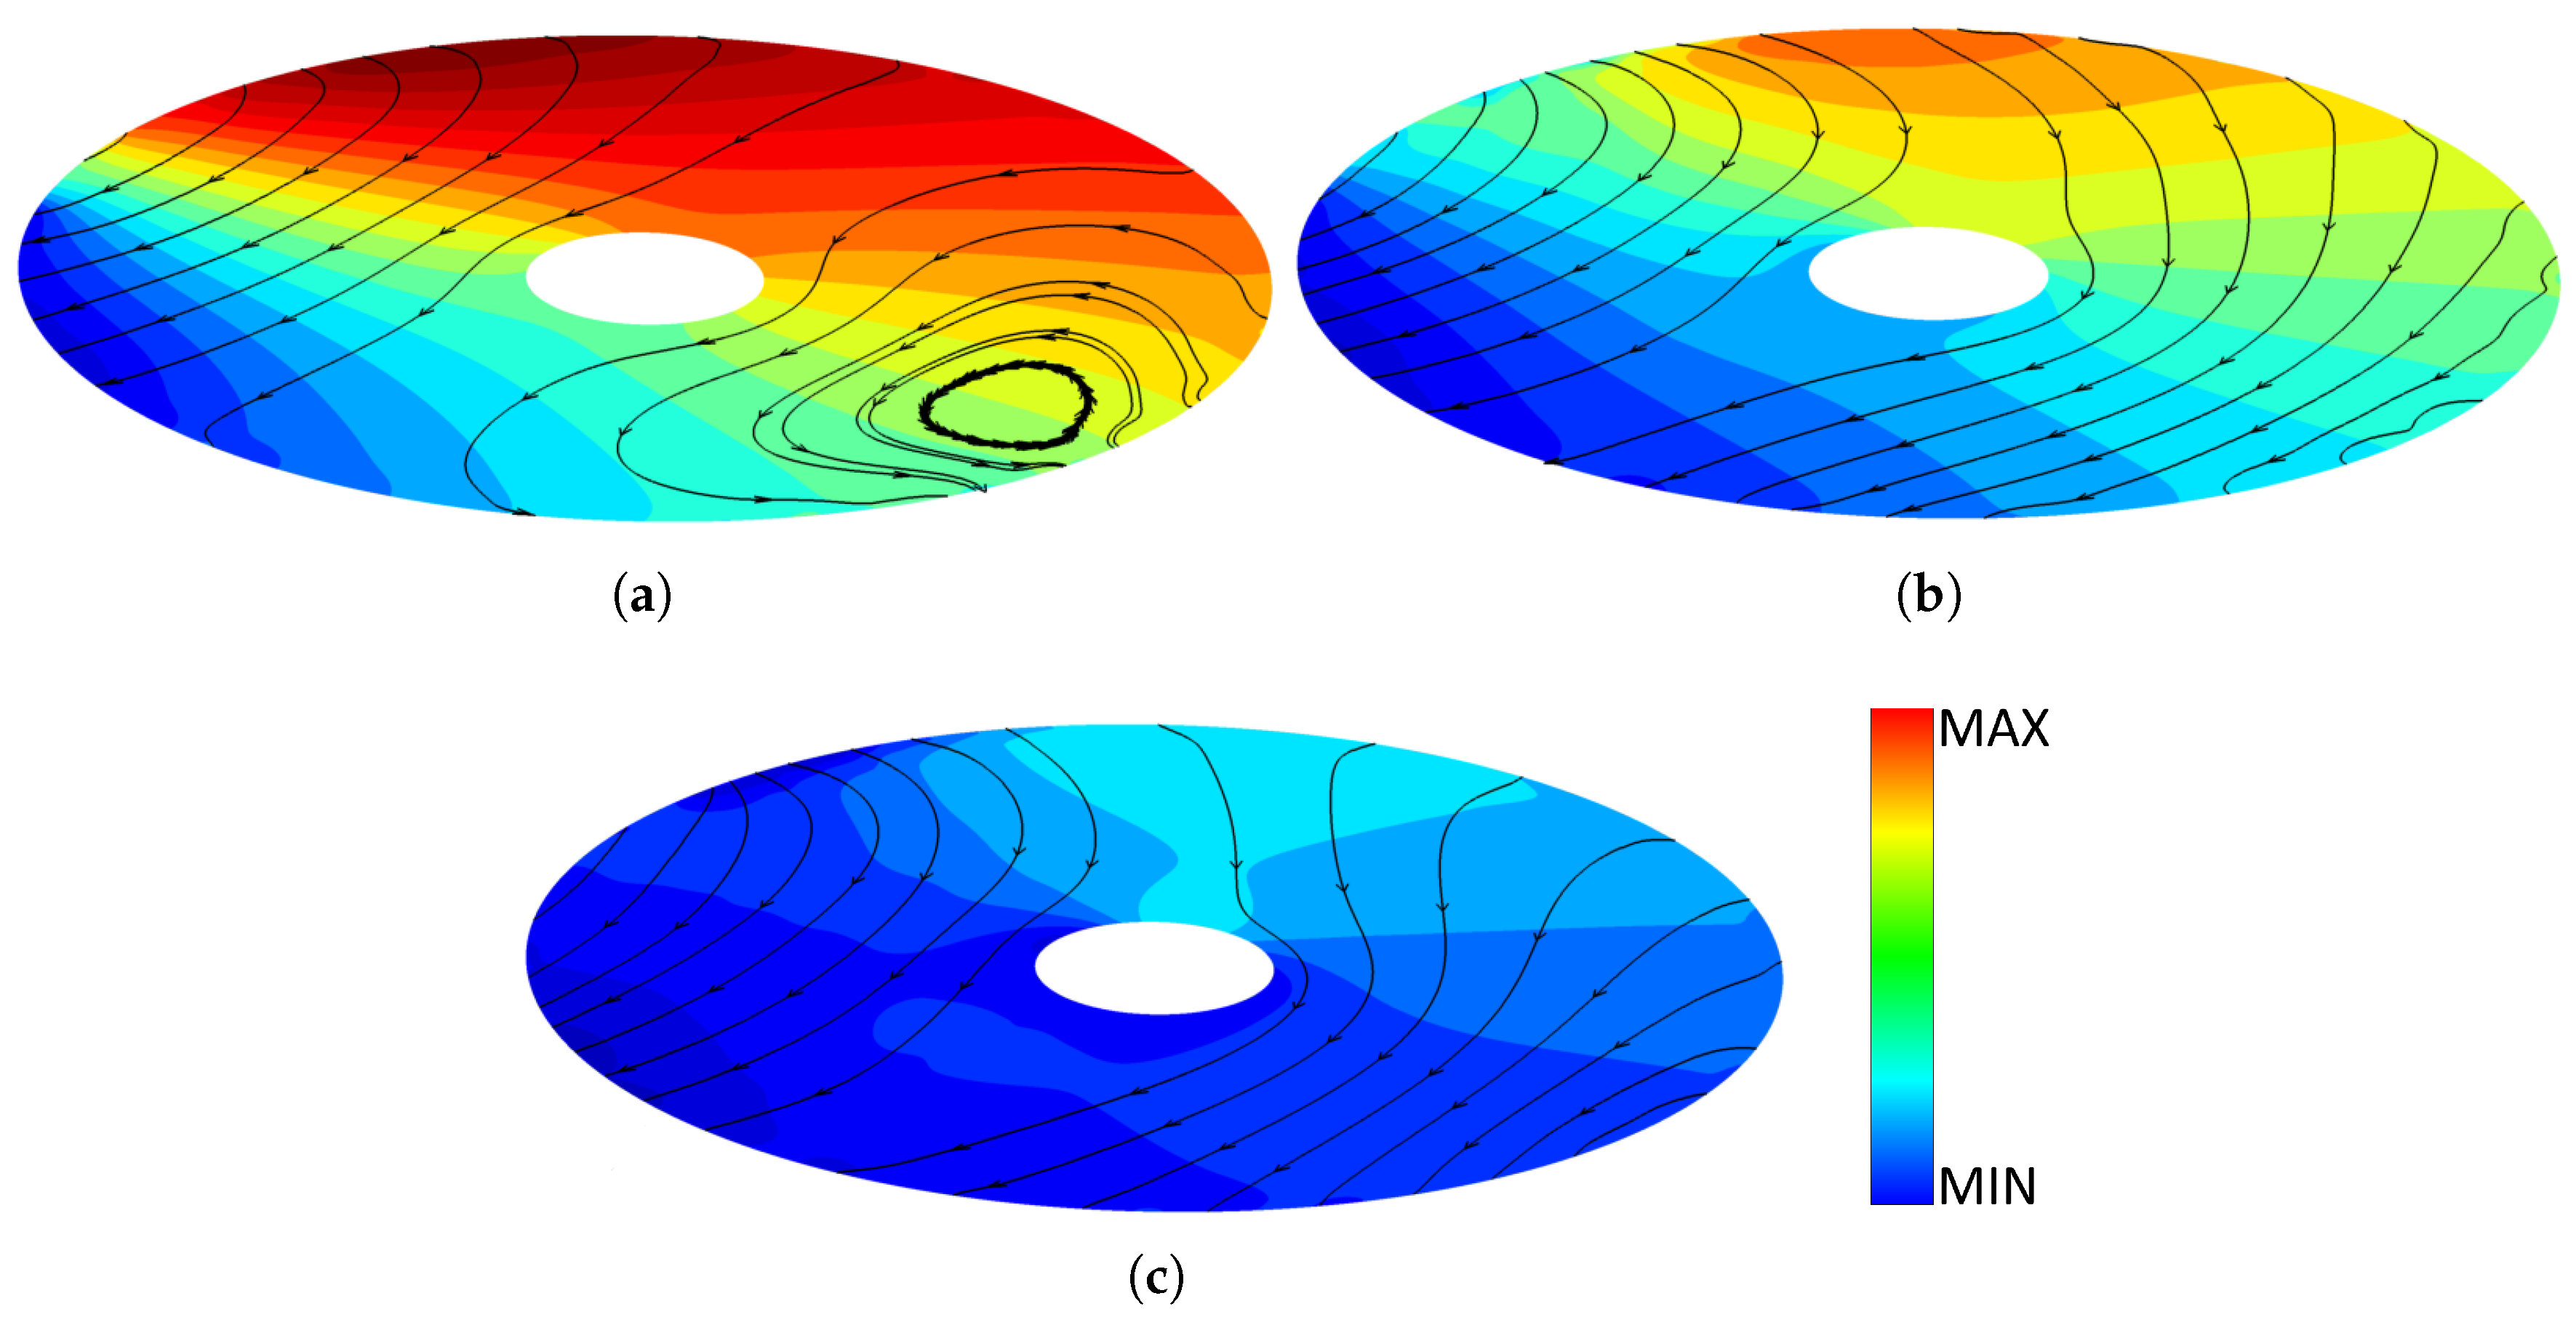
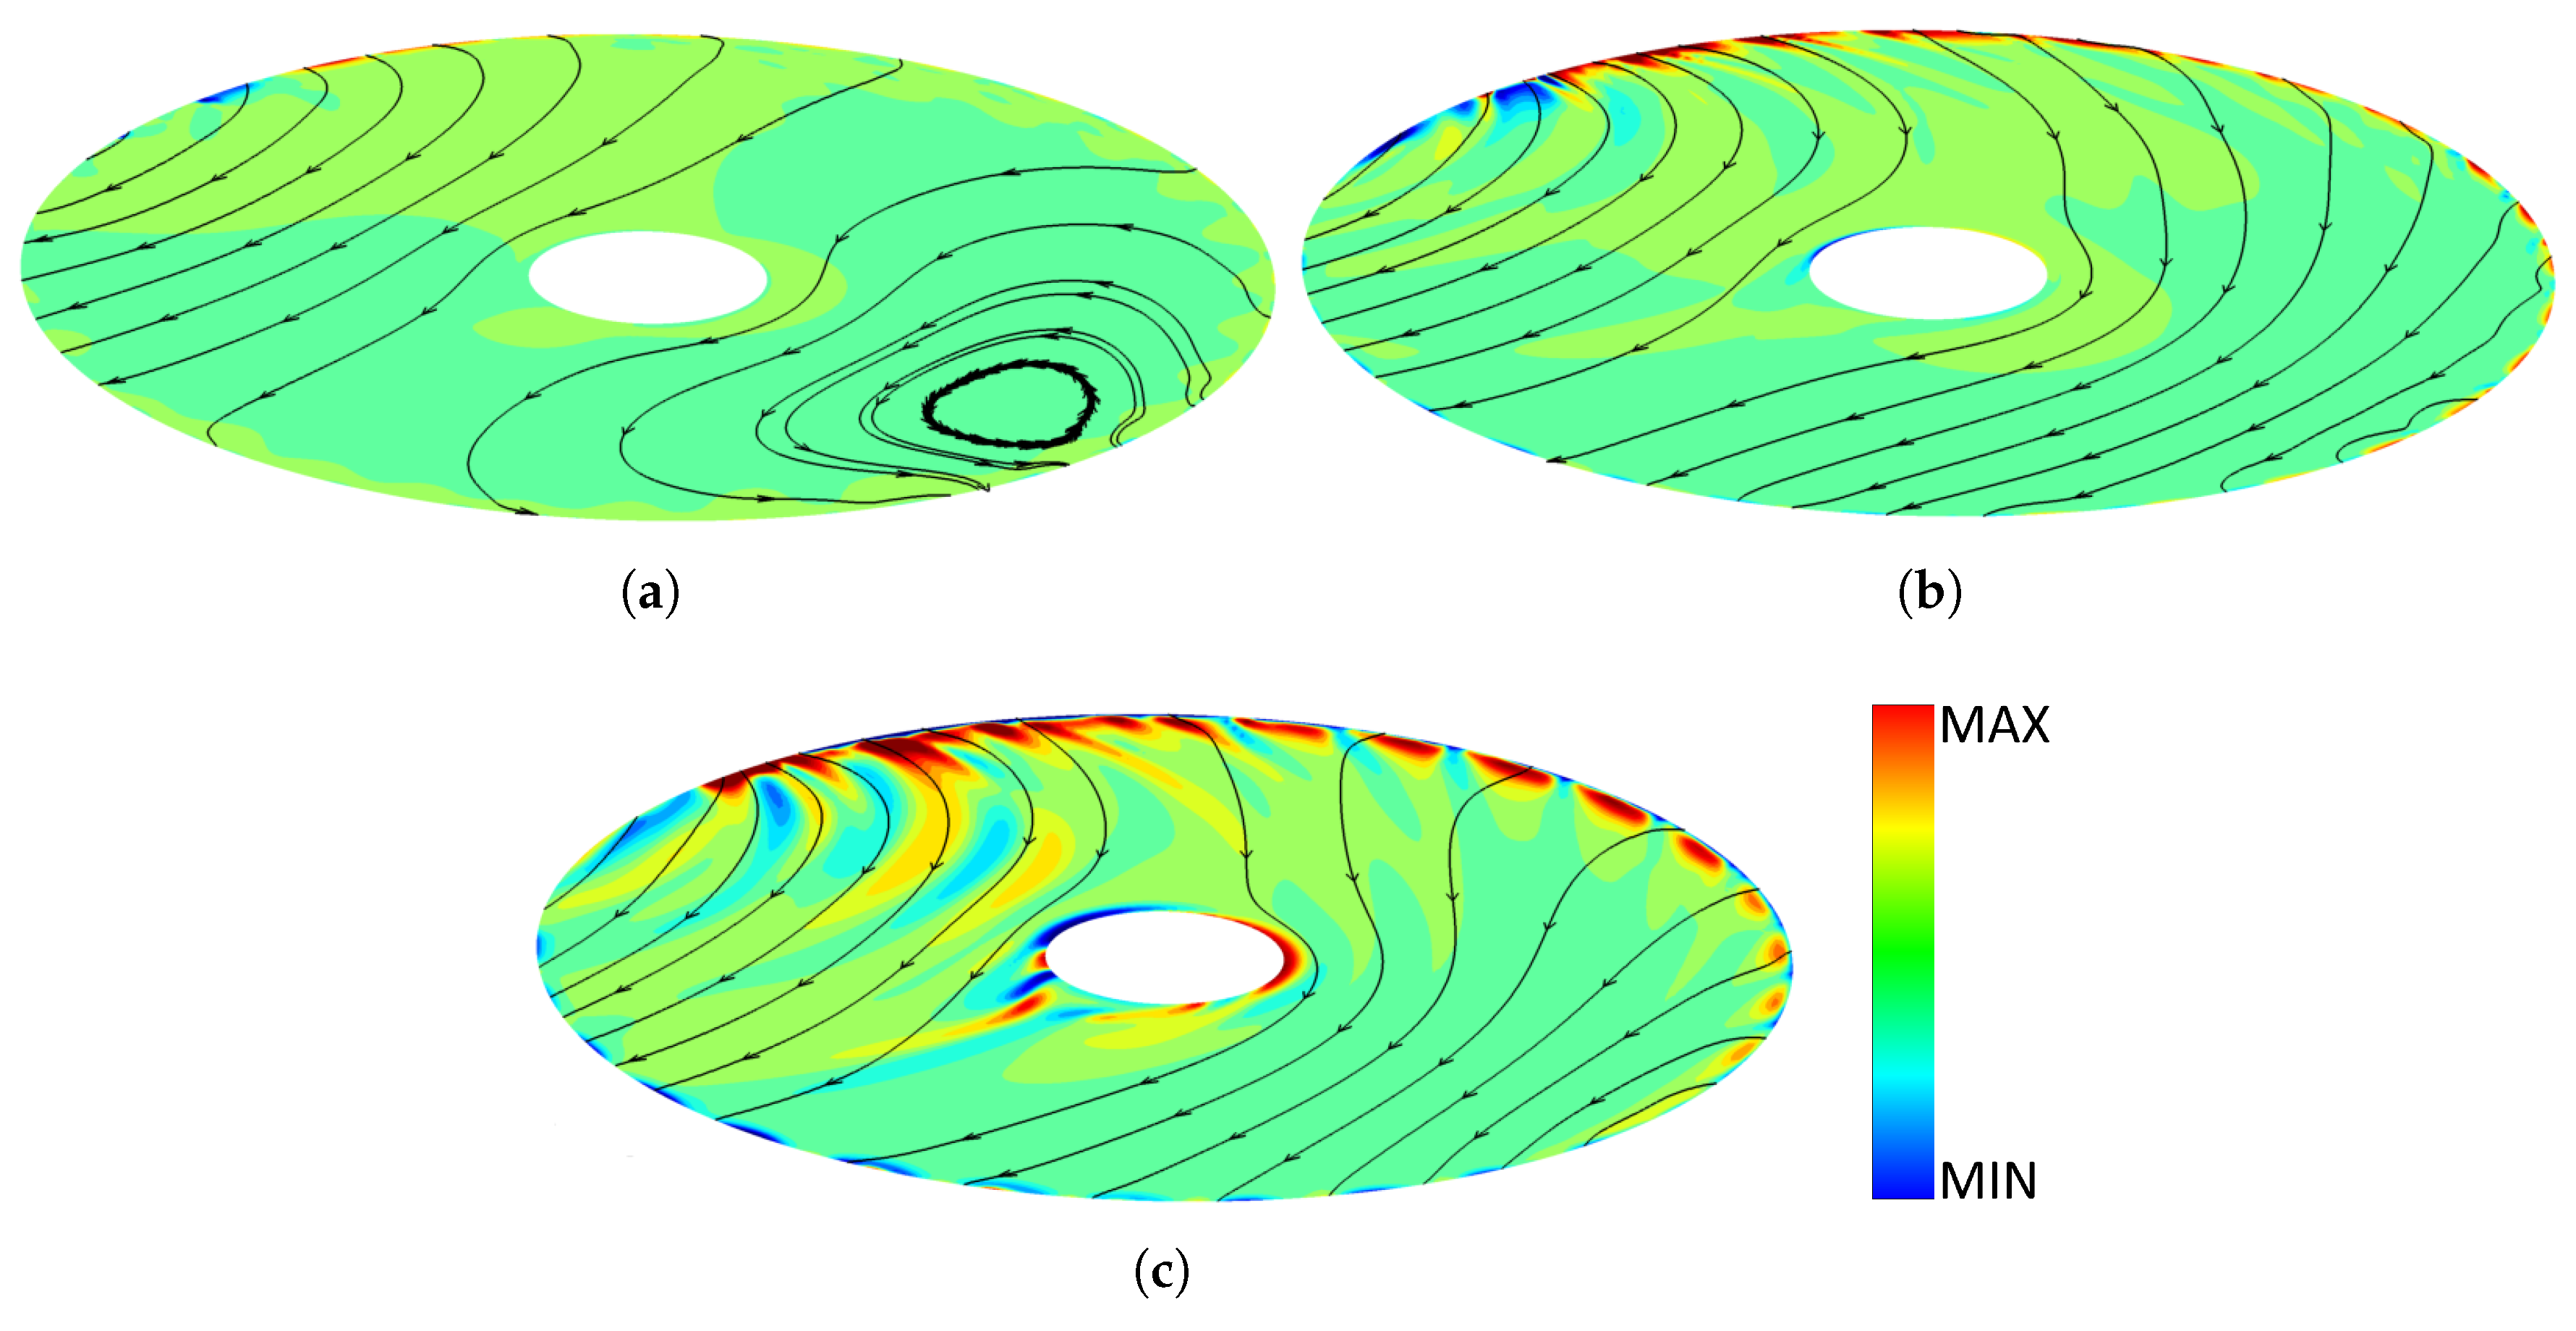
2.2. Analysis of the Leakage Flow Characteristics

The post-processing of the CFD data allowed the authors to obtain the two-dimensional maps of several flow parameters in the cavity. The maps that are shown in this section are referred to a section orthogonal to the rotational axis of the turbomachine and are equidistant from the rotating disk and the casing. For each variable, three maps are shown that are referred to three different ratios between the axial gap h and blade height H. In Figure 3, the map of the planar velocity is reported. The planar velocity is the most representative parameter about the leakage flow rate through the cavity. As can be observed, the velocity, and then the flow rate, increases as the gap between the rotating disk and the casing becomes higher. The zone where the planar velocity is higher is (for each of the three considered axial gaps) the one near the stripper, where:
  • The gradient of pressure is the highest.
  • The distance between two point of the boundary of the cavity is the lowest.
  • The velocity of the rotor has the same direction of the decreasing pressure.
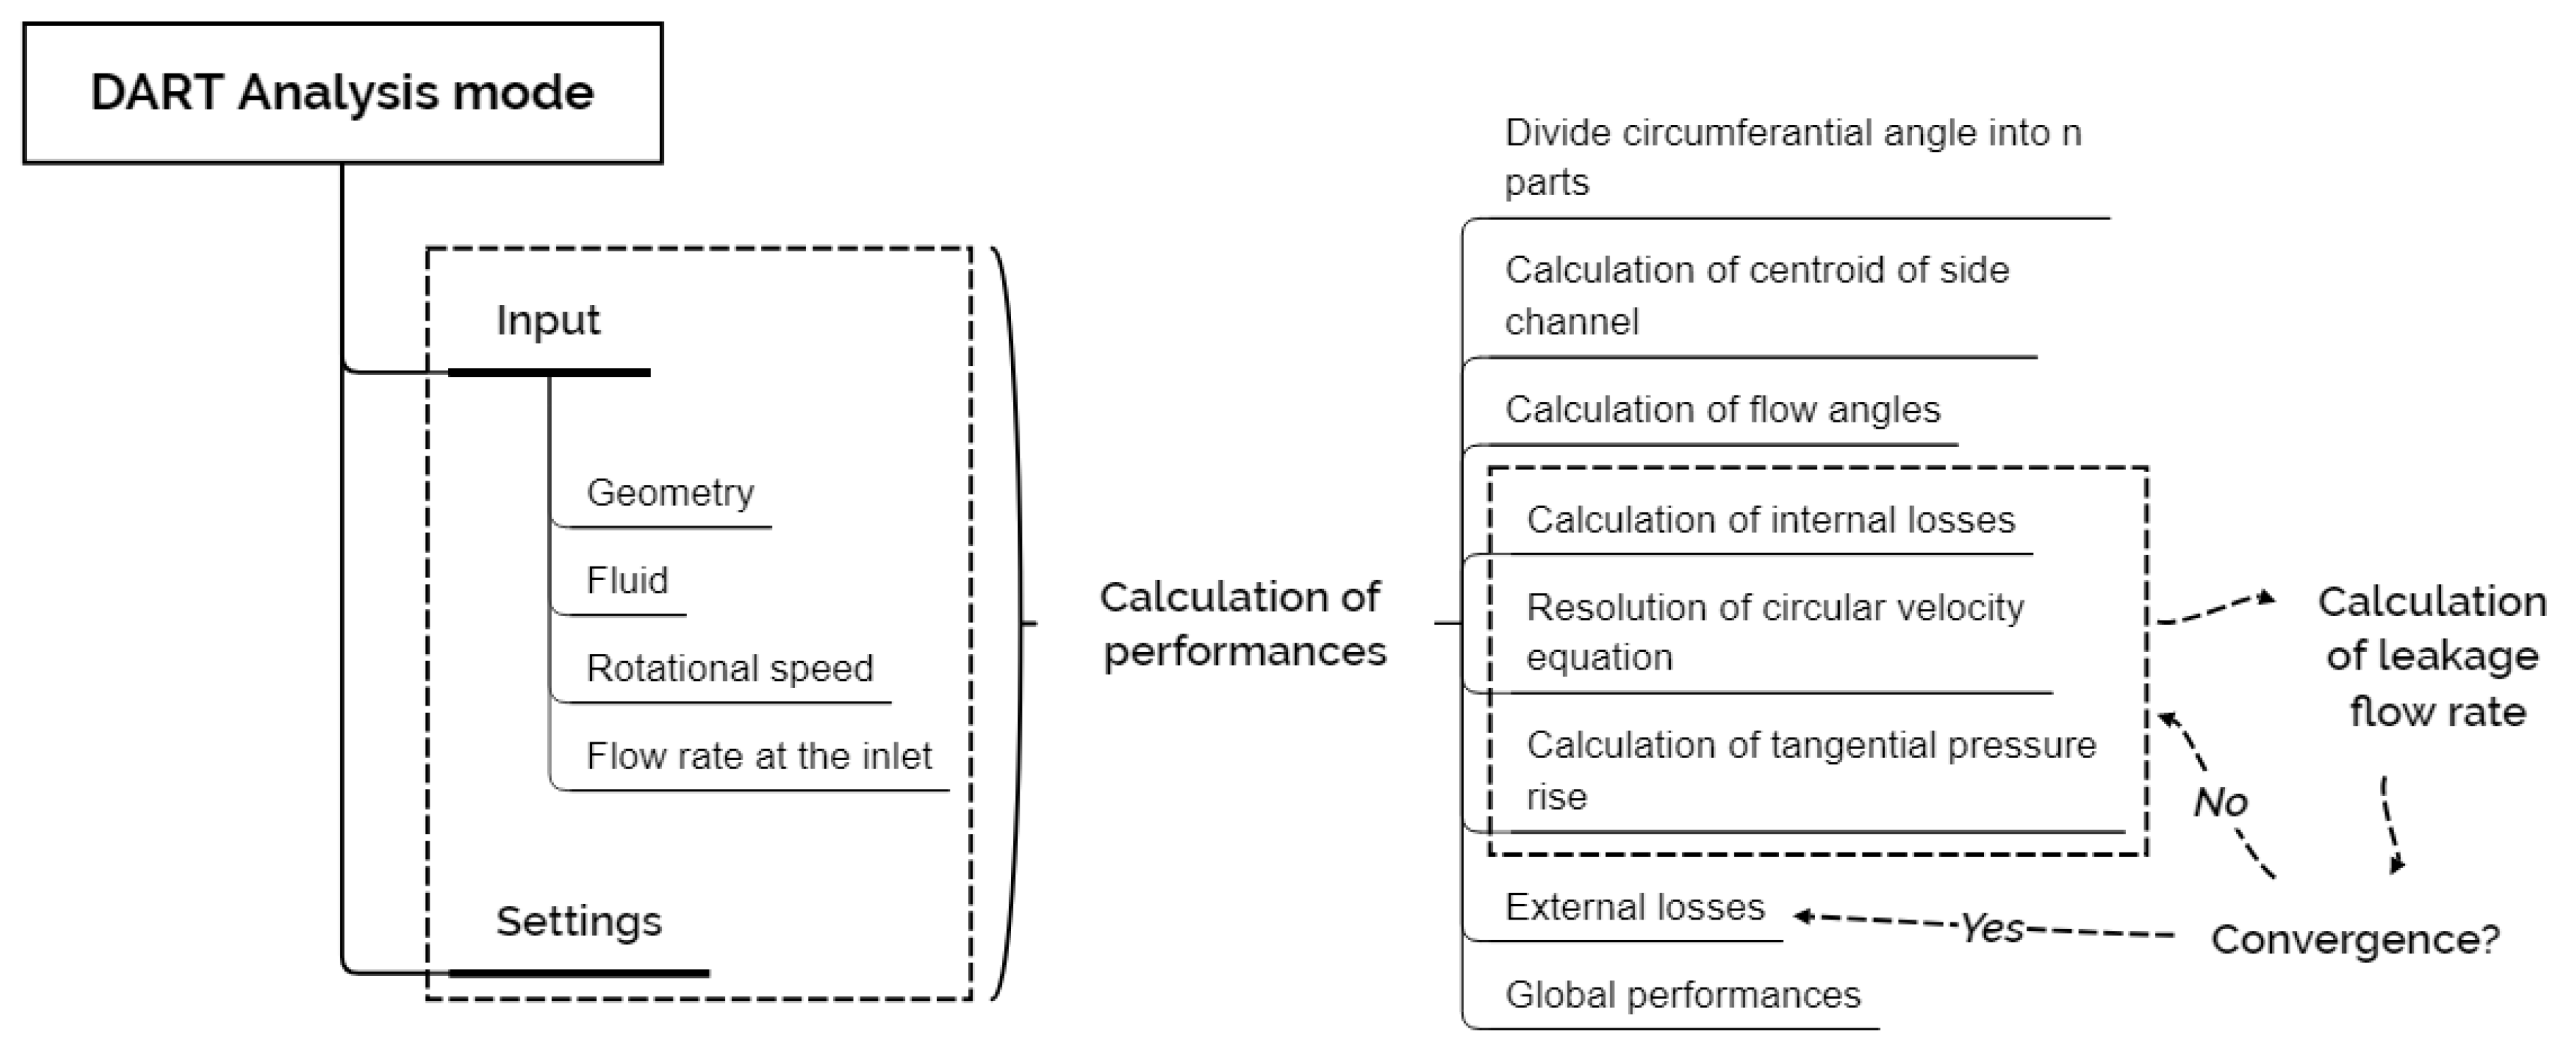
There is another zone where the velocity increases that is near the shaft. This is due to the local reduction of the section, which causes the deviation of the flow and then its acceleration. In Figure 3, the streamlines can also be observed. It has to be noticed that for the cavity with low aspect ratio (Figure 3a) a recirculation zone appears at the opposite side with respect to the stripper. There, the pressure gradient is not sufficiently high to contrast the entrainment generated by the rotating disk and, when a particle of fluid reaches a zone where the velocity of the disk is high enough to deviate the direction of the flow, the recirculating zone is established.
For what concerns the pressure maps in Figure 4, it can be underlined that increasing the axial gap (and then the leakage flow rate) the maximum available pressure value in the side channel decreases and then the performance of the regenerative pump reduces. In Figure 4a, it is possible to observe how the pressure value decreases from the outlet zone to the inlet zone in a linear way inside of the cavity. Despite the decrease of the pressure rise, a similar behavior can be observed in Figure 4b. On the contrary, for the higher aspect ratio of the cavity (Figure 4c), the pressure rise decreases so much that, using the same color scale as in Figure 4a,b, the cavity seems to be almost isobaric. That outcome underlines how leakage flows govern the performance of regenerative pumps.
In Figure 5, the velocity map along the z-direction (the direction parallel to the axis of the shaft) is reported. It can be observed that that velocity component is close to zero in almost the entire cavity. Considering the higher axial gap (Figure 5c), the zones where the axial velocity is not negligible are close to the high pressure zone, where the circulatory flow pattern in the side channel is dragged into the cavity, and near the shaft, where the wake behind the shaft increases the vorticity and establishes vortices that result in components of velocity along the z-direction. It can be concluded that the flow is almost planar in the cavity for most of the geometrical configurations. Therefore, the hypothesis of planar flow is acceptable in the development of the leakage flows model in regenerative pumps.

3. The DART Code

The use of simplified models for the preliminary analysis and design of energy systems’ components is widely accepted in the turbomachinery field (see, for example, [14,15,16,17]). Concerning regenerative pumps, a one-dimensional tool called DART (Design and Analysis tool for Regenerative Turbomachinery) has been developed aiming at providing preliminary design parameters for the setup of detailed three-dimensional numerical simulations. A general scheme of the DART solver is reported in Figure 6. For the development and verification of the original version of the DART code, refer to the work in [6]. A brief description of the solver follows.
The original model for performance prediction is as described in [4,5] and is based on the following hypothesis:
  • steady, adiabatic, incompressible flow;
  • pressure independent from axial and radial coordinates; and
  • leakage flow through disks does not have any impact on the main flow.
The second hypothesis makes the model one-dimensional, while the third hypothesis is the one that has to be overcome to increase DART’s accuracy. The aim of the present work is to equip the DART code with a methodology for the prediction of leakage flows through stationary and rotating disks in the presence of a tangential pressure non-uniformity, which is a typical configuration during regenerative pump operation.
DART is mainly based on the calculation of the equation for the circulatory velocity flow (Equation (1), where the notation is the same used by Yoo [4]).
d V c d θ = A c Q + Q v C 3 + C 2 V c ( θ ) C 1 V c ( θ )
The resolution of Equation (1) gives enough information to obtain the performance of the machine. It has to be noticed that both the derivative of the circulatory velocity and the coefficients C i depend on the flow rate Q. If there is no leakage flow through the disk cavity, the local flow rate is constant at every tangential coordinate in the side channel and it is equal to the sum of the flow rate at the inlet Q i n and the flow rate leaking through the stripper Q l , s t . If the flow rate in the side channel is constant, an analytic solution for Equation (1) can be found:
V c ( θ ) = K + 1 1 V 0 K C 1 C 2 2 K C 1 exp A c Q + Q v C 2 2 K C 1 θ θ 0 + C 1 C 2 2 K C 1
where K = C 2 + C 2 2 + 4 C 1 C 3 2 C 1 and V 0 is the circulatory velocity at the coordinate θ 0 .
The solution to Equation (2) cannot be used if there is a not negligible leakage flow through the disk-casing cavity because the term Q and the coefficient C i vary with the tangential coordinate θ . With reference to Figure 1, it is possible to write the continuity equation as follows:
Q ( θ ) = Q i n + Q l , s t + Q l , d i s k ( θ )
With variable flow rate and variable coefficient, two approaches are possible for the resolution of the circulatory velocity equation, both based on discretization of the θ coordinate in n parts named θ i :
  • a pure numerical solution with a linearization of the derivative d V c ( θ ) d θ V c ( θ i + 1 ) V c ( θ i ) θ i + 1 θ i ; and
  • a hybrid solution that consider the coefficients C i and the flow rate constant from θ i to θ i + 1 and use the solution in Equation (2).
A model for the leakage flow in the disk-casing cavity should be able to forecast the effect of the leakage on the resolution of Equation (1). As shown in Figure 6, the model has to be inserted in an iterative cycle that can be summarized as follows:
  • Solve the circulatory velocity equation.
  • Obtain the pressure rise, as a function of the coordinate θ .
  • Calculate the leakage flow rate, induced by the pressure distribution at the boundary of the cavity.
  • Obtain the new parameters for the equation of circulatory velocity and recalculate the solution.

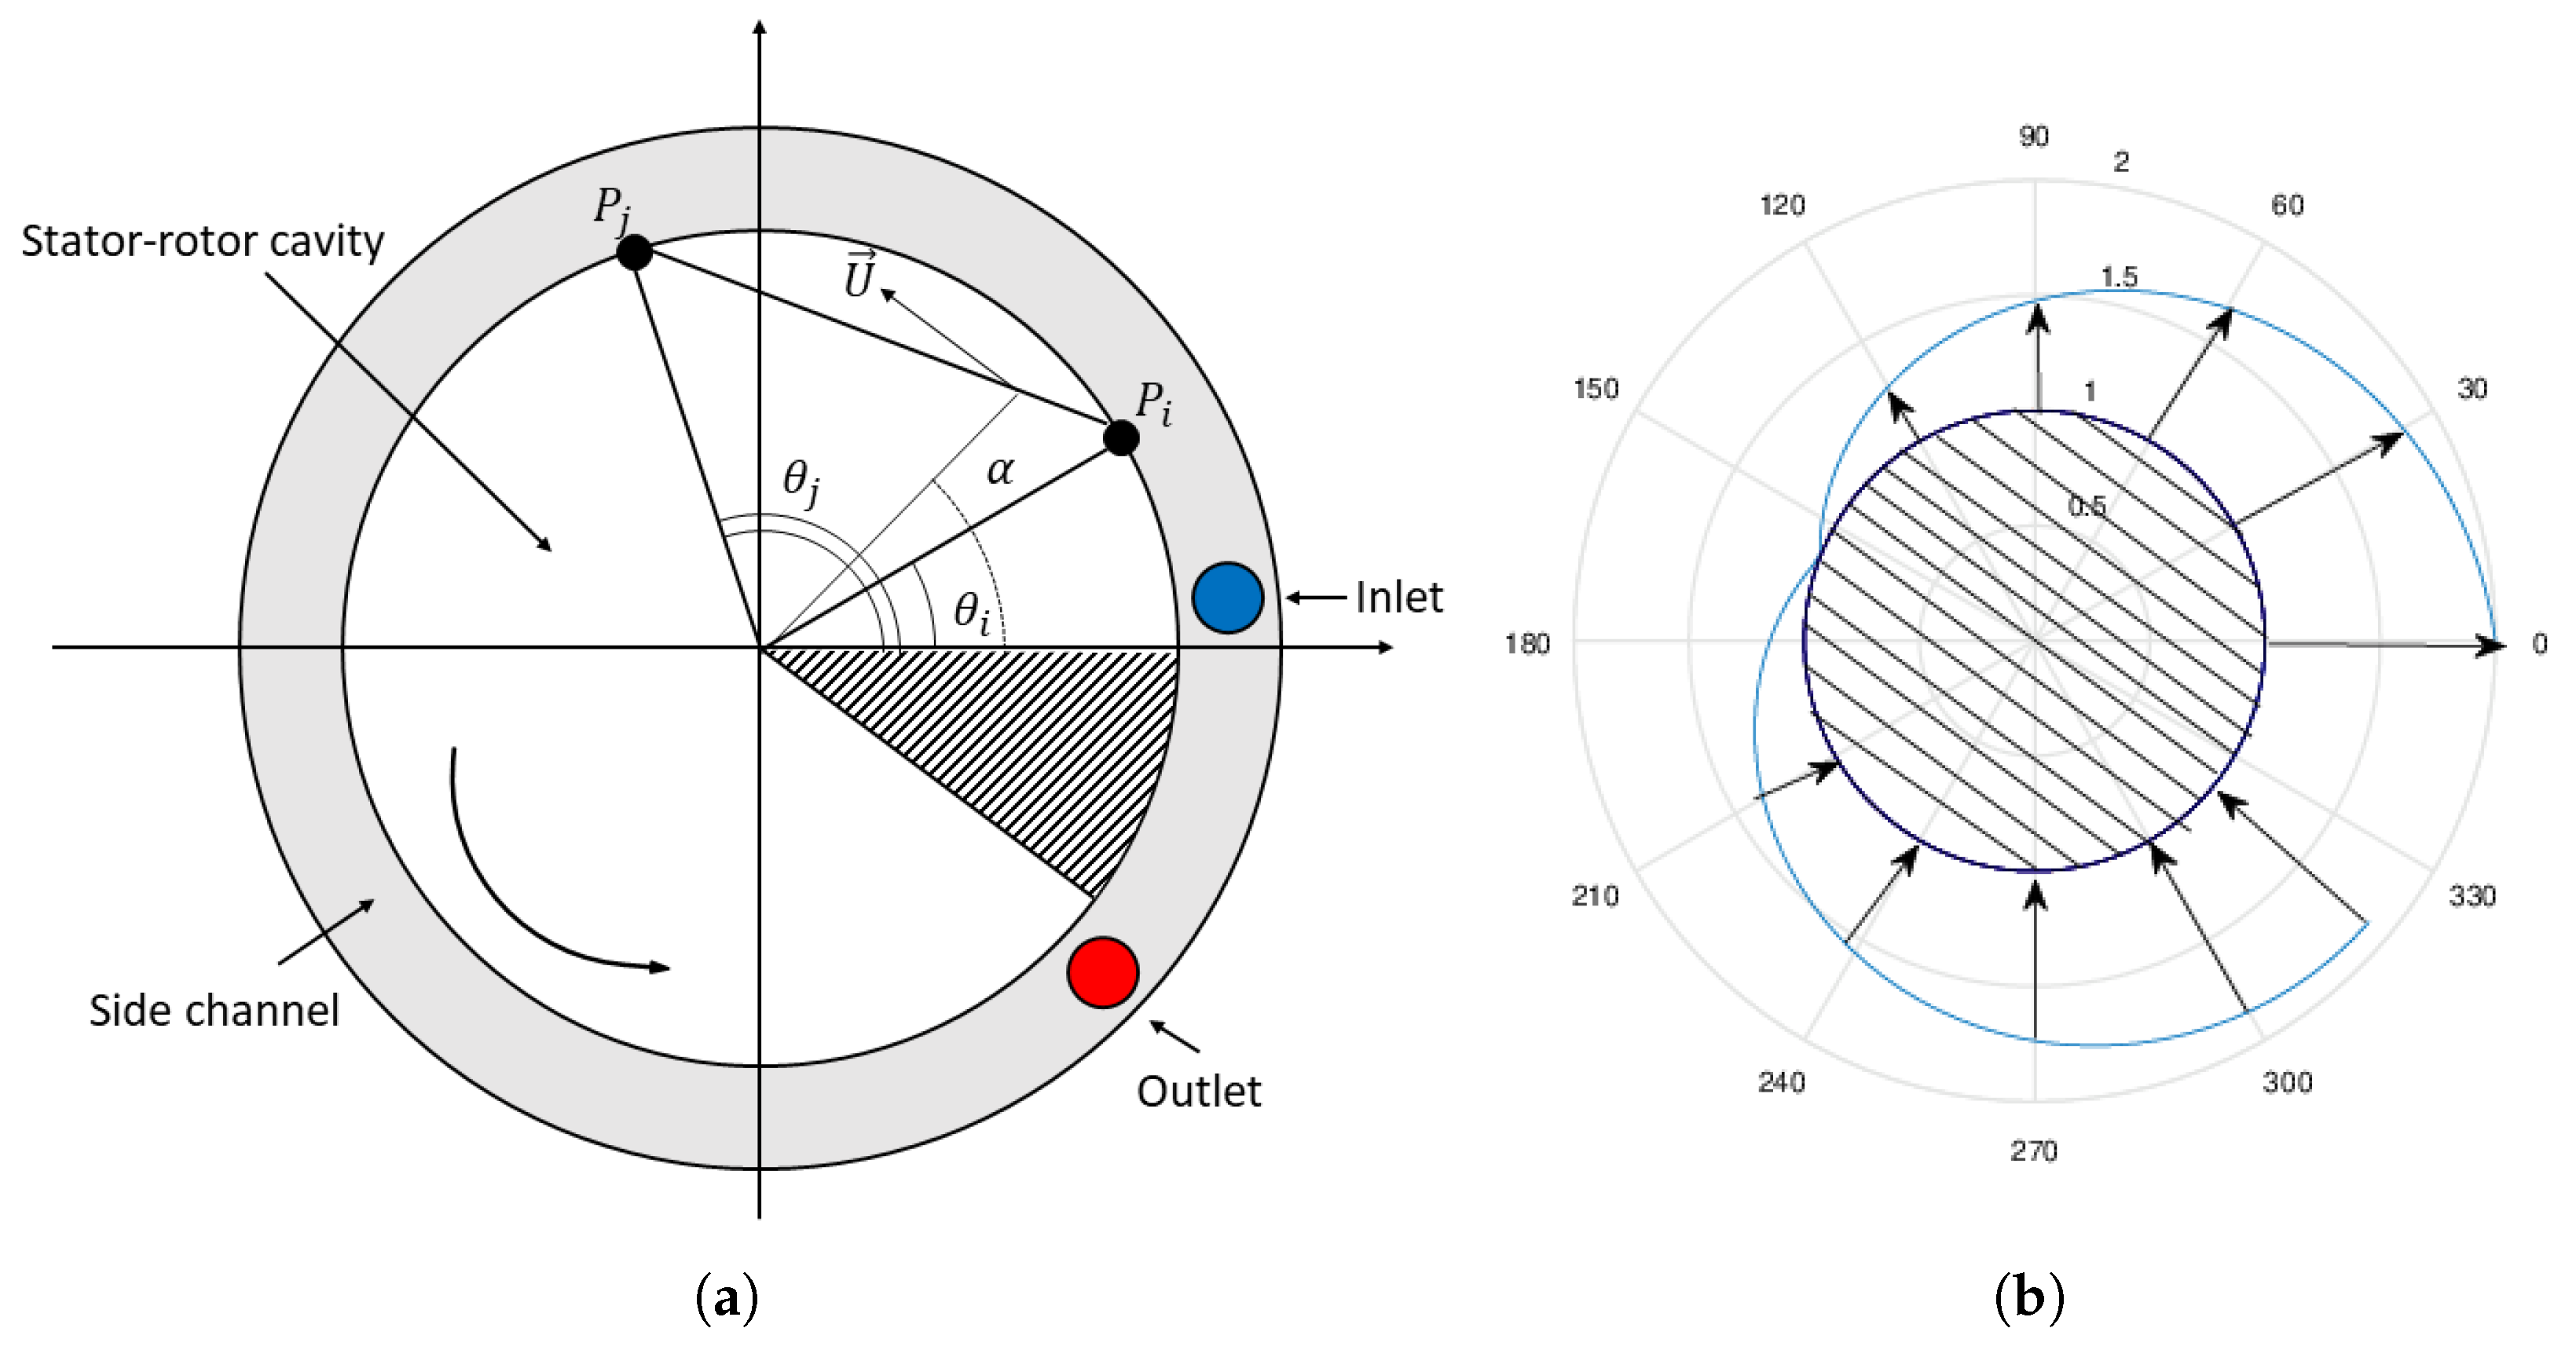
4. The Model for Leakage Flows

The present model is aimed at calculating the function Q l , d i s k ( θ ) and is based on three fundamental assumptions:
  • The diameter of the shaft is negligible with respect to the diameter of the hub of the blades. That hypothesis allows developing a model where the blockage of the shaft does not modify the total leakage flow rate.
  • The contribution of centrifugal forces to the tangential distribution of the leakage flow is negligible with respect to the pressure ratio between two different zones of the pump. That hypothesis means that the fluid can follow a straight trajectory inside of the cavity between two points, considering negligible any deviation from a straight line between any couple of points. Given these hypotheses, a stream-tube model can be developed.
  • The flow in the cavity is a planar flow. This hypothesis is consistent with the preliminary CFD calculation, as shown by the comments on Figure 5.
The disk-casing cavity is considered as a zone delimited by a circular boundary and each couple of points P i and P j laying on that zone identify a stream-tube along a chord C i j . Therefore, the leakage flow rate in each stream-tube can be determined by knowing the pressure ratio between P i and P j , the hydraulic resistance between P i and P j and the motion of the disk relative to the casing in every point of C i j . In Figure 7a, the circumference has been scaled to have radius equal to 1 and the radius defines the distance from the axis of the shaft to the hub of the vanes. Referring to Figure 7a, it is possible to define the angle θ from the stripper location to Point P i on the circumference and the angle ϕ from the stripper location to Point P j on the circumference. The flow rate from a point P i to a point P j can be written as follows:
q i j = S i j W i j + U m e a n , i j 2
where W i j depends on the pressure ratio between point P i and point P j and S i j is the passage area of the stream-tube P i P j . In a cavity with a relative motion between two walls, the superposition principle allows correcting the flow rate q i j by a factor U 2 , where U is the relative speed between the walls. Therefore, the term U m e a n , i j represents the effect of the rotation of the disk to the leakage flow and depends on the relative motion between the impeller and the casing. All of those terms have to be calculated separately. The energy equation for a generic stream-tube P i P j can be written as follows:
p i ρ + W i 2 + R i j = p j ρ + W j 2
where R i j are the losses in the stream-tube P i P j considering a uniform velocity profile. In addition, the section of the stream-tube is considered constant, thus Equation (5) reduces to:
p j p i ρ = R i j
For what concerns the sign of the velocity and the flow-rate, the flow rate coming into the cavity is considered positive and the flow rate exiting the cavity negative. The losses R i j depend on the square of the velocity W, on the length L of the chord P i P j , on the friction factor f and on the equivalent hydraulic diameter D e q :
R i j = f L D e q W 2 2
Combining Equation (7) with Equation (6), it is possible to evaluate the velocity W:
W i j = 2 D e q ( p j p i ) L f ρ
The equivalent hydraulic diameter is equal to the ratio between four times passage area and the wetted perimeter:
D e q = 4 S l w e t t e d = 4 h s 2 s = 2 h
where h is the height of the cavity. The length of the chord L is:
L = 2 r sin θ j θ i 2
The friction factor is a function of Reynolds number R e = ρ W D e q μ and of the relative roughness, which is available from a Moody’s chart. Finally, an equation for the velocity W is available:
W i j = 2 h ( p j p i ) r f ρ sin θ j θ i 2
The value of the effect of the term U m e a n , i j of Equation (4) also has to be evaluated. Neither the magnitude nor the direction of U will be constant along a chord P i P j , thus the integral average of the parallel component of U along the chord (called U m e a n ) has to be used:
U m e a n = 1 θ j θ i θ i θ j U ( P i P j ) P i P j d α .
With reference to Figure 7a, it is possible to write:
U = ρ ω sin α cos α
Combining Equation (13) with Equation (12), it is possible to evaluate U m e a n :
U m e a n = ω cos θ j θ i 2 s i g n sin θ j θ i 2
where:
s i g n ( x ) = 1 if   x 0 1 if   x < 0
Once the velocities W i j and U m e a n , i j are calculated, it is possible to evaluate the flow rate using Equation (4) estimating the passage area. Given a discretization d θ = 2 π θ s t r i p p e r N , where N is the number of tangential steps, the passage area of the stream-tube from θ i d θ 2 , θ i + d θ 2 to θ j d θ 2 , θ j + d θ 2 is:
S i j = 2 h r sin d θ 2 sin θ j θ i 2

5. Implementation of the Leakage Model

The proposed model was initially implemented as a stand-alone tool in MATLAB ® to test its accuracy and to tune the method using the available data obtained from a specifically performed numerical campaign using Computational Fluid Dynamics (CFD). The final version of the model was implemented in DART and the new code was verified using both CFD and experimental data.
To make the new model work in DART, the circumferential domain of the cavity is divided into n equal parts θ i , written in a vector ϑ . The matrix Δ p is also defined, where the i j th element represents the difference of pressure between ϑ i and ϑ j :
Δ p = p Γ n T p Γ n T T
In Equation (17), Γ n is a n-dimensional vector that has a unitary value in every component. With the same method, the matrix containing the difference of the angular coordinate between ϑ i and ϑ j can be written:
Δ ϑ = ϑ Γ n T ϑ Γ n T T
To complete the implementation, it is necessary to define the matrices of the passage areas, of the length of the chords and of the square root of differences of pressure between ϑ i and ϑ j :
S = h n 1 2 r sin d θ 2 sin Δ ϑ 2
L = 2 r sin Δ ϑ 2
K = Δ p Δ p T
In the latter equation the operator refers to the real part of the elements of the matrix. Since it is necessary to initialize an iterative cycle, a discharge coefficient is calculated with a methodology proposed by Balje [7]. The initial guess of the friction factor λ therefore has no physical relevance:
C D = 2 h λ 1 L
Then, the first attempt leakage flow rate Q * is:
Q * = r h C D K d θ
It is now possible to calculate the matrix of Reynolds numbers and a fictitious velocity dividing the flow rate by the passage area:
R e = ρ W o l d D e q μ
W o l d , i j = Q i j * S i j
The iterative cycle can start by recalculating the value of W with the following equation:
W n e w = K 2 ρ C o l R e ; ε D e q L D e q
where C o l R e ; ε D e q is the function that gives the friction factor using the Colebrook formula. The cycle converges when the following convergence condition is reached:
max W n e w W o l d W o l d < δ
To be coherent with the proposed physical model, it is possible to correct the obtained velocity value including the effects of rotation:
W r o t = W + ω r cos Δ ϑ 2 s i g n sin Δ ϑ 2 2
where ∘ is the element-by-element product. According to Equation (4), the flow rate is Q i j = S i j W r o t , i j . From this matrix, we can obtain the vector of the leakage flow rates for every discretized element Q i d i s t r i b u t i o n and the vector of cumulative sum of leaked flow rate Q i c u m u l :
Q i d i s t r i b u t i o n = j = 1 N Q i j
Q i c u m u l = j = 1 i Q j d i s t r i b u t i o n
From these data, the total flow rate leaked into the cavity can be finally calculated:
Q t o t , l e a k = max i = 1 n Q i c u m u l
The typical distribution of flow rate obtained from the aforementioned model is schematized in Figure 7b. The leakage flow rate is maximum close to the stripper (maximum pressure drop available) and reaches zero in the circumferential position opposite to the stripper region. In a real machine, a leakage flow rate will also be present between the stripper and the cavity. In the present model, the stripper leakage flow rate is supposed to move across the stripper from the outlet to the inlet of the regenerative machine ( Q l , s t in Figure 1) without any interaction with the cavity flow and then it is treated separately from the disk leakage.

6. Calibration of the Leakage Model

The proposed leakage model was calibrated by comparing its results with the data obtained from the numerical campaign shown in Section 2.1. For the calibration procedure, the case with the smaller gap ( h / H = 0 . 00886 ) was considered. For the comparison between CFD data and the outcome of the 1D model, the interface region between the side channel and the cavity was considered to extract (from the numerical simulations) the boundary conditions of the model and the reference data for the comparison. The circumference was split into 600 sectors and for every sector the averaged values of pressure and radial velocity were considered. The number of sectors was chosen after a sensitivity test. It was demonstrated that, with more than 600 sectors, there were no more differences in the obtained results. Thus, the outcome of the model is independent from the discretization in the tangential direction. However, in the standard routine, DART uses fewer sectors to obtain a faster convergence rate. The sum of the elements of the latter vector multiplied for the surface of one sector represents the total flow rate leaked through the cavity. The 1D model uses a discretization that is different from the one used for the numerical campaign, thus the tangential pressure distribution was interpolated at the boundary with a shape-preserving algorithm.
In Figure 8a, a comparison between the model (dashed line) and the CFD data (solid line) for Q c u m u l at h / H = 0 . 00886 is reported. In that figure, θ n d = 0 is in correspondence of the center of inlet duct and θ n d = 1 corresponds to the center of the outlet duct. It can be observed that the model does not forecast the fluctuations due to the presence of the vanes, but it was an expected result since they are not considered in the hypothesis of the model. The discrepancy on the global leaked flow rate can be estimated around 1.66%. The trend of the curve for the model is quite similar to the curve obtained from CFD data, particularly regarding the tangential position of the maximum of the curve. The limits of the zones with a positive derivative (the flow rate that leaks from the side channel into the cavity) and the zones with a negative derivative (the flow rate leaks from the cavity to the side channel) are also well reproduced.
The model seems to be able to reproduce the overall flow rate passing from side to side of the stator/rotor cavity, but also shows some discrepancies in the reproduction of the flow rate repartition around the disk. To overcome such limitation, a non-dimensional distribution of the flow rate around the stator/rotor cavity obtained from the CFD campaign was used to tune the model. Since the leakage flow through the stripper zone is not considered in DART as a contribution to the total leaking flow, that flow rate was deducted and the CFD data distribution visible in Figure 8b (solid line) was obtained. As can be observed, the non-dimensional distribution does not reach the unitary value due to the exclusion of the stripper flow rate from the computation of the cumulative distribution (the θ n d variable is therefore limited between 0 and 1). The CFD data distribution was fitted with a polynomial function and used in a non-dimensional form to correct the theoretical flow rate (Equation (4)) obtained from the proposed model. The comparison between the CFD data and the stand-alone model after the tuning procedure is visible in Figure 8b (dash-dotted line).
Figure 8b shows a comparison between the results calculated by a version of DART equipped with the tuned leakage model (dashed line) and the results from CFD campaign without stripper leakage. The two curves shown in Figure 8b were obtained for the same pump but with two completely different approaches. In fact, the dashed line in Figure 8b was obtained by calculating iteratively the pressure distribution and the leakage flow rate in a coupled way with DART. As can be observed, the prediction of the leakage flow distribution along the tangential direction is quite close to the CFD data and to the one obtained with the calibrated stand-alone model (dash-dotted line in Figure 8b), thus demonstrating that the tuned model implemented in DART is able to capture the quantitative and qualitative behavior of the leakage flow.

7. Validation of the Model

It was shown that the DART code equipped with a tuned disk leakage model is able to reproduce correctly the tangential distribution of leakage flow rate if compared with CFD data. It was then necessary to check its accuracy when the performance of the regenerative pump is of interest. The code verification procedure was therefore completed by comparing the data obtained using the DART code with the CFD data from the already described campaign and with experimental data from literature.

7.1. Comparison with CFD Data

A comparison between the performance obtained with DART and with the CFD campaign introduced in Section 2.1 is here reported. In Table 2, the data obtained from DART with the leakage option switched on and off are compared with CFD data. Variables were reduced to non-dimensional values with reference to the non-dimensional Δ p value obtained using CFD for the case with a non-dimensional axial clearance equal to 0 . 0177 .
As can be observed, both the Δ p and the η values were greatly overestimated with respect to CFD data when the leakage model was switched off. The accuracy of the DART code increased when the leakage flow model was used, especially in terms of Δ p for both the h / H = 0 . 00886 and the h / H = 0 . 0354 cases. In addition, the trend of variation of the performance was well captured, with some notable exception. In fact, both the Δ p and the η values for the h / H = 0 . 0177 case did not diminish as expected and in general the η values obtained with DART were higher than the respective ones obtained from the CFD campaign. The latter behavior can be explained considering that a one-dimensional model cannot correctly evaluate the impact of three-dimensional phenomena (e.g., secondary flows) on the performance of the machine, unless they are specifically modeled with correlations that have to be tuned for the specific range of application.
To better understand the differences in the Δ p prediction, the pressure variation along the circumferential coordinate for the three investigated cases was analyzed. Concerning the CFD data, the same procedure used to extract the pressure boundary condition for the stand-alone model was used. The results are reported in Figure 9 in a non-dimensional form with respect to the Δ p value obtained from the CFD campaign excluding the stripper region. The data shown in Figure 9 refer to a case with h / H = 0 . 0177 and a halved radial clearance at the rotor tip. As can be observed, the inclination of the pressure variation along the circumferential direction obtained without the leakage model (dash-dotted line) was higher than the one obtained from the CFD campaign (solid line), thus leading to a higher Δ p value of the pump. That overestimation was corrected by activating the leakage model (dashed line in Figure 9), which corrected iteratively the local flow rate of the pump and reduce the overall performance in terms of Δ p . Current data demonstrate that the implementation of a calibrated leakage flow model in the original one-dimensional code improves its accuracy by a non-negligible factor.

7.2. Comparison with Experimental Data

There is a limited amount of experimental data in the literature about regenerative pumps’ performance. In fact, those machines are not extensively studied if compared with centrifugal pumps. The dimension of the disk clearance can be extrapolated from a study made by Yoo et al. [5] about a regenerative pump used as a heart pump. It can be observed that, for the cases studied in [5], leakage flows’ impact on the performance of the heart pump is more relevant as the ratio h / H increases. That outcome is coherent with the numerical data shown in Table 2, which demonstrate that increasing the clearance value has a detrimental effect on the regenerative pump performance.
Since the heart pump was fully described by Yoo et al. [5] and the geometrical parameters and the fluid properties are summarised in Table 3, their experimental results can be compared with data obtained with DART for the same working conditions and geometrical configuration (including clearance dimension). Only flow rates close to the design point at ω = 2400 RPM were considered, to study the clearance effects limiting the impact of off-design conditions on the overall performance. The comparison between the experimental data and the numerical results is reported in Table 4 for the case h / H = 0 . 00282 . The percentage of overestimation of the pressure rise made by DART with respect to the experimental value is tabulated.
The entity of the overestimation for the case without leakage model is quite high (around +40%), while the leakage model allows limiting the difference with respect to the experiments to the (−20%; +11%) interval. In addition to the reduction of the error, it is interesting to observe that switching on the leakage flow model makes the variation of performance with respect to the experimental data dependent on the flow rate of the pump.
Although it is not possible to state that the model is fully validated, it can be concluded that the implemented method increases the accuracy of the DART code by introducing a physical feature that has a fundamental impact on the regenerative pump performance.

8. Conclusions

A novel methodology for the evaluation of leakage flow tangential distribution through a stationary and a rotating disk subject to a non-uniform pressure field is proposed. The aim of the activity is to implement the methodology in the DART code, which is able to predict the performance of a regenerative pump using a one-dimensional approach.
The characteristics of the leakage flow through a stationary and a rotating disk were analyzed through a numerical campaign on a virtual model for three different clearance aspect ratios. As a general conclusion, the impact of the clearance dimension on the regenerative pump performance is non-negligible, especially for the higher investigated aspect ratio. Furthermore, it can be concluded that the flow field is essentially two-dimensional for most of the investigated cases and that the leakage flow moves through streamlines that could be approximated as chords between two points along a circumferential position. The relative dimension of the shaft with respect to the disk dimension could have an impact on the flow trajectory, but, in the present model, that aspect has been neglected.
The theory underlying the methodology is explained and the implementation procedure is detailed. The outcome of the stand-alone methodology was initially compared with data obtained from the three-dimensional CFD campaign performed on the virtual model used as reference case. A tuning procedure is defined to correctly reproduce the shape of the tangential flow rate distribution neglecting the stripper flow rate contribution.
The tuned model was coupled with the original algorithm in DART and the results were compared with CFD data, thus demonstrating that the new version of the code is able to capture the main-flow/leakage-flow interaction phenomenon. Then, DART was used to analyze the performance of the reference case varying the clearance dimension and results were compared with CFD data. The obtained results show that, if the clearance dimension increases, the performance of the pump decreases. Furthermore, data demonstrate that the implementation of the calibrated leakage-flow model improves DART accuracy by a non-negligible factor. Finally, DART was used to analyze a heart pump geometry whose characteristics are available from the literature. Based on the data comparison, it can be concluded that the implemented method greatly increases the accuracy of the DART code by considering a real-machine effect that has a fundamental impact on regenerative pump performance.

Author Contributions

Conceptualization, G.C., S.S., M.I., G.P., G.S., D.G. and R.S.; methodology, G.C., S.S. and M.I.; software, G.C., M.I., G.P., G.S. and D.G.; validation, G.C., S.S., M.I., G.P. and G.S.; formal analysis, G.C. and M.I.; investigation, G.C., S.S., M.I., G.P., G.S., D.G.; resources, S.S. and R.S.; data curation, G.C., M.I., G.P., G.S. and D.G.; writing—original draft preparation, G.C., S.S.; writing—review and editing, G.C., S.S.; visualization, M.I., G.P. and D.G.; supervision, S.S. and R.S.; project administration, S.S. and R.S.; and funding acquisition, S.S. and R.S.

Funding

This research received no external funding.

Acknowledgments

The authors want to thank sincerely Giacomo Armenio (R & D Director Global, BU Pierburg Pump Technology), Frank Maurer (CEO, Pierburg Pump Technology Italy), Marco Pierini and Francesco Martelli (University of Florence) for without them, this paper would not have been possible.

Conflicts of Interest

The authors declare no conflict of interest.

Abbreviations

The following abbreviations are used in this manuscript:
PPoints on the circumference that individuate a stream-tube
dAxial extension of the open channel
D e q Equivalent hydraulic diameter
fFriction factor
hClearance of the disk-casing cavity
HImpeller blade height
lPerimeter
LGeneric distance between two points on the circumference
n d Non-dimensional
N b l Number of impeller blades
pPressure
PPoint in a stream-tube
QFlow-rate
rRadius
R e Reynolds number
sWidth of the disk-casing cavity
tImpeller blade thickness
SPassage area of the stream-tube
UVelocity contribution of relative disk-casing movement
WVelocity
Greek
α Angle from stripper to generic point on a stream-tube
Φ Flow coefficient
Ψ Load coefficient
ρ Density
θ i Angle from stripper to point P i
ω Rotating speed

References

  1. Gülich, J.F. Centrifugal Pumps, 3rd ed.; Springer: Berlin/Heidelberg, Germany, 2014. [Google Scholar] [CrossRef]
  2. Brown, A. A Comparison of Regenerative and Centrifugal Compressors. In International Compressor Engineering Conference; Purdue University: West Lafayette, IN, USA, 1972; Paper 34. [Google Scholar]
  3. Mosshammer, M.; Benigni, H.; Jaberg, H.; Konrad, J. Maximum Efficiency Despite Lowest Specific Speed—Simulation and Optimisation of a Side Channel Pump. Int. J. Turbomach. Propuls. Power 2019, 4, 6. [Google Scholar] [CrossRef]
  4. Yoo, I.S.; Park, M.R.; Chung, M.K. Improved Momentum Exchange Theory For Incompressible Regenerative Turbomachines. Proc. Inst. Mech. Eng. Part A J. Power Energy 2005, 219, 567–581. [Google Scholar] [CrossRef]
  5. Yoo, I.S.; Park, M.R.; Chung, M.K. Hydraulic design of a regenerative flow pump for an artificial heart pump. Proc. Inst. Mech. Eng. Part A J. Power Energy 2006, 220, 699–706. [Google Scholar] [CrossRef]
  6. Insinna, M.; Salvadori, S.; Martelli, F.; Peroni, G.; Simon, G.; Dipace, A.; Squarcini, R. One-dimensional prediction and three dimensional CFD simulation of the fluid dynamics of regenerative pumps. In Proceedings of the ASME Turbo Expo 2018: Turbomachinery Technical Conference and Exposition, 2C: Turbomachinery, V02CT42A036, Oslo, Norway, 11–15 June 2018. Paper No. GT2018-76416. [Google Scholar] [CrossRef]
  7. Balje, O. Drag Turbines Performances. Trans. ASME 1957, 79, 1291–1302. [Google Scholar]
  8. Batchelor, G. Note on a class of solutions of the Navier-Stokes equations representing steady rotationally-symmetric flow. Q. J. Mech. Appl. Math. 1951, 4, 29–41. [Google Scholar] [CrossRef]
  9. Stewartson, K. On the flow between two rotating coaxial discs. Proc. Camb. Philos. Soc. 1953, 49, 333–341. [Google Scholar] [CrossRef]
  10. Salvadori, S.; Marini, A.; Martelli, F. Methodology for the residual axial thrust evaluation in multistage centrifugal pumps. Eng. Appl. Comput. Fluid Mech. 2012, 6, 271–284. [Google Scholar] [CrossRef]
  11. Quail, F.; Scanlon, T.; Stickland, M. Design optimisation of a regenerative pump using numerical and experimental techniques. Int. J. Numer. Methods Heat Fluid Flow 2011, 21, 95–111. [Google Scholar] [CrossRef] [Green Version]
  12. Nejadrajabali, J.; Riasi, A.; Nourbakhsh, S. Flow pattern analysis and performance improvement of regenerative flow pump using blade geometry modification. Int. J. Rotating Mach. 2016, 2016, 1–16. [Google Scholar] [CrossRef]
  13. Shih, T.; Liou, W.; Shabbir, A.; Zhang, Z.; Zhu, J. A new κϵ eddy-viscosity model for high Reynolds number turbolent flows—Model development and validation. Comput. Fluid 1995, 24, 227–238. [Google Scholar] [CrossRef]
  14. Griffini, D.; Salvadori, S.; Carnevale, M.; Cappelletti, A.; Ottanelli, L.; Martelli, F. On the development of an efficient regenerative compressor. Energy Procedia 2015, 82, 252–257. [Google Scholar] [CrossRef]
  15. Bontempo, R.; Manna, M. Analysis and evaluation of the momentum theory errors as applied to propellers. AIAA J. 2016, 54, 3840–3848. [Google Scholar] [CrossRef]
  16. Bontempo, R.; Manna, M. Highly accurate error estimate of the momentum theory as applied to wind turbines. Wind Energy 2017, 20, 1405–1419. [Google Scholar] [CrossRef]
  17. Griffini, D.; Salvadori, S.; Martelli, F. Thermo-hydrodynamic analysis of plain and tilting pad bearings. Energy Procedia 2016, 101, 2–9. [Google Scholar] [CrossRef]
Figure 1. Scheme of the regenerative pump.
Ijtpp 04 00019 g001
Figure 2. (a) Detail of the grid; and (b) photograph of the prototype.
Ijtpp 04 00019 g002
Figure 3. Contour of velocity on plane xy for various axial gap: (a) h/H = 0.00886; (b) h/H = 0.0177; and (c) h/H = 0.0354.
Ijtpp 04 00019 g003
Figure 4. Pressure contour for various axial gap: (a) h/H = 0.00886; (b) h/H = 0.0177; and (c) h/H = 0.0354.
Ijtpp 04 00019 g004
Figure 5. Contour of velocity on z-direction for various axial gap: (a) h/H = 0.00886; (b) h/H = 0.0177; and (c) h/H = 0.0354.
Ijtpp 04 00019 g005
Figure 6. Scheme DART.
Ijtpp 04 00019 g006
Figure 7. (a) Nomenclature for angular positions; and (b) tangential Q d i s t r i b u t i o n .
Ijtpp 04 00019 g007
Figure 8. Q c u m u l comparisons for h / H = 0 . 00886 : (a) model and CFD data; and (b) DART and CFD data.
Ijtpp 04 00019 g008
Figure 9. Comparison of pressure rise between DART (with and w/o leakage option) and CFD data.
Ijtpp 04 00019 g009
Table 1. Non-dimensional parameters of the regenerative pump.
r h u b / H [-]1.23
r t i p / H [-]2.23
d / H [-]0.30
t / H [-]0.134
h / H [-]0.00886, 0.0177, 0.0354
N b l [-]30
Φ [-]0.52
Ψ [-]2.5
R e [-]197000
Table 2. Comparison between performance obtained using CFD and DART.
h / H 0 . 00886 0 . 0177 0 . 0354
Δ p η Δ p η Δ p η
DART w/o disk leakage--2.4050%--
DART with disk leakage2.0744%1.4345%0.5230%
CFD2.0534%1.0026%0.5821%
Table 3. Geometrical and fluid parameters for Yoo’s heart pump presented in [5].
Design ParameterValueUnit
Tip radius ( r 2 )15mm
Tip clearance (c)1.4mm
Vane height (h)7.1mm
Channel aspect ratio (AR)0.8-
Vane thickness (t)0.51mm
Number of Vane (z)31-
Clearance of stripper and cavity0.2mm
Stripper angle25.2deg
Rotational speed2400rpm
Density1000 kg / m 3
Viscosity1.001mPa s
Table 4. Comparison between pressure rise of experimental data and DART.
Q [lpm]DART without Leakage [%]DART with Leakage [%]Experimental Data [mbar]
3.45+30+11216
3.95+42+9182
4.40+40+3149
4.85+41-6115
5.25+42-2082

