Exploration of Axial Fan Design Space with Data-Driven Approach


Abstract
:1. Introduction
2. Data Mining
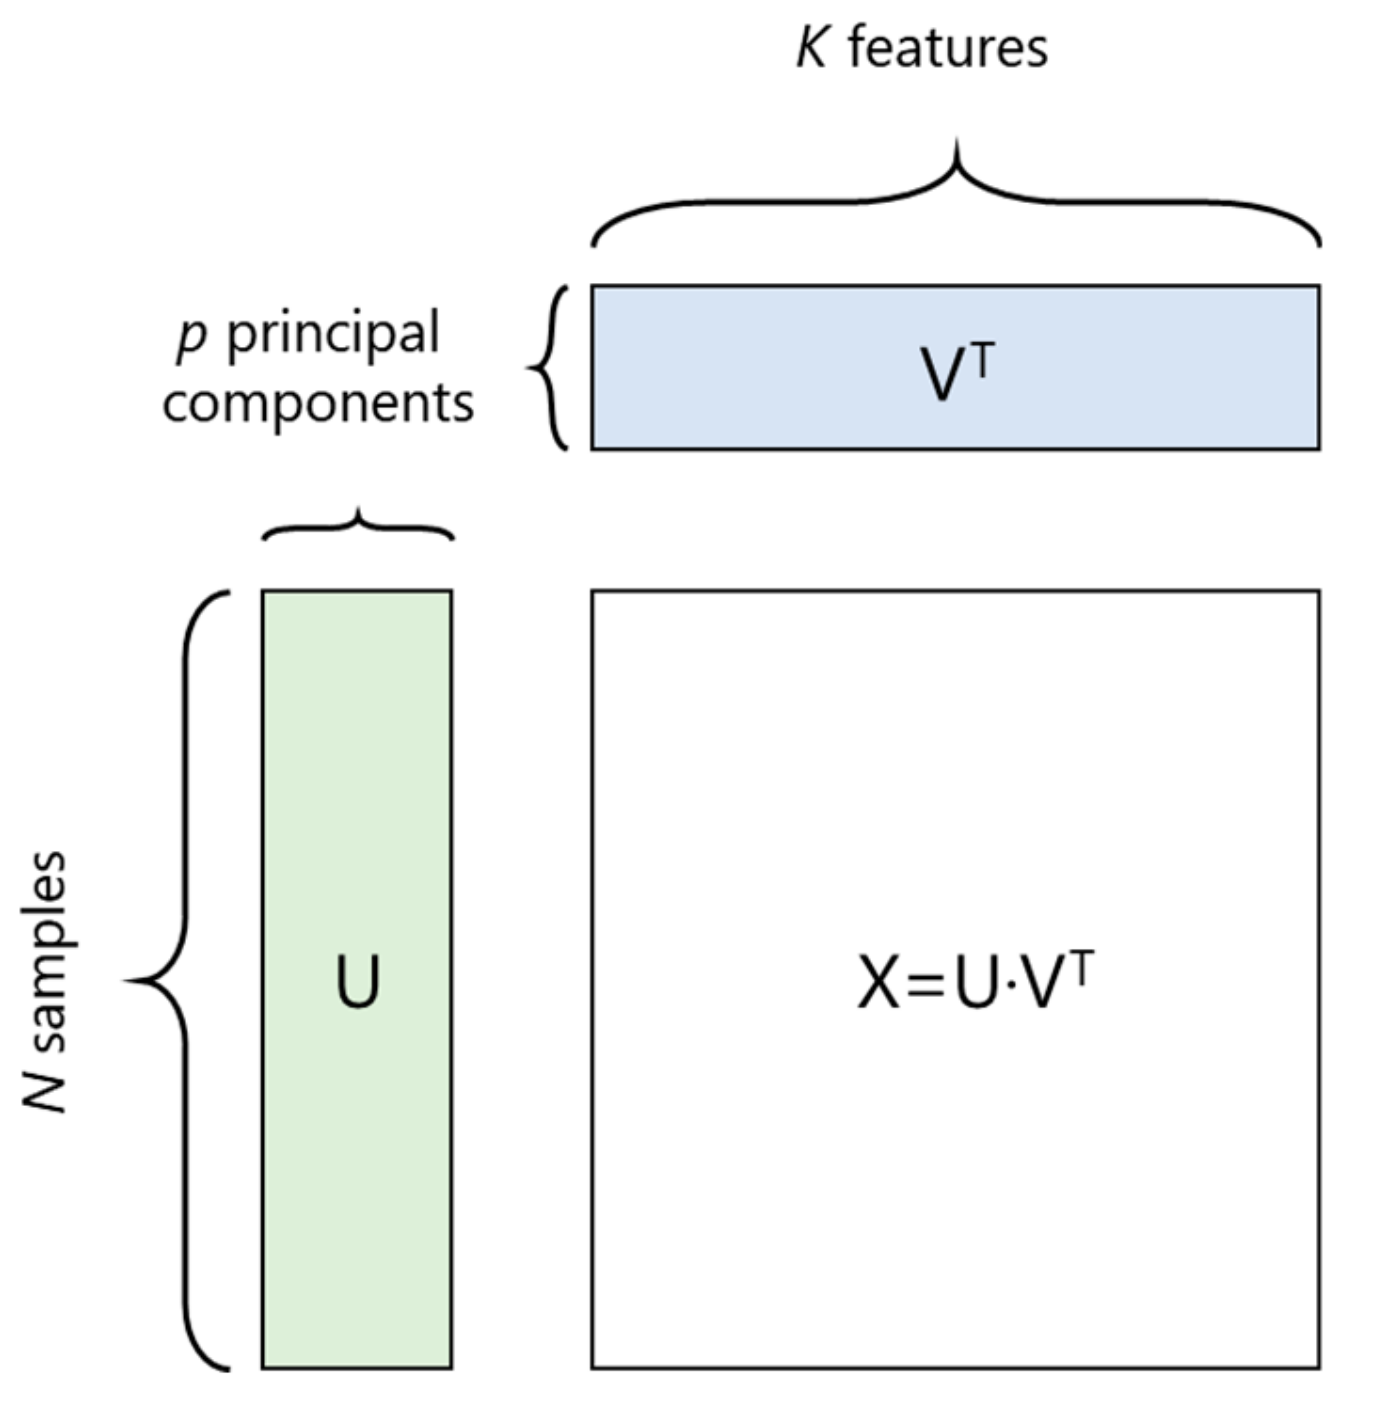
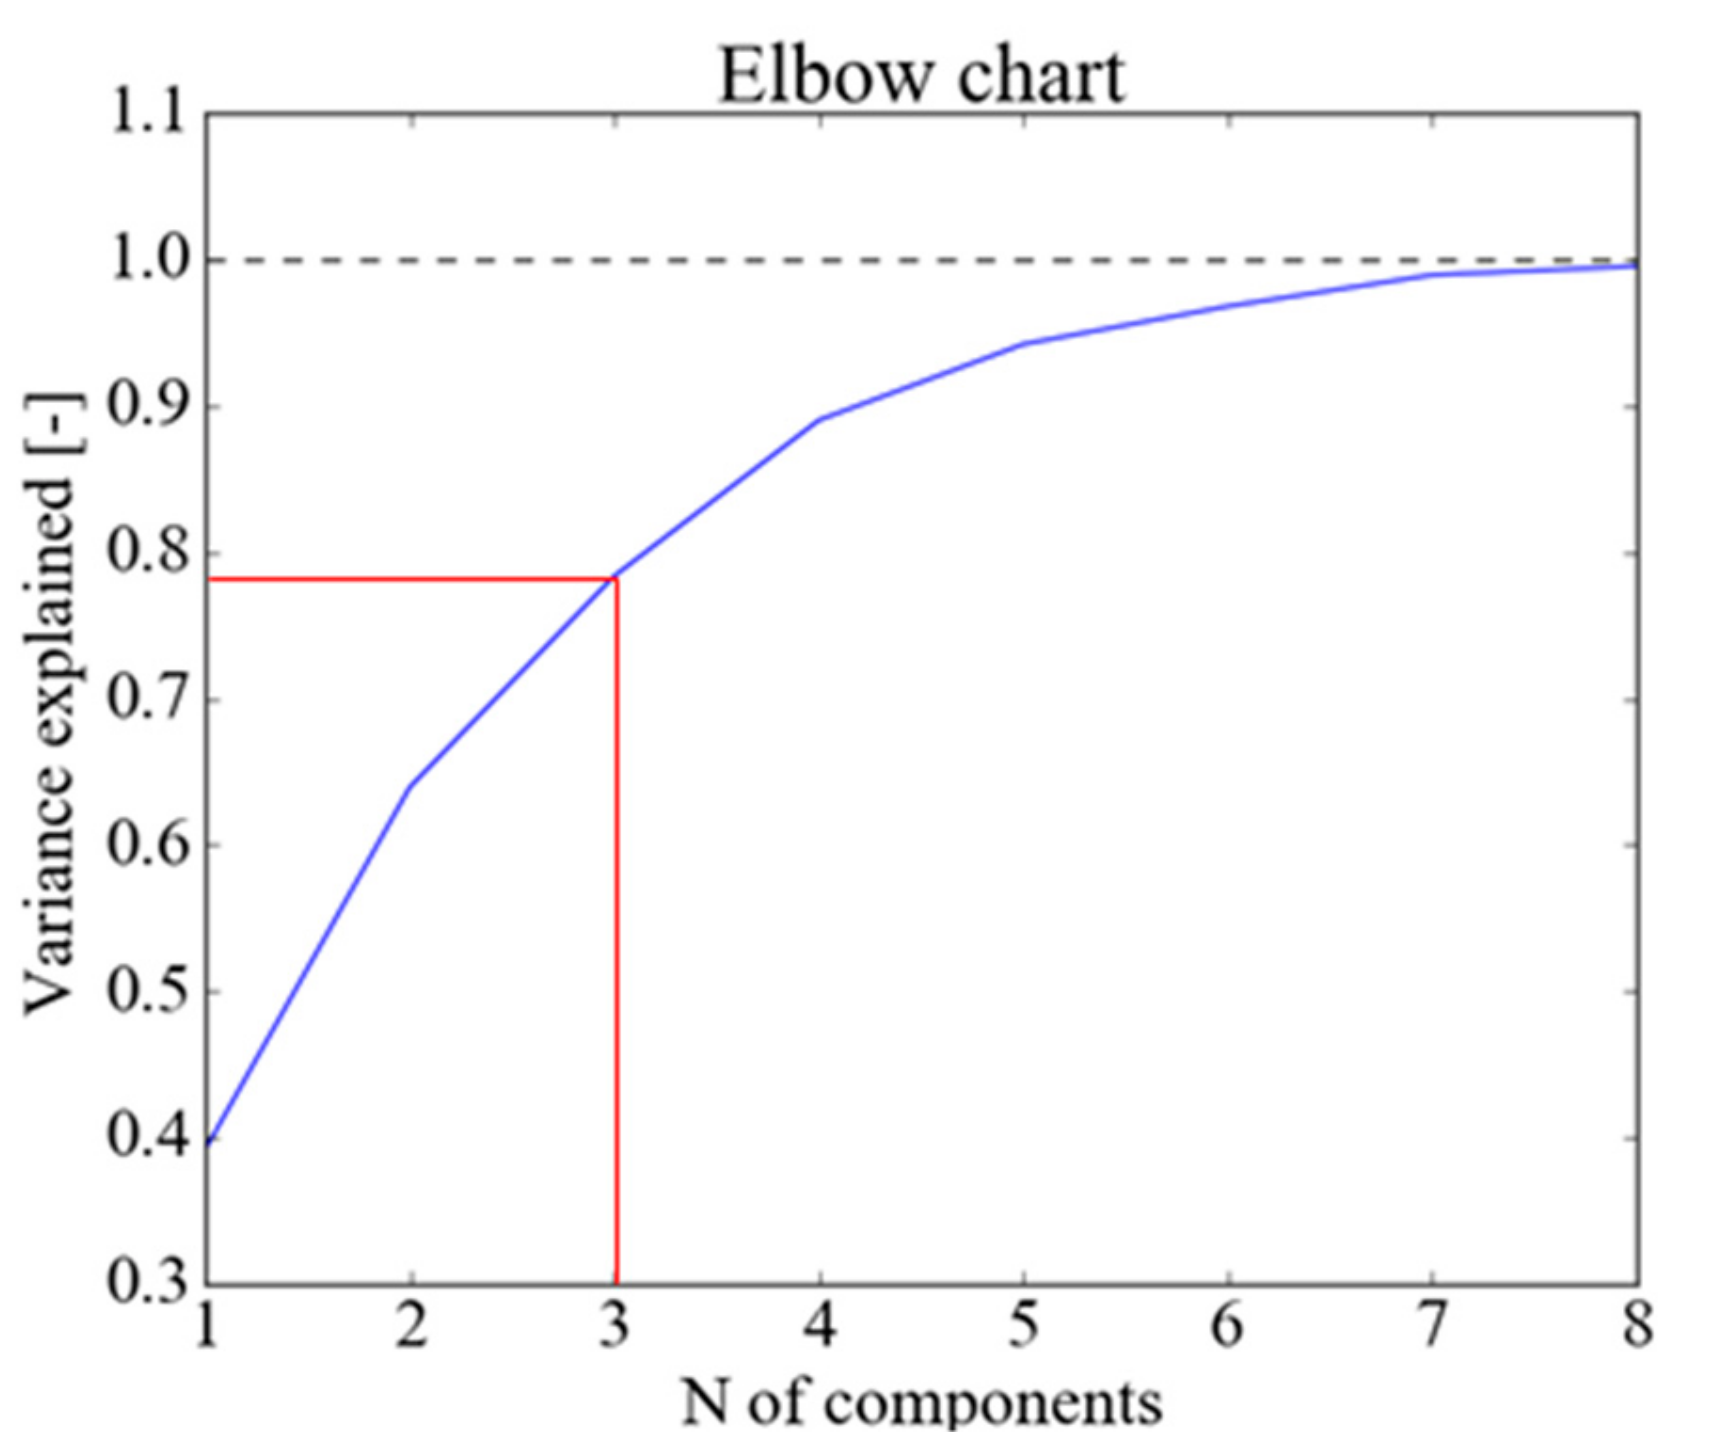
2.1. Principal Component Analysis
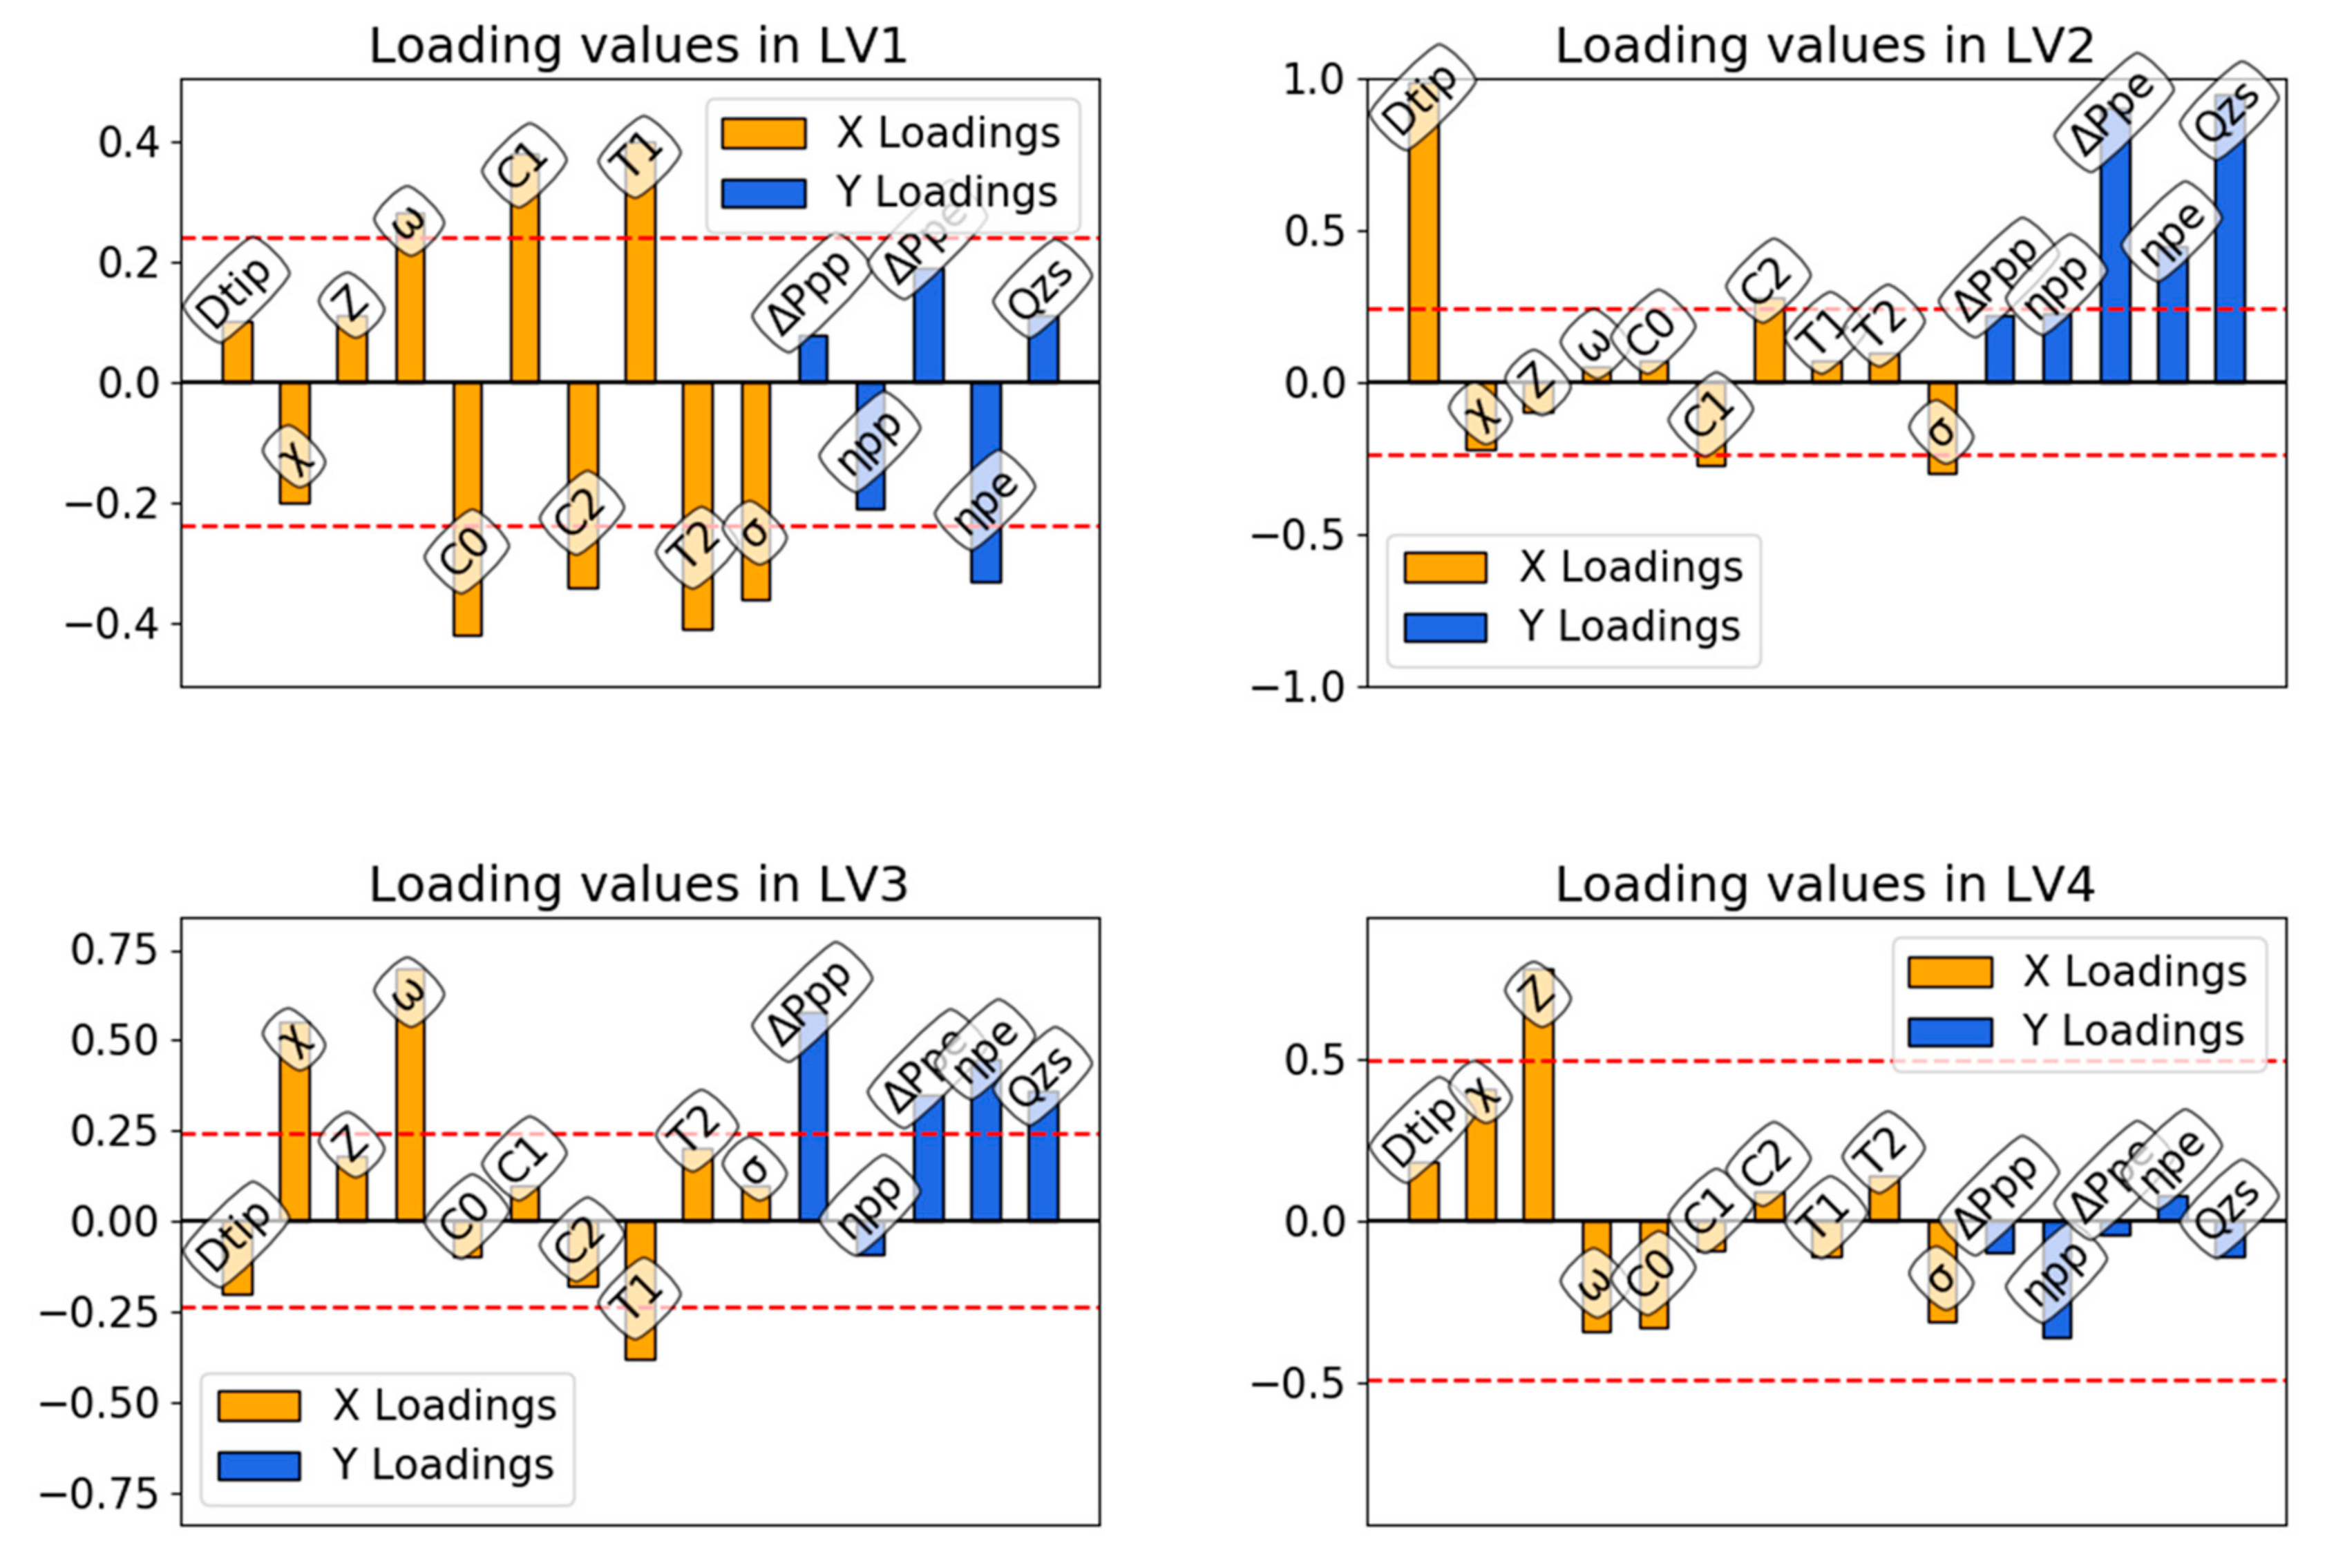
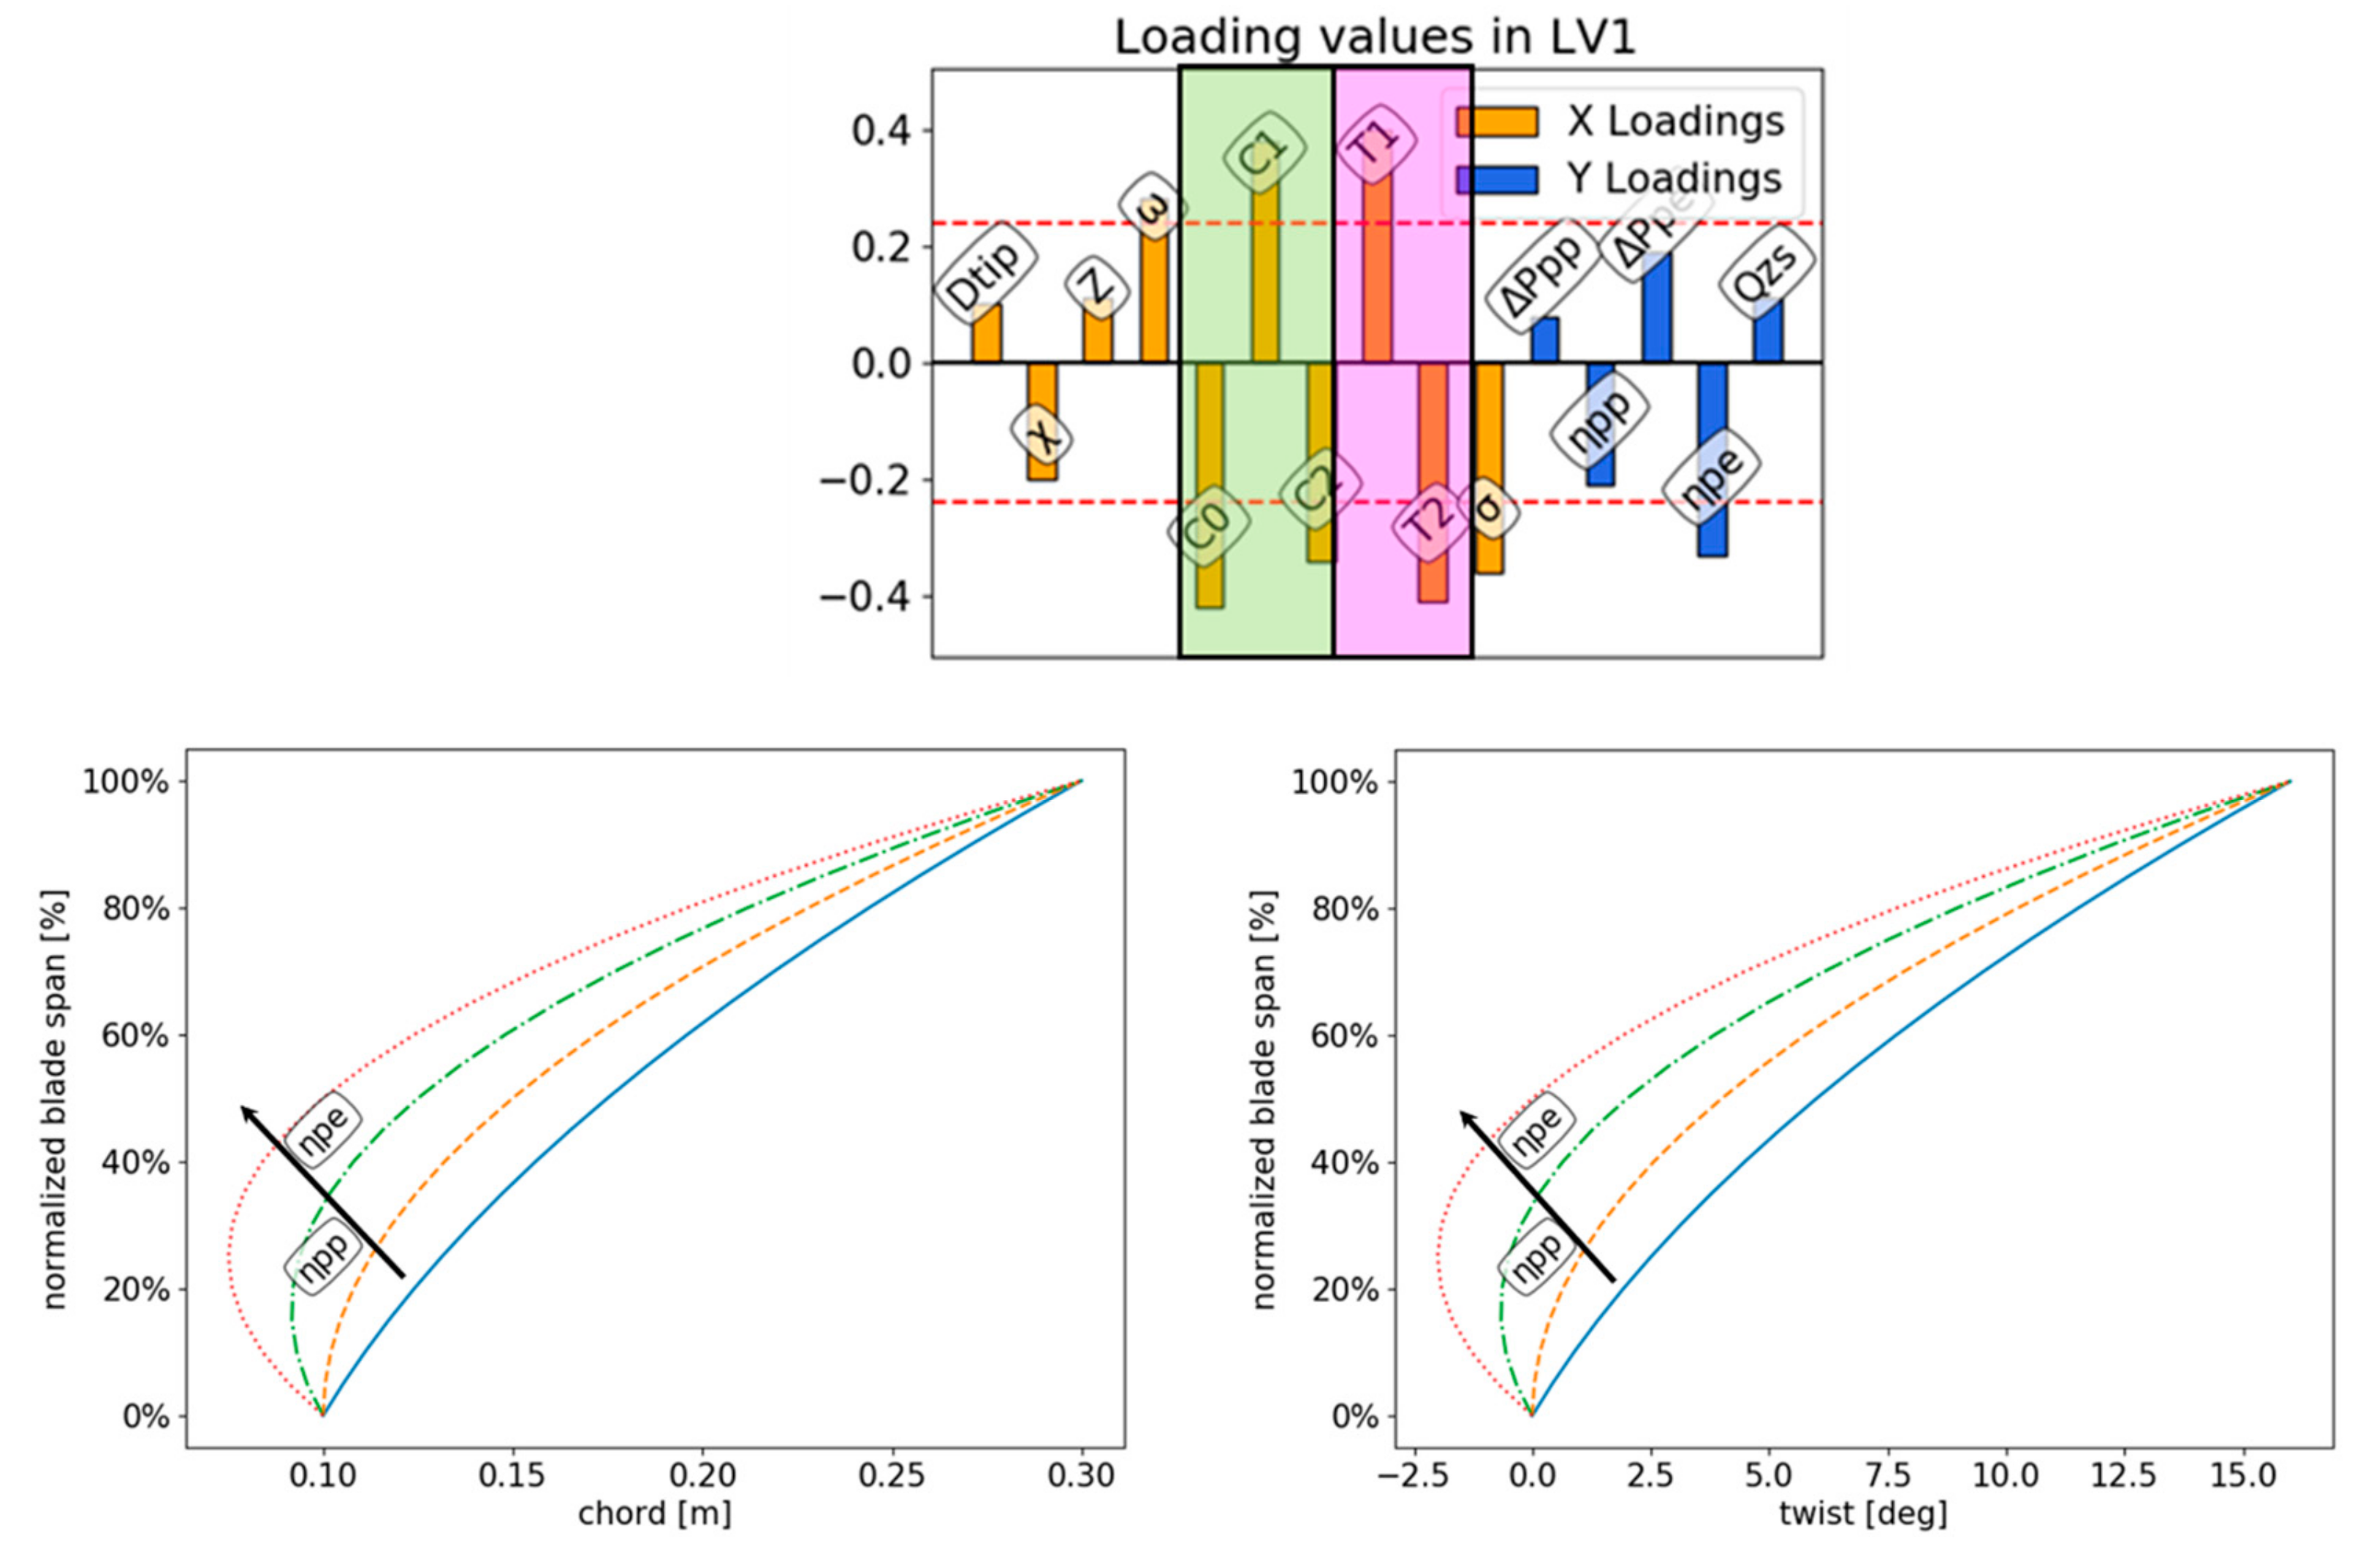
2.2. Projection to Latent Structure
3. Dataset
4. Results
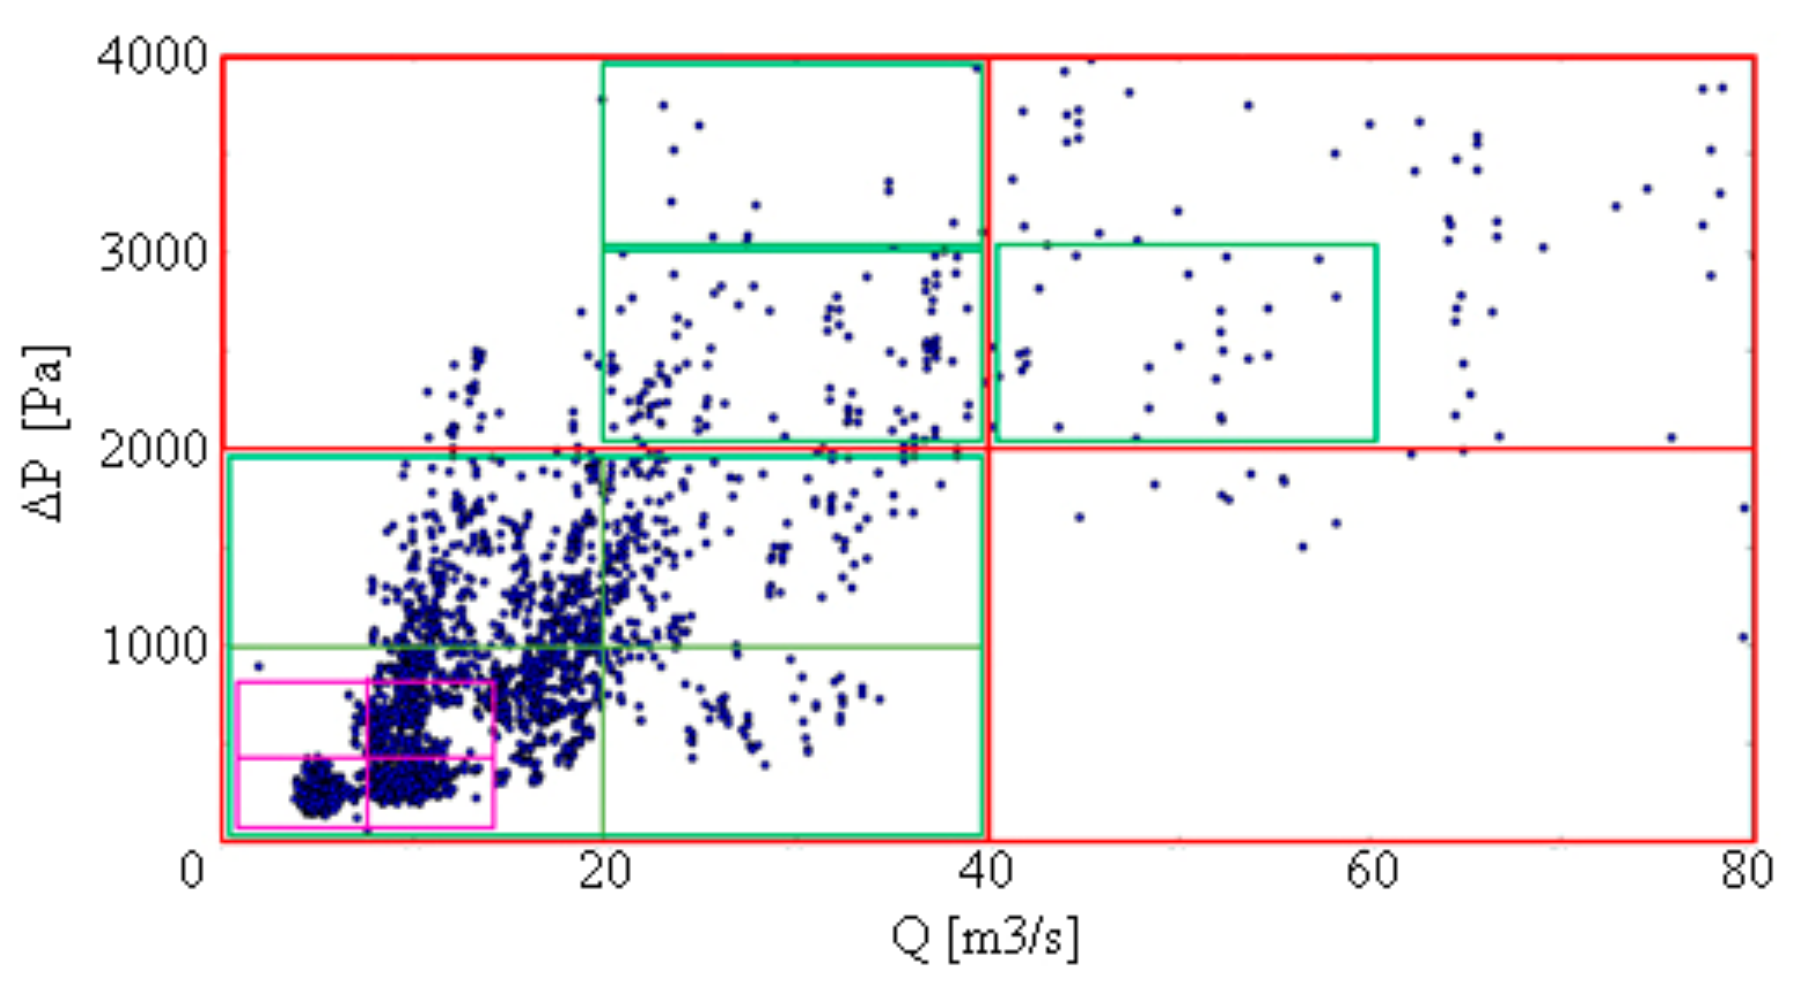
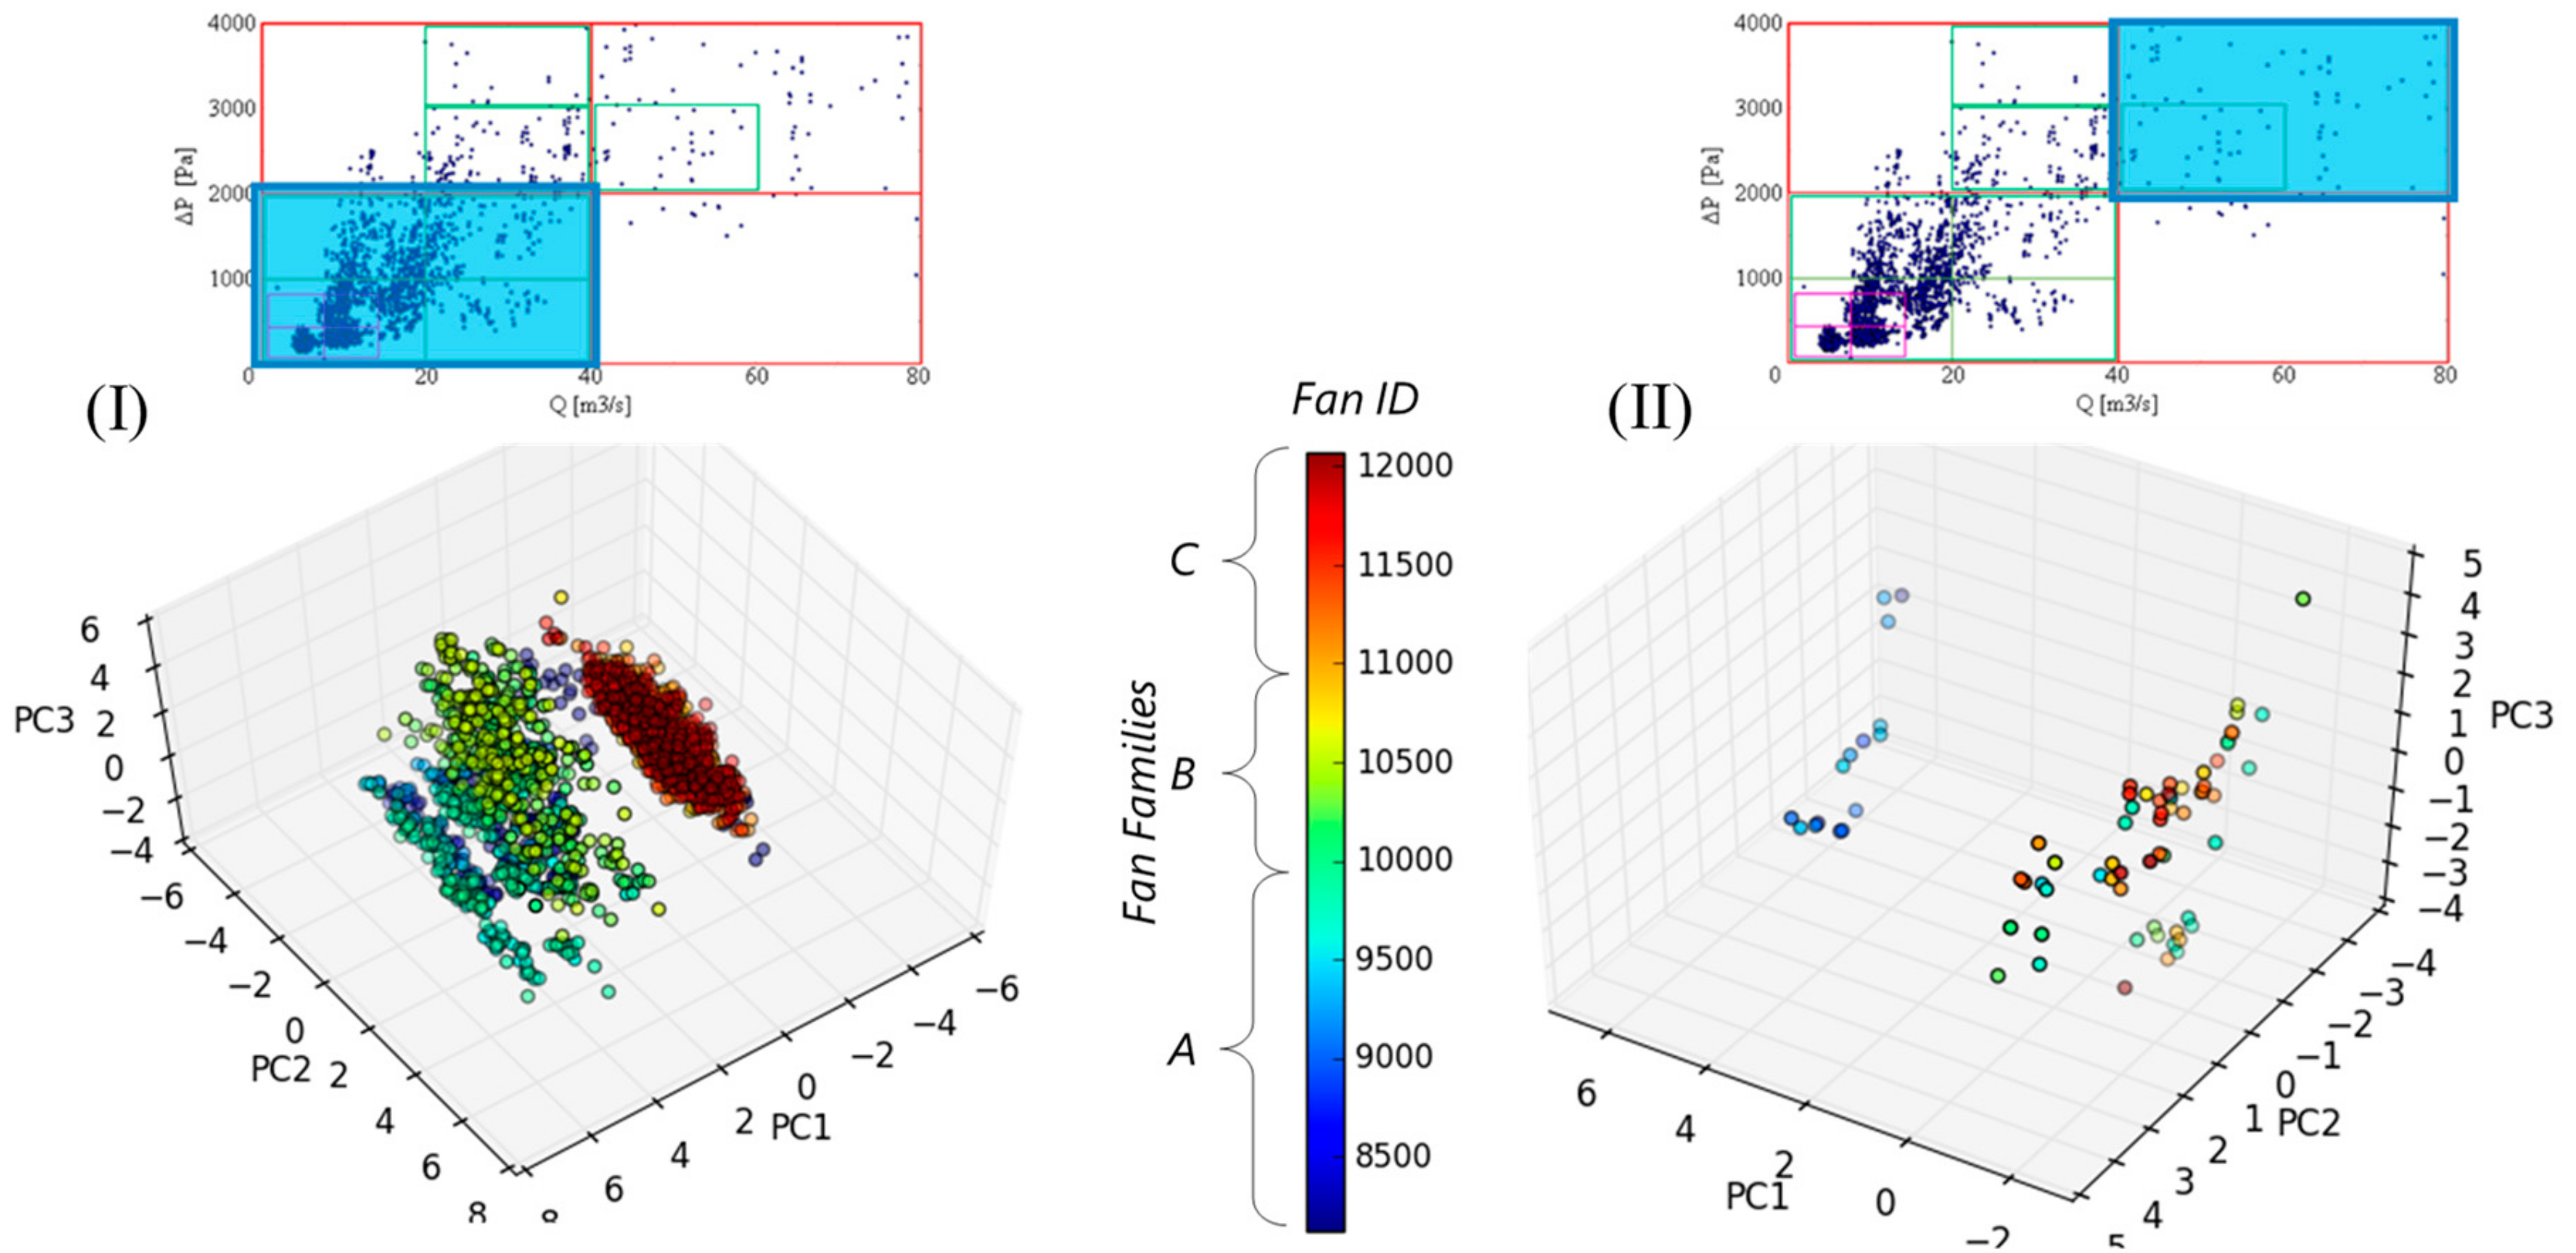
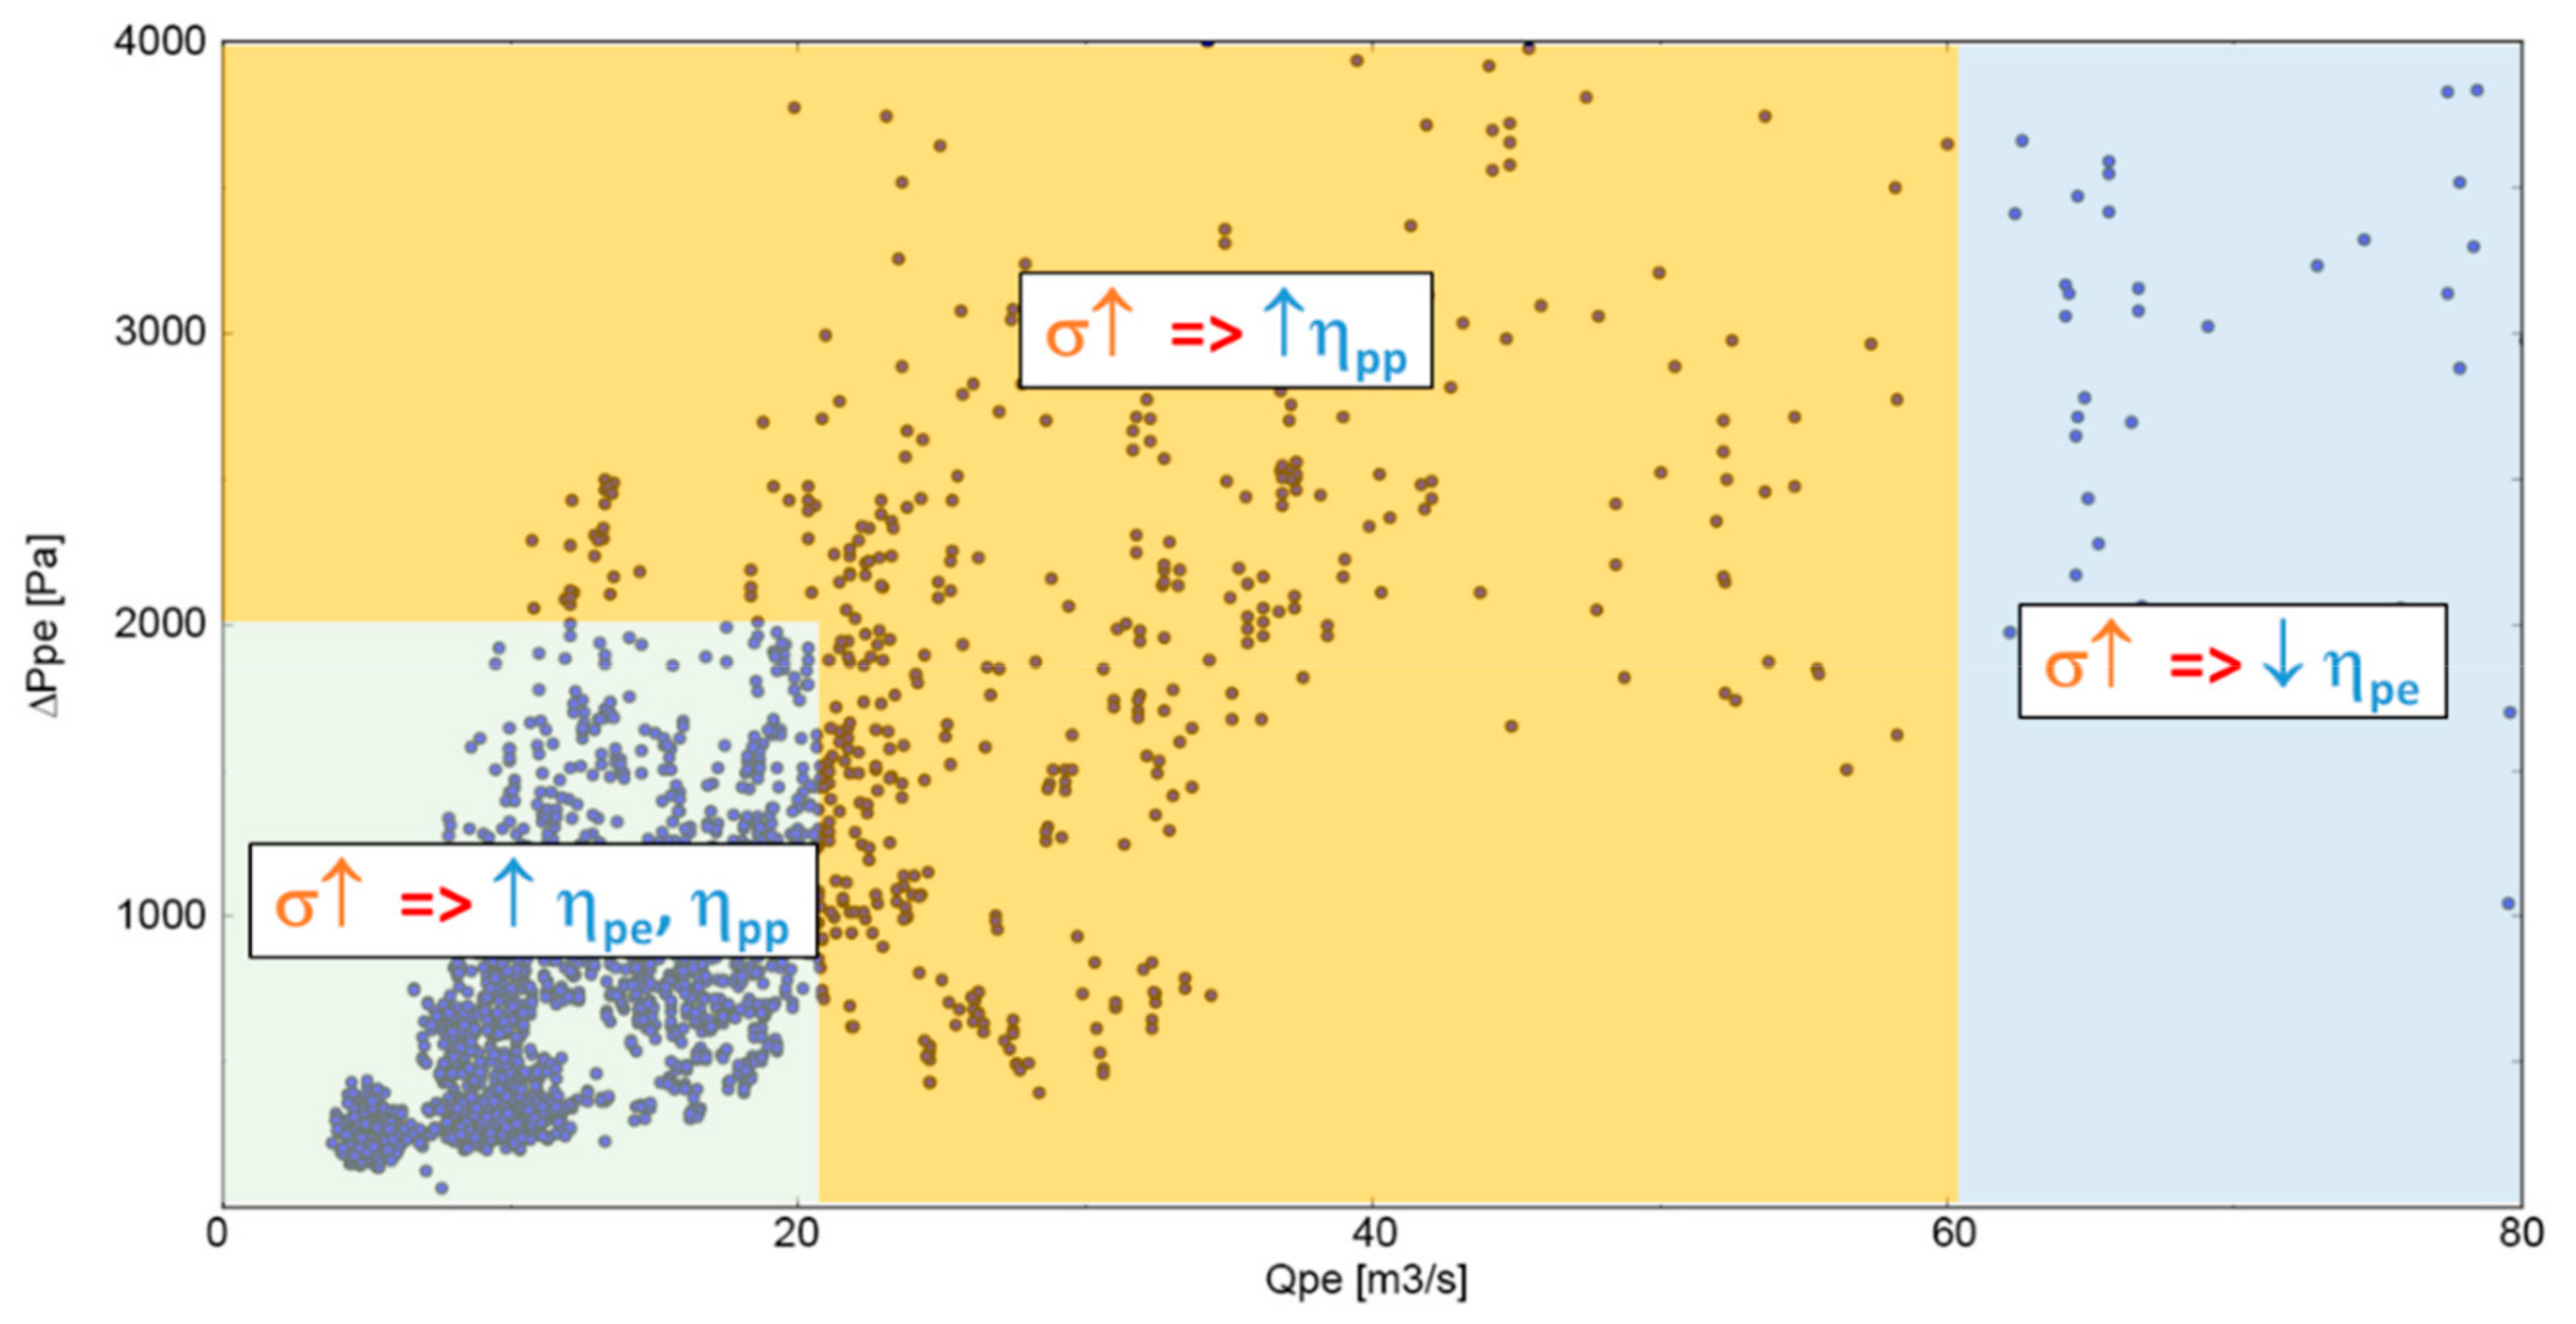
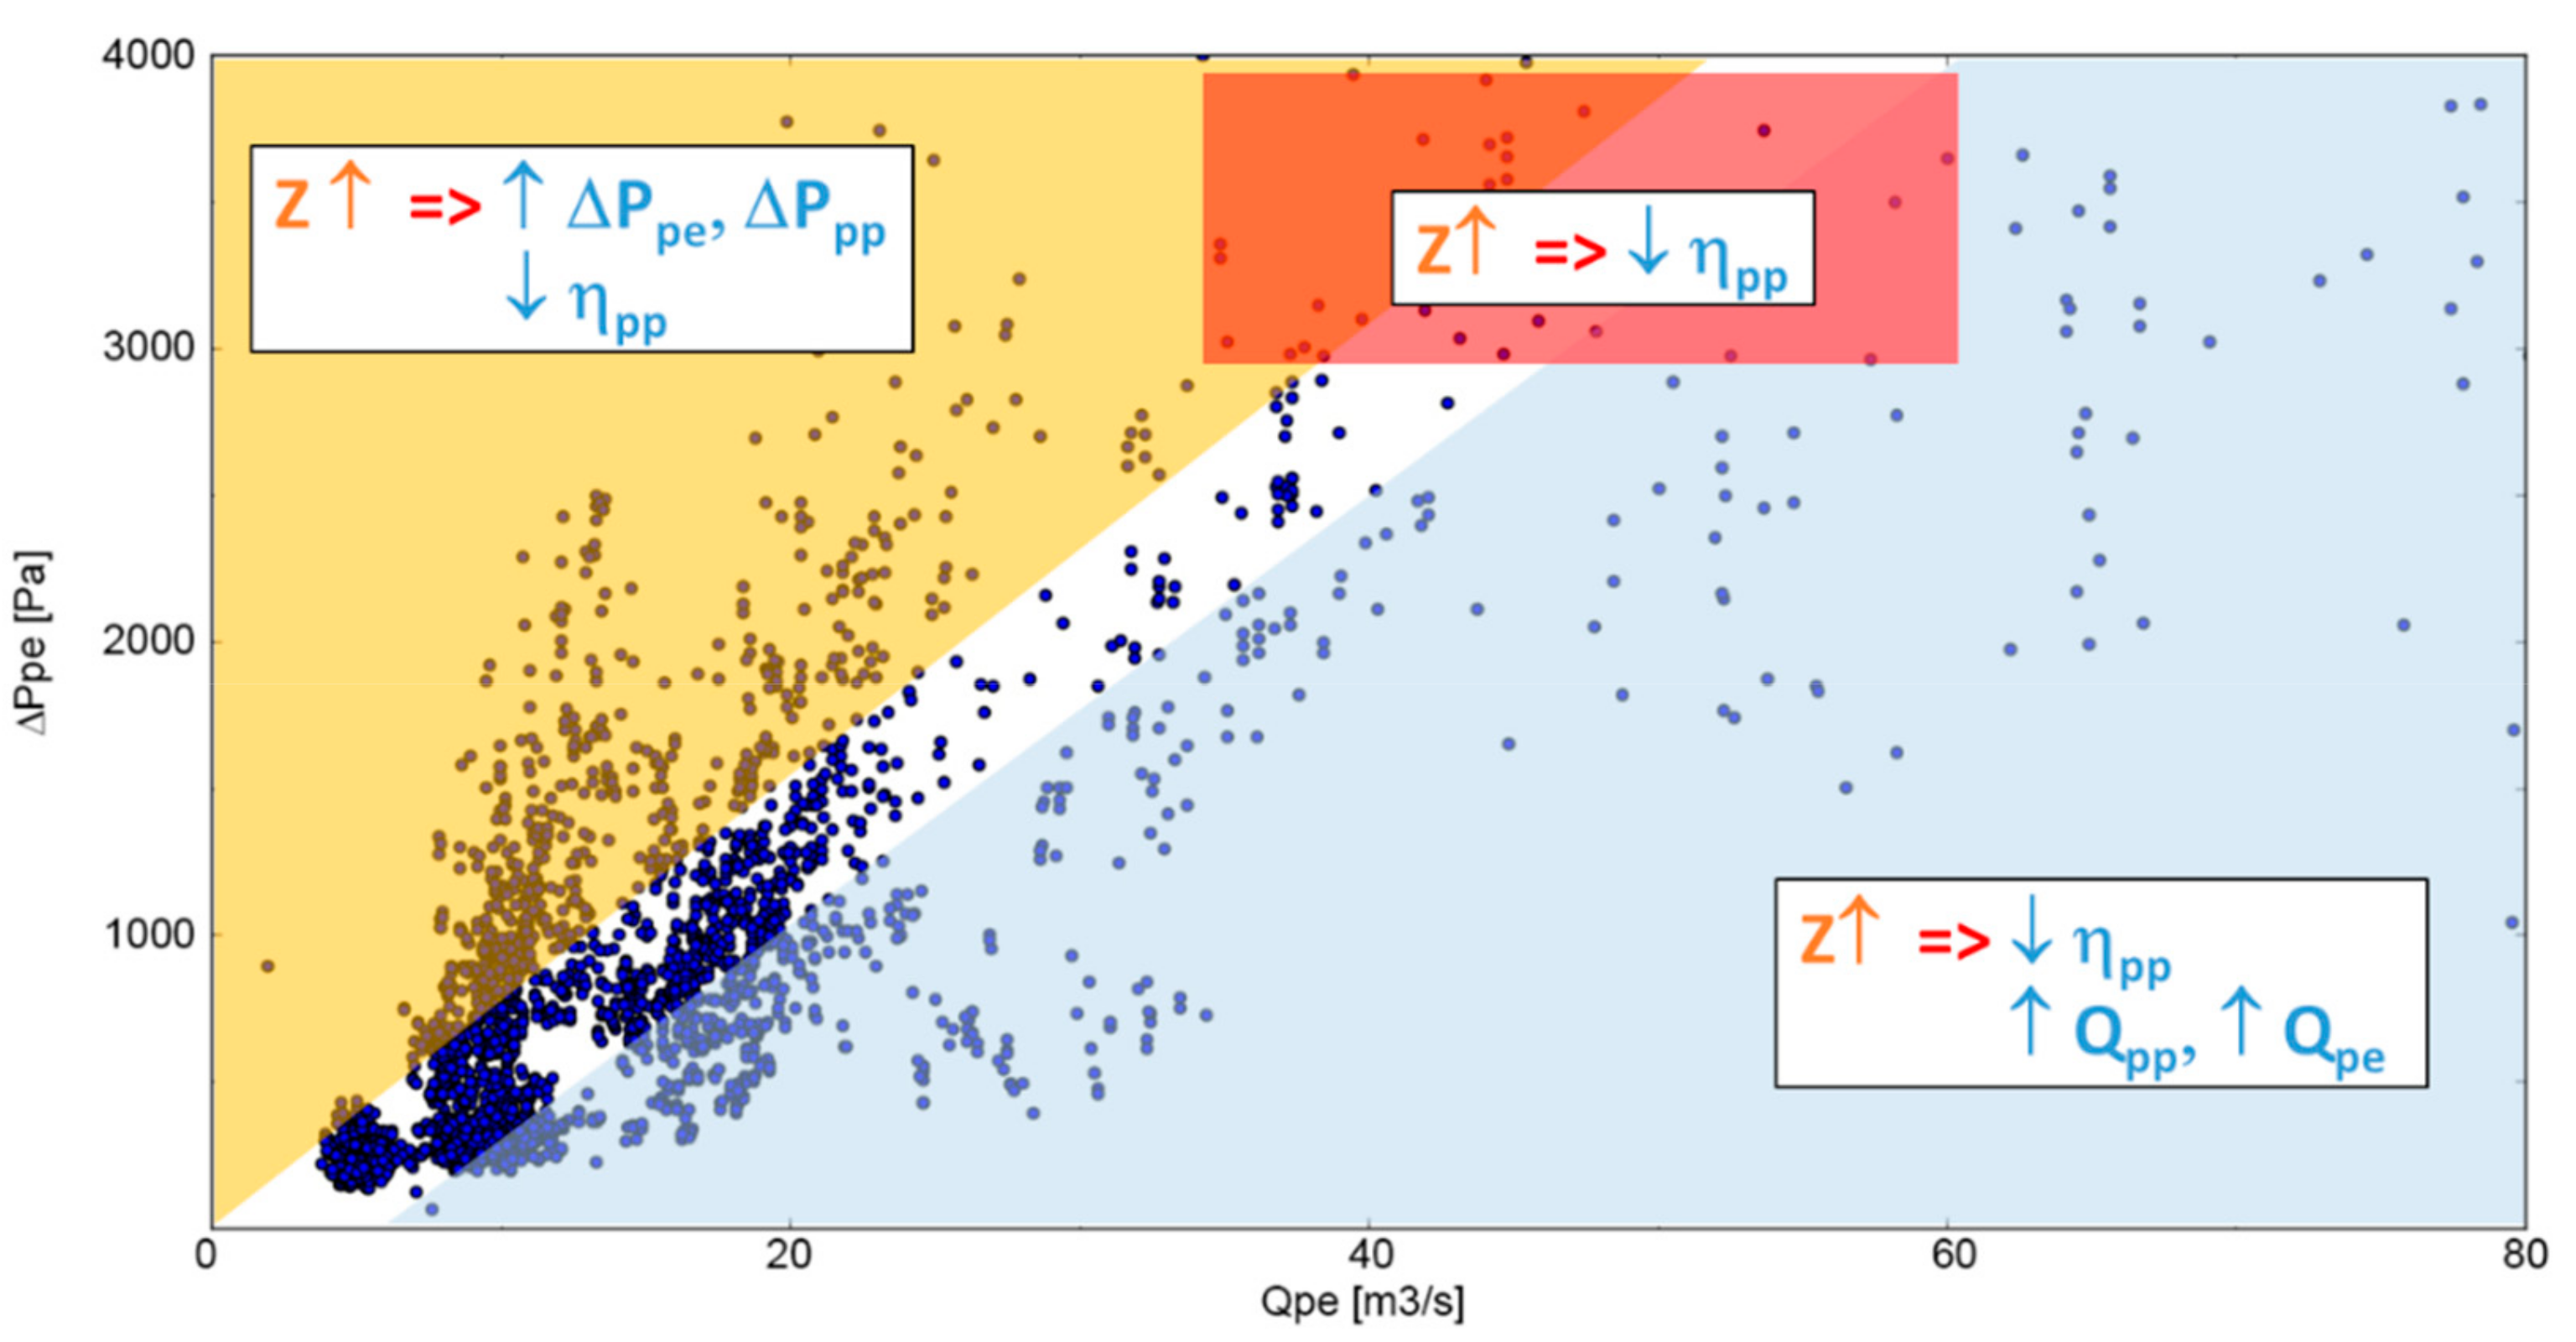
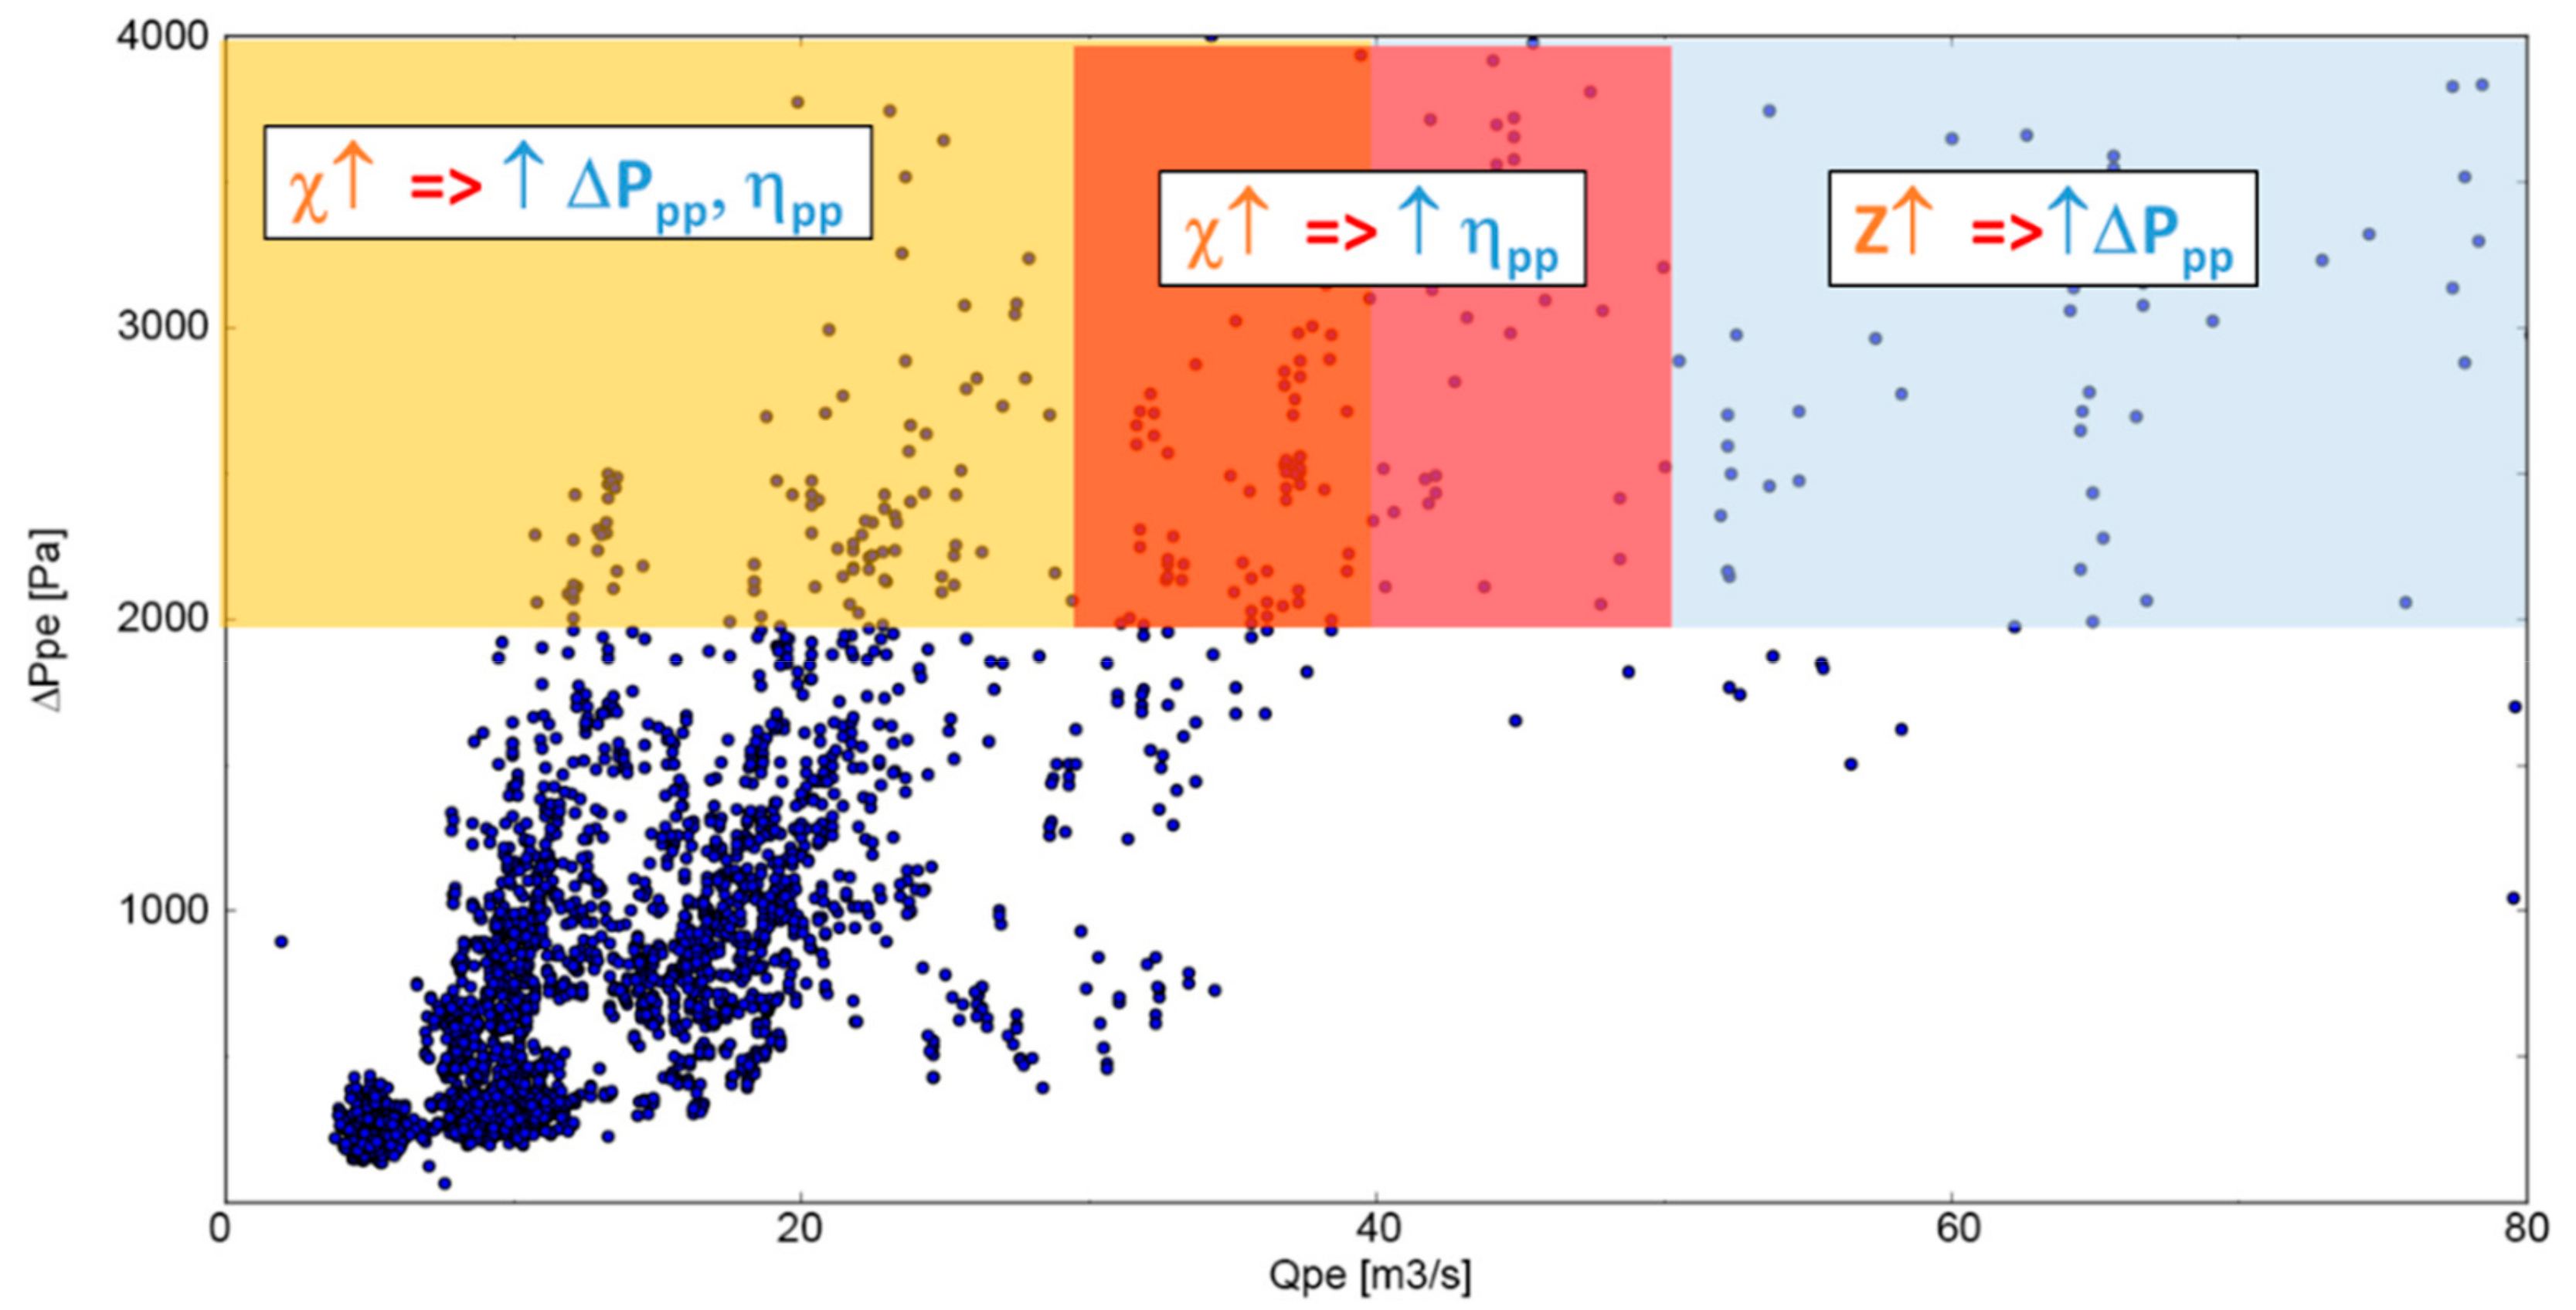
4.1. Q−ΔP Analysis
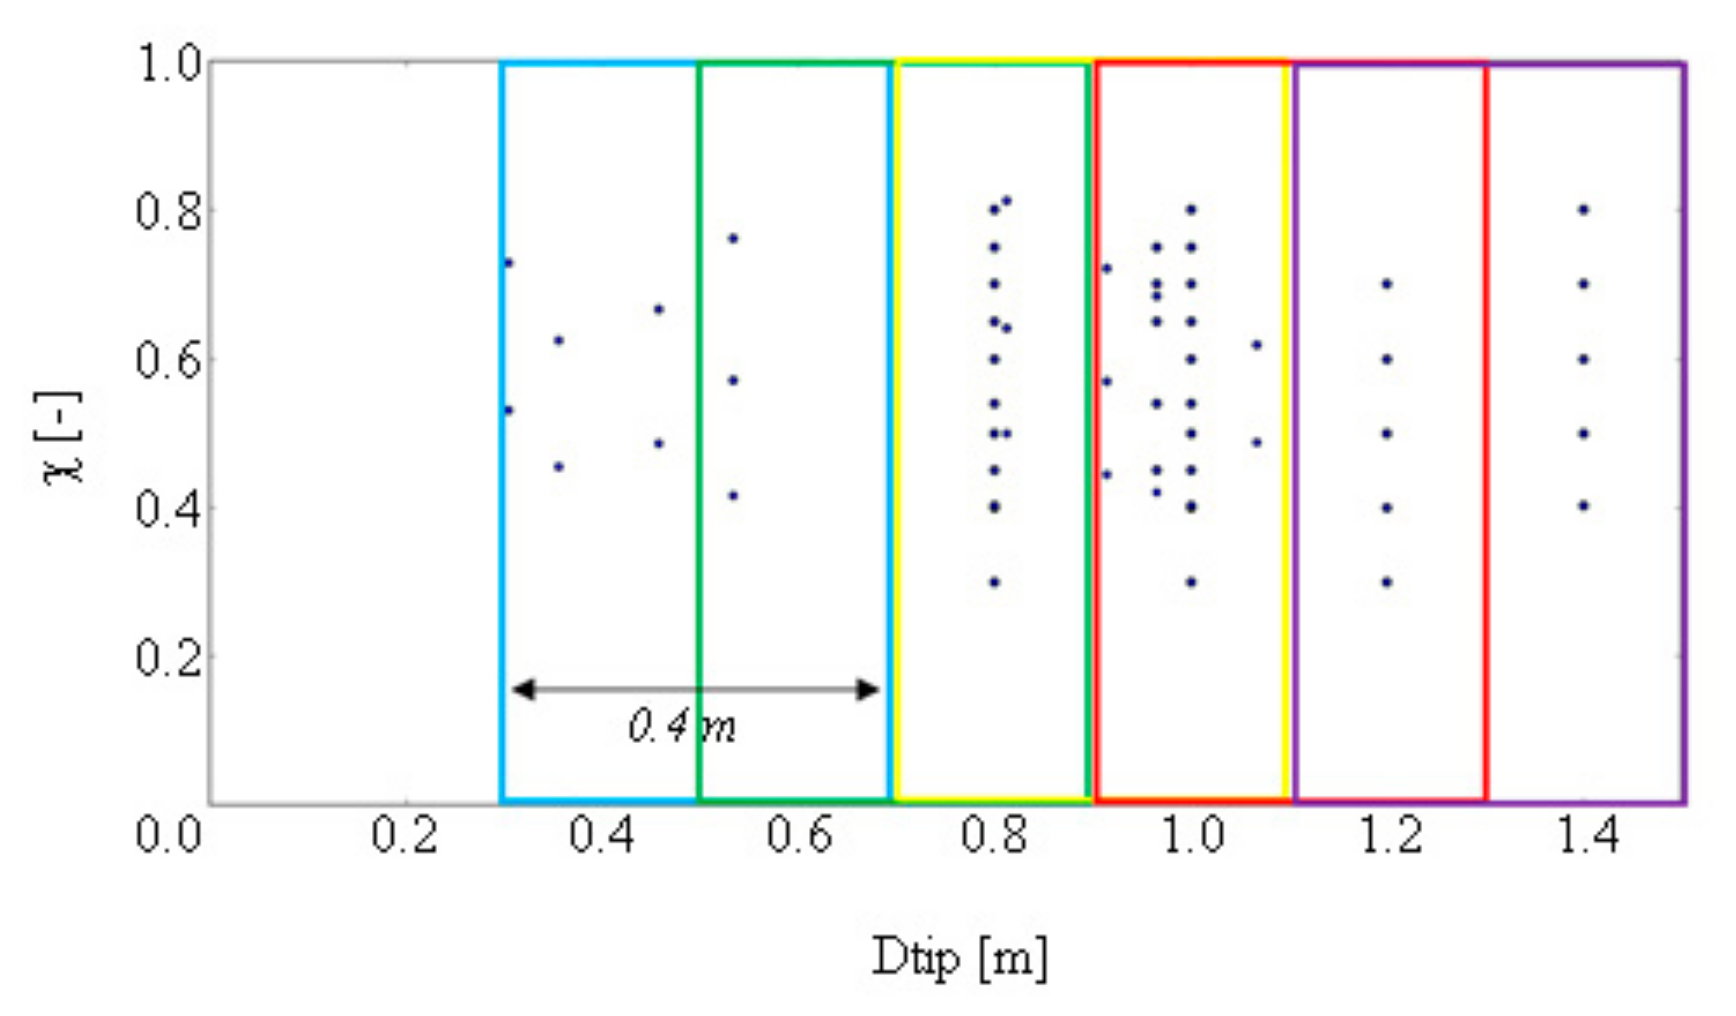
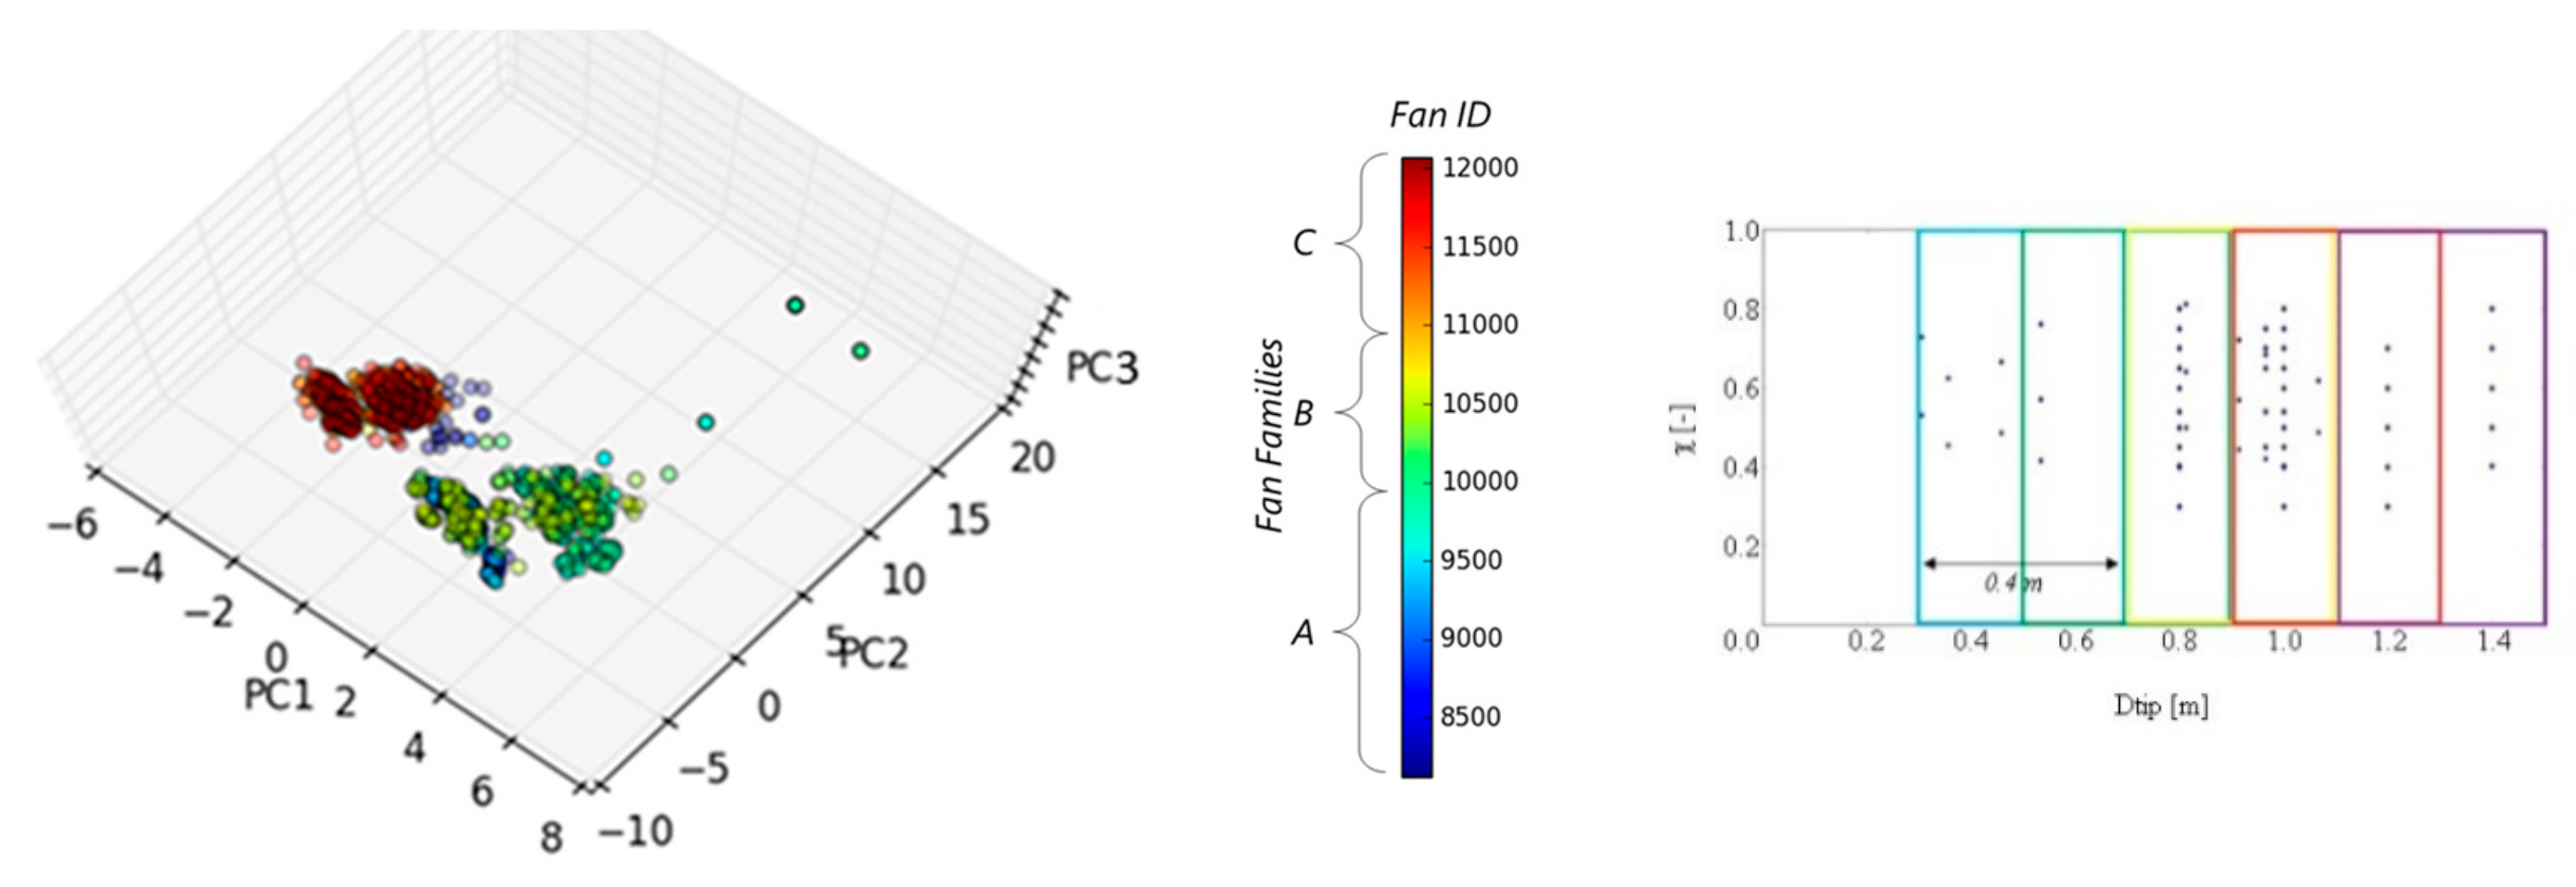
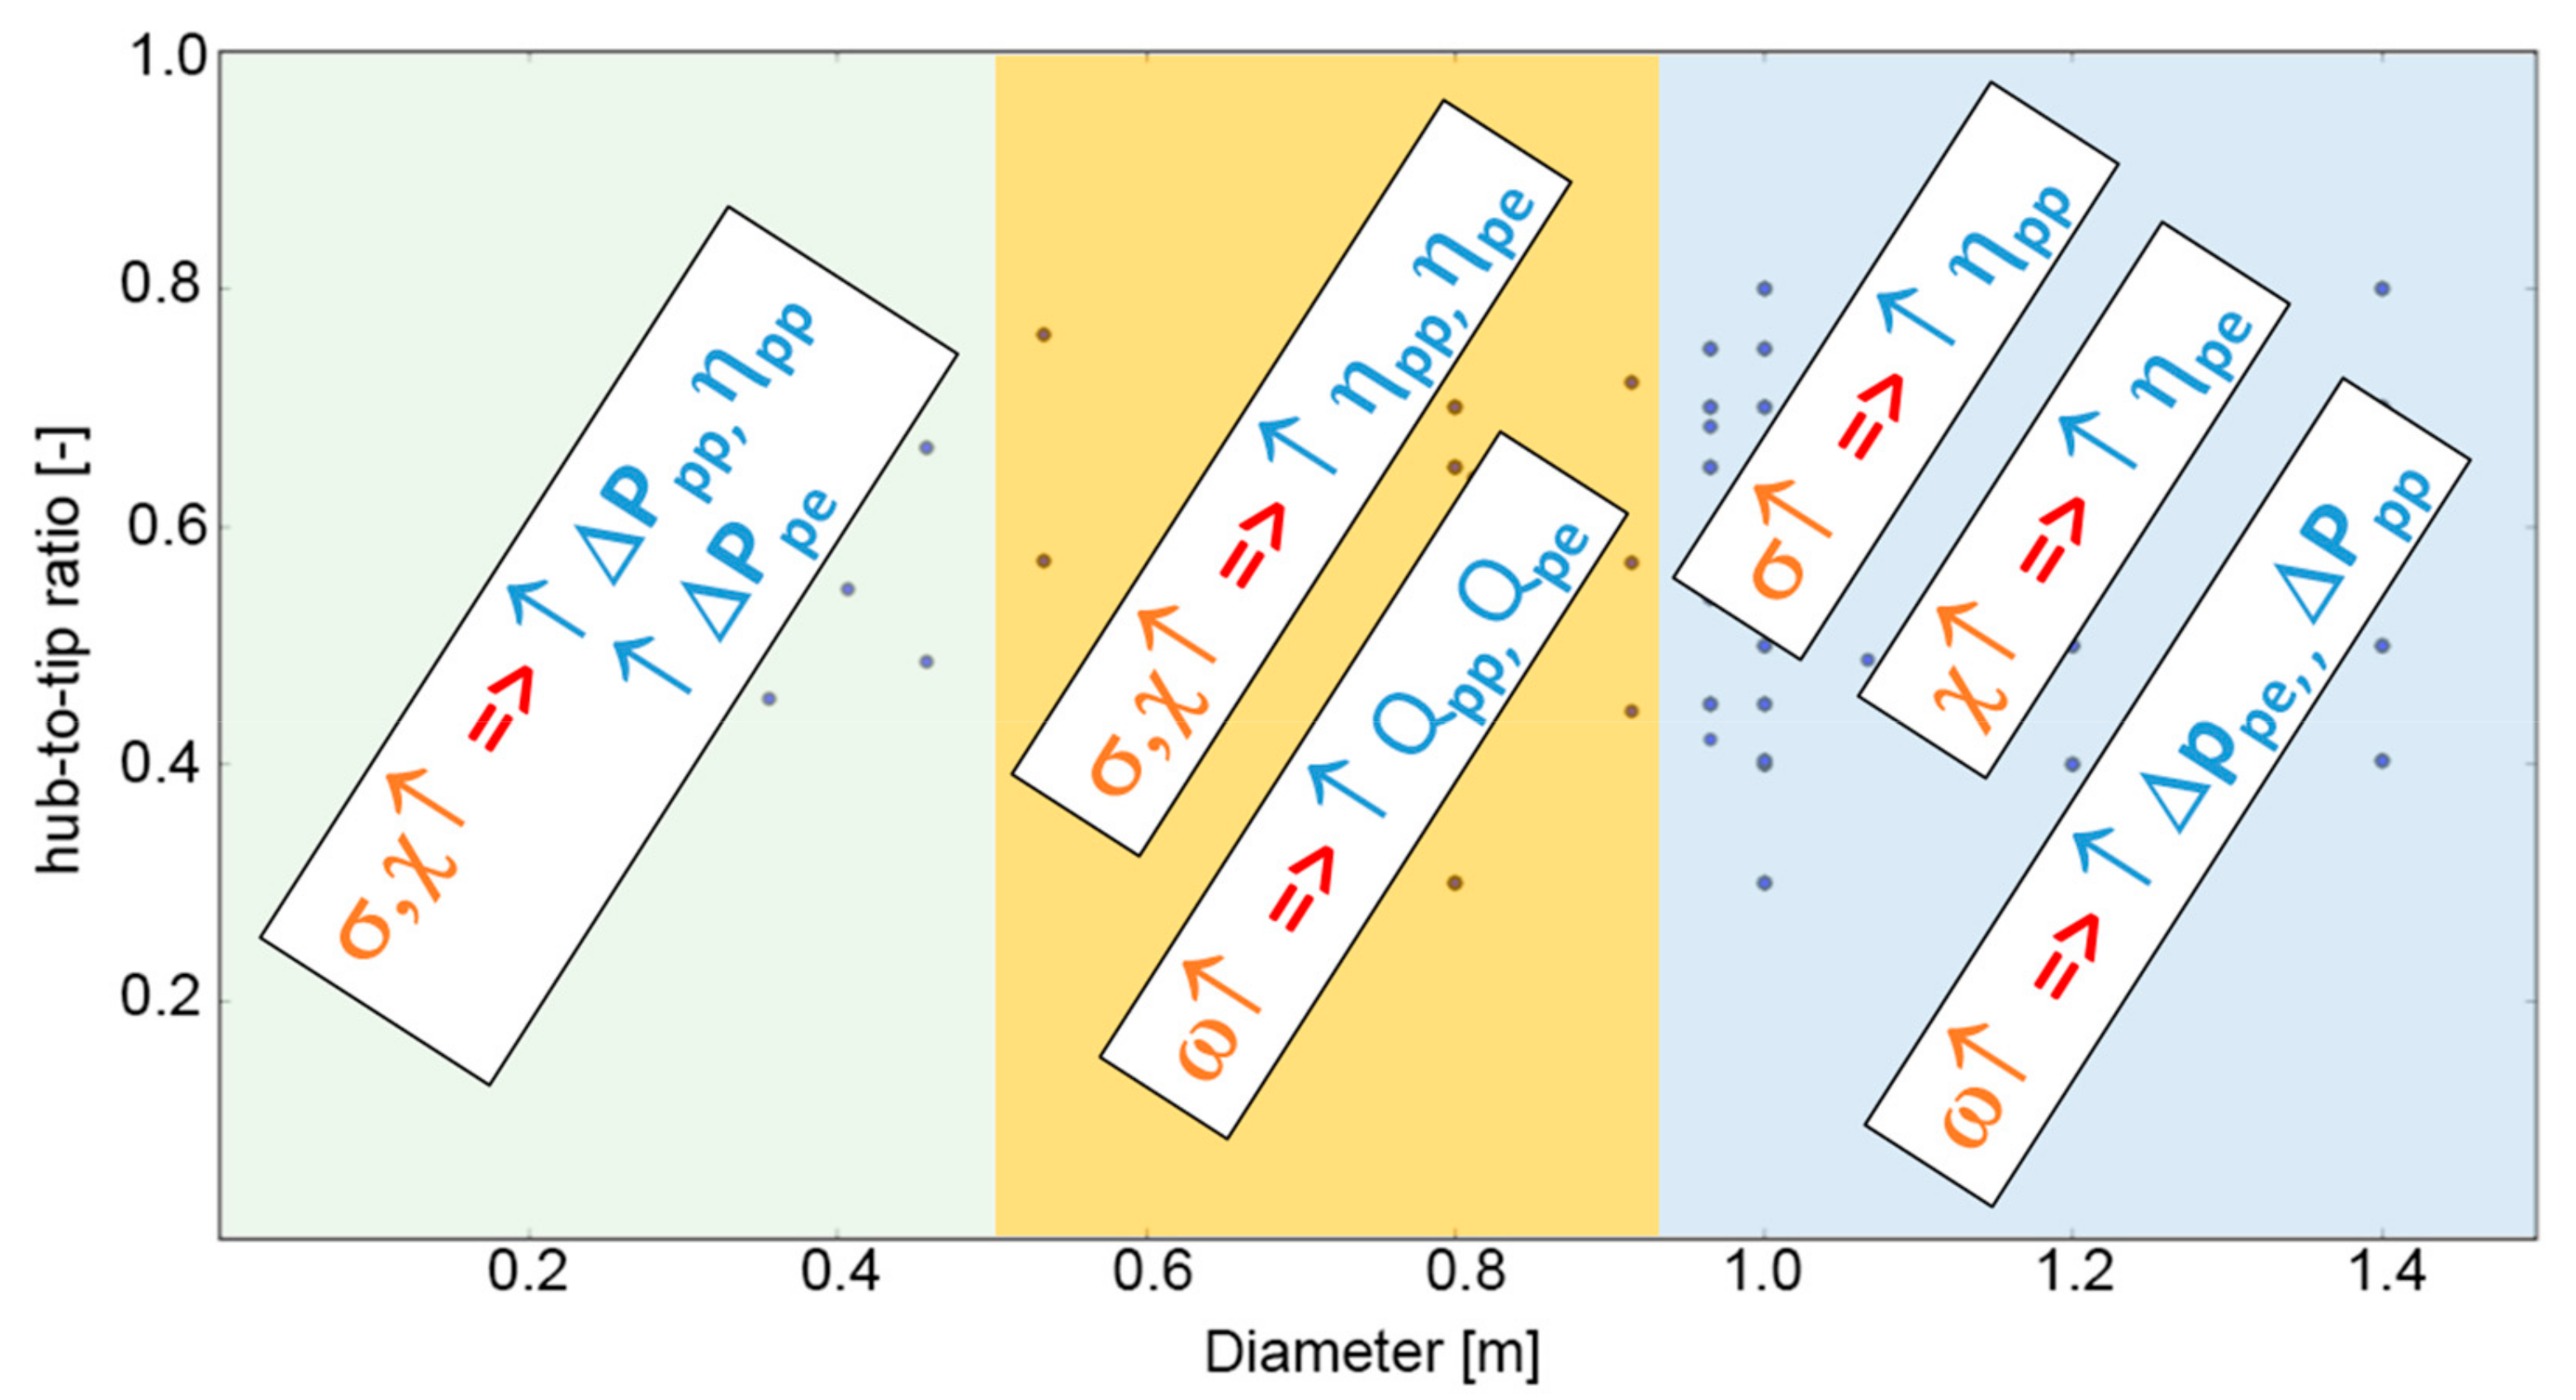
4.2. Dtip−χ Analysis
5. Conclusions
Author Contributions
Funding
Acknowledgments
Conflicts of Interest
References
- Cordier, O. Ahnlichkeitsbedingungen fur Stromungsmaschinen. BWK 1953, 5, 337–340. [Google Scholar]
- Wallis, R.A. Axial Flow Fans; George Newnes Ltd.: London, UK, 1961. [Google Scholar]
- Smith, S.F. A Simple Correlation of Turbine Efficiency. Aeronaut. J. 1965, 69, 467–470. [Google Scholar] [CrossRef]
- Balje, O.E. Turbomachines; John Wiley: New York, NY, USA, 1981. [Google Scholar]
- Howell, A.R. The Present Basis of Axial Flow Compressor Design; British Aeronautical Research Council: London, UK, 1942. [Google Scholar]
- Lieblein, S.; Schwenk, F.C.; Broderick, R.L. Diffusion Factor for Estimating Losses and Limiting Blade Loadings in Axial-Flow-Compressor Blade Elements; National Advisory Committee for Aeronautics: Washington, DC, USA, 1953.
- Bonanni, T.; Corsini, A.; Delibra, G.; Volponi, D.; Sheard, A.G. Derivative Design of Axial Fan Range: From Academia to Industry. In Proceedings of the ASME Turbo Expo 2016: Turbomachinery Technical Conference and Exposition, Seoul, Korea, 13–17 June 2016. [Google Scholar] [CrossRef]
- Bonanni, T.; Corsini, A.; Delibra, G.; Volponi, D. Design of a Single Stage Variable Pitch Axial Fan. In Proceedings of the ASME Turbo Expo, Charlotte, NC, USA, 26–30 June 2017. [Google Scholar]
- Rosipal, R.; Krämer, N. Overview and recent advances in partial least squares. In International Statistical and Optimization Perspectives Workshop “Subspace, Latent Structure and Feature Selection”; Springer: Berlin/Heidelberg, Germany, 2005; pp. 34–51. [Google Scholar]
- Erevelles, S.; Fukawa, N.; Swayne, L. Big Data consumer analytics and the transformation of marketing. J. Bus. Res. 2016, 69, 897–904. [Google Scholar] [CrossRef]
- Labrinidis, A.; Jagadish, H.V. Challenges and opportunities with big data. Proc. VLDB Endow. 2012, 5, 2032–2033. [Google Scholar] [CrossRef]
- Fan, J.; Han, F.; Liu, H. Challenges of big data analysis. Natl. Sci. Rev. 2014, 1, 293–314. [Google Scholar] [CrossRef] [PubMed]
- Lohr, S. The age of big data. New York Times, 11 February 2012. [Google Scholar]
- Kagaya, H.; Aizawa, K. Highly accurate food/non-food image classification based on a deep convolutional neural network. In Proceedings of the International Conference on Image Analysis and Processing, Genoa, Italy, 7–8 September 2015. [Google Scholar]
- Tam, K.Y.; Kiang, M. Predicting bank failures: A neural network approach. Appl. Artif. Intell. 1990, 4, 265–282. [Google Scholar] [CrossRef]
- Ahn, C.P.; Alexandroff, R.; Allende Prieto, C.; Anders, F.; Anderson, S.F.; Anderton, T.; Andrews, B.H.; Aubourg, E.; Bailey, S.; Bastien, F.A.; et al. The Tenth Data Release of the Sloan Digital Sky Survey: First Spectroscopic Data from the SDSS-III Apache Point Observatory Galactic Evolution Experiment. ApJS 2014, 211, 17. [Google Scholar] [CrossRef]
- Lintott, C.; Schawinski, K.; Bamford, S.; Slosar, A.; Land, K.; Thomas, D.; Edmondson, E.; Masters, K.; Nichol, R.C.; Raddick, M.J.; et al. Galaxy Zoo 1: Data release of morphological classifications for nearly 900 000 galaxies. Mon. Not. R. Astron. Soc. 2011, 410, 166–178. [Google Scholar] [CrossRef]
- Jagadish, H.V. Big data and science: Myths and reality. Big Data Res. 2015, 2, 49–52. [Google Scholar] [CrossRef]
- Mackiewicz, A.; Ratajczak, W. Principal components analysis (PCA). Comput. Geosci. 1993, 19, 303–342. [Google Scholar] [CrossRef]
- Abdi, H.; Williams, L.J. Principal Component Analysis; Wiley: Hoboken, NJ, USA, 2010; pp. 433–459. [Google Scholar]
- Svante, W.; Esbensen, K.; Geladi, P. Principal component analysis. In Chemometrics and Intelligent Laboratory Systems; Elsevier: Amsterdam, The Netherlands, 1987; Volume 2, pp. 37–52. [Google Scholar]
- Abdi, H. Partial Least Squares Regression and Projection on Latent Structure Regression (PLS Regression). In Wiley Interdisciplinary Reviews: Computational Statistics; Wiley: Hoboken, NJ, USA, 2010; Volume 2, pp. 97–106. [Google Scholar]
- Svante, W.; Sjöström, M.; Eriksonn, L. Partial least squares projections to latent structures (PLS) in chemistry. In Encyclopedia of Computational Chemistry; Von Ragué Schleyer, P., Allinger, N.L., Clark, T., Gasteiger, J., Kollman, P.A., Schreiner, P.R., Eds.; Wiley: Hoboken, NJ, USA, 2002. [CrossRef]


| Features | PCA | PLS | ||
|---|---|---|---|---|
| Fan tip diameter | features | input features | ||
| χ | hub-to-tip ratio | |||
| σ | midspan solidity | |||
| Z | blade number | |||
| ω | rotational speed | |||
| C0, C1, C2 | chord distribution | c(r) = C0 + C1∙r + C2∙r2 | ||
| T1, T2 | twist distribution | twist (r) = T1∙r + T2∙r2 | ||
| Subscripts | output features | |||
| Q | volume flow rate | pp: at peak pressure | ||
| ΔP | total pressure rise | pe: at peak efficiency | ||
| η | total efficiency | zs: at zero static pressure rise | ||
| FAN A | FAN B | FAN C | |
|---|---|---|---|
| Dtip | 1 m | 1 m | 1 m |
| χ | 0.4 | 0.5 | 0.54 |
| Z | 10 | 16 | 12 |
| Ω | 3000 rpm | 3000 rpm | 1800 rpm |
| QDES | 18.63 m3/s | 13.34 m3/s | 9.12 m3/s |
| ΔPDES | 2240 Pa | 500 Pa | 1210 Pa |
| FAMILY A | Level 0 | Level 1 | Level 2 | Level 3 | Level 4 |
| Dtip [m] | 0.3 | 1.00 | 1.2 | 1.6 | 1.7 |
| χ [−] | 0.3 | 0.4 | 0.5 | 0.6 | 0.7 |
| ω [rpm] | 1500 | 3000 | 3600 | ||
| Z [−] | 8 | 10 | 12 | ||
| C1 | from original value up to +1.6% | ||||
| C2 | from original value up to −1.2% | ||||
| T1 | from original value up to +4 | ||||
| T2 | from original value up to +2 | ||||
| FAMILY B | Level 0 | Level 1 | Level 2 | Level 3 | Level 4 |
| Dtip [m] | 0.4 | 1.00 | 1.4 | 1.6 | |
| χ [−] | 0.4 | 0.5 | 0.6 | 0.7 | 0.8 |
| ω [rpm] | 1500 | 3000 | 3600 | ||
| Z [−] | 12 | 16 | 18 | ||
| C1 | from original value up to +1.6% | ||||
| C2 | from original value up to −1.0% | ||||
| T1 | from original value up to +4 | ||||
| T2 | from original value up to +1 | ||||
| FAMILY C | Level 0 | Level 1 | Level 2 | Level 3 | Level 4 |
| Dtip [m] | 0.4 | 0.96 | 1.6 | ||
| χ [−] | 0.45 | 0.54 | 0.65 | 0.7 | 0.75 |
| ω [rpm] | 1500 | 3000 | 3600 | ||
| Z [−] | 8 | 10 | 12 | ||
| C1 | from original value up to +1.6% | ||||
| C2 | from original value up to −1.2% | ||||
| T1 | from original value up to +8 | ||||
| T2 | from original value up to −4 | ||||
| Latent Variable | Correlation between X and Y Scores |
|---|---|
| 1st | 85% |
| 2nd | 76% |
| 3rd | 54% |
| 4th | 52% |
| Latent Variable | Correlation between X and Y Scores |
|---|---|
| 1st | 79% |
| 2nd | 69% |
| 3rd | 65% |
| 4th | 60% |
| Latent Variable | Correlation between X and Y Scores |
|---|---|
| 1st | 43% |
| 2nd | 51% |
| 3rd | 35% |
| 4th | 8% |
© 2019 by the authors. Licensee MDPI, Basel, Switzerland. This article is an open access article distributed under the terms and conditions of the Creative Commons Attribution (CC BY-NC-ND) license (https://creativecommons.org/licenses/by-nc-nd/4.0/).
Share and Cite
Angelini, G.; Corsini, A.; Delibra, G.; Tieghi, L. Exploration of Axial Fan Design Space with Data-Driven Approach. Int. J. Turbomach. Propuls. Power 2019, 4, 11. https://doi.org/10.3390/ijtpp4020011
Angelini G, Corsini A, Delibra G, Tieghi L. Exploration of Axial Fan Design Space with Data-Driven Approach. International Journal of Turbomachinery, Propulsion and Power. 2019; 4(2):11. https://doi.org/10.3390/ijtpp4020011
Chicago/Turabian StyleAngelini, Gino, Alessandro Corsini, Giovanni Delibra, and Lorenzo Tieghi. 2019. "Exploration of Axial Fan Design Space with Data-Driven Approach" International Journal of Turbomachinery, Propulsion and Power 4, no. 2: 11. https://doi.org/10.3390/ijtpp4020011
APA StyleAngelini, G., Corsini, A., Delibra, G., & Tieghi, L. (2019). Exploration of Axial Fan Design Space with Data-Driven Approach. International Journal of Turbomachinery, Propulsion and Power, 4(2), 11. https://doi.org/10.3390/ijtpp4020011