Article

Characterization of the Unsteady Aerodynamics of Optimized Turbine Blade Tips through Modal Decomposition Analysis †

Von Karman Institute for Fluid Dynamics, 1640 Sint-Genesius-Rode, Belgium
*
Author to whom correspondence should be addressed.
Proceedings of the 13th European Conference on Turbomachinery Fluid Dynamics and Thermodynamics, Lausanne, Switzerland, 8–12 April 2019; Paper No. 184.
Int. J. Turbomach. Propuls. Power 2019, 4(2), 12; https://doi.org/10.3390/ijtpp4020012
Submission received: 24 April 2019 / Revised: 9 May 2019 / Accepted: 17 May 2019 / Published: 27 May 2019

Abstract

:
The present research focused on the analysis of the leakage flows developing from advanced blade tip geometries. The aerodynamic field of a contoured blade tip and of a high-performance rimmed blade were investigated against a baseline squealer rotor. Time-resolved numerical predictions were combined with high-frequency pressure measurements to characterize the tip leakage flow of each tip design. High spatial and temporal resolution measurements provided a detailed representation of the unsteady flow in the near-tip region and at the stage outlet. Numerical computations, based on the nonlinear harmonic method, were employed to assess the unsteady blade row interactions and identify the loss generation mechanisms depending on the tip design. The space- and time-resolved flow field was analysed by modal decomposition to identify the main periodicities of the near-tip and outlet flow and classify the most relevant sources of aerodynamic unsteadiness and entropy generation across the stage.

1. Introduction

In the pursuit of increased engine performance and durability, novel design solutions have been conceived in recent years to shape the high pressure turbine (HPT) rotor tips and gain control over the tip leakage streams. From an engine manufacturer standpoint, an optimal rotor sealing design must minimize the amount of working fluid spilled through the gap [1], while limiting the harmful thermal loads.
While relevant numerical and experimental studies have demonstrated the inherent aerothermal unsteadiness of high-speed leakage streams over flat tip geometries [2,3,4], the gap flow physics induced by alternative tip designs [5,6] is still scarcely documented in the open literature.
Conventional squealer tip profiles present a complete or partial perimetral rim to amplify the vena contracta effect and therefore minimize the total leakage mass flow [7]. Carved tip designs, on the other hand, employ a contoured surface to control the acceleration of the leakage stream in the gap and force it to choking conditions [8]. This allows effectively decoupling the blade tip load from the spillage mass flow, breaking the mutual dependency between the work extraction process and the blade aerodynamic performance [9].
While linear cascade testing represented for many years the main experimental tool to investigate the HPT aerodynamics, the importance of three-dimensional flow mechanisms in low aspect ratio turbines has been widely acknowledged [10,11,12]. To ensure the correct reproduction of engine-relevant blade row interactions [13,14] and rotor-casing relative motion [15], the present experimental campaign was carried out in the short-duration rotating turbine test rig of the von Karman Institute. The one-stage turbine test section, representative of the first stage of a two-stage aeroengine HPT, was operated at engine-scaled conditions and specifically instrumented to allow a high-fidelity, time-resolved characterization of the over-tip aerodynamic field of each single profile.
To maximize the experimental repeatability, a simultaneous testing strategy was adopted for multiple tip geometries, operating the annular cascade in rainbow rotor configuration [16]. Seven different tip designs were investigated, each one hosted in a dedicated sector of the rotor disk and all sharing a common blade profile.
Unsteady CFD computations were performed in support to the experimental study, allowing the identification of the main entropy generation mechanisms and flow interactions. Dedicated data processing routines were employed to analyze the unsteady aerodynamics. A modal decomposition [17] was performed to characterize the flow spatial and temporal periodicities of the over-tip and outlet flow field. This analysis served to study the physical mechanisms behind the blade row interactions and isolate the sources of spatial and temporal variations in the stage aerodynamics and entropy field.

2. Research Methodology

2.1. Experimental Setup

2.1.1. Test Article

The HPT stage under investigation was tested in the short-duration rotating turbine test rig of the von Karman Institute [18], operating on the principle of the compression tube. The transient testing strategy allowed preserving engine-relevant Mach and Reynolds numbers [19] for a time period ranging between 250 and 300 ms.
For this test campaign, the rig was refurbished to host a large scale turbine article, representative of a full high-subsonic uncooled stage with 34 vanes and 48 rotor blades (Figure 1a). The full stage configuration allowed the correct reproduction of relevant time-varying periodicities, blade row interactions and rotation effects.
Multiple optimized blade tip geometries were simultaneously evaluated in the one-stage test section by employing a “rainbow rotor” configuration (Figure 1b). The rotor disk was divided into seven sectors, each presenting 6–7 blades of equal tip geometry to ensure flow periodicity and all sharing the same baseline blade profile. The alternative blade tip designs were obtained from a previous optimization effort [20,21].
The paper presents the aerodynamic performance of two optimized profiles, a squealer-like rimmed geometry (AC06D) and a contoured tip (AC07T), in comparison to a baseline conventional squealer tip (IN01D) (Figure 1c). The AC06D profile features a discontinuous lateral rim and a closed “island” rim in the central cavity. The AC07T tip, on the other hand, presents a three-dimensional contoured geometry with a maximum clearance variation of ∼3% of the blade span. The shaped surface reminds of a squealer-like geometry in the front part, while a rounded pressure side knife-edge characterizes the aft part of the blade, followed by a progressive aperture of the tip gap. Both squealer type profiles were tested at a nominal clearance value of 1.38% of the blade span, while a tighter gap characterized the contoured profile (0.85% span).

2.1.2. Operating Conditions

The HP stage was tested at one single flow regime, representative of engine cruise condition. Engine scaled thermodynamic flow conditions were established, achieving an average pressure ratio of 2.2 across the stage and a thermodynamic speed of 281 rpmK0.5. An inlet total pressure of 1040 ± 1.5% mbar was maintained during the test duration. At the outlet, the Reynolds based on the rotor axial chord was 2.76 × 10 5 , reached at high-subsonic conditions (relative Mach number of 0.78). A more detailed characterization of the experimental campaign boundary conditions was provided by the authors in [16].

2.1.3. Measurement Setup

High frequency aerodynamic measurements were performed in the over tip casing area and at the stage outlet. The rotor shroud was instrumented with a flush-mounted measurement insert allowing the interrogation of the wall static pressure distribution over a full vane pitch and between −5% and 105% c r , a x (6 azimuthal × 11 axial measurement points). The array mounted 33 fast response piezo-resistive pressure sensors (Kulite type XCQ-062 25A) and 33 pneumatic taps connected to a dedicated pressure scanner (Scanivalve® ZOC 33/64PX ±15 psid). The tap diameter of 0 . 6 mm ensured a high spatial resolution of the geometric features of each single tip, while the symmetric nature of the insert allowed doubling the measurement locations by rotating the array 180 . The piezo-resistive sensors, recessed by 0 . 2 mm with respect to the casing wall, offered a frequency response above 100 kHz.
The stage outflow was investigated 50% c r , a x downstream of the rotor trailing edge, in a measurement region that extended over the full blade span and covered one entire vane pitch in azimuthal direction. The time-resolved aerodynamic field was interrogated by traversing double-head Kulite sensor rakes (20 radial × 8 circumferential = 160 measurement points). The probe detected the blade-to-blade flow variations up to frequencies in excess of 50 kHz with a precision of ± 0 . 01 % of P 01 ( 0 . 1 mbar) [22]. Miniaturized single-hole probes were employed in “virtual three-hole probe” mode [23], emulating the yaw-sensitivity of real three-sensor probes by applying a probe rotation in three consecutive tests for each investigation point. Time-resolved flow yaw angle, pressure and Mach number were then retrieved by applying calibration maps to the measured pressure signals. The probe head was specifically designed to ensure enhanced spatial and temporal resolution. The fast response piezo-resistive transducer was connected by a small cavity to a tap of 0.2 mm diameter, ensuring a frequency response of 30 kHz. The measurement matrix covered one full vane pitch, extending over the upper 50% of the rotor blade span.

2.1.4. Signal Acquisition

Before digitization, the analogue pressure signals were split into high- and low-frequency components to ensure the correct resolution of fluctuations at the time scales of the rig blowdown (0.5 s) and rotor blade passage (200 μ s). The low pass filter was set at 500 Hz and the signal was sampled for 10 s at 10 kHz. The high-frequency component, on the other hand, was obtained by applying a band-pass filter (60–200 kHz) to the raw data. The AC signal was then amplified by a factor of 10, before being sampled at 1 MHz for 3 s, leading to a resolution of 210 points per rotor passage. Both components were digitized with 16-bit resolution. The full measurement chain was calibrated between 0 and 1 MHz to determine the static gain and frequency response. Hence, the calibrated de-boosting functions were employed in the data reduction process to retrieve the original signal from the acquired one.
An ensemble averaging procedure was applied to the AC signal to isolate the deterministic fluctuations, strictly correlated with the blade passing event, from the uncorrelated unsteadiness, due to random revolution-to-revolution flow variations [24].
The time-resolved raw data were phase-locked averaged over one entire rotor revolution to account for the rainbow configuration. The averaging time window (240–250 ms) included 23 rotor revolutions. The passage-average flow field was then computed by considering the central passages of each rotor sector. The outer blade passages were excluded from the ensemble average to ensure an increased flow periodicity. The instantaneous rotor angular position was monitored by optical shaft encoders with an accuracy of ± 0 . 25 % of the rotor pitch at a rotational speed of 5900 rpm. Five blade passages per revolution were therefore considered for each single tip profile, leading to a total of 23 × 5 = 115 blade periods per test [16].

2.2. Numerical Setup

The HPT time-varying flow field was analyzed by means of nonlinear harmonic computations (NLH) performed in Numeca FINE/Open 6.1. The flow was decomposed into a time mean component and several perturbations located at the harmonics of the blade passing frequency. With the flow equations cast in the frequency domain, it was possible to fully resolve the stage periodicity by only modeling a single blade passage and reducing considerably the domain dimension. After an initial parametric study, five harmonics of the blade-passing frequency were considered in the unsteady computations, while a time reconstruction was employed to retrieve the time-accurate flow solution.
An unstructured fully-hexahedral grid was employed to mesh the complex tip geometries under investigation, with a number of cells ranging between 21 and 23.8 × 10 6 . The tip region was discretized by a minimum of 100 cells in axial and tangential direction and 50 cells in radial direction [25], with a y + value below 0.7 over the entire tip surface.
The one-equation Spalart–Allmaras formulation was used to model turbulence, while adiabatic conditions were imposed at the walls. The perfect gas hypothesis was assumed for the working fluid. Since the experimental inlet and outlet were included inside the numerical domain, an iterative method was applied to finely match the measured flow conditions. Pianko averaged total pressure and mass-flow averaged total temperature conditions were set at the experimental inlet plane.

2.3. Modal Analysis

A clear identification of the main unsteadiness sources within the turbine stage is critical to gain a full understanding of the time-varying flow field. While instantaneous flow representations can only give a visual indication of the degree of periodicity of different flow structures, the modal analysis [26] allows a quantitative assessment of the spatial and temporal non-uniformities characterizing the stage flow.
As indicated in Figure 2, the flow quantities were first represented in the phase-time domain at each axial position. The vertical axis refers to the normalized circumferential position and the horizontal one to time. The flow evolution in both the spatial and temporal domain was therefore resolved. The vane-dependent periodicities appeared as horizontal flow structures, while the rotor-dependent ones presented an inclination angle proportional to the blades angular velocity. In the case exemplified in Figure 2, the static pressure field at −15% c r , a x is highly dependent on the vane-relative position, while a much stronger rotor periodicity is shown by the same quantity at 90% c r , a x .
A double Discrete Fourier Transform was applied to these distributions to obtain the modal matrix, where each element represents a specific spatial-temporal mode. Those periodicities which are stationary in the vane frame of reference are addressed as vane modes. Conversely, the flow structures which show a steady behaviour in the rotor relative frame represent the rotor modes. The total energy content of the rotor- and vane-dependent periodicities can therefore be computed by knowing their position in the matrix [22]. All the remaining modes result non-stationary in both reference frames and are addressed as vane–rotor interactions.

3. Results

The aerodynamic field of each tip sealing geometry was assessed by means of a combined experimental and numerical analysis. The predicted over-tip flow was first validated by addressing the unsteady pressure distribution measured at the rotor casing. The numerical results were interrogated at the mid-gap plane of each profile to assess the influence of the tip geometry on the generation and development of the tip leakage stream. Time-averaged pitchwise-averaged radial distributions of total pressure and flow angle were then examined 50% downstream of the rotor trailing edge. The entropy field of each profile was interrogated to understand the impact of the tip geometry on the outlet loss generation pattern. Finally, a modal analysis was performed in space and time to identify the most relevant sources of aerodynamic and entropic unsteadiness within the stage blade rows.

3.1. Over-Tip Flow

3.1.1. Blade Passing Effect

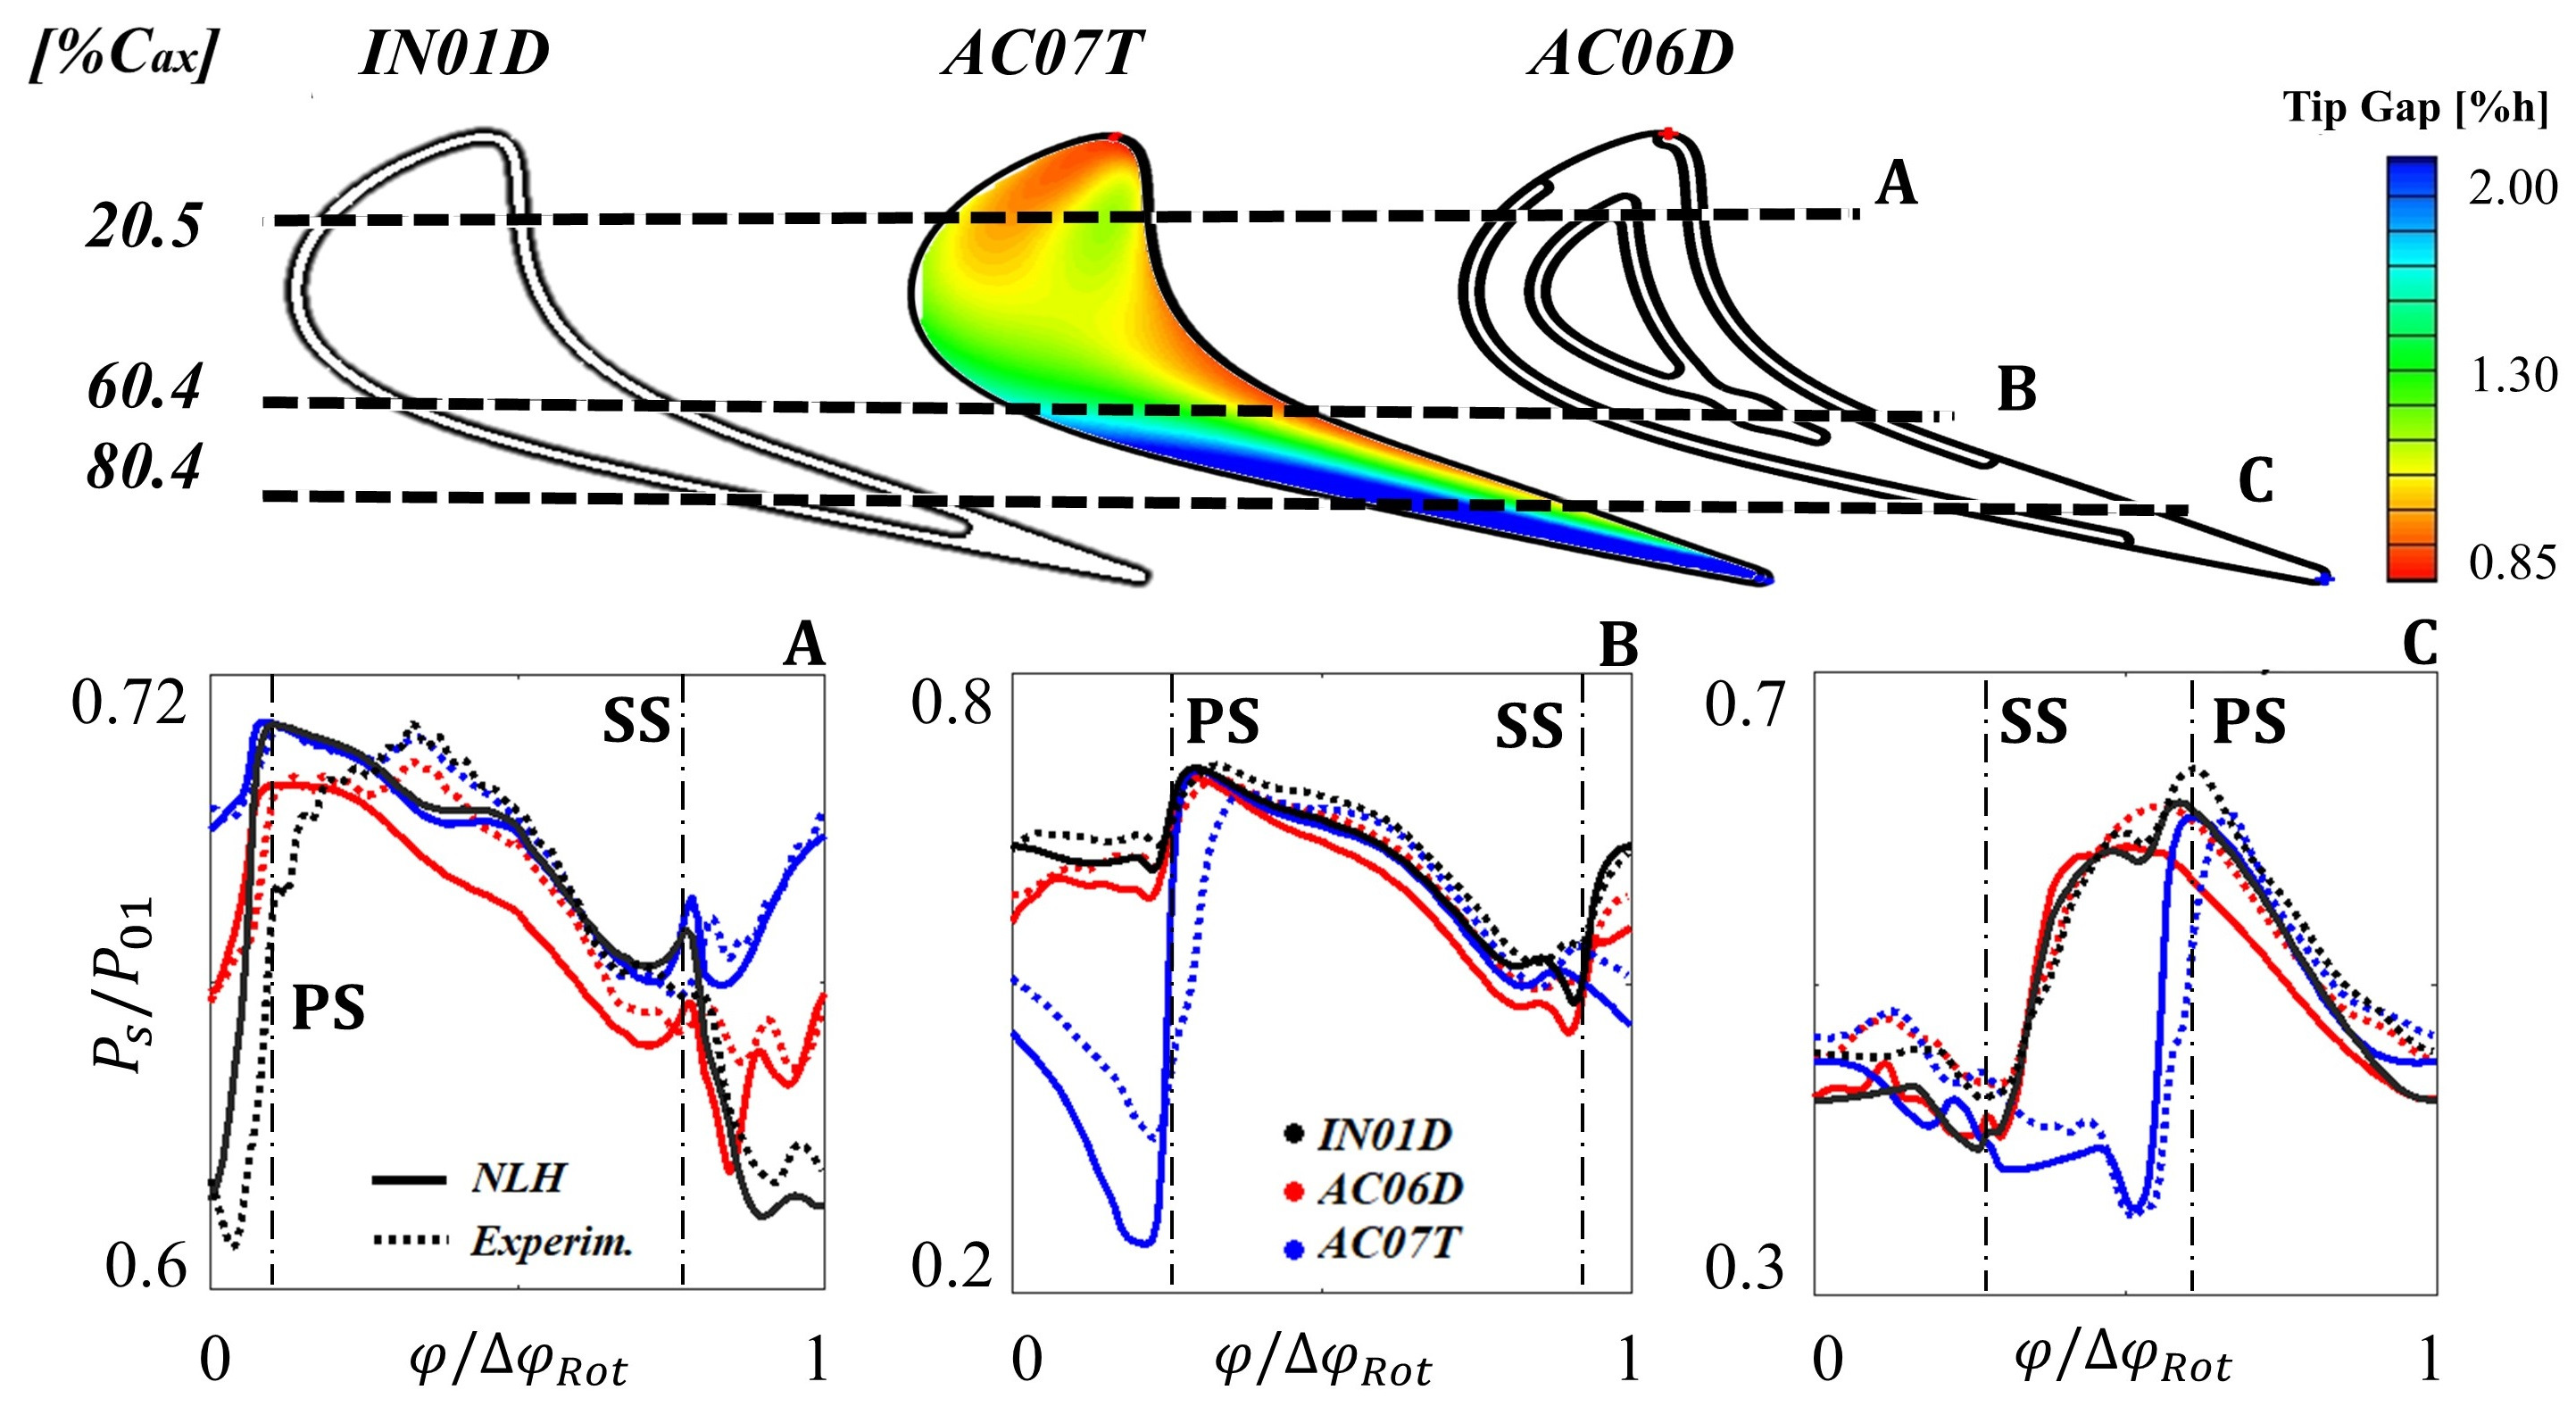
Figure 3 shows the computed and measured time-resolved static pressure variations at three different axial positions along the rotor chord (20.5%, 60.4%, and 80.4% c r , a x ). The flow interrogation points were all located at 33.1% of the vane pitch, where θ = 0 corresponds to the azimuthal position of the vane trailing edge. The pressure histories were plotted as a function of the rotor phase, with one period representing the time that a rotor blade needs to cover a full rotor pitch. The predicted pressure signals, represented by solid lines, were obtained by sampling the time reconstructed flow field in the exact same locations at the rotor casing.
The blade tip, travelling from right to left in the plots, caused a pressure fluctuation, which depended on the leakage-driving aerodynamic load of the rotor airfoil. Moving through the rotor passage from the suction towards the pressure side, a gradual increase of pressure was registered for the three tips. The steep acceleration experienced by the leakage flow inside the gap the produced an abrupt pressure drop, dependent in magnitude and shape by the tip geometry. Blades IN01D and AC06D exhibited a more abrupt pressure decrease at 20.5% of the rotor axial chord, while the contoured shape of AC07T promoted a significantly higher gap flow acceleration at 60.4% and 80.4% c r , a x . A remarkably good agreement was observed between experimental and numerical results for both the time-mean and fluctuating signal components. The tip-to-tip flow differences were clearly captured by the CFD, especially in the tip gap region where the airfoil geometry mostly affected the flow aerodynamics.

3.1.2. Casing Pressure Field

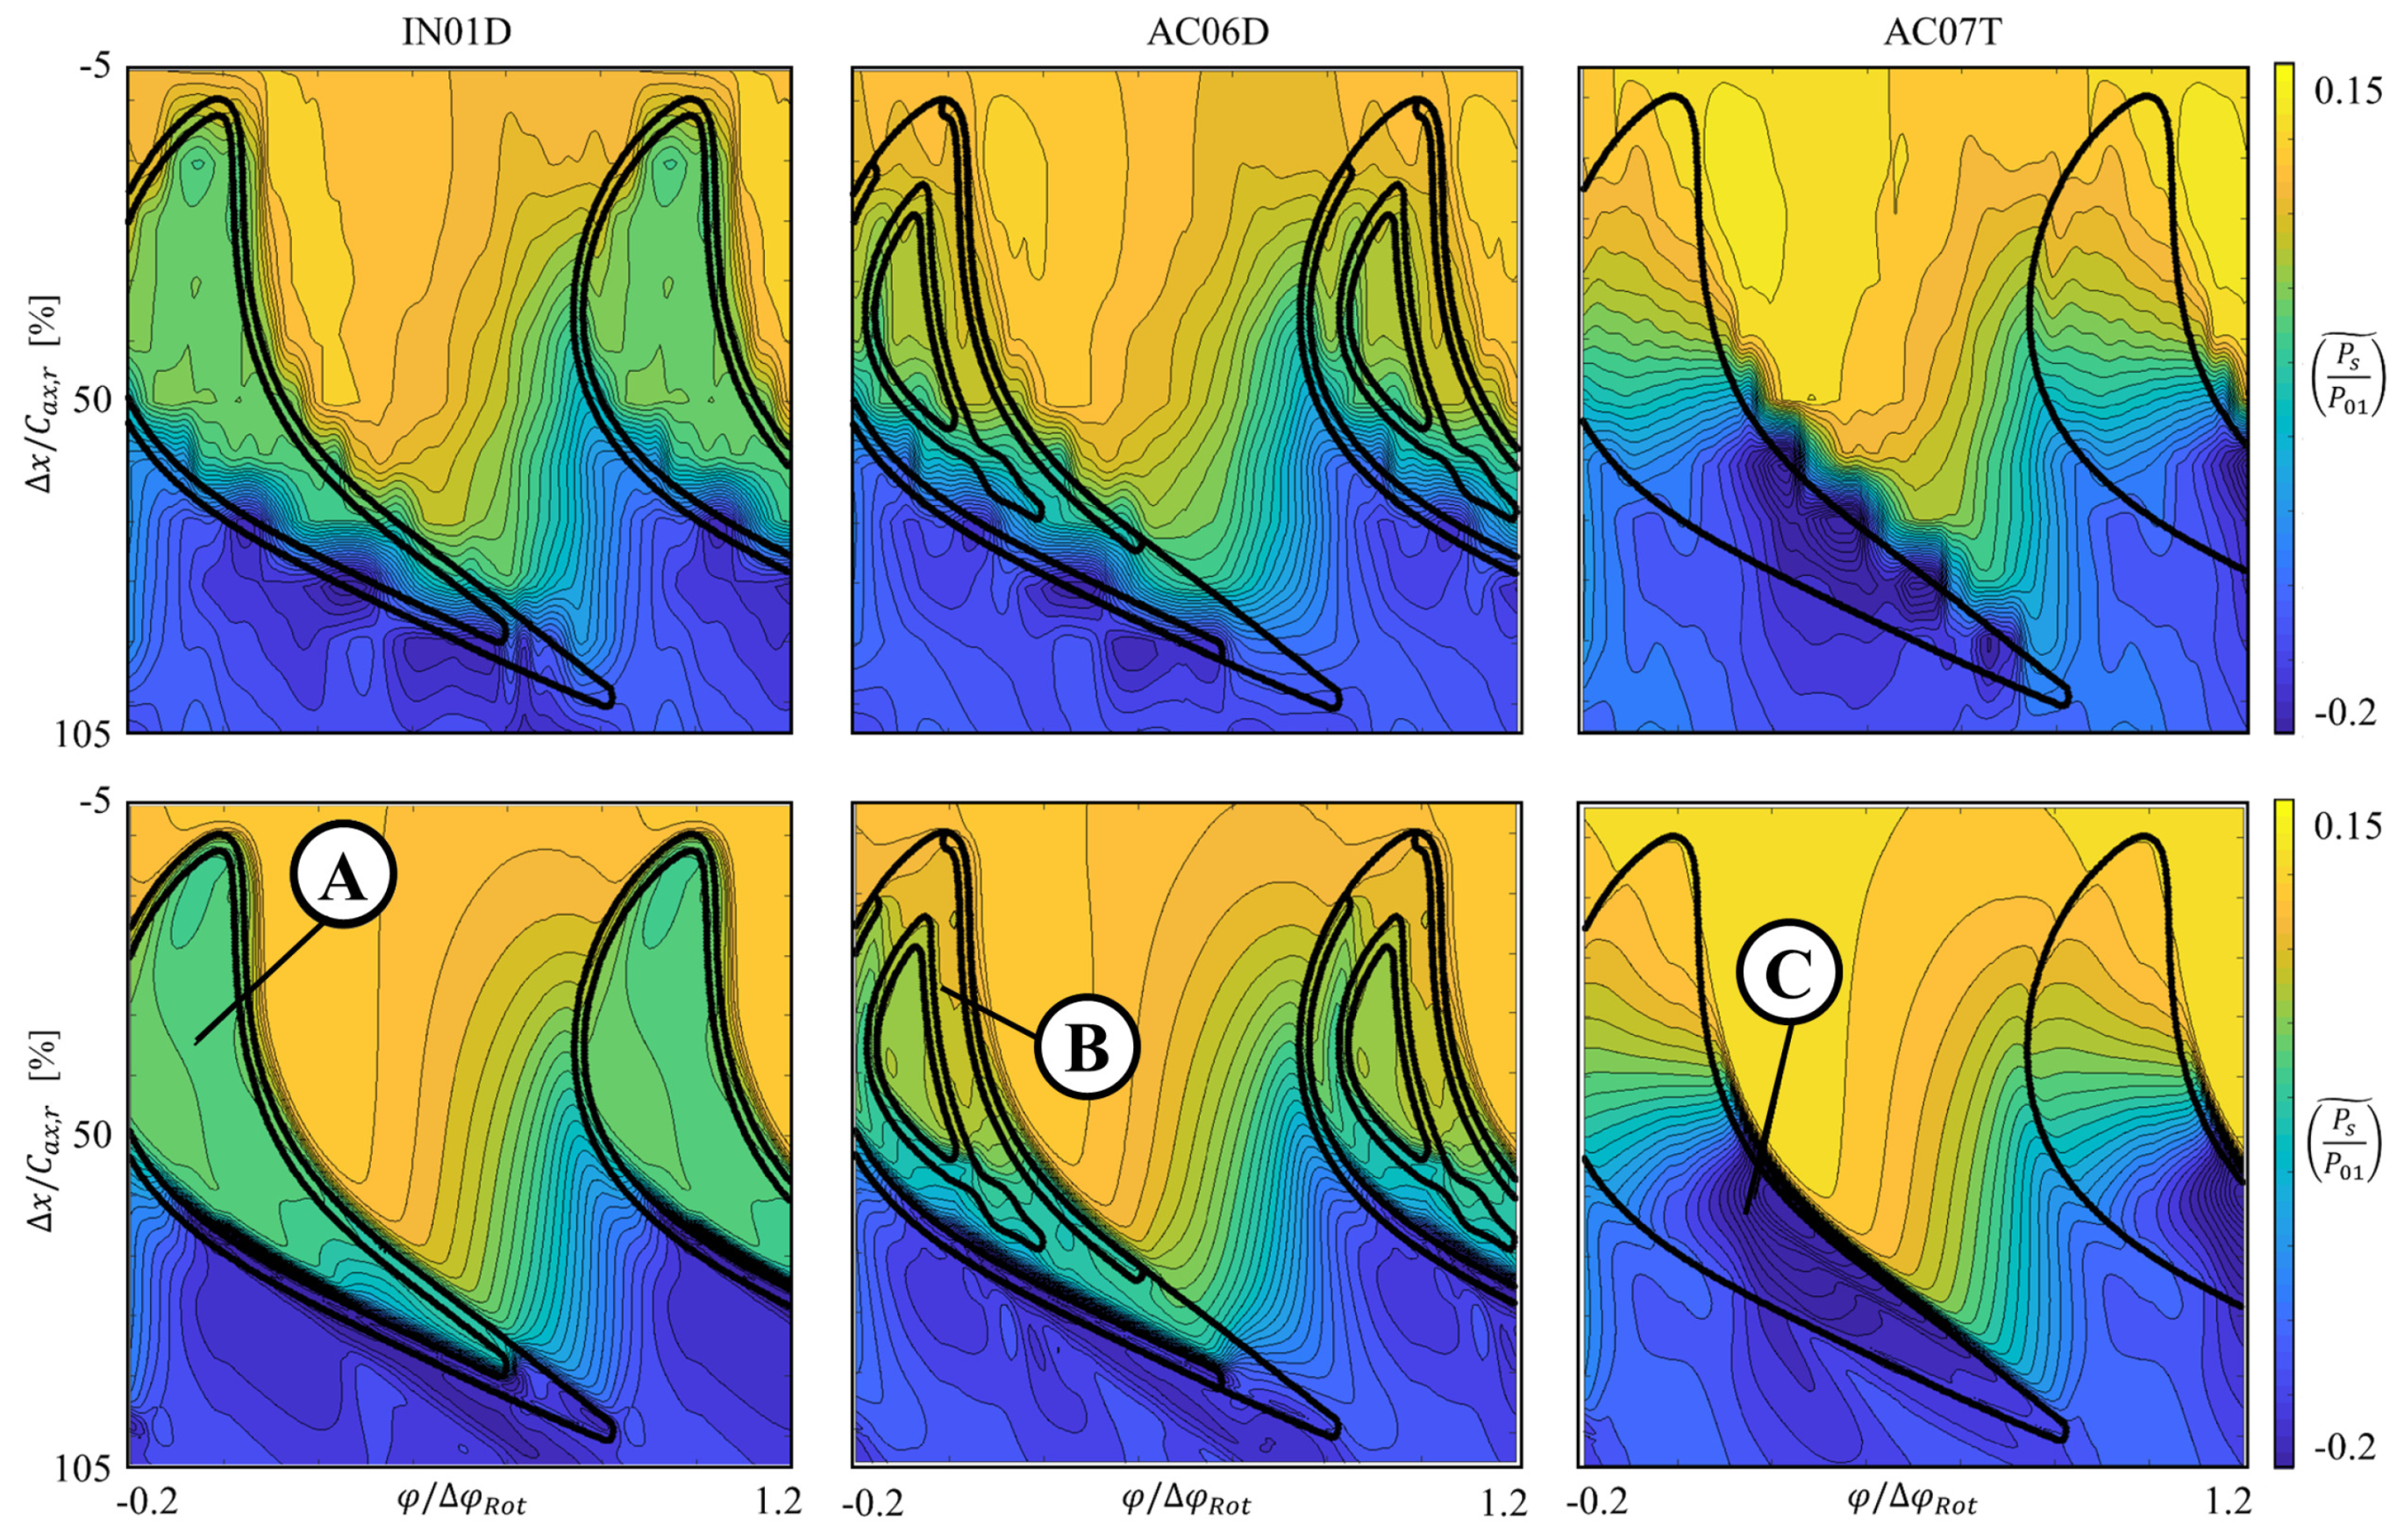
Figure 4 shows the phase-resolved normalized casing static pressure field for the three tip geometries over a full rotor pitch. The contours are represented in the relative frame of reference, with the horizontal coordinate indicating the position along the rotor passage. All the pressure contours were normalized by their time-averaged values. The time- and space- dependent effects of the upstream vane were removed by averaging the measured and computed distributions in the rotor relative frame, isolating the impact of the tip sealing design on the over-tip static pressure field.
Blade AC07T exhibited the largest acceleration of the gap flow (marker C, 40–60% c r , a x ), while a relatively constant static pressure was found over the baseline squealer tip cavity (marker A). The suction side channel created by the internal and peripheral rims of AC06D promoted the acceleration of the flow in axial direction (marker B). The computed field closely agrees with the measured distributions, not only from the flow topology standpoint but also for the magnitude of the pressure fluctuations. The lower resolution exhibited in axial direction by the experimental results was solely due to the spatial discretization imposed by the measurement array (11 axial stations over 110% c r , a x ).

3.1.3. Mid-gap Entropy Field

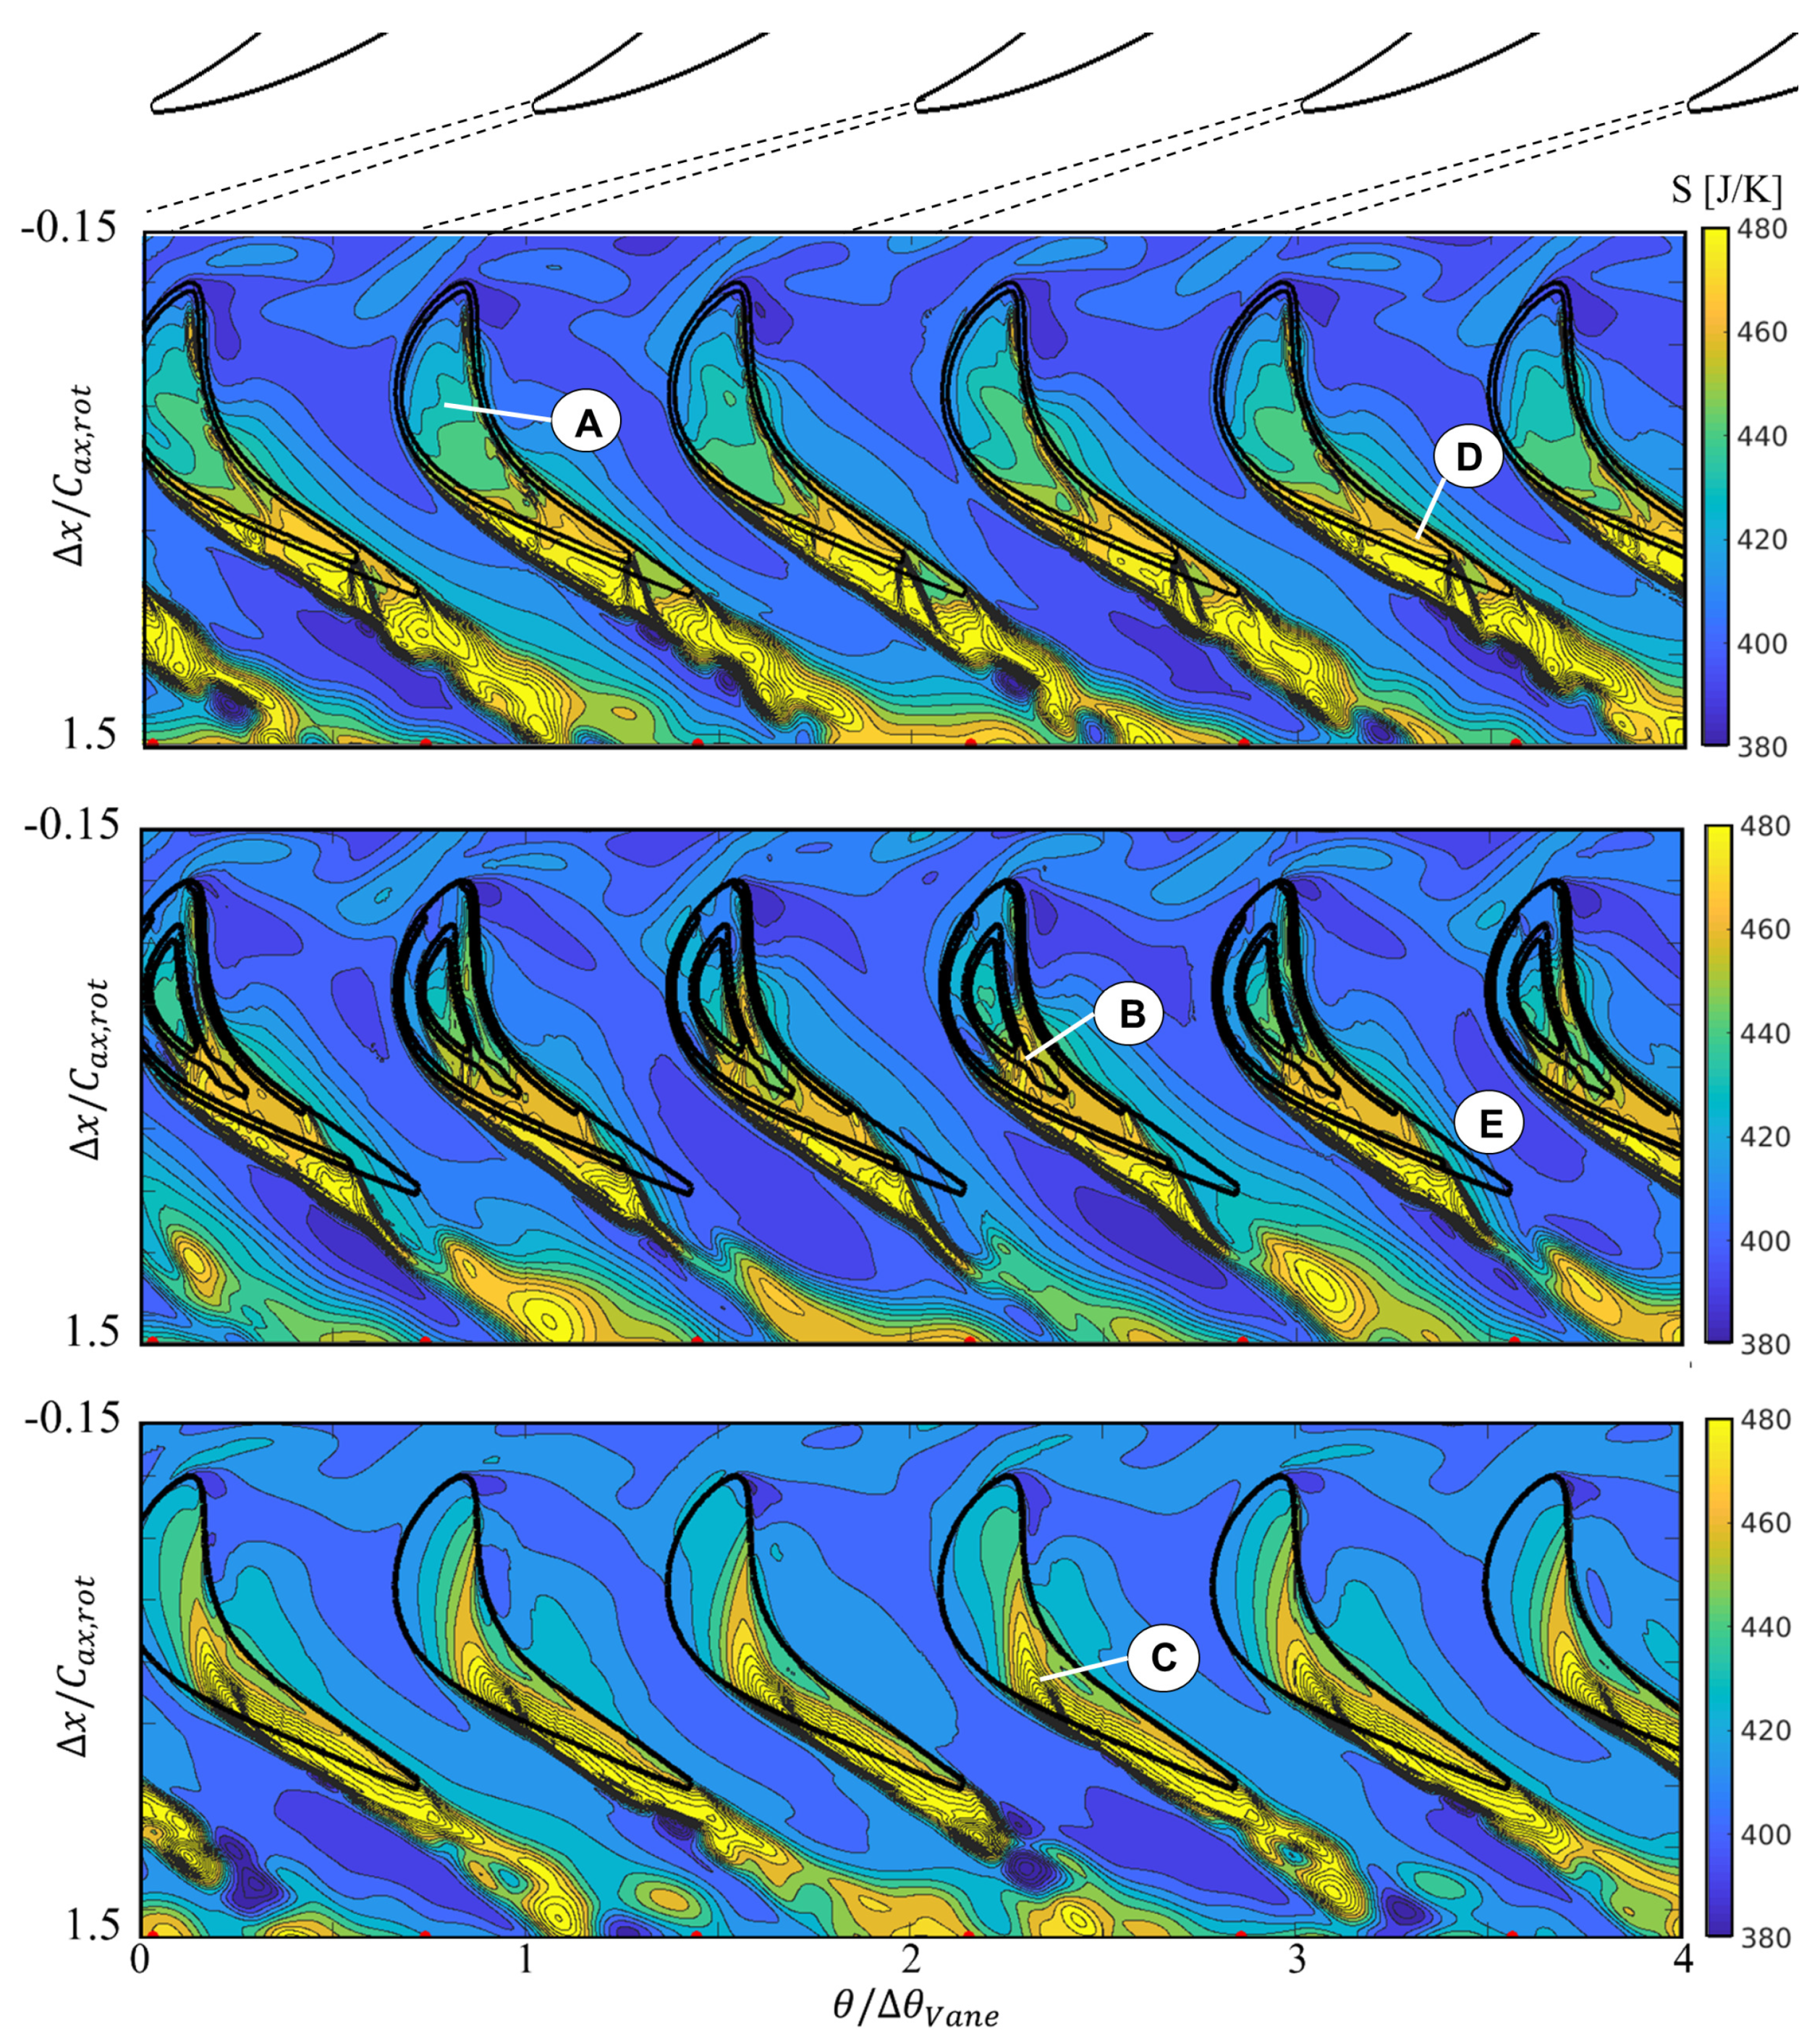
Figure 5 shows the instantaneous entropy distributions at mid-gap for the three tips, i.e., at 99.31% h r for the squealer profiles and 99.58% h r for the carved tip. The contours were computed in the vane frame, between −15% and 150% of the rotor axial chord, taking as reference the vane trailing edge. The entropy levels were referred to standard conditions of temperature and pressure. Periodic spots of high entropy, caused by the incoming vane wakes, were observed to impact on the rotor blades leading edge as they travel from right to left in the carpet plots. The slightly higher values exhibited by the wakes impacting the AC07T tip were justified by the different spanwise position of this mid-gap plane.
Inside the rotor passage, a gradual increase of entropy was registered from the suction towards the pressure side for the three tips. The passage intensity peak was reached at the blade pressure side, around 50% of the axial chord, and presented a partial dependence in both magnitude and shape from the vane-relative position. The most significant impact of the tip geometry was registered in the over-tip region. As a common feature between the three profiles, relatively low values of entropy were registered in the front part of the tip surface. Proceeding towards 60% c r a x , the increase was very gradual in the central cavity of IN01D (A) and in the inner squealer of AC06D. The pressure side rim of both profiles generated localized high entropy streams that did not travel further inside the cavity. High entropy fluid was channeled in between the internal and external rims of AC06D (B), eventually climbing over the central single-rim at 60% c r , a x . The entropy gradient was much steeper on the AC07T profile, which exhibited over-tip entropy peaks that significantly exceeded the squealer profiles (C). The loss distribution in the gap showed a good passage-to-passage repeatability, being only slightly influenced by the vane-relative position.
The tip leakage vortex (TLV) was characterized by high levels of loss for all the three profiles. The stream was injected in the rotor passage from the blade suction side, at an axial position that depended on the tip design: 50–55% c r , a x for the squealer geometries and 60–65% c r , a x for the carved tip. This difference was due to the contoured surface of AC07T, which tended to accelerate and redirect the gap flow, delaying its emission into the main stream.
Major differences were observed in the flow pattern over the aft part of the blades. The closed end of the squealer cavity (D) produced an upturned high-entropy stream that slightly varied in intensity with the vane-relative position (i.e., with the rotor blade loading) and interacted with the tip leakage stream. The open-end rim of AC06D, on the other hand, produced a strong inviscid interaction between the low-entropy by-pass jet and the tip leakage vortex (E). The nature and strength of this interaction was observed to be rotor-periodic between 90% and 110% c r , a x , while becoming more vane-dependent between 110% and 130% c r , a x , where the flow was no longer guided by the rotor airfoils. The carved tip appeared to generate a more intense, localized leakage stream in the over-tip region, keeping a significant degree of rotor-periodicity up to 105% c r , a x . Downstream of this position, the entropy pattern of AC07T appeared to acquire immediately a high vane-dependence, as the unguided flow left the rotor passage.
The time-average mid-gap entropy field of the three profiles is shown in Figure 6 in the vane frame of reference. The three blades showed a common pattern between −15% and 55% c r , a x , with a slightly higher mean level registered in the carved profile, probably due to the smaller clearance value. The steep acceleration experienced by the gap flow on AC07T was shown to significantly increase the time mean loss level between 60% and 100% c r , a x . The aft part of blade IN01D, characterized by the closed rim end, exhibited higher time-mean losses than AC06D. The higher clearance value and low-entropy by-pass jet of the latter contributed to limit the mean entropy level between 90% and 100% c r , a x . As a common feature, the three profiles showed a significantly uniform time-mean entropy field in the over-tip region, confirming the rotor-periodic nature of the gap flow.
Downstream of the rotor trailing edge, the vane periodicity became more significant, with high entropy regions largely modulated by the vane relative position. These high-loss flow structures marked the increased influence of the upstream vane over the TLV developing from the three profiles. Between 110% and 150% of the axial chord, IN01D showed a more scattered entropy distribution compared to AC06D and AC07T, which were more influenced by the relative position of the upstream vane. The carved profile, in particular, exhibited periodic entropy peaks between 0 and 0.1 of the vane pitch. Blade AC06D exhibited large periodic regions of low time-mean entropy between 110% and 130% c r , a x , probably a direct effect of the variable blade tip loading on the jet–leakage interaction.

3.2. Stage Outlet Flow

3.2.1. Time Average Radial Profiles

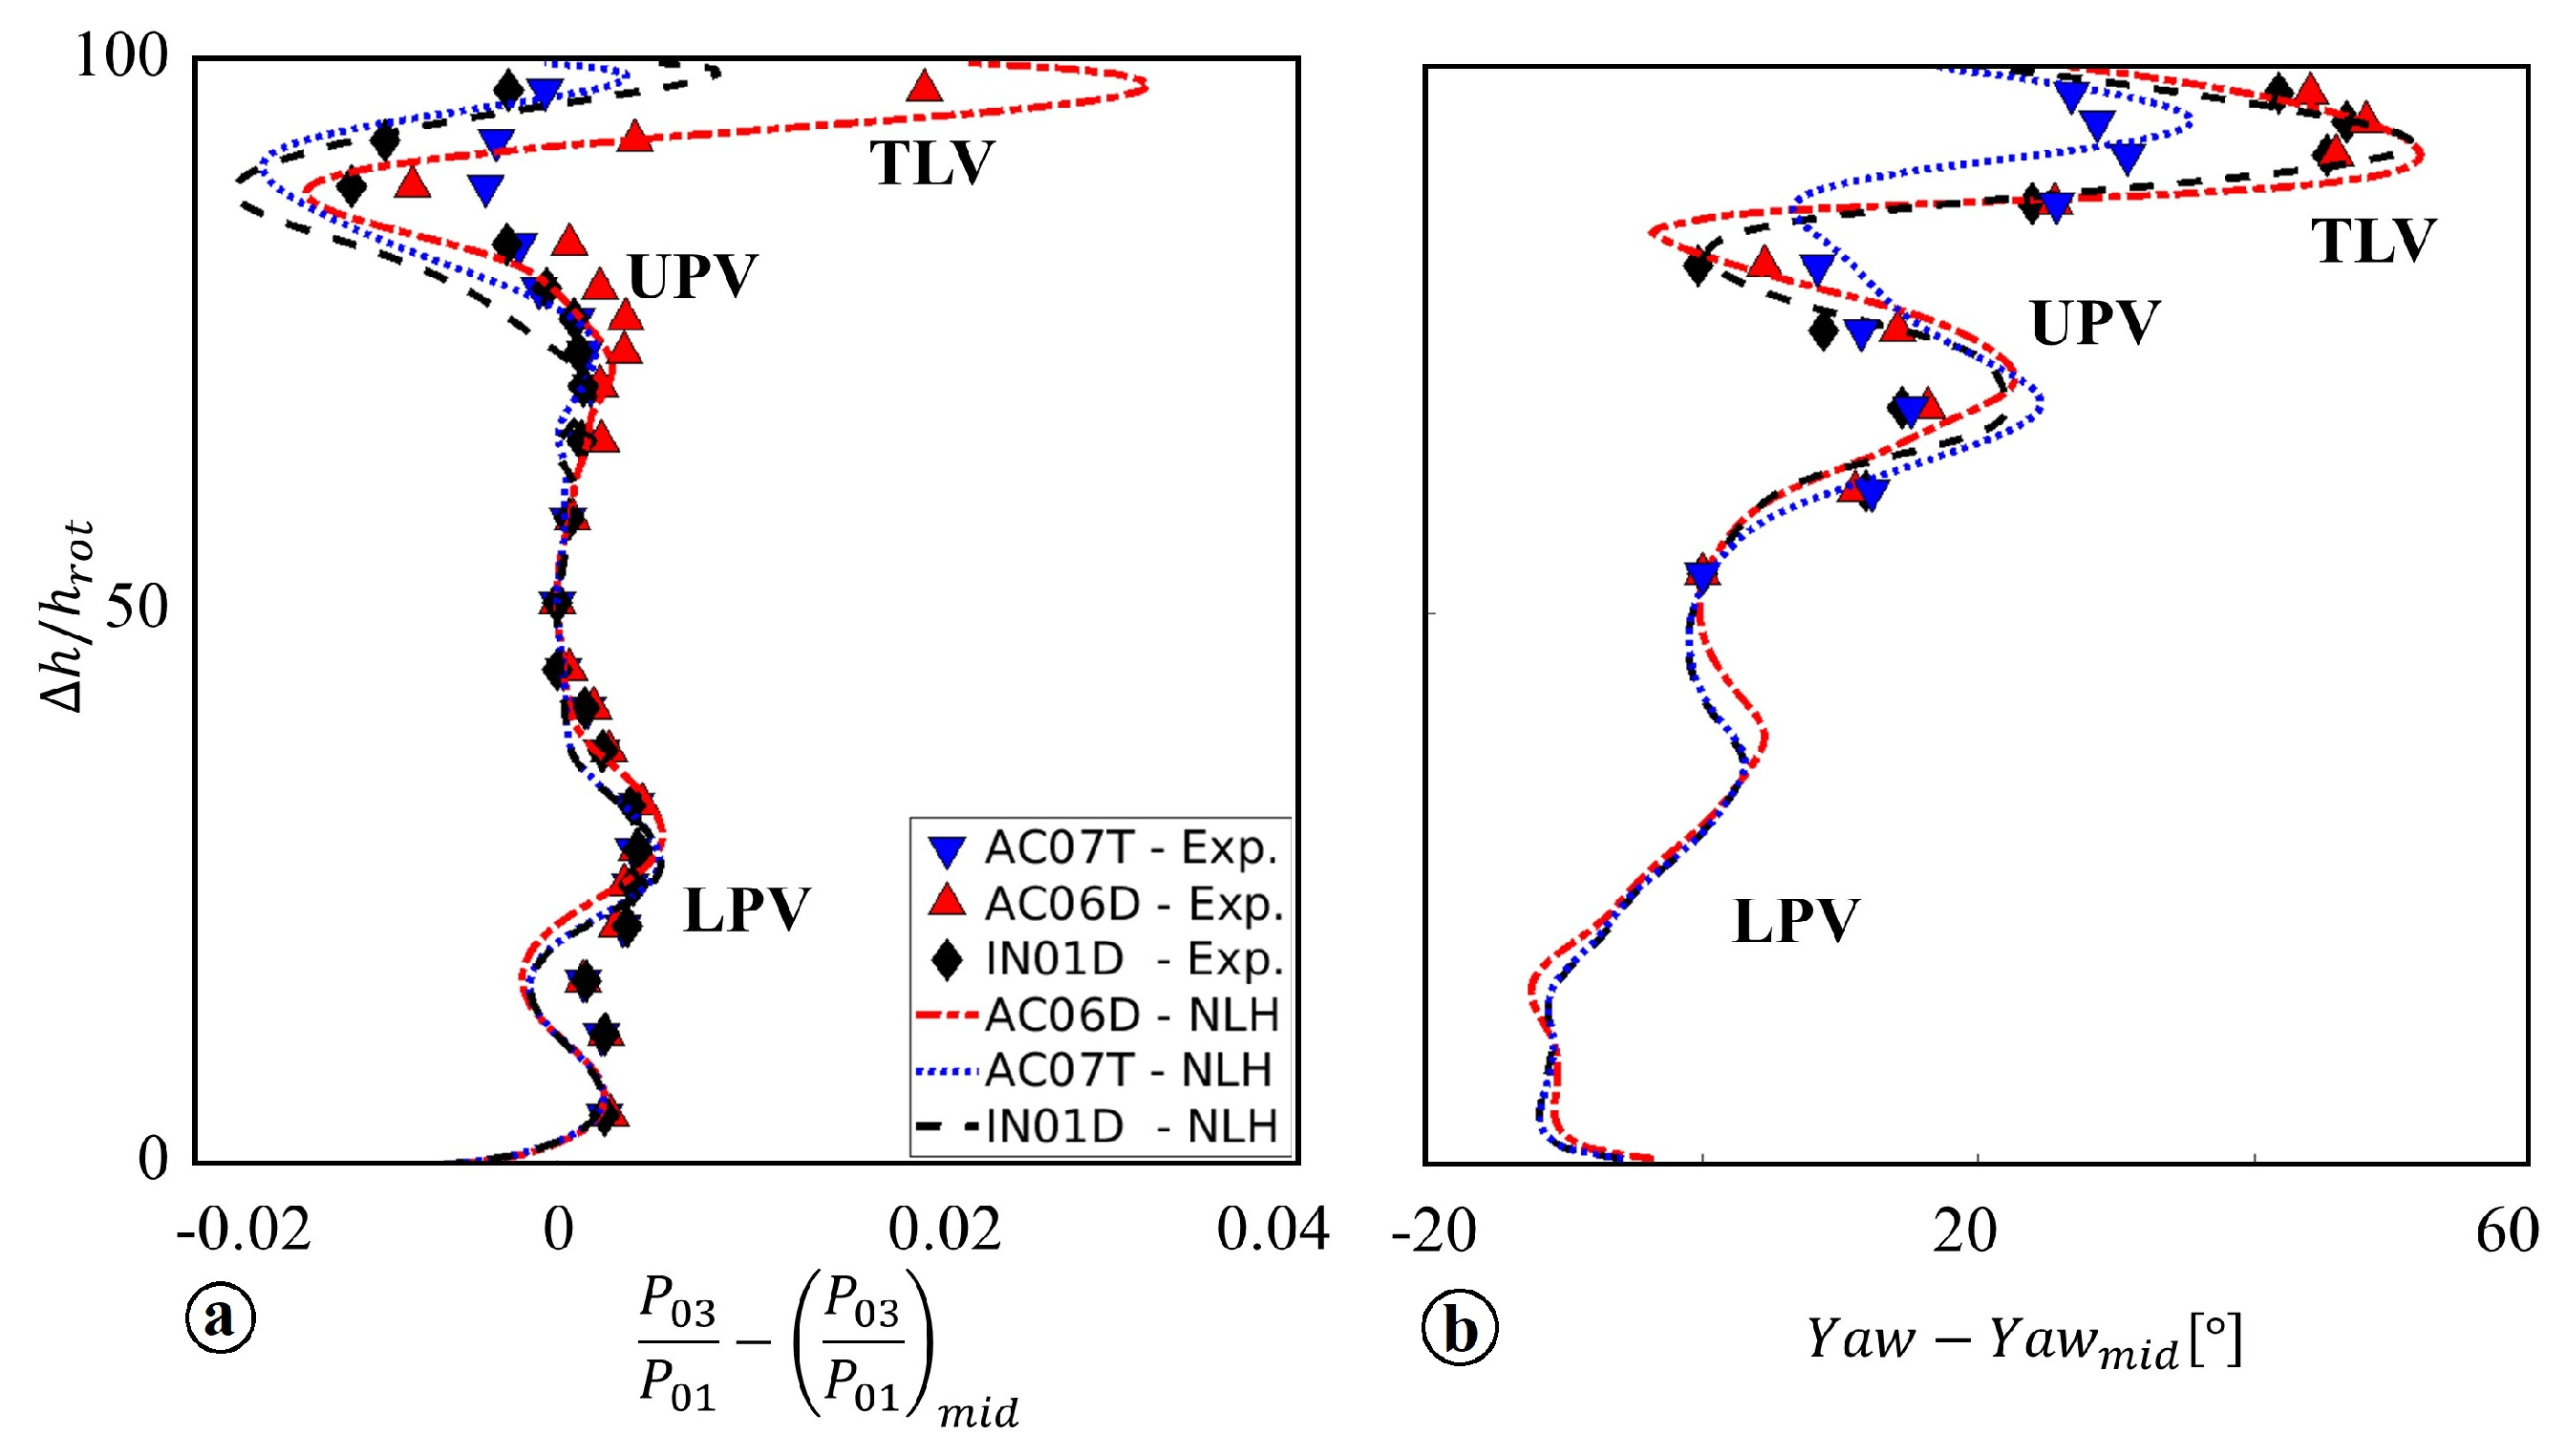
The outlet total pressure and absolute yaw angle radial profiles are reported in Figure 7 as a variation from the value at 50% of the blade span. The computed distributions showed a good agreement with the experimental profiles, obtained by pitchwise-averaging the time-resolved signals for each tip.
Blade AC06D exhibited the highest peak of time-mean absolute total pressure in the near tip region, probably due to the aforementioned by-pass stream leaking through the rear rim aperture. A pressure deficit was present for all blades at 90% of the span, where the tip leakage vortex was located. While the spanwise location of this structure was well matched, the numerical results seem to overestimate the pressure deficit of blade AC07T. In the same area, the predicted absolute flow turning was shown to follow very well the experimental results. The under-turning produced by the presence of the tip leakage flow was confirmed to be less important in the case of AC07T in comparison to the squealer profiles. The tip-to-tip differences were also well captured at 75–80% h r , where the upper passage vortex (UPV) was located. At 20% of the blade span, a minor total pressure deficit was registered, corresponding to the time-mean effect of the lower passage vortex (LPV).

3.2.2. Rotor Entropy Field

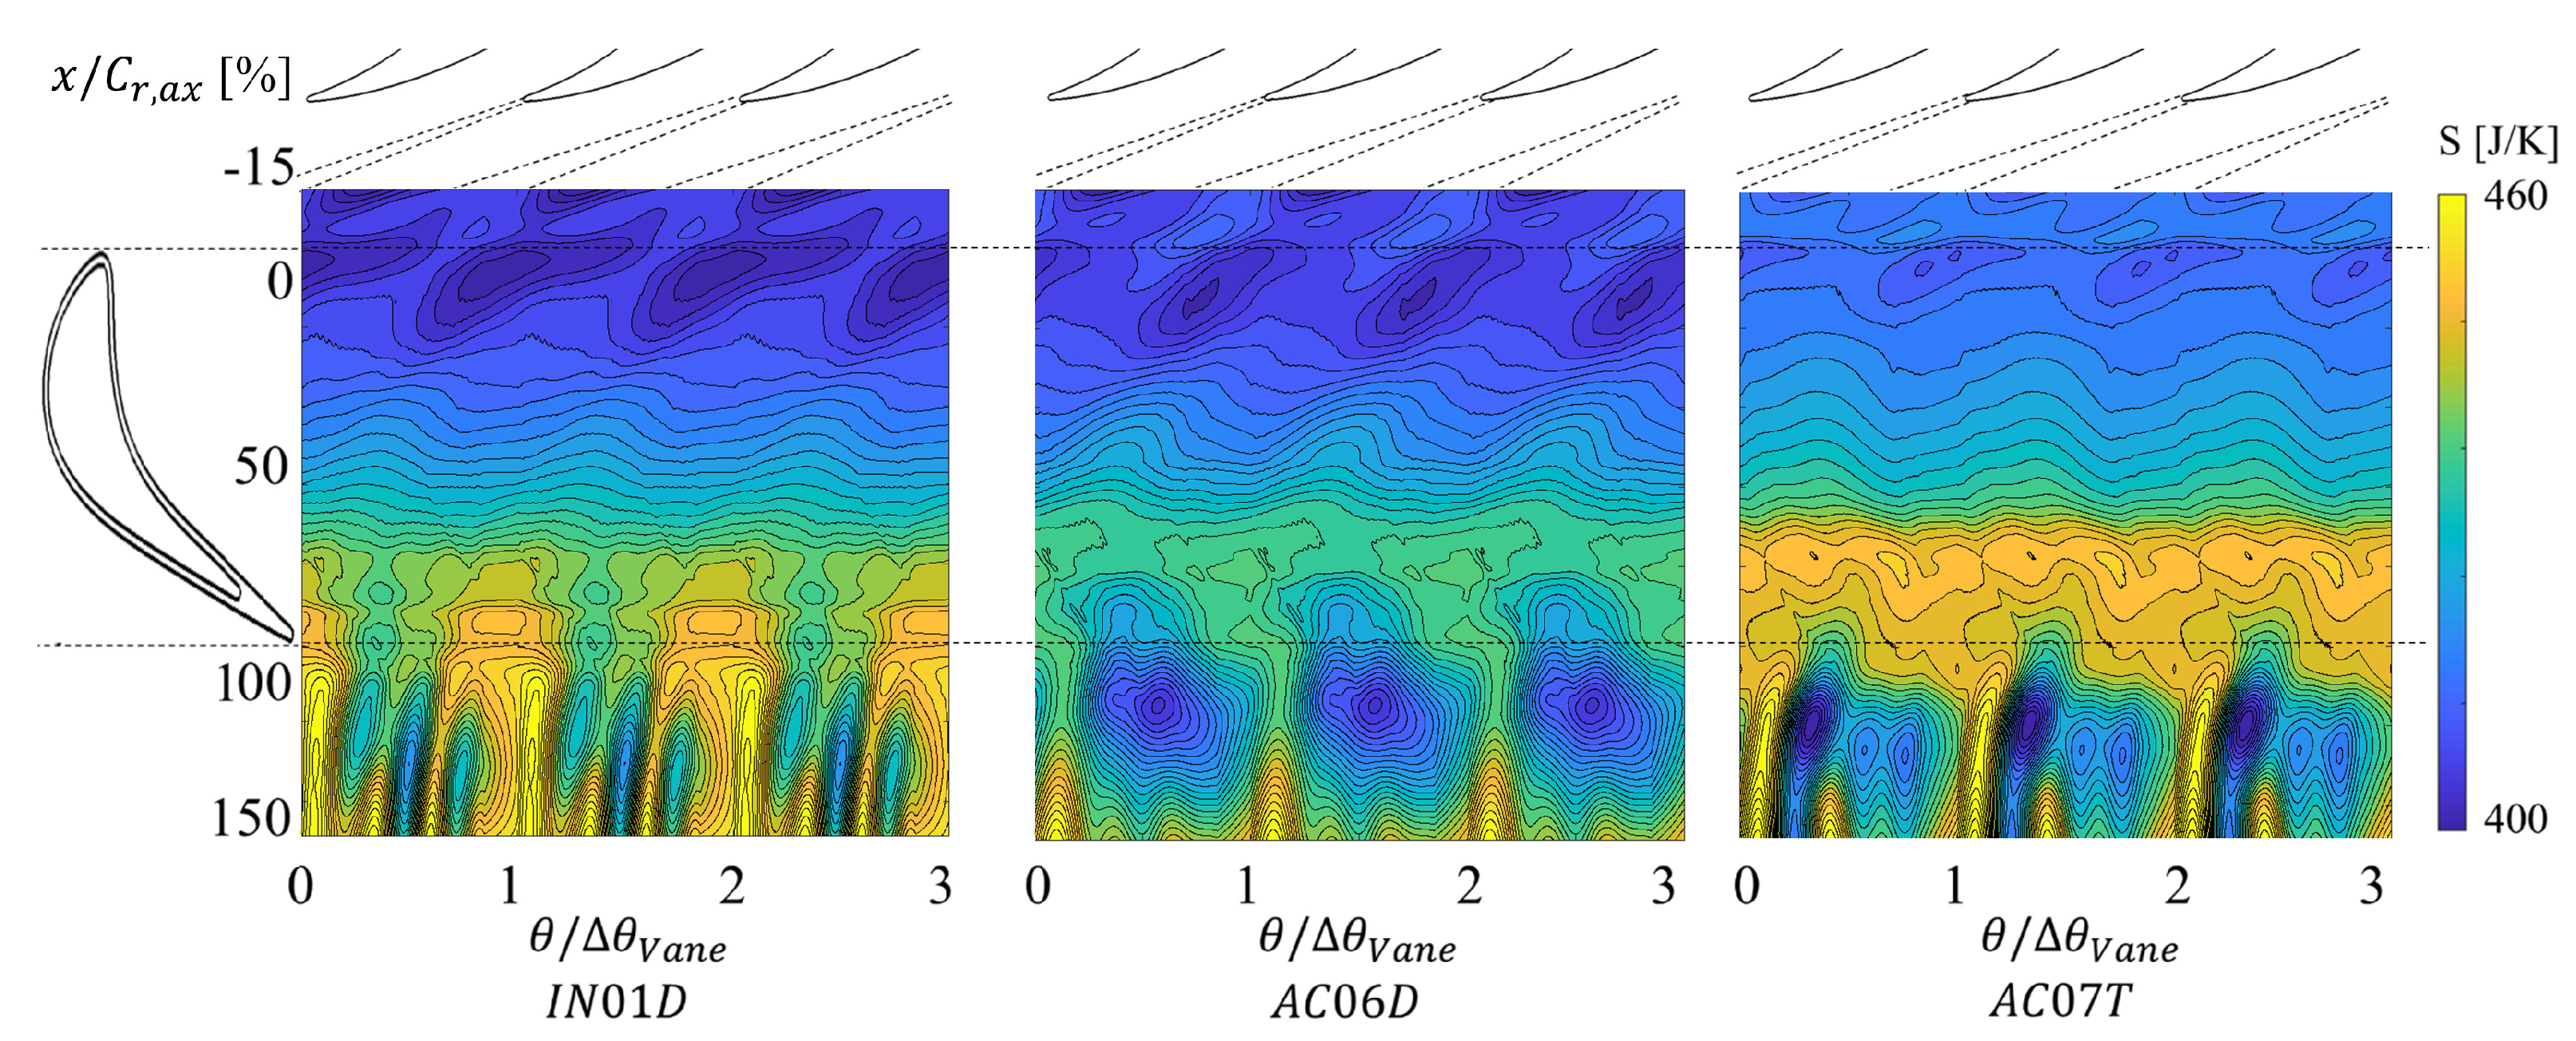
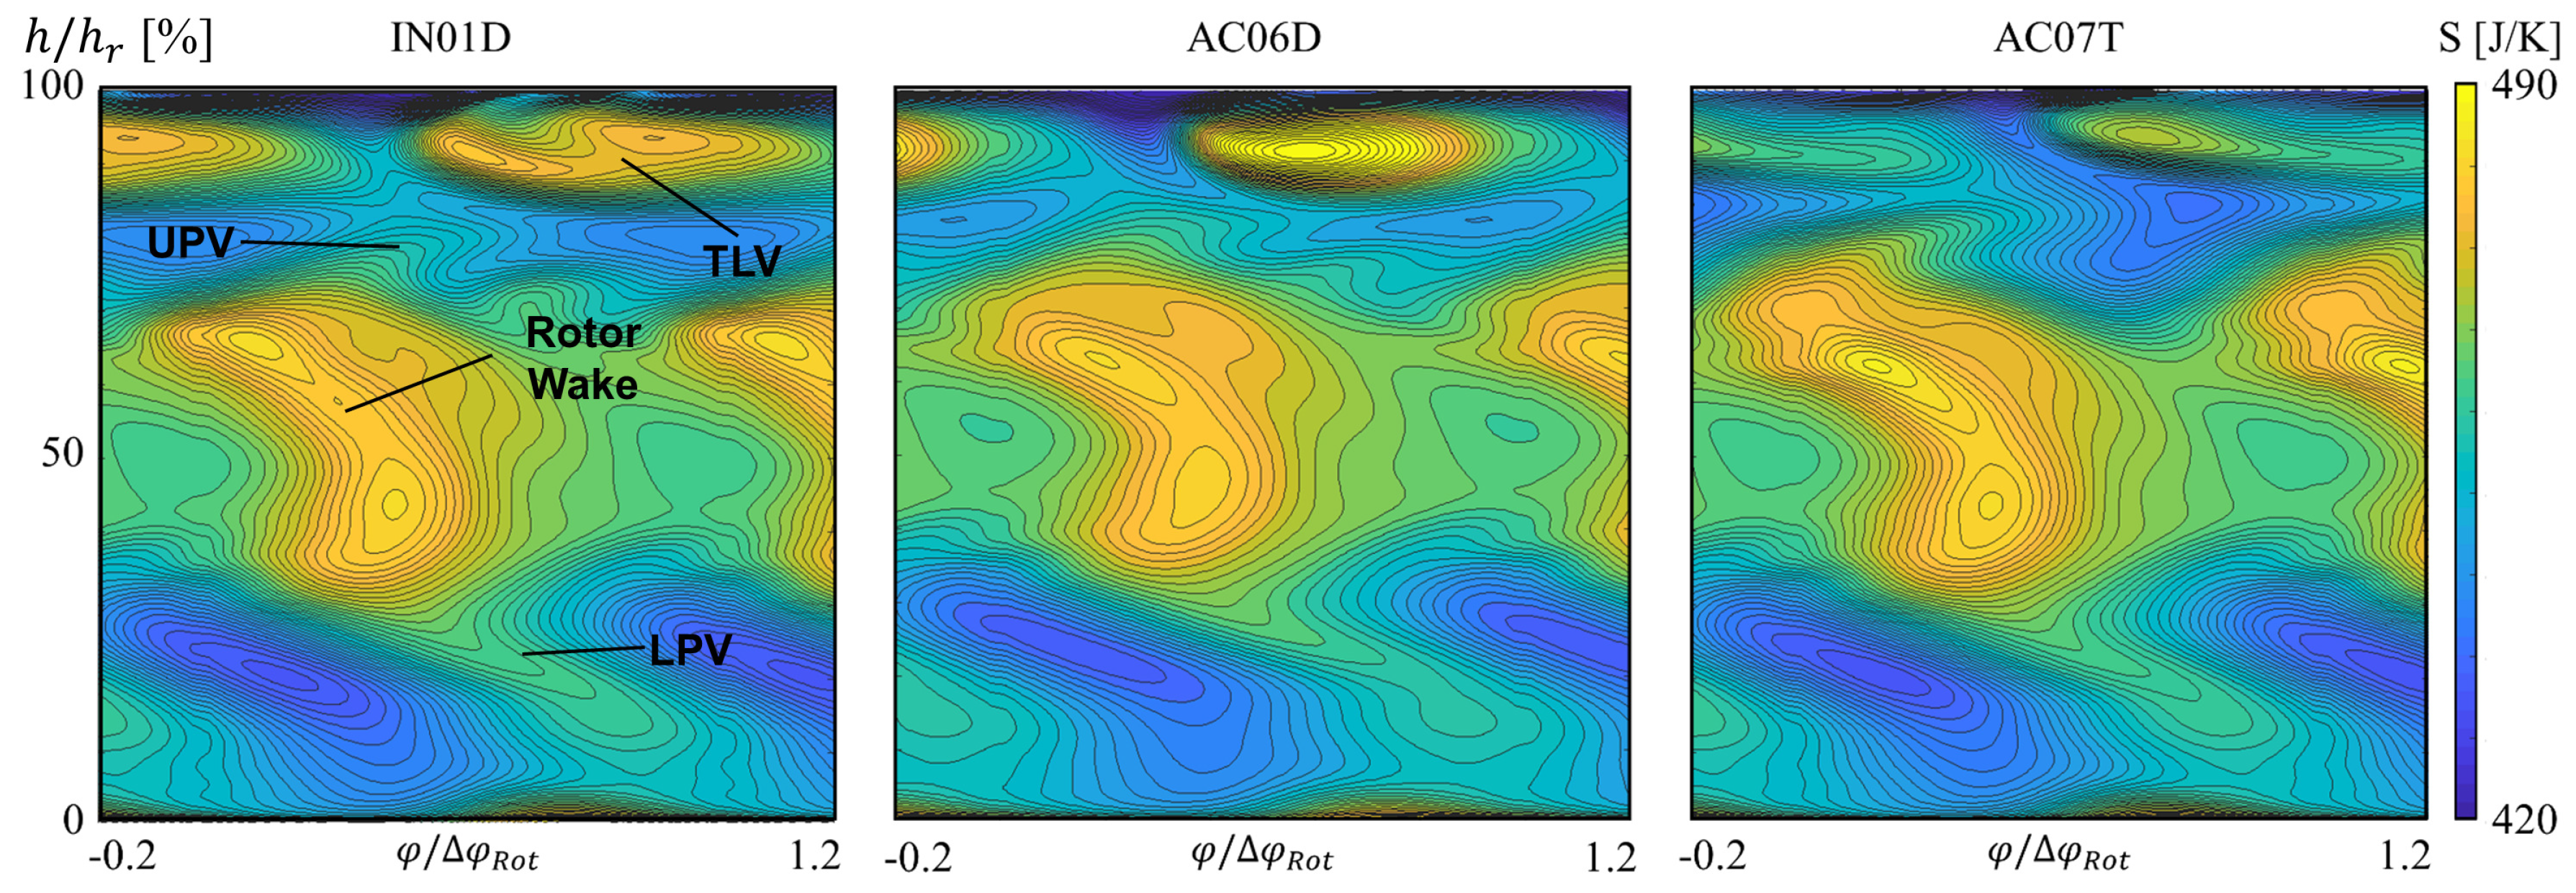
The computed phase-resolved entropy field at 150% of the rotor axial chord is shown in Figure 8 in the rotor relative frame of reference. The presence of an upstream vane, in this case, only affected the flow field in radial direction, while the azimuthal gradients solely depended on the rotor field. The x-axis indicated the position along the rotor passage, proceeding from the blade pressure side ( φ = 0 ) to the suction side ( φ = 1 ).
From 0% to 50% of the blade span, the entropy field exhibited a very repeatable behaviour between the different blades. A periodic region of slightly higher entropy was observed at 20% h r , where the lower passage vortex was located. Between 30% and 70% h r , a high entropy region leaning towards the blade pressure side corresponded to the high-loss fluid of the rotor wake. In the upper part, this fluid interacted with the upper-passage vortex, which was indicated by a region of slightly increased entropy level around 80% h r .
The most evident tip-to-tip flow differences were detected between 80% and 100% of the blade span, where a rotor-periodic high loss region indicated the presence of the tip leakage vortex. The maximum entropy levels were observed in the rotor-mean field of blade AC06D, where the peak resulted significantly higher than in the other tips. A weaker, more scattered tip leakage structure was detected for the baseline tip (IN01D), while the carved profile (AC07T) exhibited the less significant peak among the three blades. This confirmed the strong dependency of blade AC07T on the vane-relative position, leading to high time-mean entropy gradients in the fixed frame of reference. The azimuthal location of the tip leakage vortex resulted quite similar for blades IN01D and AC07T ( φ = 0 . 8 –0.9), while the jet–leakage interaction of blade AC06D forced the entropy peak deeper into the blade channel ( φ = 0 . 6 –0.7).

3.2.3. Time-Mean Entropy Field

The time-average outlet entropy field is shown in Figure 9, represented in the vane frame of reference. The x-axis indicates the trailing edge-phased position along the vane passage, proceeding from the suction side ( θ = 0 ) to the pressure side ( θ = 1 ). The circumferential gradients in this plot depended exclusively on the presence of the upstream vane. The rotor, travelling from right to left in the plots, only contributed to the radial entropy variations.
In the near hub region, the three blades presented the same low-entropy pattern. At 20%, where the lower passage vortex was located, a vane-periodic low entropy region was observed. The azimuthal gradients were more significant than the ones found in the rotor-relative frame, suggesting a strong vane-periodic modulation of this structure.
From 25% to 50% h r high entropy avenues, leaning towards the sense of rotation of the rotor blades, appeared at each vane passage, interrupted by a uniform loss region at mid-span. These structures represented the vane wake avenues and resulted significantly repeatable between the different tips.
Substantial tip-to-tip differences were observed in the upper 50% of the blade span. At 70% h r , where the upper passage vortex was located, the two squealer profiles showed a vane-periodic pattern of high- and low-entropy regions. Blade AC07T, on the other hand, exhibited a more uniform entropy contour. The upper passage vortex of the contoured tip was therefore expected to present a higher degree of rotor-periodicity. In the near tip region, conversely, blade AC07T exhibited the strongest periodic variation of entropy among the three tips, followed by blade IN01D. This periodicity marked the unsteady behaviour of the tip leakage flow, highly modulated by the vane-relative position. Blade AC06D, conversely, presented the most uniform loss distribution at this height, indicating a rotor-periodic tip flow pattern.

3.3. Modal Decomposition

3.3.1. Over-Tip Modes

The plot in Figure 10 represents the modal decomposition applied to the static pressure field at the rotor casing. In the left plot, the total energy of each investigated profile is presented. Three sets of data were considered for this analysis: experimental measurements, high time- and space-resolution numerical results and low space-resolution predictions. The CFD spatial resolution downgrade aimed at reproducing the spatial discretization of the experimental measurement matrix (6 × 11 = 66 fast response sensors) to allow a relevant comparison between CFD and experimental spectra.
Low levels of total energy were observed in the front part of the three tips, up to 40% of the axial chord. At this location, the steep acceleration experienced by the gap flow over blade AC07T generated high static pressure fluctuations, i.e., an abrupt rise of modal energy. The energy peak was located at 60% c r , a x and exceeded by more than 150% the peaks experienced at 70% c r , a x by the two squealer-like geometries. This large difference was motivated by the significantly lower flow velocities reached over blades IN01D and AC06D. The low-resolution modal decomposition performed on the CFD data showed a good agreement with the experimental results, in terms of both peaks magnitude and location. The sensitivity of the modal analysis results to the spatial and temporal data discretization was therefore confirmed, while the “ranking” of the different profiles was unaffected by the resolution change.
From the energy breakdown in Figure 10b, the vane influence results significant only upstream of the rotor leading edge. From 0% to 20% of the axial chord the vane and vane–rotor modes decreased abruptly for blade IN01D, characterized by a continuous leading edge rim. A more gradual decay was observed for the open rim geometry (AC06D) and carved profile (AC07T), for which the rotor modes still constituted only 40% of the total energy content at 10% c r , a x . After 30% c r , a x , the over-tip pressure field of the three profiles was highly periodic with the rotor motion, with the vane–rotor interactions accounting only for 10% of the total energy content. The rotor-periodic fluctuations decreased at 85% c r , a x , with the carved profile showing the most significant rise of vane-related modes. The over-tip spectrum was supported by the experimental results in Figure 10c, while more significant discrepancies were found at the first and last axial stations, respectively, −5% and 105% c r , a x . The experimental vane–rotor modes appeared dumped in favour of rotor-only modes at the upstream location and of vane periodicities downstream. These inconsistencies might be due to the smaller magnitude of the pressure fluctuations outside the gap, which affected the experimental resolution of minor flow periodicities ( 0 . 5 % P 01 ).
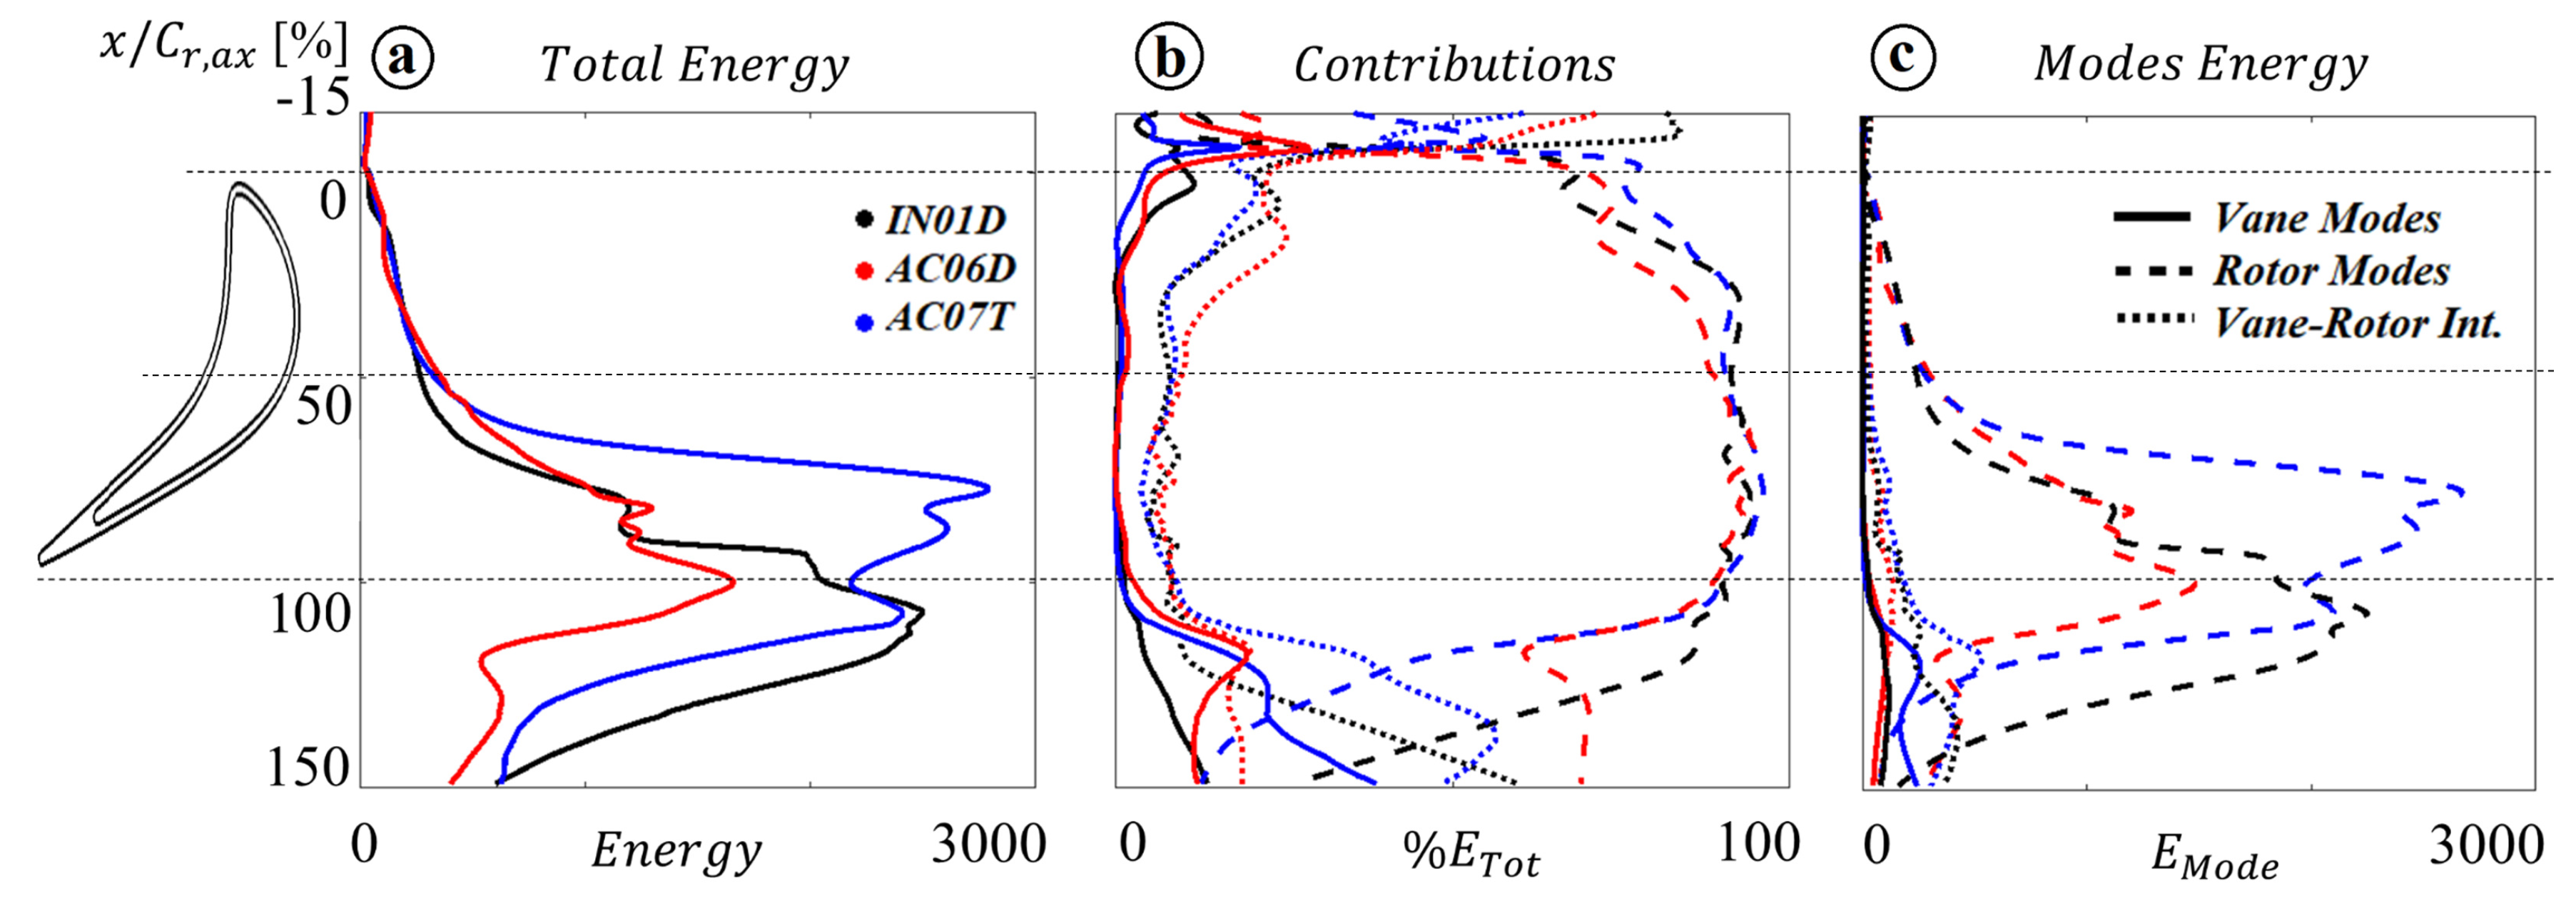
Figure 11 shows the energy spectra obtained for the time-resolved mid-gap entropy fields of the three blades. The analysis was performed between −5% and 150% of the axial chord to document the mixing process experienced by the tip leakage flow downstream of the rotor trailing edge. The three blades showed a monotonous increase of entropy energy content as the gap flow developed over the front part of the tip surface producing a rotor-periodic generation of loss. As for the pressure field, the AC07T profile exhibited the highest and earliest energy peak (70% c r , a x ), due to the very localized high entropy stream generated by the contoured surface, followed by an energy decrease towards the trailing edge. The squealer tips, on the other hand, showed an increasing trend up to 100% of the axial chord. At 90% c r , a x , blade IN01D exhibited a steep rise of rotor modes due to the upward emission of fluid from the cavity closed end, reaching the energy content of AC07T at the trailing edge station. The open-end rim of AC06D attenuated the entropy fluctuations, which resulted 25% lower in energy content with respect to the other tips.
From 100% to 150% of the chord, the baseline squealer showed a monotonous increase of vane–rotor interactions, but kept the most rotor-periodic behaviour among the three tips. For the carved tip, the rotor periodicity was observed to decrease more quickly than in the other geometries, in favour of a rapid increase of vane and vane–rotor interaction modes. Blade AC06D showed a peak of vane-related modal energy around 120% c r , a x , where the periodic spots of low entropy were observed in the time-mean entropy distribution. This trend confirmed a local dependence of the jet–leakage interaction [25] on the blade tip loading variation with the vane-relative position. More downstream, the rotor-periodicity of AC06D increased again, confirming the very steep entropy gradients observed in the tip area of the rotor-mean entropy field at 150% c r , a x (Figure 8).

3.3.2. Outlet Modes

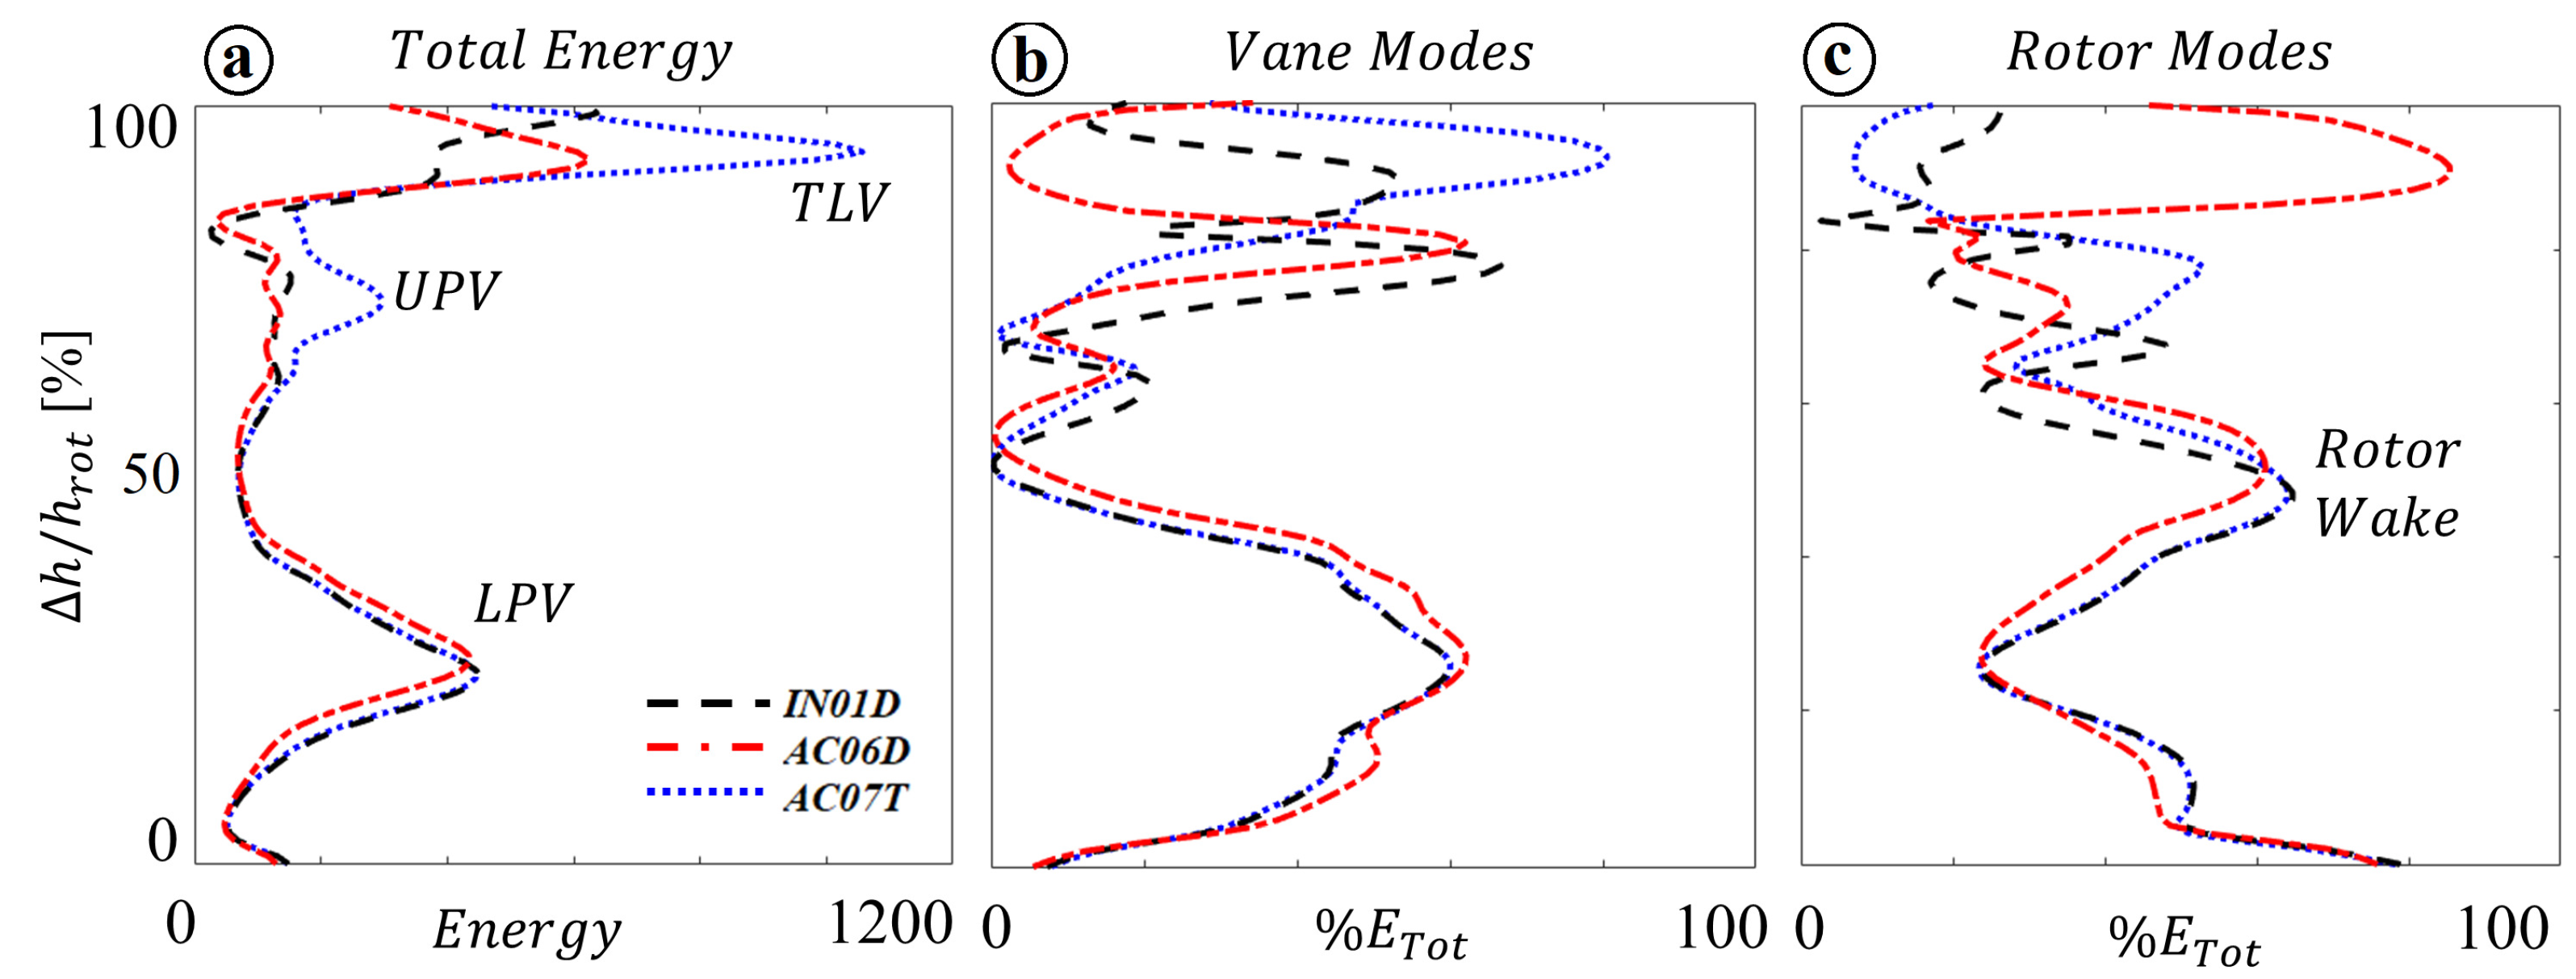
The energy spectra presented in Figure 12 show the unsteadiness content of the entropy field at 150% of the rotor axial chord. The total energy distribution (Figure 12a) indicated that the most significant entropy fluctuations were located in the near tip area for the three blades. This high-loss periodic structure was due to the tip leakage vortex, as already shown in the phase-resolved entropy contours. The magnitude of the energy peaks depended on the intensity and on the level of localization of the loss generation mechanism. Blade AC07T showed the highest entropy fluctuation of the three, mostly due to the vane-flow modulation in the loss generation process, as shown in Figure 12b. The two squealer tips reached the same maxima of total energy in the tip region, but with different radial distributions.
At 75% of the blade span, a second energy peak was detected for the three profiles. This concentrated-loss region represented the upper passage vortex. In the two squealer profiles, this high-loss structure was shown to be sensitive to the vane-relative position, while the highest degree of rotor-periodicity was observed for blade AC07T.
Between 25% and 70% h r , where the high-entropy rotor wake fluid was detected in the rotor-mean field, a high contribution of rotor modes was observed. These results seem to partially confirm the findings of Lengani et al. [27], who performed a modal analysis of the total pressure field immediately downstream of an unshrouded HP turbine stage. Rotor-only modes were seen to dominate the unsteadiness in the tip region (as for blade AC06D) and at mid-span (as for the three tips in the present study).
Moving further downwards along the blade span, the tip-to-tip differences tended to attenuate, with a high-energy region appearing around 25% h r . The high degree of vane-periodicity at this location indicated the strong modulation operated by the vane flow structures and potential field on the lower passage vortex. In agreement with this trend, an increased importance of vane–rotor interactions was reported, in the near-hub region, by Lengani et al. [27].

4. Conclusions

This paper presents a combined experimental and numerical analysis of the time-resolved flow field of an HP turbine stage mounting three different rotor tip designs.
High-frequency casing static pressure measurements validated the over-tip aerodynamic field predicted by the unsteady computations, in terms of both time-mean and phase-resolved distributions. A modal analysis was performed, highlighting the predominance of rotor-only modes in the over-tip region. The carved profile, operated at a tighter clearance, showed an energy peak in the region of maximum acceleration of the tip flow (60% c r , a x ), exceeding by more than 150% the peaks registered over the squealer-like profiles 10% c r , a x downstream. The absolute energy content was shown to be sensitive to the spatial discretization of the target flow field, while the relative modes contributions were not affected by the spatial resolution change. The modal decomposition performed on CFD and experimental data with the same spatial resolution generated congruent results.
Low mid-gap entropy levels were observed over the squealer cavities, accompanied by localized maxima over the perimetral rims. The tip flow acceleration promoted by the carved surface was associated to much larger entropy levels than those produced over the squealer tips. The tip leakage vortex was marked by high entropy stripes for all three profiles. The rear rim aperture of blade AC06D facilitated the flow bypass from the pressure to the suction side, generating a periodic jet–TLV interaction. The modal analysis showed large fluctuations in space and time over the contoured blade tip, against a gradual energy content increase along the axial chord of the squealer profiles. The entropy fluctuations were dominated by rotor-modes in the over-tip region, progressively decreasing in favour of vane-related modes downstream of the blades trailing edge.
At the outlet plane, the highest energy content was registered in the near-tip area. The tip flow established by the carved geometry was strongly modulated by vane modes, while the rear-rim aperture of blade AC06D promoted rotor-related fluctuations. The tip geometry did not affect the energy spectrum in the lower half of the blade span. In agreement with previous studies, the rotor wake was shown to be mainly rotor periodic, while the near-hub flow was significantly influenced by the vane-relative position.
In conclusion, a mutual correlation was observed between aerodynamic and entropic unsteadiness. The squealer baths generated rather uniform pressure regions, which corresponded to limited loss-generation phenomena, while the over-tip acceleration promoted by the carved profile was observed to cause steep increments of over-tip entropy. At the rotor outlet, the TLV and UPV periodicity was strongly dependent on the tip geometry, which could promote or contrast the propagation of vane-related flow structures. The mid-gap and near-hub regions, conversely, presented common flow features among the three profiles, indicating that the influence of the tip design on the stage outflow was limited to the upper 50% of the blade span.

Author Contributions

The experimental and numerical methodologies employed in this research were developed by B.C. and S.L. The original draft of the paper was prepared by B.C. and both authors contributed to the production of the final manuscript and to the review and editing process.

Funding

This research received no external funding while the APC was funded by Euroturbo.

Acknowledgments

The authors would like to thank Marek Paty for the setup of the unsteady numerical simulations.

Conflicts of Interest

The authors declare no conflict of interest.

Nomenclature

AAmplitude
α Absolute flow angle ( )
c r , a x Rotor axial chord (m)
EModal Energy
φ Rotor phase
h r Rotor blade span (m)
H P T High pressure turbine
L P V Lower passage vortex
mMode number
P 01 Stage inlet total pressure (bar)
P s Static pressure (bar)
SEntropy (J/K)
tTime
θ Vane phase
T L V Tip leakage vortex
U P V Upper passage vortex
y + Non-dimensional first cell size

References

  1. Bindon, J.P. Pressure distributions in the tip clearance region of an unshrouded axial turbine as affecting the problem of tip burnout. In Proceedings of the ASME 1987 International Gas Turbine Conference and Exhibition. American Society of Mechanical Engineers, Anaheim, CA, USA, 31 May–4 June 1987. [Google Scholar]
  2. Collins, M.; Chana, K.; Povey, T. Improved Methodologies for Time-Resolved Heat Transfer Measurements, Demonstrated on an Unshrouded Transonic Turbine Casing. J. Turbomach. 2016, 138, 111007. [Google Scholar] [CrossRef]
  3. Bunker, R.S. A Review of Turbine Blade Tip Heat Transfer. Ann. N. Y. Acad. Sci. 2001, 934, 64–79. [Google Scholar] [CrossRef]
  4. Shyam, V.; Ameri, A.; Chen, J.P. Analysis of Unsteady Tip and Endwall Heat Transfer in a Highly Loaded Transonic Turbine Stage. J. Turbomach. 2011, 134, 041022. [Google Scholar] [CrossRef] [Green Version]
  5. Hofer, T.; Arts, T. Aerodynamic Investigation of the Tip Leakage Flow for Blades With Different Tip Squealer Geometries at Transonic Conditions. In Proceedings of the ASME Turbo Expo 2009: Power for Land, Sea, and Air, Orlando, FL, USA, 8–12 June 2009; pp. 1051–1061. [Google Scholar] [CrossRef]
  6. Kwak, J.S.; Ahn, J.; Han, J.C.; Lee, C.P.; Bunker, R.S.; Boyle, R.; Gaugler, R. Heat Transfer Coefficients on the Squealer Tip and Near-Tip Regions of a Gas Turbine Blade With Single or Double Squealer. J. Turbomach. 2003, 125, 778–787. [Google Scholar] [CrossRef]
  7. Heyes, F.J.G.; Hodson, H.P.; Dailey, G.M. The Effect of Blade Tip Geometry on the Tip Leakage Flow in Axial Turbine Cascades. J. Turbomach. 1992, 114, 643–651. [Google Scholar] [CrossRef]
  8. Shyam, V.; Ameri, A. Comparison of Various Supersonic Turbine Tip Designs to Minimize Aerodynamic Loss and Tip Heating. In Proceedings of the TURBO EXPO 2011, Vancouver, BC, Canada, 6–10 June 2011; pp. 887–895. [Google Scholar] [CrossRef]
  9. Zhang, Q.; He, L. Tip-Shaping for HP Turbine Blade Aerothermal Performance Management. J. Turbomach. 2013, 135, 051025. [Google Scholar] [CrossRef]
  10. Dring, R.; Joslyn, H.D.; Hardin, L.; Wagner, J. Turbine rotor-stator interaction. J. Eng. Power 1982, 104, 729–742. [Google Scholar] [CrossRef]
  11. Joslyn, D.; Dring, R. Three-Dimensional Flow in an Axial Turbine: Part 1—Aerodynamic Mechanisms. J. Turbomach. 1992, 114, 61–70. [Google Scholar] [CrossRef]
  12. Zaccaria, M.; Lakshminarayana, B. An eXperimental Investigation of Steady and Unsteady Flow Field in an Axial Flow Turbine, NASA Contractor Report 4778, 1997. Available online: ntrs.nasa.gov/archive/nasa/casi.ntrs.nasa.gov/19970021336.pdf (accessed on 25 May 2019).
  13. Dénos, R.; Paniagua, G. Effect of vane-rotor interaction on the unsteady flowfield downstream of a transonic high pressure turbine. Proc. Inst. Mech. Eng. Part A J. Power Energy 2005, 219, 431–442. [Google Scholar] [CrossRef]
  14. Krishnababu, S.; Newton, P.; Dawes, W.; Lock, G.D.; Hodson, H.; Hannis, J.; Whitney, C. Aerothermal Investigations of Tip Leakage Flow in Axial Flow Turbines—Part I: Effect of Tip Geometry and Tip Clearance Gap. J. Turbomach. 2009, 131, 011006. [Google Scholar] [CrossRef]
  15. Thorpe, S.; Yoshino, S.; Ainsworth, R.; Harvey, N. An investigation of the heat transfer and static pressure on the over-tip casing wall of an axial turbine operating at engine representative flow conditions (II). Time-resolved results. Int. J. Heat Fluid Flow 2004, 25, 945–960. [Google Scholar] [CrossRef]
  16. Cernat, B.C.; Pátỳ, M.; De Maesschalck, C.; Lavagnoli, S. Experimental and Numerical Investigation of Optimized Blade Tip Shapes—Part I: Turbine Rainbow Rotor Testing and Numerical Methods. J. Turbomach. 2019, 141, 011006. [Google Scholar] [CrossRef]
  17. Courtiade, N.; Ottavy, X.; Gourdain, N. Modal decomposition for the analysis of the rotor-stator interactions in multistage compressors. J. Therm. Sci. 2012, 21, 276–285. [Google Scholar] [CrossRef]
  18. Sieverding, C.; Arts, T. The VKI compression tube annular cascade facility CT3. In Proceedings of the ASME 1992 International Gas Turbine and Aeroengine Congress and Exposition, Cologne, Germany, 1–4 June 1992. [Google Scholar]
  19. Paniagua, G.; Sieverding, C.; Arts, T. Review of the von Karman Institute compression tube facility for turbine research. In Proceedings of the ASME Turbo Expo 2013: Turbine Technical Conference and Exposition, San Antonio, TX, USA, 3–7 June 2013. [Google Scholar]
  20. De Maesschalck, C.; Lavagnoli, S.; Paniagua, G. Blade tip carving effects on the aerothermal performance of a transonic turbine. J. Turbomach. 2015, 137, 021005. [Google Scholar] [CrossRef]
  21. De Maesschalck, C.; Lavagnoli, S.; Paniagua, G.; Verstraete, T.; Olive, R.; Picot, P. Heterogeneous Optimization Strategies for Carved and Squealer-Like Turbine Blade Tips. J. Turbomach. 2016, 138, 121011. [Google Scholar] [CrossRef]
  22. Cernat, B.C.; Paty, M.; Lavagnoli, S. On the Unsteady Aerodynamics of a High-Speed Turbine with Squealer Blade Tips. In Proceedings of the Joint Propulsion Conference, Cincinnati, OH, USA, 9–11 July 2018; p. 4434. [Google Scholar]
  23. Kupferschmied, P.; Köppel, P.; Gizzi, W.; Roduner, C.; Gyarmathy, G. Time-resolved flow measurements with fast-response aerodynamic probes in turbomachines. Meas. Sci. Technol. 2000, 11, 1036. [Google Scholar] [CrossRef]
  24. Lakshminarayana, B. Fluid Dynamics and Heat Transfer of Turbomachinery; John Wiley & Sons: Hoboken, NJ, USA, 1995. [Google Scholar]
  25. Pátỳ, M.; Cernat, B.; De Maesschalck, C.; Lavagnoli, S. Experimental and Numerical Investigation of Optimized Blade Tip Shapes: Part II—Tip Flow Analysis and Loss Mechanisms. J. Turbomach. 2019, 141, 011006. [Google Scholar] [CrossRef]
  26. Tyler, J.M.; Sofrin, T.G. Axial Flow Compressor Noise Studies; Technical Report, SAE Technical Paper; SAE: Warrendale, PA, USA, 1962. [Google Scholar]
  27. Lengani, D.; Spataro, R.; Peterleithner, J.; Göttlich, E. Unsteady Flow Evolution Through a Turning Midturbine Frame Part 2: Spectral Analysis. J. Propuls. Power 2015, 31, 1597–1606. [Google Scholar] [CrossRef]
Figure 1. Test article: HP stage (a); rainbow rotor setup (b); and optimized rotor tips (c).
Ijtpp 04 00012 g001
Figure 2. Modal decomposition of casing static pressure field.
Ijtpp 04 00012 g002
Figure 3. Time-resolved casing static pressure over a rotor blade pitch: numerical and experimental results.
Ijtpp 04 00012 g003
Figure 4. Contours of experimental (top) and numerical (bottom) normalized P s / P 01 in the rotor-relative frame.
Ijtpp 04 00012 g004
Figure 5. Contours of time resolved mid-gap entropy in the vane frame for (top to bottom): IN01D, AC06D, and AC07T.
Ijtpp 04 00012 g005
Figure 6. Contours of time-average mid-gap entropy in the vane frame for (left to right): IN01D, AC06D, and AC07T.
Ijtpp 04 00012 g006
Figure 7. Time-average pitch-average radial distributions of P 03 / P 01 (a) and absolute outlet flow angle (b) for the three tip profiles.
Ijtpp 04 00012 g007
Figure 8. Contours of phase-resolved outlet entropy in the rotor-relative frame.
Ijtpp 04 00012 g008
Figure 9. Contours of time-average outlet entropy in the vane frame of reference.
Ijtpp 04 00012 g009
Figure 10. Modal decomposition of over-tip casing static pressure field: total energy (a) and relative energy spectra from numerical predictions (b) and experiments (c).
Ijtpp 04 00012 g010
Figure 11. Modal decomposition of mid-gap entropy field: total energy (a); mode contributions (b); and mode absolute energy spectra (c).
Ijtpp 04 00012 g011
Figure 12. Modal decomposition of rotor outlet entropy field: absolute total energy (a), vane (b) and rotor (c) modes.
Ijtpp 04 00012 g012