During several foregoing measurement campaigns, deviations between results of 5HP and total pressure rakes could be observed, especially in the measurement plane downstream of an HP rotor. For this reason, measurements were carried out using a 5HP, a total pressure rake and a FRAPP to be able to get a deeper insight into the reasons for these deviations. All of the measurements were performed during one test run at the same circumferential and the same radial measurement positions.
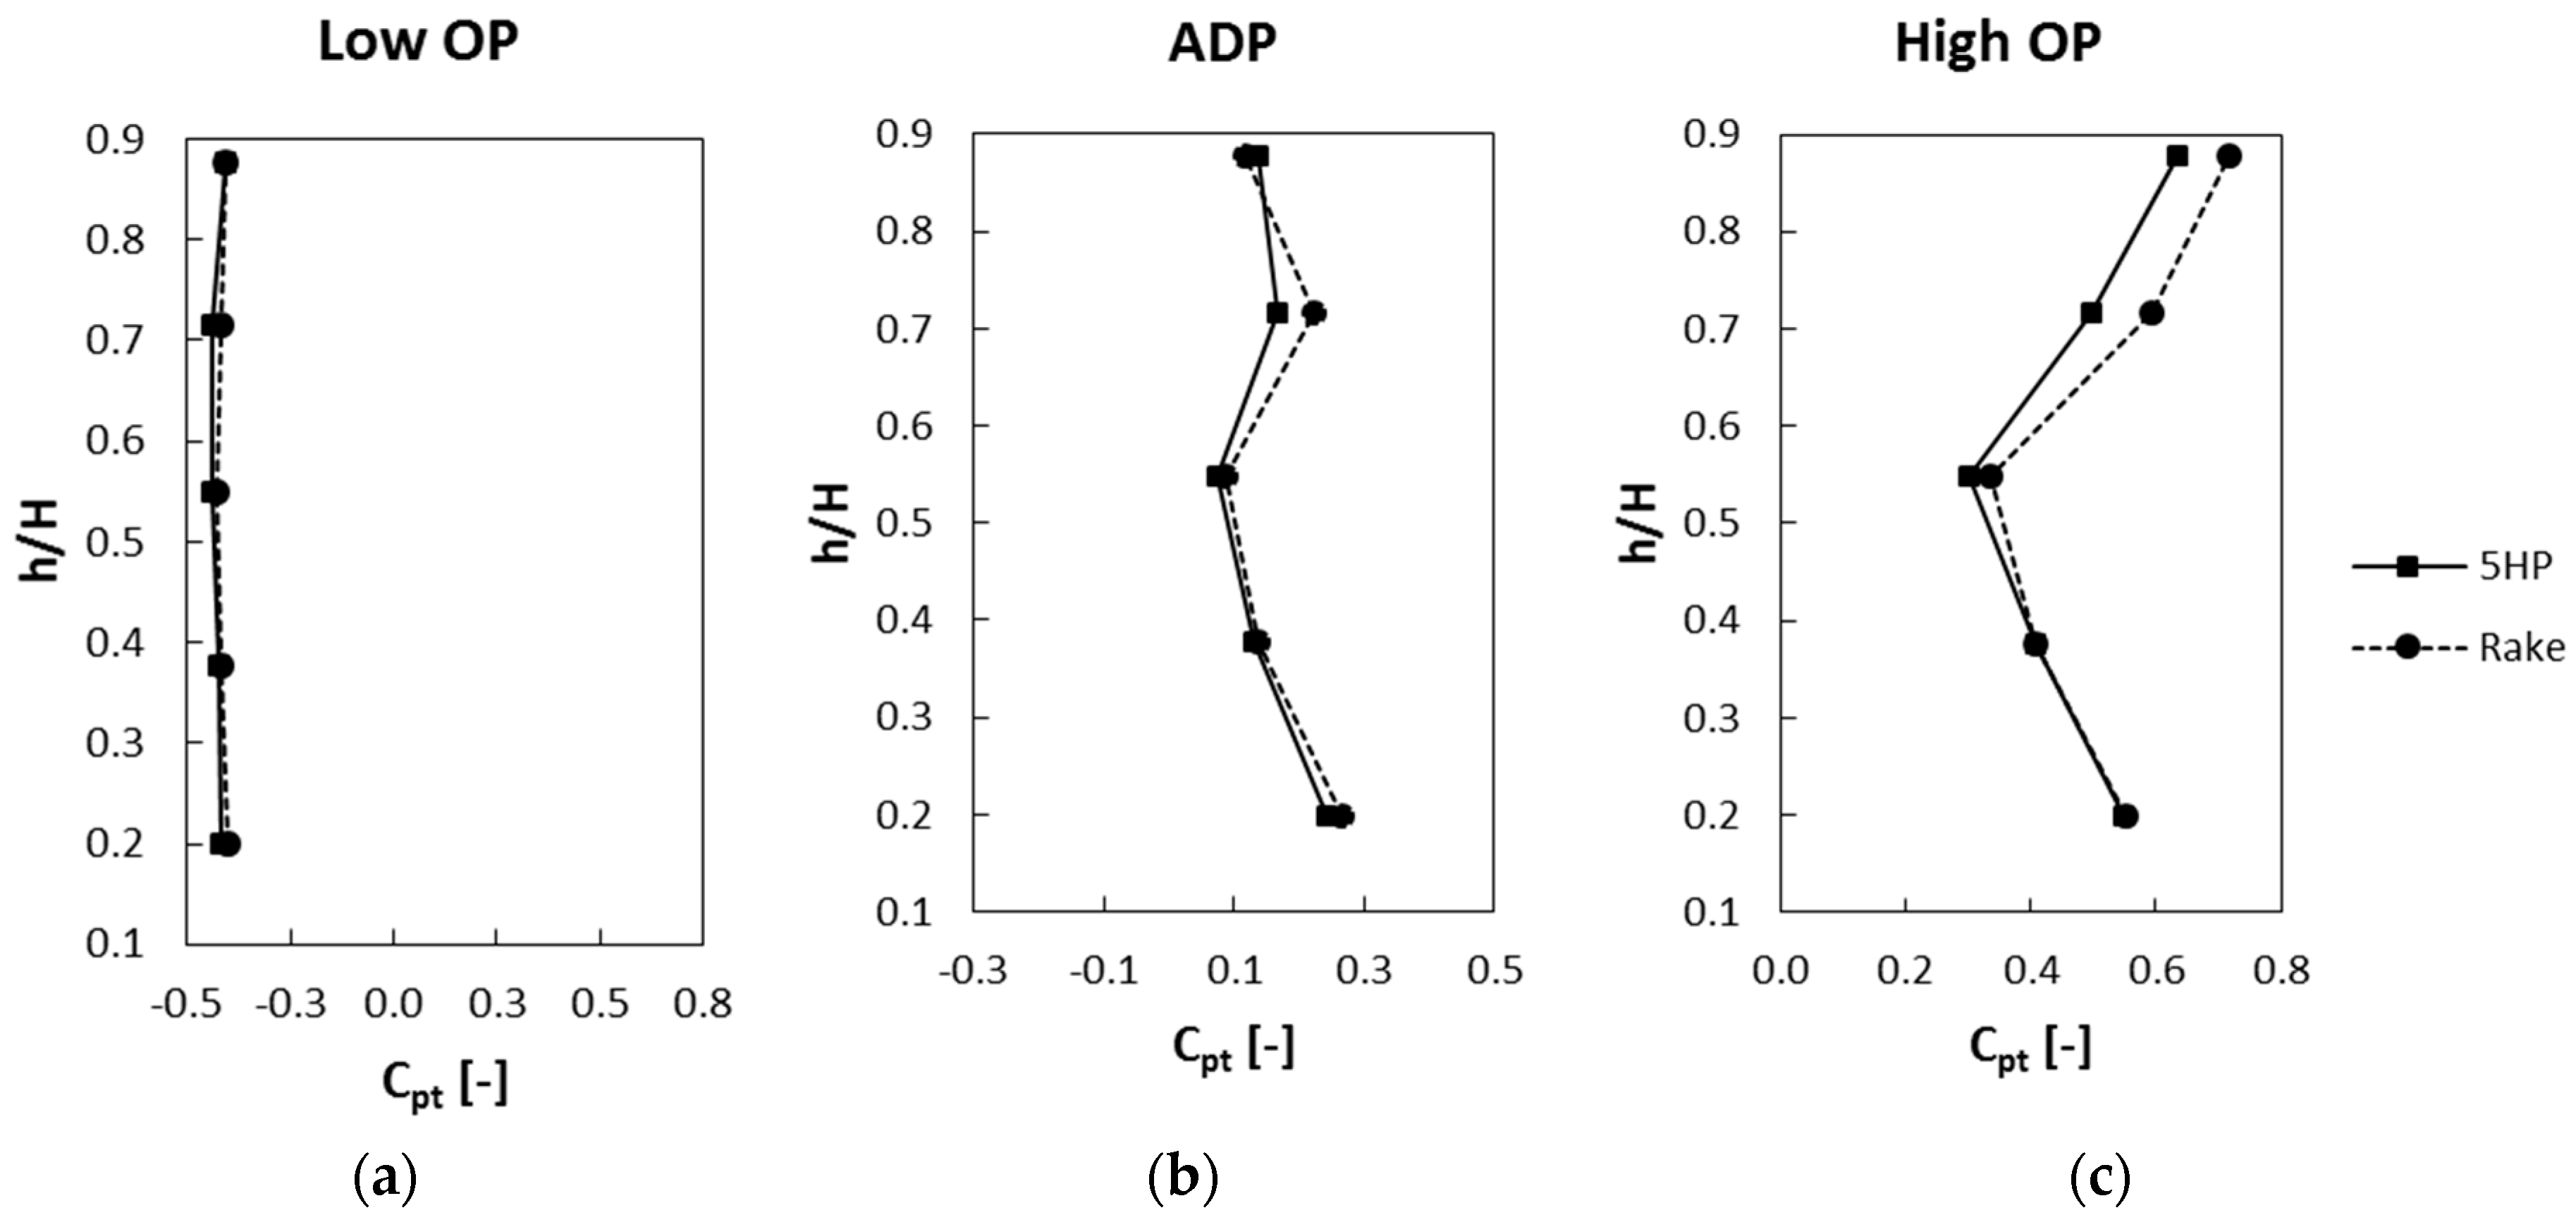
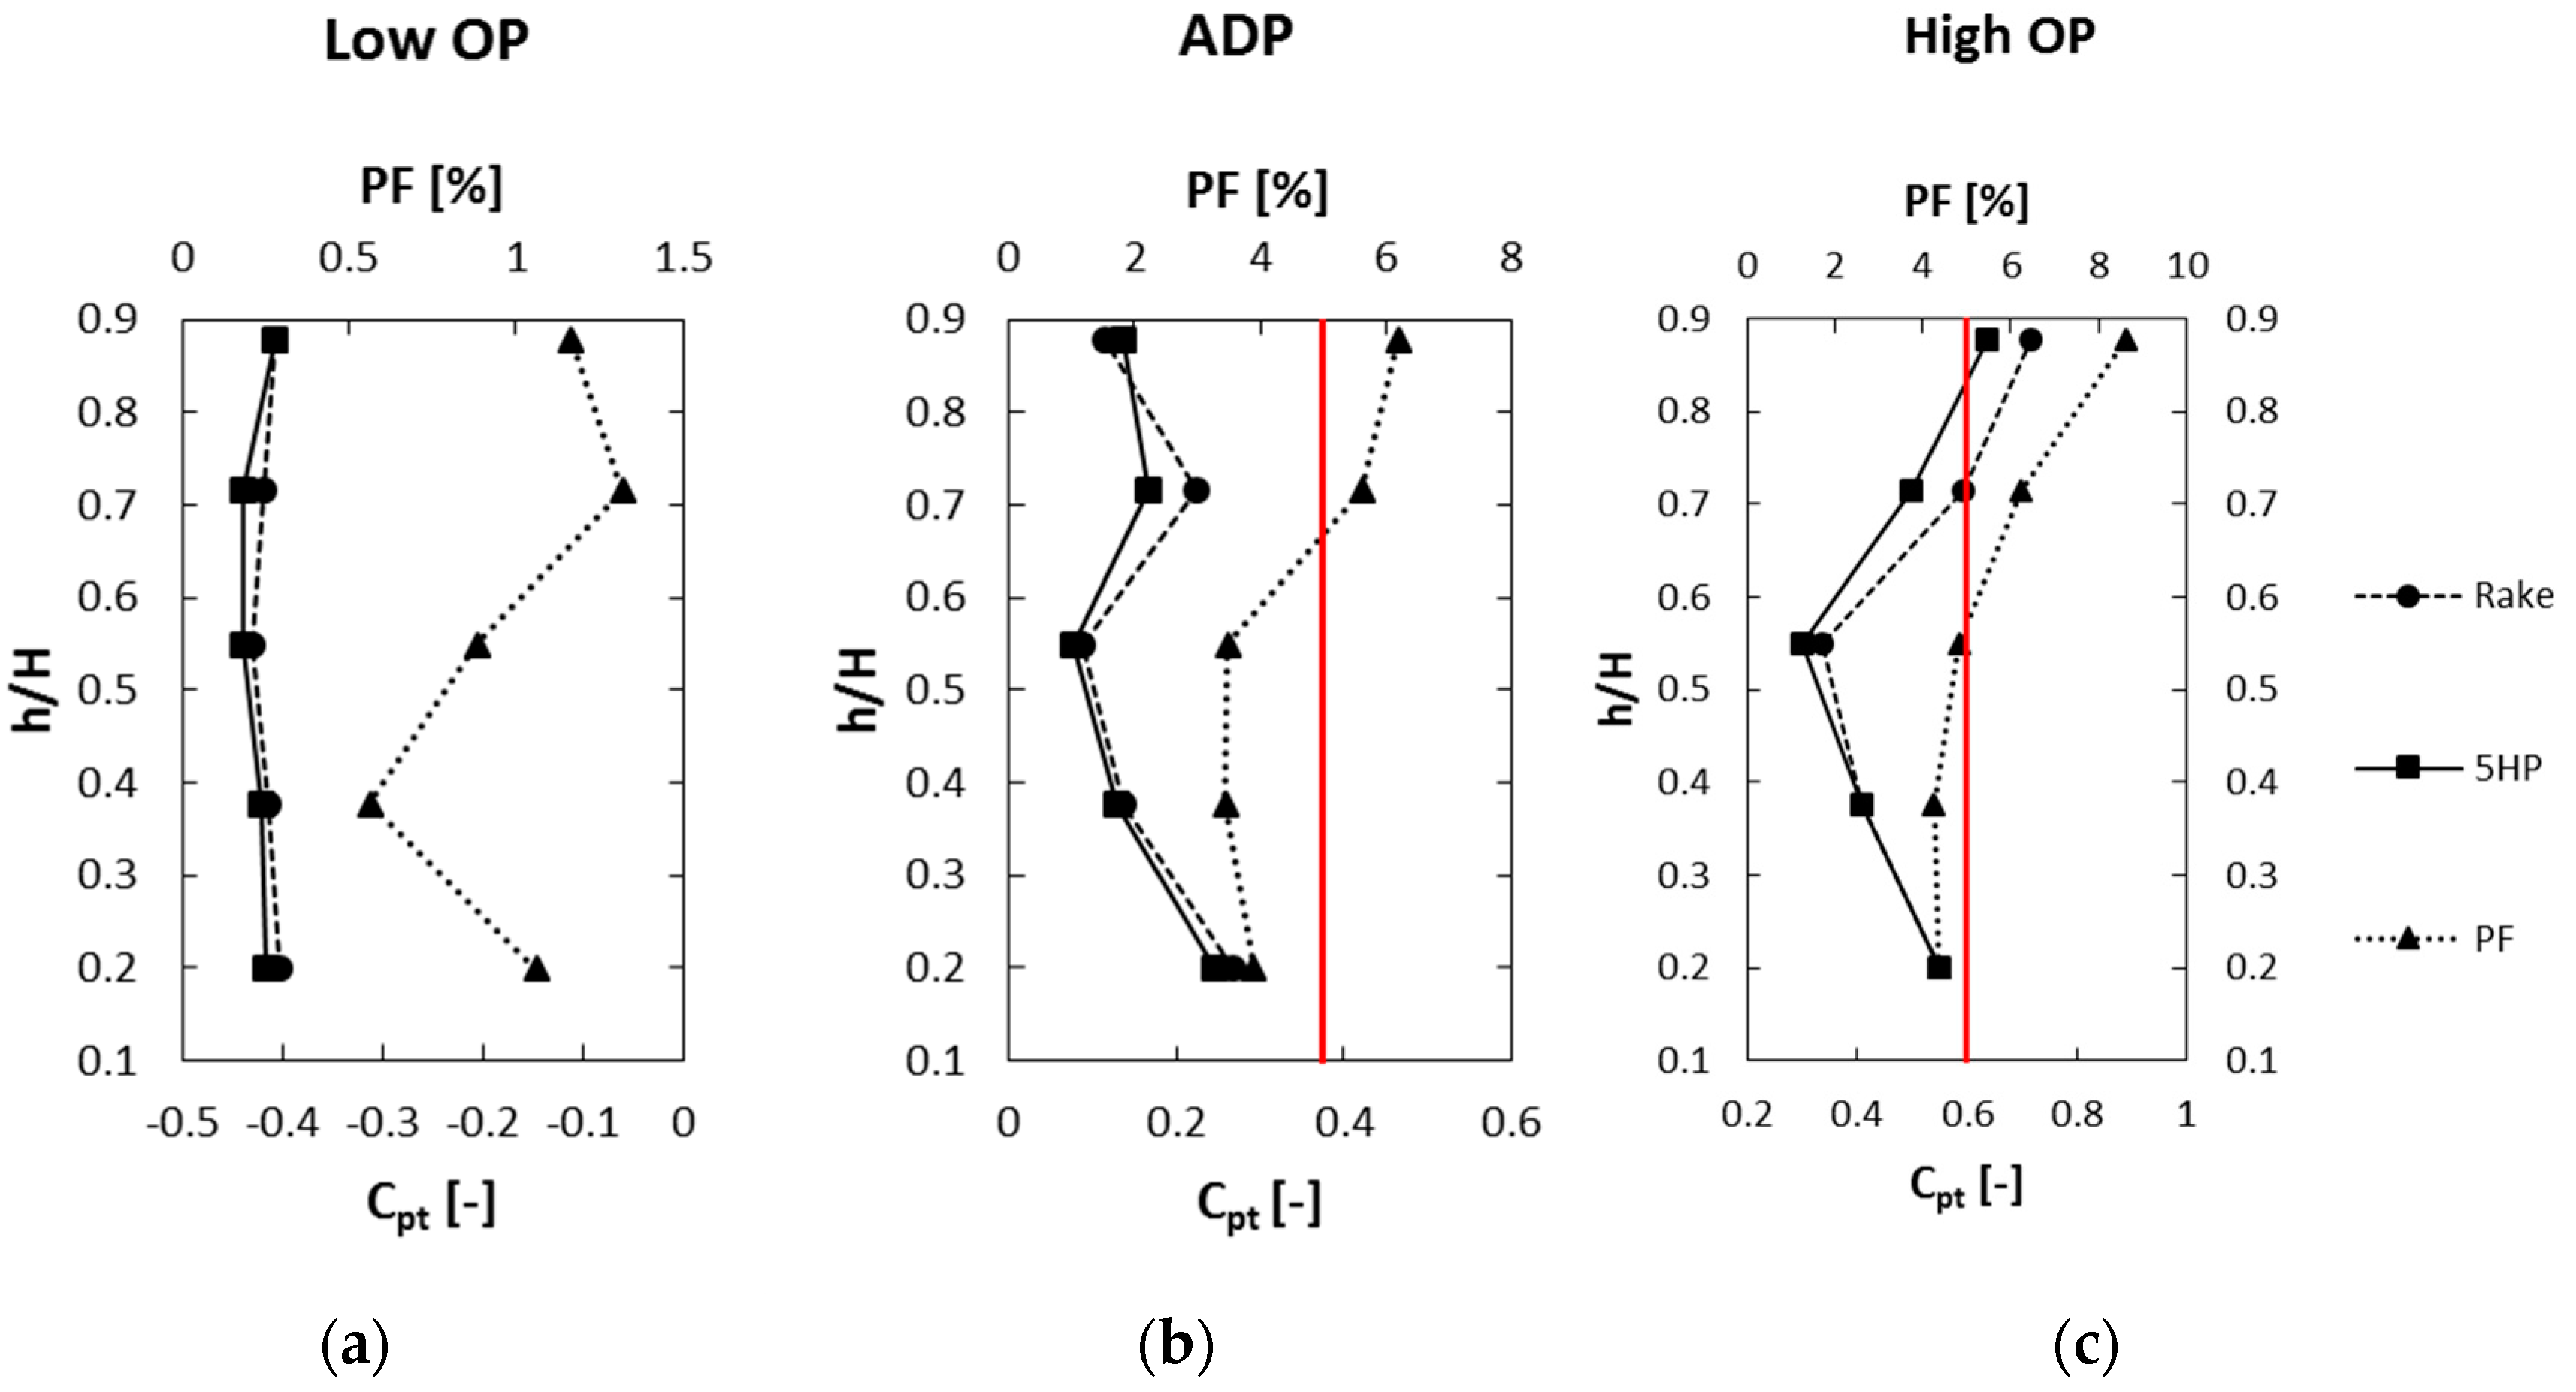
Figure 2 shows the comparison of the total pressure coefficient between 5HP and rakes for three different operating points, which were already described in the
Section 2.1. On the one hand, it can be seen that the pressure level increases significantly when going from the lowest to the highest operating point. On the other hand, the difference between 5HP and rake results also gets considerably larger, especially for the measurement points in the upper half of the flow channel. While 5HP and rakes show identical results for the lowest operating point, the two measurement techniques start to deviate from each other with increasing mass flow, pressure ratio (PR) and rotational speed. To make this even clearer, the same scaling was used for the abscissa in all three diagrams. In the following, every radial measurement point got a name starting with measurement point (MP) 1 at the inner channel wall and ending with MP 5 at the outer channel wall.
This was also done in order to make sure that the deviations in total pressure distribution between different pneumatic probes really originate from high amplitudes of stochastic fluctuations and high turbulence (as assumed a priori), respectively, and that the results are not dominated by the influence of other parameters.
6.1. Amplitude and Frequency of Pressure Fluctuations
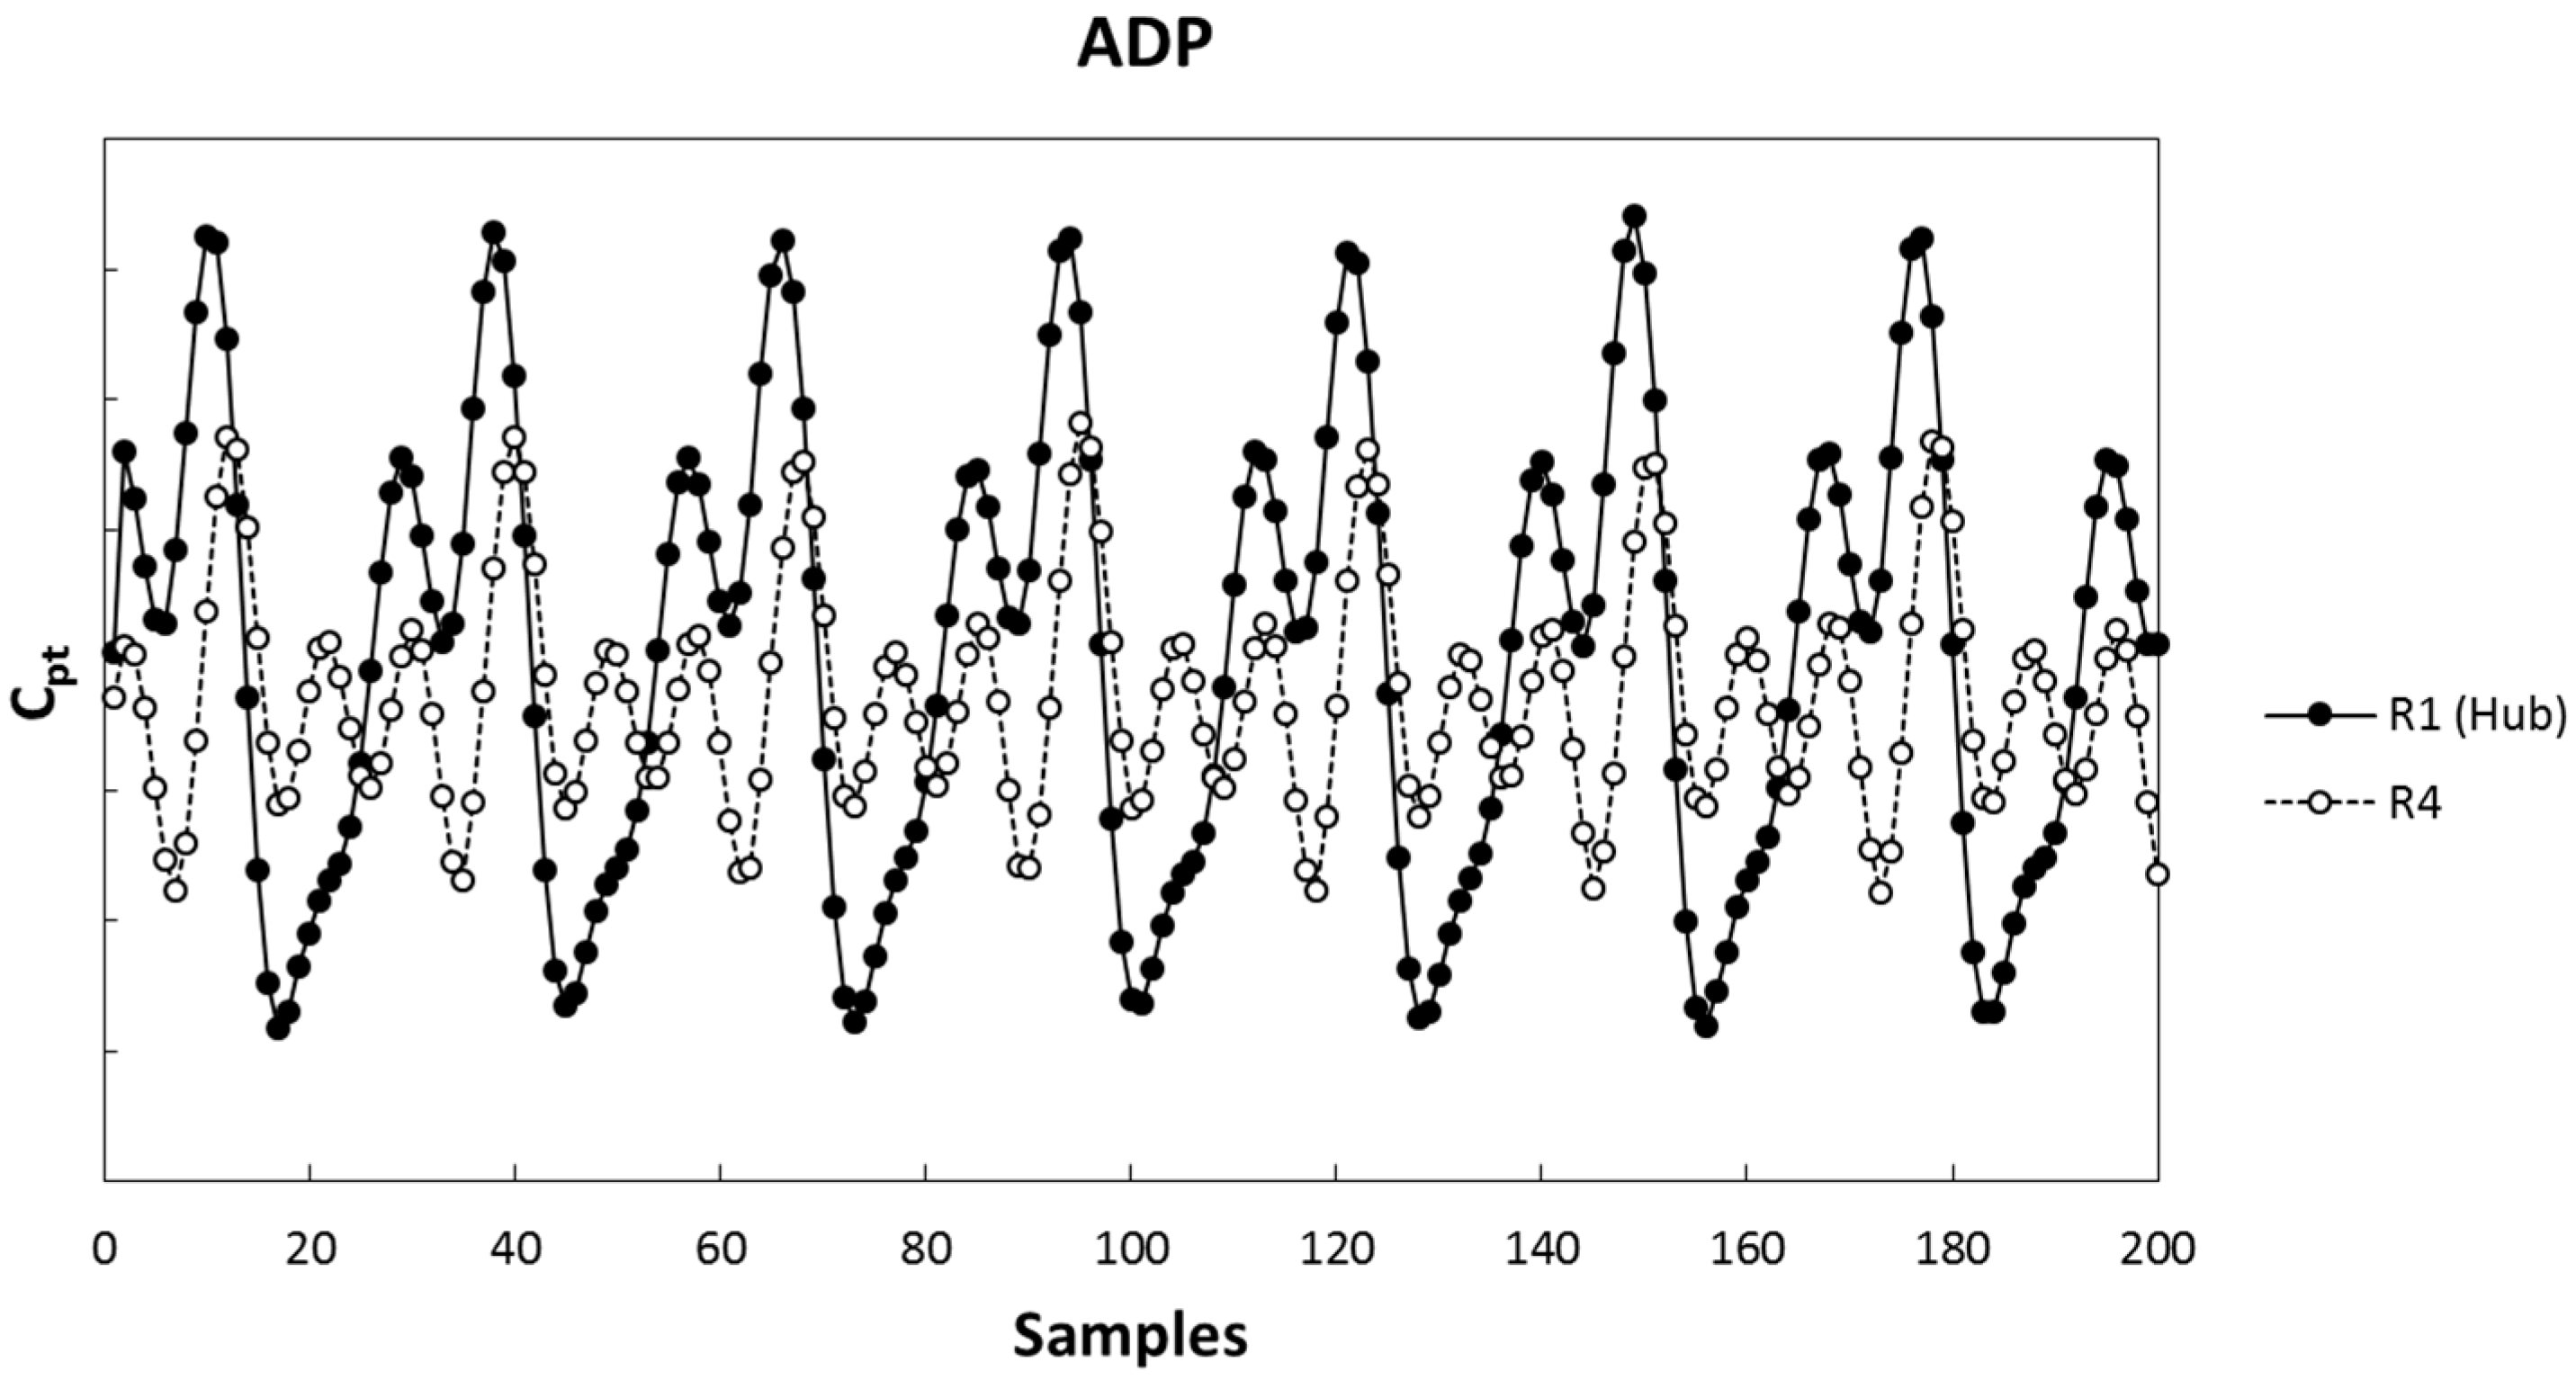
Figure 3 shows the time resolved total pressure coefficient for a certain number of samples obtained from the FRAPP measurement for two radial measurement points at operating point ADP. The results represent the periodic component of the signal, which is obtained through phase averaging of the signal, where the stochastic fluctuations are averaged out. As shown in
Figure 2, the largest deviation between 5HP and rake was observed at MP 4. At this point, the amplitudes of the periodic pressure fluctuations are significantly smaller compared to those at MP 1, where the difference between 5HP and rake results is negligible. This means that the amplitude of the periodic part of the signal does not seem to influence the measurement result depending on the shape of the probe head. The same is true for other radial points and operating conditions but is not shown here due to space reasons.
Besides the different amplitudes,
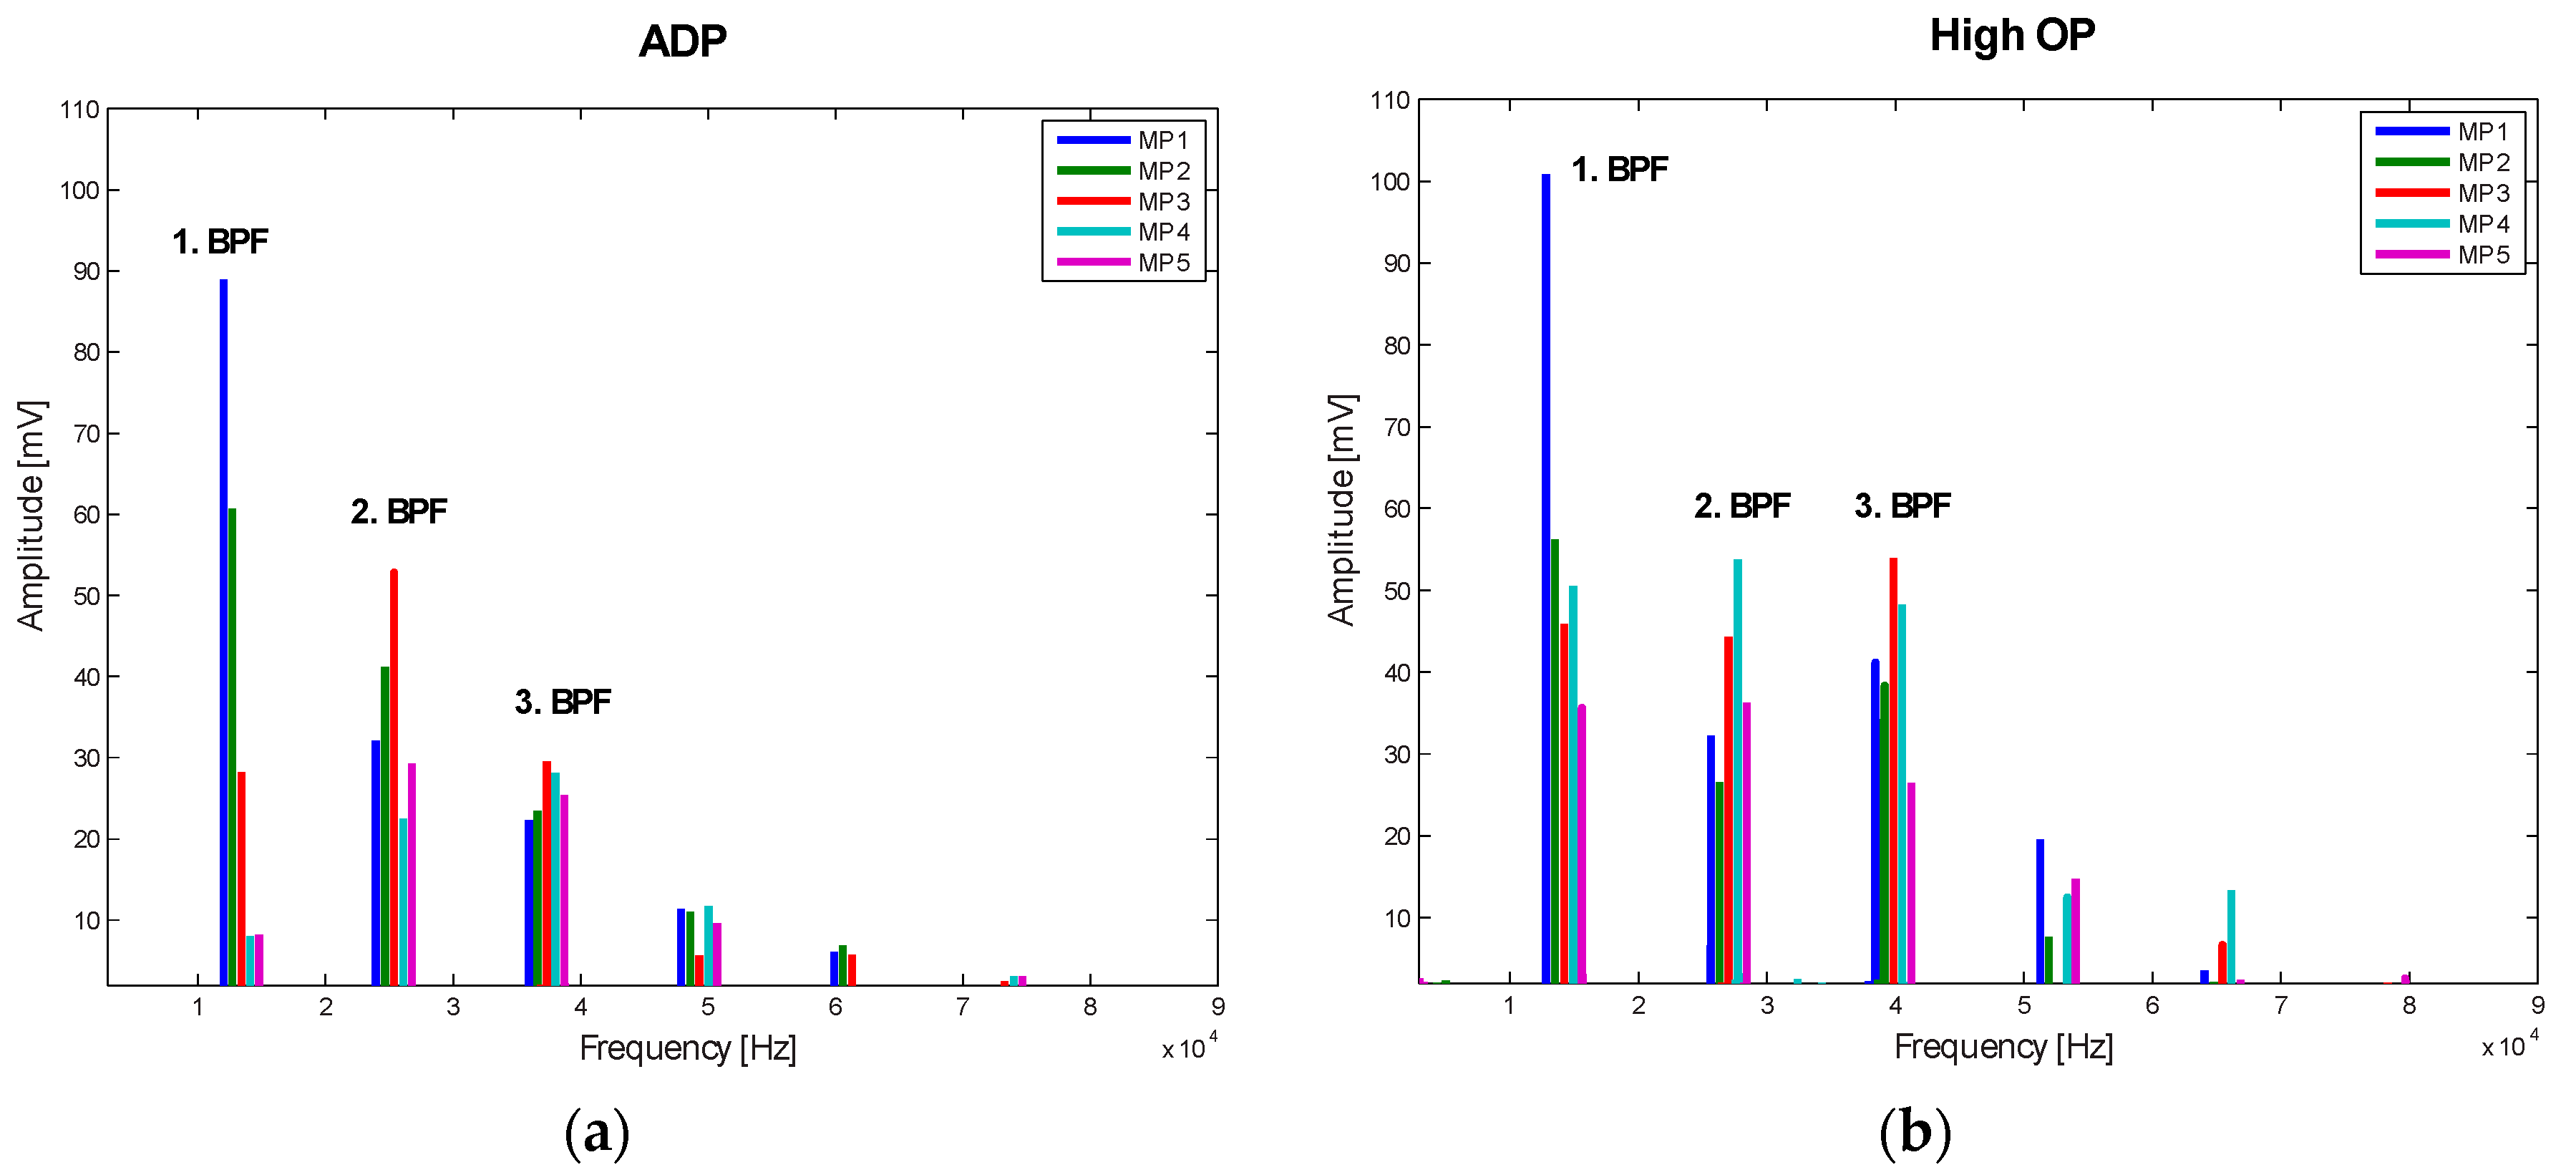
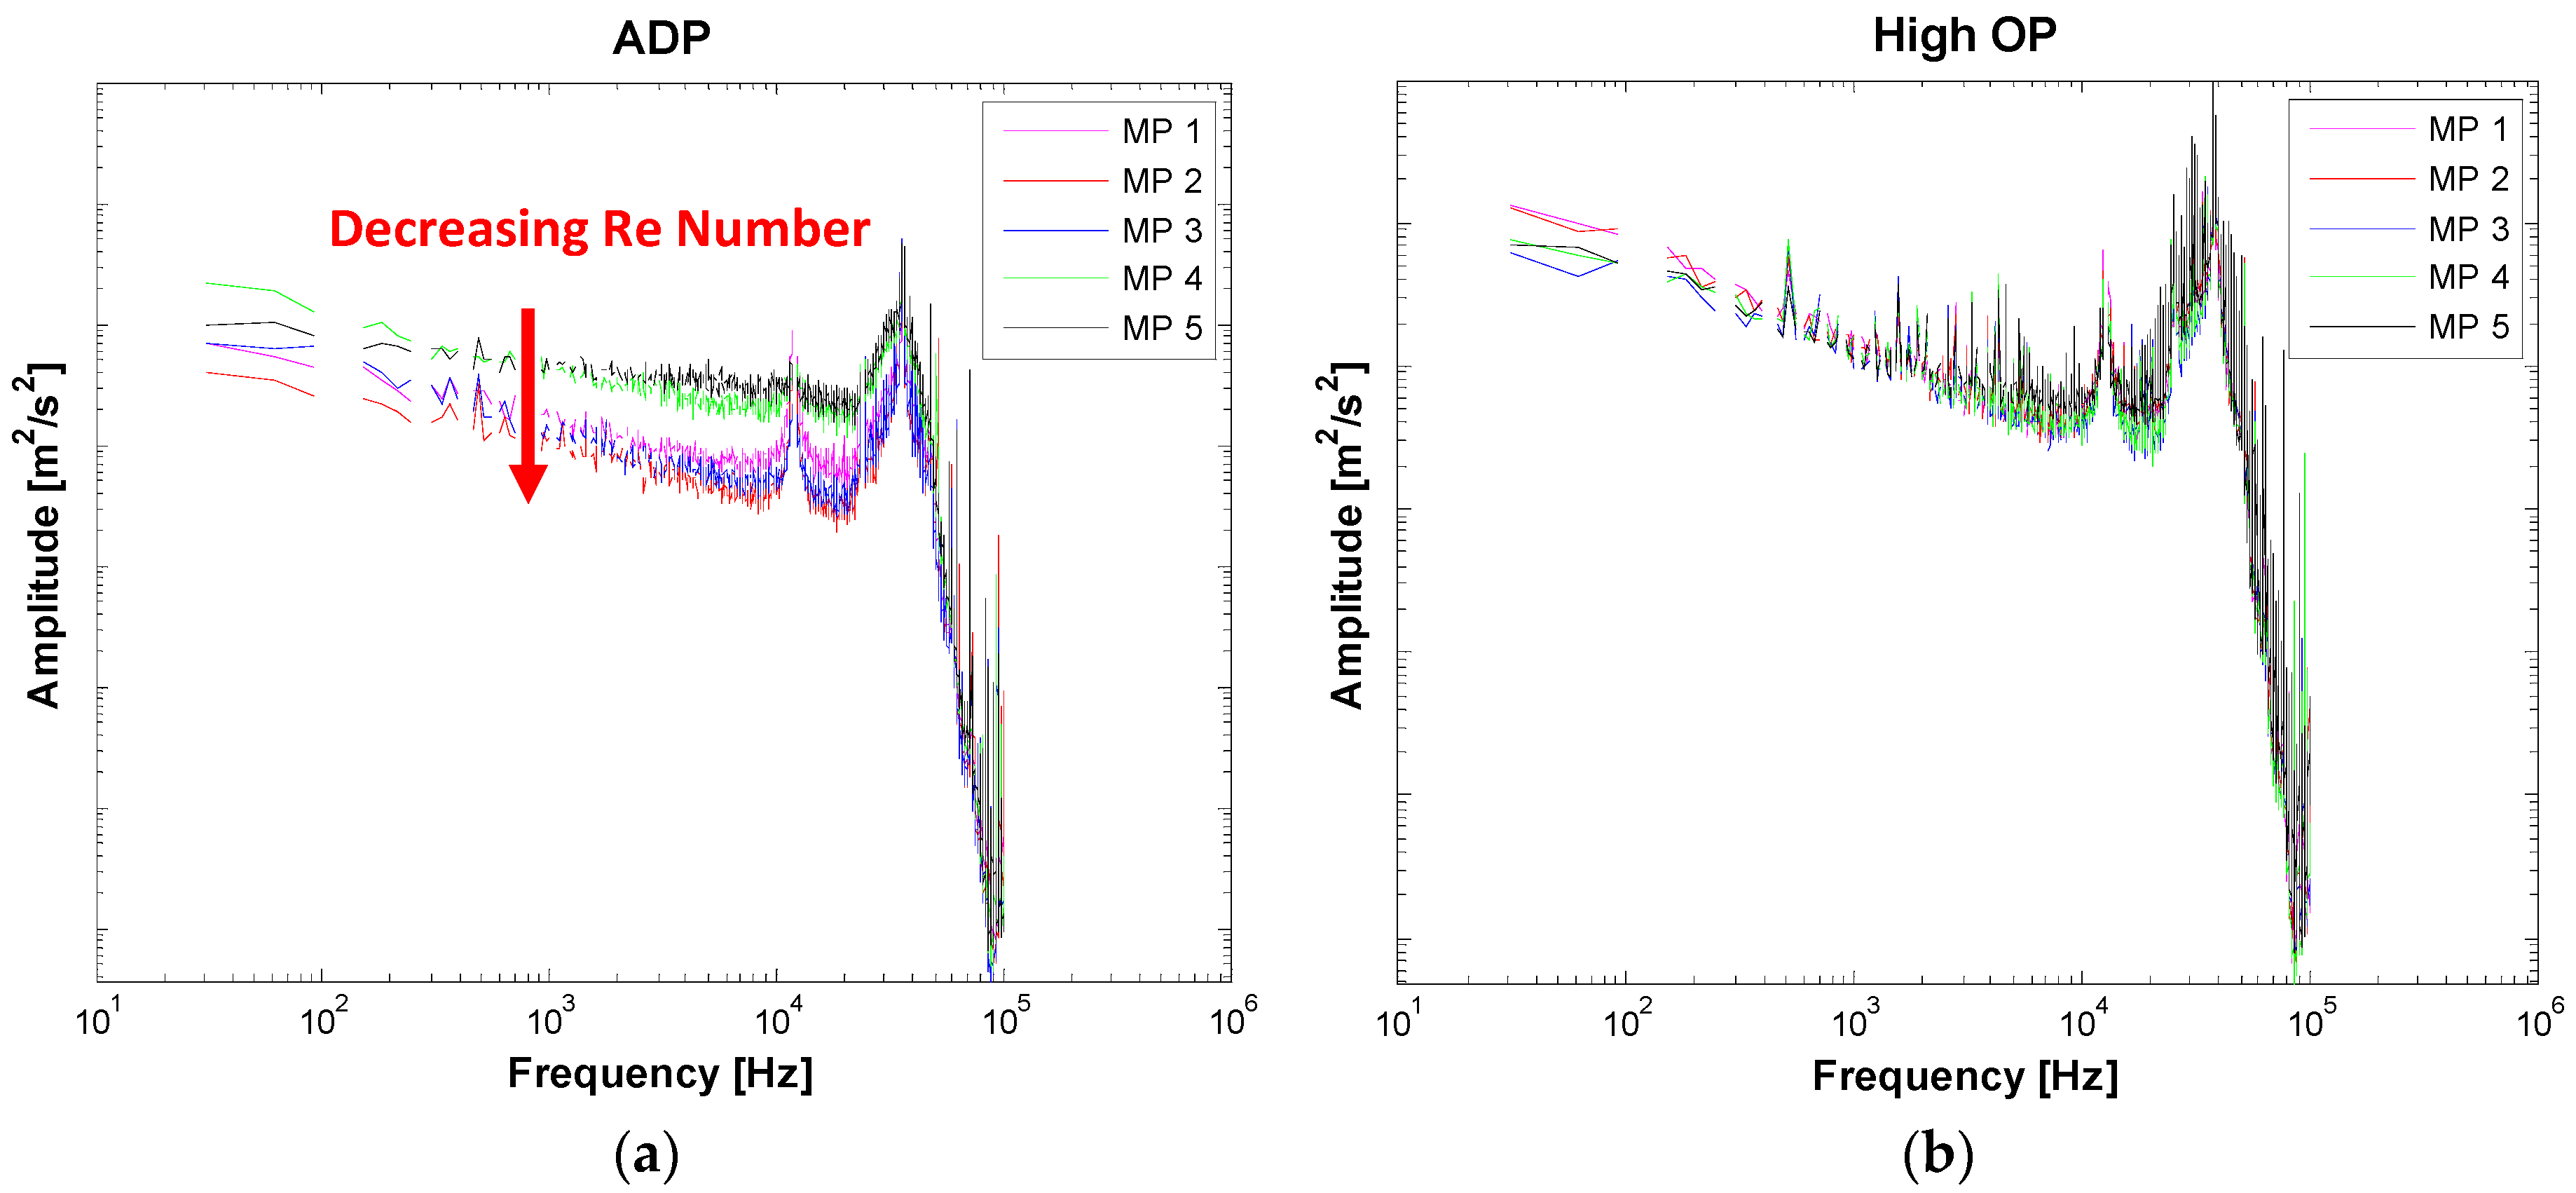
Figure 3 leads to the assumption that there is a difference between MP 1 and MP 4 concerning the frequency content. Therefore, an FFT of the raw signal originating from FRAPP measurements was performed. The signal contains both periodic and stochastic parts but is clearly dominated by peaks at the BPF and its harmonics. This is why the stochastic part of the signal cannot be seen in the two plots in
Figure 4, although they are actually present. The spectrum for ADP (
Figure 4) shows that the pressure signal at MP 4 is really dominated by a higher frequency content with the highest peak at the third harmonic of the BPF. MP 1 and MP 2, where the differences between 5HP and rake results are negligible, have the highest peak at lower frequencies.
However, MP 3 shows good agreement between the different measurement techniques at ADP, but, nevertheless, the signal at this radial point is composed of higher frequency components with a significant peak at the second BPF. Similar findings can be made for the higher OP: only MP 1 has the largest peak at the first BPF. For all of the other measurement points, peaks with very similar amplitudes can be found at the first, the second and the third BPF. At some of these points, the 5HP and rake results differ significantly from each other, but, at MP 2, the difference is negligibly small, although the signal mainly consists of higher frequencies at this point. To sum up, no clear correlation between the frequency content of the signal and the deviations between the results of different measurement devices can be found, which leads to the assumption that the frequency content of the signal does not seem to influence the result considerably.
6.2. Reynolds Number
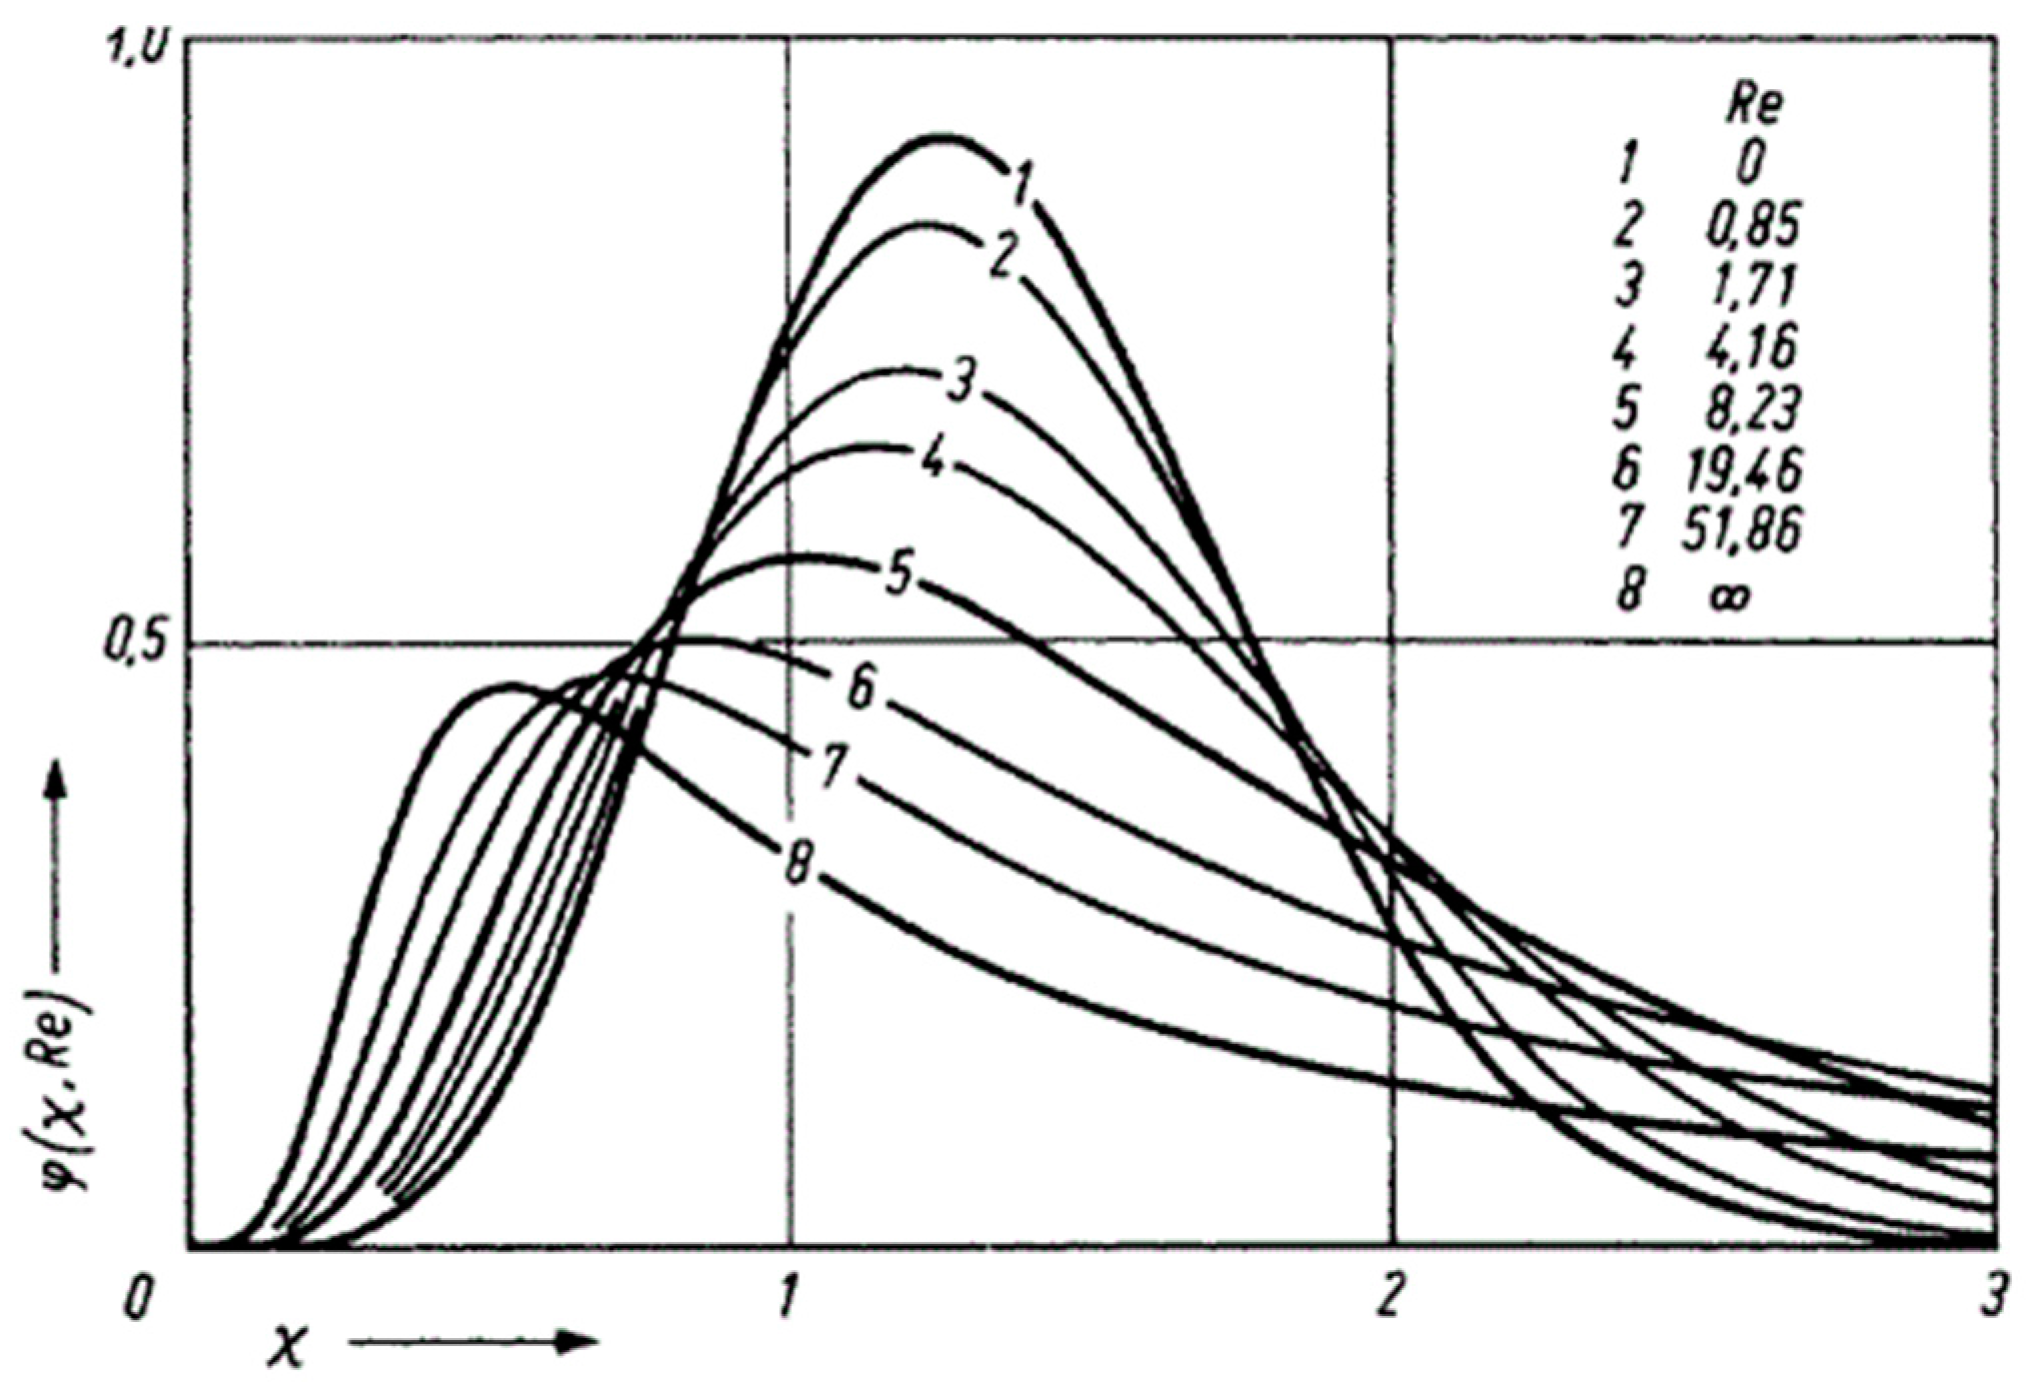
According to Rotta [
10], different Reynolds numbers of the flow result in different amplitudes of the energy spectral function, which was calculated using the average of the squared flow velocity assuming isotropic turbulence (see
Figure 5). In this figure, the abscissa is represented by a dimensionless value calculated from the wave number times an integral length scale. The ordinate corresponds to a dimensionless function, which depends on the Reynolds number and on
χ . This dimensionless function is calculated from Equation (4), whereas
is the energy spectral function. The
Re number is given as
:
As one can clearly see, the amplitude of the spectral function decreases with increasing Reynolds number. Assuming that the turbulent length scale and the kinematic viscosity stay constant, only a change in flow velocity can change the
Re number significantly. If the velocity increases, the
Re number increases and so does the energy
, but the function
decreases (see
Figure 5).
Based on this theoretical approach by Rotta, results from unsteady pressure measurements with FRAPP were used to obtain a comparable data representation as shown in
Figure 5. For this reason, the velocity fluctuations were calculated from the pressure fluctuations using the method given by Persico et al. [
11]. In order to get the energy and intensity of the velocity fluctuations, respectively, the Root Mean Square (RMS) value of the velocity was calculated comparable to Rotta. When plotting now the intensity over the frequency as it was done in
Figure 6, the amplitude is larger for high velocities, which corresponds to higher
Re numbers. This result is also in accordance with other publications like Rodriguez et al. [
12]. The peaks originating from the periodic parts of the signal are still clearly visible in both plots of
Figure 6.
Especially in the plot for ADP, a small difference in amplitude and therefore Reynolds number depending on the radial measurement positions is depicted. When regarding the spectrum for ADP, one may assume that higher
Re numbers lead to discrepancies between the results of different pneumatic probes, as the two radial points with the largest differences (MP 4 and MP 5) also have the highest
Re number as shown in
Figure 6. However, this assumption is proved wrong when regarding the spectrum for the high OP, where the
Re number seems to be very similar for each radial point, but, according to
Figure 2, significant differences in total pressure occur for MP 3, MP 4 and MP 5. Again, no relation between
Re number and deviations in measurement results could be determined, which also corresponds to the findings of Arts et al. [
9], who just found influences on Pitot probe measurements for very low
Re numbers, which usually do not occur in a turbomachine like the currently presented.
6.3. Velocity Gradients and Wall Proximity Effects
Especially in the region of the tip leakage vortex, the total pressure rake (and also the 5HP) sees a large velocity gradient. According to Arts et al. [
9], a strong transverse pressure gradient causes a measurement error due to two effects. The first one is the integration of velocity over the orifice and the second more important one is the deflection of streamlines due to the presence of a probe. Both effects lead to an increase in total pressure measured by a Pitot probe. It was assumed by the authors that, in the Kielhead of a total pressure rake, the mixing process due to the velocity gradient is more pronounced than in a Pitot probe, as the Kielhead is significantly larger than the opening of a Pitot probe. Therefore, the pressure after the mixing of two streams was estimated using the formulae given by Denton [
13]. For this estimation, the flow into the Kielhead was divided into two streams with constant total temperature and total pressure according to the same gradient that was seen in the measurement data. It was found considering that a mixing process leads to total pressure values that are lower than the arithmetically averaged total pressure value of the two streams. This may be a possible explanation for the trend seen for MP 5 at ADP: the difference between the two measurement techniques is smaller compared to MP 4. It is not as clear for the high OP, but, still, the trend can be seen that the deviation between 5HP and the rake is smaller at MP 5 than at MP 4 with lower values for the rake than expected.
Concerning the wall proximity effects, no influence could be found, as both the Kielhead close to the inner and the one close to the outer casing are located far enough from the walls (see Arts et al. [
9]). The same is of course valid for the 5HP measurement positions.
6.4. Stochastic Pressure Fluctuations/Turbulence Intensity
As seen in the foregoing sections, the stochastic pressure fluctuations and the turbulence intensity, respectively, seem to be to most influencing factor concerning increased measurement uncertainty and deviations between pressure readings of differently shaped probes.
Figure 7 shows the stochastic pressure fluctuations as a percentage of the average pressure value in the regarded plane (see Equation (3)) after applying Fourier Filtering. The radial line is shown for the three operating points, and, regarding the three plots, the assumption that the amplitude of the fluctuations gets higher with increased mass flow, pressure ratio and rotational speed is confirmed. For the low OP, the percentage fluctuation (PF) values are very small, but also the deviations between 5HP and the rake are negligible. It seems that, from a certain value, which is marked by the red line at about 5% PF, the deviations between 5HP and the rake start to become significant.
Several authors like Bennett [
14] or Goldstein [
15] already noted that the correct formulation of the measured total pressure is the one according to Equation (5). For reasons of simplicity,
was neglected and the fluctuations were just considered in two spatial directions. Therefore, the measured value of total pressure is composed of the static pressure, the average value of the flow velocity as well as the stochastic velocity fluctuations in two spatial directions. After some rearrangements, the difference
between the measured total pressure and the total pressure according to theory
depends on the flow velocity but also on the turbulence intensity. Using the formulae given by Persico et al. [
11], it is possible to calculate the stochastic velocity fluctuations from FRAPP results and insert them into Equation (7):
Bennett [
14] goes even further and introduces a factor
in relation with the measured dynamic pressure consisting of a steady and unsteady part. He also formulates the static pressure as a sum of an average value and a fluctuating part:
The author relates this coefficient to individual probe response. As total pressure rakes and 5HP have a different shape and different probe response, this factor could explain the difference between the two probes. According to him, these coefficients have to be determined by an appropriate (unsteady) calibration.
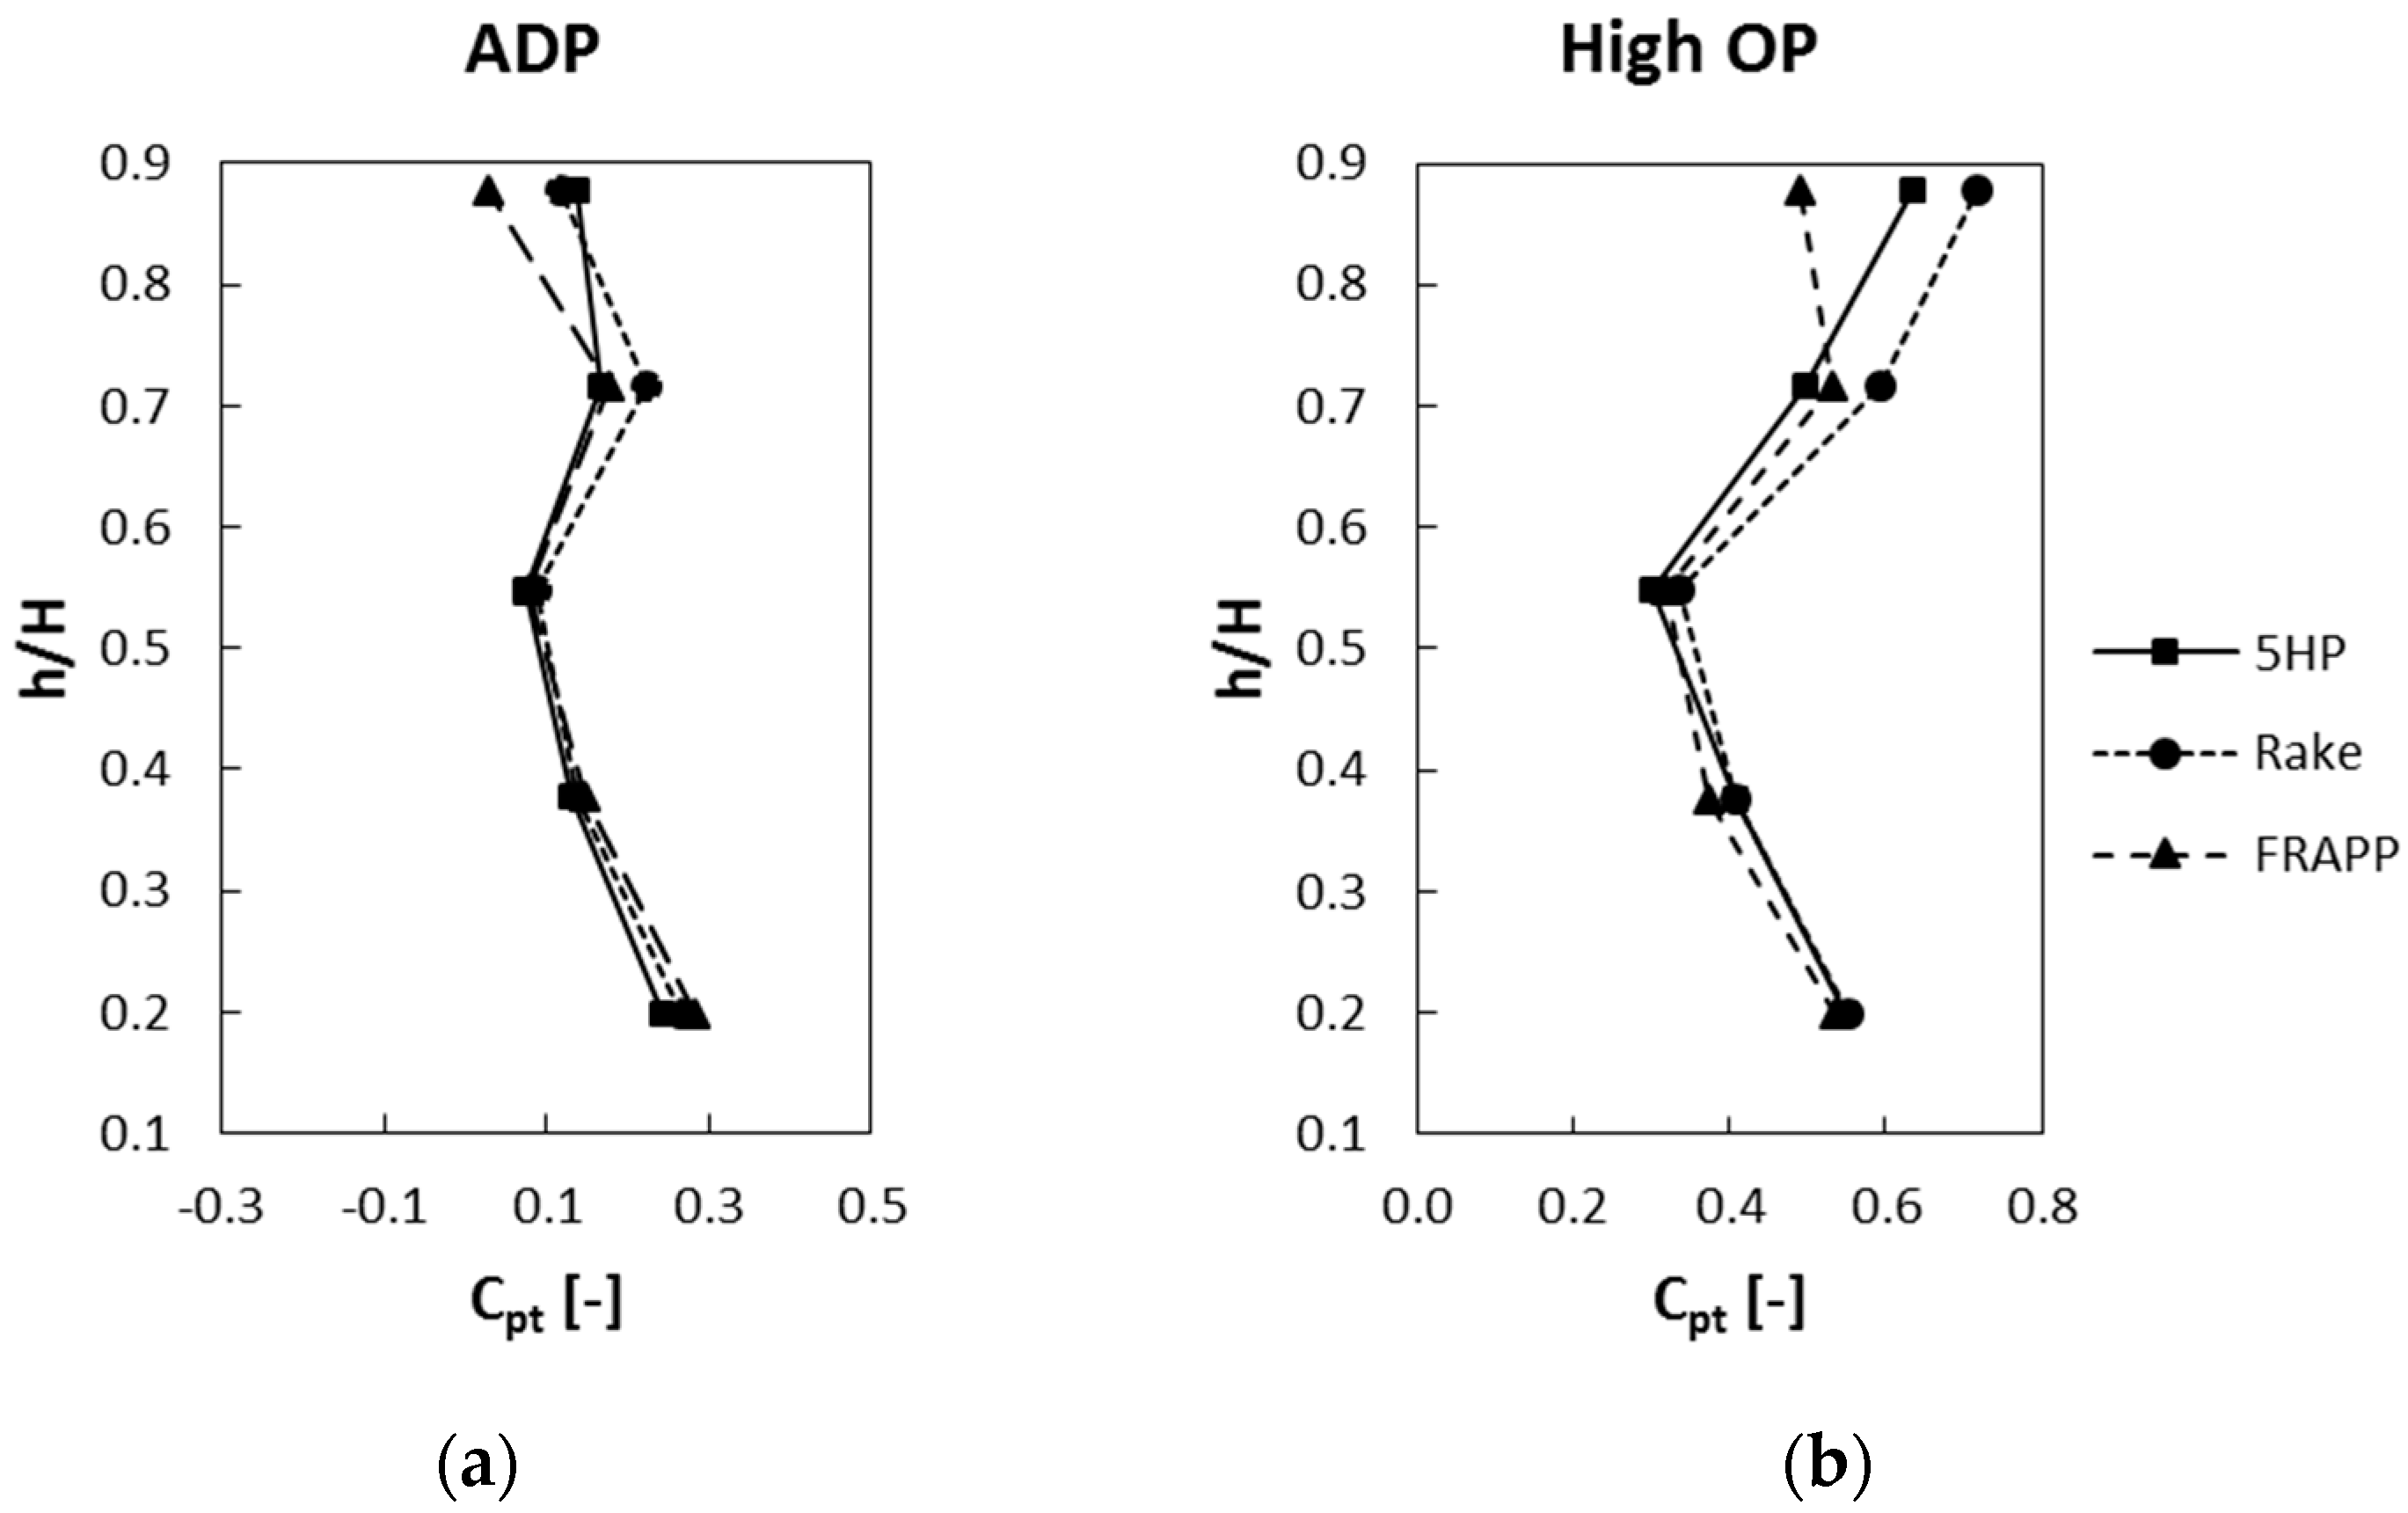
Bennett’s and Goldstein’s findings are reinforced by
Figure 8, where 5HP and rake measurements are compared to time averaged results of a FRAPP probe. The FRAPP results are shown after phase averaging, which means that the stochastic fluctuations have been averaged out and the problem with the influence of Tu on the measured value is eliminated. It seems that the 5HP is getting pretty close to the results of the FRAPP, except for the region of the tip leakage. Concerning the rake results, the deviations are significantly larger compared to those of the FRAPP, especially at the measurement points with higher turbulence. Again, this supports the theory presented by Bennett that the measured total pressure depends, amongst others, on a coefficient
, which, in turn, depends on the probe geometry.
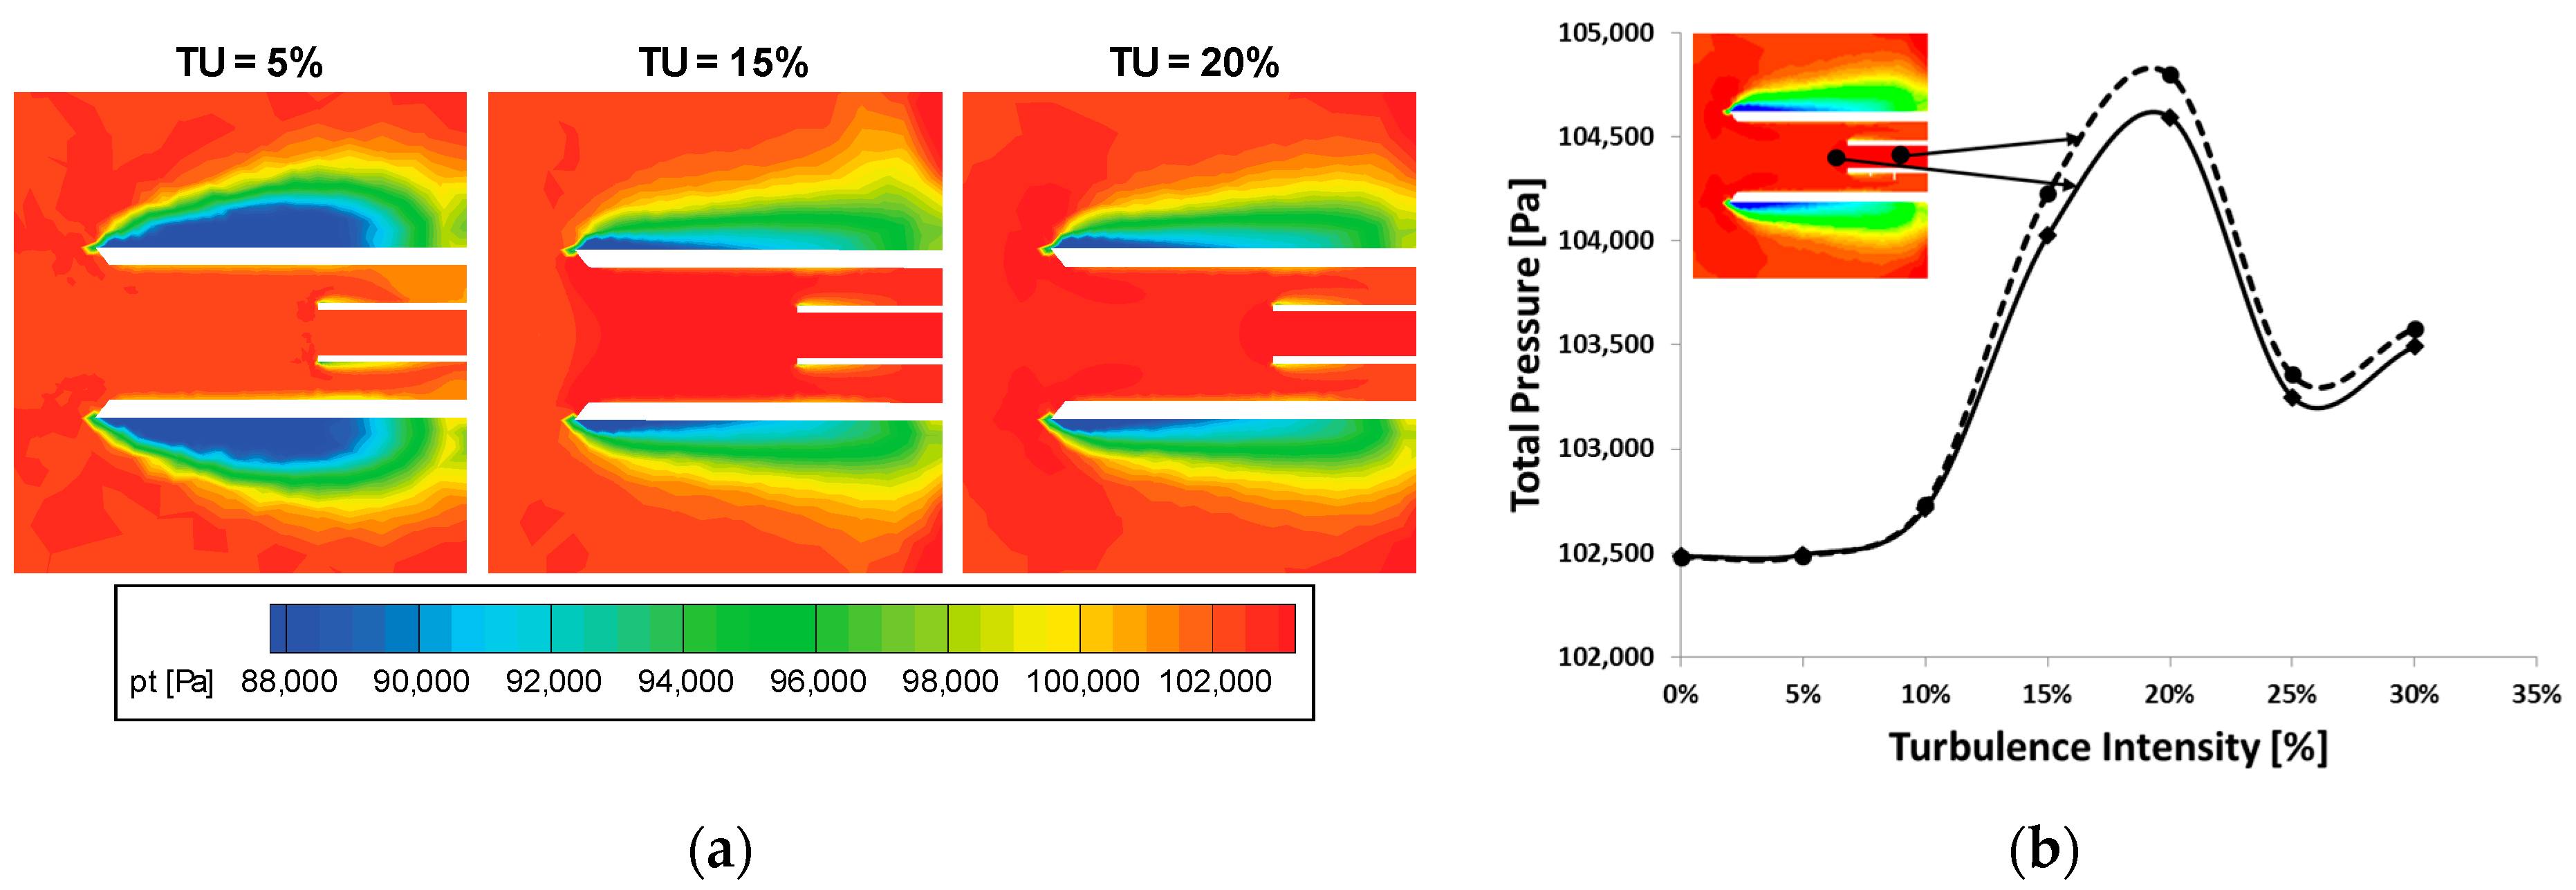
In order to get a deeper insight into the flow inside and around the Kielhead, steady state numerical investigations were carried out. The geometry of the Kielhead was the same as in the test rig, and the compensating bores on both sides of the Kielhead were also modelled but are not shown in the results. For each calculation, the turbulence intensity at the inlet was varied, but all of the other parameters were kept constant. The results of these calculations are depicted in
Figure 9. Also in the CFD, the total pressure in the pressure pipe inside the Kielhead increases with increasing turbulence intensity at the inlet. Interestingly, the shape and size of the separation zones outside the Kielhead also change with increasing turbulence.
The diagram on the right side represents the total pressure directly in front and at the end of the pressure pipe for different turbulence intensities, and shows a considerable jump in total pressure between a turbulence intensity of 10% and 15%, whereas the total pressure at 0% and 5% corresponds exactly to the total pressure given as a boundary condition.
Surprisingly, there is another jump to a lower total pressure for turbulence intensities larger than 20%, but the shape of the separation region stays the same as e.g., for 15%. It is also interesting that the difference between the total pressure of the main flow and the total pressure inside the pressure pipe depends on the position inside the pipe: for the point at the end of the pipe, the total pressure deviation is even larger for increasing turbulence than for the point directly in front of the pipe.

