
Article

Optimization and Experimental Validation of Savonius Turbines with Integrated Deflector for Enhanced Low-Speed Hydropower Efficiency †

1
Laboratory of Fluid Dynamics & Technical Flows, University of Magdeburg Otto von Guericke, 39106 Magdeburg, Germany
2
Mechanical Power Engineering Department, Faculty of Engineering-Mataria, Capital University (Formerly Helwan University), Cairo P.O. Box 11718, Egypt
3
Laboratory of Geophysical and Industrial Flows, Université Grenoble Alpes, CNRS, Grenoble INP, 38000 Grenoble, France
*
Author to whom correspondence should be addressed.
This manuscript is an extended version of the ETC16-351 paper published in the Proceedings of the 16th European Turbomachinery Conference, Hannover, Germany, 24–28 March 2025.
Int. J. Turbomach. Propuls. Power 2026, 11(3), 30; https://doi.org/10.3390/ijtpp11030030
Submission received: 9 November 2025 / Revised: 1 June 2026 / Accepted: 4 June 2026 / Published: 1 July 2026

Abstract

The global energy demand continues to rise, and increasing harmful emissions from fossil fuel combustion highlight the urgent need for alternative, eco-friendly energy sources. Hydropower stands out as a promising solution, leveraging the fact that 71 % of the Earth’s surface is covered by water, allowing for energy harnessing with minimal environmental impact. Modern hydropower technologies must also be optimized to operate efficiently in low-velocity water, a common condition that typically produces low power output. Savonius turbines have been widely studied, with many efforts focusing on enhancing their performance through design modifications. However, much of this research is limited to numerical simulations only. This study seeks to address this gap by experimentally validating a new optimization process that integrates a deflector into the turbine design, first based on Computational Fluid Dynamics. Both the turbine and deflector were fabricated and tested in our water flume, with a comparative analysis conducted against the standard Savonius turbine. In addition to evaluating key experimental parameters such as torque and rotational speed at various tip speed ratios, Particle Image Velocimetry (PIV) is used to investigate the flow structure around the turbine, proving the validity of our CFD-based optimization under real-world conditions.

1. Introduction

The rising global energy demand, driven by population growth, underscores the need for renewable energy sources. Hydropower, which taps into the 71% of the Earth’s surface covered by water, offers a promising solution. Energy from water can be captured through two primary methods: the widely used hydraulic head difference, which unfortunately requires dams [1,2], and the direct conversion of water’s kinetic energy via hydro-kinetic turbines. While hydraulic head systems are highly efficient, they disrupt ecosystems and landscapes, making hydro-kinetic turbines more environmentally friendly and cost-effective, despite their relatively low efficiency. Ongoing efforts in many countries are focused on improving this efficiency. However, hydro-kinetic turbines still generate limited power compared to Betz’s theoretical maximum [3]. Although hydro-kinetic turbines show specific features, lessons from wind turbines are applicable due to similar design principles. Because of water’s higher density, turbines in water flows of 2–3 m/s can produce up to four times the energy of wind turbines (with air at 10–12 m/s) in comparable conditions. However, challenges such as limited water depth and potential damage from debris pose significant obstacles. Darrieus and Gorlov turbines offer higher efficiency but suffer from structural complexity and poor self-starting [4,5]. In contrast, Savonius turbines excel in simplicity and self-starting, making them suitable for low-flow applications despite their lower efficiency, which this study aims to improve through an optimized deflector [6]. Traditional Savonius turbines, which are designed by splitting a cylinder, perform well in low-speed flows but suffer from very low power coefficients. These turbines are simple, robust, and cost-effective, making them ideal candidates for hydro-kinetic energy extraction if their power coefficient can be enhanced and their blades protected from collisions. Enhancing the performance of Savonius turbines focuses on minimizing drag on the returning blade and boosting the hydro-kinetic force on the advancing blade. Various studies have examined such modifications, including changes to blade shape, end plates, overlap ratios, and additional accessories, to increase efficiency [7,8,9,10,11]. Shifting from thin to thick blades has shown notable improvements, with Tian [12] reporting a 4.4% gain and Kerikous et al. [13] achieving even a 15% performance increase through multi-parameter CFD-based optimization. One further advancement involves the use of deflector plates in front of the returning blade to reduce drag. Mohamed et al. [14] demonstrated a power coefficient increase of over 27% in wind turbines, while Golecha et al. [15] reported a 50% improvement for water turbines. Studies also show that combining deflectors with nozzles or ducts can further boost power output [16,17]. Several studies have reported similar results regarding the effectiveness of deflectors [18,19]. However, these modifications increase the frontal area of the system, preventing direct and fair comparisons with standard turbines [20]. This is why the present study keeps the frontal area constant. In hydro-power applications, where flow direction is predictable, deflector plates not only enhance power but also protect the blades from collisions with debris, providing dual benefits of increased efficiency and durability. While much of the research in this area is purely based on numerical simulations, this study bridges the gap by experimentally validating a new optimal design that incorporates a frontal deflector in the turbine. A comparative analysis was conducted in a water flume against the standard Savonius turbine after the optimization process [21]. Key experimental parameters, such as torque and rotational speed at different tip speed ratios, were evaluated. Additionally, Particle Image Velocimetry (PIV) was employed to examine the flow structure around the turbine, offering a thorough assessment of the effectiveness of CFD-based optimization in real-world conditions. Parts of this work have been presented previously at the 16th European Turbomachinery Conference [22].

2. Main Equations

This section provides an overview of the key equations used to analyze turbine performance, as outlined in our previous publication [21]. Turbine behavior is typically evaluated using TSR- C p curves, which describe the relationship between the Tip Speed Ratio (TSR) and the power coefficient ( C p ).
The Tip Speed Ratio (TSR) is the ratio of the turbine’s tip speed ( V t i p ) to the incoming flow velocity (U):
TSR = λ = V t i p U = ω R U
where ω is the turbine’s angular velocity and R is the radius of the turbine.
The power coefficient ( C p ) represents the turbine’s efficiency in converting the available kinetic energy of the flow into mechanical energy:
C p = P m e c h P a v a i l a b l e = T ω 0.5 ρ A U 3
where T is the torque generated by the turbine, ρ is the fluid density, A is the turbine frontal area, and U is the velocity of the incoming flow.

3. Experimental Work

First, the methodology will be outlined, concerning the arrangement, equipment used, and their placement. The results will be organized into two key areas: (1) the flow field observed behind the turbine and (2) power extraction, including torque and corresponding rotational speed.

3.1. Water Flume

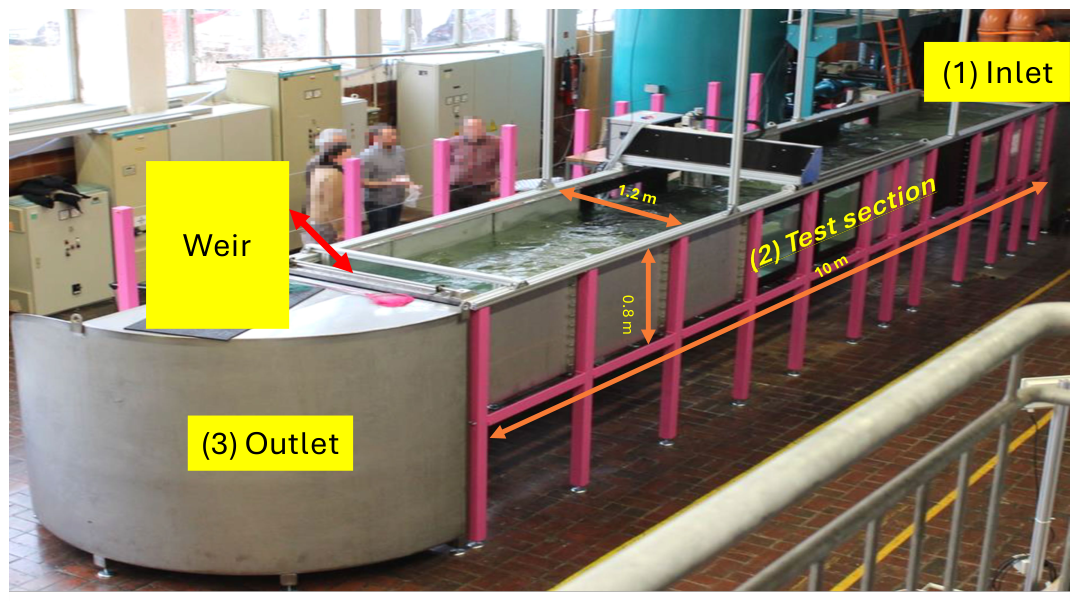
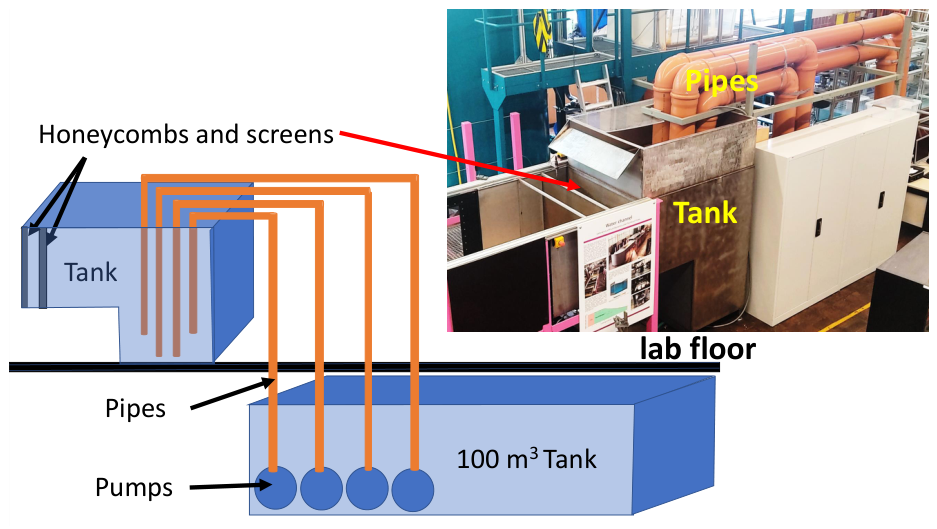
The performance of the Savonius turbine and the surrounding flow dynamics were investigated through a series of experiments conducted at the water channel facility of Otto von Guericke University in Magdeburg, Germany, as shown in Figure 1. This facility has been already used in many previous studies, e.g., refs. [23,24]. This water flume comprises three key sections: the inlet, the main test section, and the outlet. A large reservoir, capable of holding 100 cubic meters of water, supplies the channel with water via four submersible centrifugal pumps (KSB, model KRTK 200-315/96 UGP) located beneath the lab floor. Water is initially routed through a smaller tank positioned on the laboratory floor, as depicted in Figure 2. The flow rate within the channel can be adjusted by varying the frequency of three pumps, while the fourth pump operates at a constant frequency but can be switched off if required. The pump frequency was kept fixed at 47.4 Hz, ensuring consistent flow conditions across all experiments. Additionally, the opening of the weir were kept constant at 35% of the full opening throughout the entire experimentation period. Continuous monitoring was performed during the experiments to ensure these conditions remained unchanged, maintaining uniform test conditions.
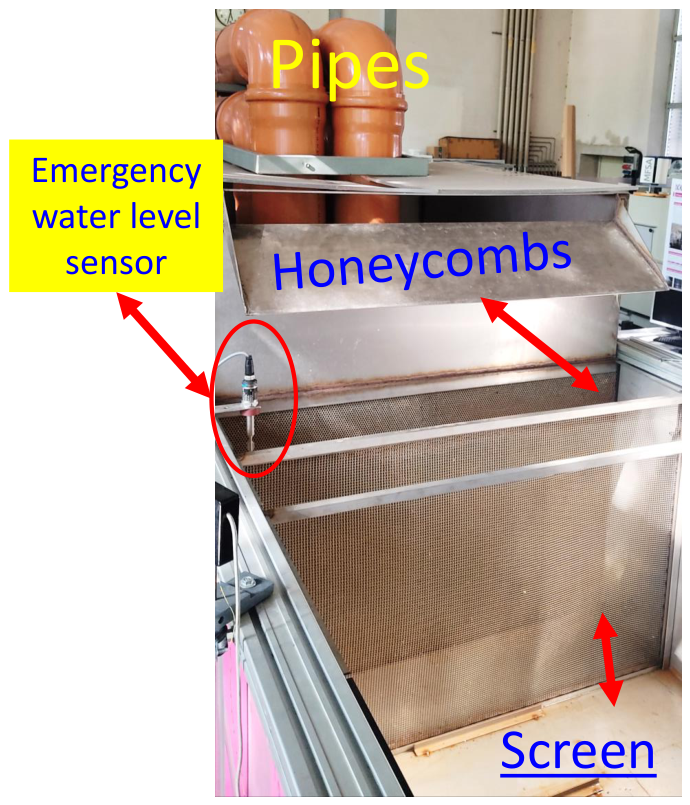
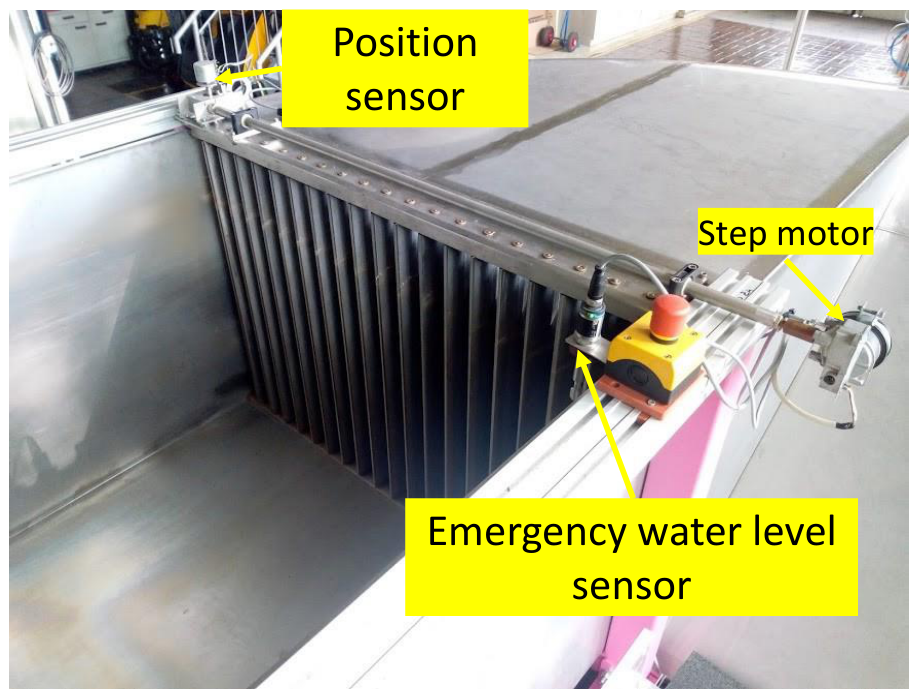
To reduce turbulence and create a steady, uniform flow, a honeycomb structure followed by a fine mesh was placed at the inlet (Figure 3). The test section, where the turbine is positioned, stretches 10 m in length, with a width of 1.2 m and a depth of 0.8 m, allowing for a free water surface across the entire length. Water velocity in this section can reach up to 0.72 m/s. Water level is monitored in real time through sensors connected to a computer system, ensuring precise control over the experimental conditions. For safety reasons, additional sensors are installed at various points along the channel to prevent water overflow (as seen in Figure 3 and Figure 4).
At the downstream outlet, the water exits through a weir fitted with vertically mounted blades, each 0.025 m wide, capable of rotating around their vertical axis. These blades, controlled by a step motor, allow for accurate regulation of water flow, with all relevant data recorded digitally (Figure 4). Throughout the experiments, the operating conditions remained consistent, with the pump frequencies, weir settings, and water levels held steady. Particle Image Velocimetry (PIV) was used to analyze the flow fields and investigate the fluid behavior around the turbine, as further elaborated in subsequent sections. This controlled environment ensured that the experimental setup aligned closely with the intended conditions, providing accurate and repeatable data for performance evaluation.

3.2. Savonius Turbine

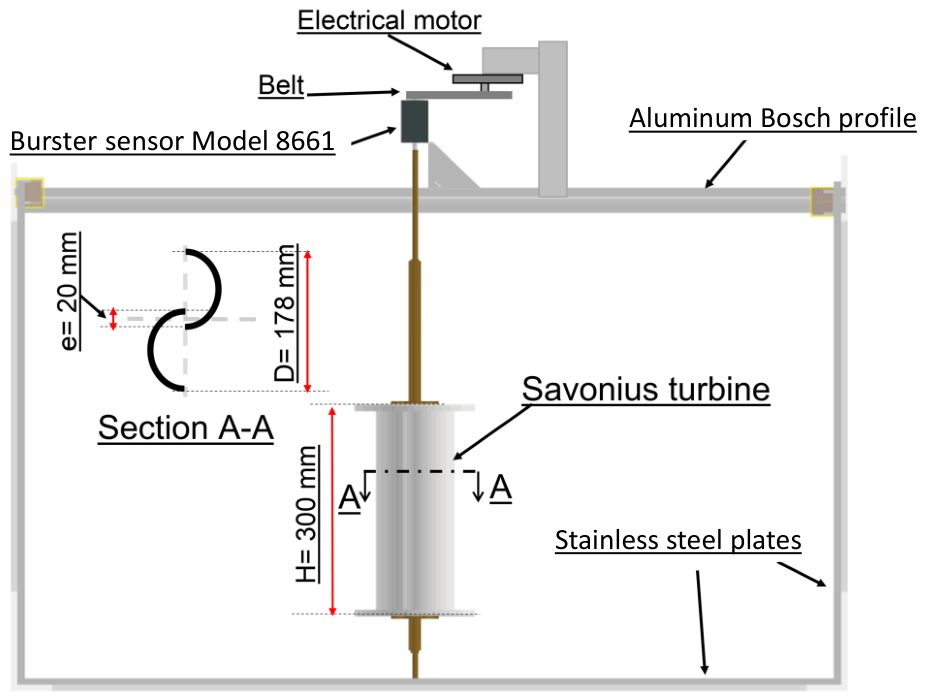
Figure 5 depicts the arrangement of the turbine and the associated measurement instruments. The hydraulic Savonius turbine models were constructed by halving a stainless steel pipe and offsetting the sections axially to form the blades. A 20 mm gap (12% of the total diameter) was preserved between the blade halves to prevent overlap, which was optimized by our study before [11]. The height of the turbine was designed to be 300 mm, which was almost one and a half times the diameter [8]. To ensure stability, the turbine was fastened at both the top and bottom with acrylic plates, which were connected to two axes for support. A torque sensor was installed directly on the axis to monitor both the rotational speed and the torque output. The speed of rotation was adjusted using an electric motor configured to act as a brake, allowing for variations in turbine speed. This entire setup was mounted on a rectangular frame and positioned within the water channel, as shown in Figure 5.

3.3. Torque Sensor

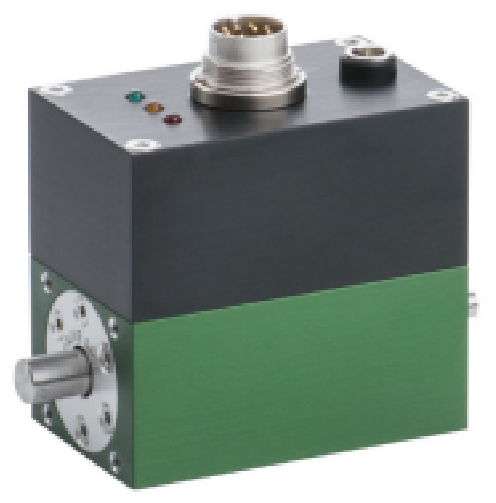
The measurement of shaft torque and rotational speed was performed using a Burster sensor, specifically the model 8661. This sensor (Burster 8661-4500-v0200, burster präzisionsmesstechnik gmbh & co kg, Gernsbach, Germany) is designed to measure torque within a range of 0 to ±0.5 Nm and supports a maximum rotational speed of 25,000 rpm. When evaluating the increase in power output with the addition of an optimal deflector, a different model was used (Burster 8661-5002-v0200, burster präzisionsmesstechnik gmbh & co kg, Gernsbach, Germany) that can measure up to ±2 Nm. Figure 6 illustrates the sensor utilized for these measurements, with an excellent accuracy of 0.05% of the full scale (F.S.).

3.4. Particle Image Velocimetry (PIV) System

To analyze the flow and vortex behavior behind the turbine, particle image velocimetry (PIV) was employed. This advanced optical method allows for the real-time measurement of fluid velocity, offering both two- and three-dimensional (in case of tomographic PIV system) insights into the instantaneous characteristics of the flow. Imaging two-dimensional planes with a corresponding laser-sheet illumination was employed.
The setup for particle image velocimetry included a double-pulsed Nd-Yag laser, optics designed specifically for PIV, and an LX camera. Data was recorded and analyzed with the Davis 8.4 software, and synchronization of the entire system was managed by a LaVision programmable timing unit (PTU). All relevant device specifications are as follows.
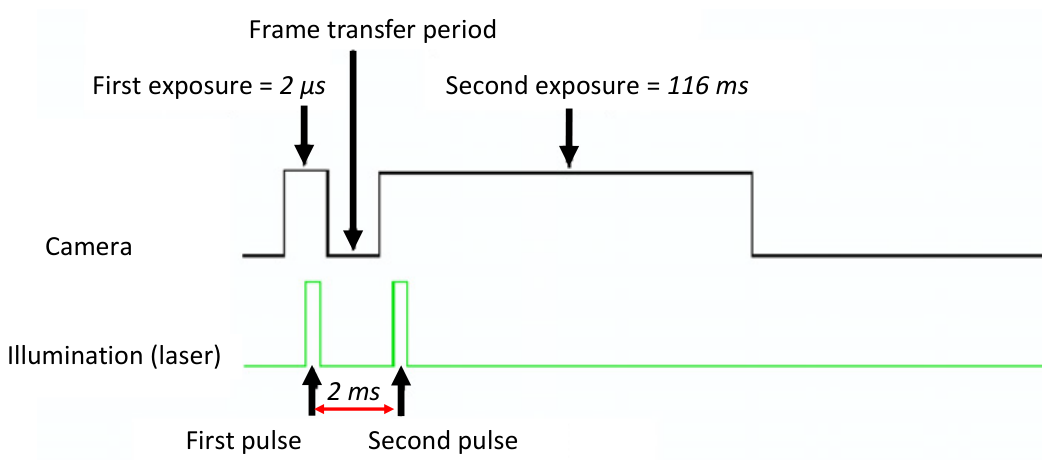
The experimental setup featured double-pulsed Nd:YAG laser (EverGreen series lasers) with a maximum of 200 mJ/pulse energy at 532 nm wavelength. Data collection was carried out using an LX camera from LaVision with a resolution of 3312 × 2488 pixels. The individual pixel size was 5.5 µm × 5.5 µm, translating to an effective pixel size of 0.127 mm ×  0.127 mm in the setup. The PIV velocity vectors were analyzed using a 32 × 32 pixel window size. Exposure times varied from 2 μ s –116 m s , while the camera utilized a double shutter mechanism to capture two images with a minimum interframing time of 200 ns. Figure 7 illustrates the timing of the double-frame operation concerning camera exposure and laser pulses. The time shift between frames was set to 2 ms, and image recording rates were adjusted using a photosensor to synchronize with the turbine’s rotational speed.
Illumination is obtained by a laser light sheet, produced with LaVision light-sheet optics. The thickness and dimensions of the light sheet could be modified by adjusting the focus and interchanging various divergent lenses. These optics were specifically designed to handle high-power Nd:YAG lasers, accommodating beam diameters up to 12 mm. In this study, a light sheet thickness of approximately 1 mm was utilized.
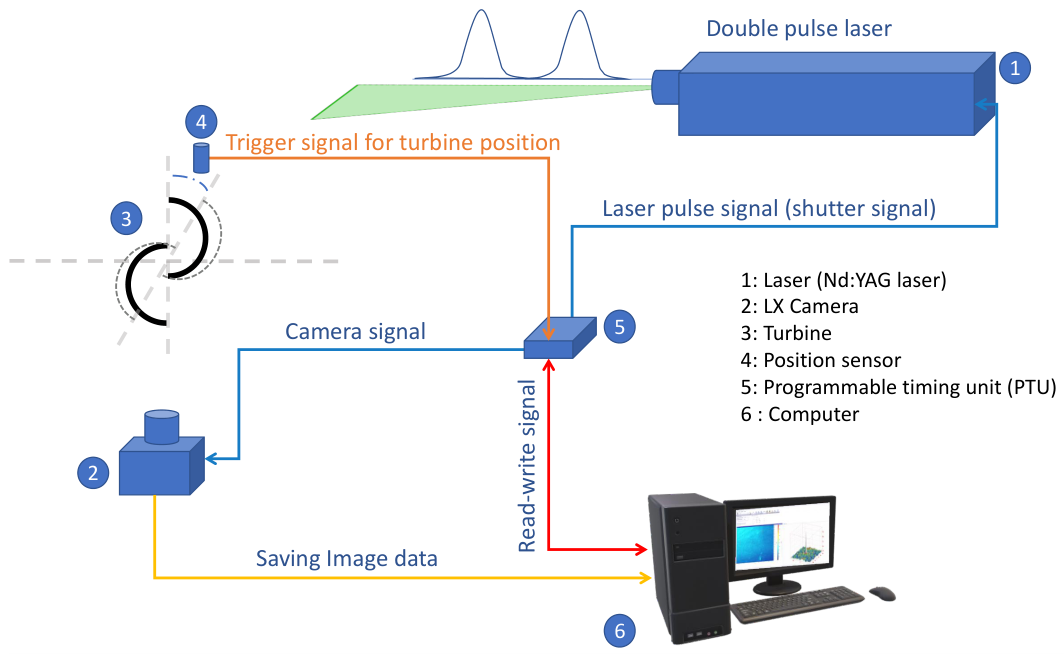
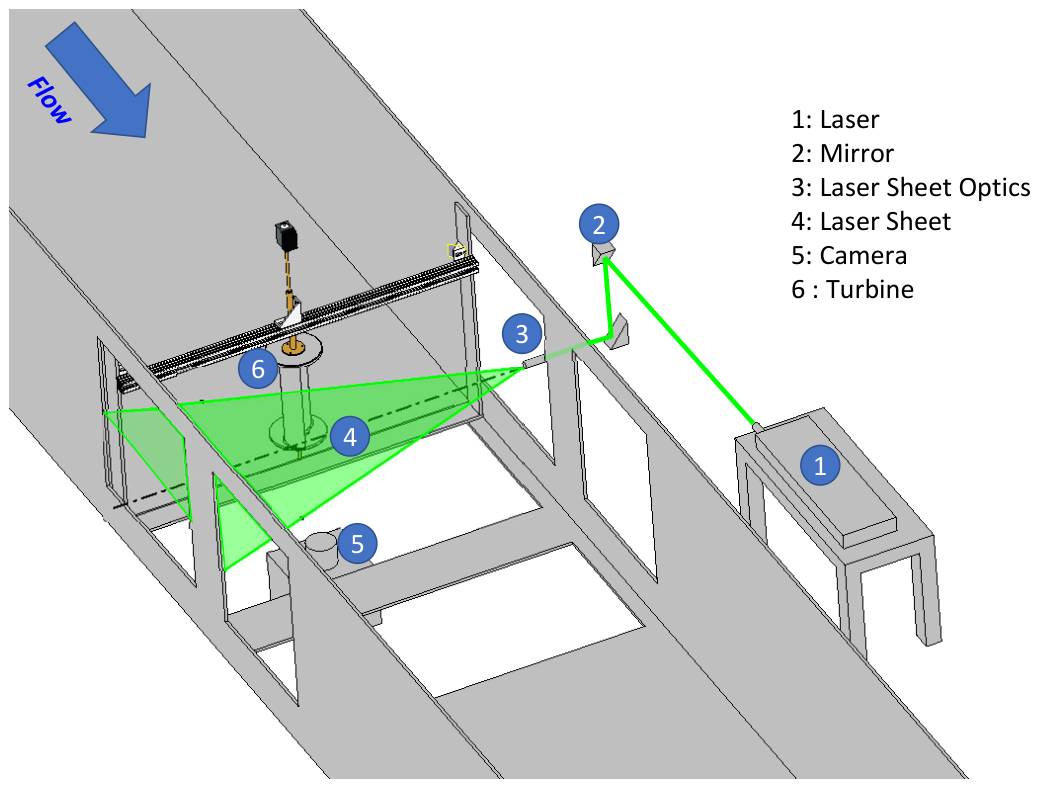
The PIV setup for this study was designed to capture flow velocity data around the turbine using a fully synchronized array of components, as depicted in Figure 8. The 1 mm-thick laser sheet was projected perpendicular to the turbine’s rotational direction, aligned with its mid-span, while an LX camera, positioned beneath the water channel, recorded the particle motion. Synchronization was managed by a PTU from LaVision, as shown in Figure 9, which coordinated all experimental components. The process began when a turbine-mounted phototransistor sensor generated 5V signals at specific angular positions, with the signal frequency increasing as the turbine rotational speed rose. Upon receiving a signal from the trigger sensor, the PTU synchronized the laser pulses and camera exposures, enabling the capture of double-frame images with a 2 ms time shift, allowing particles to move 4–5 pixels between frames. This timing precision was critical for accurate velocity measurements.

3.5. Recording

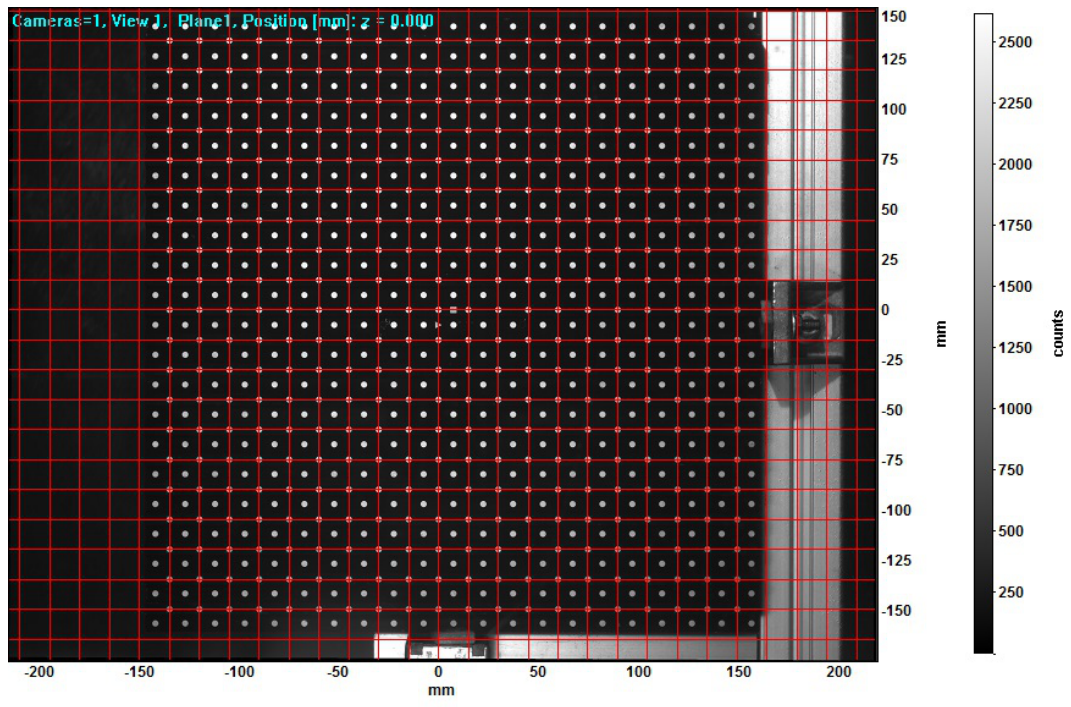
After establishing all connections, the first task was to calibrate the camera to ascertain the size of each pixel. A 3D calibration plate from LaVision, arranged in a 31 × 31 grid, was employed for this calibration, as illustrated in Figure 10. This plate contains numerous white points, each spaced at a fixed distance from one another, with a diameter of 3 mm and a center-to-center distance of 15 mm. Using DaVis software Version 8.4, fifteen images were recorded and averaged to enhance the accuracy of the point measurements. Figure 10 depicts the calibration plate within the water channel. The resulting calibration allowed for the determination of pixel dimensions, with a root-mean-square (RMS) error of less than 0.09 pixels, indicating minimal remaining error from the calibration process.
Following the calibration of the camera and the precise adjustment of the laser sheet to match the calibration plate’s position, image recording started. In principle, two images are enough to determine the instantaneous vector field around the turbine. However, given the complexity of the flow patterns in this turbulent flow, averaging is necessary. For this reason, a total of 500 double-frame images were collected for each angular position and used to get the average flow velocity.
To maintain consistency, a light sensor was utilized to establish the same phase angle throughout the recordings. This process was replicated for a range of angular positions and tip speed ratios ( λ ), selected as follows:
  • Tip speed ratios: 0.6, 0.7, 0.8, 0.9, 1.0, 1.1, and 1.2.
  • Phase angles: 0°, 45°, 90°, 135° (taking into account that the cycle repeats every 180° due to the symmetric two-bladed rotor).

3.6. PIV Post-Processing

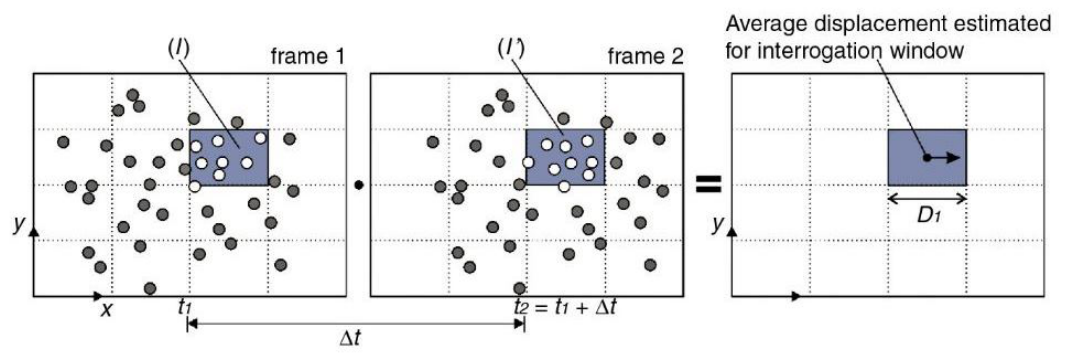
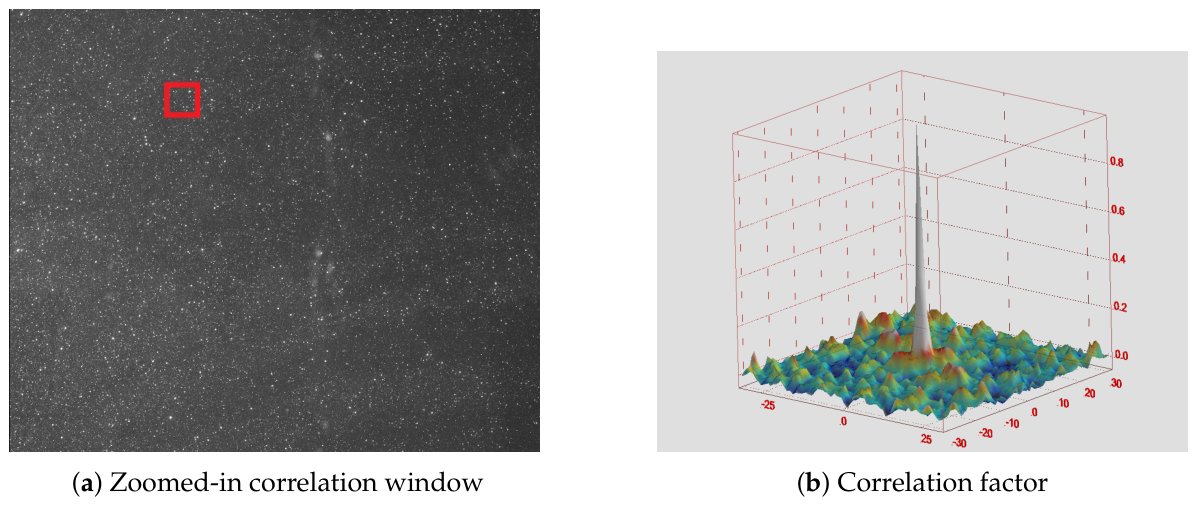
In PIV, the technique does not involve tracking individual particles. Instead, velocity vectors are calculated using a correlation window that contains around 5 to 6 particles, as illustrated in Figure 11. The vector density depends on the size of the correlation window and the degree of overlap between neighboring windows.
The calculation of velocity vectors begins with a preprocessing stage aimed at removing irrelevant components, such as the sliding background. This step is essential because eliminating the fixed background between image pairs significantly reduces potential errors in the calculations. In DaVis software, the sliding background was limited to a maximum of 5 pixels, and a 9 × 9 Gaussian filter was applied to smooth the images.
Following the preprocessing, velocity vectors were computed using a multi-pass cross-correlation technique. The process started with a correlation window size of 64 × 64 pixels and progressively reduced to 32 × 32 pixels with a 50% overlap on the final pass. Figure 12 highlights the largest correlation window and the corresponding correlation factors. The correlation factor peaked at 0.9, though in some areas it decreased to as low as 0.5. During post-processing, any vectors with a correlation factor below 0.6 were eliminated. Each vector underwent 500 calculations, and an average value was determined for each point in the dataset at the conclusion of the analysis.

3.7. Results and Discussion

This section presents the experimental measurement results and compares them with the outcomes of 3D CFD simulations. The setup, verification, and optimization process for the simulations have been fully documented in [21] and are not repeated here in the interest of space. While the 3D simulation used the same physical models as the 2D simulation initially employed for optimization, the key distinction lies in the fact that the 3D simulation domain now precisely matched the experimental setup. The first part of this section analyzes the power output, while the second part discusses the PIV results, emphasizing the comparison between the velocity distributions obtained from simulations and those measured experimentally.

3.7.1. Error Analysis

For experimental studies, it is important to identify the uncertainties associated with measurements. While error is defined as the difference between observed and true values, this definition has limited practical value since the true value is not known here. Calibration provides an approximation of the true value by comparing measured values with a standard derived from reference designs. Therefore, a more meaningful definition of error accounts for the limitations of the measurement process and their impact on the results. They can be broadly classified into two types: random errors, which vary between measurements, and systematic errors, which remain constant across readings. By identifying the sources of error for each measured parameter, it becomes possible to calculate their respective uncertainties, leading to a total uncertainty for the derived parameters.
In our experiments, several sources of error were identified. One comes from fluctuations in room temperature. Although the experiments were performed in a controlled laboratory setting, temperatures ranged from 20 °C to 23 °C across seasons, causing a 0.07% uncertainty in water density. Additional errors were linked to the precision of the devices used to measure torque and rotational speed. Table 1 summarizes these uncertainties along with other error sources for each parameter. The uncertainty in velocity was calculated from the PIV software (Davis 8.4), which provided uncertainty values for each velocity measurement, with the average values presented. The most significant error was attributed to the slight misalignment of the turbine axis and friction in the bearings. To quantify this, the turbine was rotated freely at various speeds without any load (i.e., no braking forces), and the measured torque in this state accounted for both bearing friction and axial misalignment. Friction was found to increase with rotational speed, with absolute friction values ranging from 0.004 to 0.008 N·m, indicating a corresponding increase in error at higher tip speed ratios.
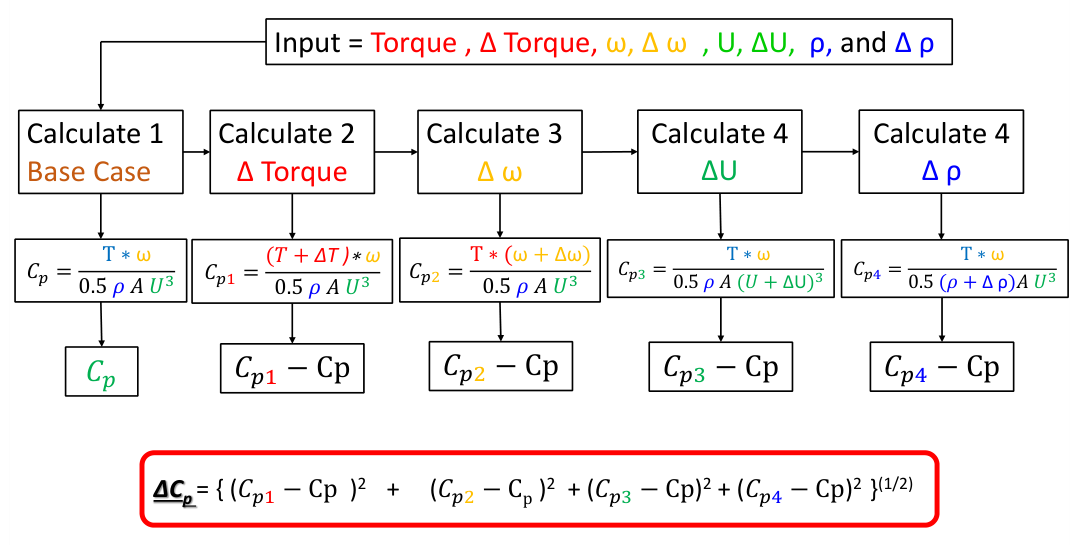
After determining the uncertainty for each measured parameter, the overall uncertainty ( Δ C p ) was computed by following established methodologies in the literature [25]. The process began with calculating the power coefficient C p based on the measured values, establishing this as the reference value, as shown in Figure 13. Subsequently, the uncertainty calculation for the first parameter, such as torque, was performed by increasing its value by the associated uncertainty and then recalculating the power coefficient. The difference between this newly calculated power coefficient and the reference value was then determined, and this new value was stored as Δ C p i . This process was repeated for the other parameters, including velocity, rotational speed, and density. Finally, the overall uncertainty was computed as the root-sum-square of all Δ C p i values.
From the previous analysis, the uncertainties of the power coefficient ( C p ) were calculated for various tip speed ratios, revealing an increasing trend in uncertainty with higher TSR. Specifically, the uncertainty started at 2% for λ = 0.6 and went up to 6% at λ = 1.2. In contrast, the error associated with the numerical model was estimated to be less than 1% This indicates that improvements in performance of less than 6% cannot be reliably detected using the experimental methodology. However, any enhancements greater than 1% can be accurately predicted by the numerical model. Consequently, an uncertainty of 6% will be kept in connection with all experimental results in the subsequent discussions.

3.7.2. Evaluating Performance

Before delving into the flow structure of the Savonius turbine, it is imperative to establish a thorough understanding of its performance characteristics, which are fundamental to optimizing its design and functionality. Key performance metrics, such as the performance peaks and cutoff speeds, must be clearly defined to assess the turbine’s efficiency and operational limits. To achieve this, detailed measurements of the torque and rotational speed of the Savonius turbine model were recorded using the torque sensor previously described. Upon applying or varying the load, sufficient time was allocated for the turbine to stabilize, allowing it to reach a steady operational speed. Data samples were subsequently collected over a period of 300 s at a frequency of 500 Hz, ensuring a comprehensive dataset for analysis.
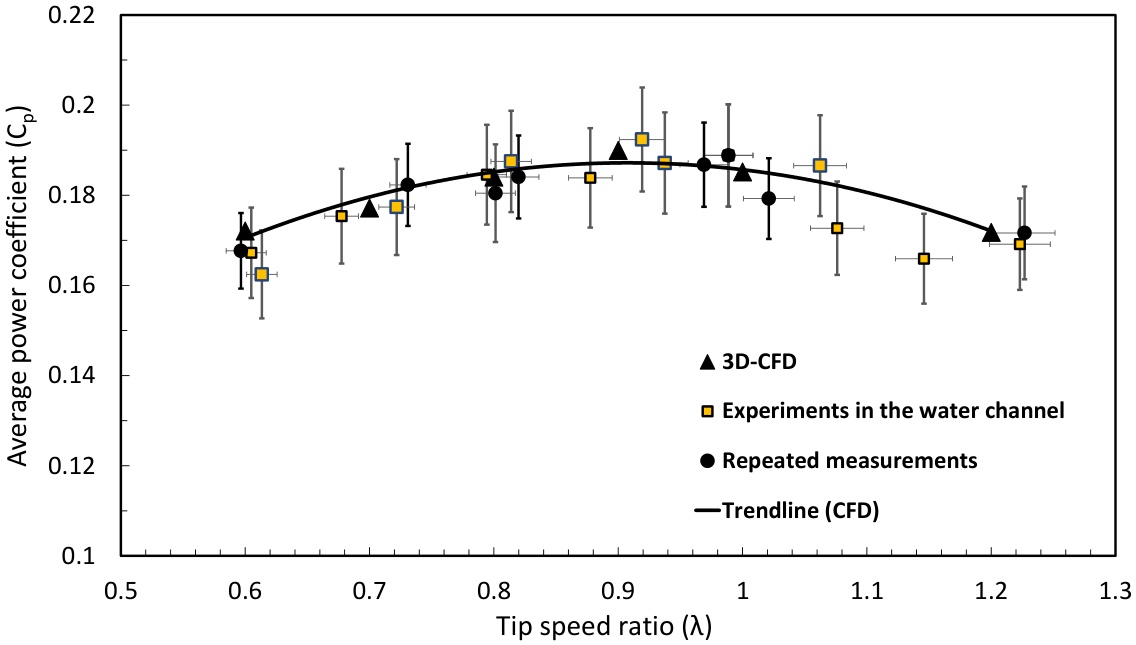
In this context, Figure 14 presents the averaged calculated power coefficient across different values of the tip speed ratio, showcasing not only the original measurements but also the independently repeated measurements conducted on a separate occasion. This repetition serves a critical purpose: it verifies the repeatability and reliability of the measurements, reinforcing the integrity of the experimental results. The figure further incorporates the performance values derived from our 3D CFD simulations, providing a comparative reference against which the experimental data can be assessed.
The analysis of these results reveals the classical trend: the performance of the turbine increases to a peak value before experiencing a subsequent decline. This behavior aligns with theoretical expectations and is characteristic of the operational dynamics of Savonius turbines. Overall, the obtained experimental data are in excellent agreement with the CFD findings. This not only validates the experimental methodology but also confirms the applicability of our simulation framework for optimization processes, thereby reinforcing the potential for further advancements in the design and efficiency of hydraulic turbines.

3.7.3. Flow Pattern

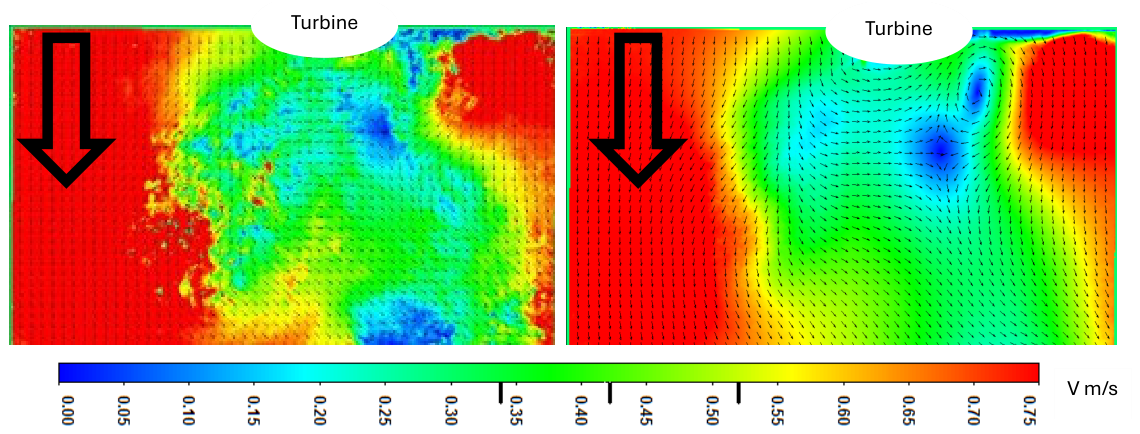
The subsequent section will focus on the velocity distribution of the flow behind the turbine, drawing a comparative analysis between the experimentally obtained velocity field and the data derived from the 3D simulation. The left-hand side of Figure 15 illustrates an instantaneous velocity field captured at a specific angular position, while the right-hand side of the same figure presents the average velocity distribution for the same position. Initial tests taking data from 150, 250, 300, and 500 images revealed that the average velocity distribution stabilizes after 300 images, demonstrating minimal variations with additional frames. To ensure robustness in the findings, a total of 500 images was utilized for the ensuing discussions, providing a reliable representation of the flow characteristics behind the turbine under all conditions. Only average velocity fields are discussed in what follows.

3.7.4. Assessment of PIV Measurements Against CFD Simulations

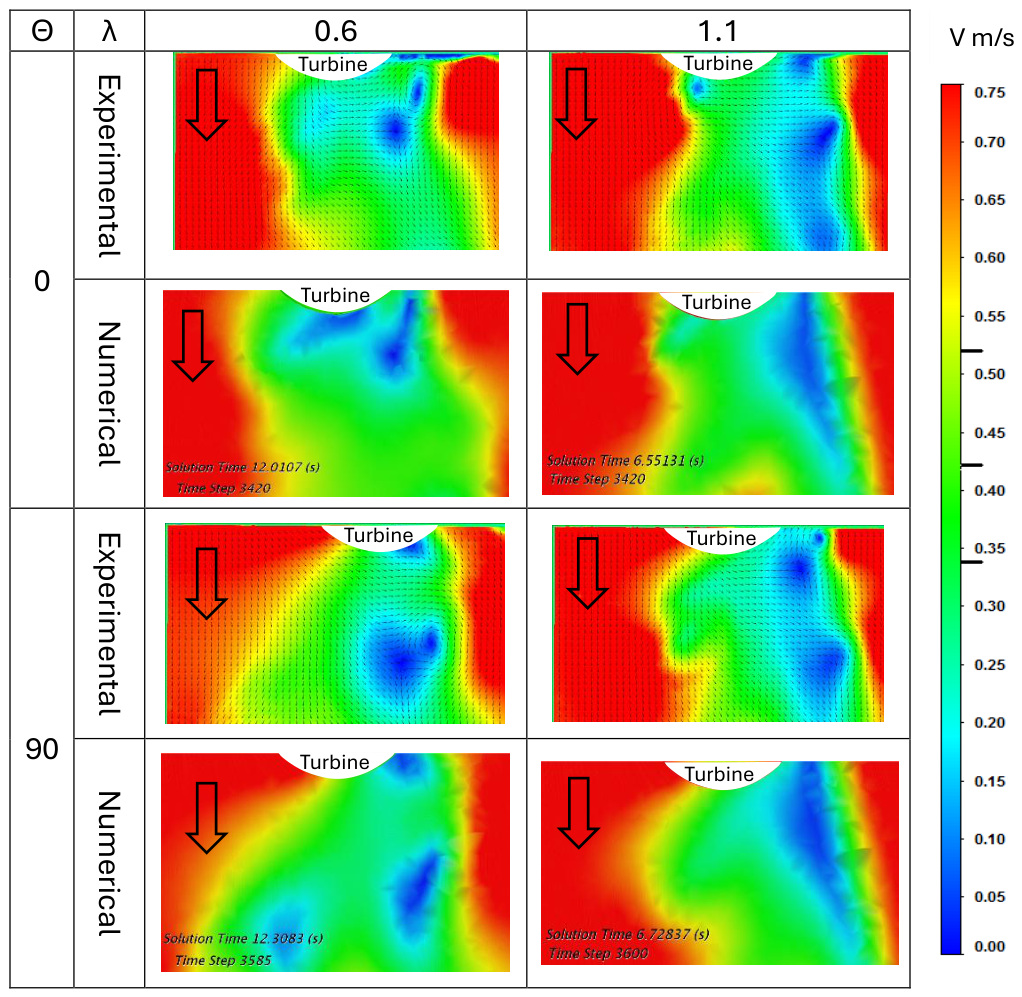
In this section, we aim to elucidate the flow structures derived from both 3D simulations and PIV measurements. Figure 16 presents a detailed comparison of the velocity distributions. This figure encompass a range of conditions, showcasing two different tip speed ratios ( λ = 0.6 and 1.1) and two different angular positions (0° and 90°) which are critical for understanding the performance and behavior of the turbine under various operational scenarios. The columns correspond to two different tip speed ratios, while every two rows represent a specific angular position; the top row illustrates the experimental results from PIV, and the bottom row displays the simulation data generated by the 3D computational model.
Upon examination of the data, it is evident that the velocity distributions across all positions and tip speed ratios show a strong correlation between experimental and simulation results. This finding is indicative of the reliability and robustness of both techniques in capturing the essential flow characteristics around the turbine. However, it is important to acknowledge that some discrepancies can be observed, primarily attributed to the presence of small eddies that manifest differently between the simulation and PIV outcomes. These variations can be explained by two key factors: firstly, the mesh resolution utilized in CFD does not coincide with the resolution of the correlation windows employed in the experiments, leading to differences in the captured flow structures; secondly, the simplified Reynolds-Averaged Navier–Stokes (RANS) model used in CFD, while effective, is not able to reproduce properly all turbulent features. Despite these differences, the overall flow patterns exhibit a good agreement. Therefore, the synergy between PIV measurements and 3D CFD simulations offers a powerful framework for analyzing flow behavior and improving the design and functionality of Savonius turbines, ultimately leading to more efficient energy harnessing in practical applications.

4. Experimental Assessment with Optimal Deflector

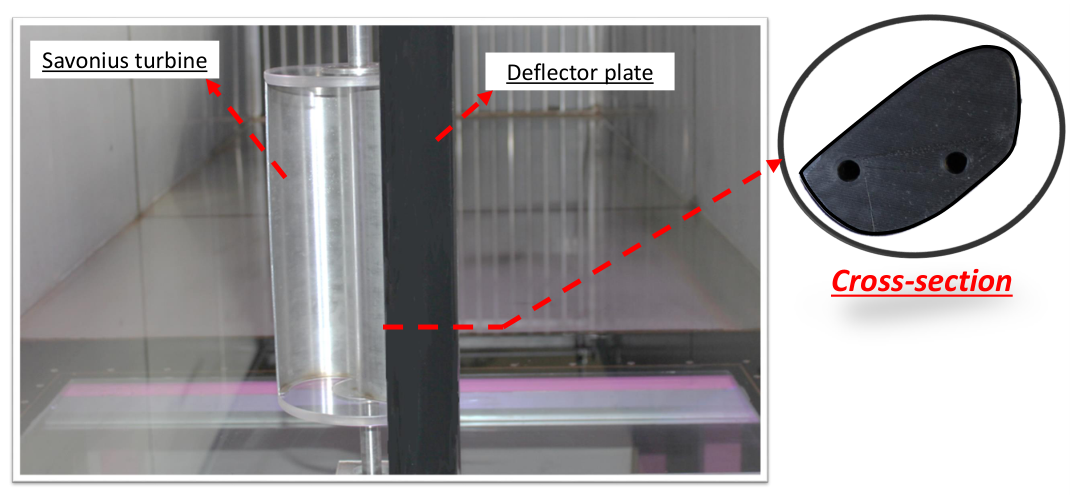
To validate the improvements predicted by CFD-based optimization, it was essential to conduct experimental testing with a 3D-printed deflector plate, based on the optimal configuration identified numerically in [21]. The deflector was added to the same water channel setup that was previously used for the tests with the standard Savonius turbine. Figure 17 illustrates the modified setup, where the deflector plate was positioned properly in front of the turbine. The experimental procedure followed the same steps outlined previously, with the torque and rotational speed of the turbine being recorded. However, this time a larger-scale torque sensor, with a maximum reading of 2 N.m, was employed to accommodate the increased forces generated by the turbine with the deflector.
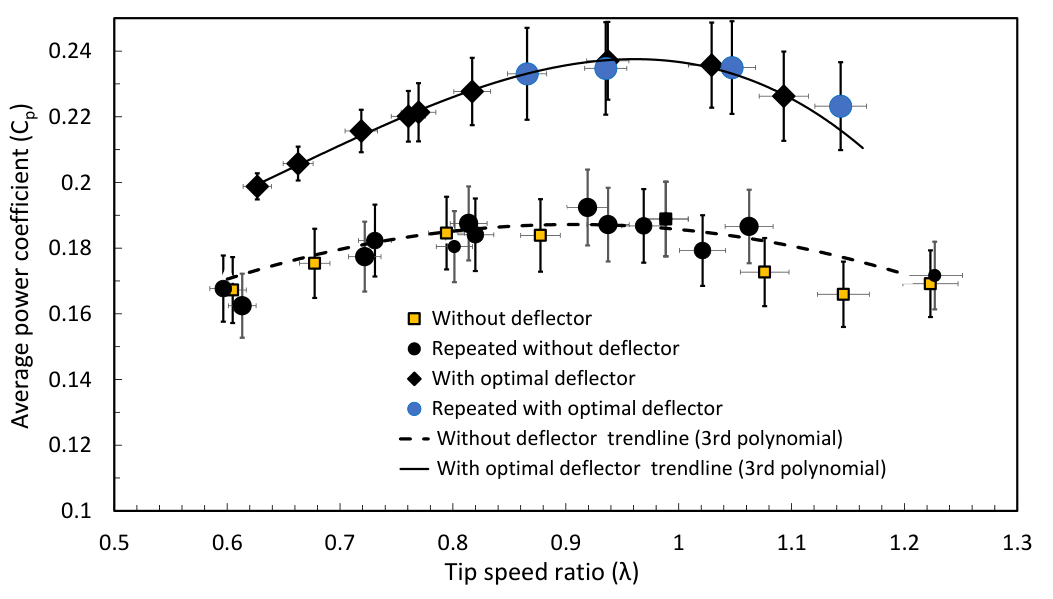
Once the experimental data were collected, the performance of the turbine with the deflector was compared to that of the standard Savonius turbine. The results, shown in Figure 18, clearly indicate that the addition of the deflector led to performance improvements across all measured tip speed ratios. These findings are consistent with the predictions from the numerical model, further supporting the validity of the CFD-based optimization process. However, the task of calculating the relative performance improvement became more complex due to the larger experimental uncertainties compared to the numerical model. To ensure the reliability of the findings, the experiments were repeated on two different occasions, and the error bars in Figure 18 illustrate the associated uncertainty in the measurements.
The good agreement between the numerical and experimental results demonstrates that the optimization process was successful and proceeded in the correct direction. The experimental improvements, even when taking into account the uncertainties, confirm that the deflector design enhances the performance of the Savonius turbine as predicted by the simulations. Consequently, the optimization process can be considered valid, and further refinement of the design based on this methodology is both justified and promising.

5. Conclusions

This study successfully validated the optimization process of Savonius hydro-kinetic turbines by integrating a deflector plate, demonstrating significant improvements in performance compared to the standard Savonius design. The experimental results, achieved through a series of well-controlled measurements, showed excellent agreement with the predictions from 3D CFD simulations. Both the experimental and simulation data confirmed that the deflector plate enhanced the turbine efficiency by reducing drag on the returning blade and increasing the driving force on the advancing blade, resulting in a notable boost in the overall power coefficient.
Particle Image Velocimetry provided detailed insights into the flow patterns around the turbine, and the velocity distributions closely aligned with the CFD predictions. This strong correlation between experimental and simulated data confirms the validity of the procedure.
In conclusion, this work demonstrates that the integration of a deflector plate into a Savonius turbine can significantly improve the efficiency of hydro-kinetic energy extraction while keeping the frontal area unchanged. The validity of the CFD-based optimization process was confirmed, providing a solid foundation for future studies of other systems, like h-rotors. Future work may consider optimizing the deflector behind the turbine to enhance performance under varying flow conditions.

Author Contributions

Conceptualization, E.K. and D.T.; methodology, E.K. and P.K.; software, E.K.; validation, E.K., P.K. and S.H.; formal analysis, E.K.; investigation, E.K.; resources, D.T.; data curation, E.K.; writing—original draft preparation, E.K.; writing—review and editing, D.T., P.K. and S.H.; visualization, E.K.; supervision, D.T.; project administration, E.K.; funding acquisition, D.T. All authors have read and agreed to the published version of the manuscript.

Funding

This research received no external funding.

Institutional Review Board Statement

Not applicable.

Informed Consent Statement

Not applicable.

Data Availability Statement

The data supporting the findings of this study are available upon reasonable request from the corresponding author.

Acknowledgments

Heartfelt thanks go to Saketh Bharadwaj for his invaluable assistance with the experiment, Dirk Meinecke for his expertise in setting up the power measurement system, Katharina Zähringer for her insightful contributions to the PIV measurement discussions, and Shokoofeh Abbaszadeh for her skilled work on the 3D printing of the deflector.

Conflicts of Interest

The authors declare no conflicts of interest. The funders had no role in the design of the study; in the collection, analyses, or interpretation of data; in the writing of the manuscript; or in the decision to publish the results.

References

  1. Das, T.K.; Kerikous, E.; Venkatesan, N.; Janiga, G.; Thévenin, D.; Samad, A. Performance improvement of a Wells turbine through an automated optimization technique. Energy Convers. Manag. X 2022, 16, 100285. [Google Scholar] [CrossRef]
  2. Das, T.K.; Kerikous, E.; Janiga, G.; Venkatesan, N.; Thévenin, D.; Samad, A. Mapping performance of a marine energy harvesting turbine for flow coefficient and Reynolds number with varying Mach number through an automated optimization technique. J. Braz. Soc. Mech. Sci. Eng. 2024, 46, 196. [Google Scholar] [CrossRef]
  3. Yadav, P.K.; Kumar, A.; Jaiswal, S. A critical review of technologies for harnessing the power from flowing water using a hydrokinetic turbine to fulfill the energy need. Energy Rep. 2023, 9, 2102–2117. [Google Scholar] [CrossRef]
  4. Paraschivoiu, I. Wind Turbine Design: With Emphasis on Darrieus Concept; Polytechnic International Press: Montreal, QC, Canada, 2002. [Google Scholar]
  5. Gorlov, A.M. Development of the helical reaction hydraulic turbine. Renew. Energy 1998, 13, 149–158. [Google Scholar]
  6. Kamoji, M.A.; Kedare, S.B.; Prabhu, S.V. Experimental investigations on single-stage modified Savonius rotor. Appl. Energy 2009, 86, 1064–1073. [Google Scholar] [CrossRef]
  7. Wong, K.H.; Chong, W.T.; Sukiman, N.L.; Poh, S.C.; Shiah, Y.C.; Wang, C.T. Performance enhancements on vertical axis wind turbines using flow augmentation systems: A review. Renew. Sustain. Energy Rev. 2017, 73, 904–921. [Google Scholar] [CrossRef]
  8. Akwa, J.V.; Vielmo, H.A.; Petry, A.P. A review on the performance of Savonius wind turbines. Renew. Sustain. Energy Rev. 2012, 16, 3054–3064. [Google Scholar] [CrossRef]
  9. Zemamou, M.; Aggour, M.; Toumi, A. Review of Savonius wind turbine design and performance. Energy Procedia 2017, 141, 383–388. [Google Scholar] [CrossRef]
  10. Abdelghafar, I.; Kerikous, E.; Hoerner, S.; Thévenin, D. Evolutionary optimization of a Savonius rotor with sandeel-inspired blades. Ocean Eng. 2023, 279, 114504. [Google Scholar] [CrossRef]
  11. Kerikous, E.; Thévenin, D. Performance enhancement of a hydraulic Savonius turbine by optimizing overlap and gap ratios. In Gas Turbine India Conference; American Society of Mechanical Engineers: New York, NY, USA, 2019; Volume 8353, p. V002T06A016. [Google Scholar]
  12. Tian, W.; Mao, Z.; Zhang, B.; Li, Y. Shape optimization of a Savonius wind rotor with different convex and concave sides. Renew. Energy 2018, 117, 287–299. [Google Scholar] [CrossRef]
  13. Kerikous, E.; Thévenin, D. Optimal shape of thick blades for a hydraulic Savonius turbine. Renew. Energy 2019, 134, 629–638. [Google Scholar] [CrossRef]
  14. Mohamed, M.; Janiga, G.; Pap, E.; Thévenin, D. Optimization of Savonius turbines using an obstacle shielding the returning blade. Renew. Energy 2010, 35, 2618–2626. [Google Scholar] [CrossRef]
  15. Golecha, K.; Eldho, T.; Prabhu, S. Influence of the deflector plate on the performance of modified Savonius water turbine. Appl. Energy 2011, 88, 3207–3217. [Google Scholar] [CrossRef]
  16. El-Askary, W.; Nasef, M.; Abdel-Hamid, A.; Gad, H. Harvesting wind energy for improving performance of Savonius rotor. J. Wind Eng. Ind. Aerodyn. 2015, 139, 8–15. [Google Scholar] [CrossRef]
  17. Elbatran, A.; Ahmed, Y.M.; Shehata, A.S. Performance study of ducted nozzle Savonius water turbine, comparison with conventional Savonius turbine. Energy 2017, 134, 566–584. [Google Scholar] [CrossRef]
  18. Salleh, M.B.; Kamaruddin, N.M.; Tion, P.H.; Mohamed-Kassim, Z. Comparison of the power performance of a conventional Savonius turbine with various deflector configurations in wind and water. Energy Convers. Manag. 2021, 247, 114726. [Google Scholar] [CrossRef]
  19. Ayadi, A.; Rabeh, N.; Nasraoui, H.; Mosbahi, M.; Driss, Z. Enhancing the efficiency of hydrokinetic Savonius turbine with guiding walls. Environ. Prog. Sustain. Energy 2025, 44, e14532. [Google Scholar]
  20. Heikal, H.A.; Abu-Elyazeed, O.S.; Nawar, M.A.; Attai, Y.A.; Mohamed, M.M. On the actual power coefficient by theoretical developing of the diffuser flange of wind-lens turbine. Renew. Energy 2018, 125, 295–305. [Google Scholar] [CrossRef]
  21. Kerikous, E.; Thévenin, D. Optimal shape and position of a thick deflector plate in front of a hydraulic Savonius turbine. Energy 2019, 189, 116157. [Google Scholar] [CrossRef]
  22. Kerikous, E.; Kováts, P.; Hoerner, S.; Thévenin, D. Optimization and experimental validation of Savonius turbines with integrated deflector for enhanced low-speed hydropower efficiency. In Proceedings of the 16th European Conference on Turbomachinery Fluid Dynamics & Thermodynamics, Hannover, Germany, 24–28 March 2025. [Google Scholar]
  23. Cleynen, O.; Kerikous, E.; Hoerner, S.; Thévenin, D. Characterization of the performance of a free-stream water wheel using computational fluid dynamics. Energy 2018, 165, 1392–1400. [Google Scholar] [CrossRef]
  24. Cleynen, O.; Kerikous, E.; Hoerner, S.; Thévenin, D. Influence of flotation bodies on the power characteristics of a free-stream water wheel. In Computational and Experimental Methods in Multiphase and Complex Flow IX 55; WIT Press: Southampton, UK, 2017; Volume 60. [Google Scholar]
  25. Moffat, R. Describing the uncertainties in experimental results. Exp. Therm. Fluid Sci. 1988, 1, 3–17. [Google Scholar] [CrossRef]
Figure 1. Water channel at the Laboratory for Fluid Dynamics and Technical Flows (LSS), Otto von Guericke University (OvGU).
Ijtpp 11 00030 g001
Figure 2. Sketch of the inlet section of the water flume.
Ijtpp 11 00030 g002
Figure 3. Inlet section featuring honeycomb and mesh flow straighteners.
Ijtpp 11 00030 g003
Figure 4. Configuration of the weir system at the outlet of the water channel.
Ijtpp 11 00030 g004
Figure 5. Standard Savonius turbine configuration featuring a torque sensor and electric drive system.
Ijtpp 11 00030 g005
Figure 6. Sensor for measuring torque and rotational speed.
Ijtpp 11 00030 g006
Figure 7. Double-frame operation for synchronized camera exposures and illumination pulses.
Ijtpp 11 00030 g007
Figure 8. PIV arrangement for analyzing the flow pattern behind the turbine.
Ijtpp 11 00030 g008
Figure 9. PIV setup for capturing and storing images.
Ijtpp 11 00030 g009
Figure 10. Calibration plate for camera adjustments.
Ijtpp 11 00030 g010
Figure 11. Overview of correlation window with particles.
Ijtpp 11 00030 g011
Figure 12. Analysis of the correlation window and its related correlation factor.
Ijtpp 11 00030 g012
Figure 13. Technique for assessing uncertainty in the power coefficient C p . The symbol “*” represents multiplication. The different colors are used only for visualization of the parameters.
Ijtpp 11 00030 g013
Figure 14. Comparison of experimental measurements in the water channel and numerical values of the power coefficient C p obtained by 3D CFD simulations.
Ijtpp 11 00030 g014
Figure 15. Comparison of a specific instantaneous velocity field (left) with the average velocity field at the corresponding angular position (right). The arrow represents the flow direction.
Ijtpp 11 00030 g015
Figure 16. Velocity field behind the turbine blades, with flow from top to bottom (indicated by the arrow) for TSR of 0.6 (left) and 1.1 (right), comparing PIV (top) and CFD (bottom).
Ijtpp 11 00030 g016
Figure 17. Front view of the standard Savonius turbine featuring the optimal deflector plate.
Ijtpp 11 00030 g017
Figure 18. Comparative analysis of the average power coefficient ( C p ) at different tip speed ratios for the standard design (dashed line from CFD, surrounding symbols from measurements) and the turbine featuring the optimal deflector plate (solid line from CFD, surrounding symbols from measurements).
Ijtpp 11 00030 g018
Table 1. Error sources for each measured parameter.
Parameter MeasurementError SourcesUncertainty Estimate
DensityFluctuations in ambient temperature0.07%
TorqueSensor precision0.05% F.S
Misalignment of the axis & Frictional energy losses0.004–0.008 N
Rotational speedSensor resolution0.31°
VelocityPrecision of PIV measurements0.5%
Disclaimer/Publisher’s Note: The statements, opinions and data contained in all publications are solely those of the individual author(s) and contributor(s) and not of MDPI and/or the editor(s). MDPI and/or the editor(s) disclaim responsibility for any injury to people or property resulting from any ideas, methods, instructions or products referred to in the content.