4.3.1. Description of the IGV Flow Field
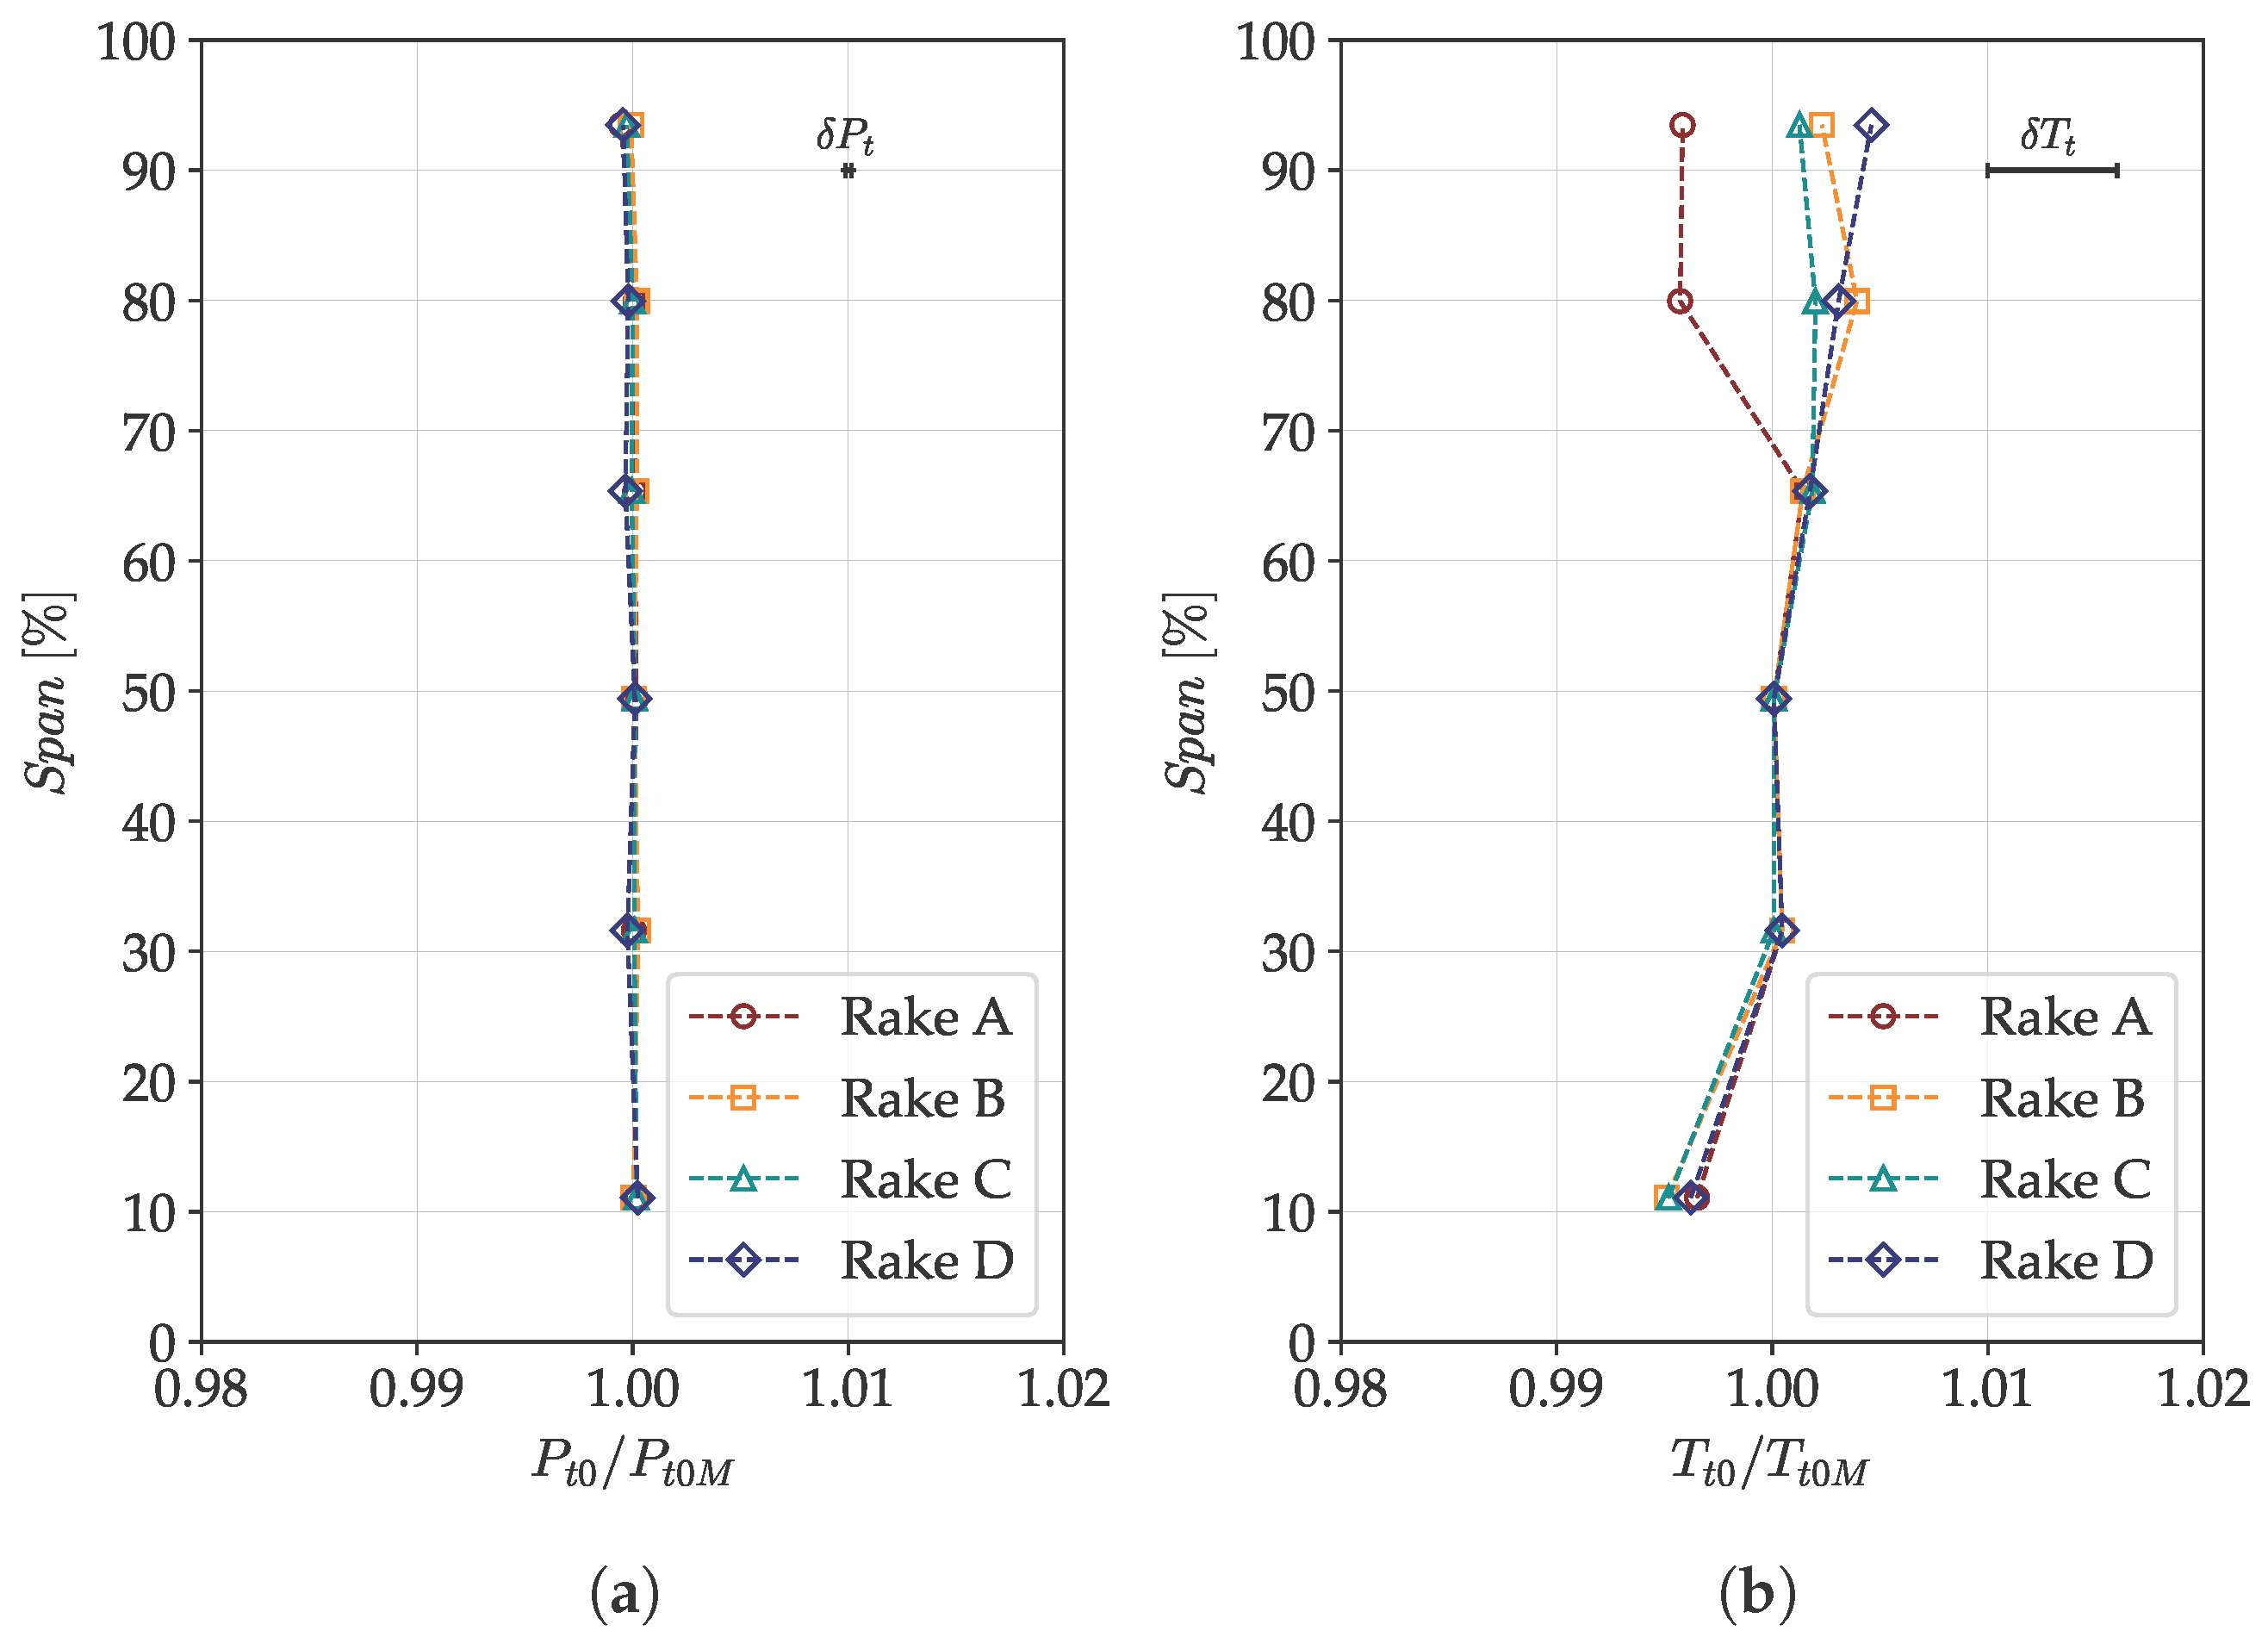
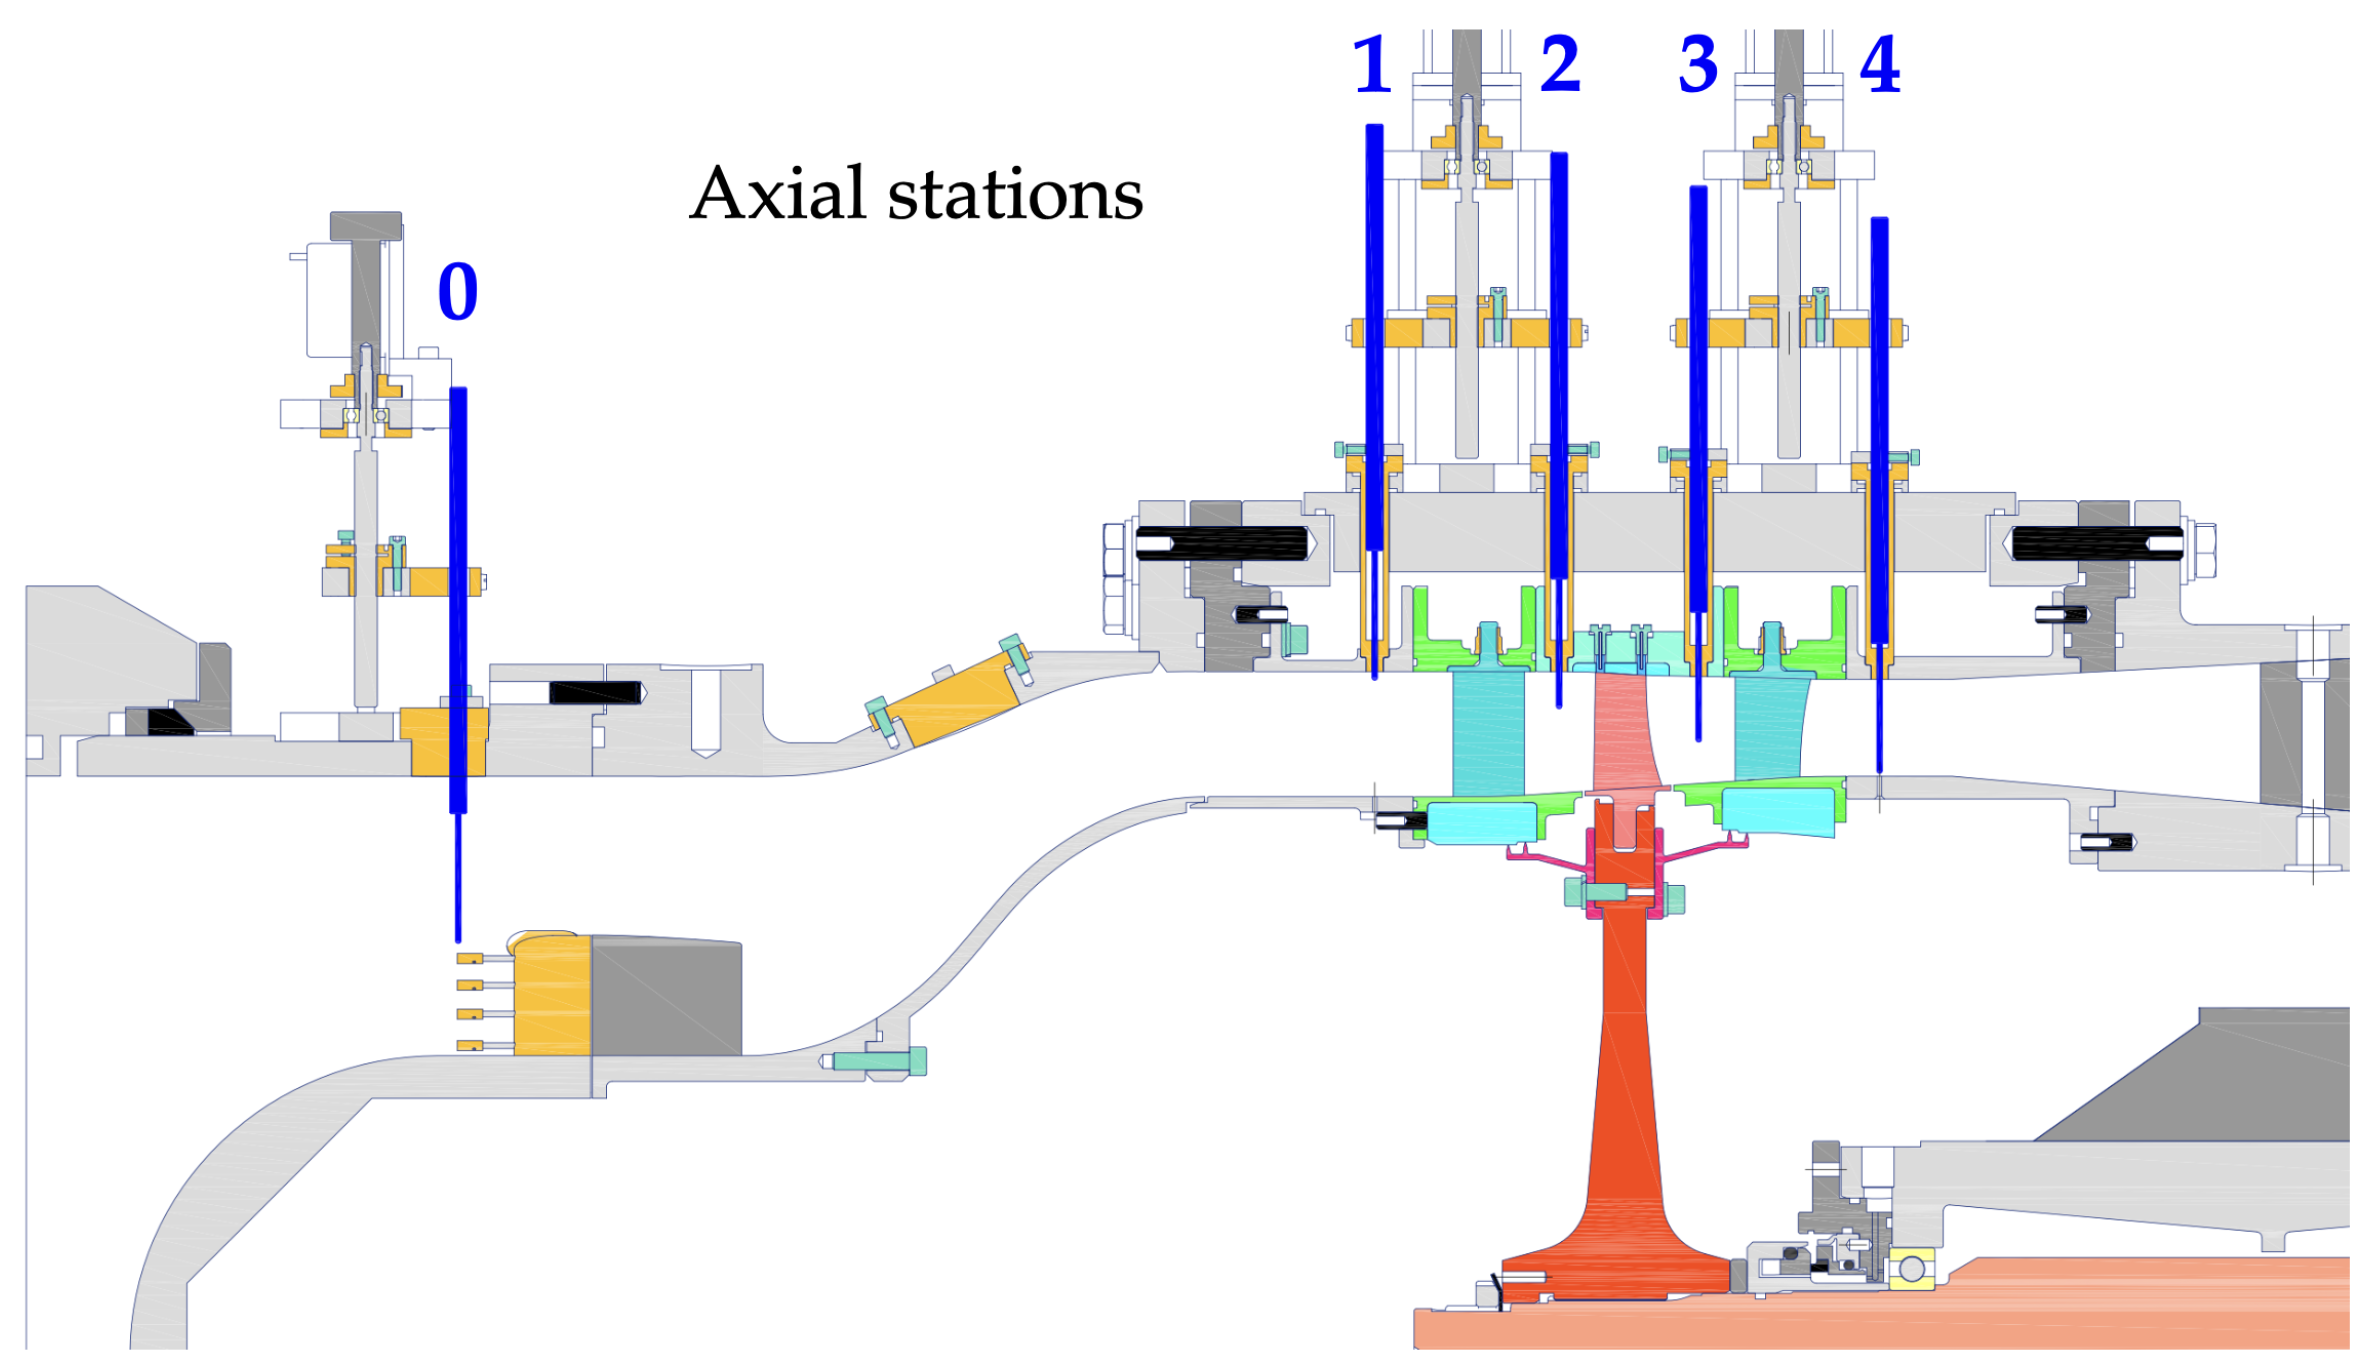
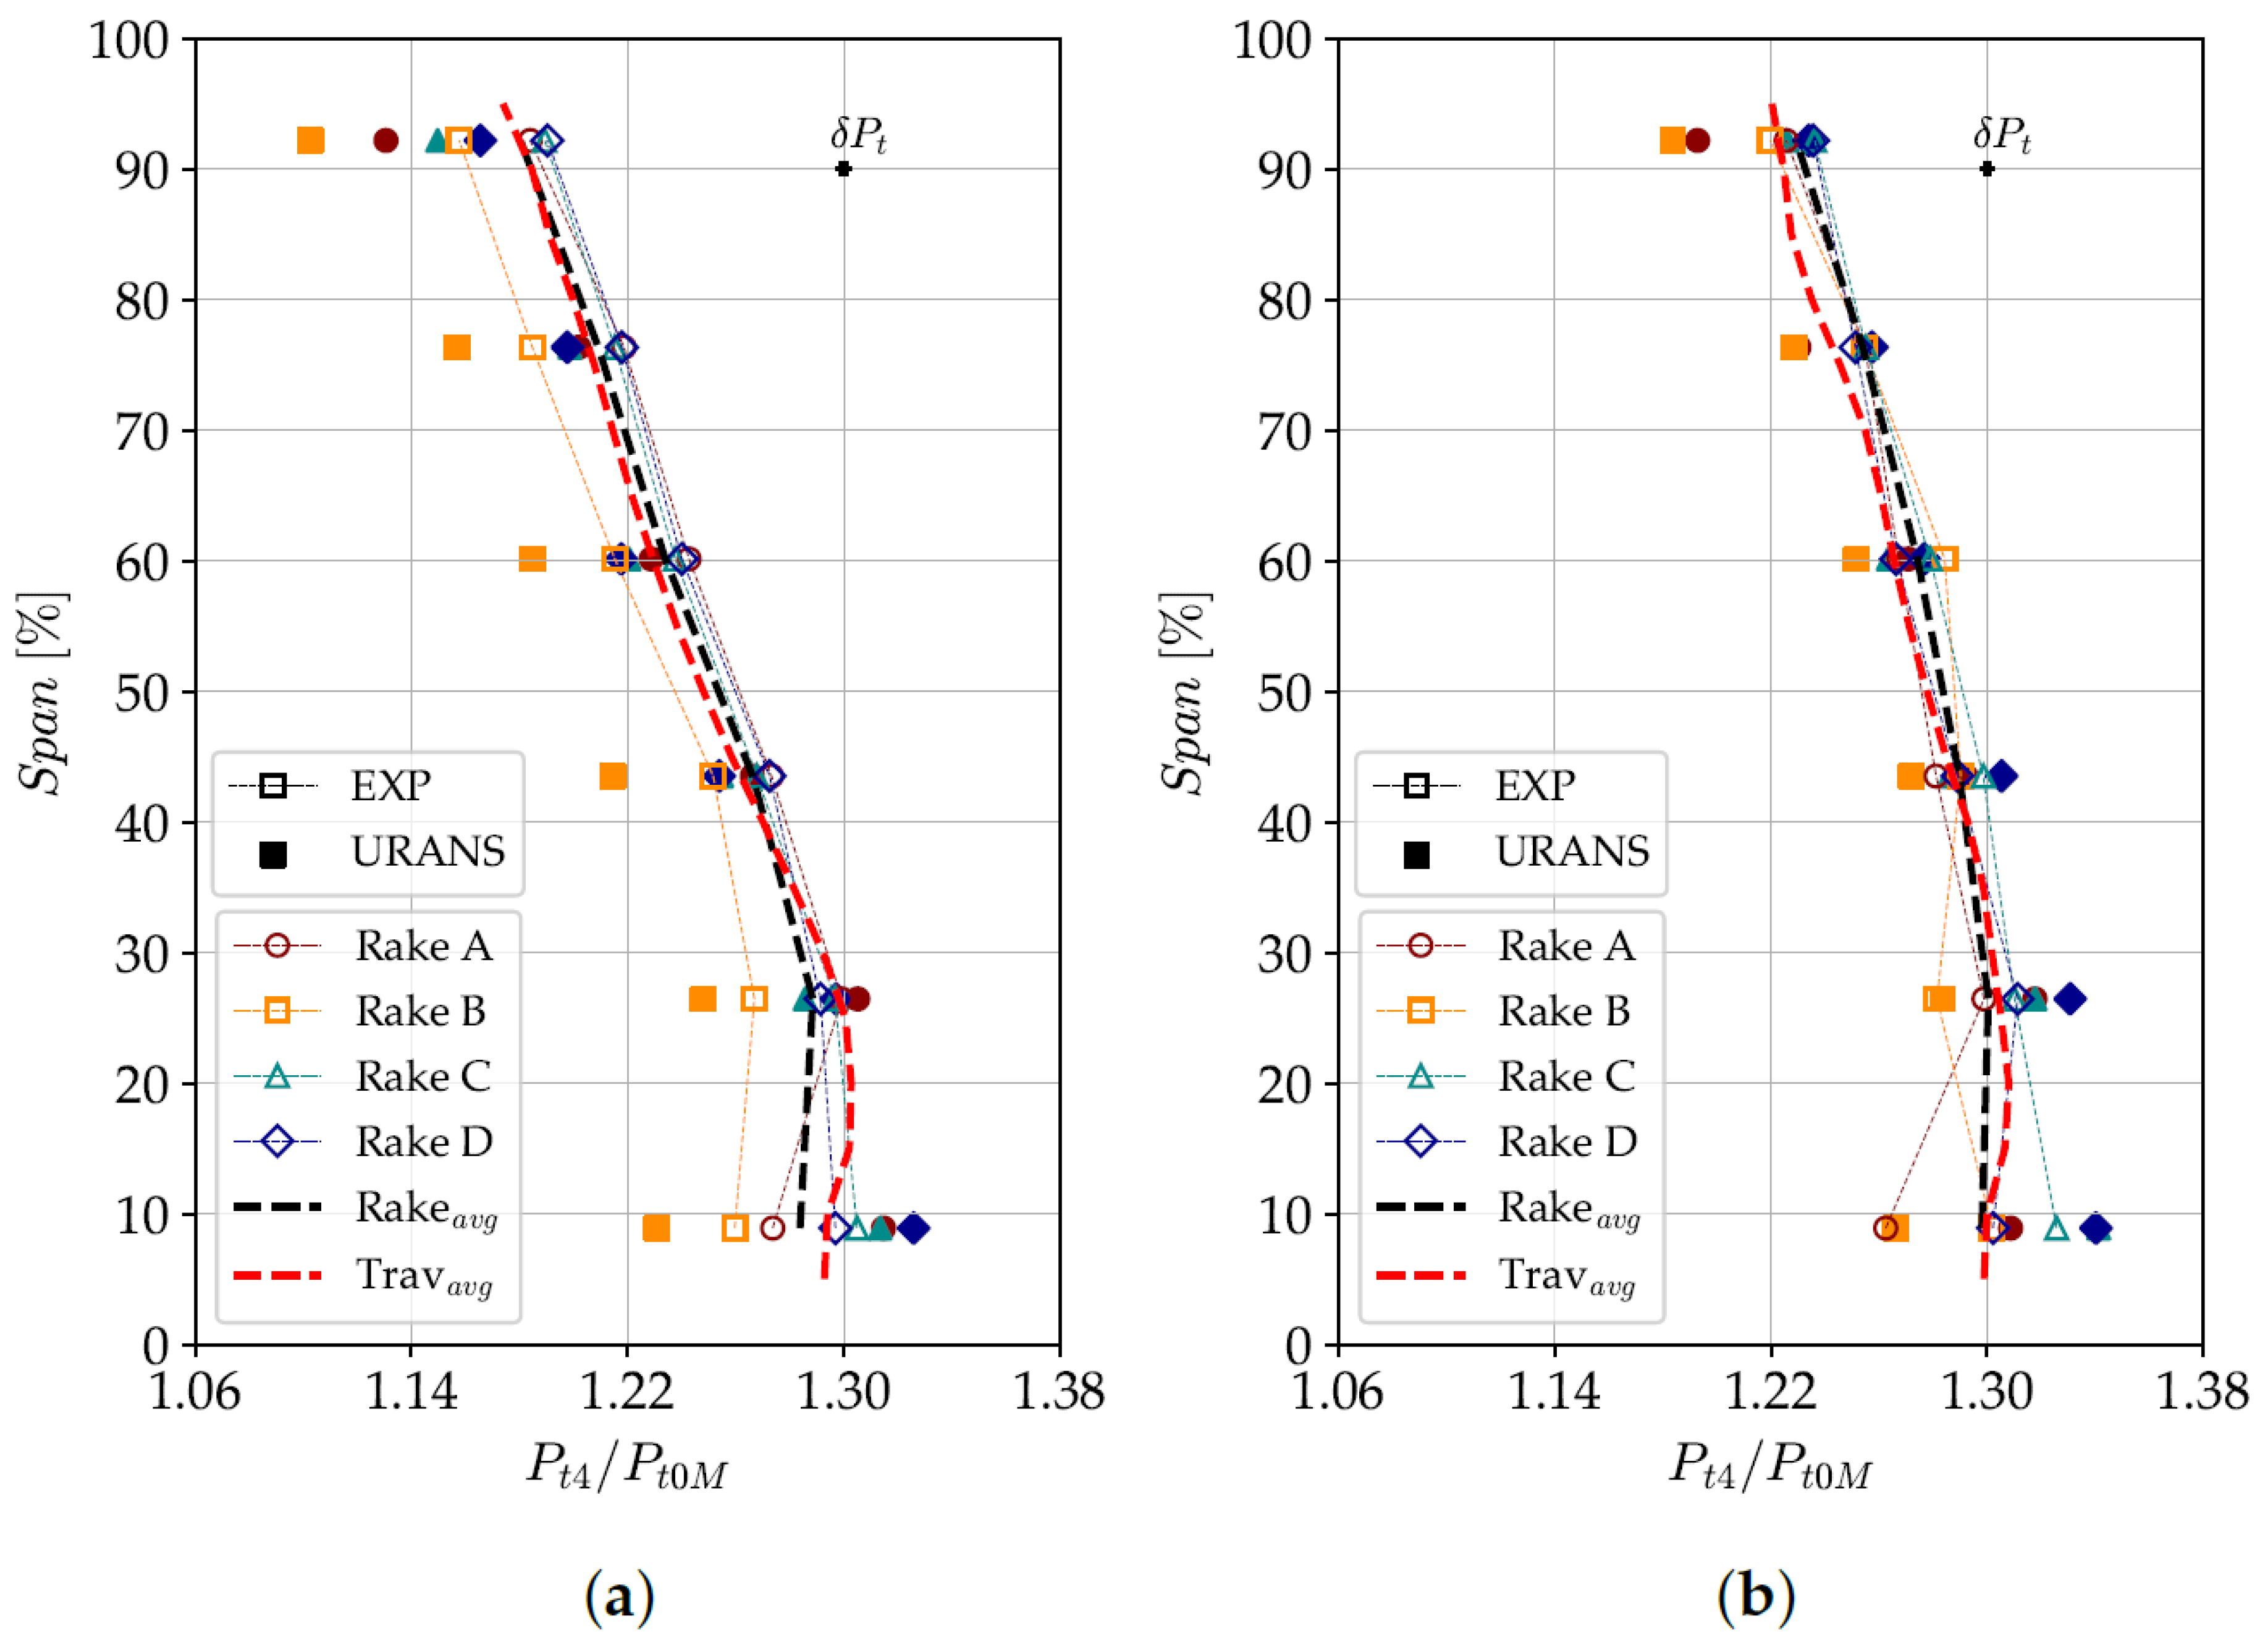
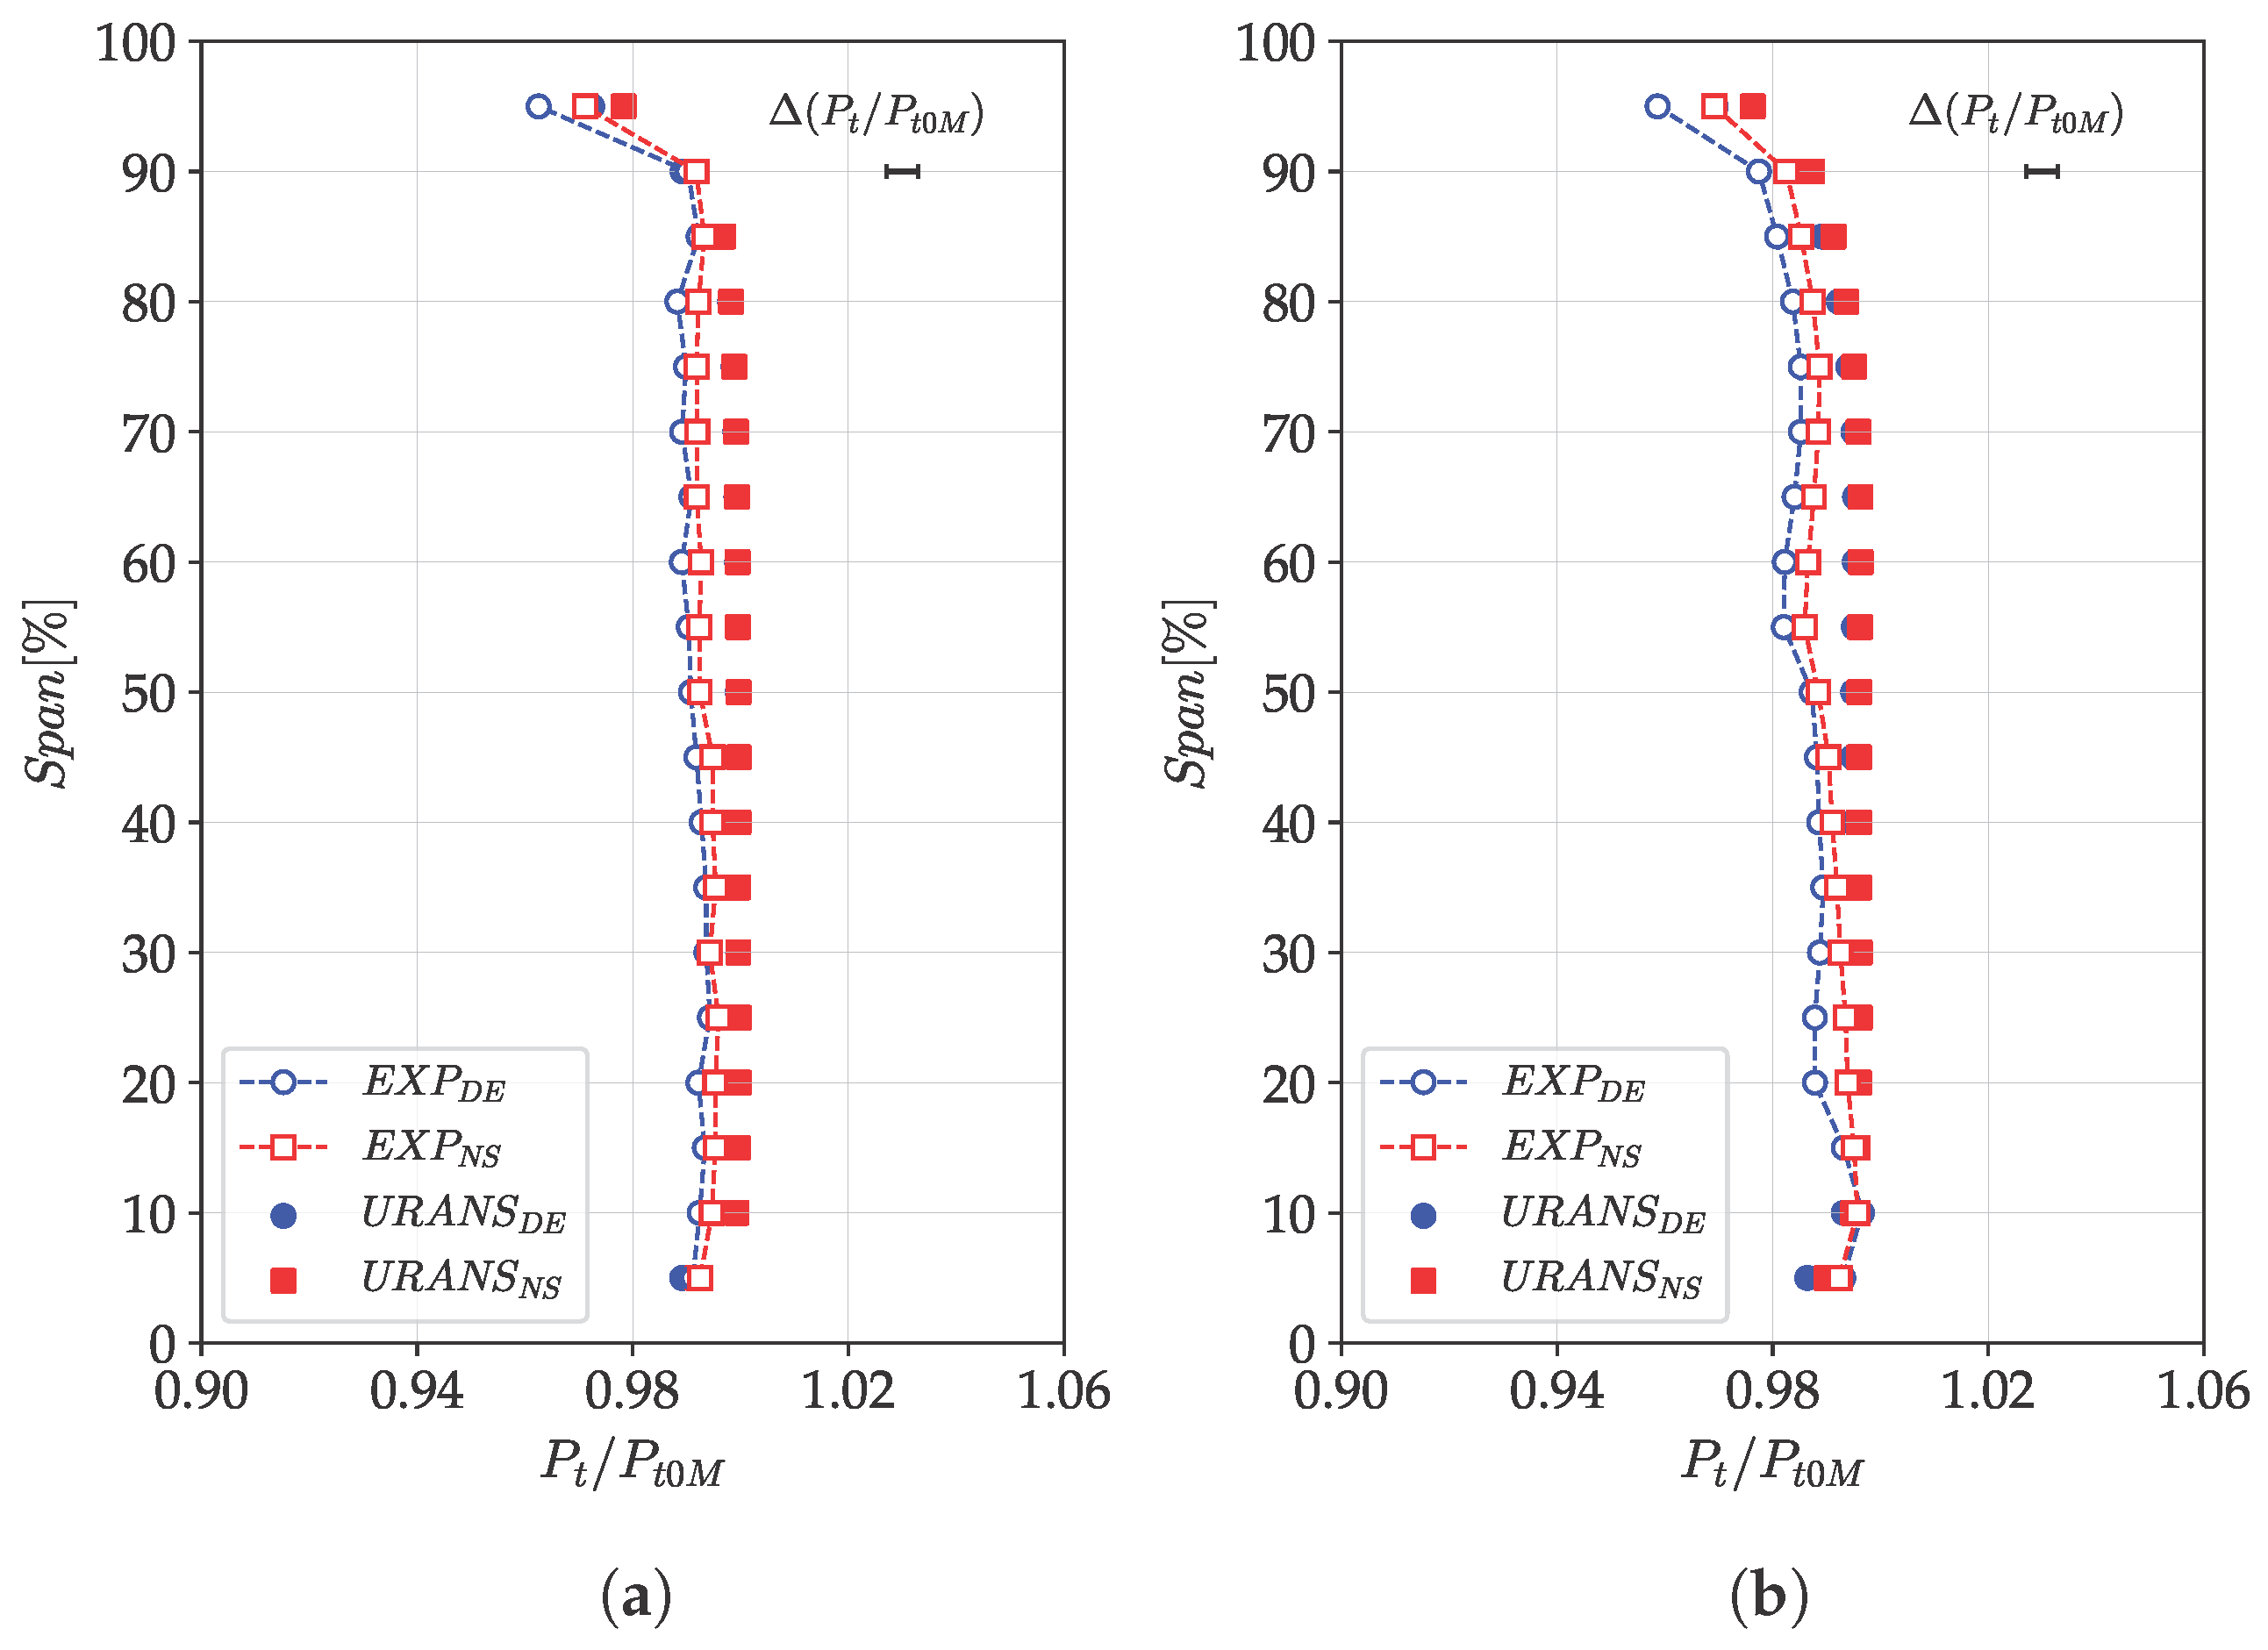
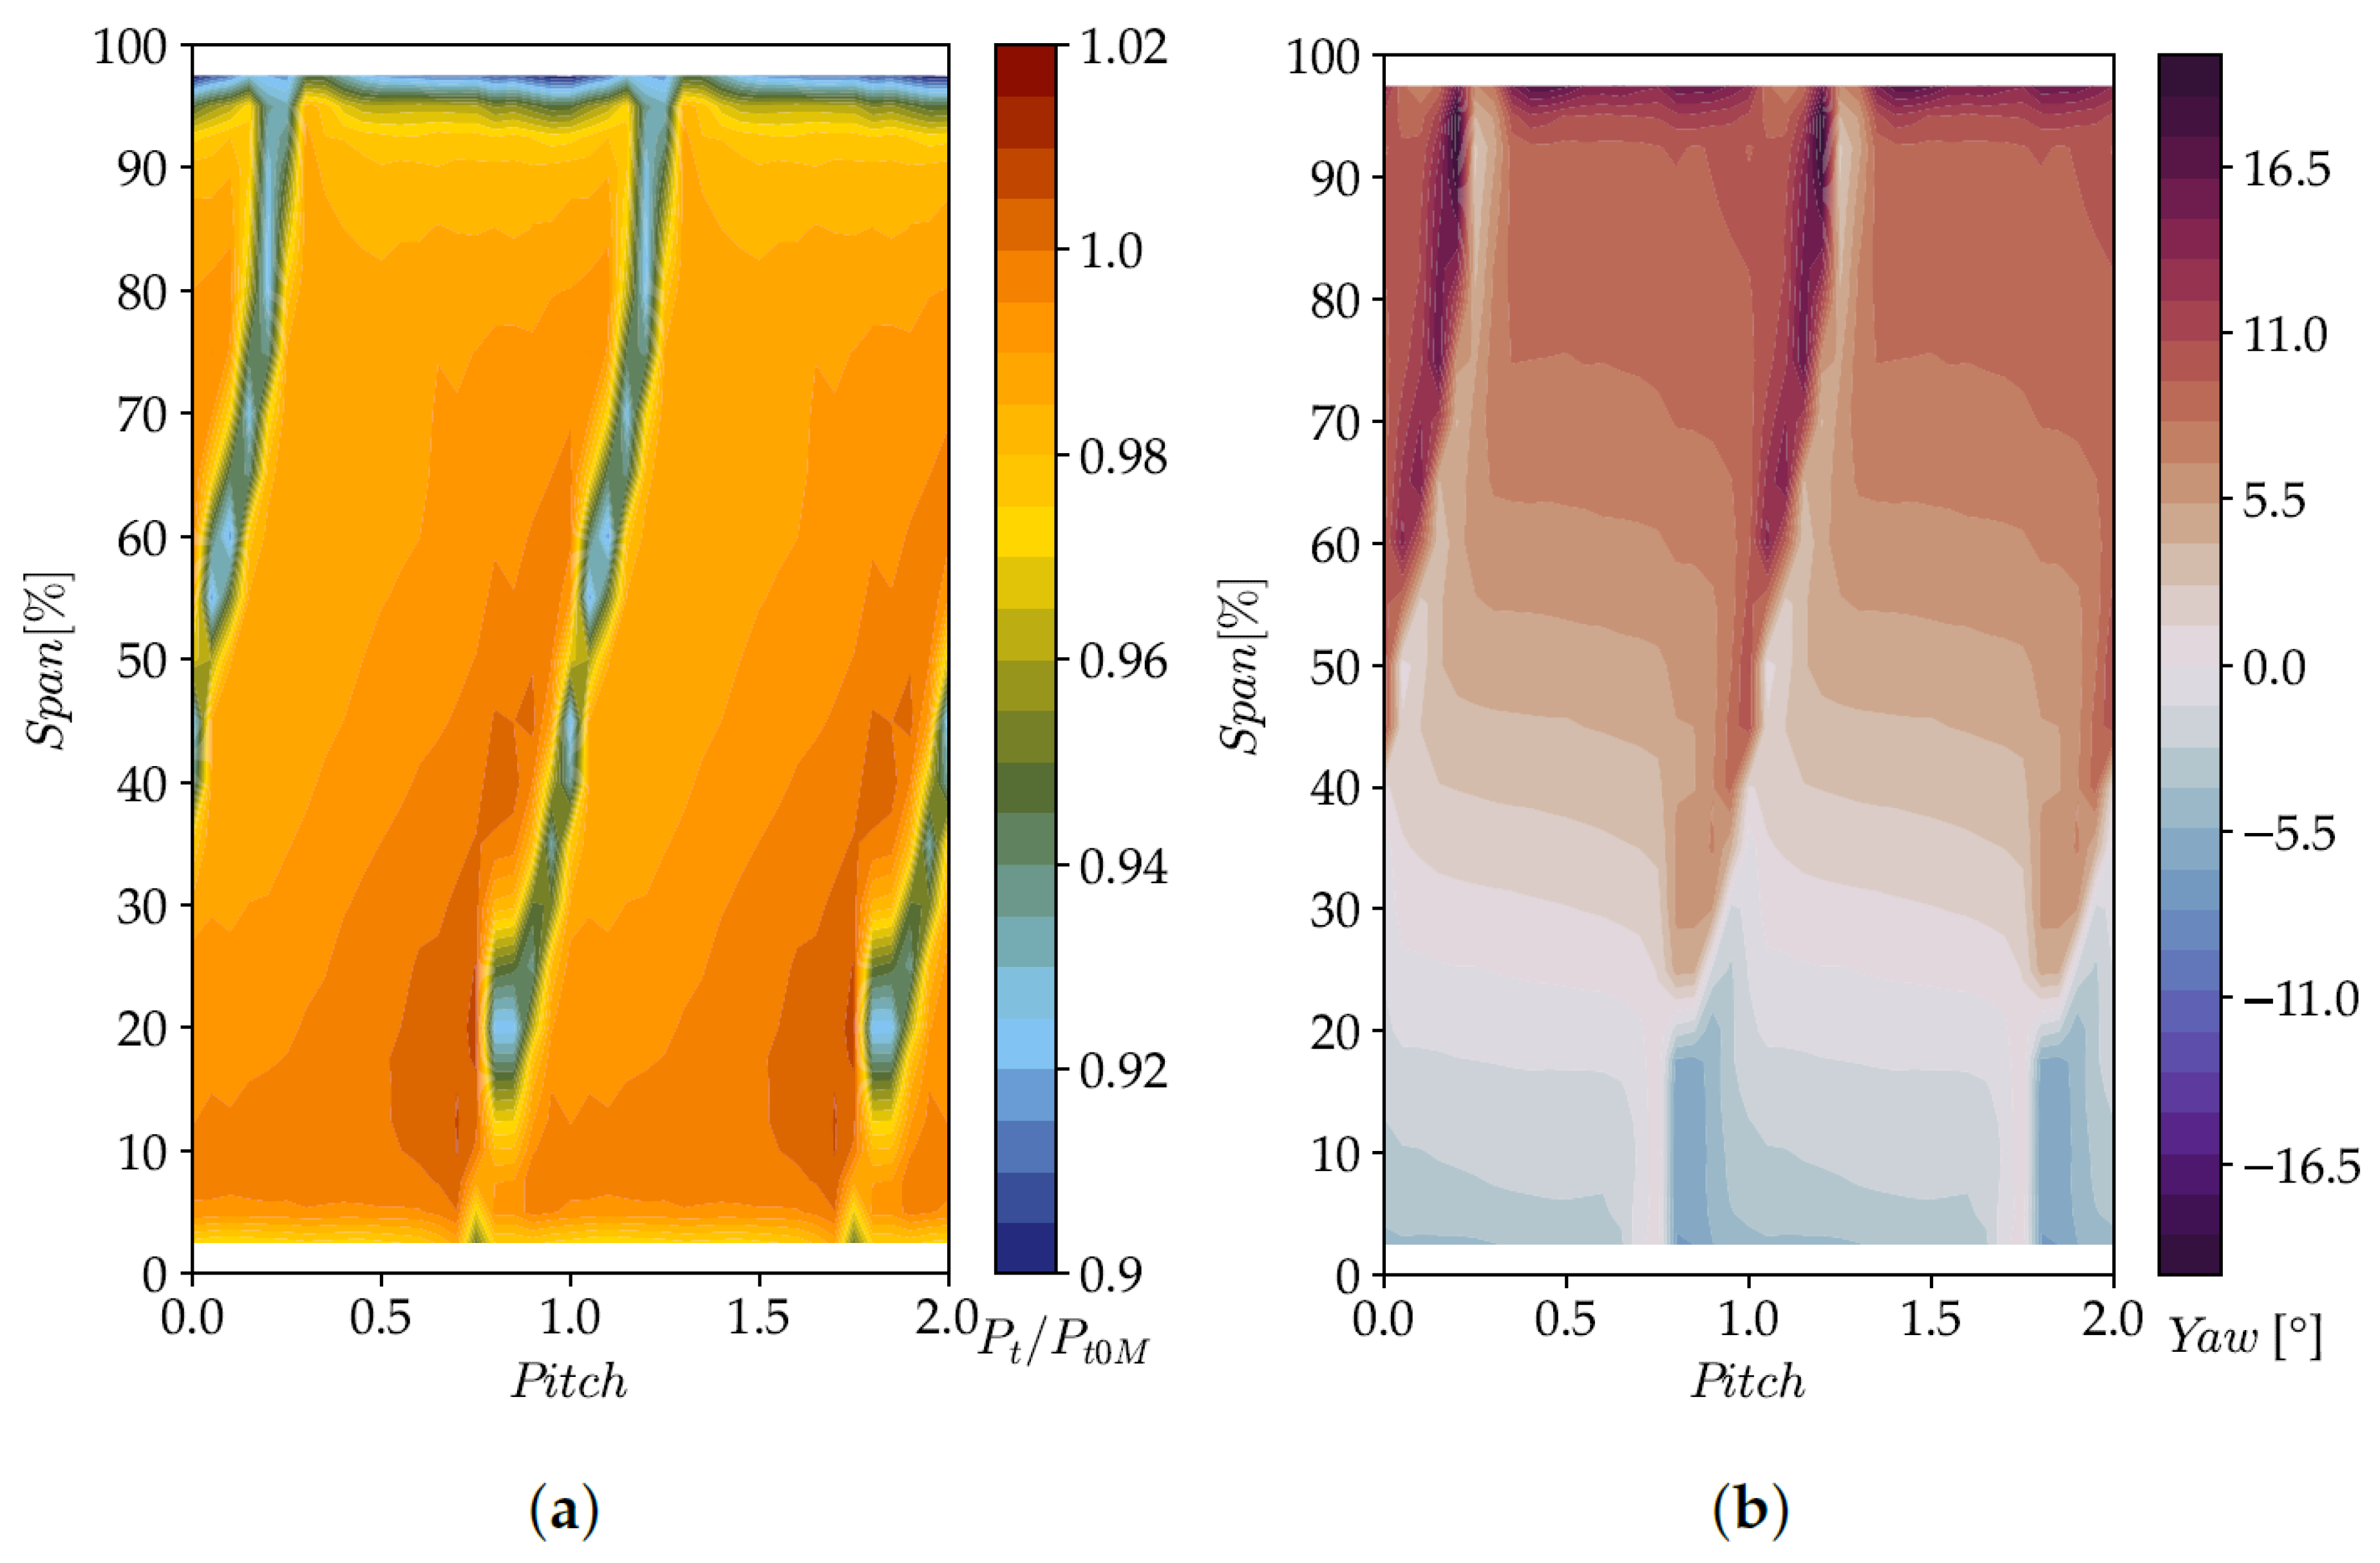
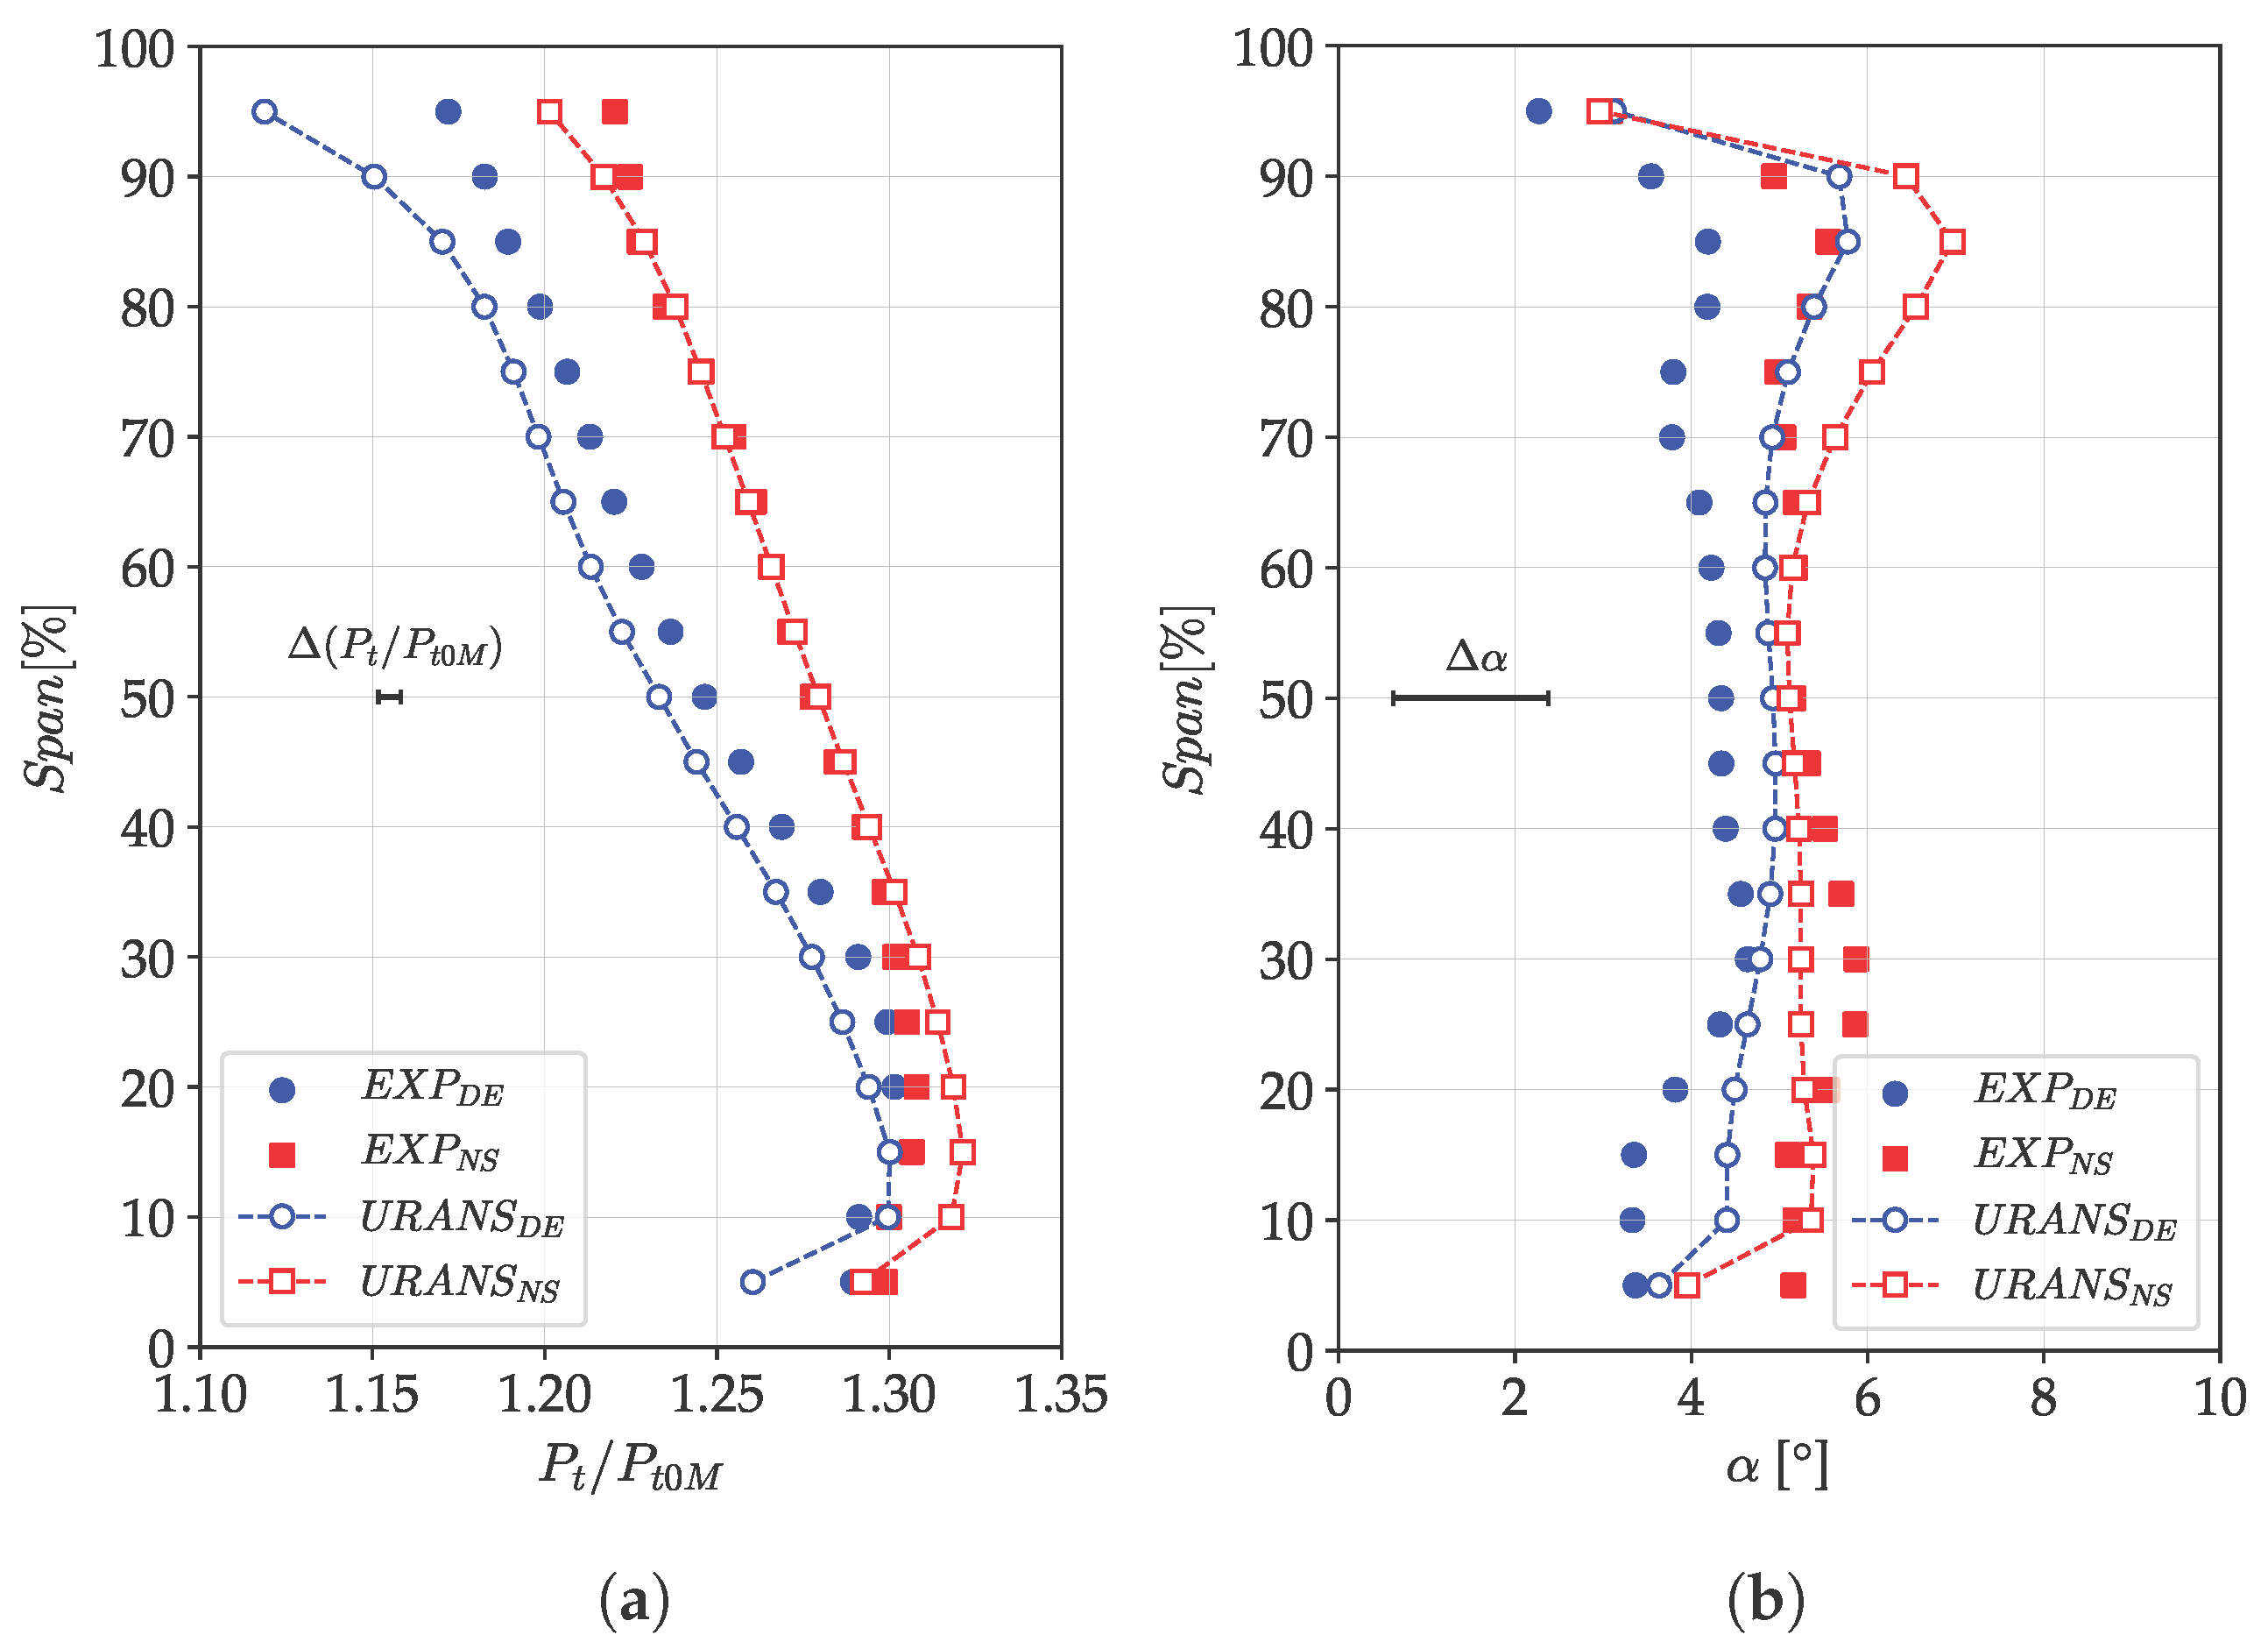
Figure 13 presents the pitch-wise averaged total pressure in Planes 1 and 2 at DE and NS conditions. The experimental uncertainty is also reported. Moreover, it is important to recall that the simulations do not account for the stage inlet duct. Instead, the inlet boundary conditions are applied at the location of experimental Plane 1.
The total pressure measured in Plane 1 at both DE and NS conditions closely aligns with the averaged total pressure measured in Plane 0, although a slight reduction is observed due to mixing losses. Over 90% of the span, a further reduction in total pressure is present, which is attributed to a separation occurring on the tip wall of the stage within the s-shape convergent section upstream of Plane 1. Evidence of such separation on the same machine is also reported in [
23]. As shown in
Figure 13b, the total pressure decreases with respect to Plane 1, primarily due to losses generated within the IGV row. These losses are concentrated in the upper 50% of the span, with a peak observed at the 55% span position.
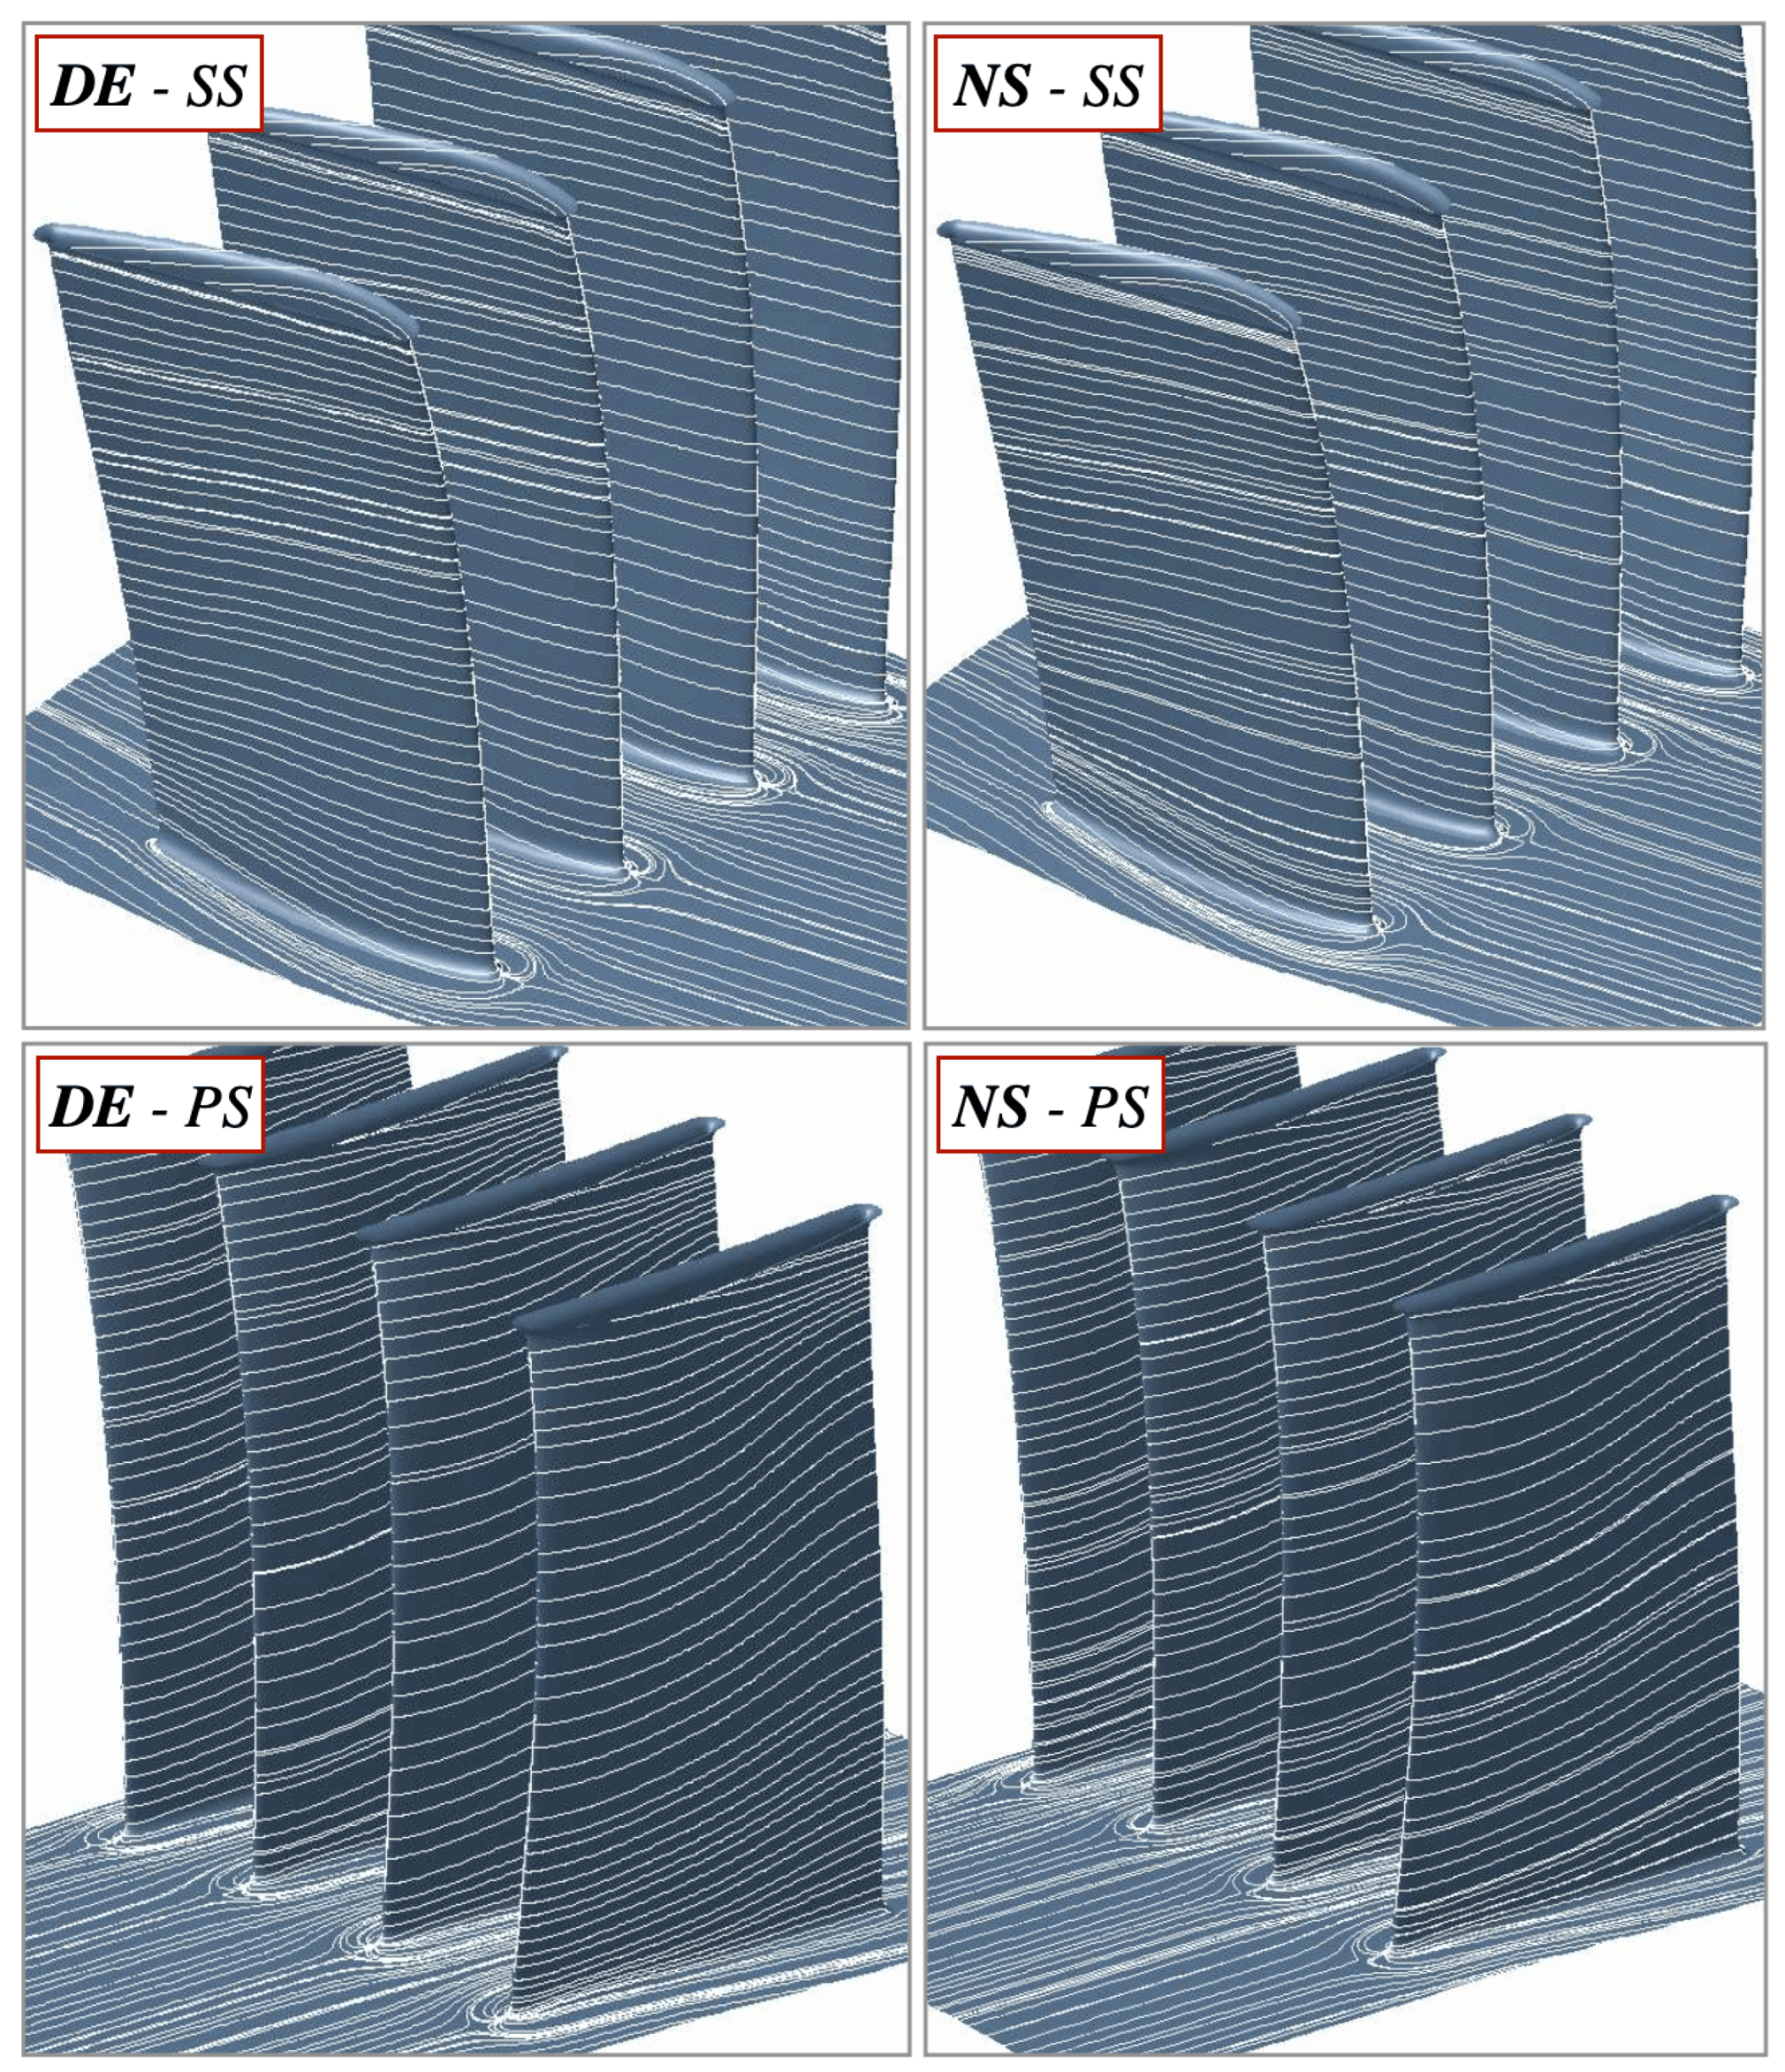
The skin friction lines on the suction and pressure sides of the IGV (
Figure 14), obtained from time-averaged URANS, indicate that the flow moves axially through the passage without significant perturbation. Consequently, the pressure reduction observed in
Figure 13 is primarily attributed to profile losses and mixing, with no critical secondary flows.
The measured flow fields at the IGV outlet (Plane 2) is reported in
Figure 15.
The primary feature observed is the IGV wake, identified as a region of reduced pressure. The outlet flow angle varies from −7.4° near the hub to 21.7° near the tip wall, reflecting the blade geometry. Near the tip, the reduction in total pressure and the increase in flow angle over 95% of the span suggest the presence of the boundary layer. However, only minimal cross-flow is detected on the tip wall, with a slight accumulation of low-momentum flow at the junction with the blade surface. This observation aligns with a minor increase in the IGV loading at higher spans.
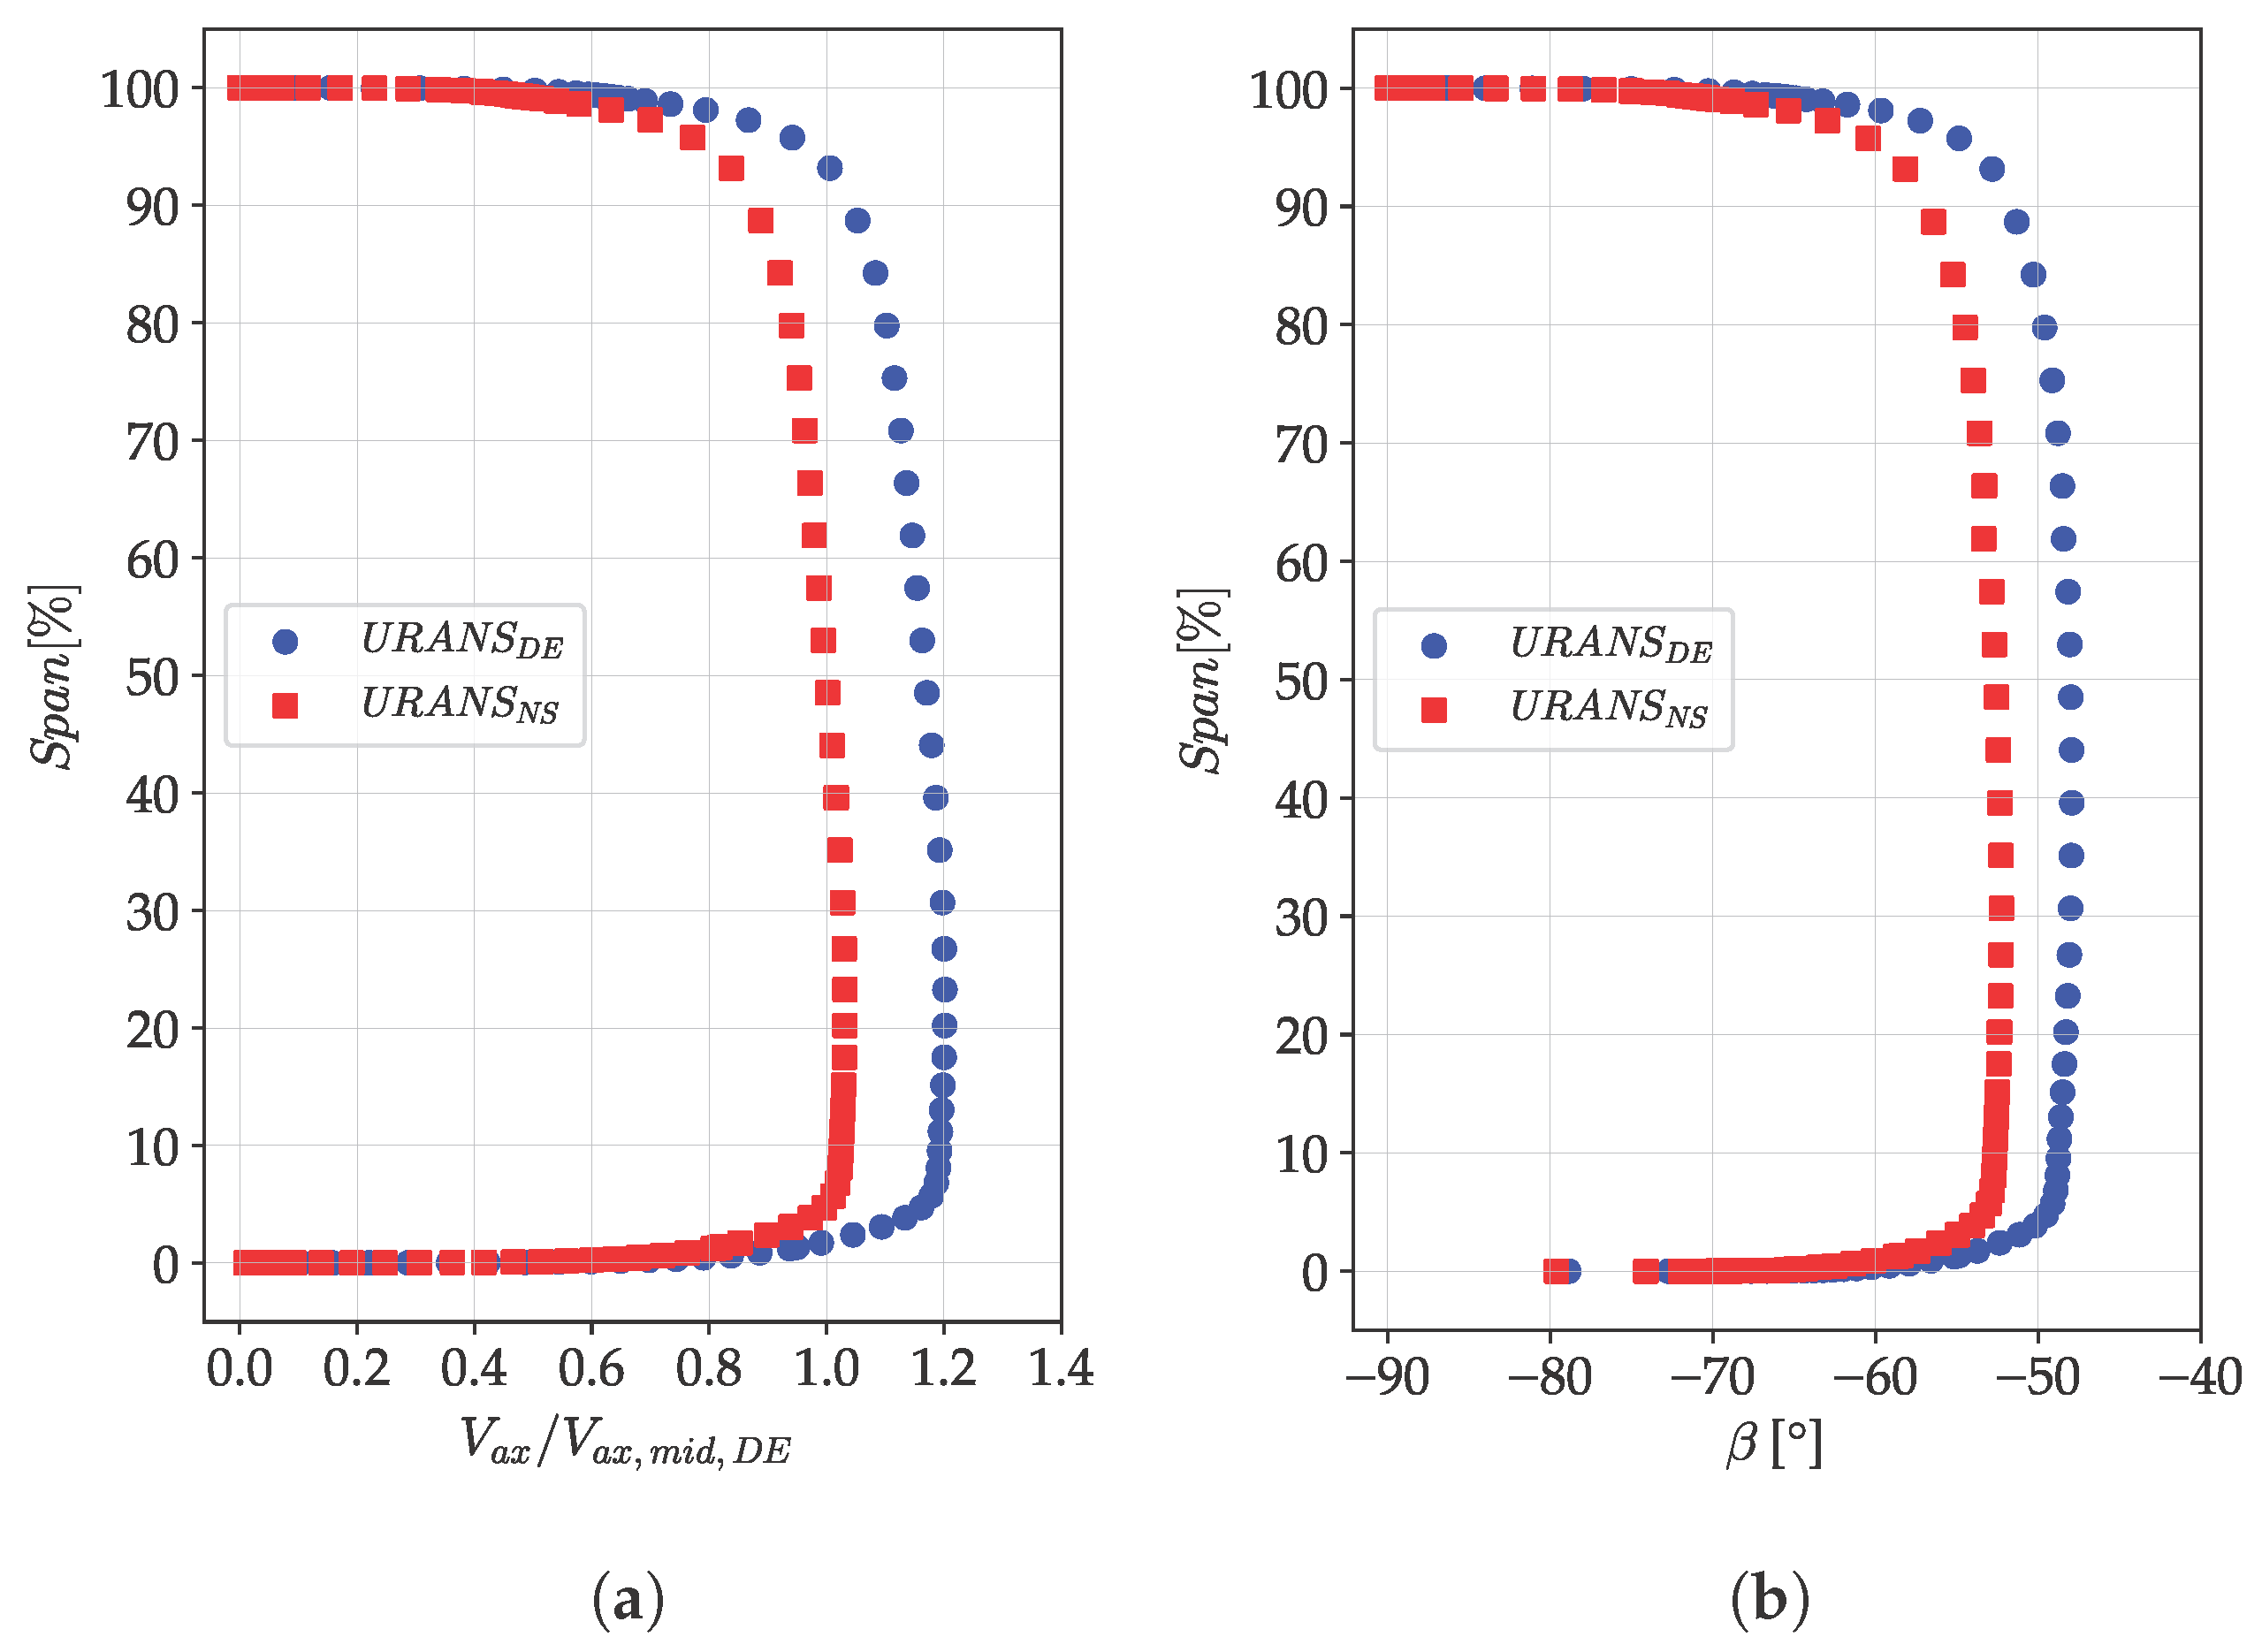
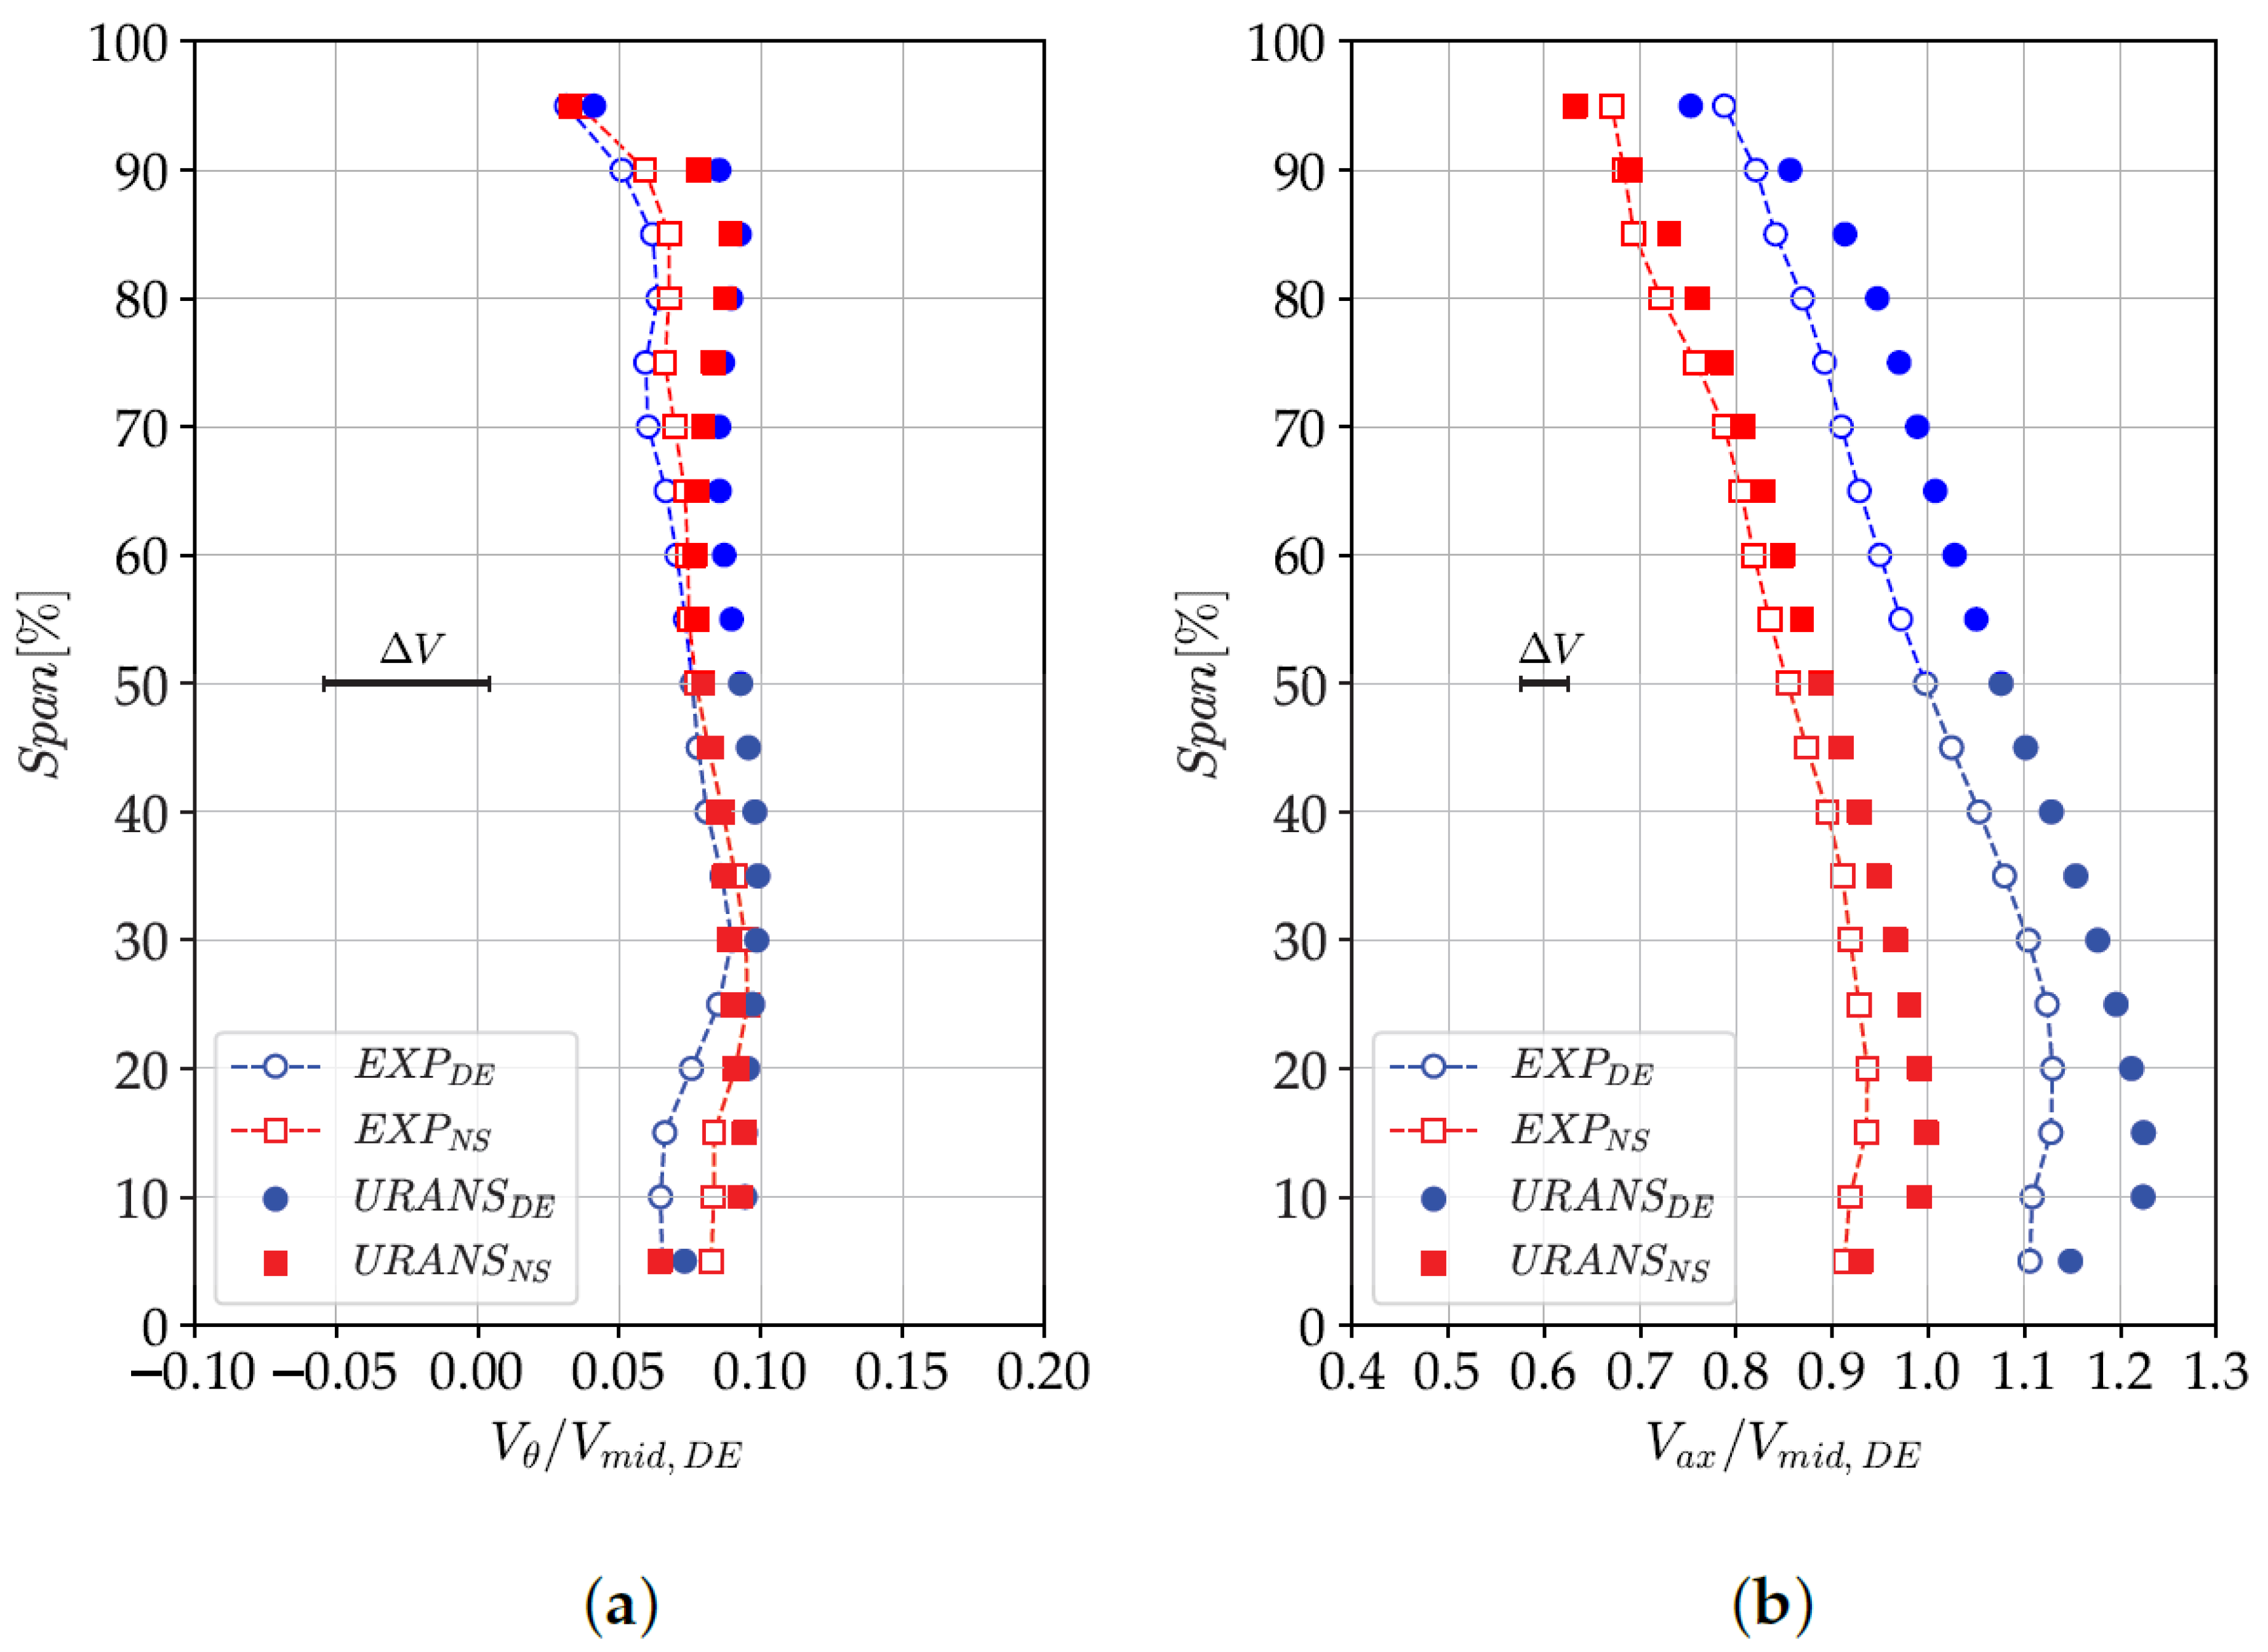
To clarify the flow behavior at the IGV outlet, and thus the conditions at the rotor inlet,
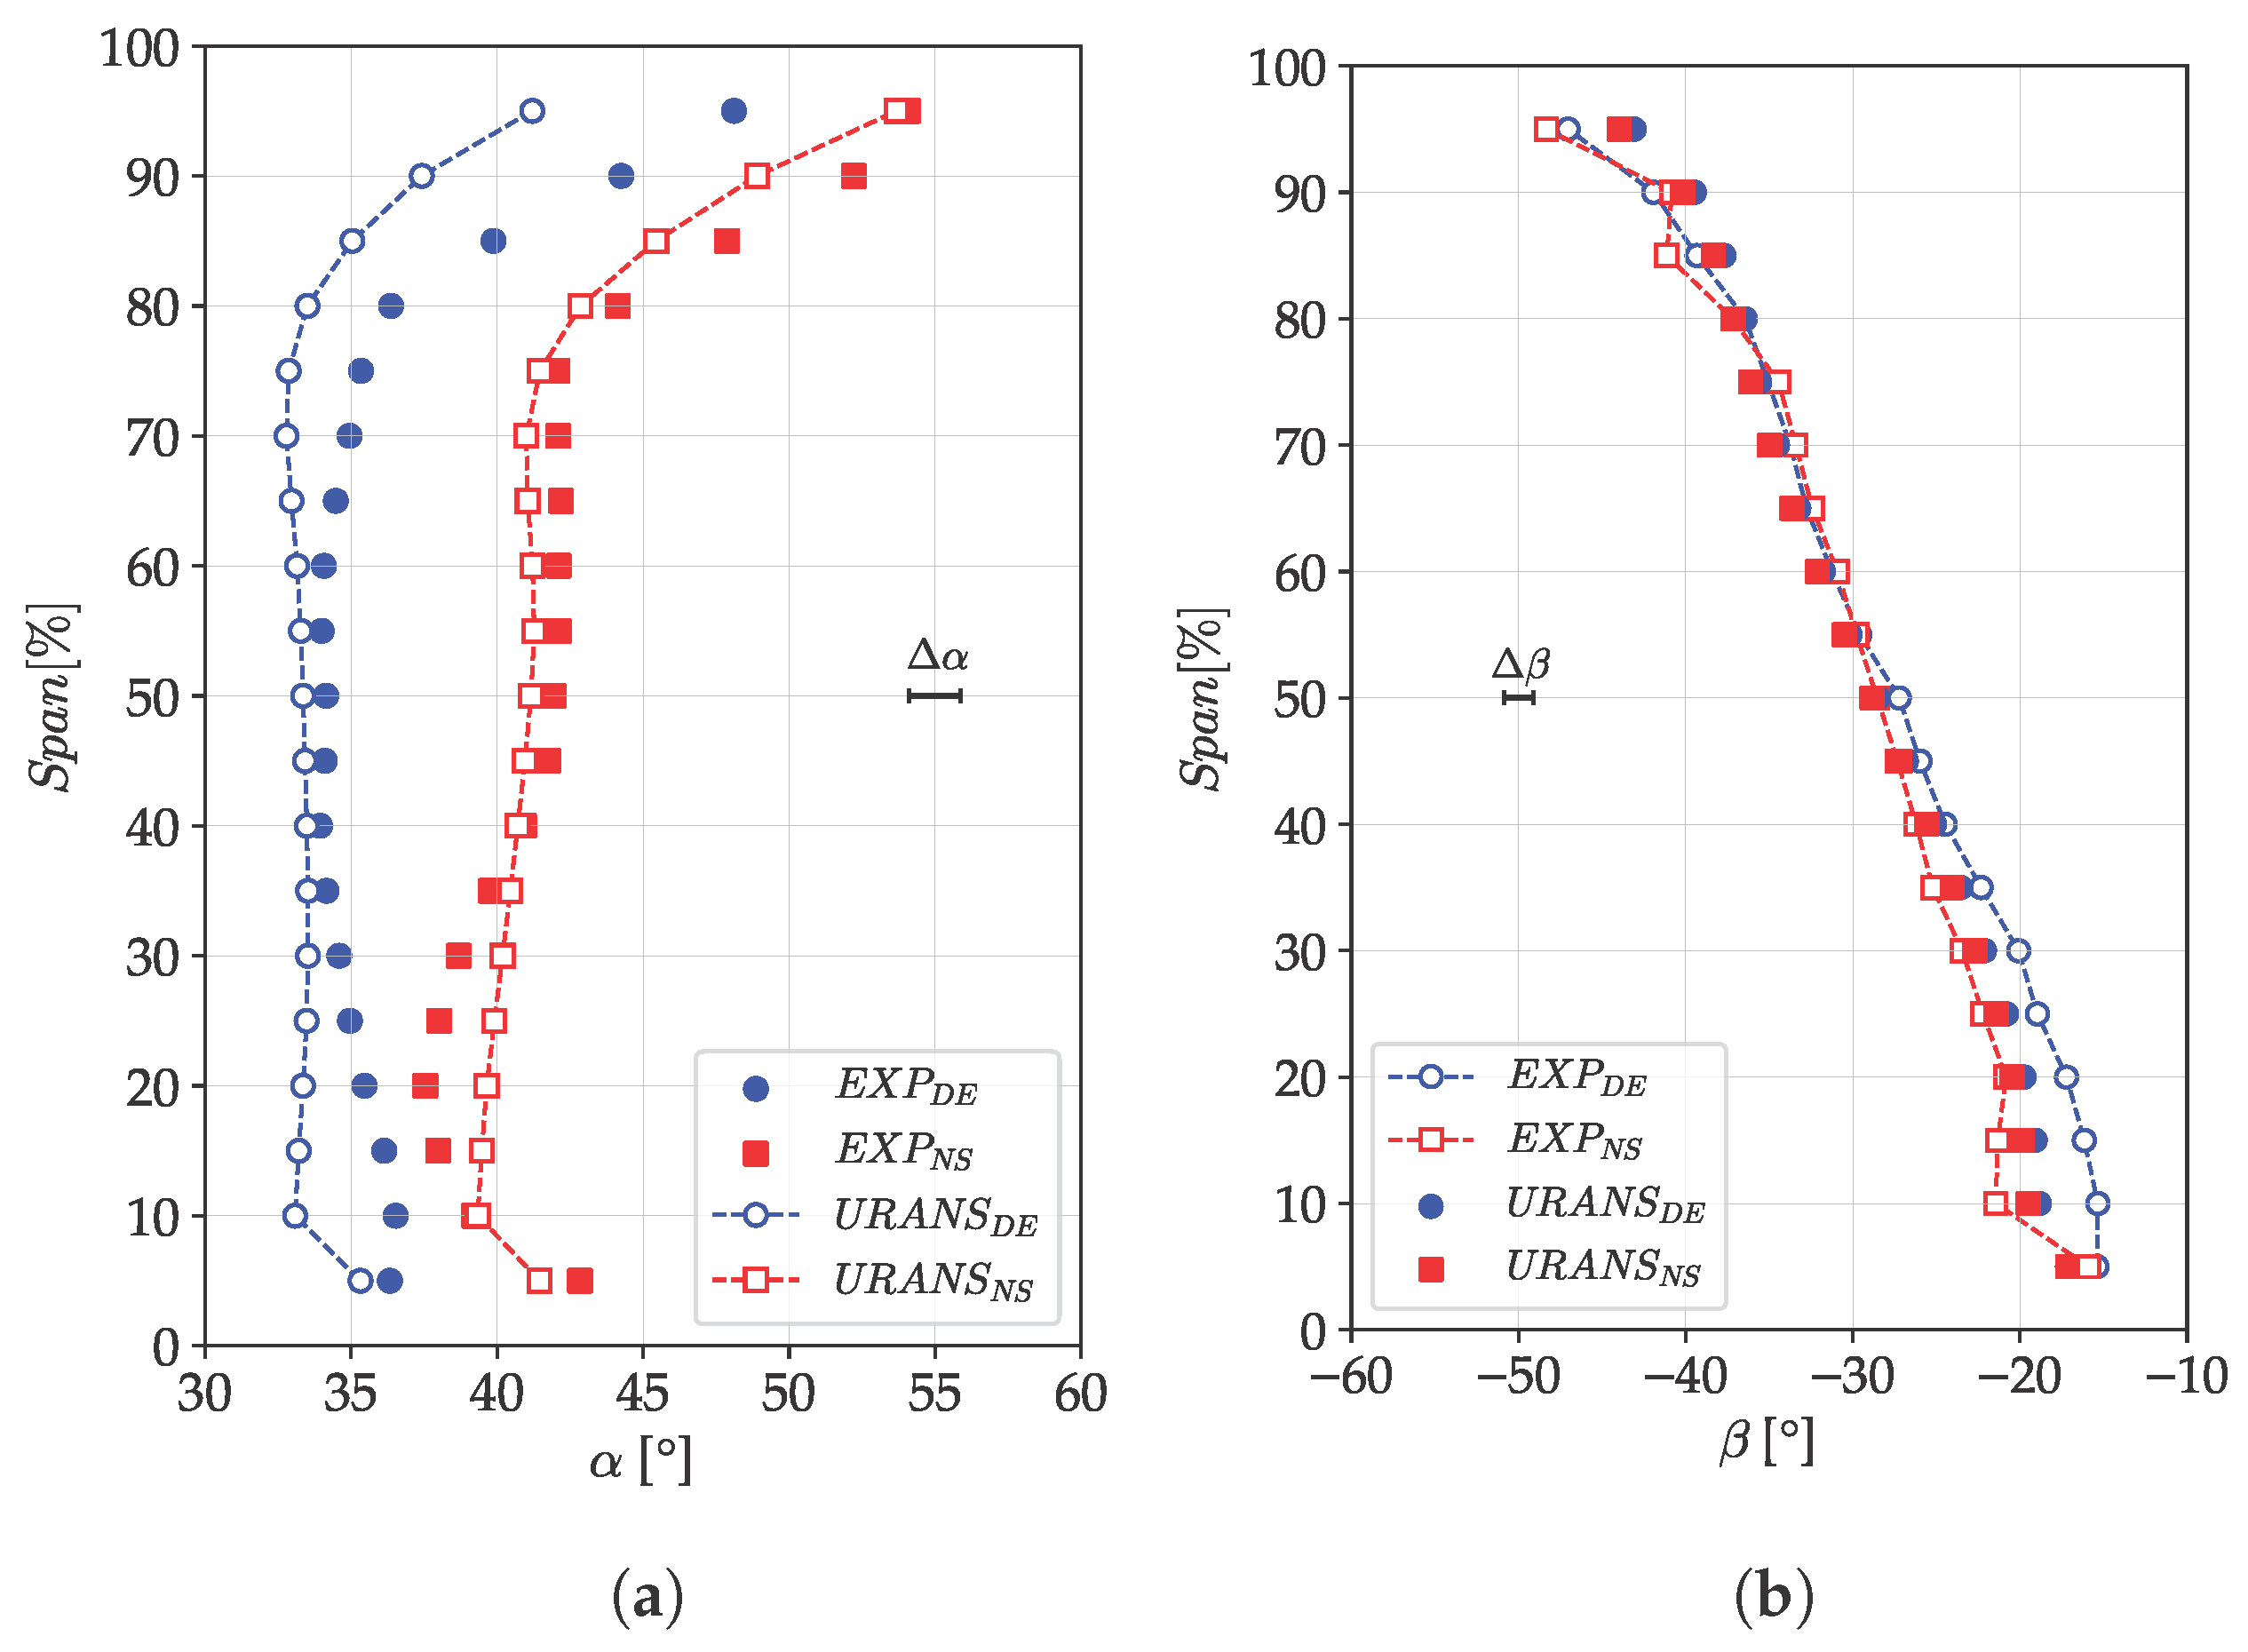
Figure 16 presents the axial velocity, normalized with the mid-span value at DE condition, and the relative flow angle, both obtained from averaged URANS simulations.
Figure 16 shows that, outside the boundary layers, the distributions remain nearly constant in the span-wise direction. However, at higher span-wise positions, a slight reduction in axial velocity is observed as a consequence of the blade action on the flow, which leads to an increase in the relative flow angle, as illustrated in
Figure 16b. Additionally, moving from DE to NS, the relative flow angle at the rotor inlet increases, while the axial velocity decreases due to the change in operating conditions.
In conclusion, the IGV row does not exhibit any significant flow structure and ensures a smooth flow to the rotor. This result aligns with the IGV design, which was installed upstream of the rotor only to replicate the flow field downstream of a fan, without the intention to generate loading.
4.3.2. Description of the Rotor Flow Field
To evaluate the rotor flow field, the outlet conditions are first analyzed, followed by the characterization of the flow features observed within the passage.
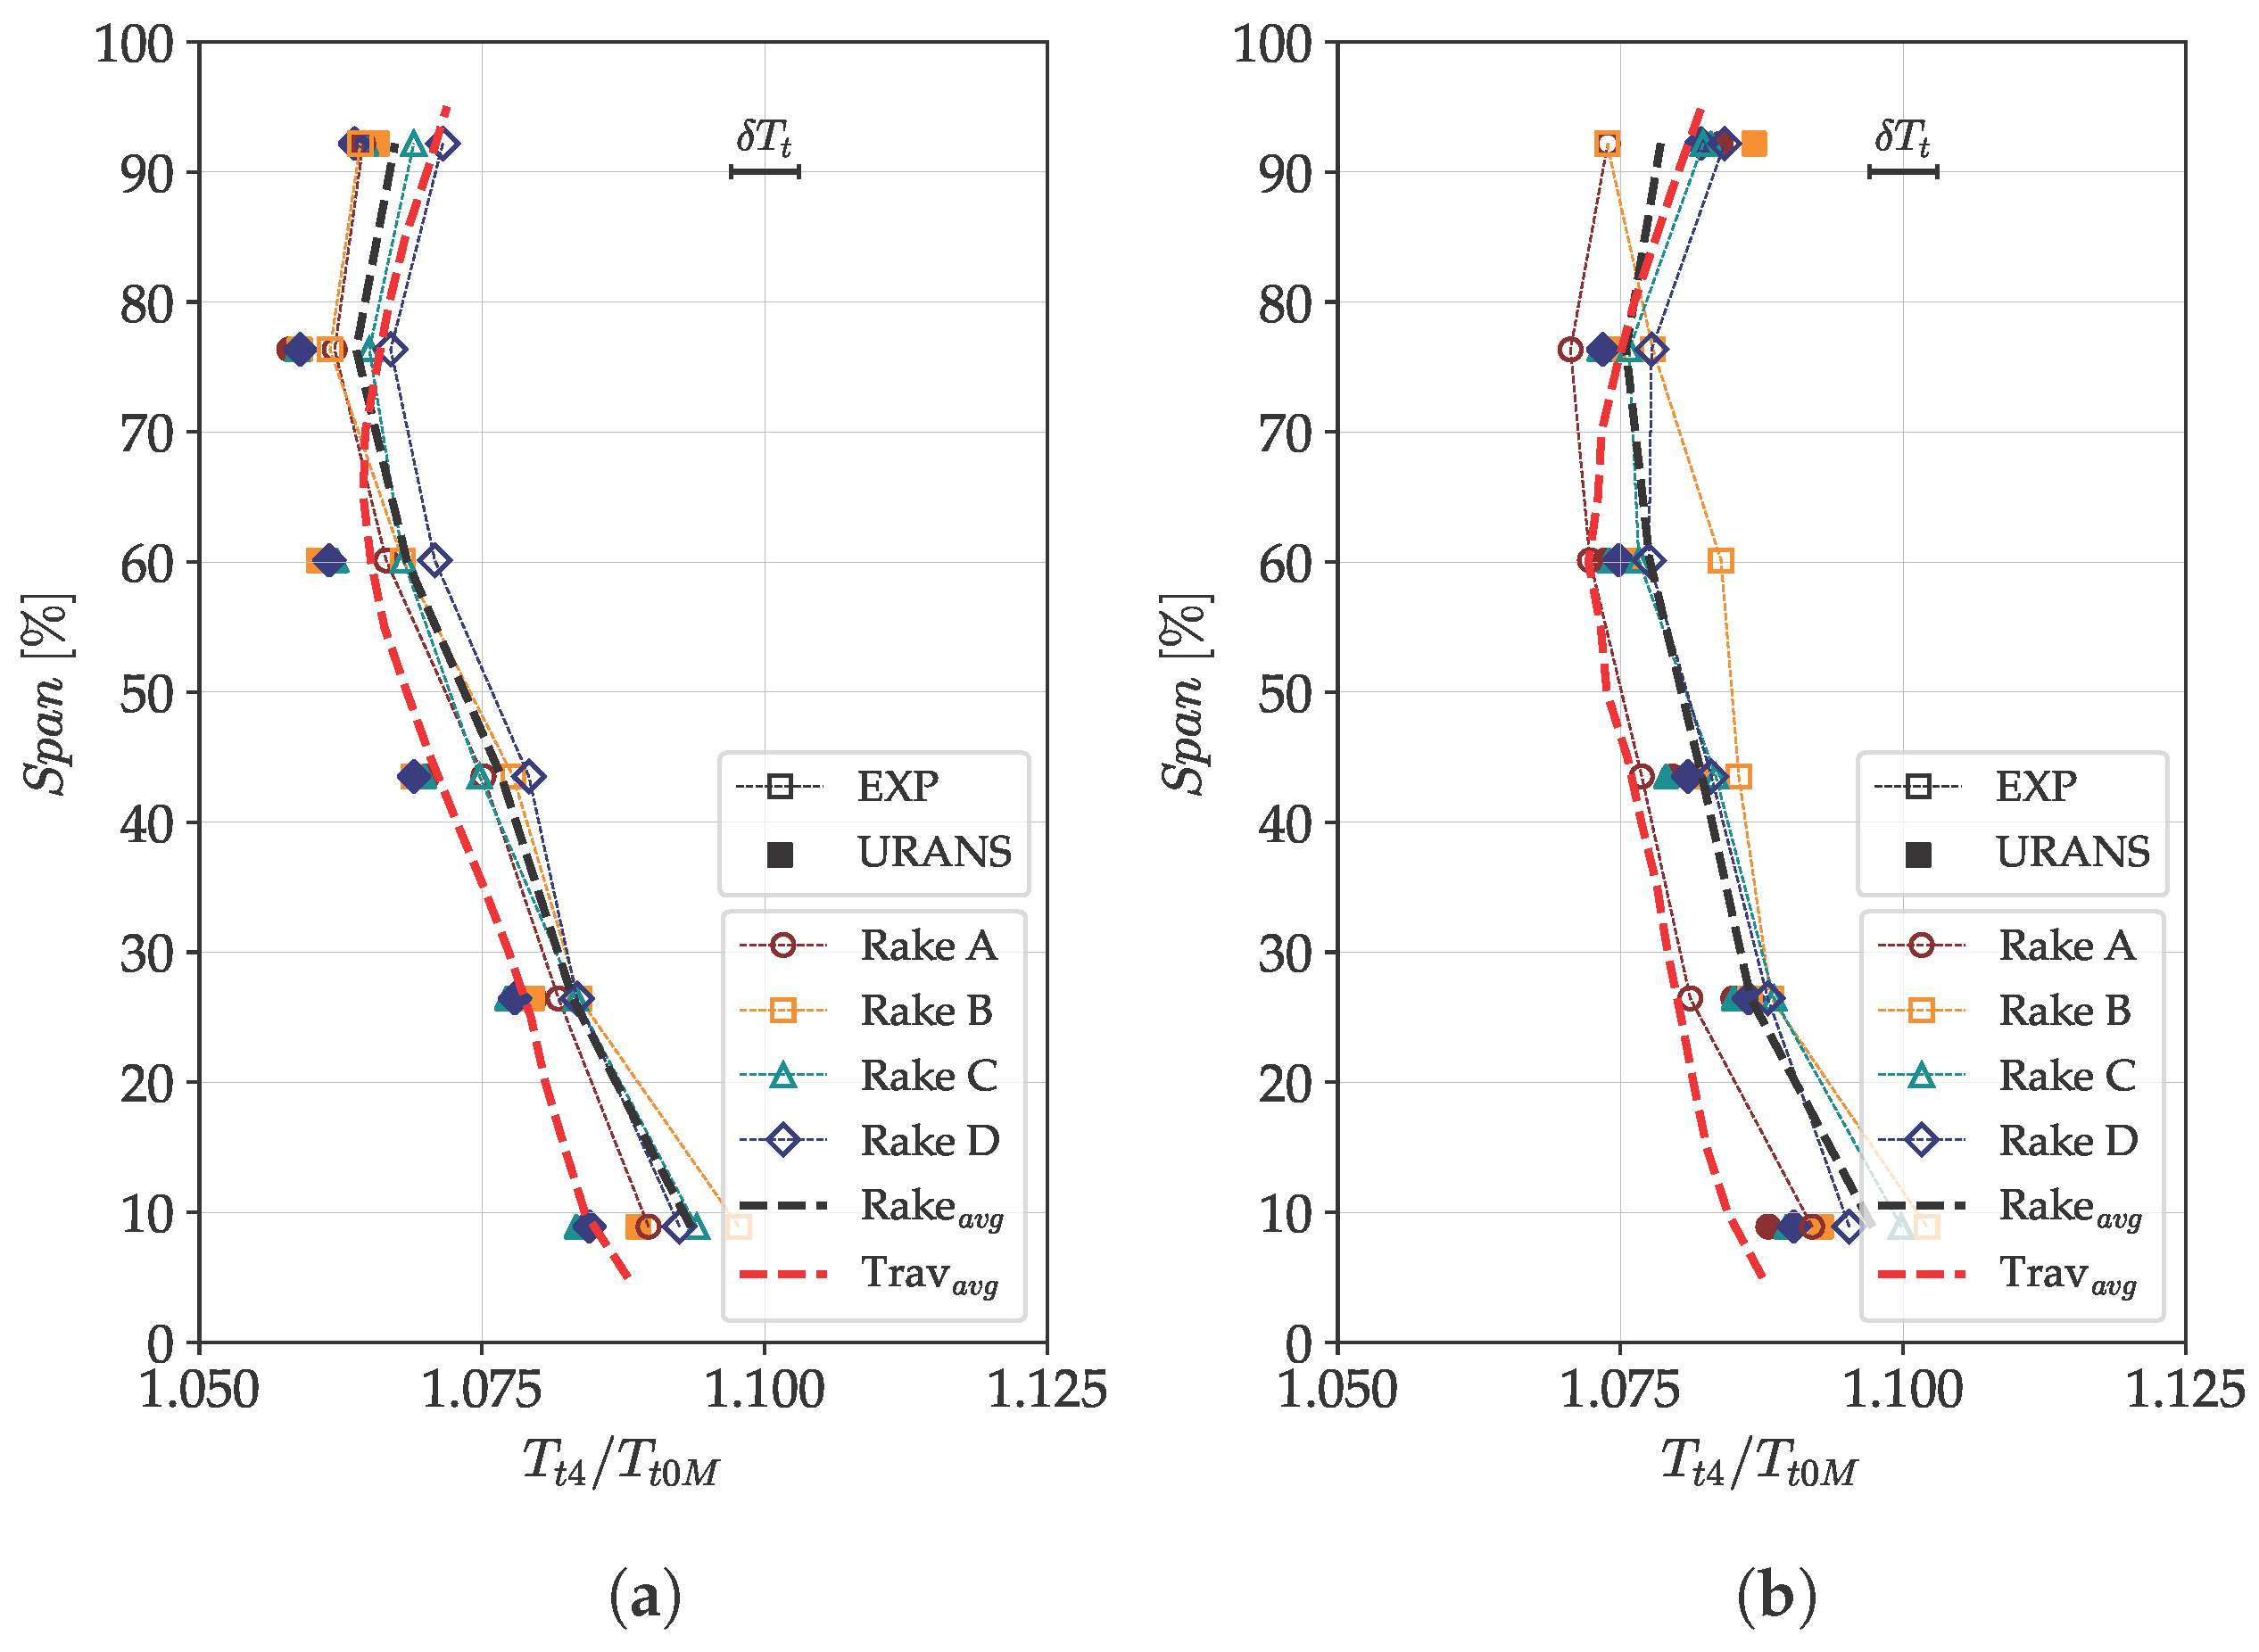
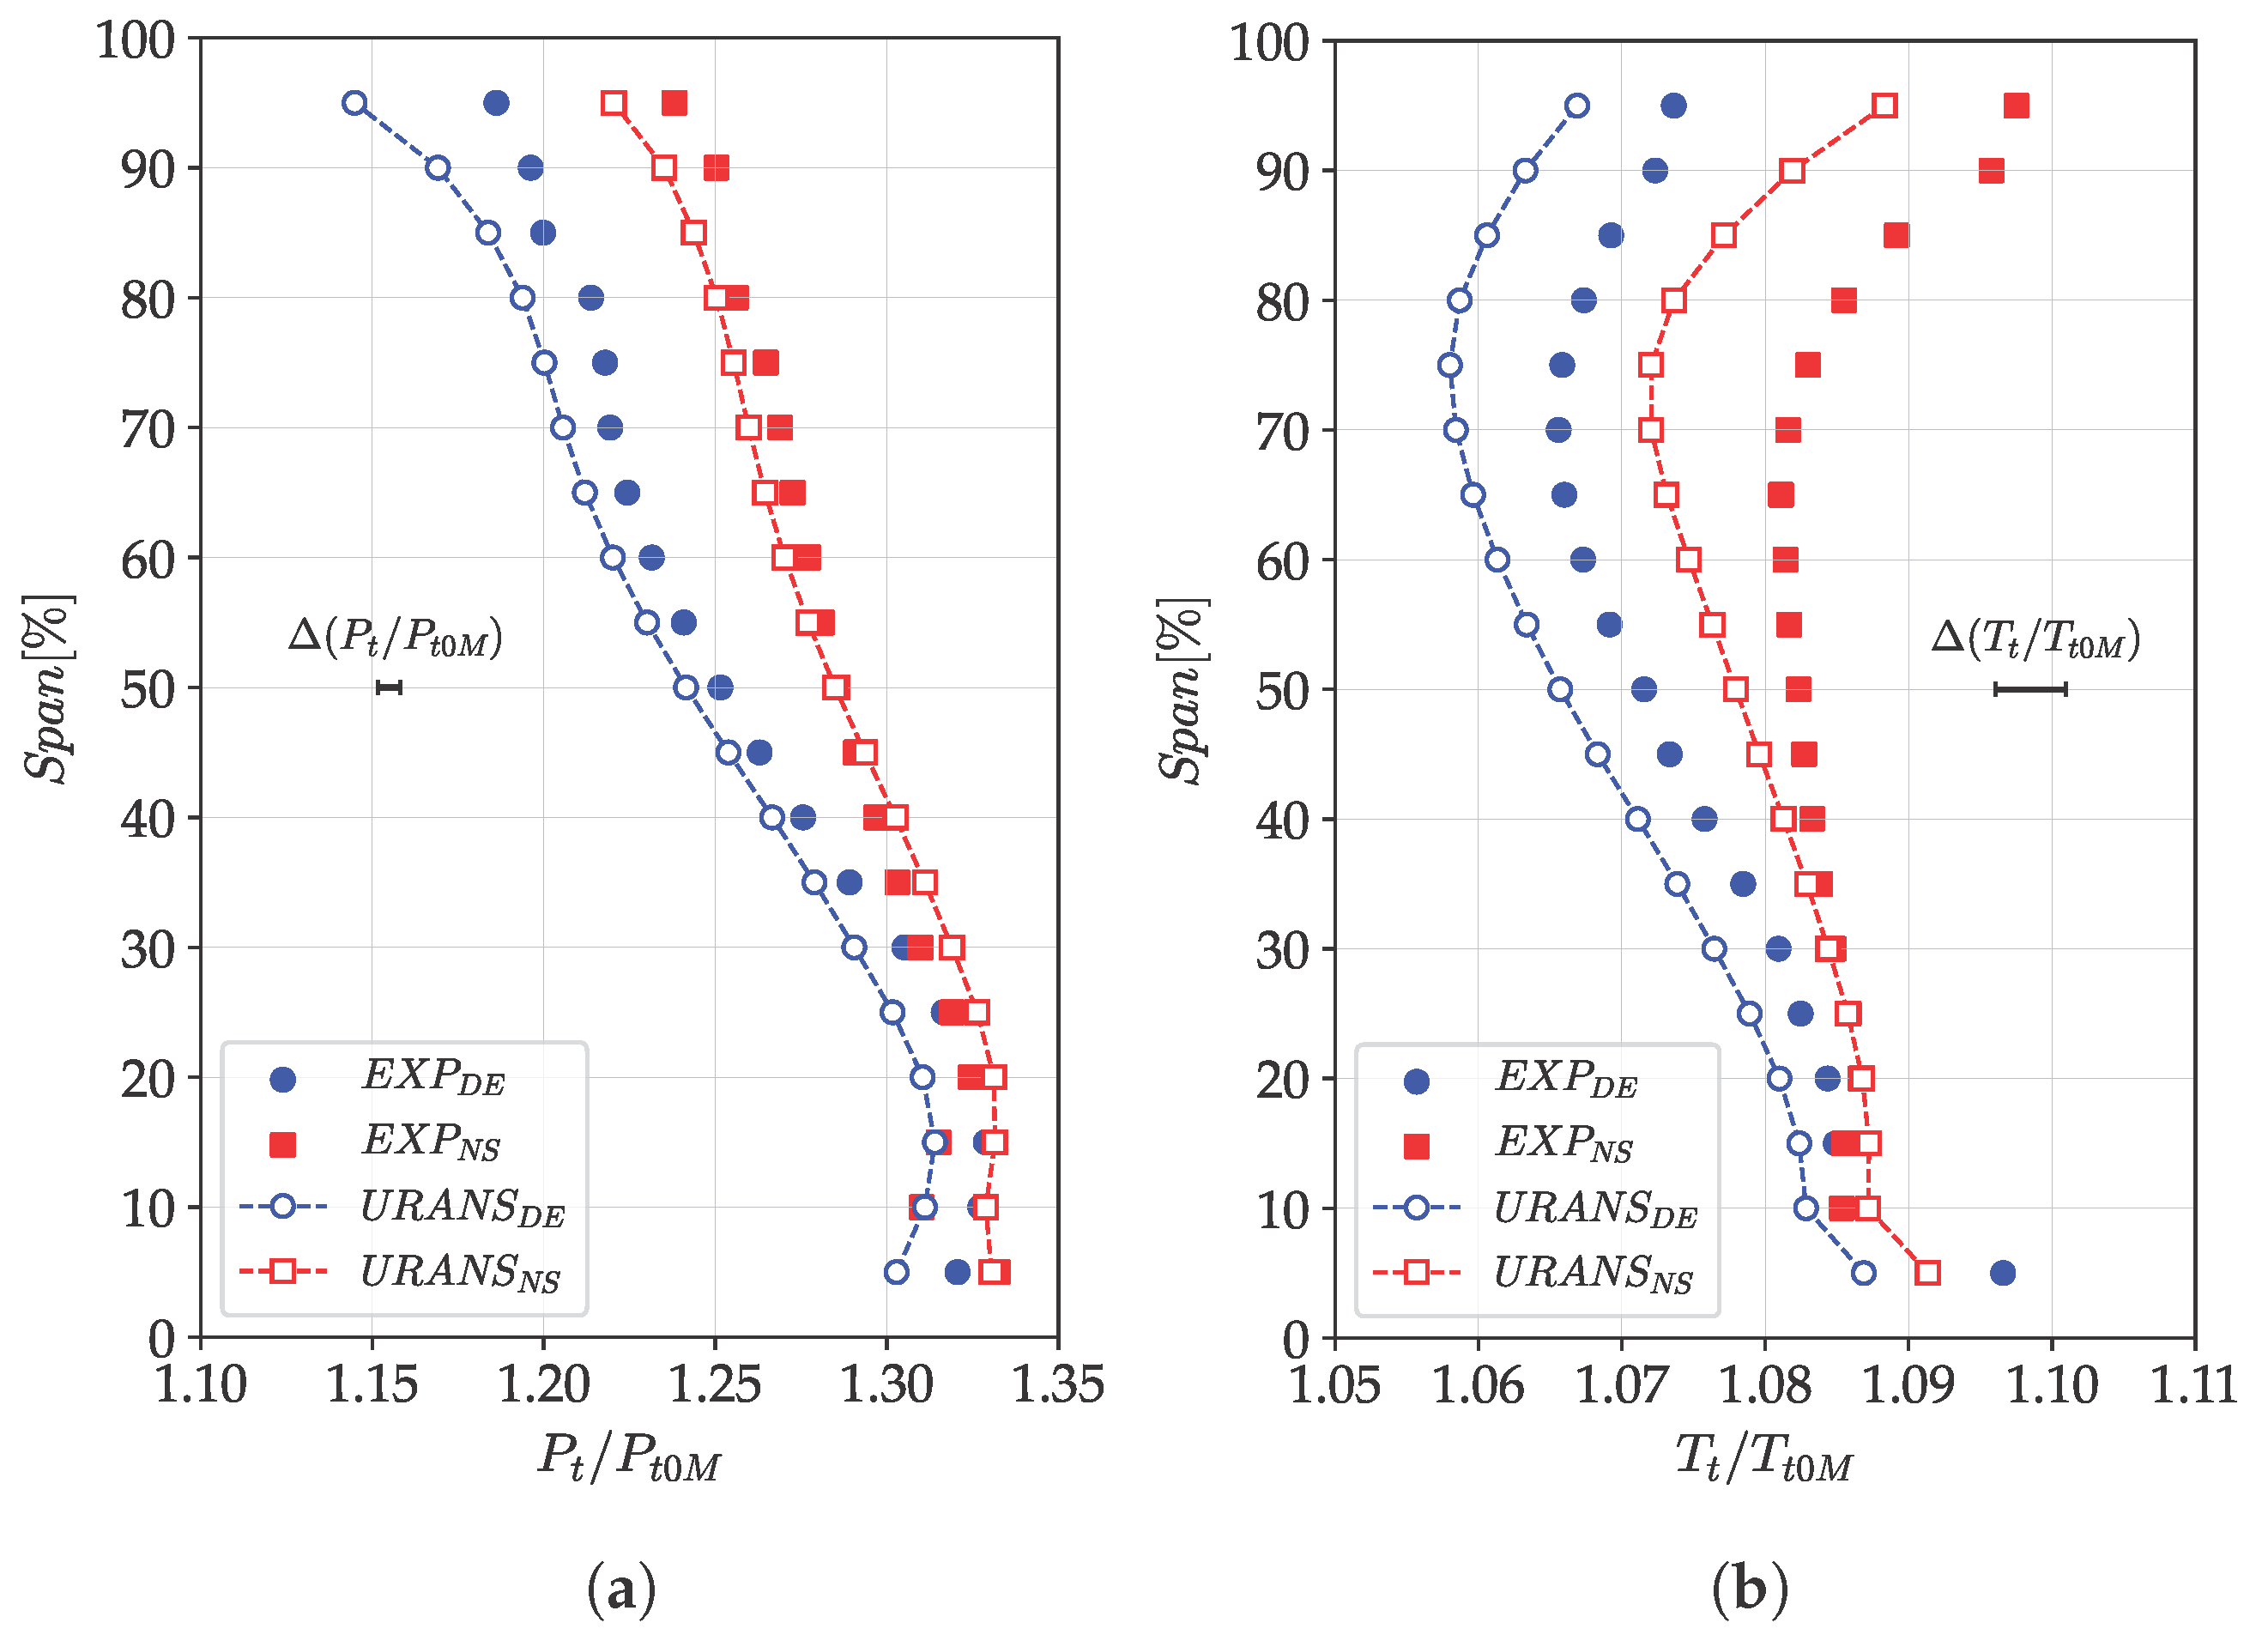
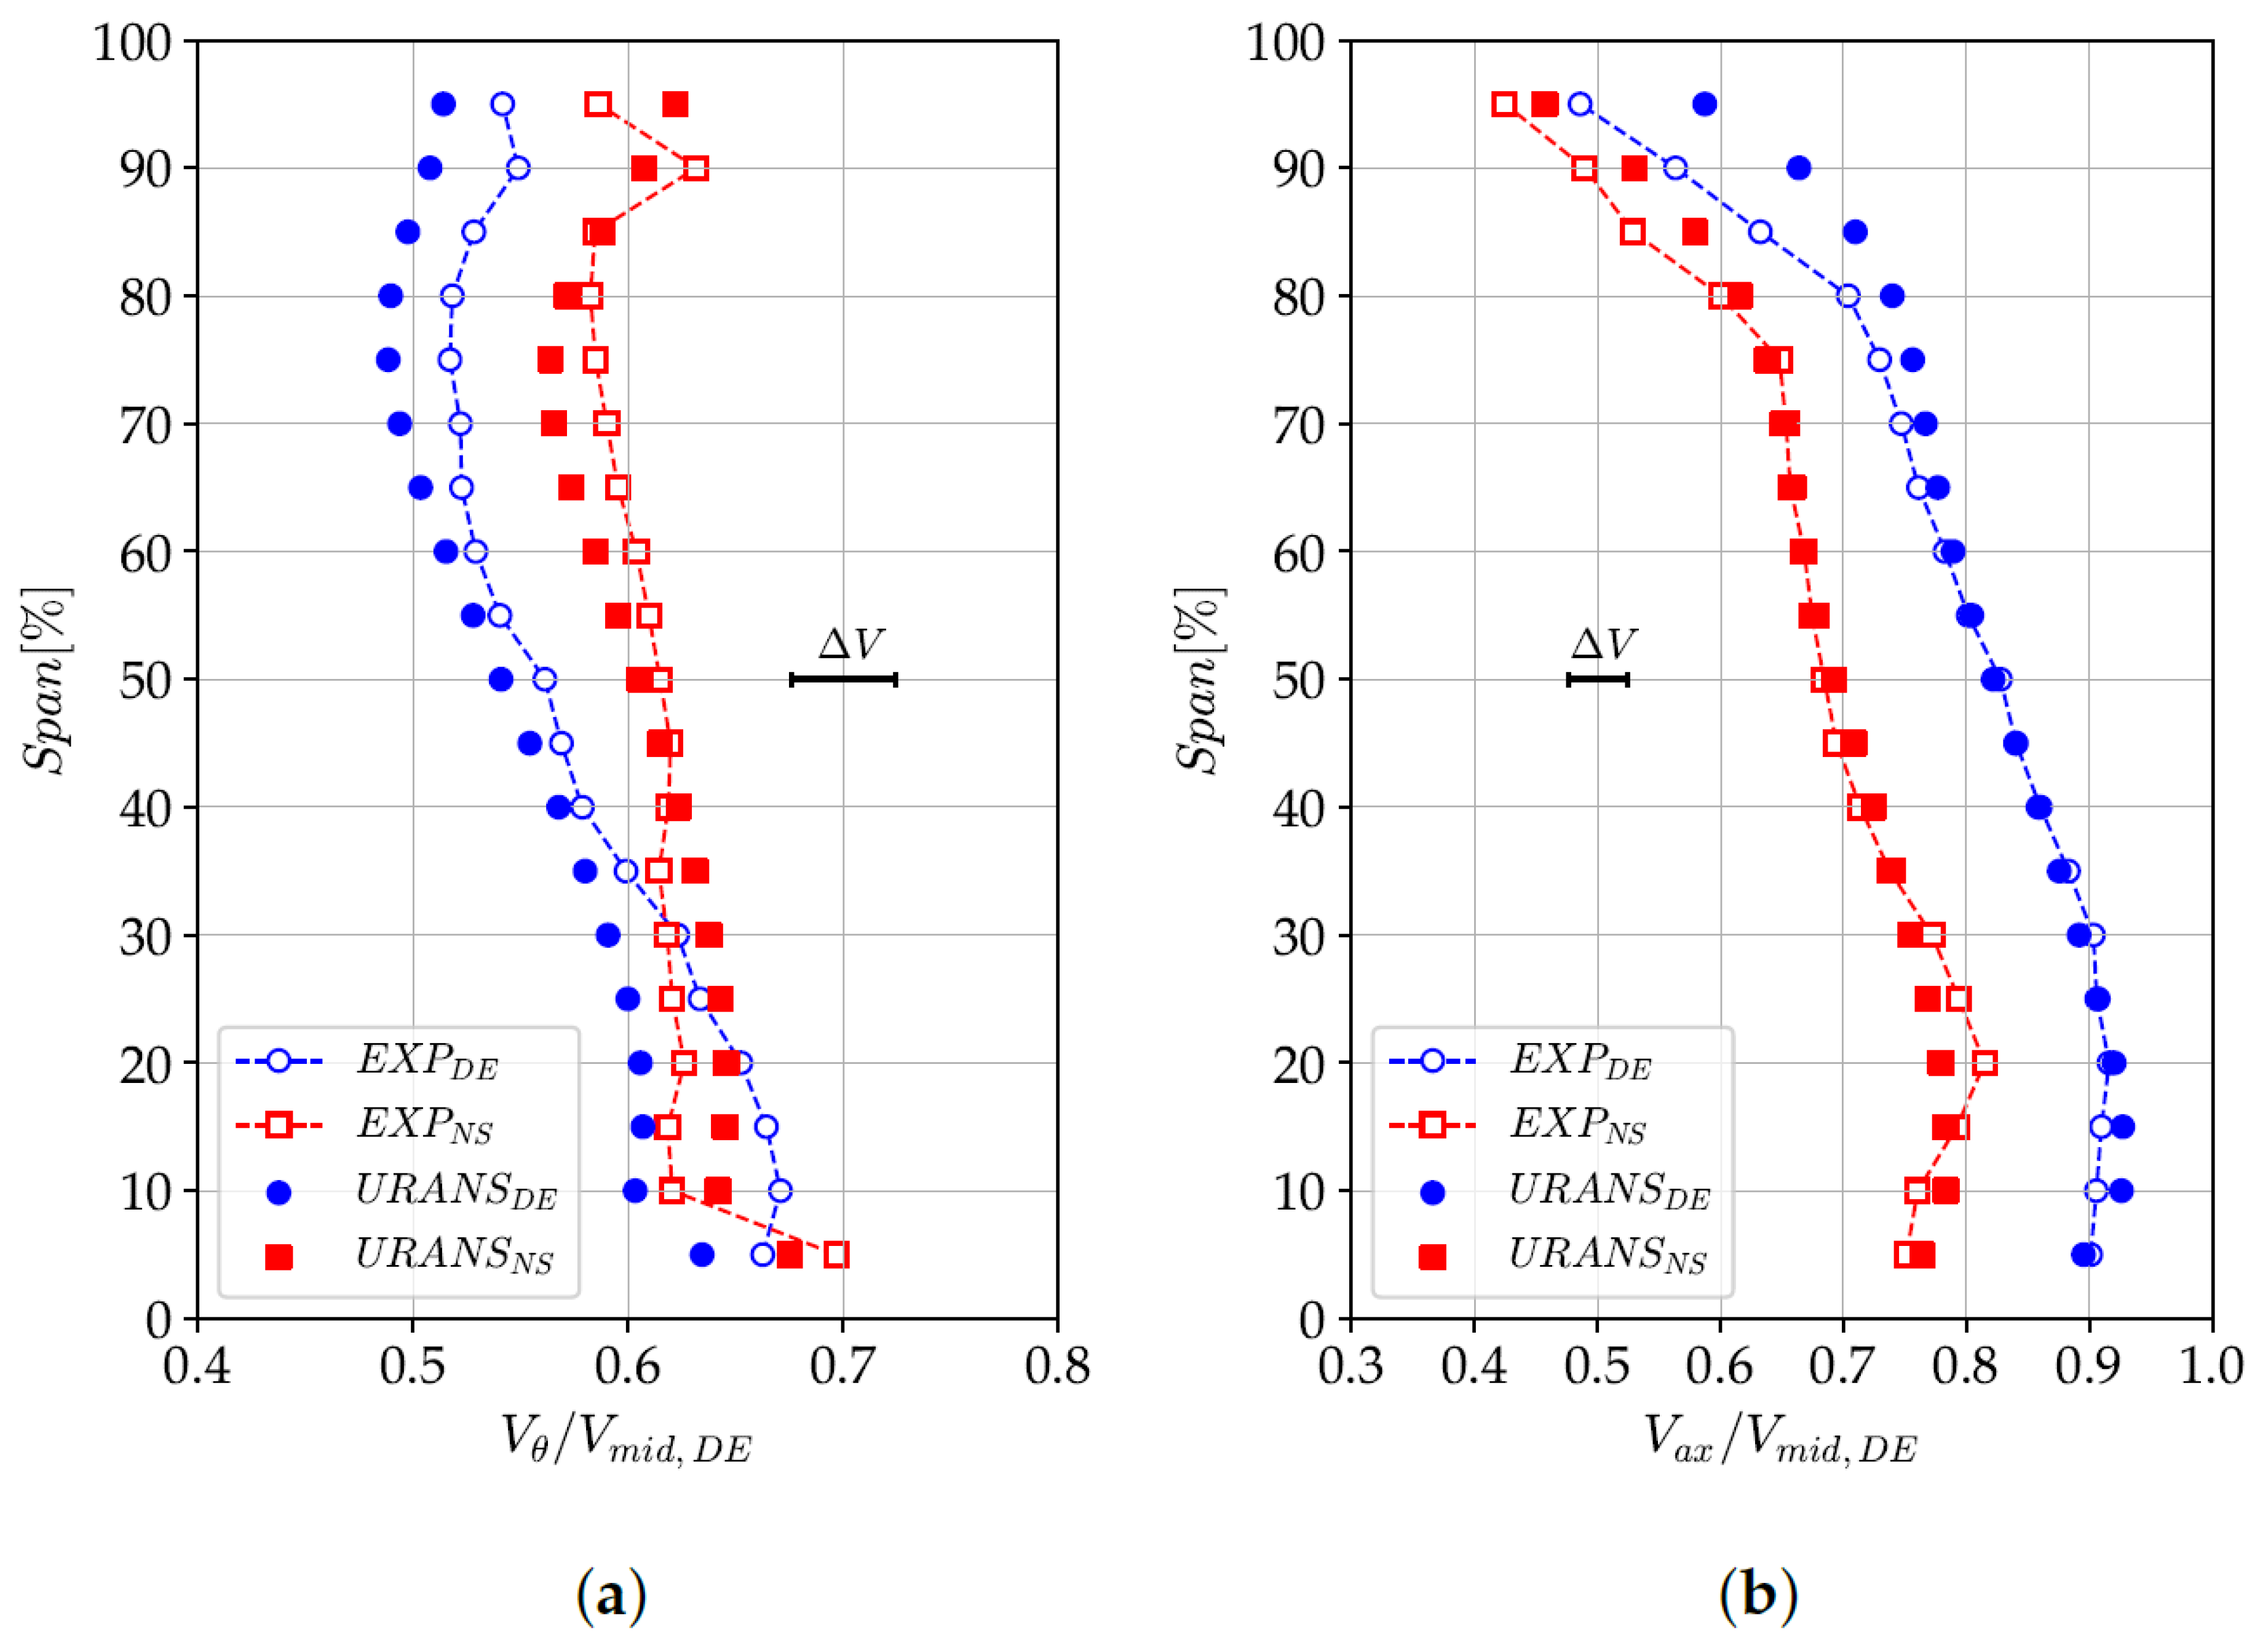
Figure 17,
Figure 18 and
Figure 19 present the numerical and experimental span-wise distributions of total pressure, total temperature, velocity components, and flow angles at the rotor outlet. The latter was computed within the absolute and relative frame of reference. Moreover, the velocity was decomposed into tangential (
) and axial (
) components, and normalized relative to the experimental absolute velocity measured at mid-span at the DE condition (
. The highest uncertainty, computed within the 95% confidence interval across the span, is also reported.
These data reveal higher total pressure and temperature near the hub, which can be attributed to the increased loading and work performed by the rotor in this region. At higher spans, both total pressure and temperature decrease, accompanied by a reduction in both tangential and axial velocity components. The tangential velocity decreases as a result of the combined effect of blade stagger and increased speed at higher spans. The simultaneous reduction in tangential and axial velocities leads to a near-constant absolute flow angle across the span, while the relative flow angle follows a single slope determined by the variation in blade stagger.
However, especially near the end-walls, the flow begins to deviate from the previously described distributions due to the presence of secondary flows. At higher spans, the blockage caused by the tip-leakage flow reduces the axial velocity in the upper 80% of the span, while both tangential velocity and the absolute flow angle increase. The relative flow angle remains relatively unchanged over 80% of the span, but a slight change in slope is observed, caused by the different deviation generated by the rotor blade near the tip wall. As a result of the increased absolute flow angle, work in the upper portion of the span rises, as indicated by the increase in total temperature. A similar trend is observed at span lower than 20%, where the blockage caused by hub corner separation leads to a reduction in axial velocity, followed by an increase in tangential velocity and absolute flow angle. At NS conditions, a general increase in pressure and temperature is observed, particularly in the upper portion of the span. This is because the blade is unable to pressurize the flow at lower radii due to the development of the hub corner flow. All the effects detected at DE conditions are observed near the end-walls when moving close to the stability limit. Specifically, the experiments show a 1.1% reduction in total pressure and a 5.5° increase in flow angle in the lower 20% of the span, indicating a more pronounced hub corner flow.
It is important to notice that the trend predicted by the CFD is overall in agreement with the experiments, despite mismatches appear near the end-walls where secondary flows take place. For instance, although the absolute increase in flow angle observed at low span in the simulations is smaller than in the experiments, the CFD still captures a similar trend in the flow angle distribution near the end-walls. This difference originates from how RANS simulations model secondary flow structures, which is strongly influenced by the choice of the turbulence model. However, at mid-span, where secondary flows are expected to play a minor role, the numerical prediction aligns more closely with the experiments, falling nearly within the computed uncertainty range of the instrumentation for all the computed quantities. Higher discrepancies between experiments and CFD are noticed in the upper portion of the span for the total temperature, which are believed to originate from the rotor casing in the test rig warming up during operation, a factor that the CFD cannot capture due to the adiabatic wall boundary condition applied at the rotor casing. Nevertheless, it should be noted that the overall total temperature difference between experiments and CFD is only slightly above the systematic uncertainty of the instrumentation.
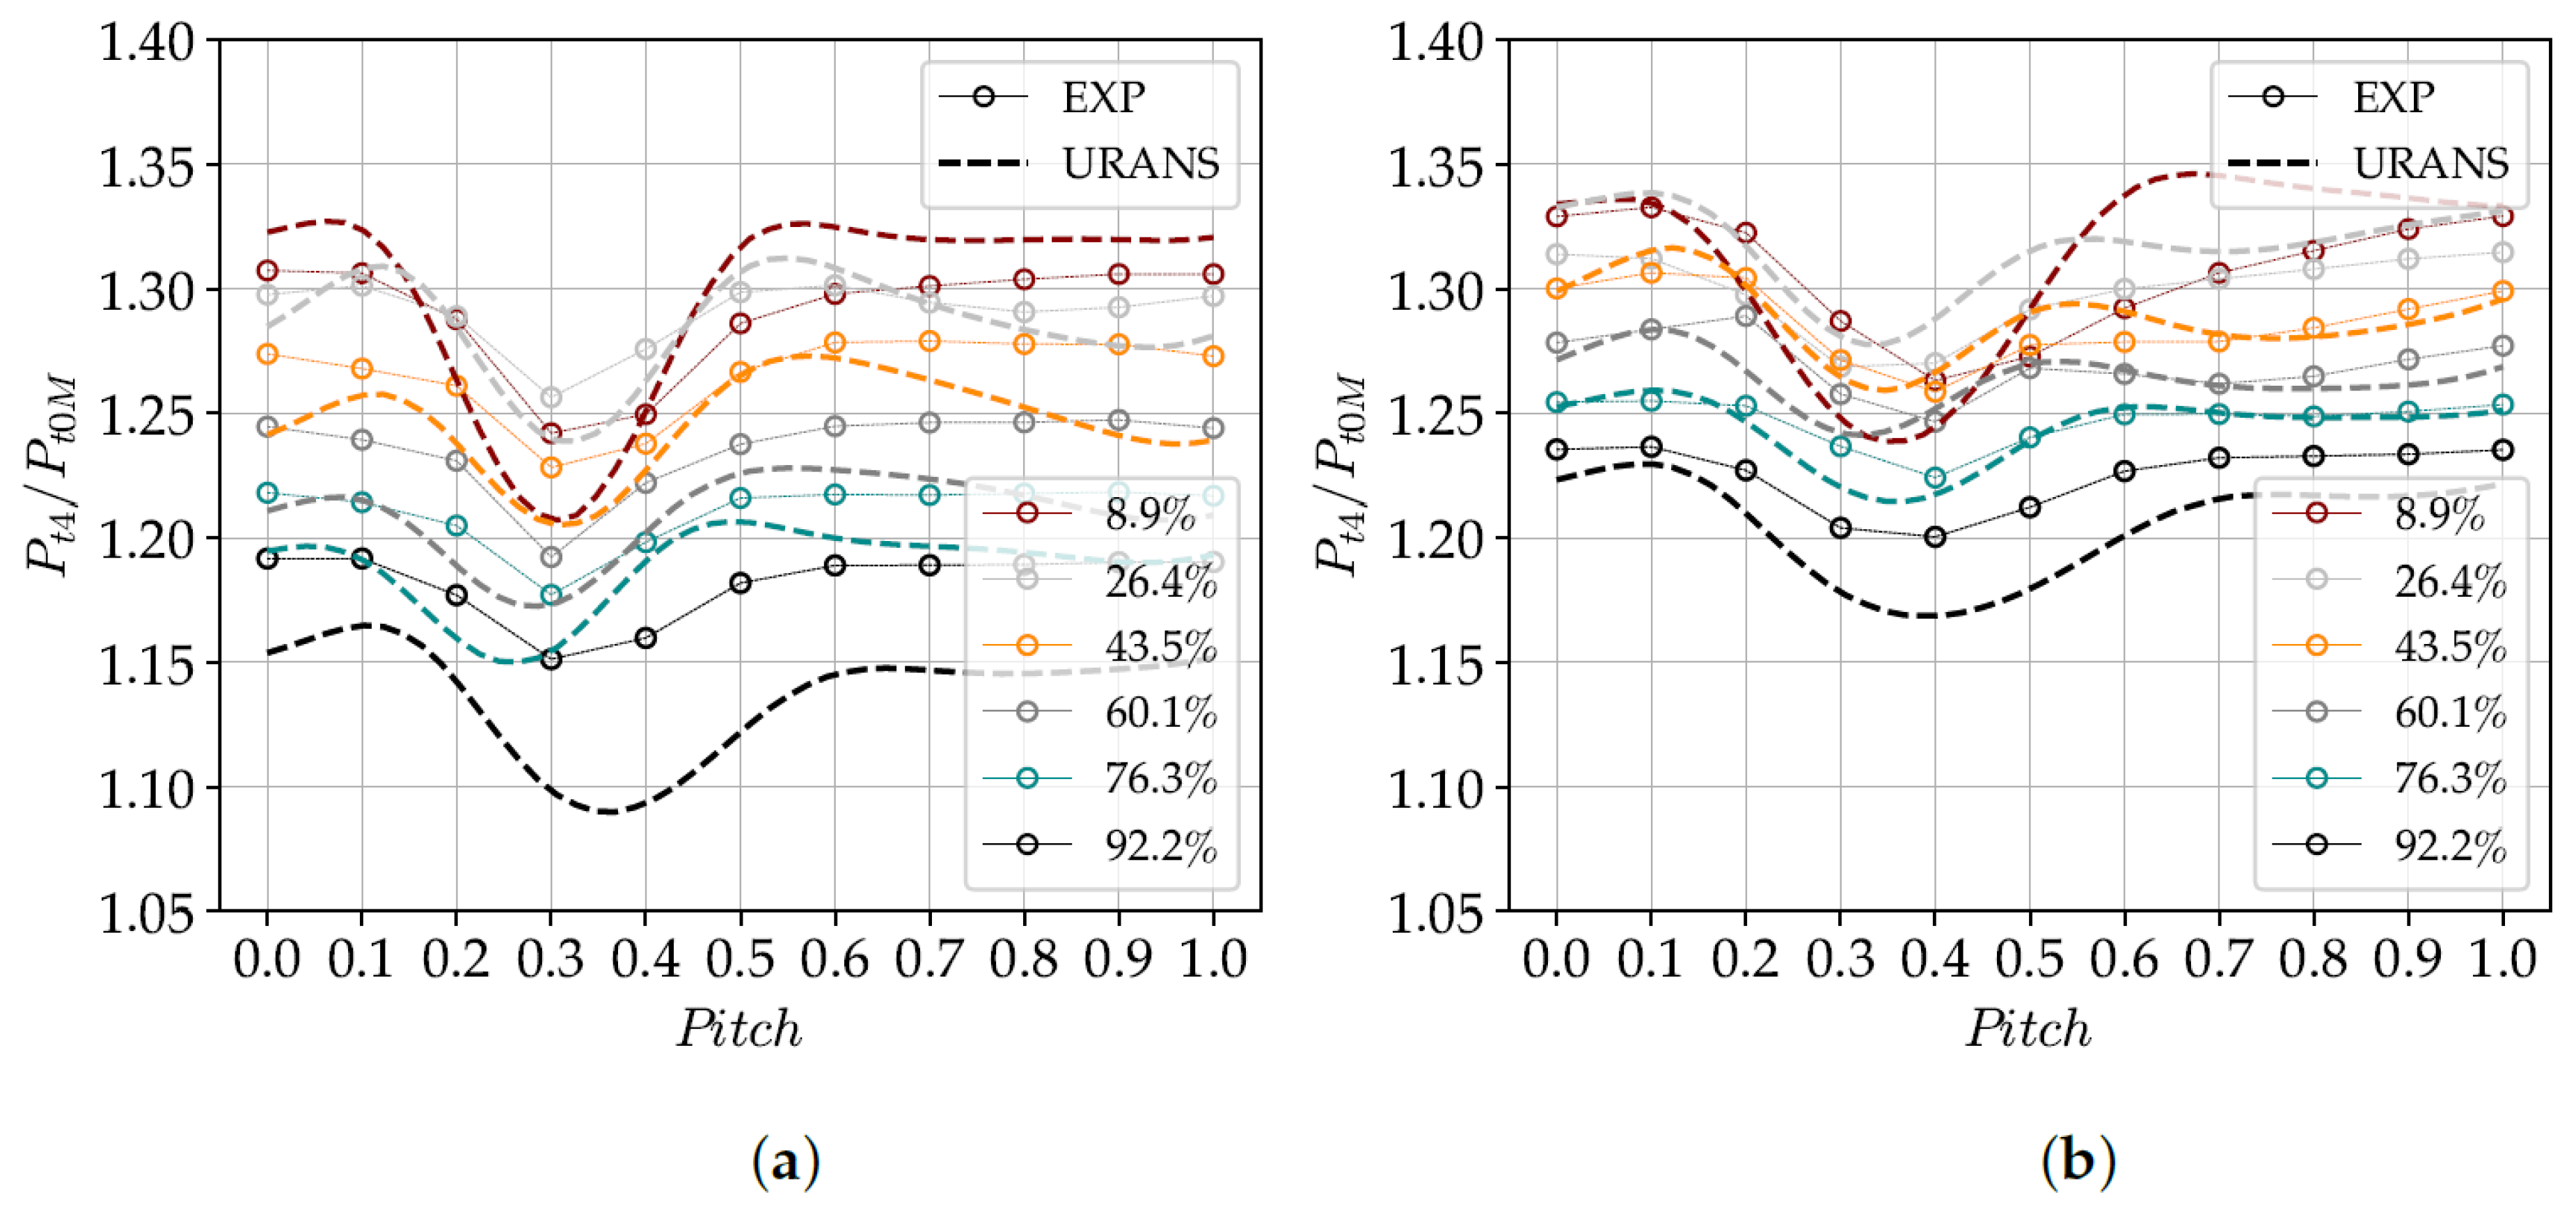
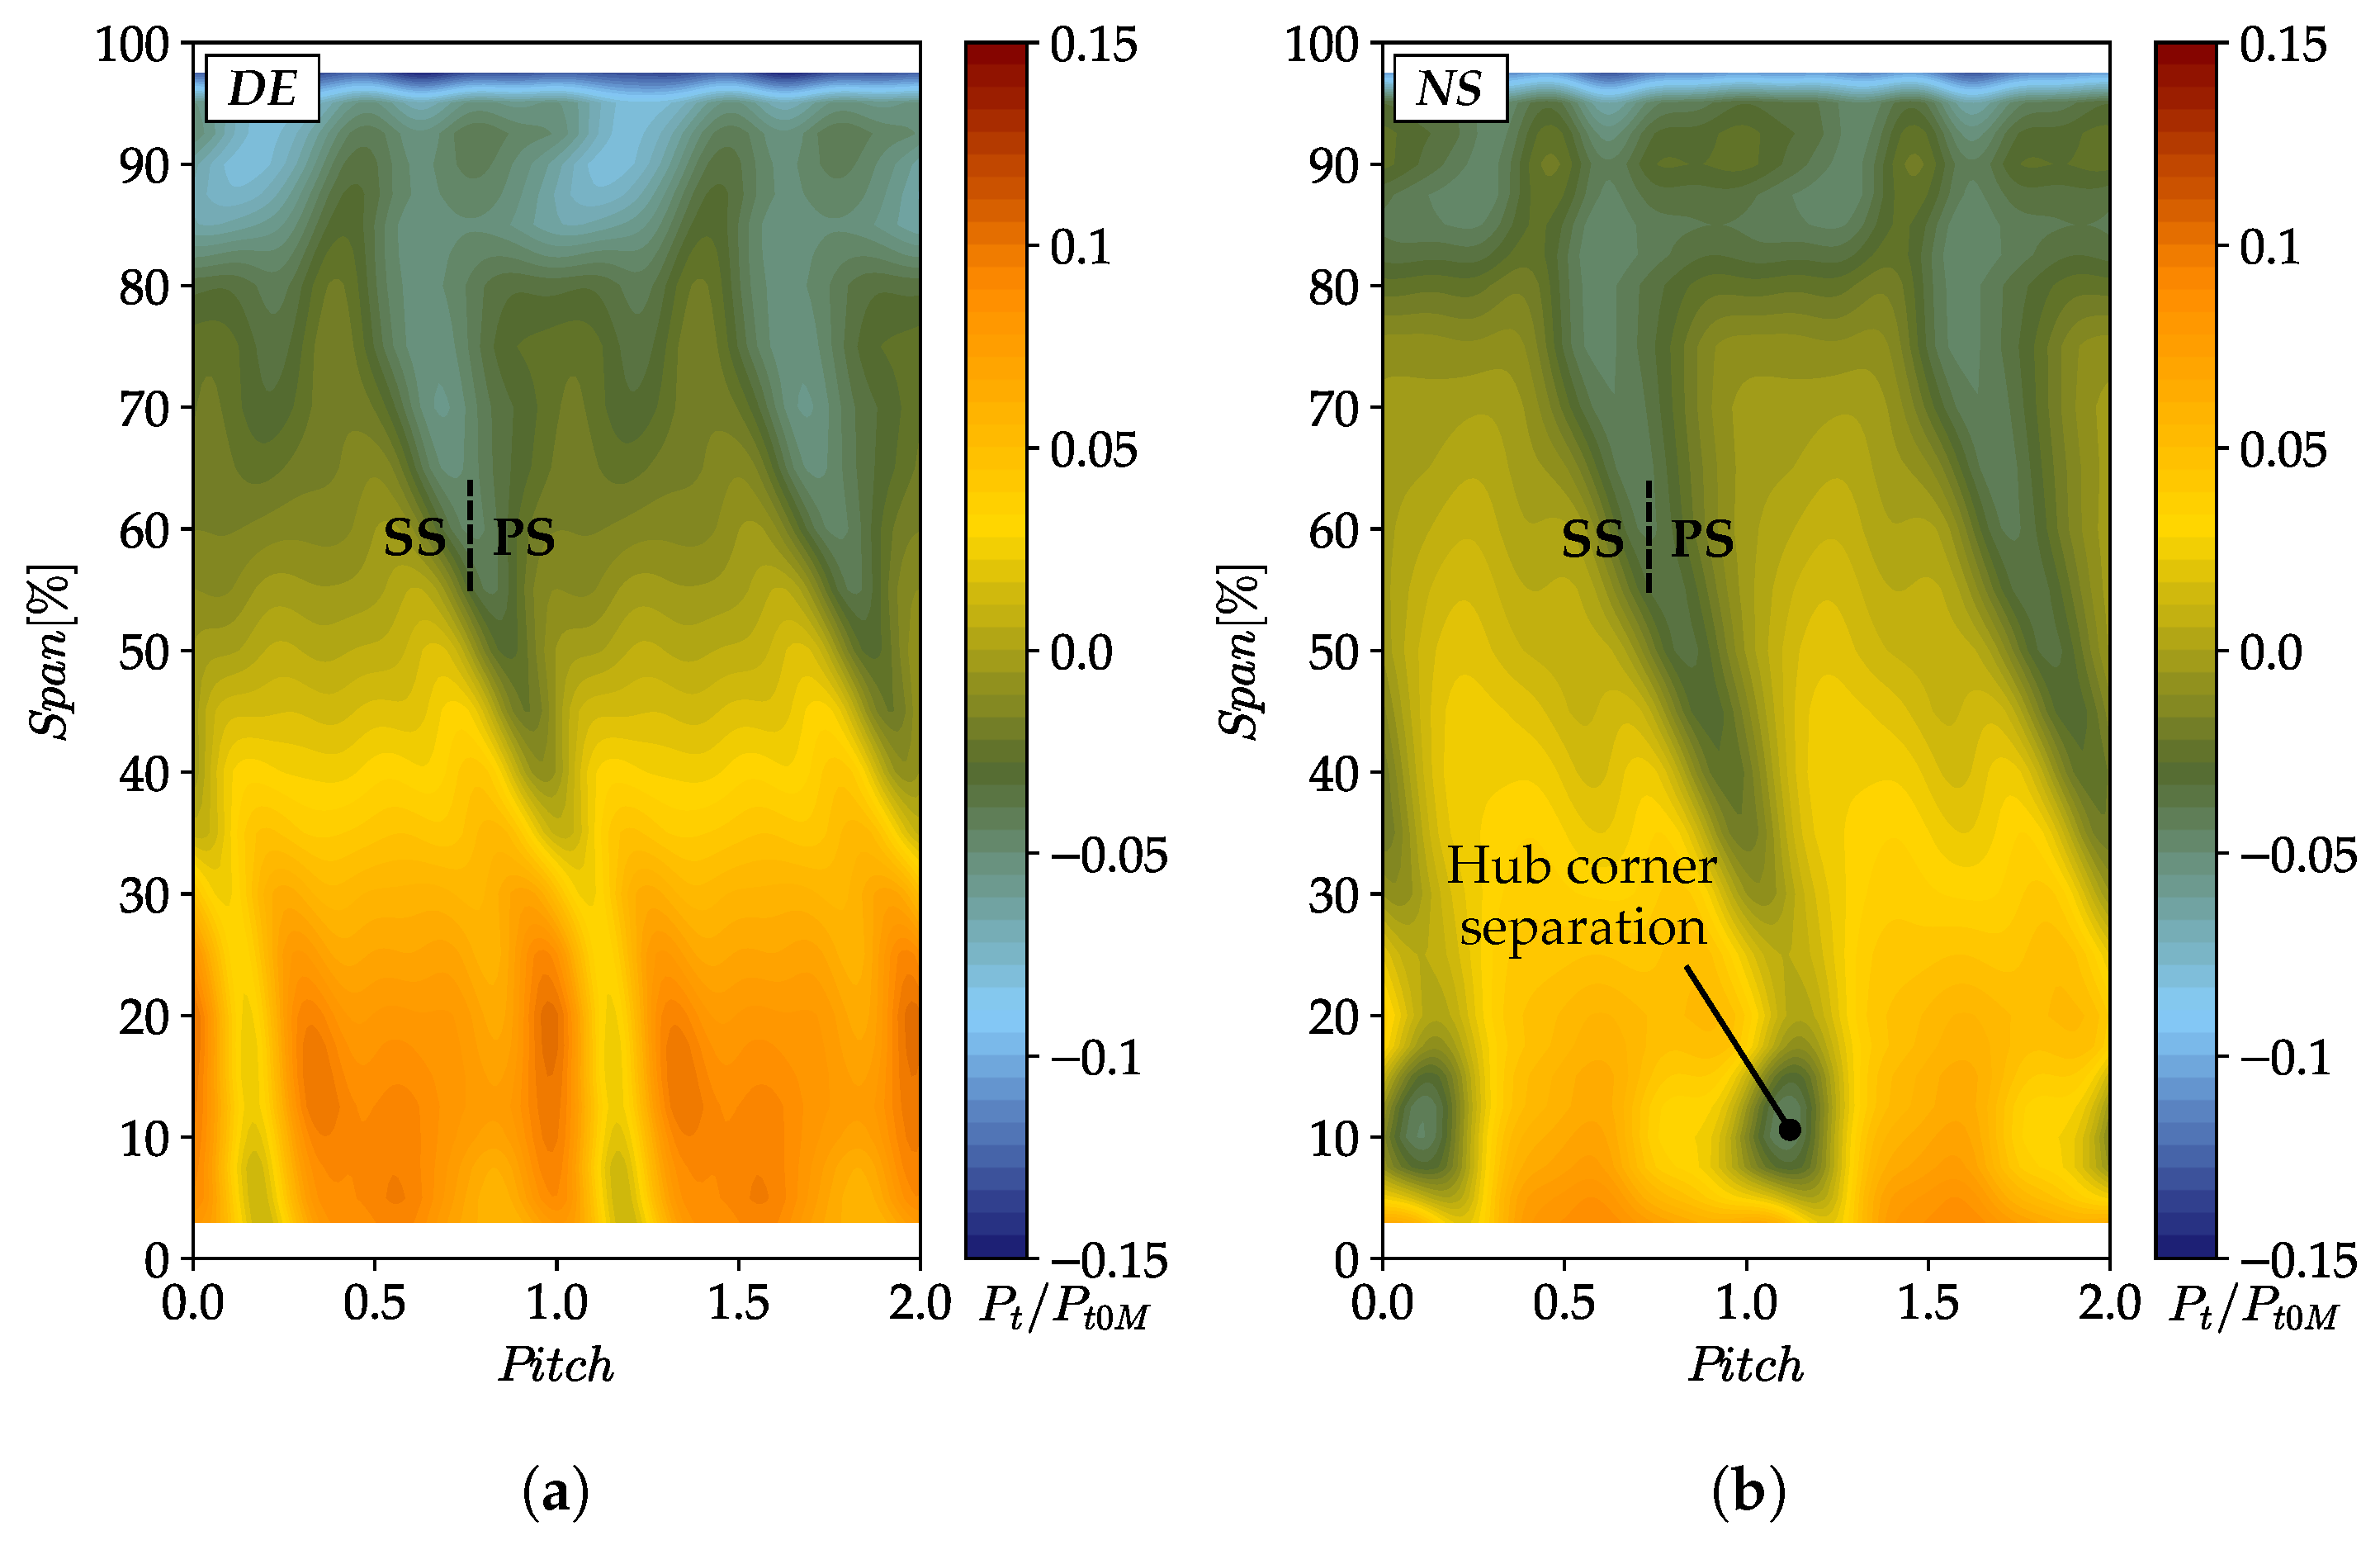
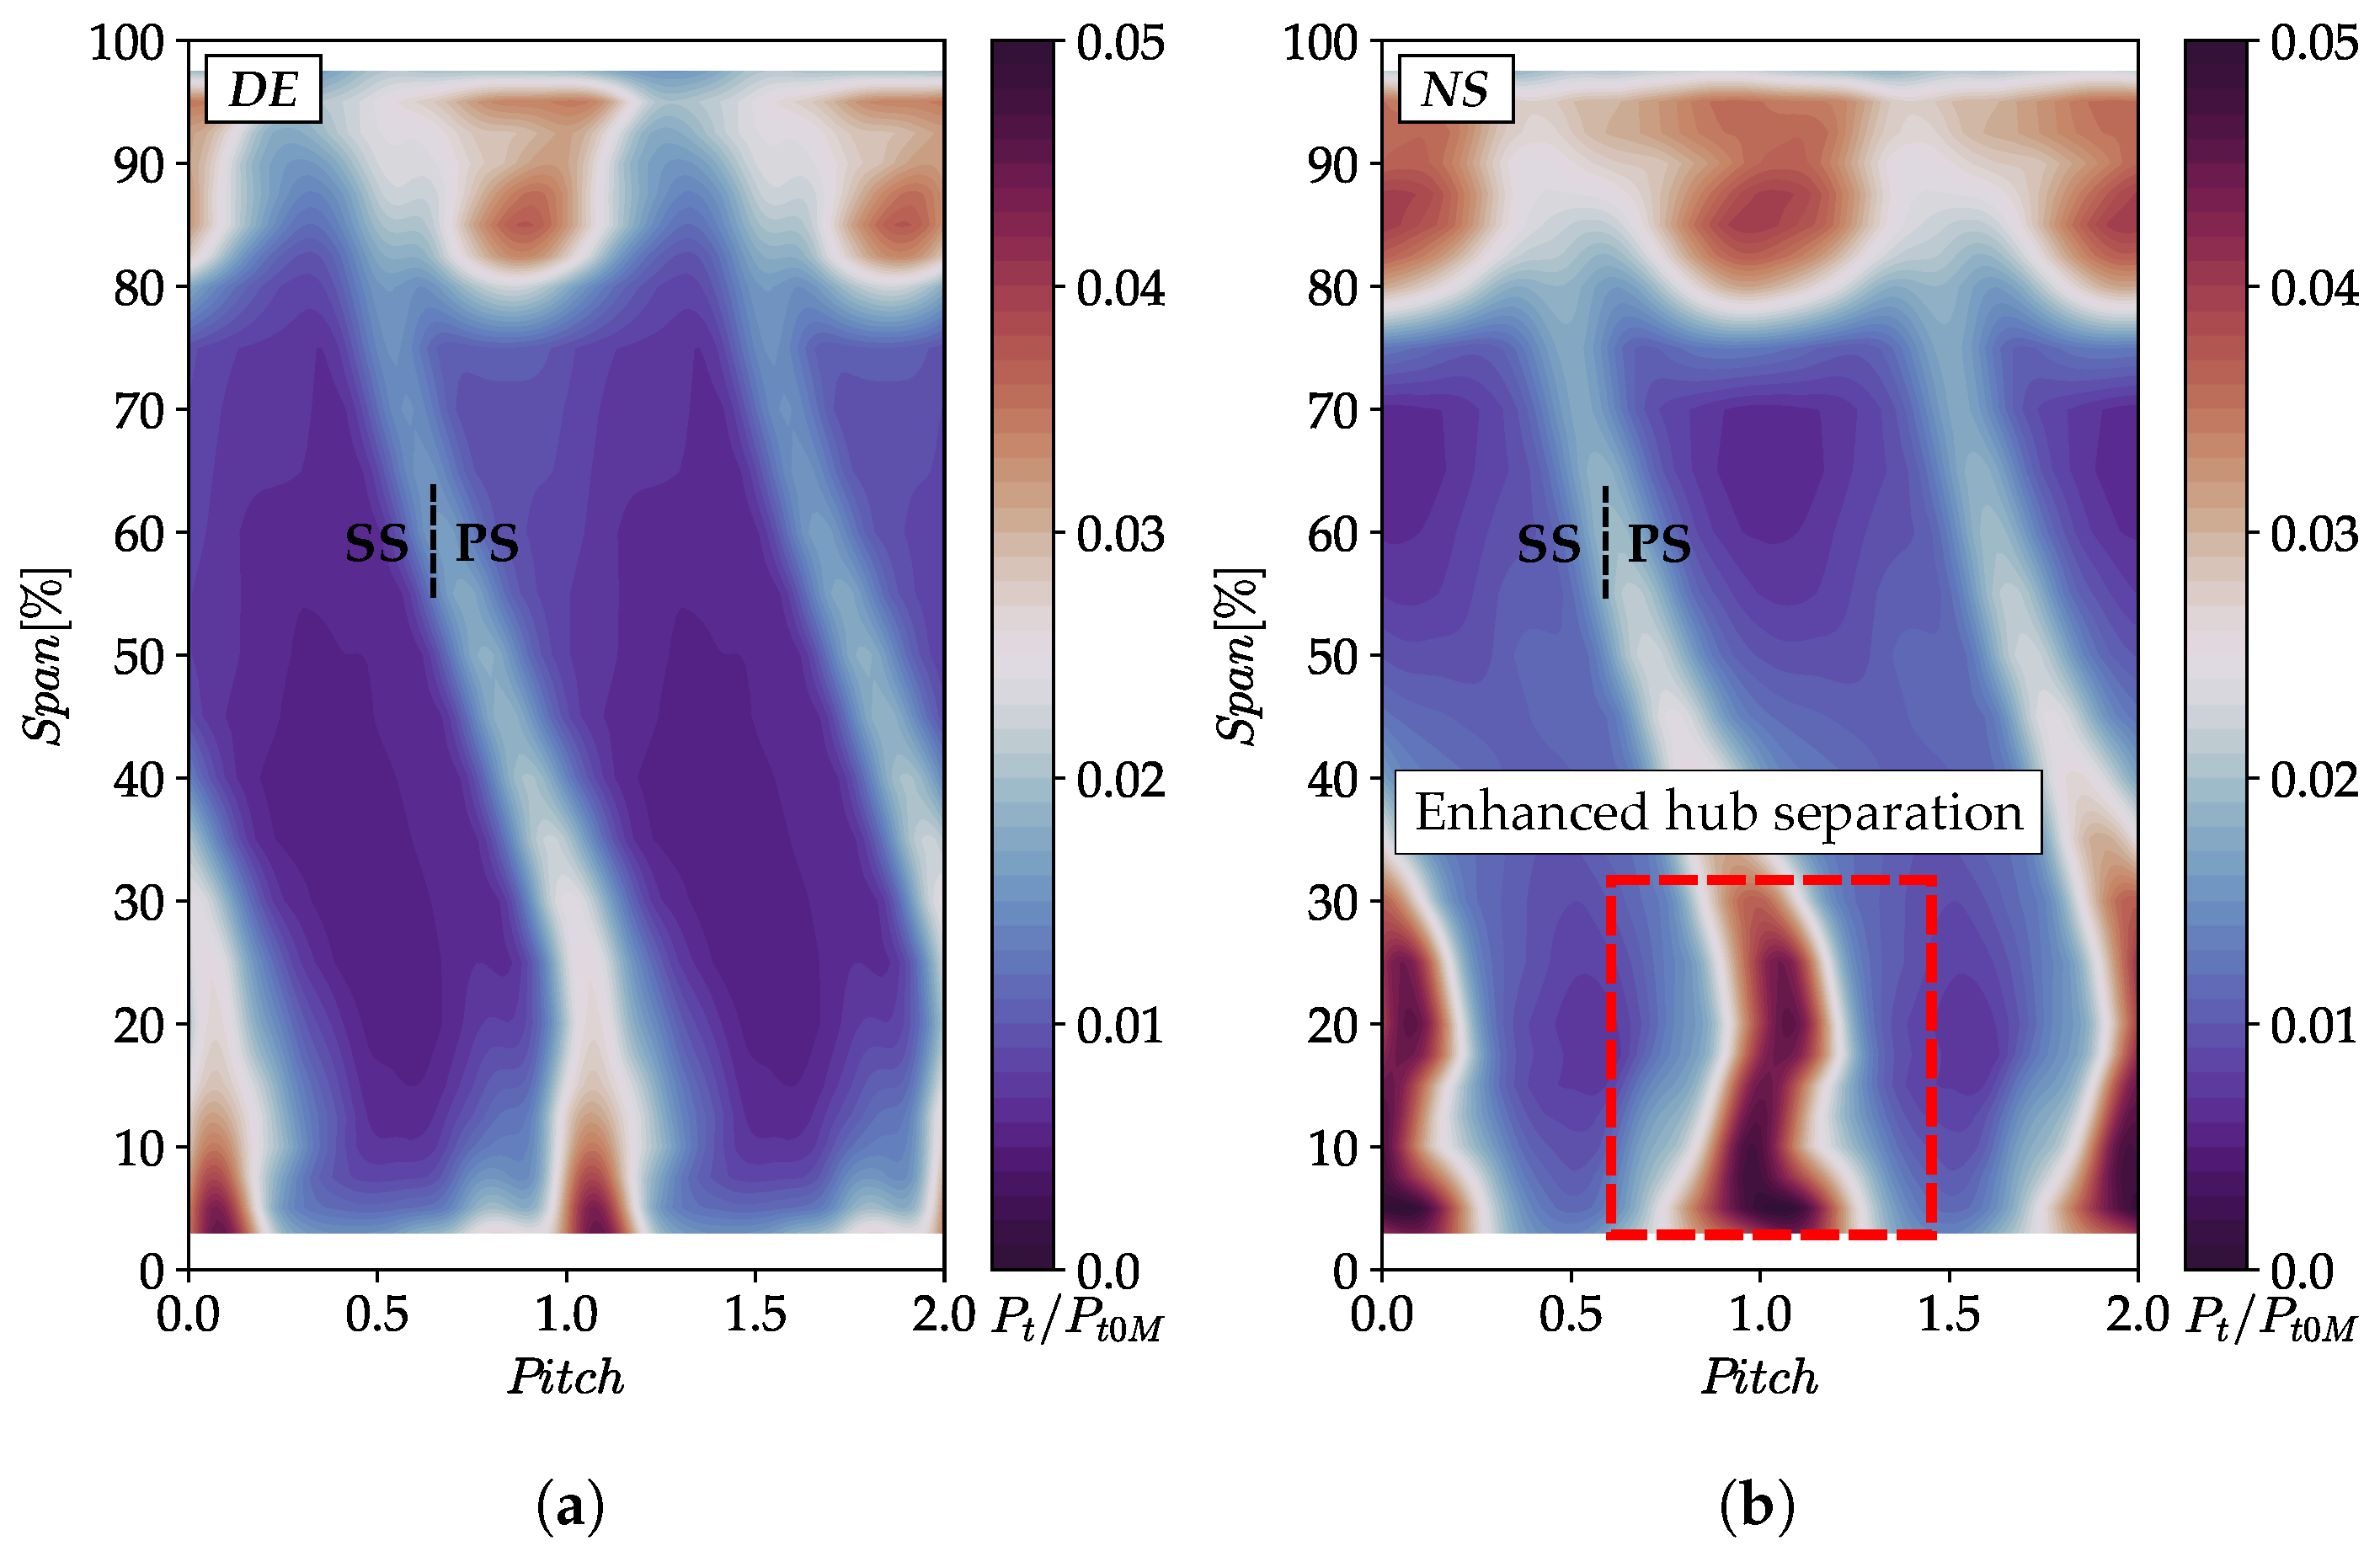
To aid in the interpretation of the span-wise distributions at the rotor outlet,
Figure 20 and
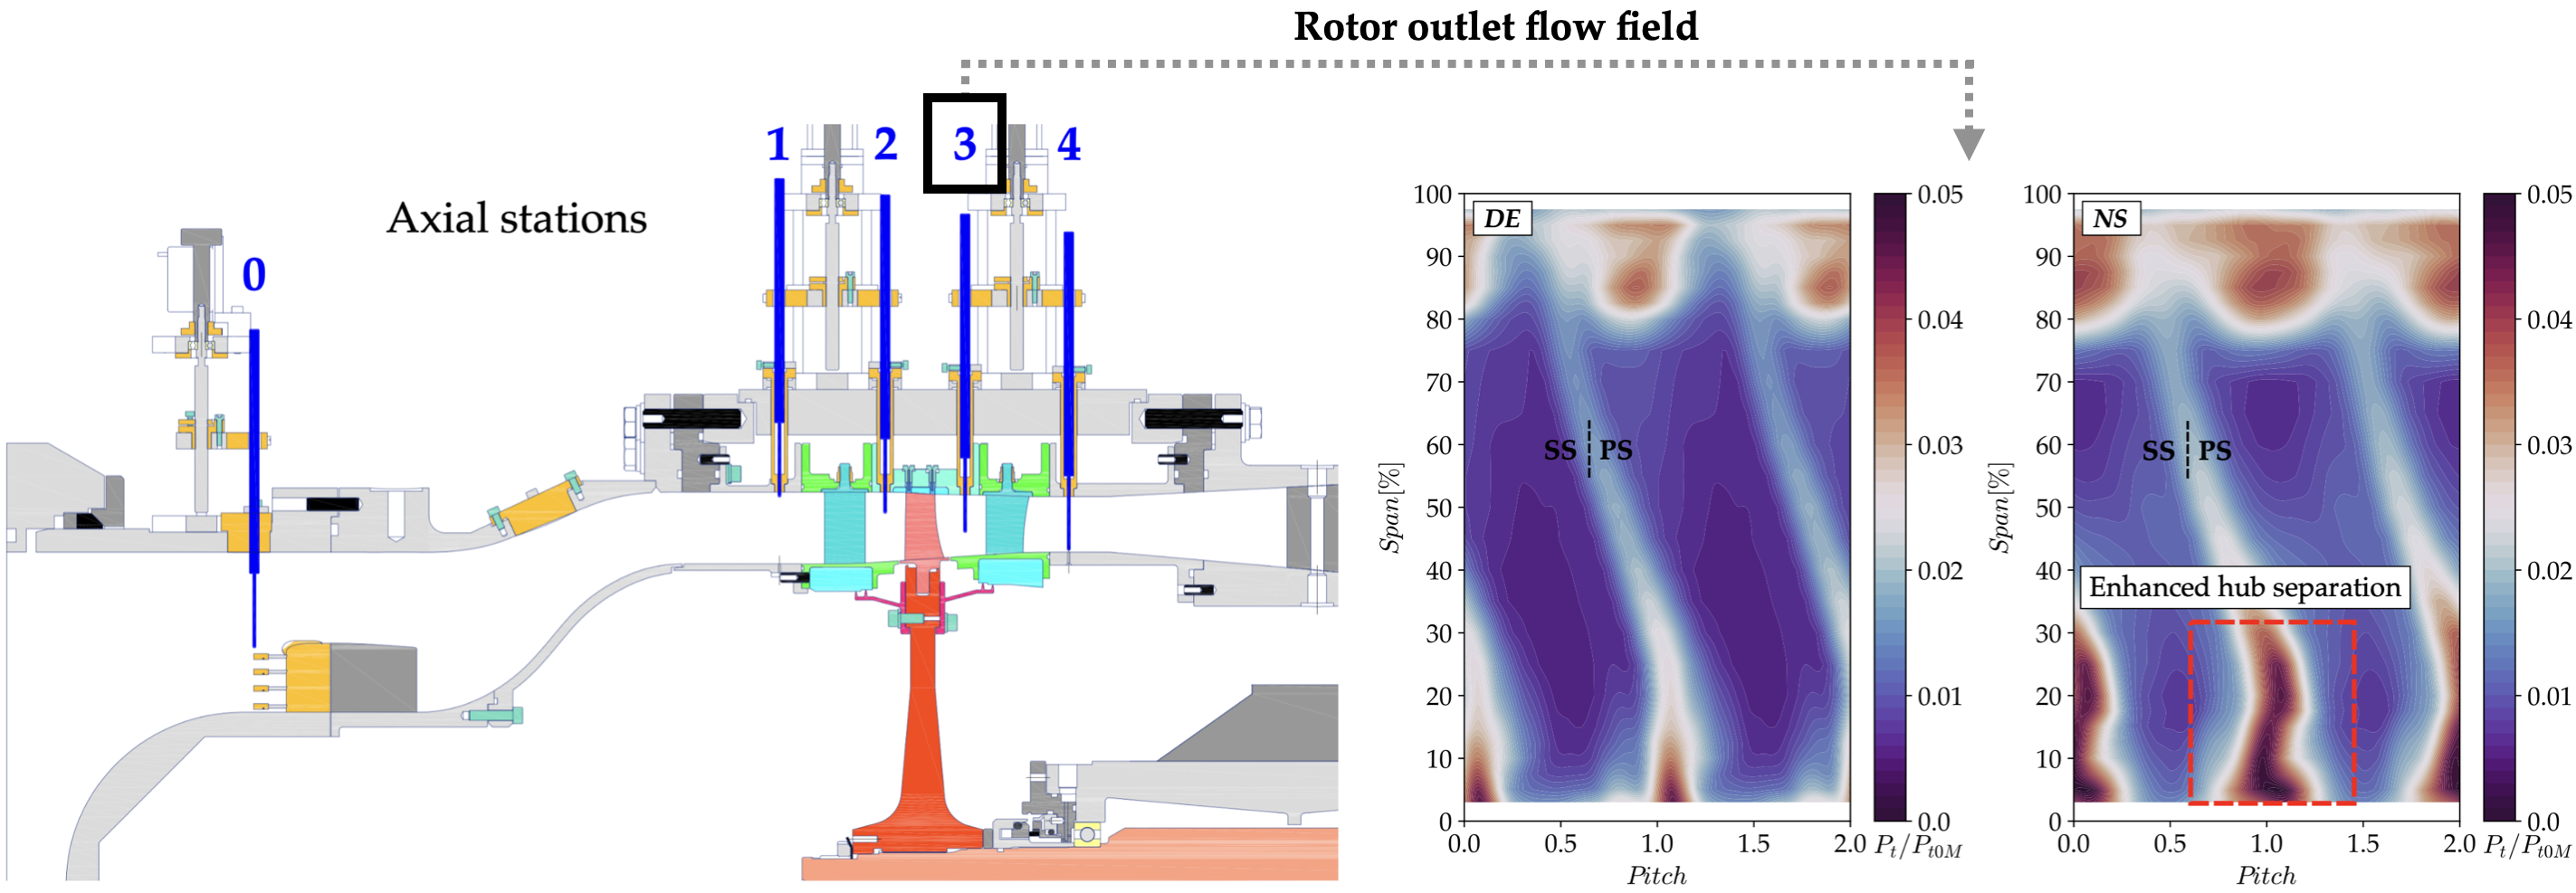
Figure 21 present the PLA of the total pressure and the corresponding RMS at DE and NS conditions. To account for variations in the operating conditions, the averaged value at mid-span has been subtracted from the PLA map.
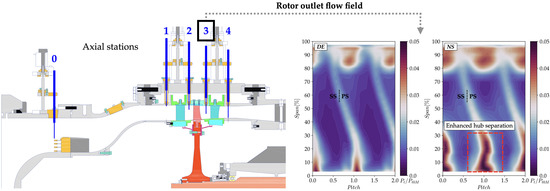
At DE condition, the PLA reveals that the tip flow occupies a significant portion of the passage, extending radially down to 80% of the span. This is corroborated by elevated pressure fluctuations in the same region. Near the hub wall, the corner flow appears relatively narrow, contributing only partially to an increase in wake thickness. However, the pressure fluctuation in this area is notable, indicating the development of an enhanced corner flow. At reduced mass flow, both the hub corner flow and the tip flow experience a sudden increase in size and intensity, accompanied by increased pressure fluctuations within the separation core, while both flow structures are amplified, the tip flow remains relatively stable at the NS condition. In contrast, the hub corner separation emerges as a dominant phenomenon, evolving rapidly near the stability limit. The core of the hub separation shows the maximum pressure fluctuation within the passage, extending up to 30% of the blade span.
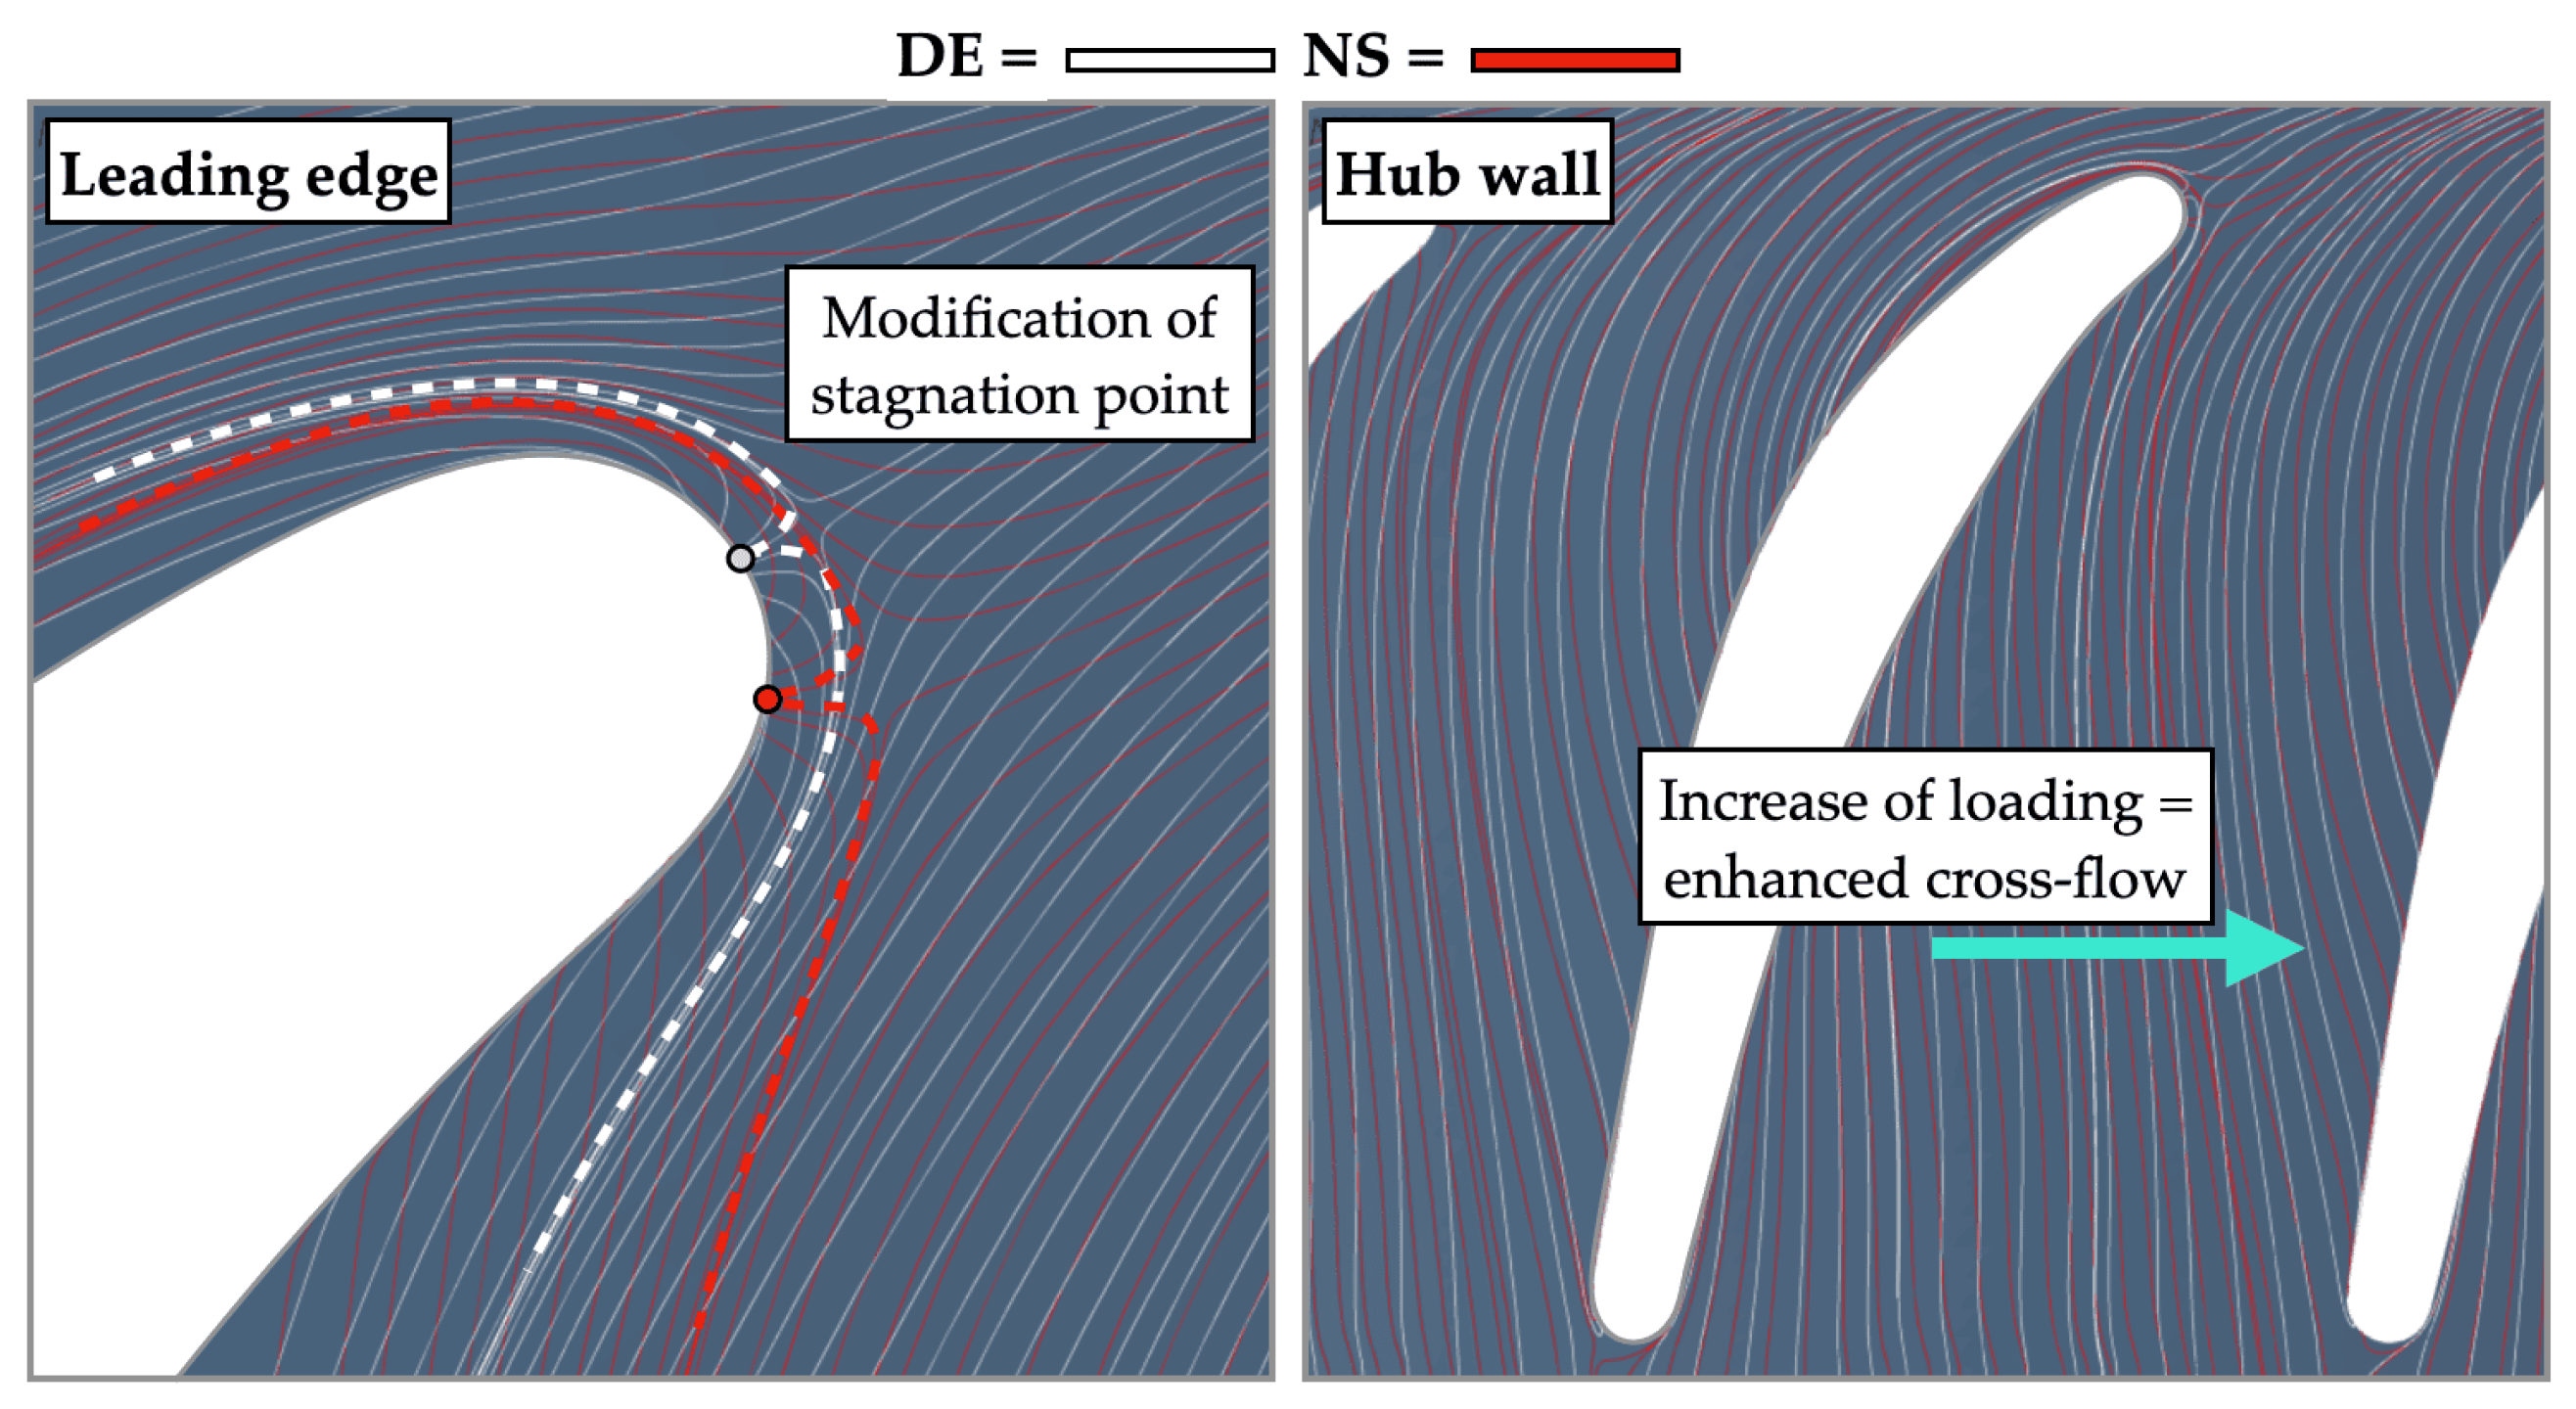
To support the interpretation of the experimental results within the rotor passage, averaged URANS simulations are here employed to analyze the impact of the operating point modification on the flow field. The variation in incidence at the rotor inlet observed in the simulations, resulting from a reduction in mass flow, leads to a shift in the stagnation point around the rotor leading edge and to an increase in loading. This is evident from the averaged skin friction lines on the hub wall (
Figure 22), which appear more inclined within the passage as the stability limit is approached.
As a result, stronger cross-flow is generated on the hub wall, causing increased interaction between low-momentum flow and the rear portion of the rotor suction side. However, as shown in
Figure 22, the horseshoe vortex legs formed around the leading edge (reported with dashed lines) do not seem to directly affect the rotor suction side of the adjacent blade.
Figure 22 also supports the interpretation of the experimental observations at the rotor outlet (
Figure 20 and
Figure 21). Indeed, the horseshoe vortex legs appear to contribute, on one side of the rotor blade, to the accumulation of low-momentum flow on the rotor suction side, which could enhance the development of the hub corner separation observed experimentally at the rotor outlet. On the other side of the blade, the vortex leg does not appear to interact with the suction side of the adjacent blade. However, it is important to note that the CFD may not predict the exact direction of the vortex propagation, and in reality the horseshoe vortex could contribute to the accumulation of low-momentum flow in the rear part of the rotor suction side of the adjacent blade. Therefore, it is plausible that the interaction of the horseshoe vortex contributes to enhancing the hub corner separation. Additionally, it is excluded that the high pressure fluctuation observed in
Figure 21 originates from the passage vortex, as it was detected numerically to be located in the middle of the rotor passage rather than at the wake root.
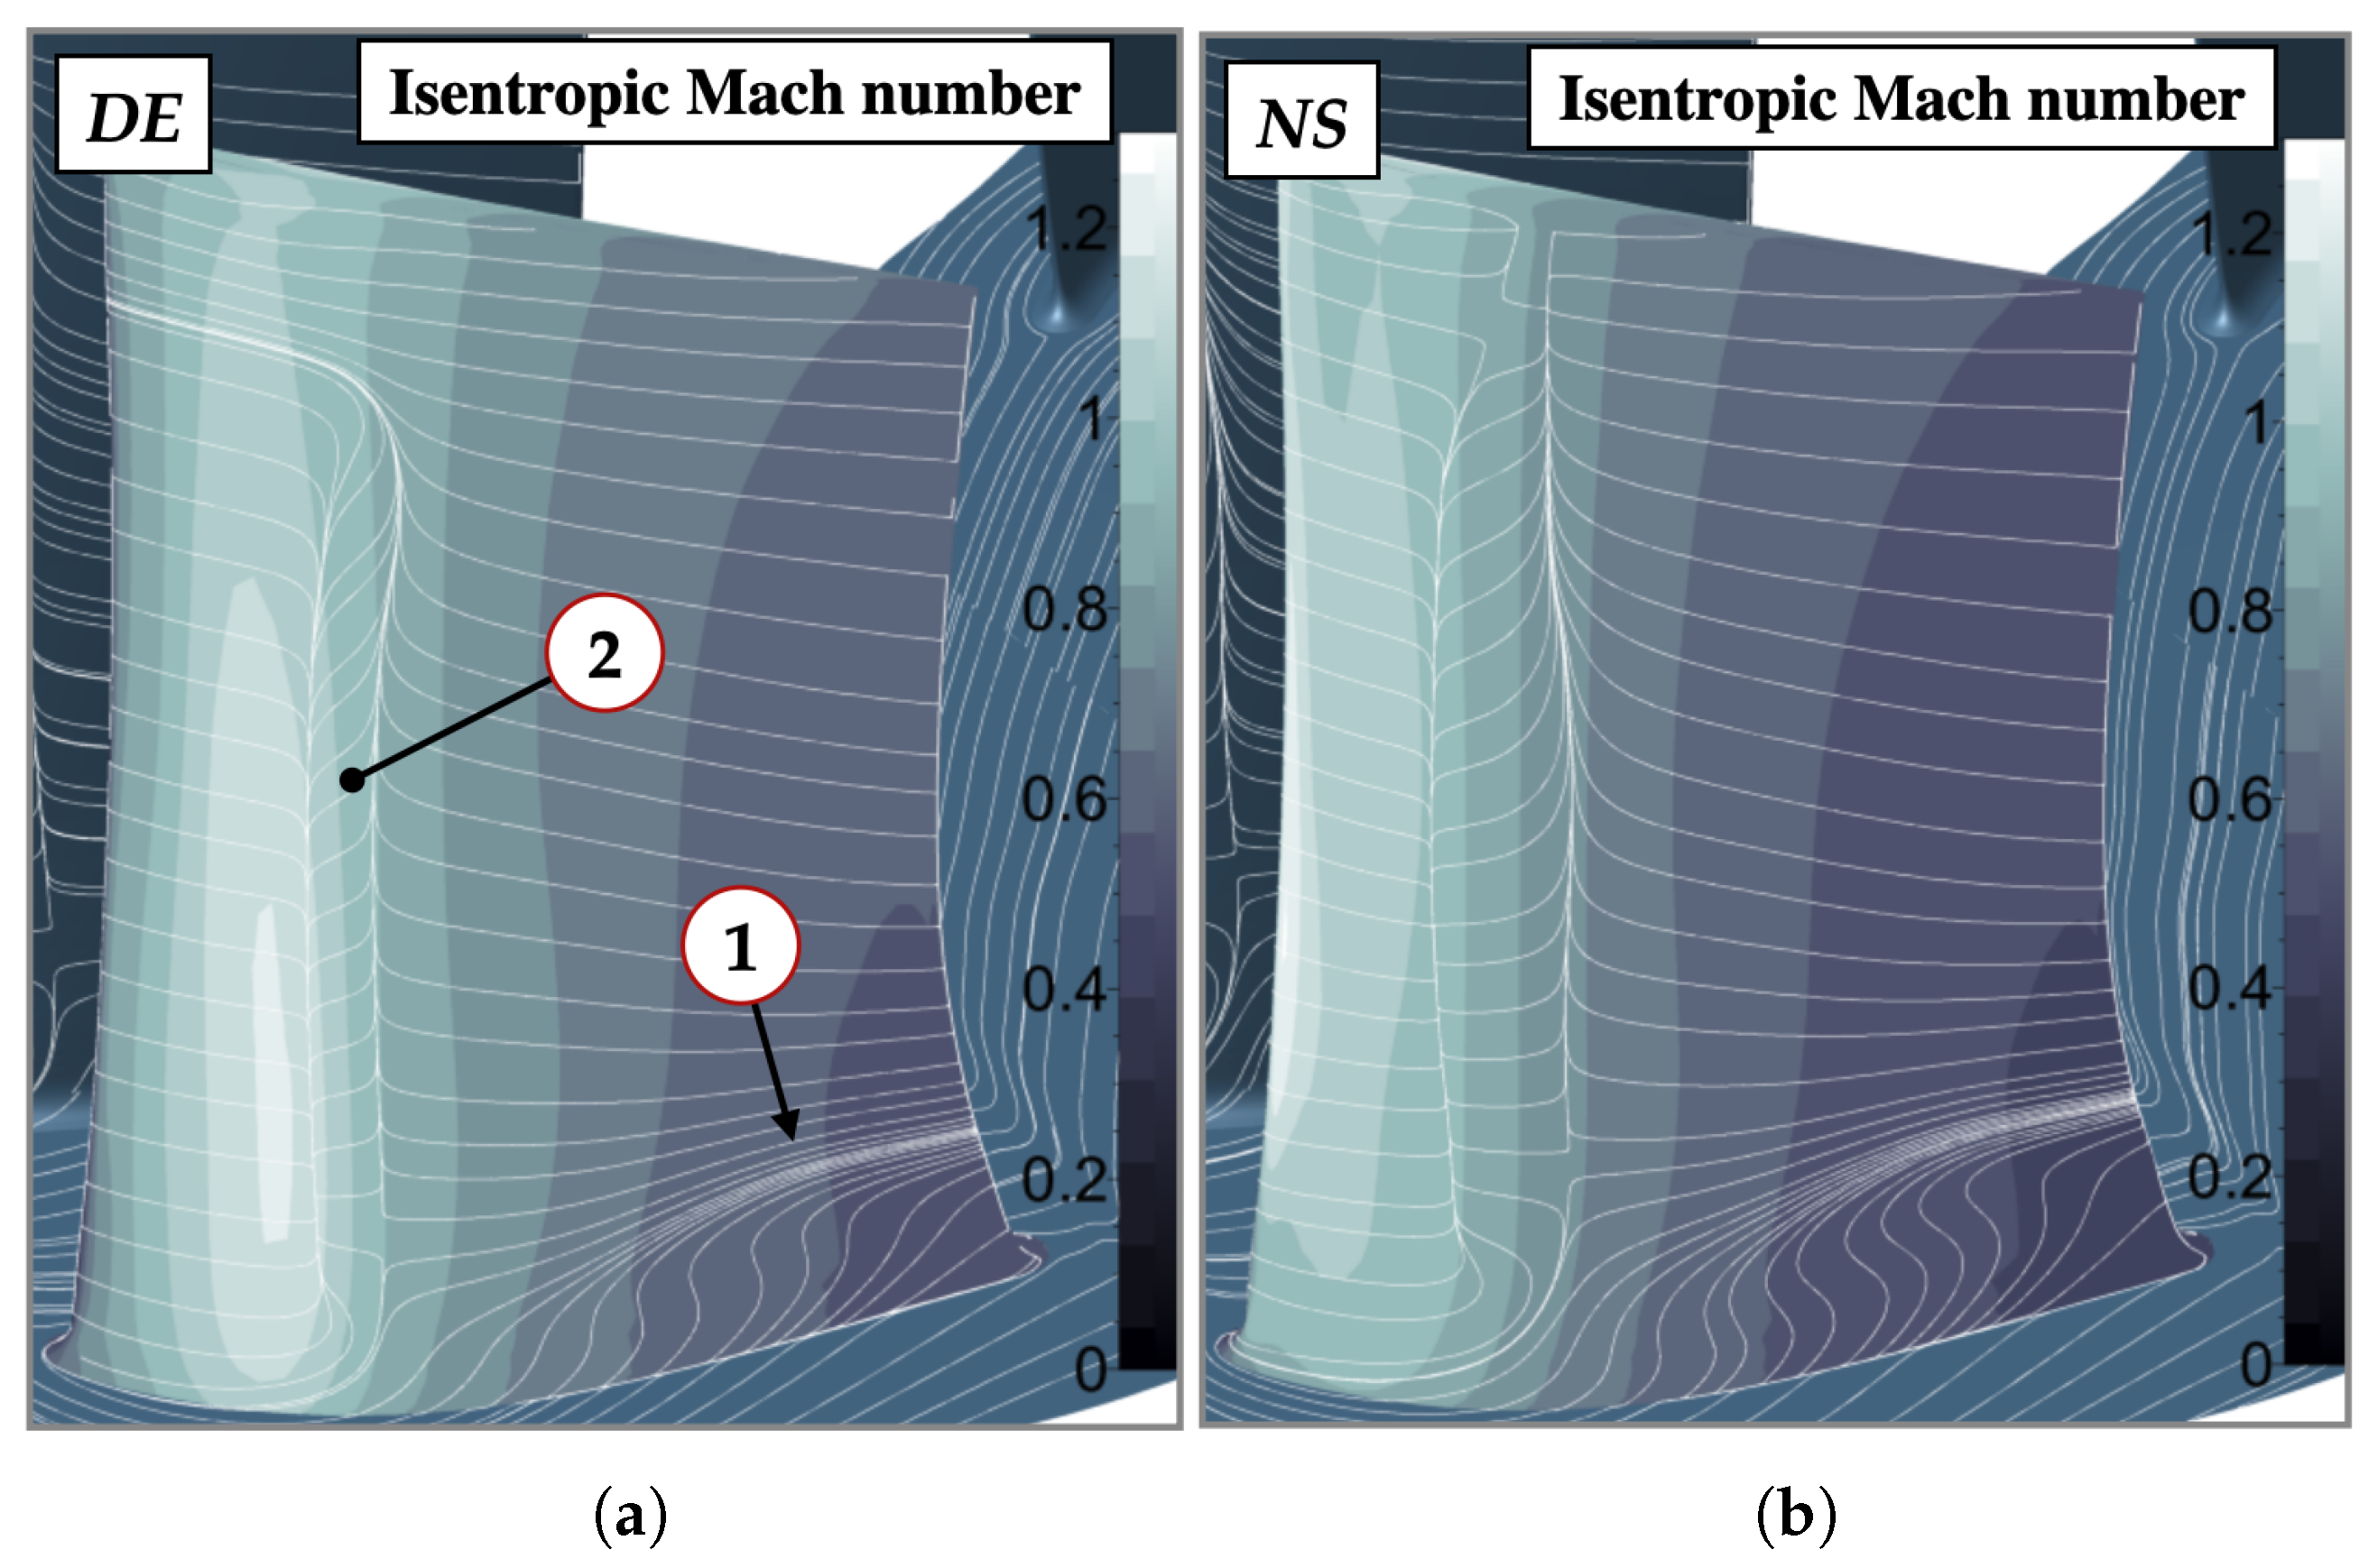
The numerical analysis of the skin friction lines on the rotor suction side enables a detailed characterization of the interaction between the end-wall flow and the rotor surface, as shown in
Figure 23 for both DE and NS conditions, retrieved from averaged URANS simulations. Alongside the skin friction lines, the isentropic Mach number is reported.
The figure highlights the presence of the hub corner separation in the rear part of the rotor suction side near the hub wall (marker 1) at DE condition, with its span-wise extension increasing as mass flow decreases. The increased curvature of the surface streamlines in this region at NS condition indicates enhanced reverse flow and heightened criticality of the hub corner separation. Additionally, separation and reattachment of the boundary layer is evident in the front part of the blade, covering nearly the entire blade span (marker 2). This separation coincides with a shock generated at the end of a sonic pocket, induced by the relative increase in Mach number on the rotor suction side. At NS condition, the edge of the separation shifts closer to the rotor leading edge, and the separation length increases due to the stronger shock and the enhanced adverse pressure gradient. The span-wise extent of this separation reaches 80% of the span at DE condition and nearly extends to the rotor tip at NS condition. However, it should be noted that the absolute size of separations and secondary flow structures predicted in the simulations is highly dependent on the turbulence model employed, as it influences both extent and intensity of the shock-boundary layer separation on the rotor suction side and the hub corner separation. Further details on the impact of the turbulence model on the prediction of secondary flow structures and separations in this machine can be found in [
18].
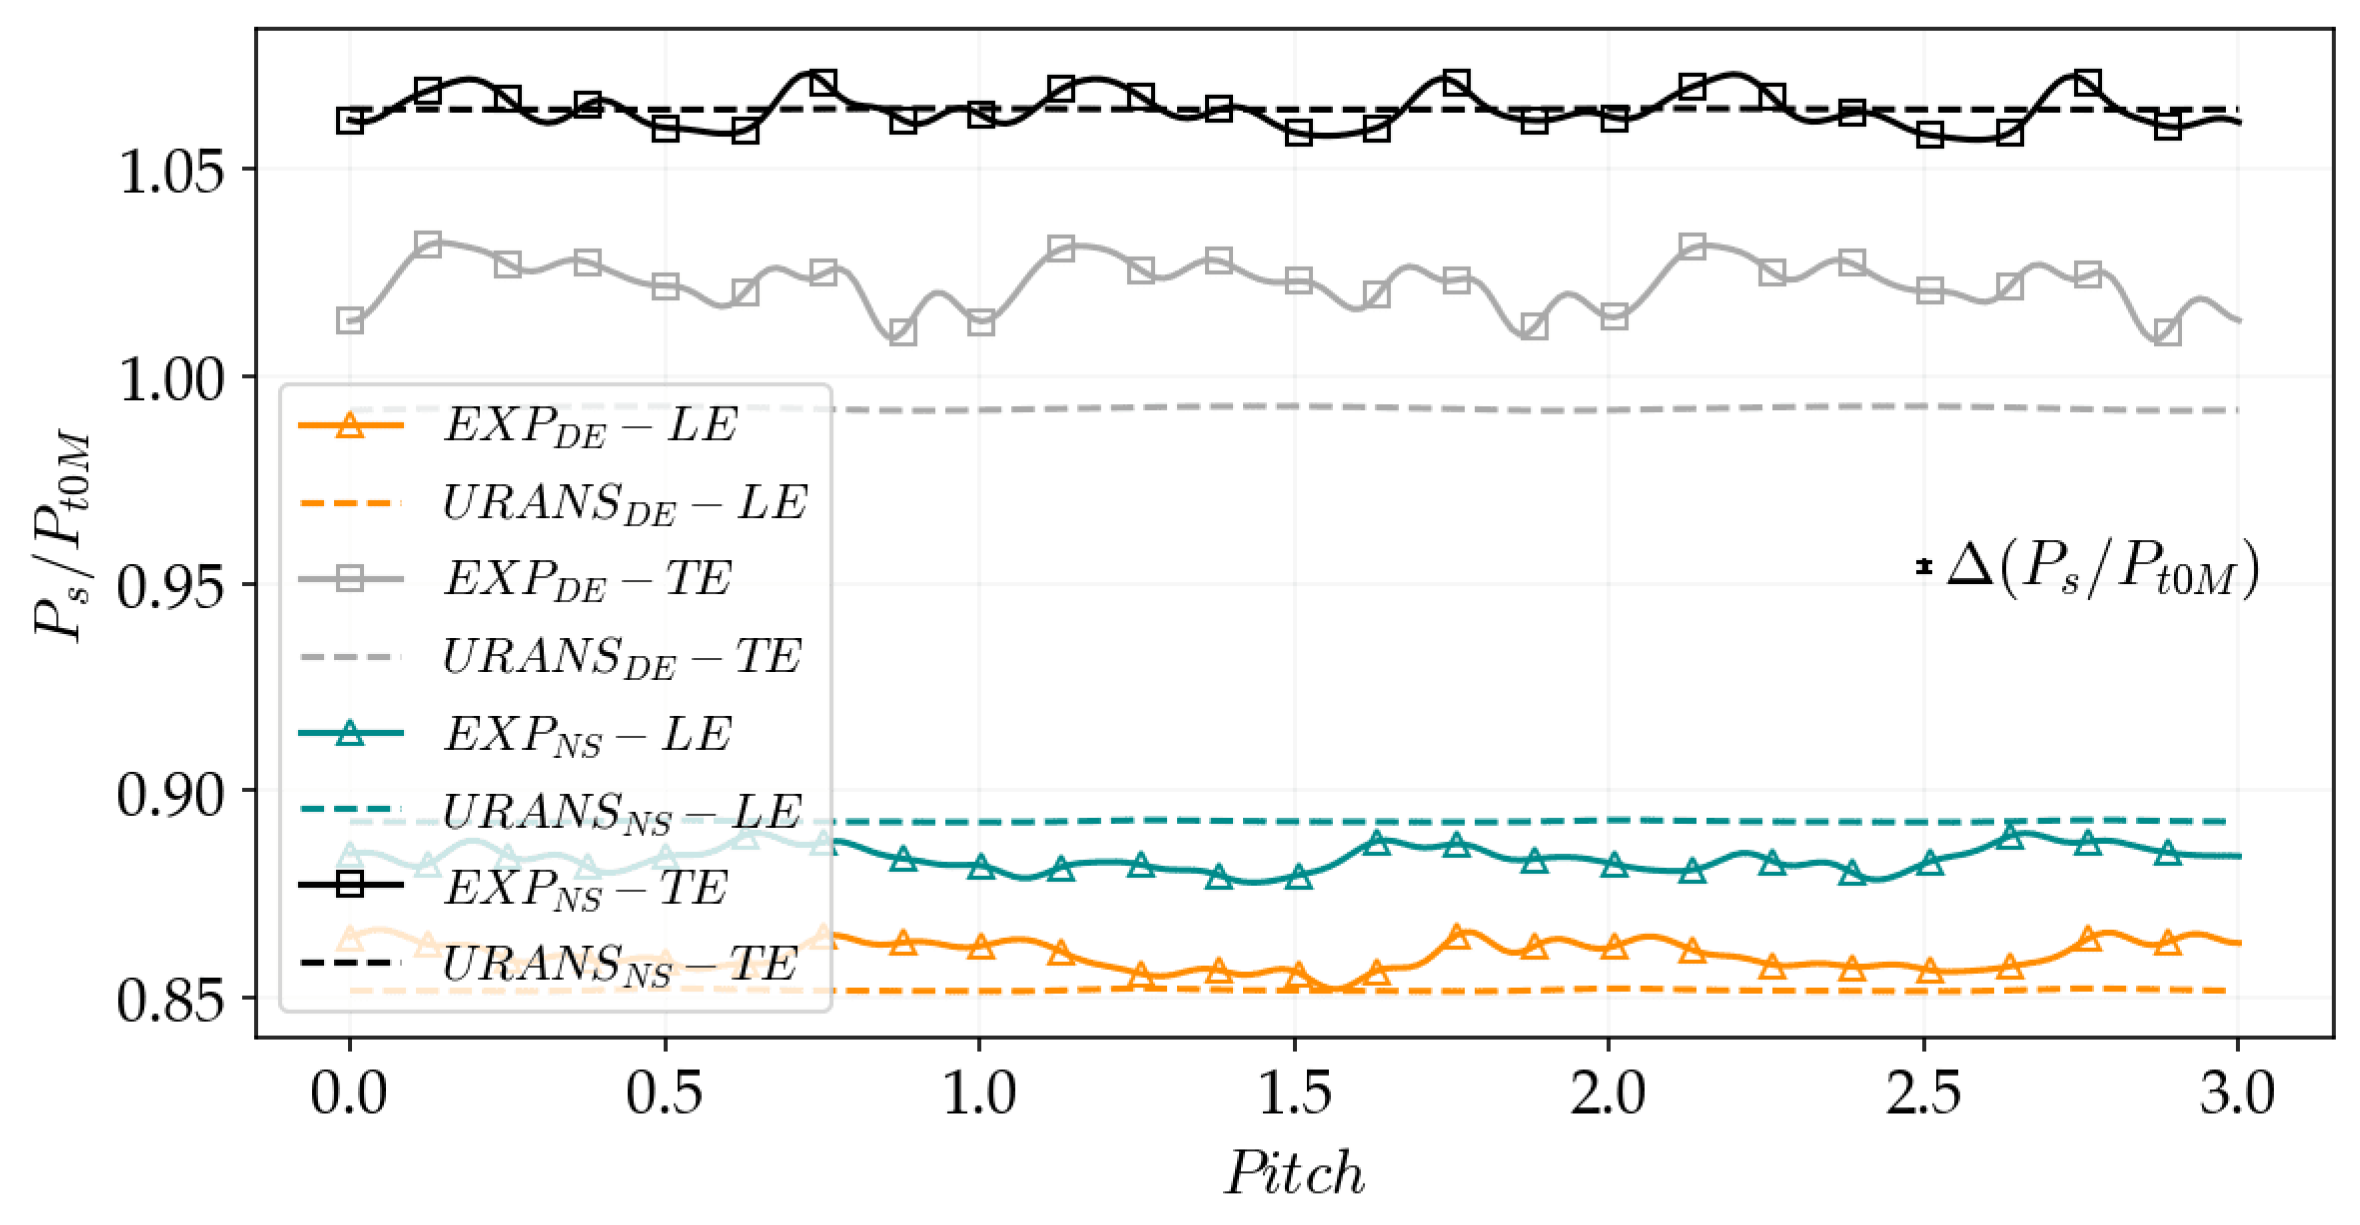
Since casing sensors were only available at the locations of experimental Planes 2 and 3, simulations were used to explore the evolution of the tip flow. To verify the validity of the numerical simulations, the pitch-wise distribution of the static pressure was therefore compared with the experimental results in Plane 2 and 3, as reported by
Figure 24. Specifically, in
Figure 24, experimental PLA distributions corresponding to three rotor pitches are compared with the time-mean of the URANS, computed over the full time length periodicity of the simulations.
The figure shows that the simulations accurately predict the absolute value of the static pressure on the tip wall, with maximum difference of 2.95% at the trailing edge at DE condition. This observation aligns with the measured performance of the stage, where a maximum difference between experiments and simulations was detected at DE condition. Based on these results, the simulations appear to be quantitatively consistent with the experimental data.
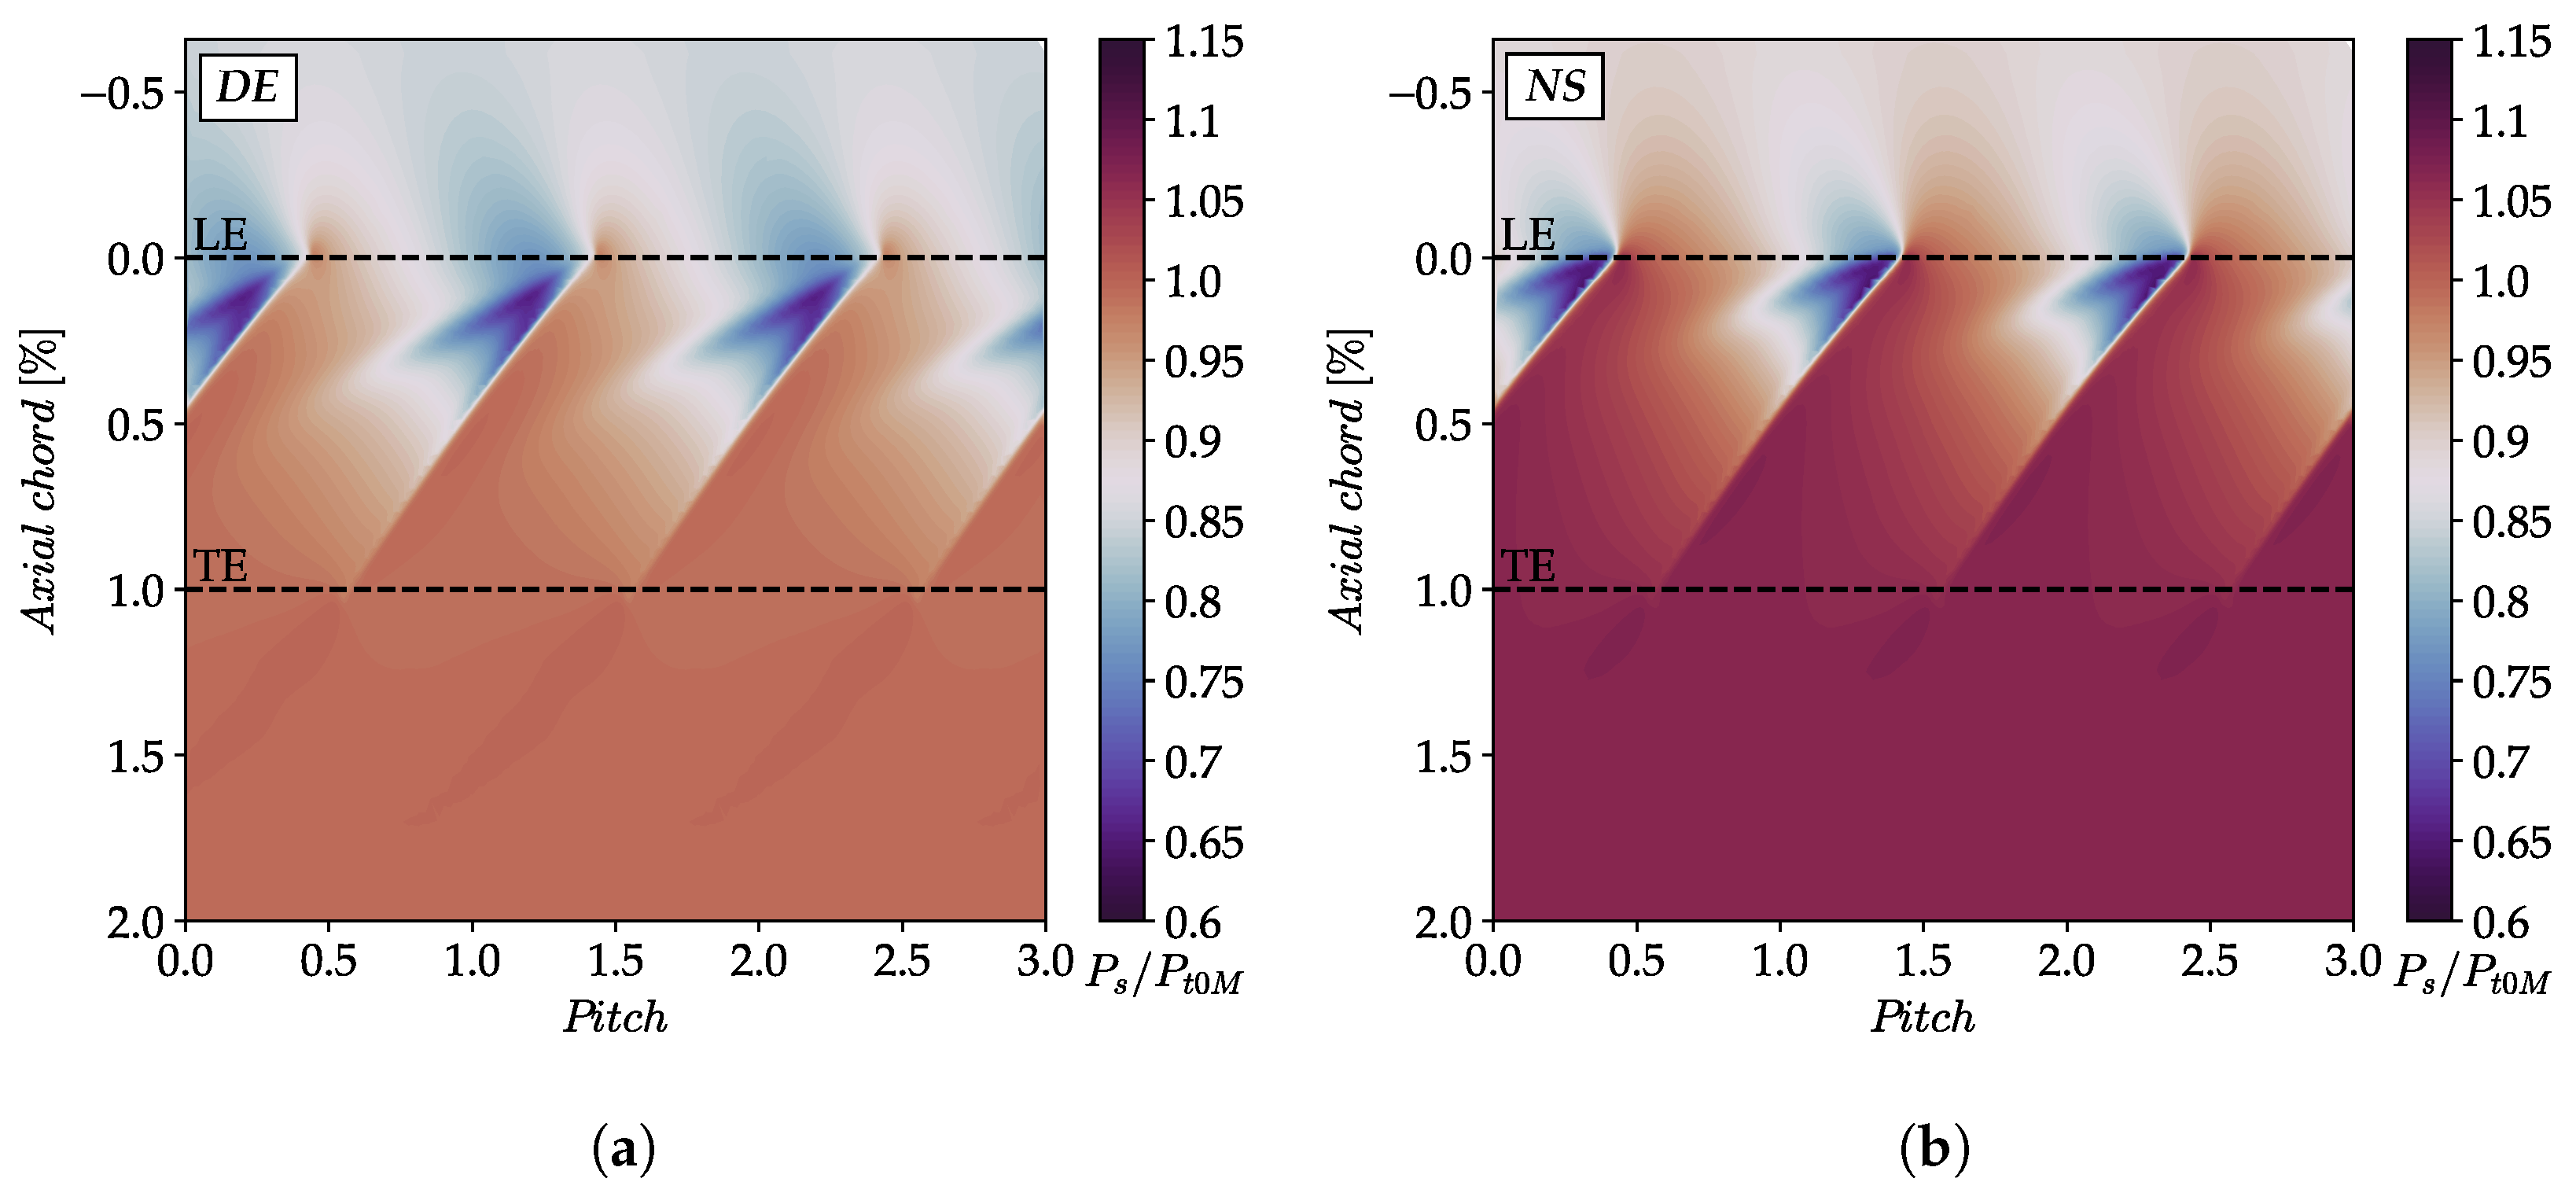
Figure 25 presents the casing static pressure field obtained from averaged URANS simulations at DE and NS conditions.
This figure highlights a reduced-pressure region within the core of the tip-leakage flow and an increased streamwise static pressure gradient at reduced mass flow. However, although the inclination of the tip-leakage flow increases as the stability limit is approached, due to the enhanced rotor inlet incidence, no evidence of critical flow features is observed. This conclusion is further supported by the findings reported in [
18,
20], where the steady and unsteady entropy distributions highlighted the absence of critical secondary flow features, particularly when approaching the machine stability limit. However, in the present work, static pressure is discussed to remain consistent with the quantities measured by the experimental casing sensors.
4.3.3. Description of the Stator Flow Field
Figure 26 presents the numerical and experimental span-wise distributions of total pressure and flow angle at the stator outlet, while
Figure 27 shows the tangential and axial velocity distributions. The latter is normalized through the absolute velocity computed experimentally in Plane 4 at mid-span. The Mach number and total temperature distributions are omitted as the Mach number closely resembles the total pressure distribution, and the averaged total temperature remains unchanged across the stator row. Experimental data were obtained by averaging the results retrieved from the pneumatic probe in the pitch-wise direction. The highest uncertainty, calculated over the entire span, is reported.
The total pressure at both DE and NS conditions decreases compared to Plane 3. Moreover, the tangential velocity component and the absolute flow angle at the stator outlet are lower than in Plane 3 due to the flow straightening induced by the stator blade. However, near the end-walls, the distributions deviate from the general trend. In these regions, a local increase in flow angle and tangential velocity suggests the presence of flow structures causing local flow blockage, as indicated by the reduction in axial velocity. This observation is further supported by the decrease in total pressure at both hub and tip, highlighting the generation of losses. These enhanced flow features observed near the end-walls are likely induced by the blockage introduced by the upstream rotor flow features, such as the hub corner separation and tip-leakage flow, which develop at the hub and tip, respectively. Moving from DE to NS conditions, experiments show an average change in flow angle of 1.26°.
The simulations generally align well with the experimental results. However, as indicated by the performance data, the total pressure at DE condition is slightly lower than the experimental values, while showing a closer match at NS condition. Additionally, the flow angle at mid-span is accurately predicted by the URANS simulations, though a larger discrepancy is observed near the end-walls, especially close to the tip, where a maximum difference of 1.6° is found compared to the experimental results. However, it should be noted that, despite the good agreement of the simulations with the experiments, the computed uncertainty on the flow angle was found to be ±0.8°, which could hide a larger discrepancy between experiments and CFD.
The stator flow field can be examined more in detail by means of
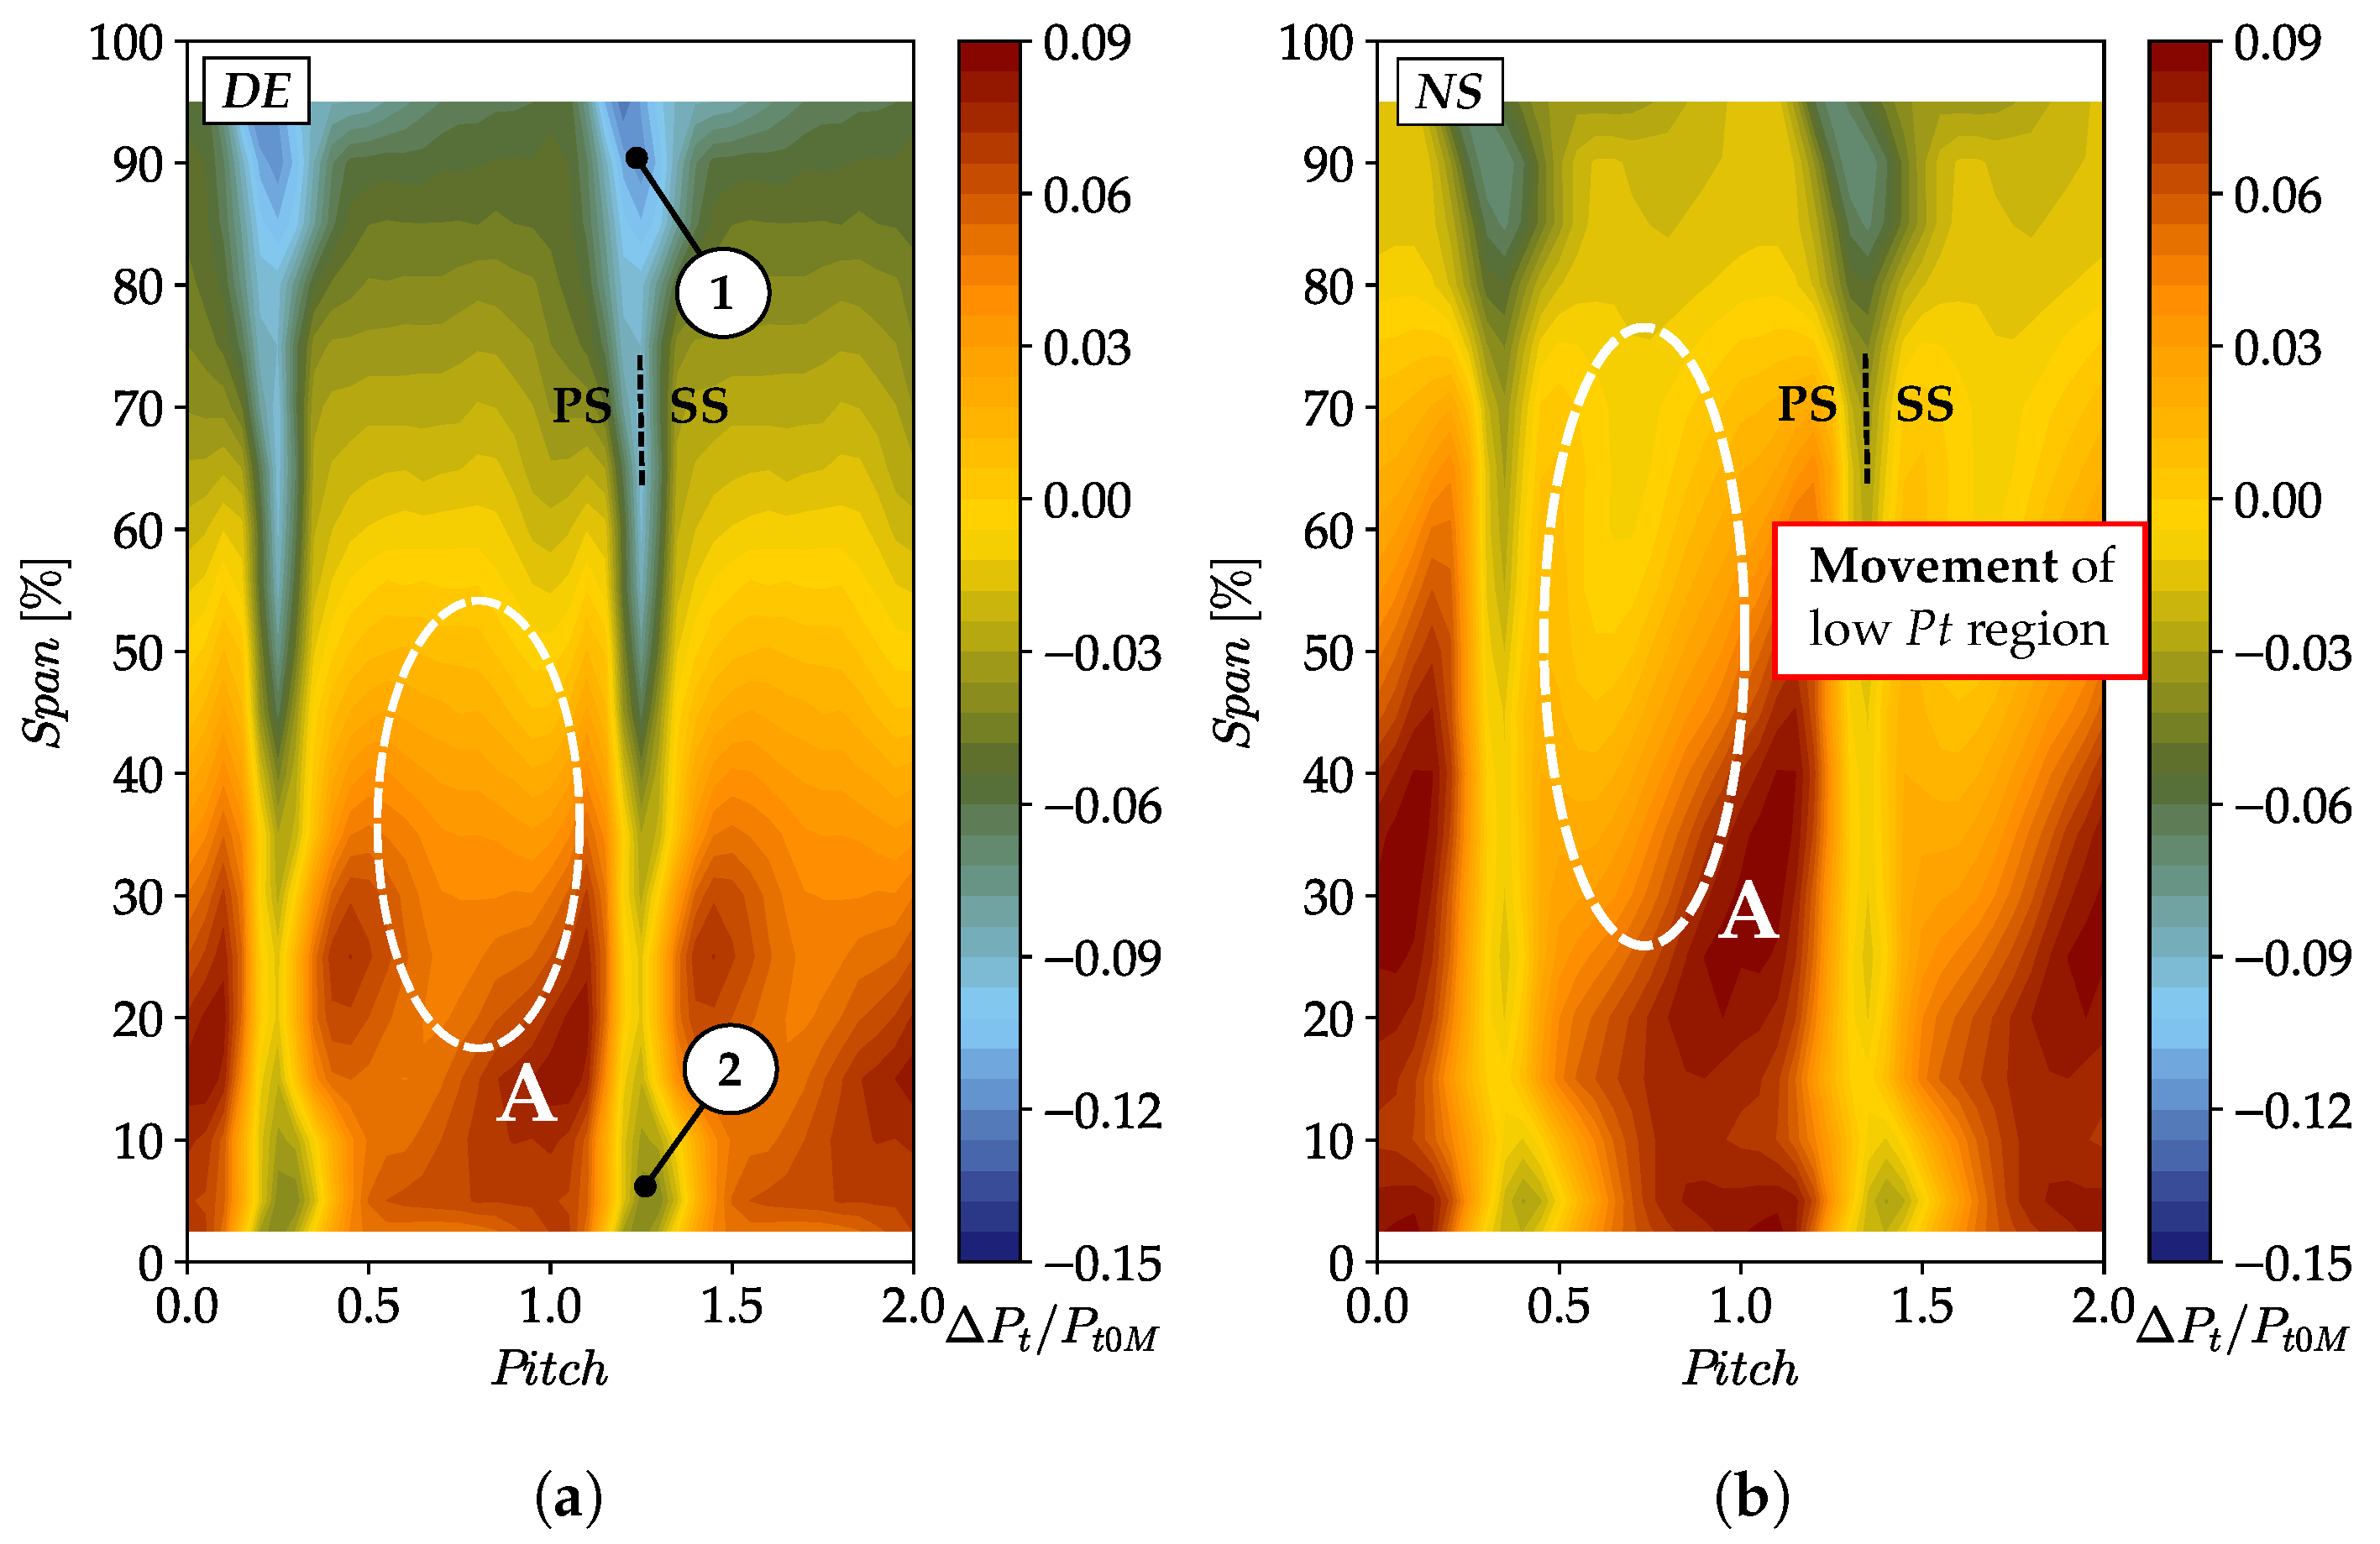
Figure 28, which presents the experimental distribution of total pressure in Plane 4 at DE and NS conditions. To prevent the absolute pressure value from scaling with the operating point, the pitch-wise average at mid-span was subtracted from the measured pressure. In addition to the total pressure maps,
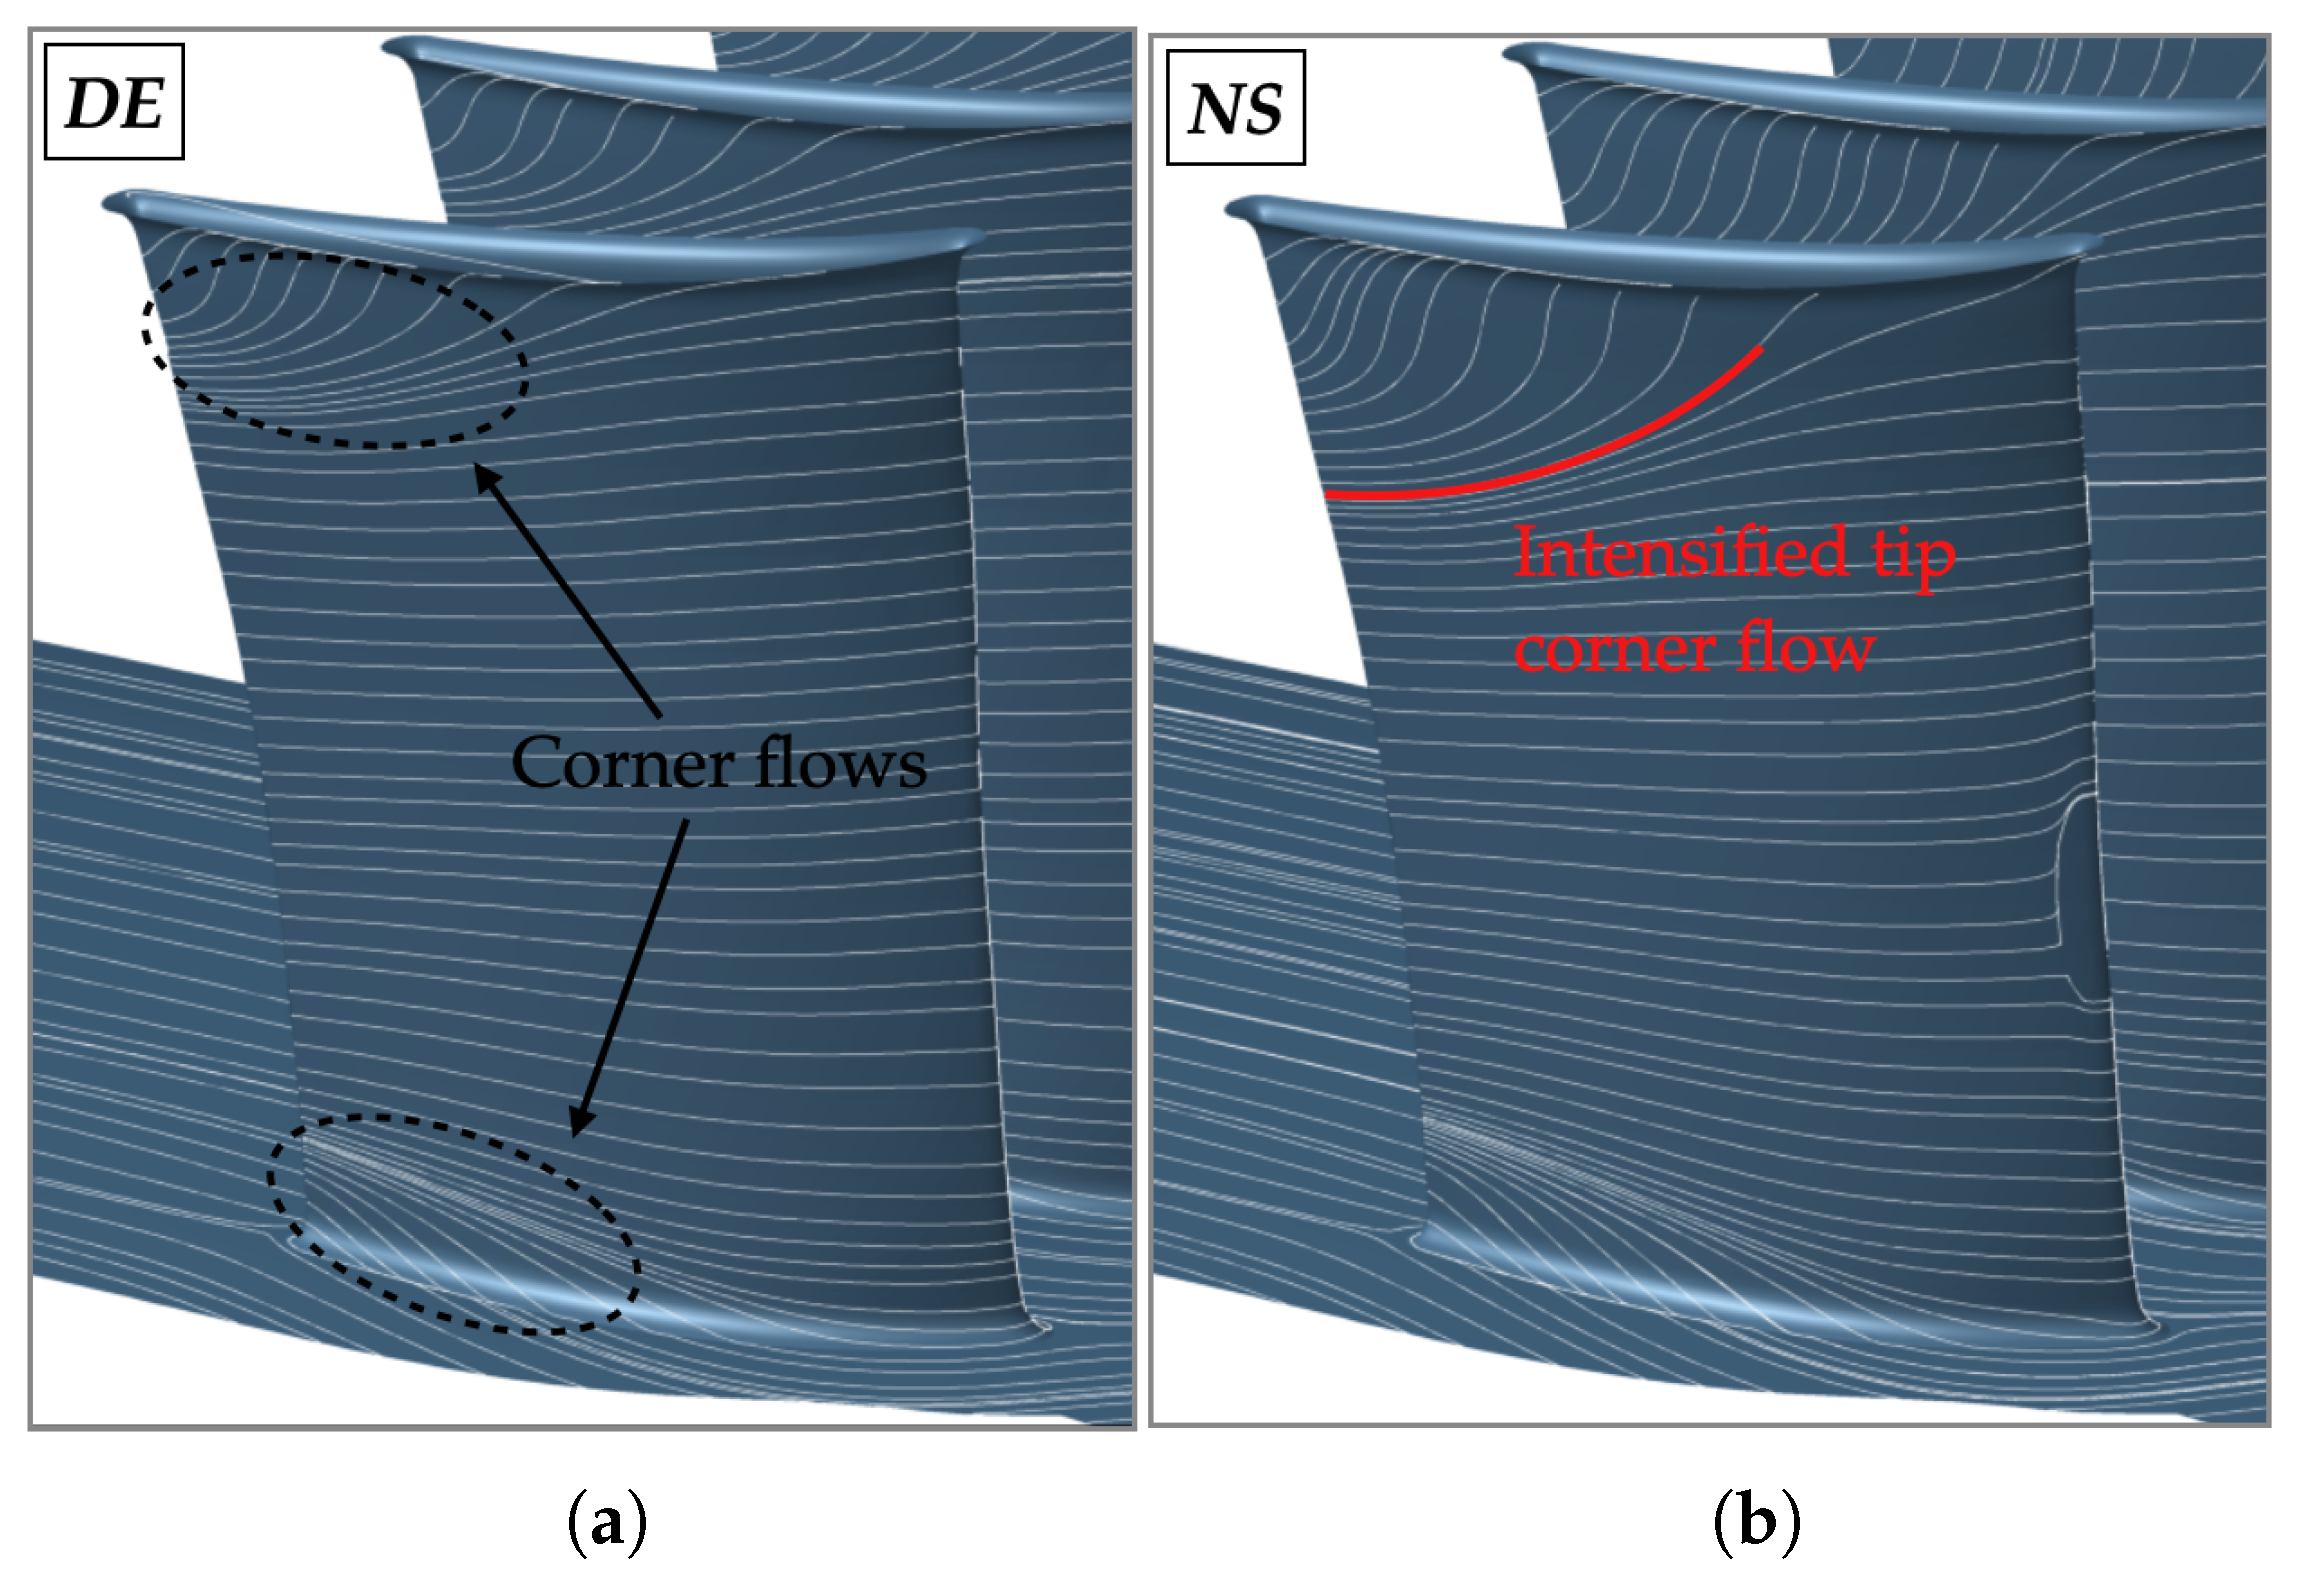
Figure 29 and
Figure 30 report the averaged skin friction lines retrieved from the URANS simulations on the suction and pressure side, respectively.
Markers 1 and 2 in
Figure 28 indicate the development of corner flows at the tip and hub corners on the suction side of the stator blade, which are caused by the blockage introduced by the tip-leakage flow and the hub corner separation and the consequent variation in incidence. These flow structures become more pronounced as the stability limit is approached, due to the larger absolute incidence value. Additionally, a region of reduced total pressure appears in the middle of the stator passage, particularly below 50% span at DE condition (marker A). As the stability limit is approached, this low-pressure region shifts closer to the stator suction side and intensifies within the 20% to 70% span range. Its interaction with the stator wake causes the wake to thicken, especially around 25% span at NS condition. The underlying cause of this reduced total pressure in the middle of the stator passage was previously investigated by [
20], where the effects of clocking and the upstream IGV on the development of flow features within the stator passage were analyzed.
A similar outcome is predicted by the URANS simulations (
Figure 29), which reveal localized flow structures near the end-walls, consistent with the experimental results. At the NS operating point, the corner flow intensifies, especially in the tip region. This is evident from the increased corner flow observed at the tip in both the experiments and simulations, as well as the enhanced span-wise curvature of the skin friction lines on the stator suction side near the tip. On the pressure side (
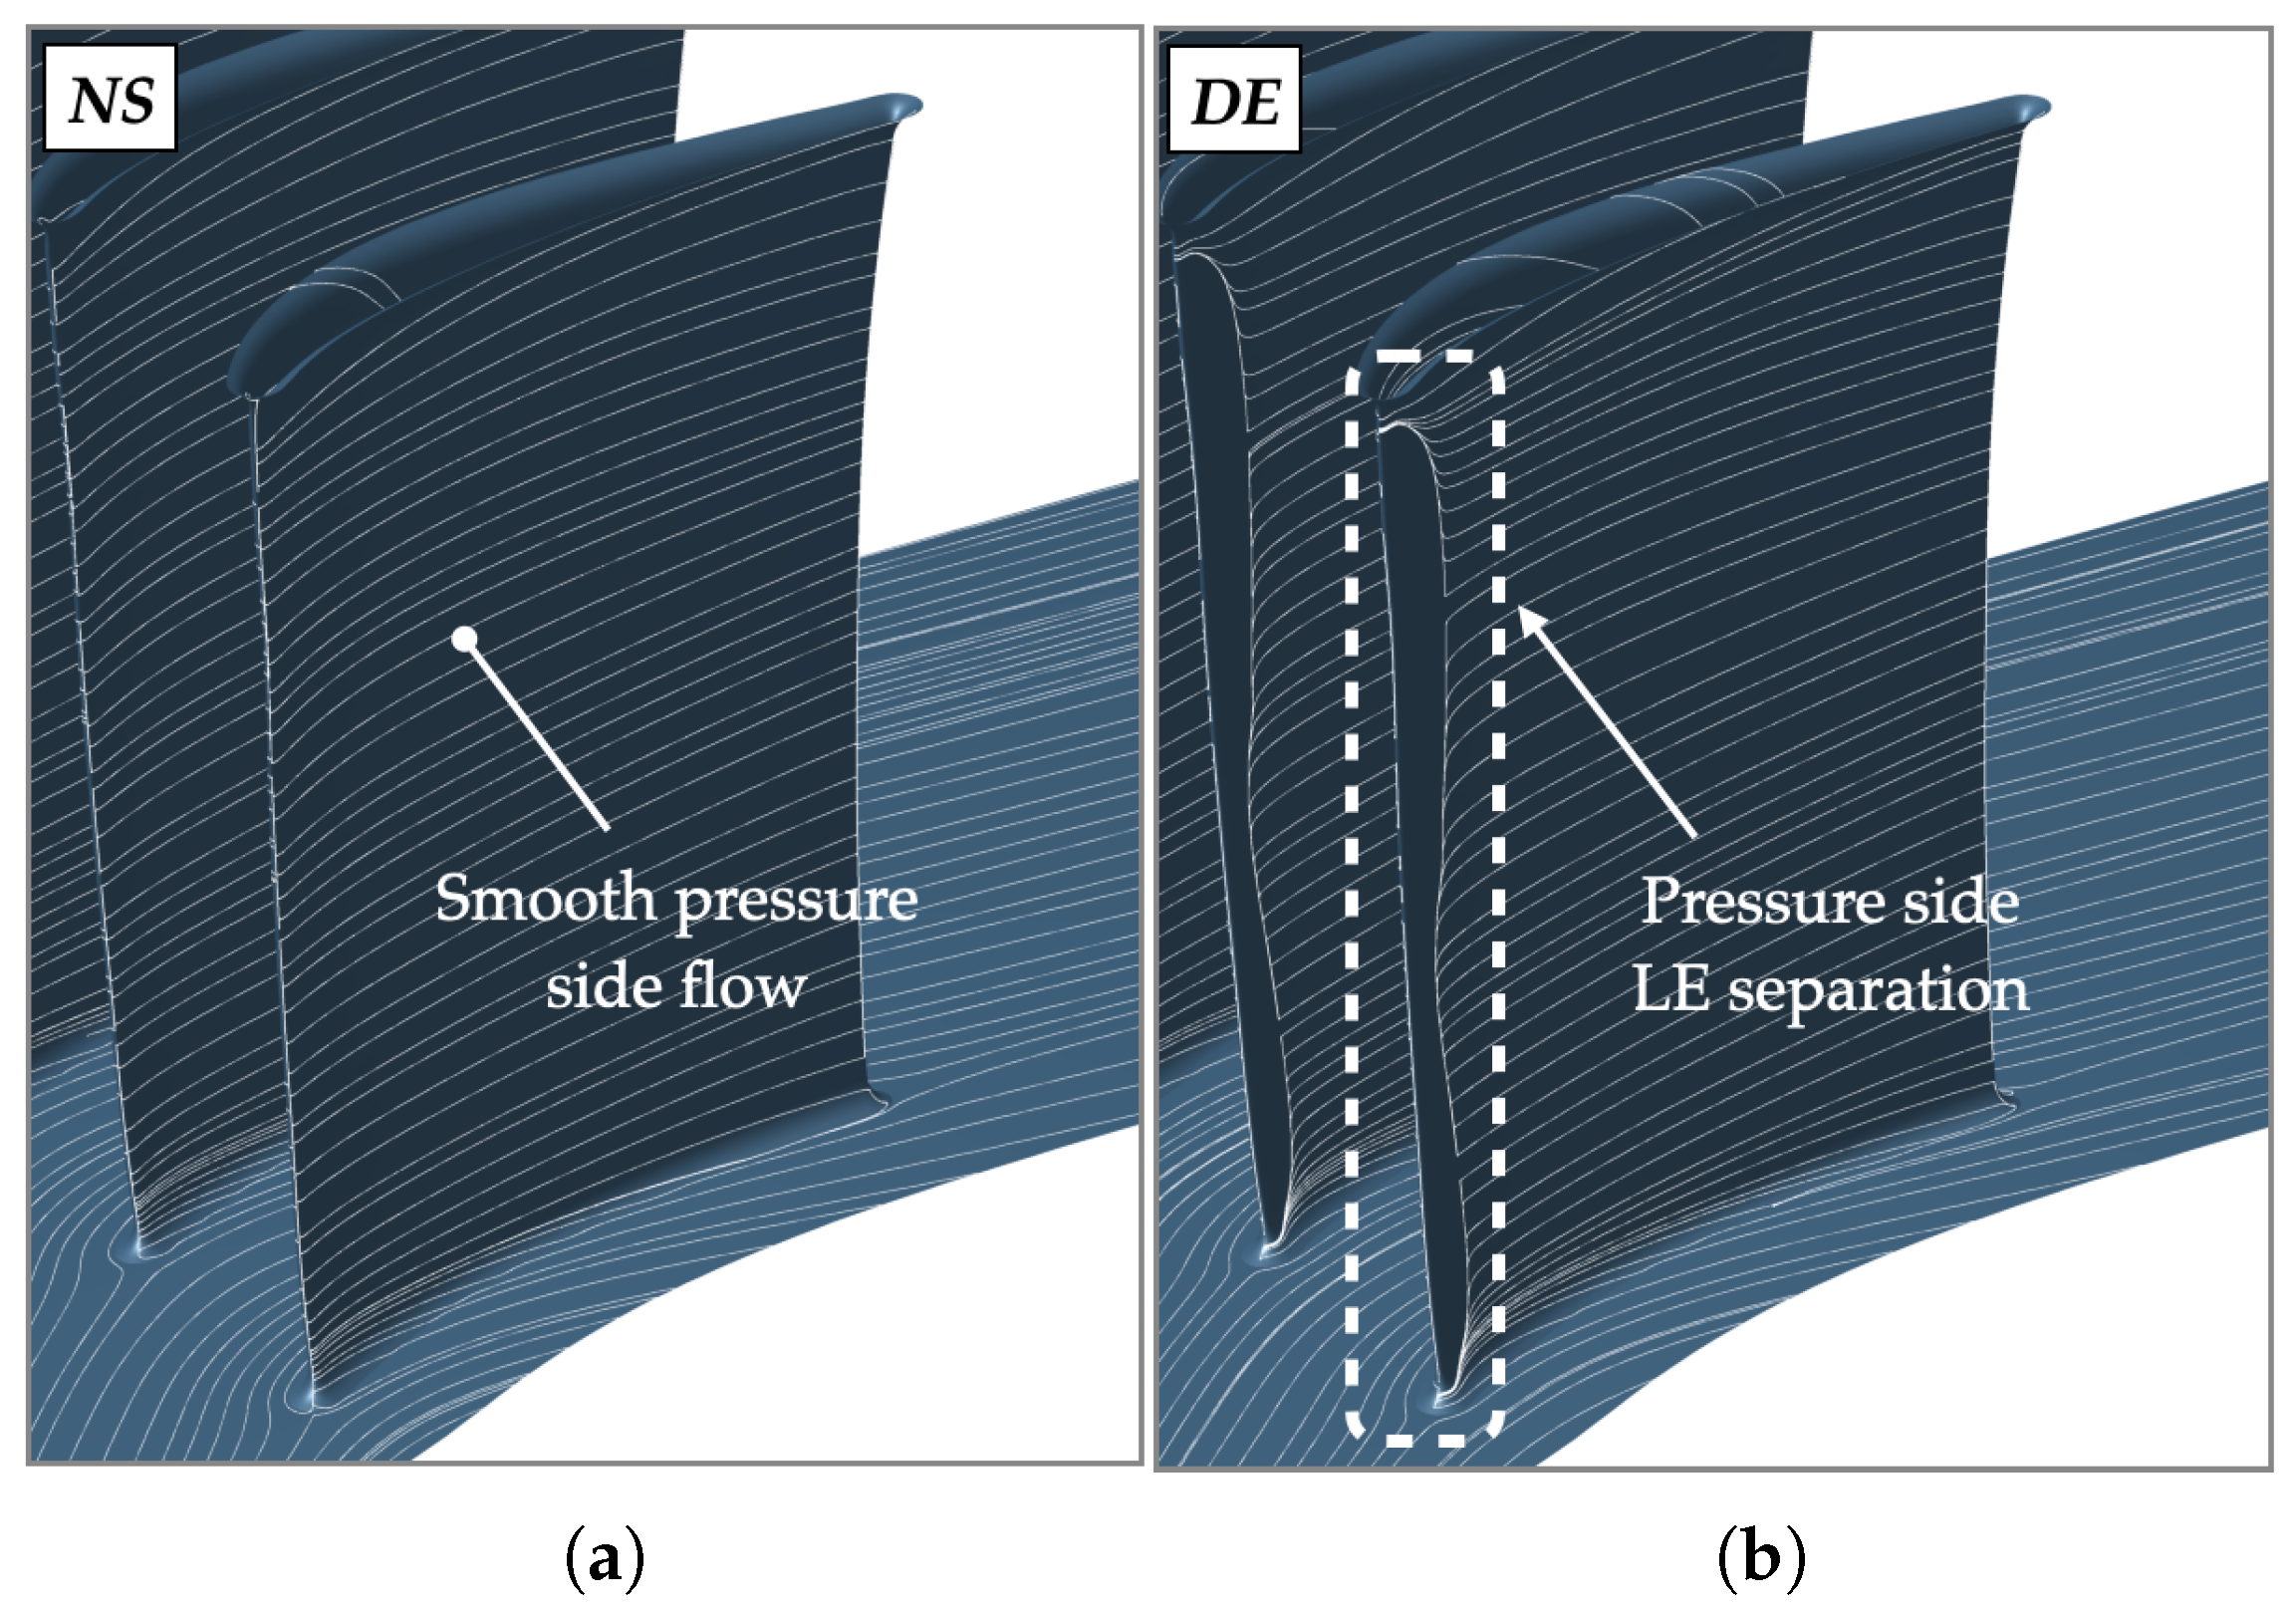
Figure 30), a small separation occurs near the leading edge at DE condition. The flow becomes smooth, with no separation observed around the leading edge at reduced mass flow, due to the higher absolute value of the incidence.