Article

The Effect of a Variable Cantilevered Stator on 1.5-Stage Transonic Compressor Performance †

1
Institute of Gas Turbines and Aerospace Propulsion, Technical University of Darmstadt, Otto-Berndt-Straße 2, 64287 Darmstadt, Germany
2
Rolls-Royce Deutschland Ltd. & Co. KG, Eschenweg 11, 15827 Blankenfelde-Mahlow, Germany
*
Author to whom correspondence should be addressed.
This paper is an extended version of our paper published in Proceedings of the 16th European Turbomachinery Conference, Hannover, Germany, 24–28 March 2025.
Int. J. Turbomach. Propuls. Power 2025, 10(3), 24; https://doi.org/10.3390/ijtpp10030024
Submission received: 7 May 2025 / Revised: 16 May 2025 / Accepted: 12 August 2025 / Published: 2 September 2025

Abstract

Future aero engine designs must address environmental challenges and meet noise and emissions regulations. To increase efficiency and reduce size, axial compressors require higher pressure ratios and a more compact design, leading to necessary modifications in the variable stator vanes, especially in the stator hub region. This study examines the impact of a variable cantilevered stator on the performance and aerodynamics of a 1.5-stage transonic compressor, representative of a high-pressure compressor front stage. Experimental tests at the transonic compressor test rig at Technical University of Darmstadt involved two variable stators with identical airfoil designs but different hub configurations, using the same inlet guide vane and rotor. Detailed aerodynamic analysis was conducted using steady and unsteady instrumentation. The cantilevered stator achieved a 2% increase in efficiency and a 1% increase in total pressure ratio, due to higher aerodynamic loading and reduced pressure losses. The primary performance gain comes from the reduction of the hub blockage area. The cantilevered stator also performed well at near stall conditions, unlike the shrouded stator. Time-resolved measurements indicated that loss mechanisms are closely linked to the rotor wake phase. Overall, variable cantilevered stators outperformed shrouded stators in this compressor stage.

Graphical Abstract

1. Introduction

The continuous growth in air traffic raises environmental concerns, making it increasingly important to meet political targets in terms of reducing emissions, particularly carbon dioxide and nitrogen oxides. However, achieving the targeted efficiency goals is essential. Reducing the size and weight of the core engine contributes to lower fuel consumption by enabling an increase in bypass ratio.
Figure 1. Illustration of the underlying issue encountered due to downsizing of the core engine (blue arrows indicate reduction of circumference due to the downsizing).
Ijtpp 10 00024 g001
This, in turn, enhances propulsive efficiency while simultaneously limiting aerodynamic drag during flight. The compressor is vital in this process, comprising about one-third of the engine’s size and weight. Downsizing the core engine poses significant challenges for the design of variable stators. As illustrated in Figure 1, a reduction in core engine size results in a decreased inner shroud circumference. Consequently, the spacing between adjacent vane pivots (pennies) becomes smaller, eventually leading to potential overlap. To address this issue, cantilevered variable stators offer a promising solution by eliminating the need for pivot integration within the inner shroud region. Variable stator vanes (VSVs) improve the part-power performance of axial compressors by decreasing the incidence angle and increasing the stall margin. Therefore, VSVs are commonly used in the first stages of modern high-pressure compressors. However, VSVs introduce additional losses due to the clearances needed for rotation around the vane axis.
Wellborn et al. [1] studied the effects of stator seal, highlighting the variable stator pivot and clearance leakage as areas worth of investigation. They show that it is crucial to take seal-tooth leakage and tip clearance flow equally into consideration when comparing shrouded and cantilevered stators.
Recent studies have provided a comprehensive comparison of shrouded and cantilevered stator configurations in axial compressors, revealing distinct performance characteristics that influence their suitability for various applications. Campobasso et al. [2] showed that shrouded stators outperform cantilevered stators at design condition, but the stall margin is higher with the cantilevered stage. However, Campobasso et al. qualified their statement somewhat with regard to the geometric conditions of the hub region.
Swoboda et al. [3] conducted a detailed comparison of the flow fields in an axial compressor with either cantilevered or shrouded stators, both paired with identical rotors. The study highlights the impact of the hub clearance vortex, particularly its role in reducing separation regions on the hub and stabilizing the flow field in the cantilevered stator configuration.
The study by Rückert and Peitsch [4] compared two annular stator cascades, focusing on the impact of tandem stators in cantilevered fashion. Both stator types benefit from hub clearance flow (tandem and conventional), which helps suppress the corner separation. However, these performance gains are sensitive to changes in hub clearance size.
A strong dependency of cantilevered stator efficiency from the hub tip gap is evident in studies by Si et al. [5].
Freeman [6] presented experimental data comparing the performance of non-variable shrouded and cantilevered stators. On the one hand, the results indicate that cantilevered (unshrouded) stators outperform shrouded stators when the leakage area is less than 2.5% of the annulus area. On the other hand, shrouded stators demonstrate superior performance when the leakage area exceeds 2.5%.
Yoon et al. [7] proposed the leakage area of shrouded and cantilevered stators to be quantified as follows:
shrouded :   A L , SHR = g a p Seal × p i t c h .
cantilevered :   A L , CAN = g a p Tip , Hub × c h o r d Tip , Hub .
And the area of the main blade passage as follows:
A M = h e i g h t × p i t c h × cos ( α ) .
This definition does not consider part and counterbore gaps as they occur in variable stators.
Lange et al. [8] present an experimental investigation comparing shrouded and cantilevered stator designs in a low-speed, multi-stage axial compressor. Their results indicate that shrouded stators are more sensitive to seal clearance changes than cantilevered stators to changes in hub tip gap clearance. Overall the shrouded stator operates at lower pressure ratio and efficiency.
The performance of cantilevered stators is, however, highly sensitive to hub clearance. The study by Dominicis et al. [9] demonstrated that cantilevered stators can outperform shrouded stators in a multistage compressor regarding efficiency.
Matthews [10] investigated the aerodynamic performance and stability of shrouded and cantilevered stator configurations in a high-speed, multi-stage axial compressor. The study reveals that cantilevered stators generally outperform shrouded stators in the front stages, offering up to 1% higher total pressure ratios and a 2% increase in isentropic efficiency.
A detailed investigation of the reference data used in this study is presented by Radermacher et al. [11]. This study investigated the aerodynamic performance of the variable shrouded stator vanes in a 1.5-stage transonic axial compressor. The research focuses on the effects of different stagger angles of the VSV on compressor performance, particularly under various throttle conditions.
In summary, cantilevered stators demonstrate superior performance compared to shrouded stators; however, there is a lack of research regarding their behavior in a variable setup. As far as the authors are aware, they exhibit higher performance even with a variable design (cf. Radermacher et al. [12]).

2. Investigation Methods

2.1. Experimental Setup

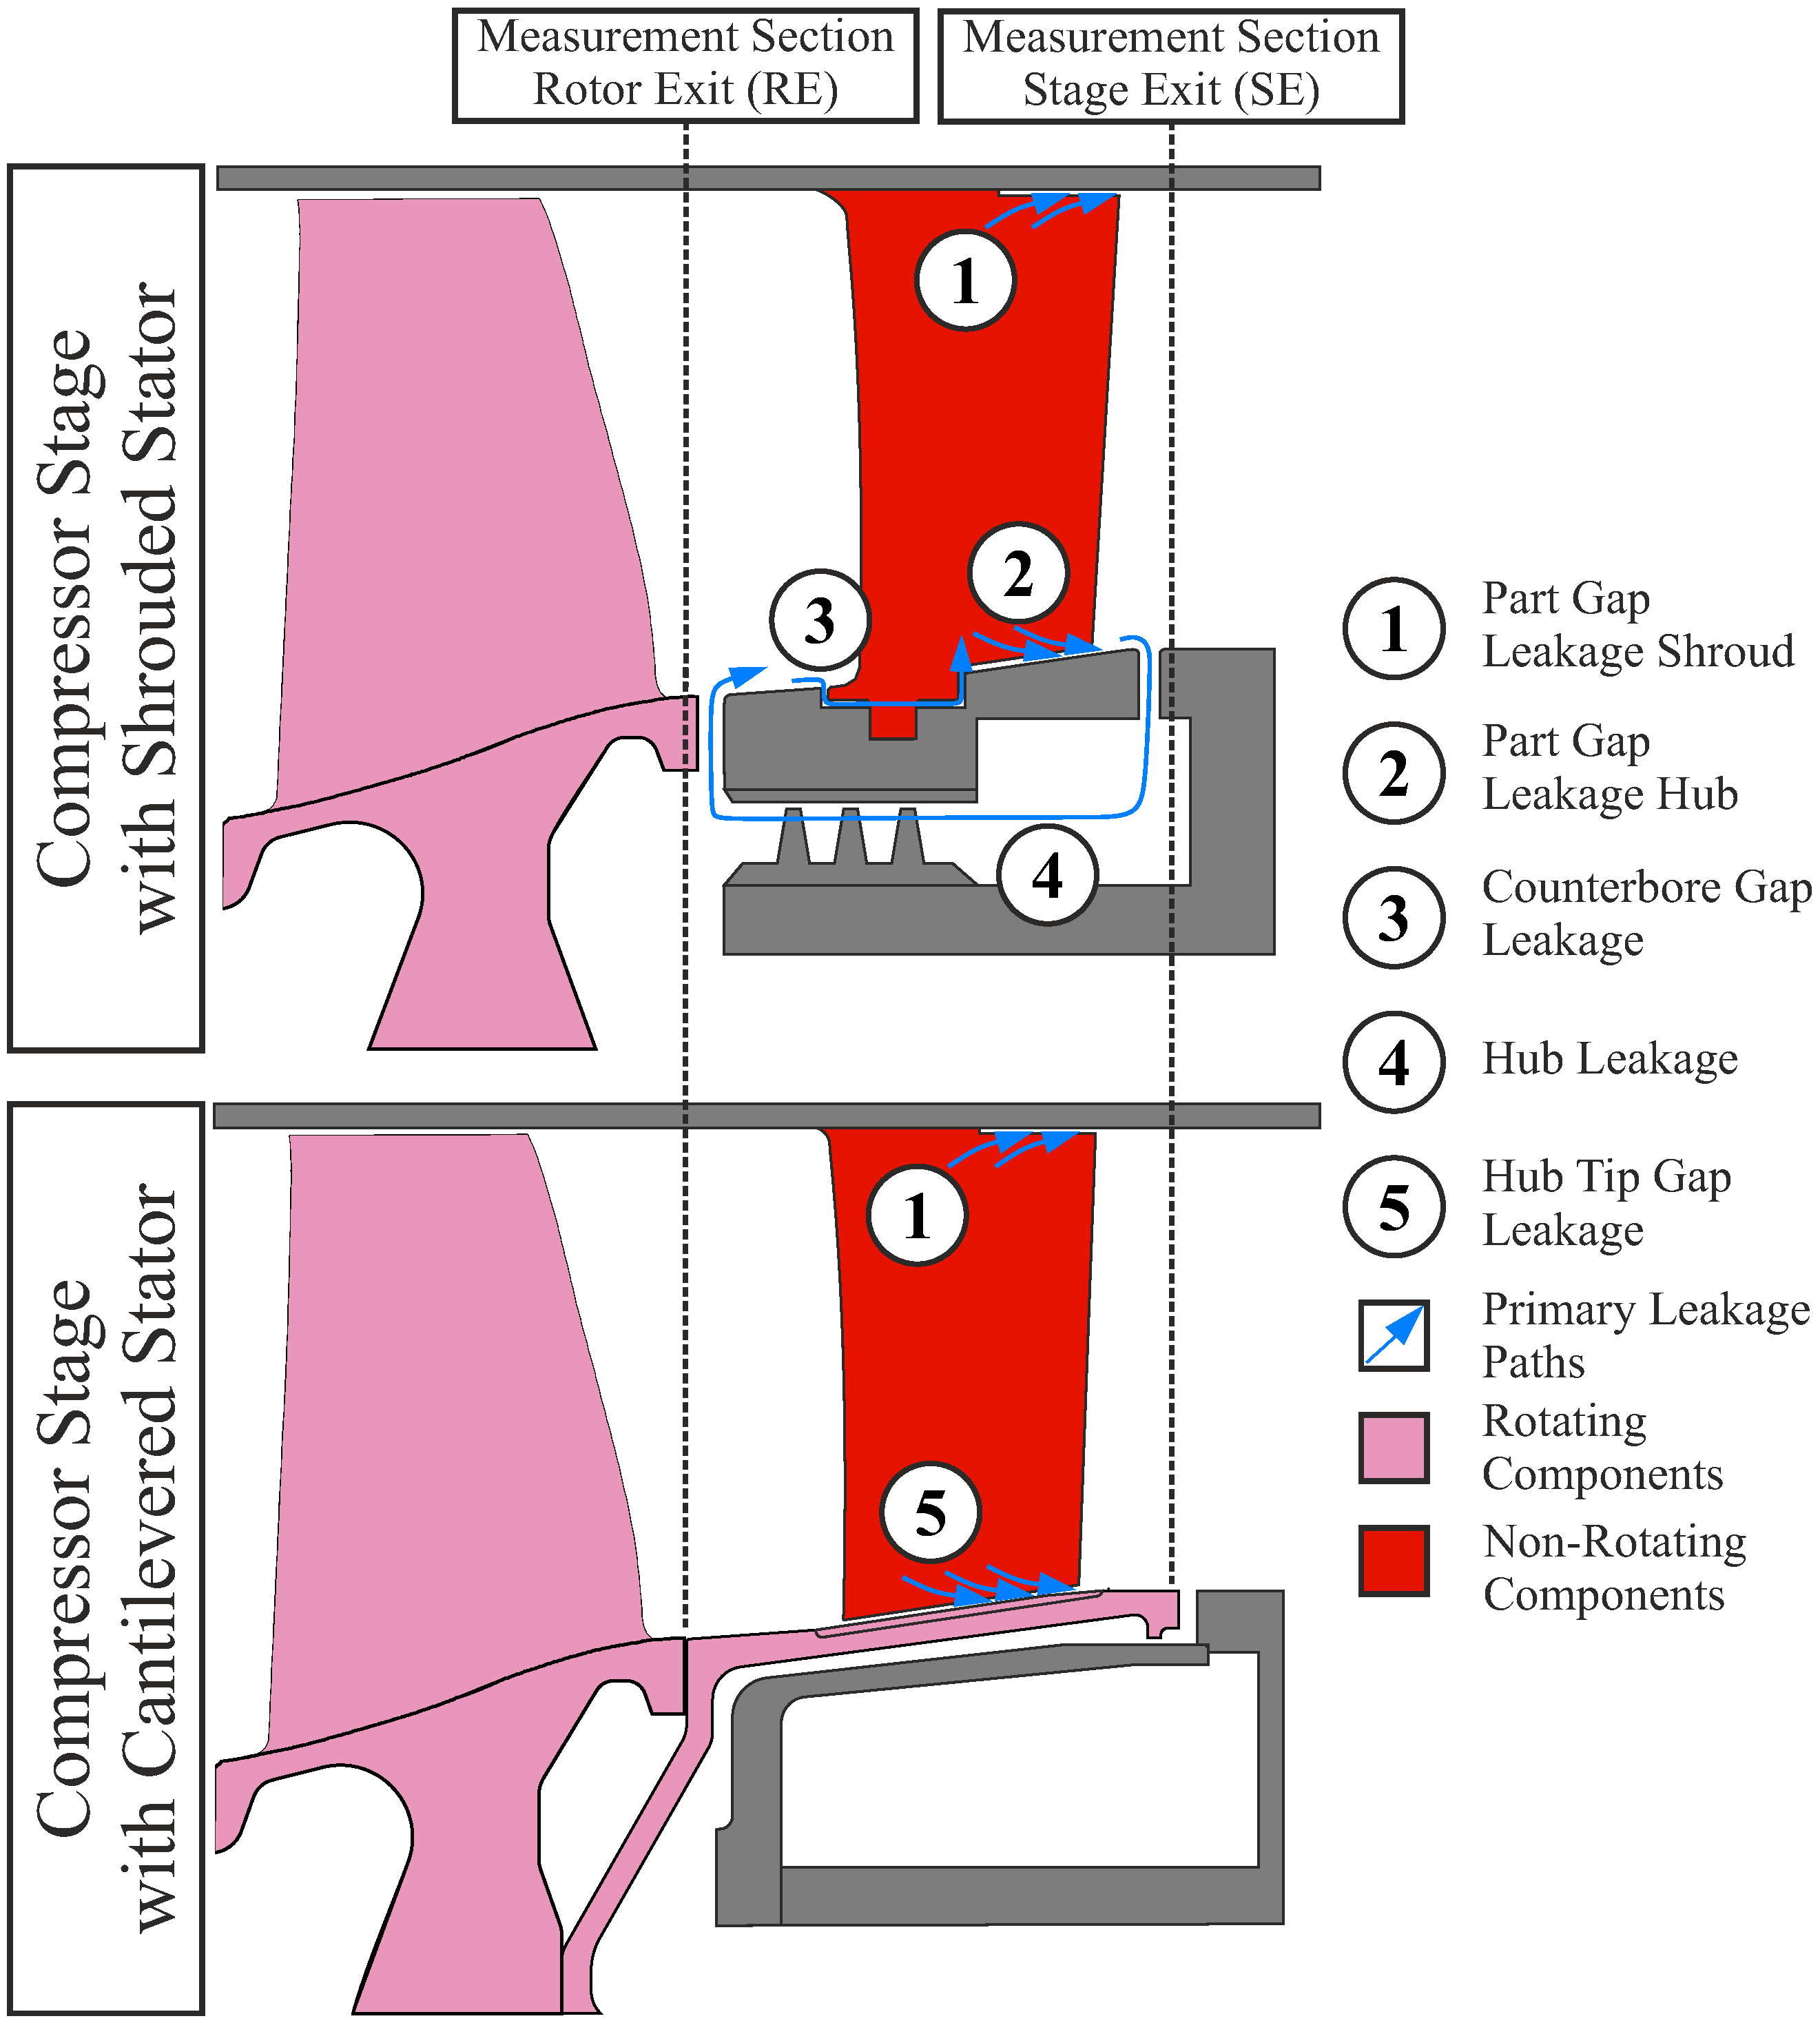
The experimental investigations were conducted at the Transonic Compressor Darmstadt (TCD) test facility. The test facility is illustrated in Figure 2. The facility operates as an open-loop system, where ambient air is drawn into a settling chamber before being directed into the compressor core. After compression, the air is expelled back into the environment through an outlet diffuser. The compressor is driven by a direct current motor that can produce up to 800 kW of power. A planetary gearbox is employed to achieve rotational speeds up to 21,000 rpm, resulting in relative Mach numbers close to 1.4 at the rotor tip, which leads to supersonic conditions. The compressor itself is configured as a 1.5-stage setup, composed of a variable inlet guide vane (VIGV), a BLISK rotor, and a variable stator vane, which is representative for a high-pressure compressor front stage found in modern jet engines.
Since two different variable stator designs are investigated in this study, a detailed cross-sectional overview of the two setups is shown in Figure 3. In this detailed view the varibale inlet guide vane is excluded because it was kept unchanged during the experiments. The variable inlet guide vane is shown in Figure 4 (middle). As shown in Figure 3, the same rotor has been used. The airfoil design and the shroud region of the stator vane is identical in all configurations. Major design changes took place in the hub region of the variable stator comparing the two setups. For the cantilevered setup, the rotor was extended with an additional drum ring to provide a rotating hub for the variable cantilevered stator. In the shrouded stator, a seal fin with three teeth is used. Additionally, a counterbore gap as well as part gaps at hub and shroud are present. The counterbore gap at the shroud is completely sealed in both setups with a special bushing. The resulting primary leakage paths of the shrouded and cantilevered stage are depicted in Figure 3. All gaps are kept as similar as possible between the setups. According to the Equations (1)–(3) by Yoon et al. [7], the fractional leakage area A L A m for the shrouded stator is 1.6% and for the cantilevered stator 2.3%. Since these equations do not consider part and counterbore gaps, the equations for the leakage area are extended as follows for the present work:
A L , SHR = g a p Seal × p i t c h + g a p Part , Shroud × c h o r d Part , Shroud + g a p Part , Hub × c h o r d Part , Hub + 1 2 π r O u t , CBore 2 π r I n , CBore 2 ,
A L , CAN = g a p Part , Shroud × c h o r d Part , Shroud + g a p Tip , Hub × c h o r d Tip , Hub .
Here, the part gaps at hub and shroud are considered. As an assumption, half of the counterbore gap is taken into account as the leakage area, because literature indicates outflow at around 50% of the circumference [11,13,14,15]. This results in a fractional leakage area of 7.1% for the shrouded stator and 5.2% for the cantilevered stator. In the Appendix A, the equations are given, which generally apply to variable shrouded and variable cantilevered stators. The investigation focuses on two primary measurement sections: the rotor exit (RE) and the stage exit (SE). Additional relevant sections include the stage inlet (SI) for determining inlet conditions and the torquemeter on the drive train shaft for measuring shaft power. For more detailed information regarding the measurement sections of the TCD and the determination of inlet conditions, refer to Klausmann et al. [16].

2.2. Instrumentation and Methodology

The compressor stage is extensively instrumented to evaluate its overall performance and detailed aerodynamic behavior. The primary measurement systems are illustrated in Figure 4(left). Total pressure and temperature rakes at the stage exit (SE) monitor compressor performance. To ensure accurate measurements, the stationary vane rows (VIGV and VSV) are synchronously clocked relative to the instrumentation (Figure 4(middle)). The data recorded from these measurements are used to calculate Π t , τ t , and η i s , as defined in Equations (6)–(8):
Π t = p t , S E , a a p t , S I , a a ,
τ t = T t , S E , a a T t , S I , a a ,
η i s = m ˙ · c p · T t , S I , a a P s h a f t p t , S E , a a p t , S I , a a κ 1 κ 1 .
The methodology is depicted in Figure 4(right). Radial profiles (1D) are obtained by averaging the recorded values circumferentially at each channel height. Area-averaging the full two-dimensional flow field then yields representative mean values, which correspond to single operating points (0D) on the compressor map.
For a detailed analysis of the compressor aerodynamics, traversable five-hole probes (5HP) and virtual three-hole probes (v3HP) are used [11]. The obtained data from the probe measurements at rotor exit and stage exit are used to calculate a range of stator loading and loss variables. The pressures and temperatures are corrected for ambient inlet conditions following the procedure described in Foret [17]. For the evaluation of both variables, identical relative radii upstream and downstream of the stator are used. Hence, possible radial shifts of the streamlines are not considered. The total pressure loss coefficient is calculated, as proposed by Lieblein et al. [18]:
Y p = p t , R E p t , S E p t , R E p s , R E .
Saha and Roy [19] demonstrated that the static pressure recovery coefficient can be used as an indicator of flow diffusion or vane loading, as defined:
C p = p s , S E p s , R E p t , R E p s , R E .
Losses in a turbo engine are directly proportional to the increase in entropy [20]. Therefore, entropy rise is a key indicator for identifying where losses occur within a blade row. According to Baehr and Kabelac [21], the increase in specific entropy for an ideal gas is defined as:
Δ s = c p · ln T t , S E T t , R E R · ln p t , S E p t , R E .
Since the total temperature across the stator remains nearly constant, an adiabatic process is assumed. Therefore, the entropy increase in the stator is mainly attributed to total pressure losses:
Δ s = R · ln p t , S E p t , R E .
Yoon et al. [7] defined an entropy-rise based loss coefficient:
ξ entropy = 1 e ( Δ s R ) .
To assess the loading of a blade row, the de Haller criterion and the diffusion factor can be used [22]. c is the velocity in the stationary frame of reference. The de Haller deceleration ratio is defined as:
D H = c S E c R E .
The diffusion factor extends the de Haller criterion, incorporating geometric properties to evaluate aerodynamic loading [23]. A simplified version is given by Lieblein et al. [18] as:
D F = 1 c S E c R E + Δ c u 2 · c R E · 1 σ .
Since density cannot be directly measured in the test rig, the deceleration ratio is evaluated instead of the axial velocity density ratio:
A V R = c ax , S E c ax , R E .
According to Hertel et al. [24], this parameter highlights three-dimensional endwall effects and provides insights into the mass flow distribution within a blade row.
In addition to the 5HP measurements, time-resolving virtual three-hole probe measurements have been conducted in this study. The probe being used was introduced by Klausmann et al. [25]. Since, the probe is operated in a virtual three-hole mode, an extensive post processing is necessary. Figure 5 shows a simplified version of the underlying methodology. The signal is ensemble-averaged using a once-per-revolution trigger, resulting in a rotor phase-dependent mean signal. This allows for consistent evaluation at identical rotor-relative positions, enabling the signal’s use as a three-hole probe. To analyze the phase-corrected 2D exit flow field in the stationary frame, measurements at various stator positions are required. Each measurement at a specific span and radius provides flow variables across all rotor pitches (samples). By combining these measurements, a 3D data matrix is generated. To analyze the phase-averaged flow field at a specific time, it is crucial to account for the interdependence between rotor and stator pitches by considering the matrix diagonals. This process is repeated across multiple samples to derive the phase corrected flow field. Next, a circumferential average is performed at specific relative channel heights for each phase-corrected 2D flow field to derive a reduced one-dimensional data series. This enables a simplified representation of the rotor-phase dependency of the variables under consideration. For a detailed description of the post processing and the probes design, refer to Klausmann et al. [25].

2.3. Numerical Setup

Steady RANS simulations were performed alongside experiments to analyze flow topology in regions where access for measurement instrumentation is limited within the test rig. The computational domain replicates the rig geometry, with boundary conditions set to the operating point. Special focus was given to meshing stator hub features, including fillet radii, part, counterbore and hub tip gaps, and the cavity and fin seal. A fully unstructured tetrahedral mesh with 54 million elements was used, ensuring an average y + < 1 for accurate boundary layer resolution.The grid was generated using the commercial software ANSYS ICEM v2022.2. A k- ω SST turbulence model [26], enhanced with the Kato limiter [27], was applied. The simulations were conducted using the commercial solver ANSYS CFX v2022.2. For a detailed description of the computational domain refer to Radermacher et al. [11].

3. Results

All measurement data presented in the following sections were obtained at the design speed of the two compressor stages, with nominal VIGV and VSV angles kept consistent between the stages. Section 3.1 presents the global performance data comparison between variable shrouded (SHR) and variable cantilevered stator (CAN) stage. Subsequently, Section 3.2 evaluates the aerodynamic loading of the two setups, followed by loss determination in Section 3.3. In Section 3.4 a rotor-phase depended loss evaluation is presented.

3.1. Global Compressor Performance

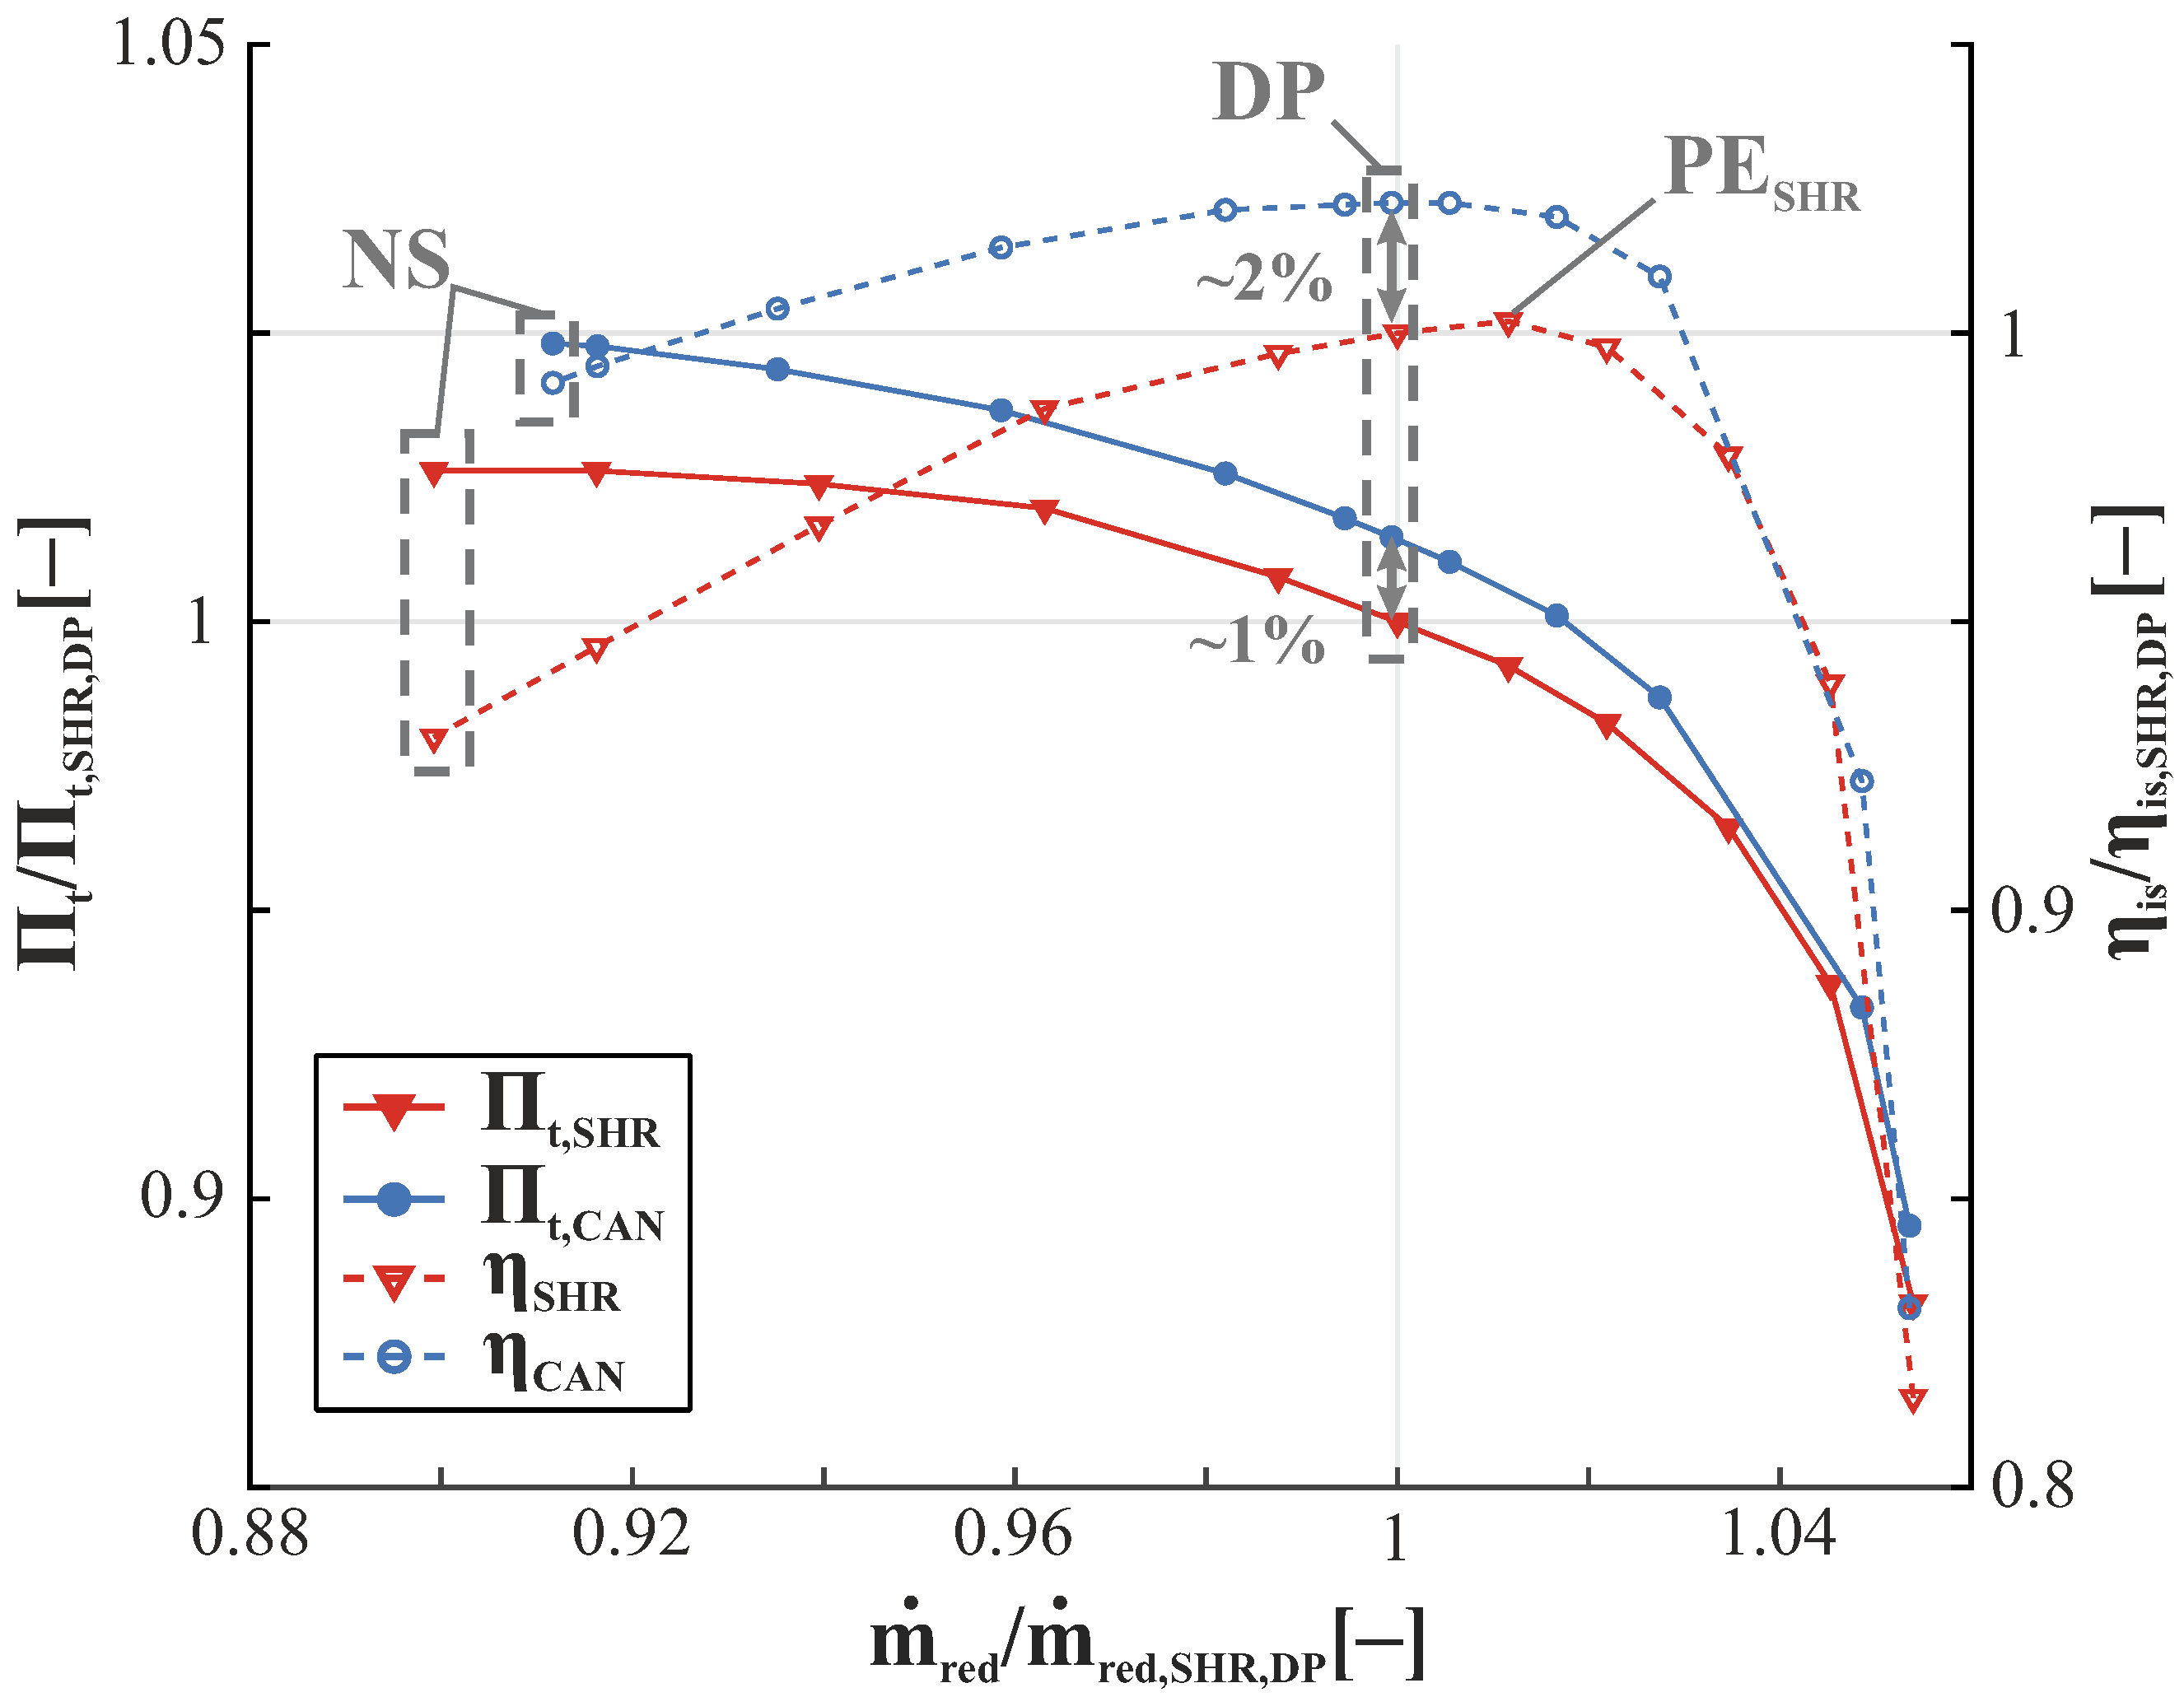
The compressor characteristics, i.e., pressure rise and efficiency, in Figure 6 show a significant improvement achieved by the CAN stage.
It is visible that a higher pressure ratio and efficiency are reached along the whole speed line. At the design point (DP, peak efficiency point of cantilevered stage) the efficiency of the CAN stage is increased by ∼2% and the pressure ratio by ∼1%. The SHR configuration reaches its peak efficiency point at a slightly higher reduced mass flow. Since the fractional leakage area, evaluated with the extended Equations (4) and (5), is out of range of the results from Freeman [6], it is evident that variable stators do not match his results. However, the fractional leakage area for the variable cantilevered stator is smaller than for the variable shrouded stator.
Another notable difference between the two configurations is evident in their respective stability margins. The stability limit of the CAN stage is reached at a higher reduced mass flow than for SHR. This is given by the last stable operating point, representing near stall operating condition (NS). Possible reasons for this are discussed in Section 3.2.
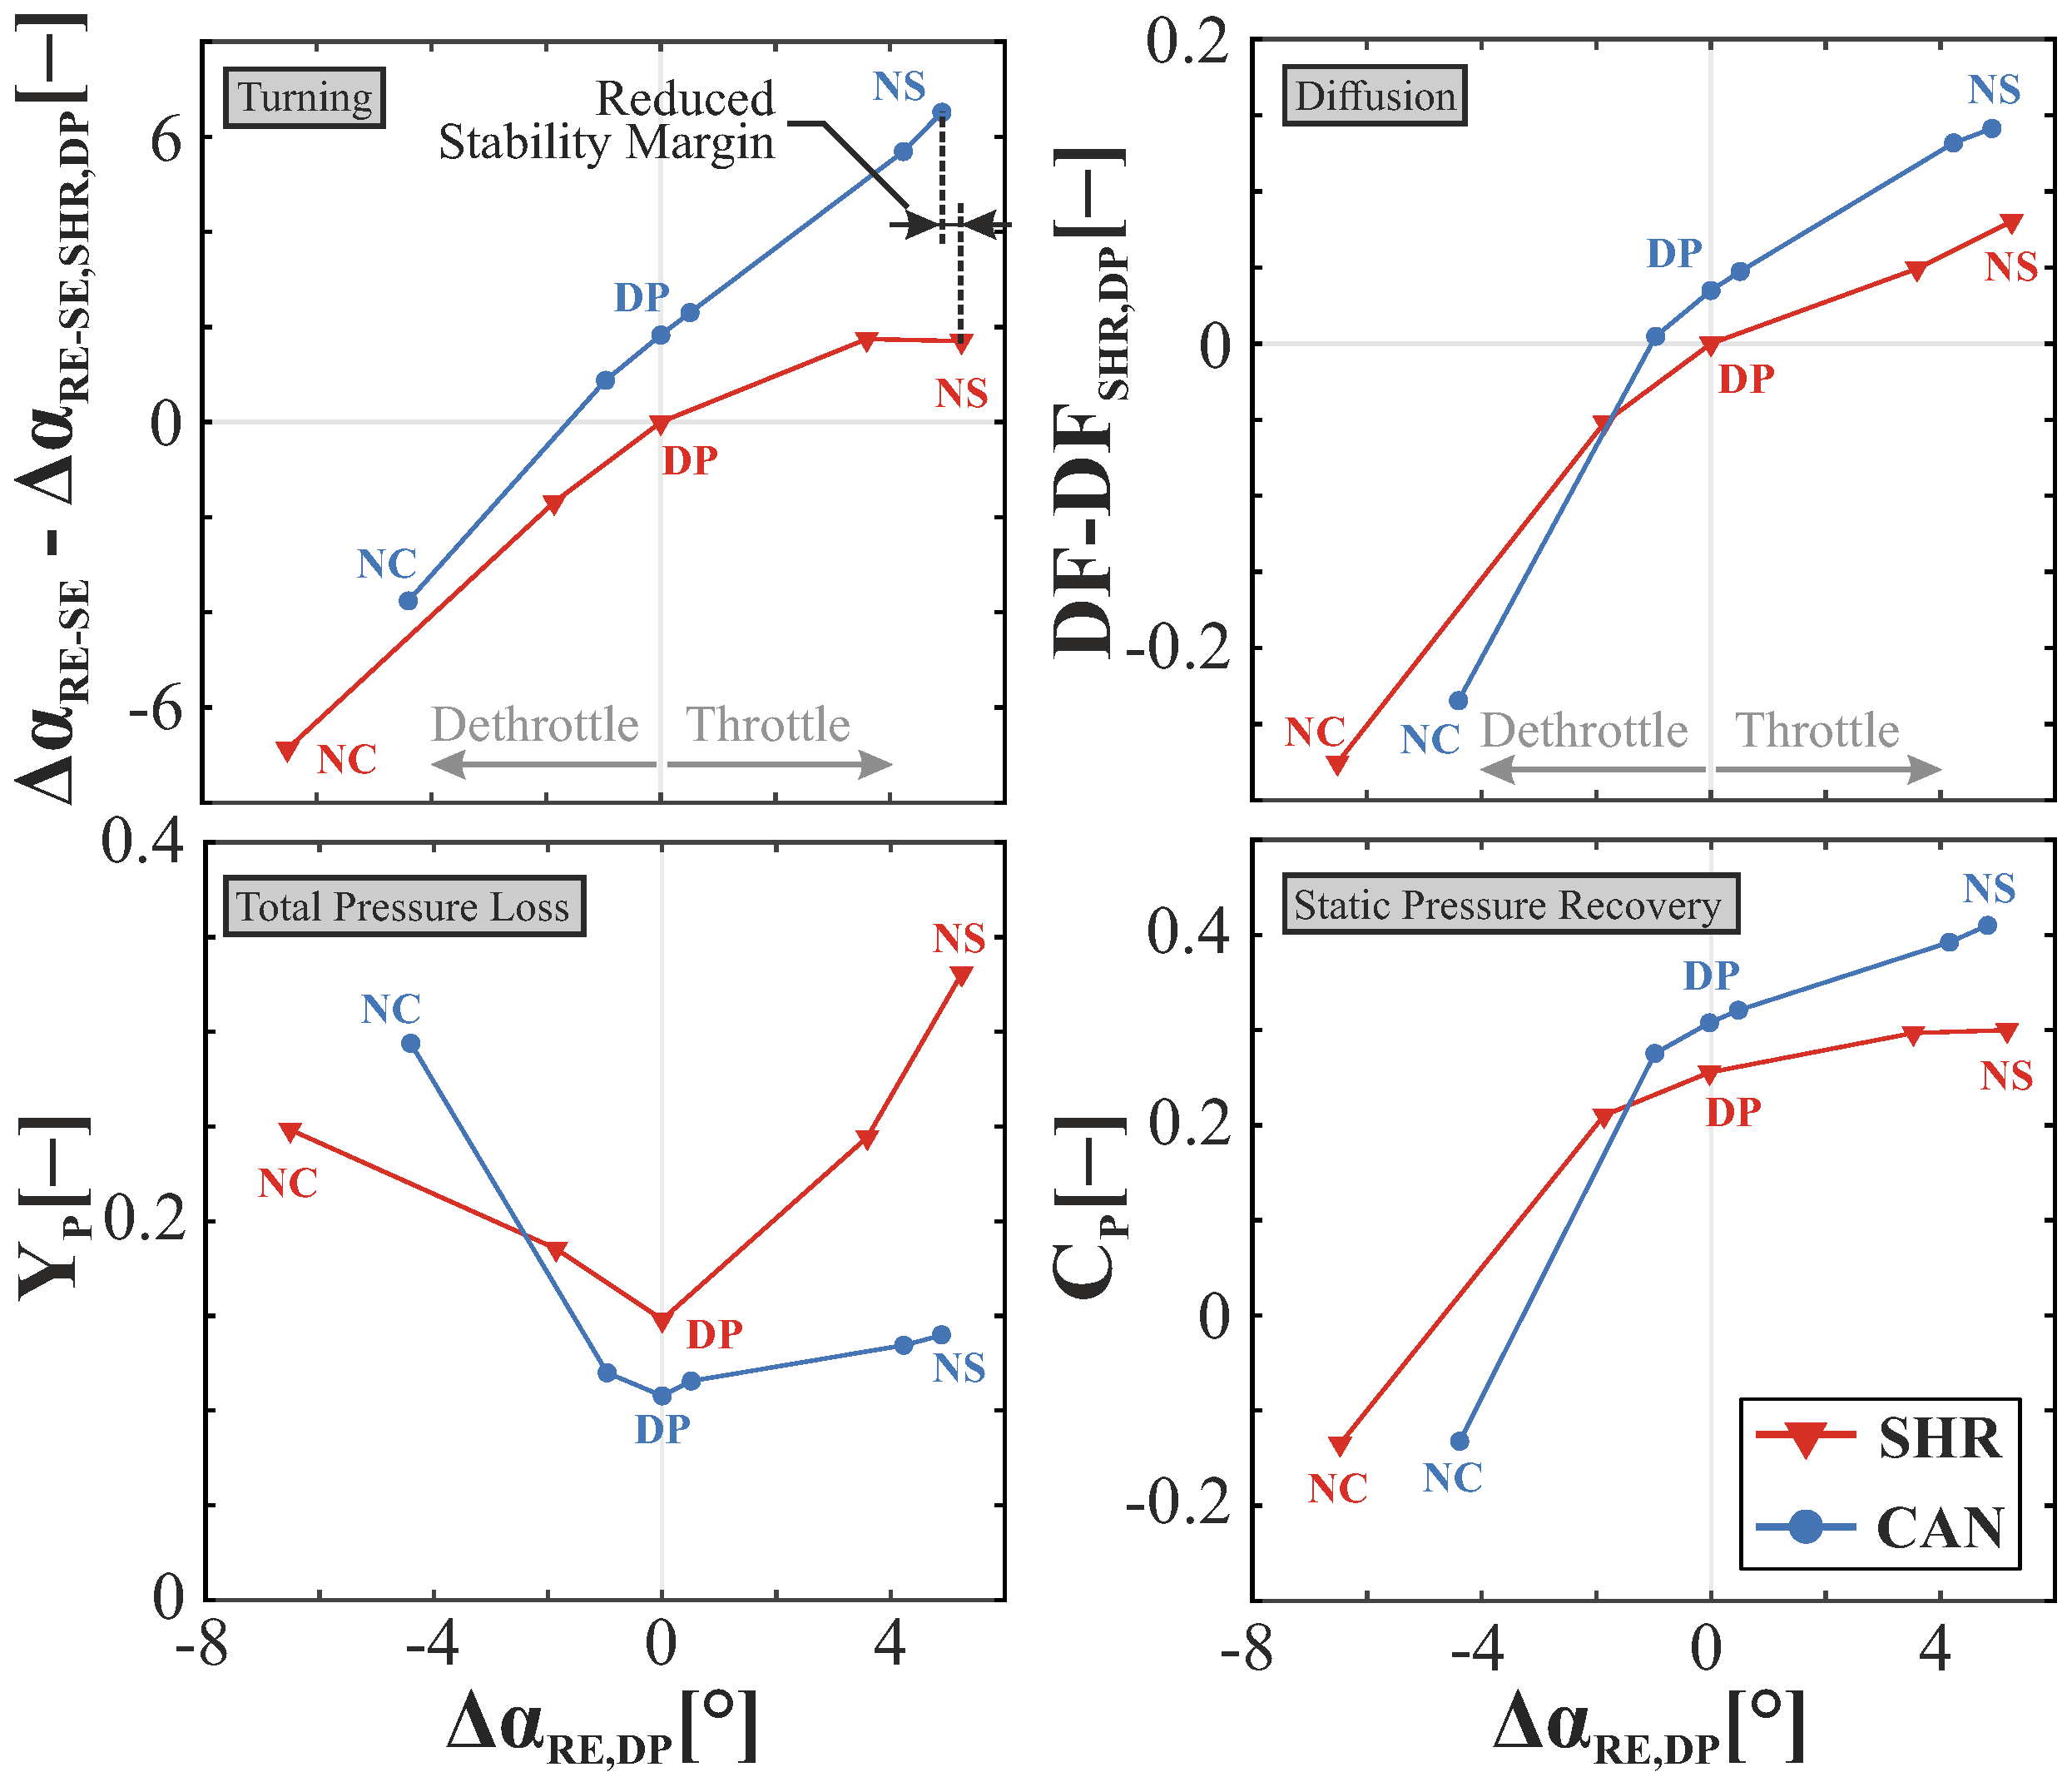
The findings from the compressor map are further supported by Figure 7. It shows the global loading and loss parameters total pressure loss, static pressure recovery, turning and diffusion, based on the equations in Section 2.2, along the characteristic. Instead of the reduced mass flow, the difference to the angle of attack at the operating point DP is used as follows:
Δ α R E , DP = α R E α R E , DP
This approach allows us to assess the behavior of the stators if the angle of attack is out of scope. The flow turning of the CAN configuration is 1.8° higher than that of the SHR configuration at the design point. The turning is constantly rising towards the NS operating point for the CAN stage, whereas the SHR stage is showing a constant slope for the last two operating points. This indicates that the aerodynamic limit of the variable cantilevered stator is not reached before the rotor stalls.
The reduced stability margin in the CAN configuration is also visible with a 0.3° lower angle of attack at its NS operating point compared to SHR.
The diffusion factor, which is related to the DP of the SHR configuration, shows a higher aerodynamic loading for the CAN stage over the whole characteristic, except for the near choke (NC) operating point. Since the solidity remains constant between the SHR and CAN stages, the higher diffusion factor is correlated to increased turning and deceleration (Section 3.2).
Despite the higher aerodynamic loading of the CAN stage, the total pressure losses are significantly lower than in the SHR stage. Whilst the total pressure loss in the CAN configuration increases only slightly from the DP operating point to the NS operating point, the SHR stage shows a notable increase. The static pressure recovery for the SHR stage shows a constant slope at increased throttling. On the one hand, this indicates that the aerodynamic limit of the SHR stage has been reached. The CAN stage, on the other hand, continues to build up static pressure.

3.2. Aerodynamic Loading

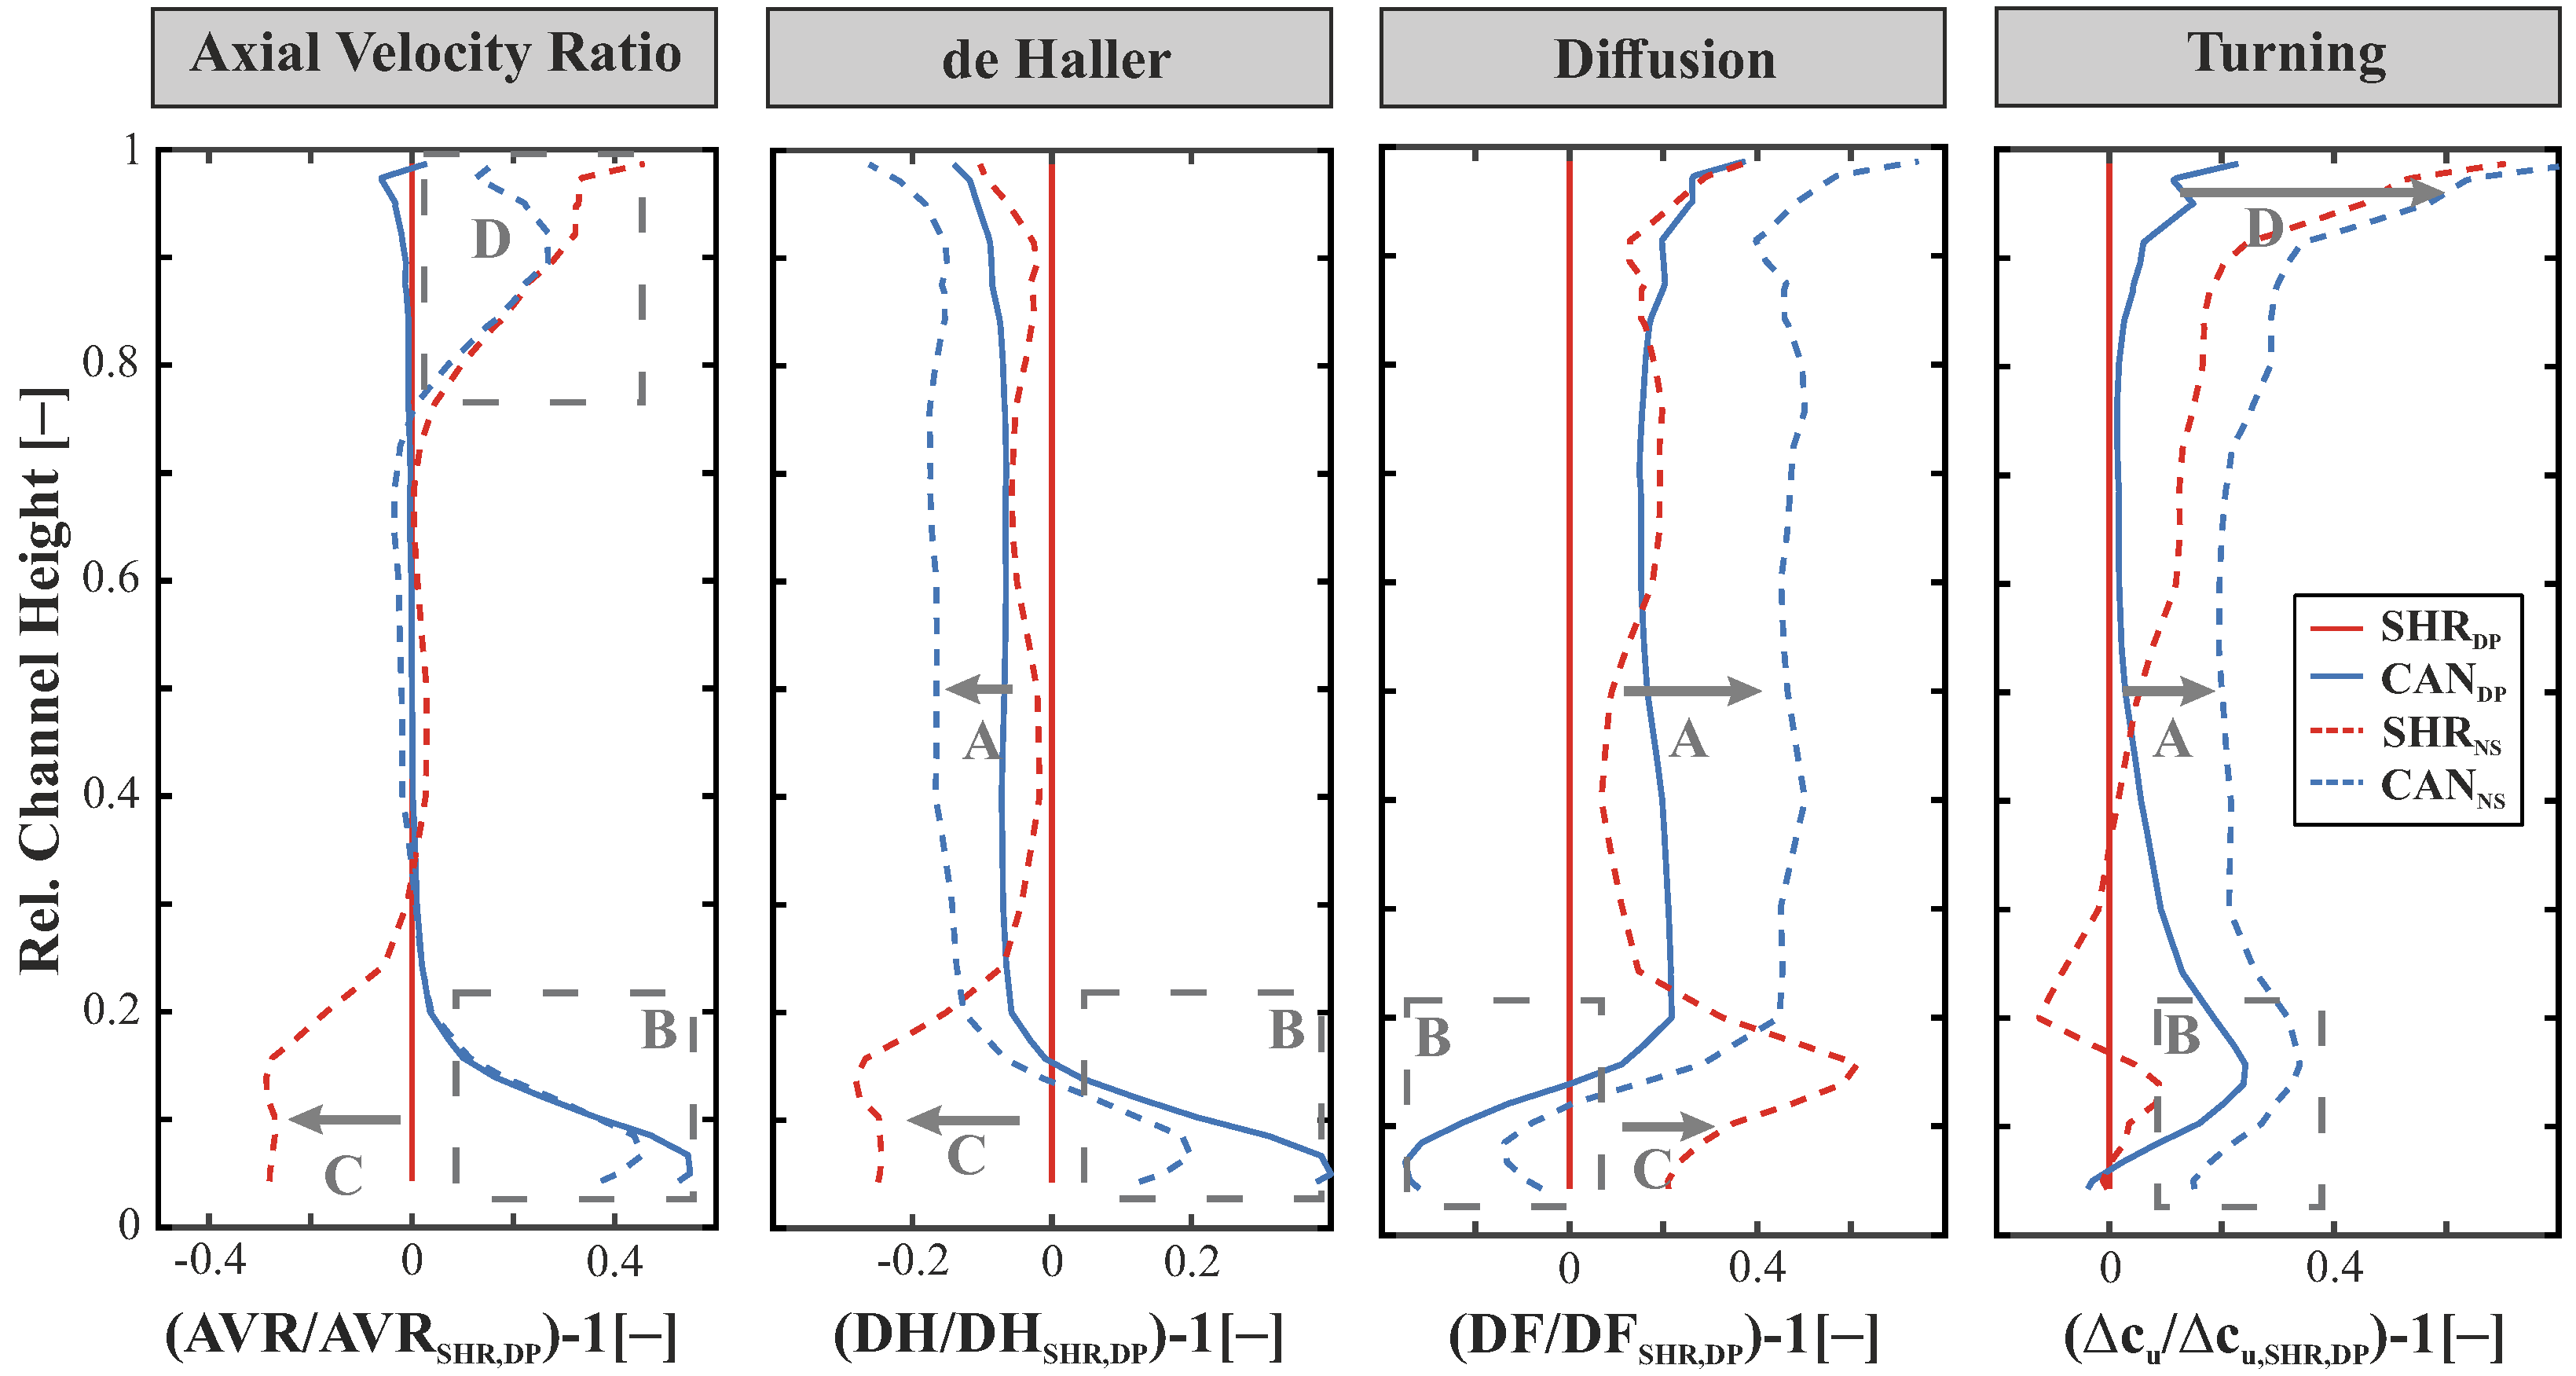
The aerodynamic loading of a compressor blade row can be assessed using the variables outlined in Section 2.2. Figure 8 presents the radial profiles for the operating points DP and NS for a selection of these variables. All variables are related to the DP operating point of the SHR stage.
The de Haller criterion D H serves as a measure for the aerodynamic loading of the blade row. Figure 8 shows a reduced de Haller number for the upper 80% of the channel height of the CAN stage (marker A). Thus, a stronger deceleration is present as well as a higher aerodynamic loading. For the NS operating point a similar behavior is observed in the upper 80% of the channel. In general, the deceleration is stronger for NS operating condition. Towards the hub the two stators work differently. The CAN configuration forms a hub tip leakage (see Section 3.3 marker C) instead of a marked hub blockage which explains the higher de Haller number compared to the SHR stage design point (marker B). This effect is more pronounced for NS operating conditions where the hub tip leakage of the CAN configuration changes but the SHR stage significantly drops in de Haller (marker C).
The axial velocity ratio A V R characterizes the mass flow distribution inside a blade row. In the lower 20% of the channel height the A V R confirms the previously noted absence of hub blockage in the CAN configuration (marker B). The SHR stage forms a larger hub blockage towards NS condition, which leads to a reduced A V R (marker C). On the one hand, the high AVR at the outer shroud for the NS operating point is an effect of a very high rotor exit flow angle (marker D), which will be discussed in detail in Section 3.3. On the other hand, especially in the SHR stage, an upstream massflow redistribution towards the shroud could be present, because of the hub blockage in the stator, visible through the difference between SHR and CAN stage values at NS. This also leads to a deloading of the rotor tip, which explains the lower stall massflow in general and the higher AVR very close to the outer shroud in the SHR stage.
The diffusion factor D F shows similar results regarding the aerodynamic loading like the de Haller number. In the upper 80% of the channel height the CAN stage is higher loaded than the SHR stage expressed by an increased diffusion factor (marker A). Near the hub the absence of hub blockage in the CAN configuration leads to a reduced diffusion factor compared to the design operating point of the SHR stage (marker B).
As previously described, the increased hub blockage at NS condition for the SHR stage leads to a high diffusion factor (marker C).
Lastly, the delta in swirl velocity, Δ c u , and thereby the turning is investigated to assess the aerodynamic loading of the two configurations. At DP operating condition, the turning between the two configurations mainly differs towards the hub. The hub blockage in the SHR stage prevents the flow from following the blade contour which causes less turning. The CAN stage exhibits no hub blockage, which allows for increased turning in the inner endwall region and improved flow uniformity (marker B). At NS condition the turning of the CAN stage is significantly higher over the complete channel height compared to the SHR stage (marker A). This is due to the increased blockage area at the hub in the SHR stage, growing towards mid span. For NS condition both configurations show an increased turning at the shroud, which can be attributed to the altered flow conditions in the rotor tip region (marker D).
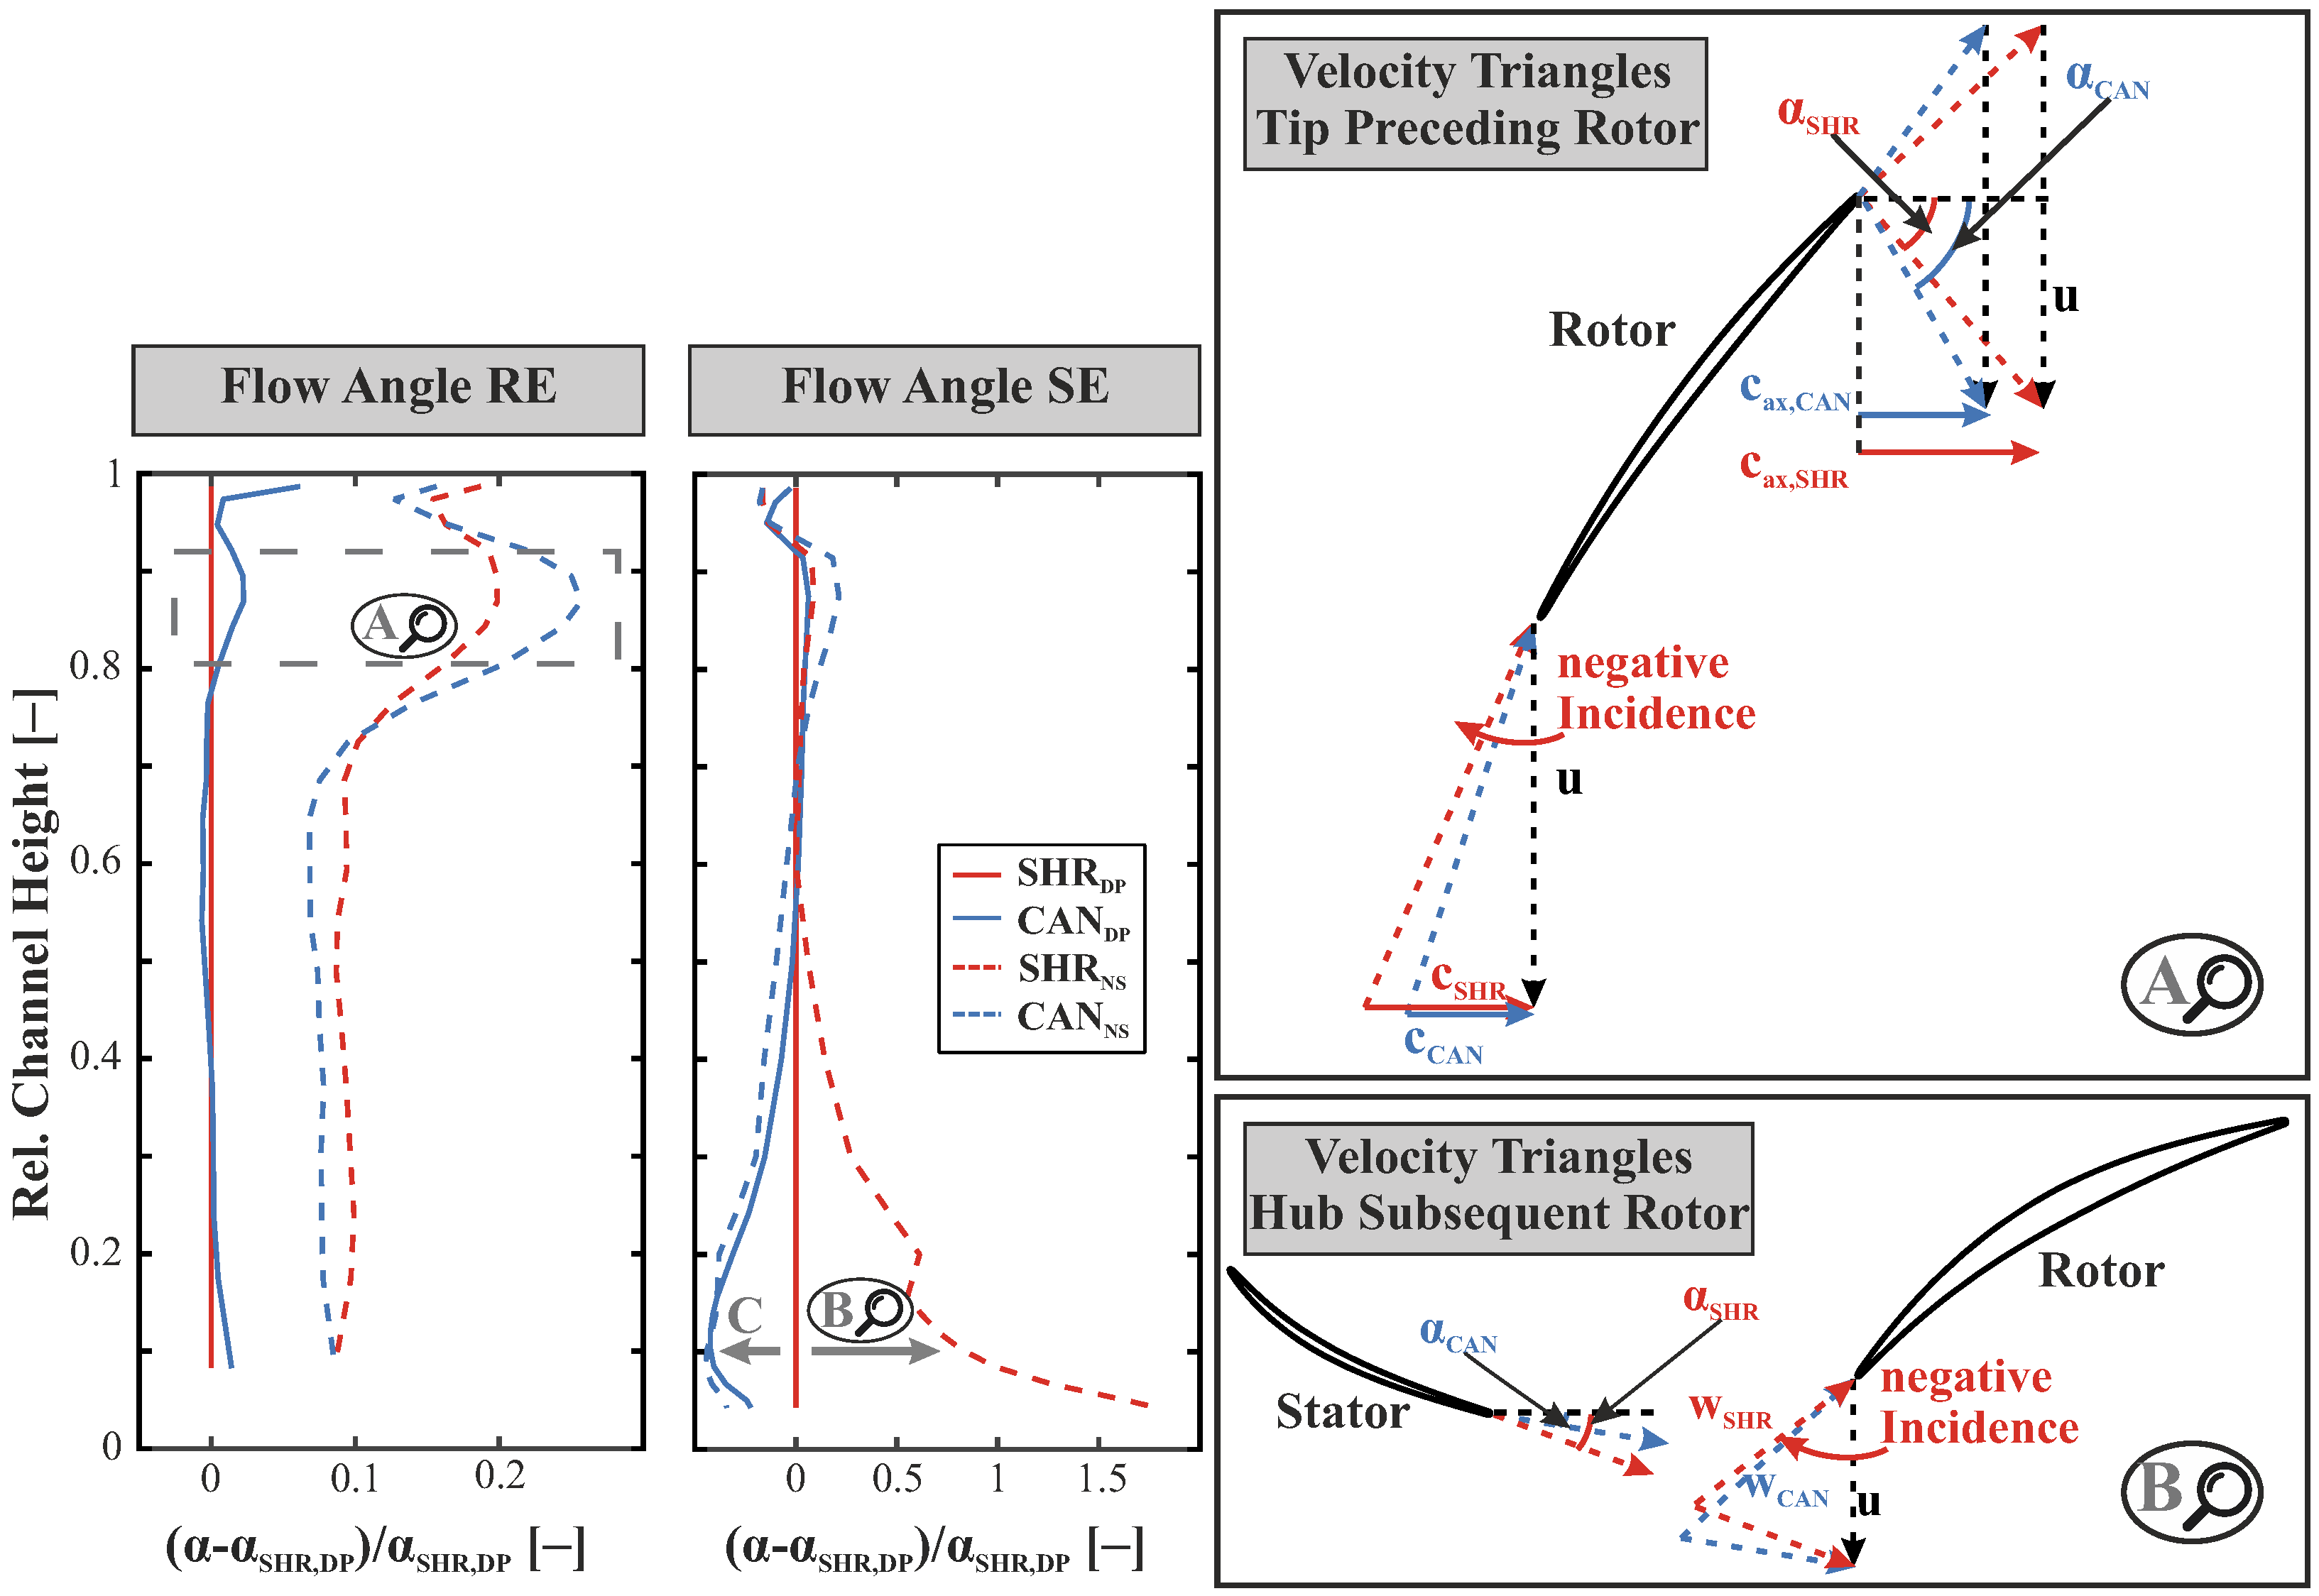
The used stator configuration affects both the preceding rotor and a potential subsequent rotor. Figure 9 shows the circumferential exit flow angle of the preceding rotor and the deployed stator as well as the impact on adjacent rotor aerodynamics. Section 3.1 demonstrates that the CAN stage exhibits a lower stability limit compared to the SHR stage. The AVR in Figure 8 indicates a massflow redistribution within the stator, which also impacts the preceding rotor. This massflow redistribution, caused by blockage at the stator hub in the SHR configuration, leads to a deloading of the rotor tip. This is reflected in lower circumferential angles in the rotor exit flow (Figure 9, marker A). The velocity triangles presented in Figure 9 (marker A) provide insight into the underlying aerodynamics. The increased mass flow rate near the tip of the upstream rotor, resulting from flow redistribution, leads to rotor deloading and a reduction in circumferential flow angles. The elevated axial velocity component ( c a x ) at the rotor inlet decreases the positive incidence at the rotor leading edge, thereby reducing aerodynamic loading. This reduction in loading contributes to an increased stability margin on the compressor map. Additionally, the elevated c a x at the rotor exit further explains the observed decrease in circumferential flow angles. Such redistribution does not occur in the CAN configuration. Consequently, there is no deloading of the rotor tip. Under NS conditions, this manifests as high circumferential angles in the rotor exit flow (Figure 9, marker A). The resulting higher load on the rotor tip in the CAN stage is the reason for the lower stability limit. Therefore, the cantilevered stator has a significant influence on the preceding rotor.
To assess the effects of the stator configuration on a potential subsequent rotor, Figure 9 depicts the stator exit flow angle in the circumferential direction α . The circumferential angle is positive in a clockwise direction, which means a higher α leads to a preswirl for an upcoming rotor. This is also indicated in the velocity triangles in Figure 9 (marker B). Under near-stall conditions, the SHR configuration exhibits very high circumferential angles at the hub. This is caused by significant under-turning in the stator due to pronounced hub blockage under NS conditions. This would lead to negative incidence and thus to a deloading of the subsequent rotor at the hub (Figure 9, marker B). In contrast, the cantilevered stator achieves significantly more turning at the hub (marker C). With the same subsequent rotor, this would result in positive incidence and consequently in higher hub loading.
In summary, it could be shown that the CAN stage is more aerodynamically loaded. Furthermore, the deficits at the hub were significantly reduced compared to the SHR stage. The cantilevered stator works more evenly over the entire channel height. Regarding preceding and subsequent rotor influence, the stator configuration is not negligible. The cantilevered stator leads to higher loaded tip of the preceding rotor and a higher loaded hub of the subsequent rotor.

3.3. Loss Determination

Additional to the aerodynamic loading of the compressor configurations, the occurring loss mechanisms and the static pressure generation are elaborated.
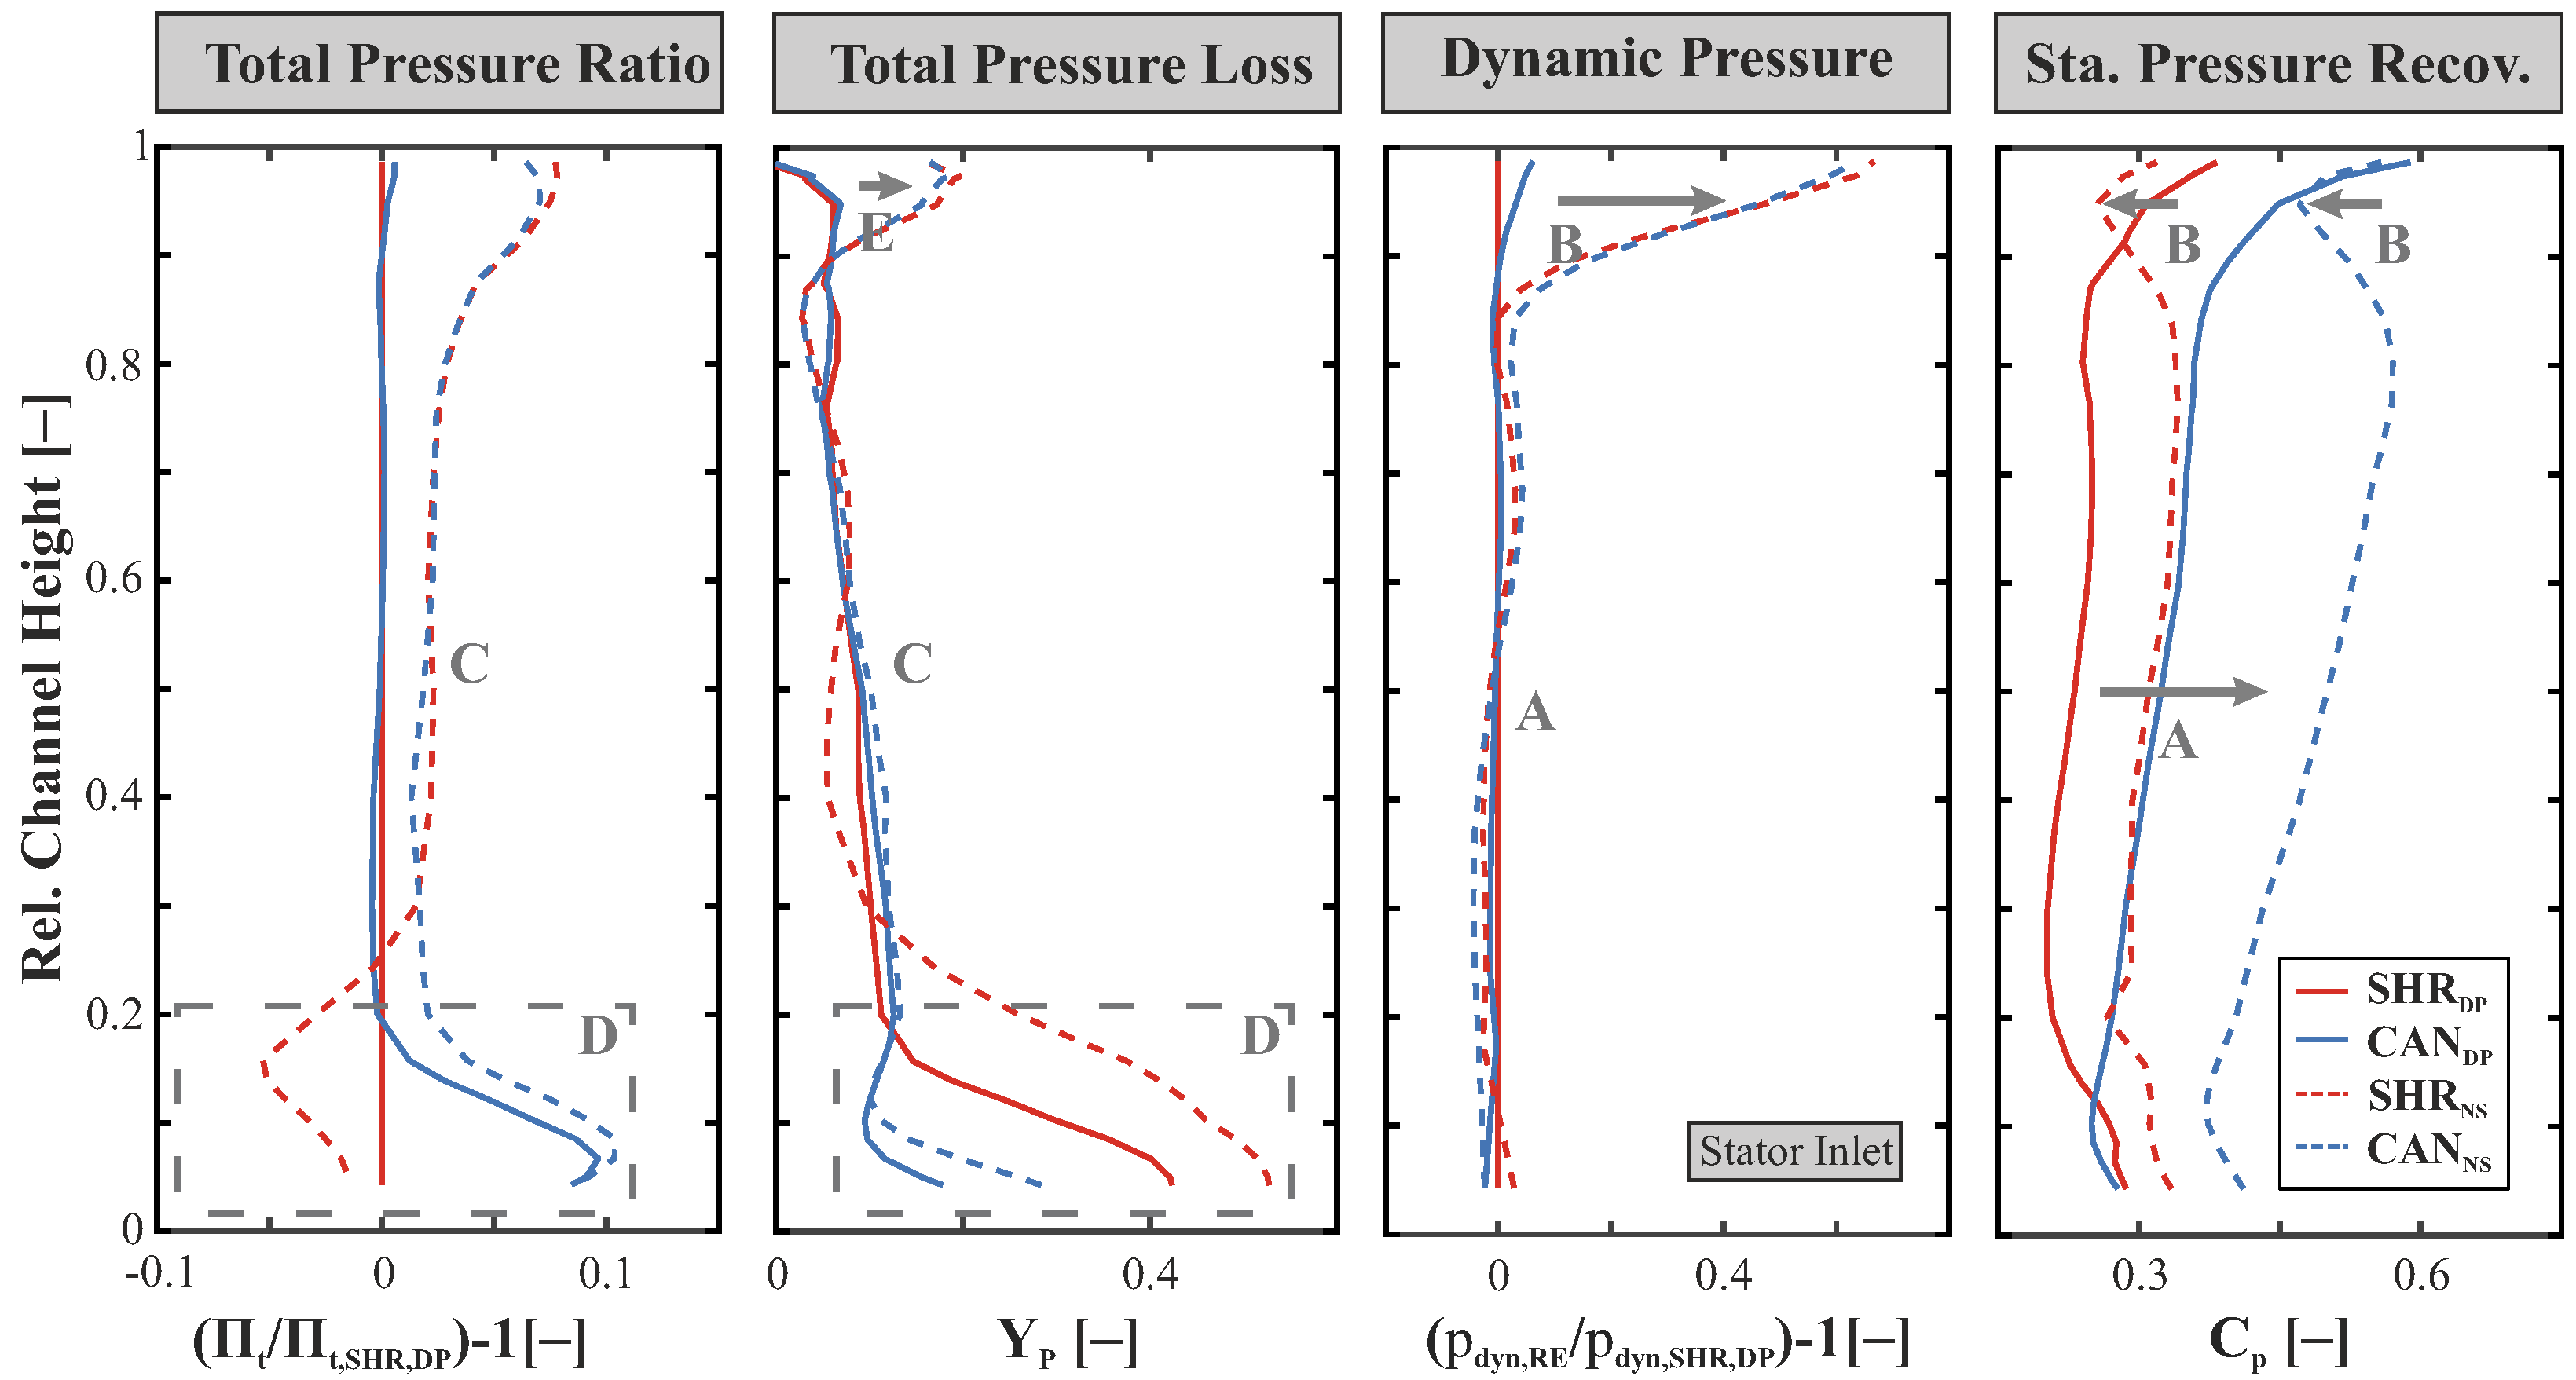
Figure 10. Radial profiles to assess the static pressure build-up and the losses of the stators.
Ijtpp 10 00024 g010
Figure 10 shows the radial distribution for the loss correlated variables defined in Section 2.2. The previous Section 3.2 showed a higher aerodynamic loading of the CAN stage. The static pressure recovery factor C p provides insights into the resulting static pressure generation. Figure 10 clearly shows a higher static pressure rise for the CAN stage (marker A). Since the dynamic pressure p d y n at the stator inlet is similar for the lower 80% of the channel height (marker A), the higher static pressure recovery factor is purely a result of a higher static pressure rise over the cantilevered stator. Towards NS condition, the rotor tip exit flow changes, which leads to a reduced static pressure recovery over the stator (marker B). The high dynamic pressure and the high circumferential exit flow angle in the rotor tip exit flow (Figure 8 and Figure 9) are indicators for a velocity with an increased circumferential component at NS condition. The incidence distribution confirms the assumption of increased circumferential angles at the outer stator shroud region (see Radermacher et al. [11]). The increased positive incidence for NS at the upper 20% channel height is likely to cause a suction side separation on the stator vane. This separation causes in combination with the part gap leakage flow a reduction of the divergent stator passage shape. As a result, it is not possible to decelerate the flow to the same extent as is the case at the lower channel heights. In fact, this leads to the generally higher A V R (Figure 8, marker D) and the lower static pressure recovery factor for NS operating condition.
To assess the occurring losses in detail, the total pressure ratio Π t and the total pressure loss coefficient Y p are depicted in Figure 10. In the middle of the channel, the total pressure ratio is similar between the configurations, whereas a higher total pressure ratio level for NS condition is achieved (marker C). Similarly, the total pressure loss in this region is comparable between CAN and SHR stage (marker C). Since most design changes were made at the hub, the total pressure losses show the strongest differences in this area. Both variables, total pressure ratio and total pressure loss coefficient, clearly show the absence of the hub blockage in the CAN stage (marker D). At the shroud, an increased total pressure loss for both configurations is present for NS condition (marker E), which is also a result of the positive incidence at the outer shroud.
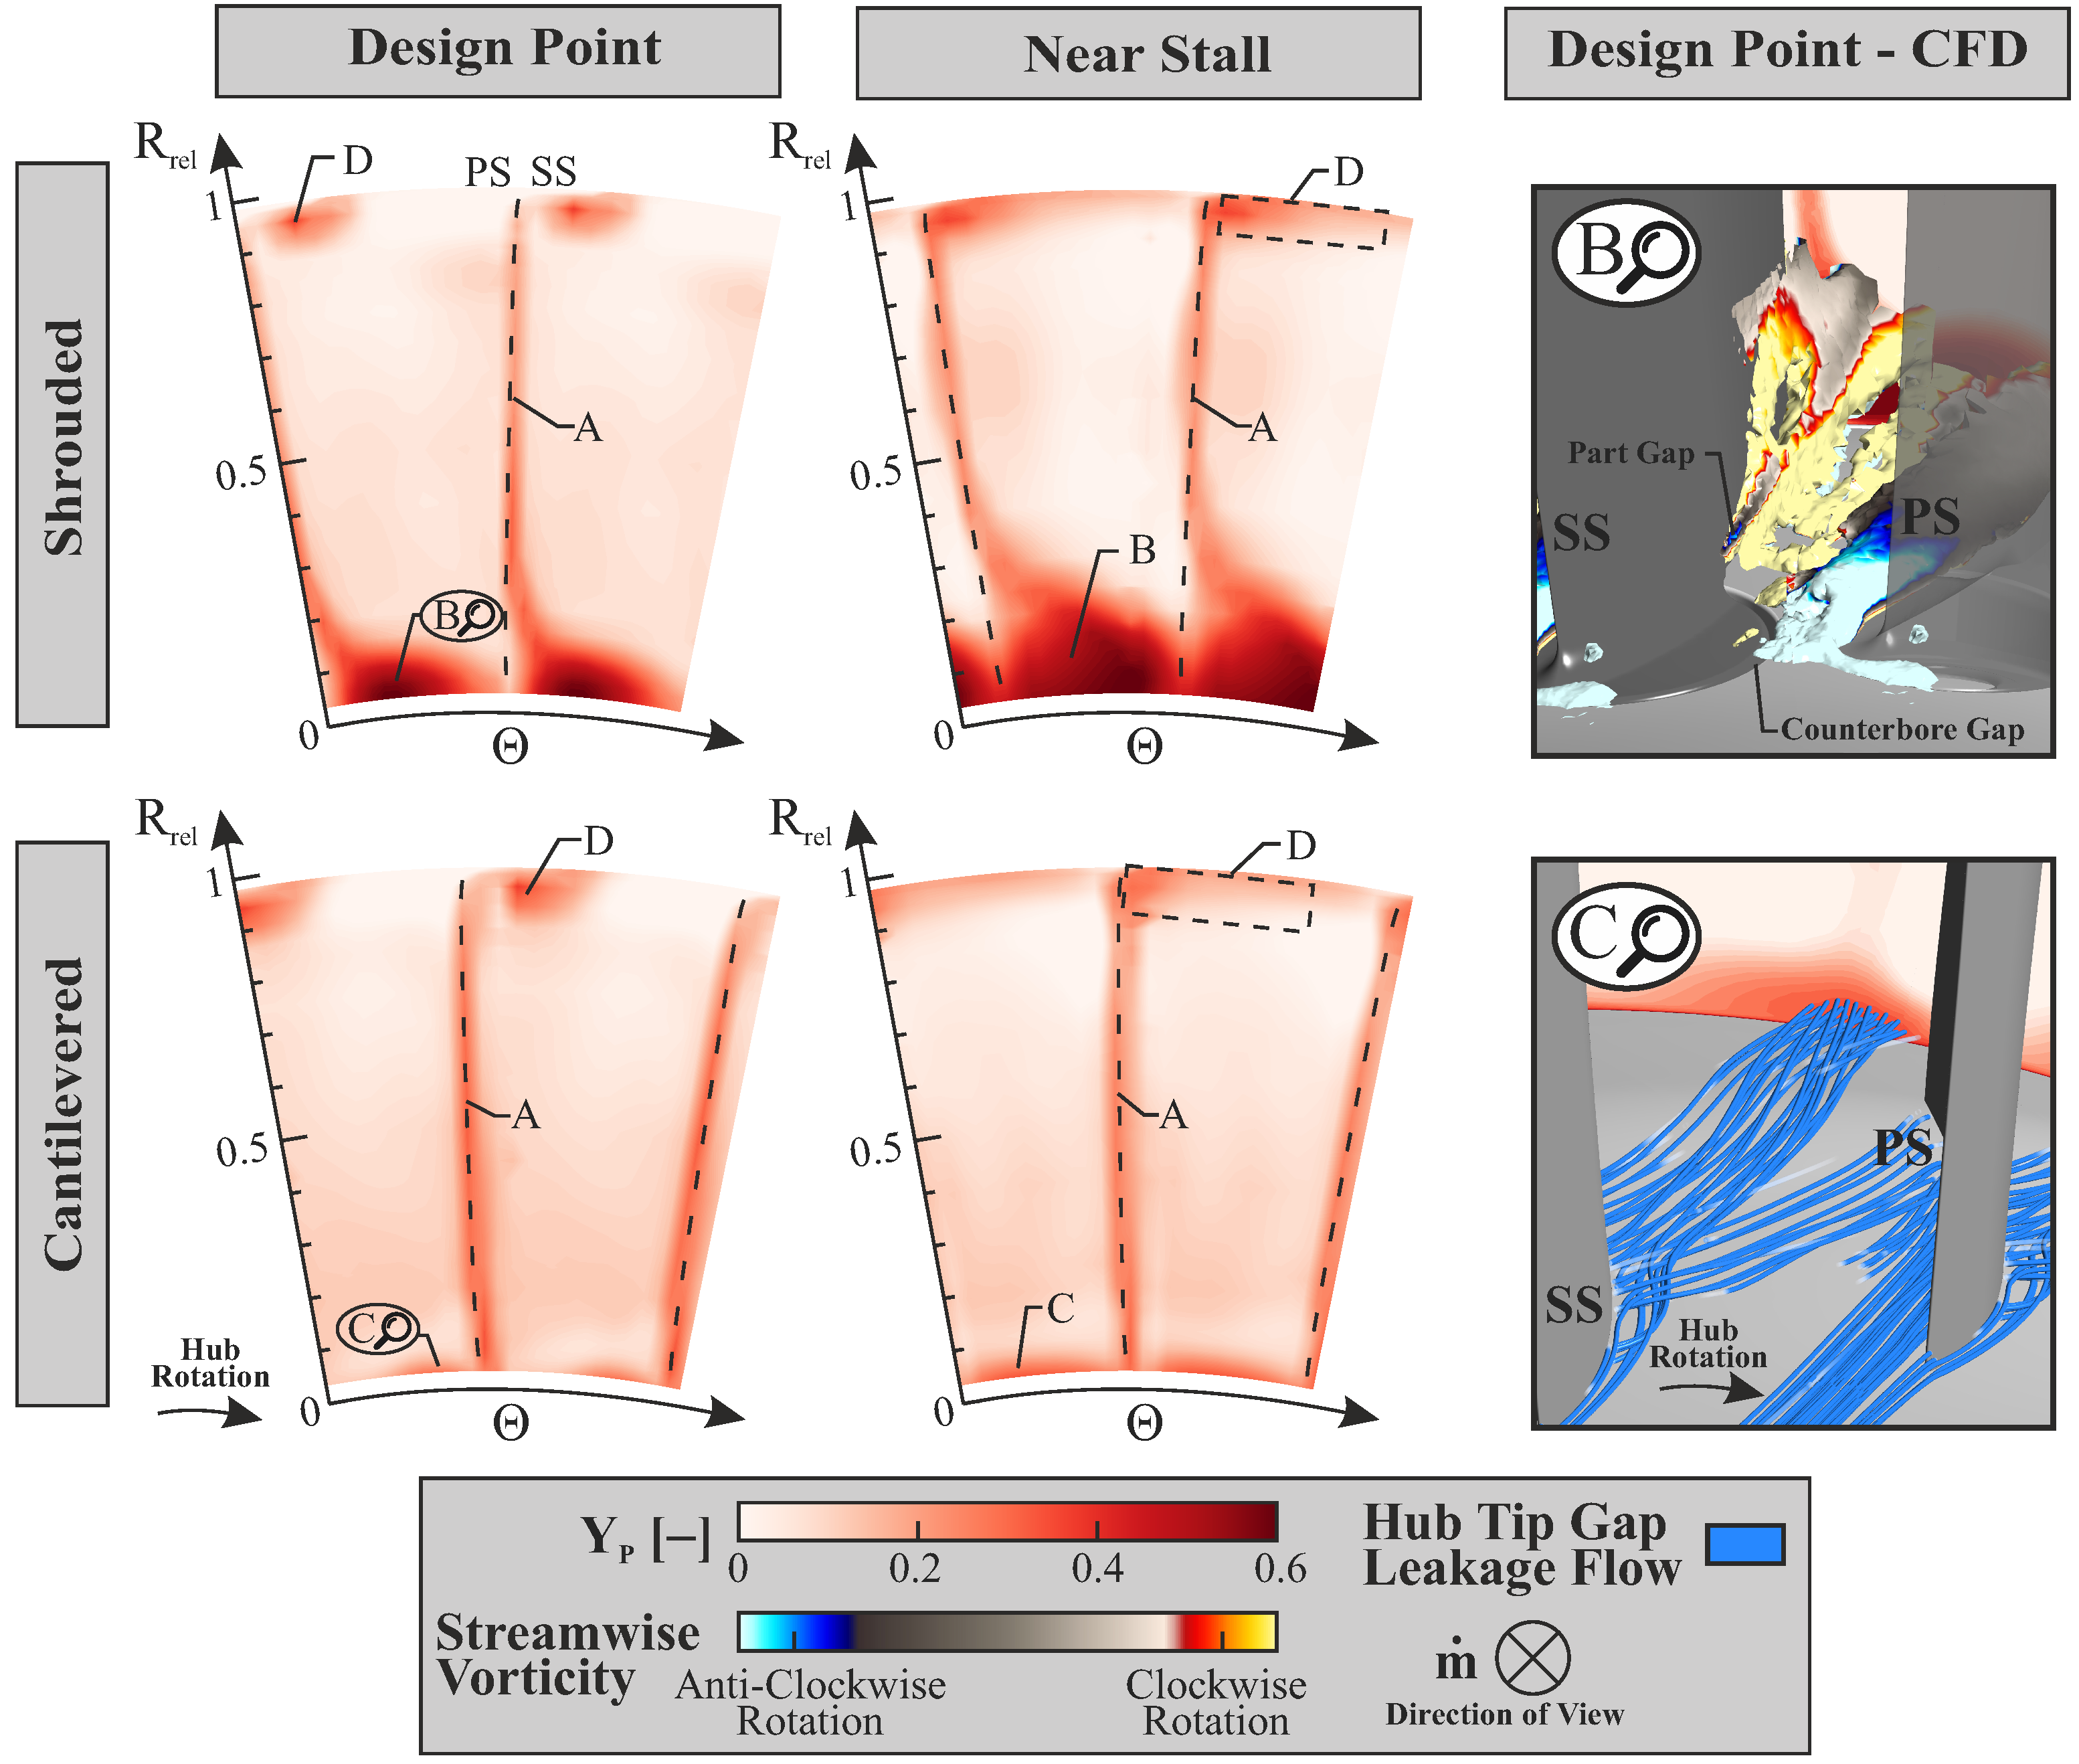
To quantify where the total pressure losses occur, the respective flow fields at the stator exit for two stator pitches are shown in Figure 11. The total pressure losses are located at the endwalls as well as close to the vanes. The wakes of the stator vanes are clearly visible with an increased total pressure loss (marker A). At NS condition the wakes are slightly thicker, because of the increased loading. In case of the SHR stage, the hub loss area is located at the suction side of the associated vane (marker B). In circumferential direction, it spans over the entire width of the passage, independent of the operating point. A change in throttling leads to radial extension up to 30% of the channel height at the NS operating point. The numerical results indicate that the loss region near the inner shroud of the variable shrouded stator (marker B) is composed of multiple interacting flow structures. Vortices with differing rotational directions originate from the counterbore gaps and the part gap, contributing to an additional total pressure loss. Furthermore, conventional secondary flow structures, such as passage vortices and horseshoe vortices, are also present within the blade passage. In summary, the loss area at the hub of the variable shrouded stator is not only a classical corner separation as defined in the literature [28], but a superposition of leakage flows and secondary flows. For this reason, the phenomenon is generally referred to as hub blockage. The CAN stage shows a different behavior at the hub. At DP condition, a small loss area is apparent at the pressure side of a vane wake (marker C). This total pressure loss is formed by the hub tip leakage of the adjacent vane and is transported to the neighboring vane due to the rotation of the hub. This behavior is further confirmed by the streamline tracing observed in the numerical simulations. At NS condition, this loss area spans over the complete passage and extends slightly in radial direction. However, it is still very small compared to the losses in the SHR stage.
For the design point, a total pressure loss at the suction side of the vane, at the outer shroud, is present for both configurations (marker D). In case of the DP condition, this loss is associated to the part gap leakage of the stator at the shroud. For the NS operating point, the shape and the intensity of the loss area are changed. The total pressure loss is located closer to the shroud and circumferentially extended. At the NS operating point, the rotor builds up a lot of total pressure ratio at the tip combined with a high circumferential angle. These flow conditions overlap and mix with the part gap leakage to form the extended loss area. Since there is a positive incidence at the shroud for the NS operating point due to the high circumferential inlet flow angle, flow separation at the suction side of the vane is likely. This could cause additional total pressure losses.
Building on the loss analysis from the previous chapter, the sources and locations of the resulting losses were identified. The cantilevered stator produces significantly less total pressure loss at the hub, which explains its improved efficiency and the higher pressure ratio observed in the compressor map.

3.4. Unsteady Loss Determination

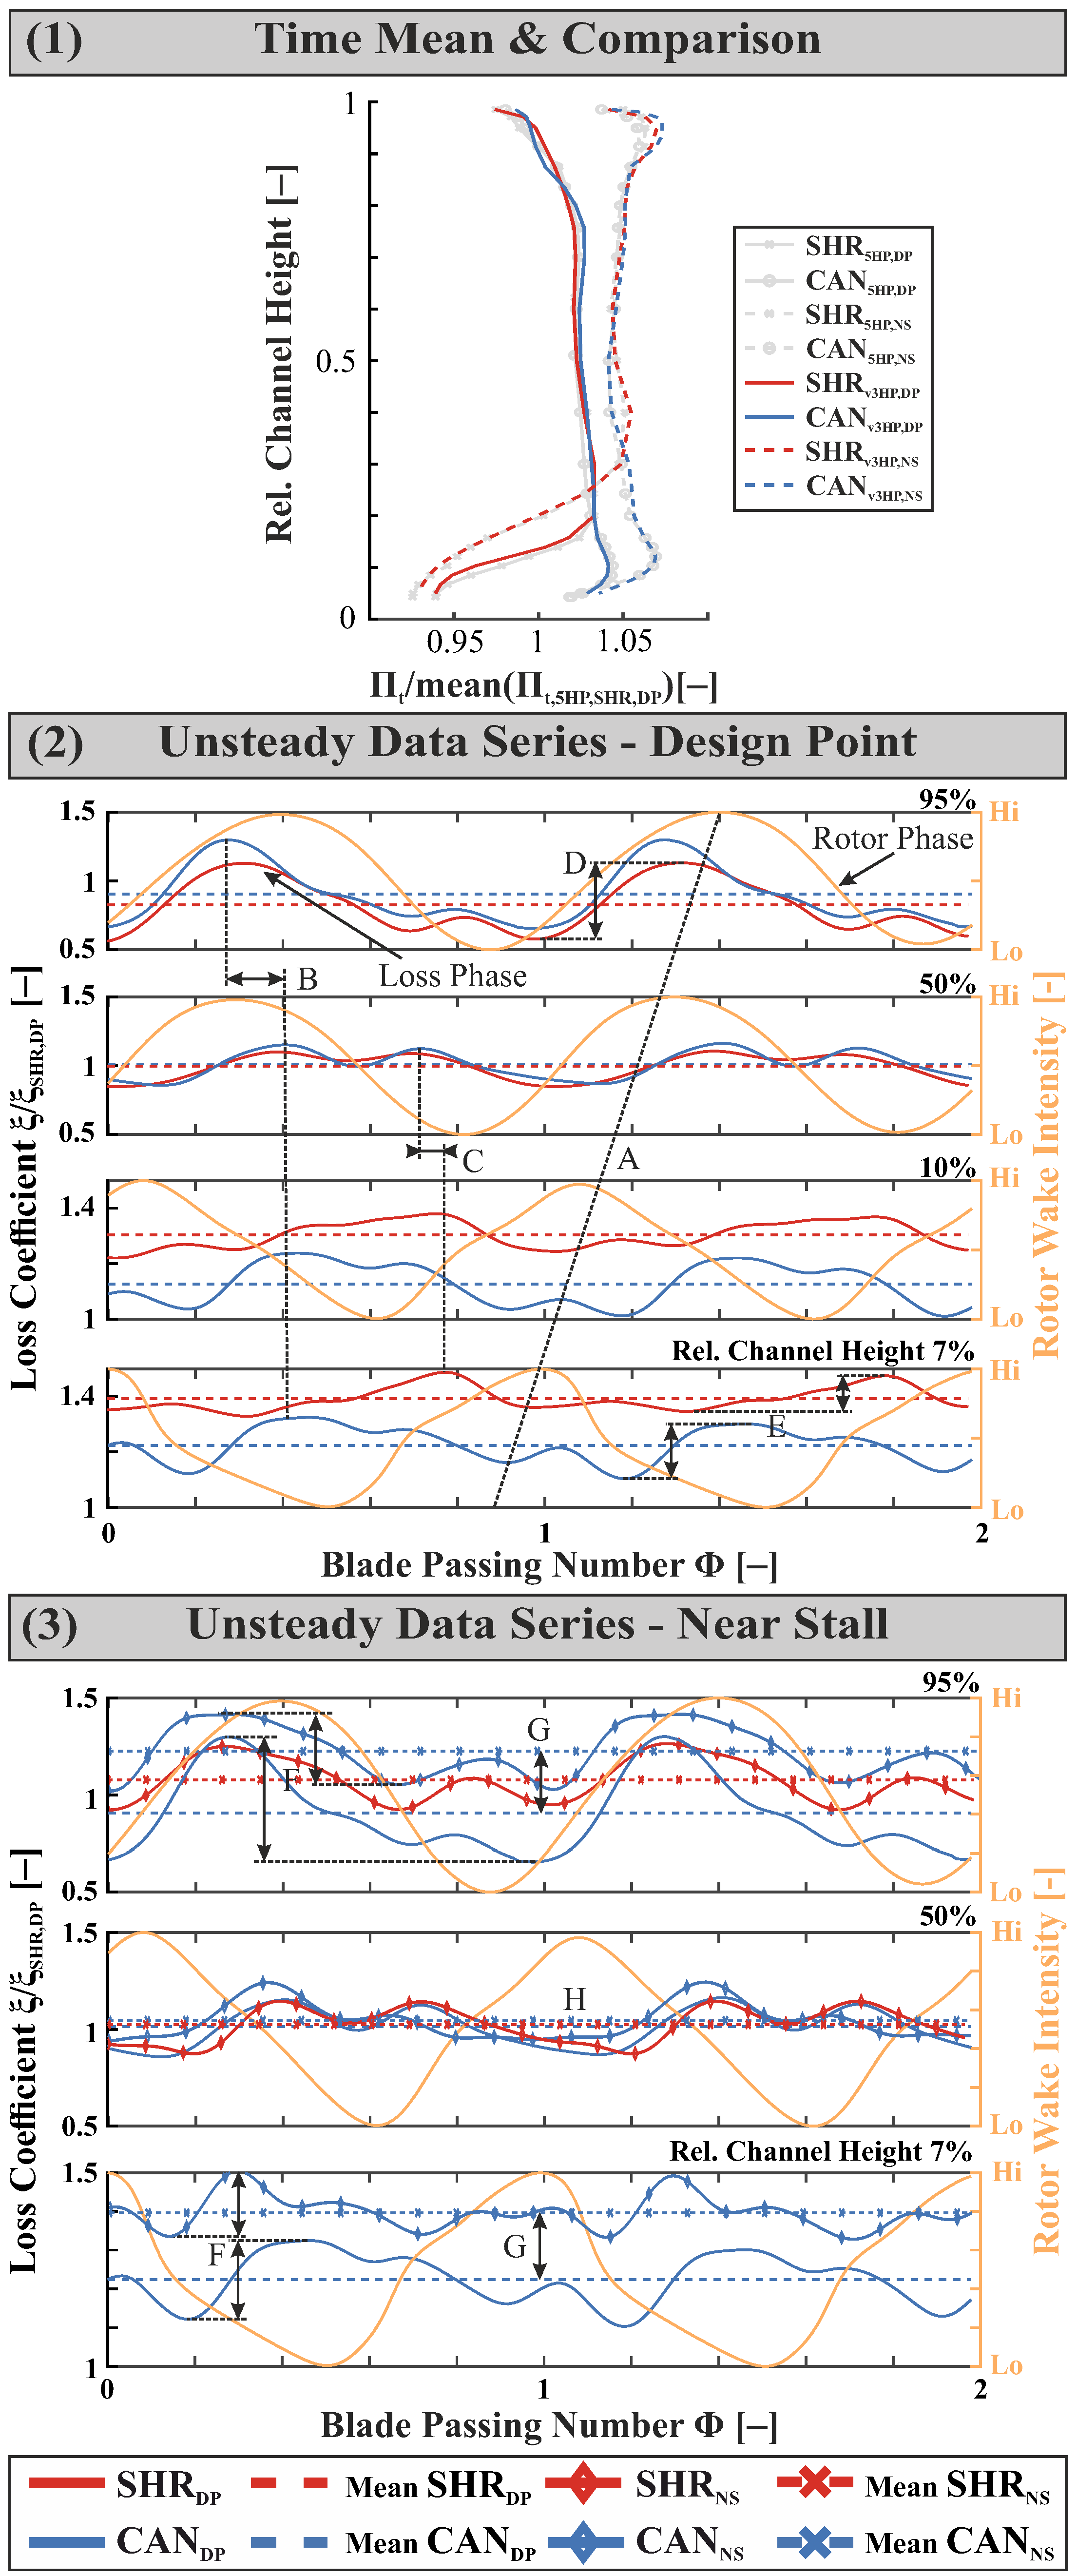
Conventional pressure measurement technology, such as 5-hole probes, only allow the analysis of time-averaged data. Therefore, a time-resolving virtual 3-hole probe was used in this work to enable the analysis of transient phenomena. The data processing of the virtual 3-hole probe is presented in Section 2.2. Figure 12-1 shows the comparison between the five-hole probe and virtual three-hole probe data. Here, the radial profiles of the total pressure ratio Π t for DP and NS condition for both stator configurations are used for the comparison. A time mean of the v3HP data was calculated for this purpose. Overall, the data show good agreement with reasonably small differences towards the endwalls. Due to the good agreement of the data, the virtual three-hole probe is assumed to be valid and is used for the following evaluation.
In Figure 12-2, the unsteady data series of the entropy-rise based loss coefficient ξ for four different relative channel heights for DP operating condition is plotted over two rotor blade passings. Additionally, the rotor wake intensity is plotted as a rotor-phase reference. Starting with the mean values, the loss coefficient delta between SHR and CAN stage is rising towards the hub, with the SHR stage showing higher values. This is in good agreement with the total pressure loss in Figure 10. In this illustration, it appears that the phase of the rotor is constantly shifting. However, the reason for this is that the rotor’s wake is not vertical in the channel, but slightly inclined against the direction of rotation, which leads to different phase starting points (marker A). For 95% and 50% relative channel height, phase and amplitude of the loss coefficient of the CAN and SHR stage are fairly similar. At 95%, the phase of the loss coefficients runs slightly ahead compared to the rotor phase. A phase shift compared to the rotor phase is apparent between 95% and 50% relative channel height for both configurations (marker B). In the middle of the channel, the loss coefficient rises just after the passing of the rotor wake. Near the hub, at 10% relative channel height only the phase of the SHR data shifts again while the CAN phase remains constant (marker C). At 7% relative channel height, no additional significant phase shifts are present. At 10% and 7%, the loss coeffcient shows a rise between two rotor wakes. Overall, the amplitude of the loss coefficient is higher at the shroud compared to the hub (marker D). Comparing SHR and CAN stage at the hub, the amplitude of the SHR configuration is more damped (marker E). This could be a result of the strong hub blockage which blends out the rotor wakes more than the freestream. The unsteady behavior of the loss coefficient at the NS operating condition is shown in Figure 12-3. As a reference, the CAN stage data series for the DP condition is plotted. Regarding phase position, no major changes occur between DP and NS condition. The amplitude for the NS condition is reduced at hub and shroud (marker F). As expected, the mean level at the endwalls is higher in both configurations (marker G). At the shroud, the CAN stage shows a higher loss coefficient which is different from the 5HP data (compare Figure 10), where both show only very small differences.
A reason could be the difference between pneumatic and time mean in such highly unsteady regions at NS condition. The 5HP only allows to capture slower and larger pressure fluctuations in time domain compared to the v3HP. Since the highly fluctuating rotor tip leakage at near stall condition will cause unsteady effects with small timescales in the stator as well, the 5HP may not capture these fluctuations accurately. The high sampling rate of the v3HP captures most of these pressure fluctuations. At 50% channel height, both configurations show a similar loss coefficient like in the 5HP data (marker H). Near the hub, only the CAN stage data is shown, because for the SHR stage in the NS condition, the probe was outside of its calibration range, which leads to nonphysical values. This could be an indicator for high circumferential and radial flow angles inside the hub blockage. As expected, the CAN stage shows a higher loss coefficient for NS than for DP condition at the hub.
In general, there is a strong dependency of the entropy-rise based loss coefficient from the rotor phase. However, the assignment of the loss maxima and minima to the rotor phase require additional investigations. Furthermore, it can be concluded that the transient data also show that the cantilevered stator generates lower losses in the hub region.

4. Conclusions

This study investigates the effect of a variable cantilevered stator in comparison to a conventional shrouded variable stator with inner shroud band. The implications of the stator configuration on the global performance and the aerodynamic behavior of the stator in a 1.5-stage transonic compressor are assessed. The investigated stage is representative of a transonic axial high-pressure compressor front stage.
A significant performance and total pressure ratio gain could be reached with the cantilevered stator compared to the shrouded configuration. The efficiency increased by approx. 2% and the total pressure ratio by approx. 1%. This is reached via a higher aerodynamic loading and lower total pressure losses of the cantilevered stator. These results contradict some of the reference studies (e.g., refs. [2,6]). When comparing the results, it is crucial to consider that most of these studies investigated non-variable stators. The additional leakage area formed by the penny regions at the endwalls significantly impacts the performance of variable stators.
A detailed analysis of the aerodynamic loading and the resulting loss mechanisms revealed that the primary factor contributing to the performance gain is the absence of the hub blockage at the inner shroud. The shrouded stator showed a strong hub blockage, formed by a superposition of multiple leakage flows and secondary flows. In the cantilevered stator, only the hub tip gap leakage contributes to additional total pressure loss. The cantilevered stator also performed very well in near stall conditions, whereas the shrouded stator reached its limit here. The stator configuration significantly affects preceding and subsequent rotors, with the cantilevered stator increasing tip loading on the preceding rotor and hub loading on the subsequent rotor.
The use of a time-resolving pressure probe revealed a strong dependency of losses to the phase of the rotor wake. In areas with less flow unsteadiness, a good agreement between the five-hole probe data and the unsteady probe data could be reached, whereas regions where the rotor tip leakage interacts with the stator showed some discrepancy.
In summary, it could be shown that variable cantilevered stators perform better in a 1.5-stage transonic compressor stage.

Author Contributions

Conceptualization, B.R., P.G. and B.B.; funding acquisition, H.-P.S. and B.B.; investigation, B.R., F.S.K., F.J., J.B., P.G. and B.B.; methodology, B.R. and F.S.K.; project administration, H.-P.S. and B.B.; supervision, H.-P.S.; visualization, B.R.; writing—original draft, B.R.; writing—review & editing, B.R., F.S.K., F.J., J.B., H.-P.S., P.G. and B.B. All authors have read and agreed to the published version of the manuscript.

Funding

This work was funded in the frame of LUFO VI KOmpakt by Federal Ministry for Economic Affairs and Climate Action (FKZ 20T 1911) as well as by Rolls-Royce Deutschland Ltd. & Co. KG. The authors gratefully acknowledge the financial support and thank Rolls-Royce Deutschland Ltd. & Co. KG for the permission to publish this paper.

Data Availability Statement

The data presented in this study are intellectual property of the industry partner Rolls-Royce Deutschland Ltd. & Co. KG and therefore restricted to share publicly.

Acknowledgments

The support and helpful discussions with the TU Darmstadt compressor team is very much appreciated. The authors would also like to acknowledge the continuous support of the compressor aerodynamics and aeroelasticity group at Rolls-Royce Deutschland Ltd. & Co. KG.

Conflicts of Interest

Authors Bernd Becker and Patrick Grothe were employed by the company Rolls-Royce Deutschland Ltd. & Co. KG. The remaining authors declare that the research was conducted in the absence of any commercial or financial relationships that could be construed as a potential conflict of interest.

Abbreviations

The following abbreviations are used in this manuscript:
LatinGreek
AArea [m2] α Circumferential flow angle [°]
cVelocity in stationary frame of reference [m/s] η i s Isentropic efficiency [–]
C p Static pressure recovery factor [–] κ Isentropic exponent [–]
c p Specific heat capacity [J/(kg K)] Π t Total pressure ratio [–]
m ˙ Mass flow [kg/s] σ Solidity [–]
pPressure [Pa] θ Circumferential position [°]
P s h a f t Shaft power [W] τ t Total temperature ratio [–]
rRadius [m] ϑ Vane metal angle [°]
RSpecific gas constant [J/(kg K)] ξ Loss coefficient [–]
sSpecific entropy [J/(kg K)]
TTemperature [K]Subscripts
Y p Total pressure loss coefficient [–] aa area-average
ax axial
Abbreviations dyn dynamic
5HPFive-hole probe rel relative
AVRAxial Velocity Ratio stat static
CANVariable Cantilevered Stator t total (stagnated)
DFDiffusion Factor u circumferential
DHde Haller-Criterion
DPDesign Point
NCNear Choke
NSNear Stall
PEPeak Efficiency
PSPressure Side
RERotor Exit
SEStage Exit
SHRVariable Shrouded Stator
SSSuction Side
v3HPTime-resolving virtual Three-hole Probe
VIGVVariable Inlet Guide Vane
VSVVariable Stator Vane

Appendix A

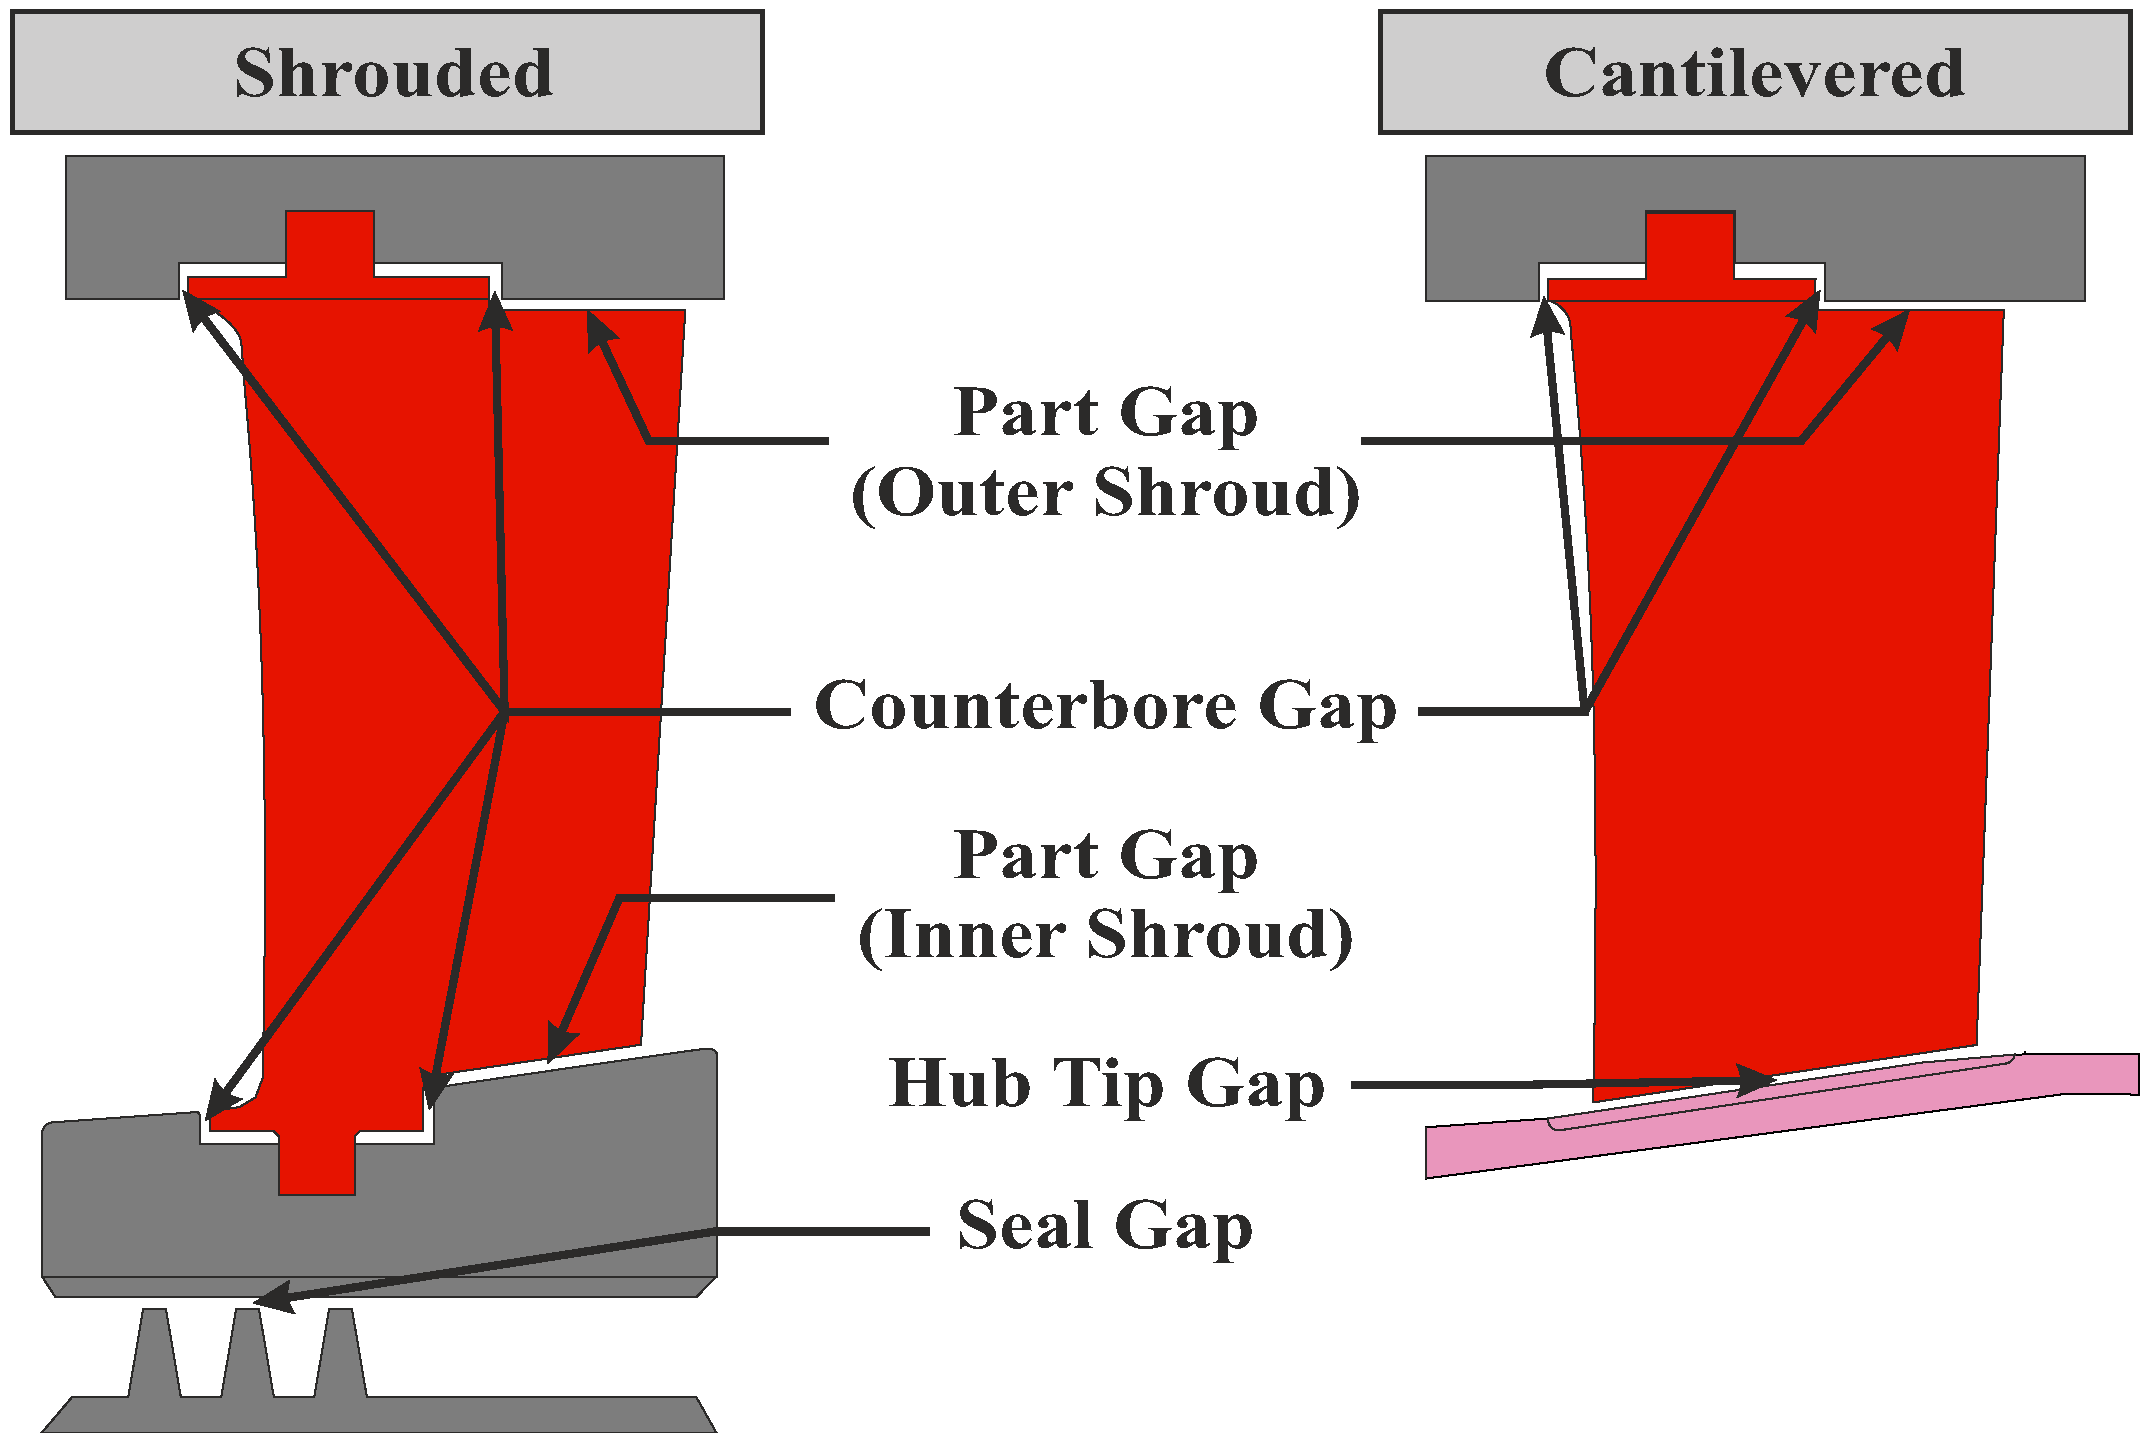
Figure A1 shows all gaps which occur in a variable shrouded or a variable cantilevered stator.
Figure A1. Relevant gaps of both stator configurations (gray/red: non rotating components, magenta: rotating components).
Ijtpp 10 00024 g0a1
Based on Figure A1, the respective leakage area could be calculated. The equations provided by Yoon et al. [7] are only applicable for non-variable stators and the equations given in Section 2.1 are specific for this work. Therefore, the Equations (A1) and (A2) that generally apply to variable shrouded or cantilevered stators are presented below:
A L , SHR = g a p Seal × p i t c h + g a p Part , Shroud × c h o r d Part , Shroud + g a p Part , Hub × c h o r d Part , Hub + 1 2 π r O u t , CBore , Hub 2 π r I n , CBore , Hub 2 + 1 2 π r O u t , CBore , Shroud 2 π r I n , CBore , Shroud 2 ,
A L , CAN = g a p Part , Shroud × c h o r d Part , Shroud + g a p Tip , Hub × c h o r d Tip , Hub + 1 2 π r O u t , CBore , Shroud 2 π r I n , CBore , Shroud 2 .

References

  1. Wellborn, S.R.; Okiishi, T.H. The Influence of Shrouded Stator Cavity Flows on Multistage Compressor Performance. In Proceedings of the ASME 1998 International Gas Turbine and Aeroengine Congress and Exhibition, Stockholm, Sweden, 2–5 June 1998; ASME: New York, NY, USA, 1998. [Google Scholar] [CrossRef]
  2. Campobasso, M.S.; Mattheiss, A.; Wenger, U.; Amone, A.; Boncinelli, P. Complementary Use of CFD and Experimental Measurements to Assess the Impact of Shrouded and Cantilevered Stators in Axial Compressors. In Proceedings of the ASME 1999 International Gas Turbine and Aeroengine Congress and Exhibition, Indianapolis, IN, USA, 7–10 June 1999; ASME: New York, NY, USA, 1999. [Google Scholar] [CrossRef]
  3. Swoboda, M.; Ivey, P.C.; Wenger, U.; Gümmer, V. An Experimental Examination of Cantilevered and Shrouded Stators in a Multistage Axial Compressor. In Proceedings of the ASME 1998 International Gas Turbine and Aeroengine Congress and Exhibition, Stockholm, Sweden, 2–5 June 1998; ASME: New York, NY, USA, 1998. [Google Scholar] [CrossRef]
  4. Rückert, R.; Peitsch, D. Cantilevered Tandem Stator in Annular High Speed Test Rig. Int. J. Turbomach. Propuls. Power 2022, 7, 24. [Google Scholar] [CrossRef]
  5. Si, X.; Teng, J.; Qiang, X.; Feng, J. Different Effects of Cantilevered and Shrouded Stators on Axial Compressor Performance. In Proceedings of the ASME Turbo Expo: Turbine Technical Conference and Exposition—2017, Charlotte, NC, USA, 26–30 June 2017; ASME: New York, NY, USA, 2017. [Google Scholar] [CrossRef]
  6. Freeman, C. Effect of Tip Clearance Flow on Compressor Stability and Engine Performance. In Tip Clearance Effects in Axial Turbomachines; VKI Lecture Series 1985-05; von Karman Institute: Rhode-Saint-Genèse, Belgium, 1985. [Google Scholar]
  7. Yoon, S.; Selmeier, R.; Cargill, P.; Wood, P. Effect of the Stator Hub Configuration and Stage Design Parameters on Aerodynamic Loss in Axial Compressors. J. Turbomach. 2015, 137, 091001. [Google Scholar] [CrossRef]
  8. Lange, M.; Mailach, R.; Vogeler, K. An Experimental Investigation of Shrouded and Cantilevered Compressor Stators at Varying Clearance Sizes. In Proceedings of the ASME Turbo Expo 2010: Power for Land, Sea, and Air, Glasgow, UK, 14–18 June 2010; pp. 75–85. [Google Scholar] [CrossRef]
  9. de Dominicis, I.; Robens, S.; Gümmer, V. Numerical Evaluation of Losses in Shrouded and Cantilevered Stators of a Multi-Stage Axial Compressor. In Proceedings of the ASME Turbo Expo 2021: Turbomachinery Technical Conference and Exposition, Online, 7–11 June 2021. Volume 2A: Turbomachinery—Axial Flow Fan and Compressor Aerodynamics. [Google Scholar] [CrossRef]
  10. Matthews, D.R. The Influence of Stator Endwall Clearances on Multistage Axial Compressor Aerodynamics. Ph.D. Thesis, School of Aeronautics and Astronautics, Purdue University, West Lafayette, IN, USA, 2024; 248p. [Google Scholar] [CrossRef]
  11. Radermacher, B.; Klausmann, F.; Bargon, J.; Lücke, M.; Schiffer, H.-P.; Becker, B. Aerodynamic Investigation of Different Variable Stator Configurations in a 1.5-stage Transonic Compressor. In Proceedings of the 25th International Society of Air Breathing Engines (ISABE) Conference, Toulouse, France, 22–27 September 2024. Paper No. ISABE-2024-102. [Google Scholar]
  12. Radermacher, B.; Klausmann, F.; Jung, F.; Bargon, J.; Schiffer, H.-P.; Becker, B.; Grothe, P. The Effect of a Variable Cantilevered Stator on 1.5-stage Transonic Compressor Performance. In Proceedings of the 16th European Turbomachinery Conference, paper No. ETC2025-174, Hannover, Germany, 24–28 March 2025. [Google Scholar]
  13. Pohl, D.; Janssen, J.; Jeschke, P.; Halcoussis, A.; Wolf, H. Variable Stator Vane Penny Gap Aerodynamic Measurements and Numerical Analysis in an Annular Cascade Wind Tunnel. Int. J. Gas Turbine Propuls. Power Syst. 2020, 11, 44–55. [Google Scholar] [CrossRef] [PubMed]
  14. Stummann, S.; Pohl, D.; Jeschke, P.; Wolf, H.; Halcoussis, A.; Franke, M. Secondary Flow in Variable Stator Vanes with Penny-Cavities. In Proceedings of the ASME Turbo Expo 2017: Turbomachinery Technical Conference and Exposition, Charlotte, NC, USA, 26–30 June 2017; ASME: New York, NY, USA, 2017. Paper No. GT2017-63771. [Google Scholar] [CrossRef]
  15. Wolf, H.; Franke, M.; Halcoussis, A.; Kleinclaus, C.; Gautier, S. Investigation of Penny Leakage Flows of Variable Guide Vanes in High Pressure Compressors. In Proceedings of the ASME Turbo Expo 2016: Turbomachinery Technical Conference and Exposition, Seoul, Republic of Korea, 13–17 June 2016; ASME: New York, NY, USA, 2016. Paper No. GT2016-56327. [Google Scholar] [CrossRef]
  16. Klausmann, F.; Franke, D.; Foret, J.; Schiffer, H.-P. Transonic compressor Darmstadt—Open test case Introduction of the TUDa open test case. J. Glob. Power Propuls. Soc. 2022, 6, 318–329. [Google Scholar] [CrossRef] [PubMed]
  17. Foret, J. Untersuchung Eines Tandemstators in Einem Transsonischen Axialverdichter. Ph.D. Thesis, Technische Universität Darmstadt, Darmstadt, Germany, 2023. [Google Scholar]
  18. Lieblein, S.; Schwenk, F.C.; Broderick, R.L. Diffusion Factor for Estimating Losses and Limiting Blade Loadings in Axial-Flow-Compressor Blade Elements; Research Memorandum; National Advisory Committee for Aeronautics: Washington, DC, USA, 1953. [Google Scholar]
  19. Saha, U.K.; Roy, B. Experimental investigations on tandem compressor cascade performance at low speeds. Exp. Therm. Fluid Sci. 1997, 14, 263–276. [Google Scholar] [CrossRef]
  20. Denton, J.D. The 1993 IGTI Scholar Lecture: Loss Mechanisms in Turbomachines. J. Turbomach. 1993, 115, 621–656. [Google Scholar] [CrossRef]
  21. Baehr, H.D.; Kabelac, S. Thermodynamik: Grundlagen und Technische Anwendungen, 14th ed.; Springer: Berlin/Heidelberg, Germany; Springer Nature: Cham, Switzerland, 2009. [Google Scholar] [CrossRef]
  22. Bräunling, W.J.G. Flugzeugtriebwerke: Grundlagen, Aero-Thermodynamik, Ideale und Reale Kreisprozesse, Thermische Turbomaschinen, Komponenten, Emissionen und Systeme, 4th ed.; Springer Vieweg: Berlin, Germany, 2015. [Google Scholar]
  23. Grieb, H. Turboverdichter für Flugtriebwerke; Springer: Dordrecht, The Netherlands, 2007. [Google Scholar] [CrossRef]
  24. Hertel, C.; Bode, C.; Kožulović, D.; Schneider, T. Investigations on Aerodynamic Loading Limits of Subsonic Compressor Tandem Cascades: End Wall Flow. In Proceedings of the ASME Turbo Expo 2014: Power for Land, Sea, and Air, Düsseldorf, Germany, 16–20 June 2014. Volume 2A: Turbomachinery; Paper No. GT2014-26978. [Google Scholar] [CrossRef]
  25. Klausmann, F.S.; Kilian, N.; He, X.; Spieker, D.; Schmidt, B.; Schiffer, H.-P. Transonic Compressor Darmstadt Open Test Case: Experimental Investigation of Stator Secondary Flows and Hub Leakage. J. Turbomach. 2024, 146, 101007. [Google Scholar] [CrossRef]
  26. Menter, F.R. Two-equation eddy-viscosity turbulence models for engineering applications. AIAA J. 1994, 32, 1598–1605. [Google Scholar] [CrossRef]
  27. Kato, M.; Launder, B.L. The modelling of turbulent flow around stationary and vibrating square cylinders. In Proceedings of the Ninth Symposium on Turbulent Shear Flows, Kyoto, Japan, 16–18 August 1993. [Google Scholar]
  28. Lei, V.; Spakovszky, Z.S.; Greitzer, E.M. A Criterion for Axial Compressor Hub-Corner Stall. ASME J. Turbomach. 2008, 130, 031006. [Google Scholar] [CrossRef]
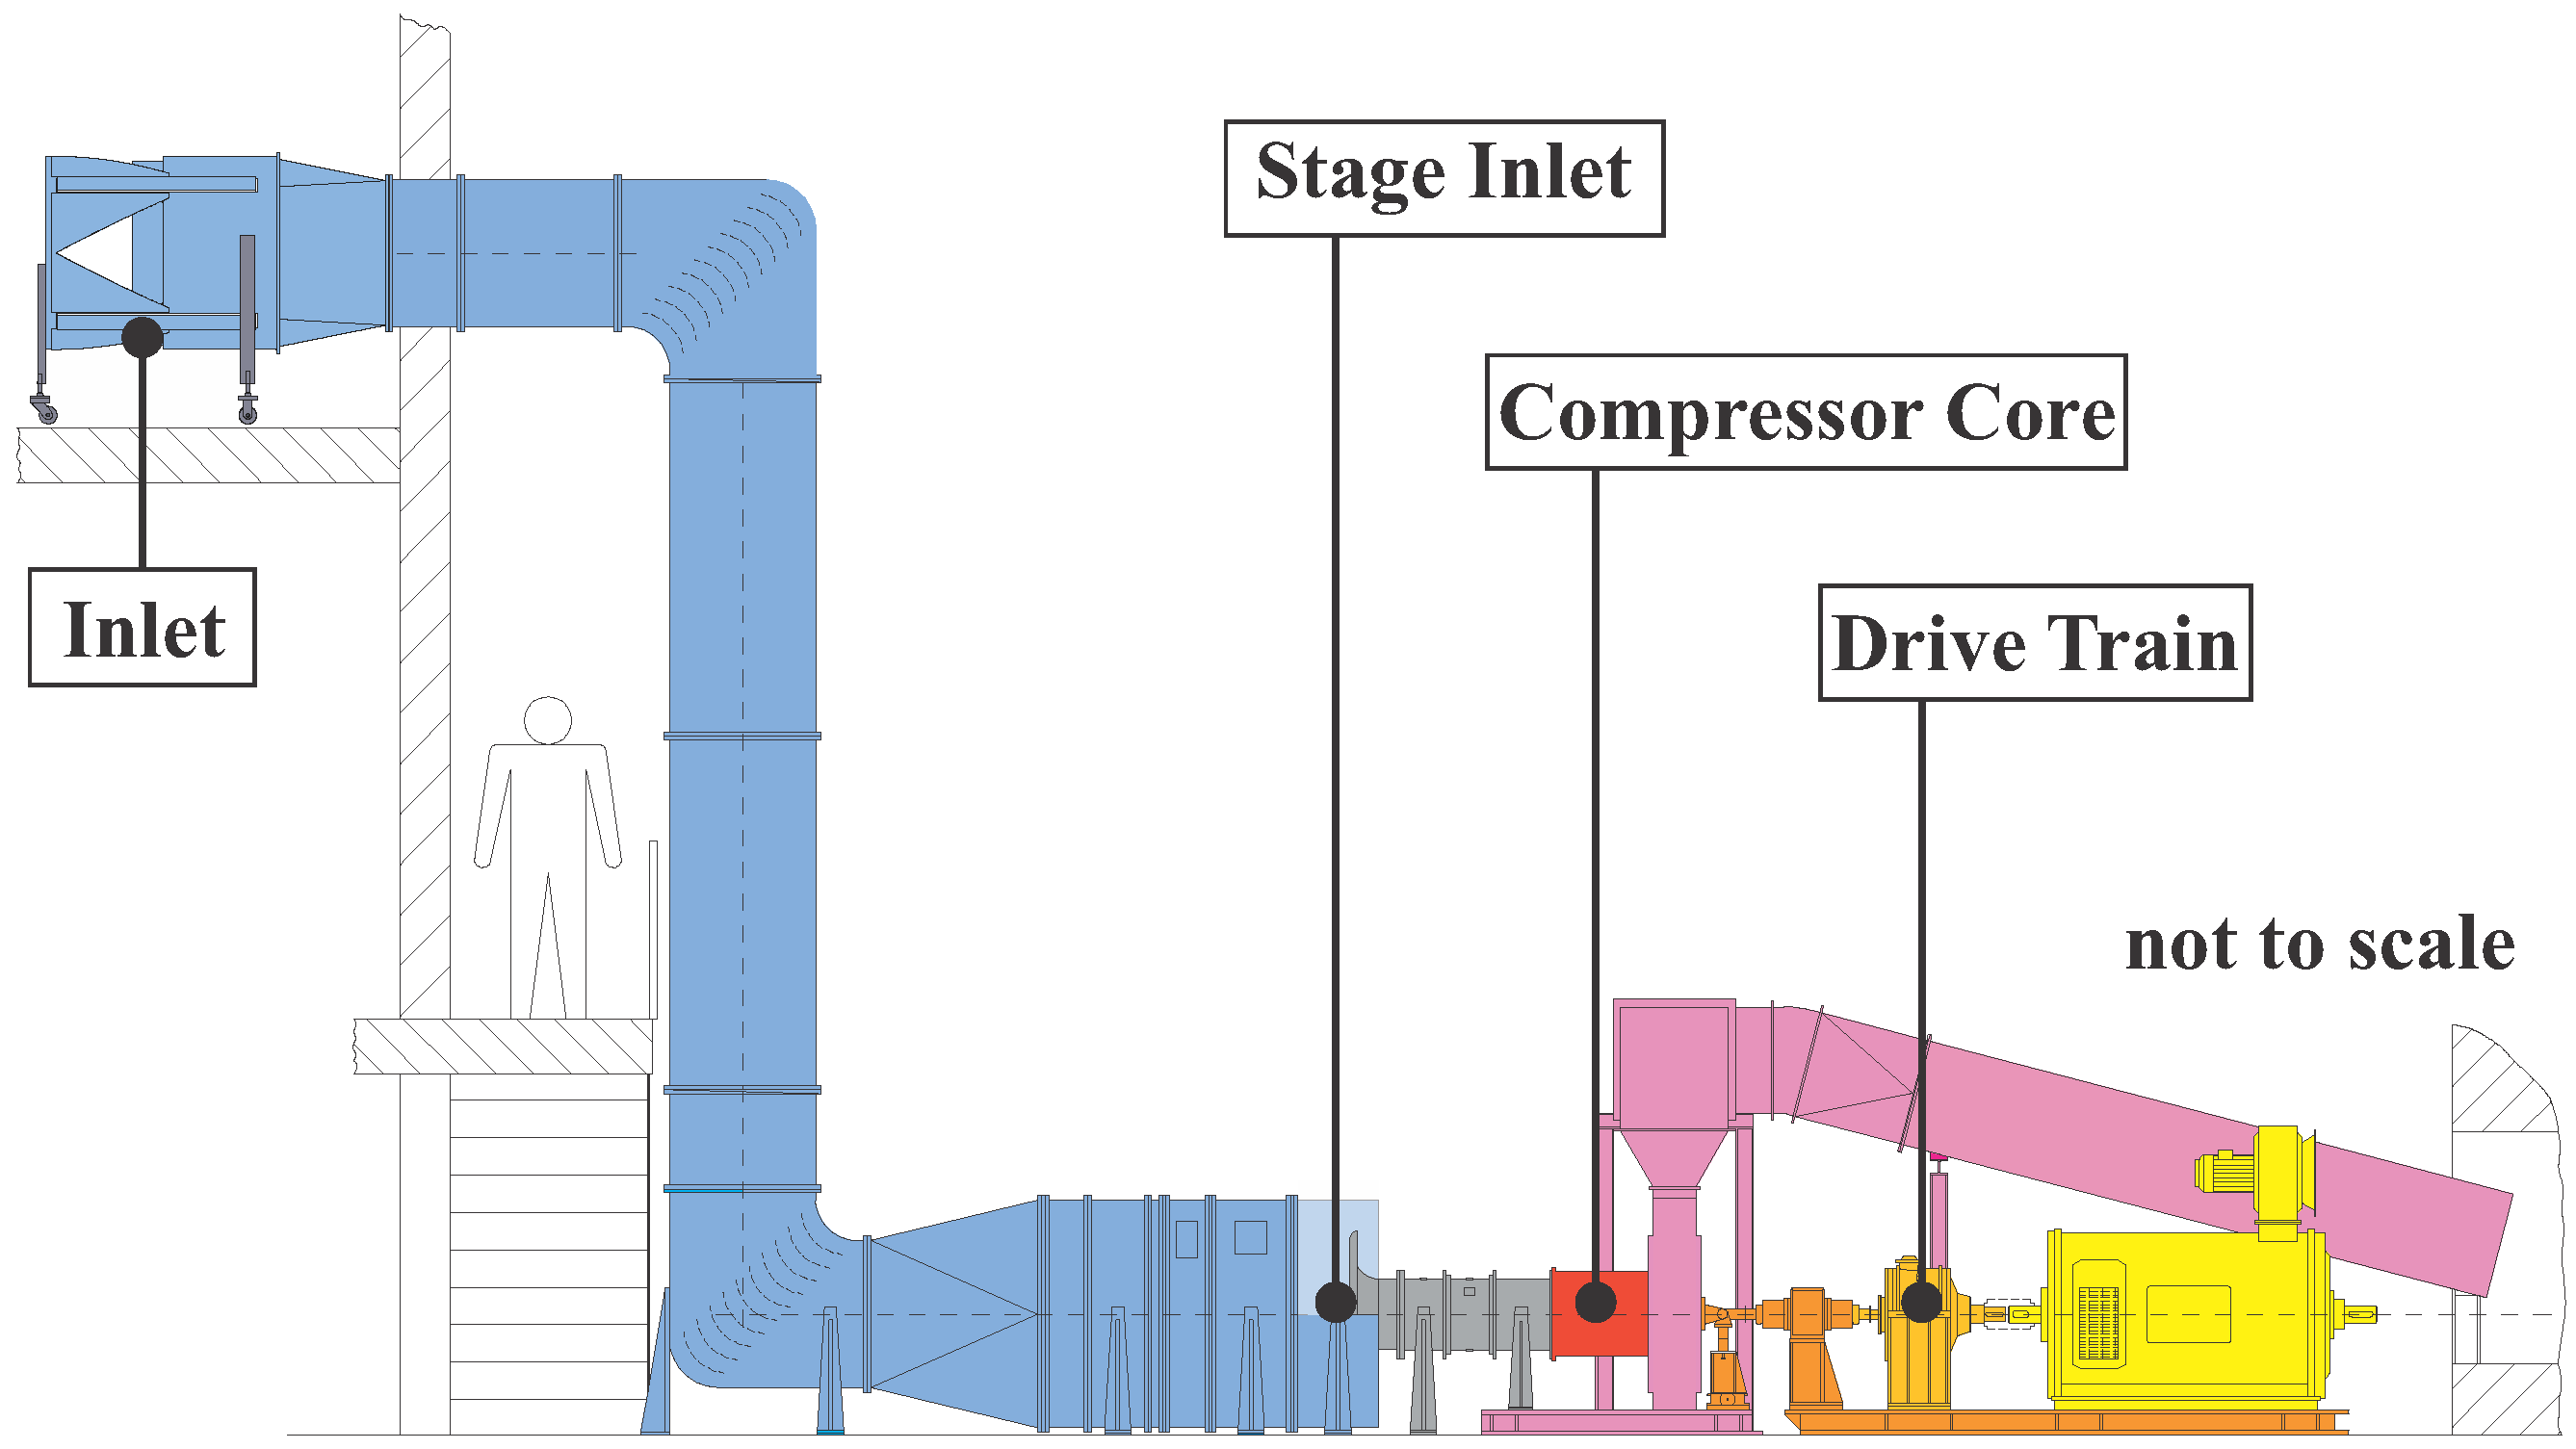
Figure 2. Test facility—Transonic Compressor Darmstadt ([11]).
Ijtpp 10 00024 g002
Figure 3. Cross-section of investigated compressor core setups.
Ijtpp 10 00024 g003
Figure 4. Instrumentation (left), measurement procedure (middle) and methodology (right) ([11]).
Ijtpp 10 00024 g004
Figure 5. Methodology of virtual probe data processing.
Ijtpp 10 00024 g005
Figure 6. Compressor map of shrouded and cantilevered stage.
Ijtpp 10 00024 g006
Figure 7. Total pressure loss, static pressure recovery, turning over stator and diffusion along the characteristic.
Ijtpp 10 00024 g007
Figure 8. Radial profiles to assess the load distribution of the investigated stators.
Ijtpp 10 00024 g008
Figure 9. Radial profiles of rotor and stator circumferential exit flow angle and impact of stator configuration on the aerodynamics of adjacent rotors.
Ijtpp 10 00024 g009
Figure 11. Two-dimensional flow fields of total pressure losses downstream of the stator (SE) for SHR and CAN at the PE and NS operating points. Additionally, visualization of flow topology a the inner shroud of the stators.
Ijtpp 10 00024 g011
Figure 12. (1) Comparison of 5HP and v3HP data, (2) Unsteady data series of the entropy based loss coefficient for PE, (3) Unsteady data series of the entropy based loss coefficient for NS.
Ijtpp 10 00024 g012
Disclaimer/Publisher’s Note: The statements, opinions and data contained in all publications are solely those of the individual author(s) and contributor(s) and not of MDPI and/or the editor(s). MDPI and/or the editor(s) disclaim responsibility for any injury to people or property resulting from any ideas, methods, instructions or products referred to in the content.