Article

ECL5/CATANA: Transition from Non-Synchronous Vibration to Rotating Stall at Transonic Speed †

by
Alexandra P. Schneider
1,*,
Anne-Lise Fiquet
1,
Nathalie Grosjean
2,
Benoit Paoletti
2,
Xavier Ottavy
2 and
Christoph Brandstetter
1
1
Ecole Centrale de Lyon, CNRS, Universite Claude Bernard Lyon 1, INSA Lyon, LMFA, UMR5509, 69130 Ecully, France
2
CNRS, Ecole Centrale de Lyon, INSA Lyon, Universite Claude Bernard Lyon 1, LMFA, UMR5509, 69130 Ecully, France
*
Author to whom correspondence should be addressed.
This paper is an extended version of our paper published in the Proceedings of the 16th European Turbomachinery Conference, Hannover, Germany, 24–28 March 2025, paper No. 190.
Int. J. Turbomach. Propuls. Power 2025, 10(3), 22; https://doi.org/10.3390/ijtpp10030022
Submission received: 22 May 2025 / Revised: 12 June 2025 / Accepted: 13 June 2025 / Published: 7 August 2025

Abstract

Non-synchronous vibration (NSV), flutter, or rotating stall can cause severe blade vibrations and limit the operating range of compressors and fans. To enhance the understanding of these phenomena, this study investigated the corresponding mechanisms in modern composite ultra-high-bypass-ratio (UHBR) fans based on the ECL5/CATANA test campaign. Extensive steady and unsteady instrumentation such as stereo-PIV, fast-response pressure probes, and rotor strain gauges were used to derive the aerodynamic and structural characteristics of the rotor at throttled operating conditions. The study focused on the analysis of the transition region from transonic to subsonic speeds where two distinct phenomena were observed. At transonic design speed, rotating stall was encountered, while NSV was observed at 90% speed. At the intermediate 95% speedline, a peculiar behavior involving a single stalled blade was observed. The results emphasize that rotating stall and NSV exhibit different wave characteristics: rotating stall comprises lower wave numbers and higher propagation speeds at around 78% rotor speed, while small-scale disturbances propagate at 57% rotor speed and lock-in with blade eigenmodes, causing NSV. Both phenomena were observed in a narrow range of operation and even simultaneously at specific conditions. The presented results contribute to the understanding of different types of operating range-limiting phenomena in modern UHBR fans and serve as a basis for the validation of numerical simulations.

1. Introduction

Understanding the behavior of fans and compressors close to their stability limit remains an essential topic in turbomachinery research. Phenomena such as flutter [1,2], non-synchronous vibration (NSV) [3,4], and rotating stall [5,6,7] can cause severe blade vibrations and limit the operating range. To ensure safe and efficient operation, the underlying mechanisms must be understood. Thus, the main objectives of the present study are as follows:
1.
To enhance the understanding of relevant phenomena at high subsonic and transonic conditions.
2.
To quantify disturbance characteristics at different rotation speeds to provide a benchmark for numerical simulations.
Within this context, an extensive experimental campaign was conducted with the open-test case fan stage ECL5/CATANA with the goal to characterize mechanisms that limit the operating range of a modern composite ultra-high-bypass-ratio (UHBR) fan. During these experiments, two different phenomena were observed: rotating stall occurred at transonic design speed conditions, and NSV was observed at all subsonic part speedlines.
Rotating stall is a purely aerodynamic phenomenon that is characterized by the circumferential propagation of regions of separated flow, typically referred to as stall cells. Regarding its onset, two different types of precursors have been reported in the literature. The first one is a short-length scale disturbance, called spike, that rapidly grows in amplitude, forming a stall cell within a few rotor revolutions [5,6,7]. The second type is a disturbance with a larger length scale and is often referred to as modal oscillation [8,9]. Depending on the size and the number of stall cells, the onset of rotating stall is usually accompanied by a significant reduction of performance and high-amplitude blade vibration [10,11,12].
NSV, in contrast, is an aeroelastic mechanism that involves the interaction of small-scale disturbances with a structural blade eigenmode. These features are described as small vorticity disturbances, resembling those associated to a spike, that occur at highly throttled but aerodynamically stable operating conditions and convect in the leading edge plane from one blade to another with a distinct speed. They can lock-in with a structural blade eigenmode when their frequency in the rotating frame of reference is coincident with an eigenfrequency of the blades [3,4,13,14,15,16].
To differentiate both phenomena in experiments, extensive instrumentation in the stationary and rotating frame of reference is required. The angular frequency of an aerodynamic disturbance in the stationary frame is given by
ω a S = N a Ω a S
and can be measured using unsteady pressure probes in the rotor casing. The respective propagation speed Ω a S can be derived based on cross-correlations of probes in different circumferential positions (see [17]) and used to calculate the aerodynamic wave number N a , i.e., the number of disturbances around the circumference. For rotating stall in single-stage fans and compressors, the cell count is typically reported between one and three; large multistage compressors may develop higher cell counts. Wall pressure spectra show characteristic peaks at the angular frequency of propagation (≈EO0.5 to EO0.8) and its harmonics according to Equation (1). In contrast, NSV is usually related to smaller disturbances, with a wave number slightly below the blade count [18,19,20,21]. Corresponding spectra show a rake of frequencies around half the blade passing frequency that is often, but misleadingly, referred to as rotating instabilities in the literature [13,22,23,24].
The interaction of propagating disturbances with the rotor blades can be analyzed using blade-mounted strain gauges in the rotating frame of reference. The angular frequency of an aerodynamic disturbance ω a S in the rotating frame (normalized with the shaft speed Ω r ) is given by
ω a R Ω r = ω a S Ω r N a
and lock-in with a structural mode can occur when this frequency is coincident with a blade’s eigenfrequency ω v R , i.e., when
ω v R = ω a R
Equation (3) can only be fulfilled if the inter-blade phase angle of the aerodynamic wave σ a is coherent with the structural inter-blade phase angle σ v , i.e., the difference in vibration phase between one blade and its neighbors
2 π N v N b = σ v = σ a = 2 π N a N b N v N a ( mod   N b )
This results in the aerodynamic wave N a and structural nodal diameter N v being identical if the wave number is below half the number of blades N b , otherwise aliased to N v = N b N a [4].
Based on this methodology, the following study presents an in-depth analysis of the behavior of the ECL5 fan stage close to the border of the operating range. The focus is on the transition between a purely aerodynamic phenomenon at transonic design and aeroelastic phenomenon at subsonic part speed conditions. It is shown that the fan experiences strong circumferential variations of the flow field within the investigated speed range that affects these phenomena. The aerodynamic analysis based on wall pressure data is supported by stereo particle image velocimetry (SPIV) measurements for selected operating points to highlight the significance of aerodynamic asymmetries, i.e., spatial deviations of the flow field from the cyclic symmetry of an ideal rotor assembly.
The data presented herein complements previous publications on the open-test-case ECL5 and serves as extended validation for simulations at highly throttled operating conditions.

2. Open-Test-Case ECL5

The investigated open-test-case fan stage ECL5 was designed by the Turbomachinery Department of the Ecole Centrale de Lyon and is representative of modern low-speed engine architectures. The stage consists of 16 carbon-fiber rotor blades and 31 aluminum outlet guide vanes (OGVs). The aerodynamic design point targets a standard mass flow rate of 36.0 kg/s at 11,000 rpm with a total pressure ratio of 1.35 and an isentropic efficiency of 92%. At this condition, the rotor is running transonic with a relative tip Mach number of approximately 1.
The open-test-case was investigated within the European CleanSky-2 project CATANA (Composite Aeroelastics and Aeroacoustics, catana.ec-lyon.fr) with the goal to identify and characterize the multi-physical interactions between aerodynamics, acoustics, and structural dynamics in the context of future ultra-high bypass ratio (UHBR) engines, with a special focus on NSV.
A total of 48 blades were manufactured and inspected using a 3D scanner and frequency response based on ping tests. This process determined individual static moments, mass, and eigenfrequencies, enabling a thorough selection to build different rotor configurations. The blades for the reference configuration (CATREF) were chosen with the goal to assemble a structurally tuned rotor. The respective aerodynamic performance and aeroelastic stability are detailed in [25,26].
To quantify the sensitivity of observed aerodynamic and aeroelastic phenomena to intentional structural mistuning (i.e., increased variation of eigenfrequencies of mode 1, 2, and 3), the fan configuration CATMIS was experimentally tested. The study presented in [27] provides a detailed comparison of both rotor configurations at highly throttled operating conditions at 80% speed, highlighting a phenomenologically similar aeroelastic behavior regarding observed vibration modes and corresponding nodal diameters. Measured differences in vibration amplitudes could be attributed to (unintended) local deviations in the aerodynamic field at the blade tip caused by manufacturing inaccuracies (correlations of tip geometry and flow field variations are discussed in Section 3.1 and Section 3.2), which were found to be more important than the introduced structural mistuning.
In this study, the mistuned configuration was used to investigate the transition of operating range limiting mechanisms between high subsonic and transonic conditions. The paper comprises a short introduction of the test setup and employed methods, followed by a detailed decomposition of aerodynamic and aeroelastic characteristics at highly throttled conditions. The reader is referred to previous publications for details on permanent instrumentation and test case design.

2.1. Test Facility and Instrumentation

The experiments with the open-test-case were conducted on the facility ECL-B3/Phare-2 at Ecole Centrale de Lyon (ECL). As schematically shown in Figure 1, the facility is operated in an open cycle and driven by an electric motor with a maximum power of 3MW, as detailed in [28]. The core section is located in an anechoic chamber, and a turbulence control screen (TCS) is installed in front of the intake to ensure homogeneous inflow conditions [29].
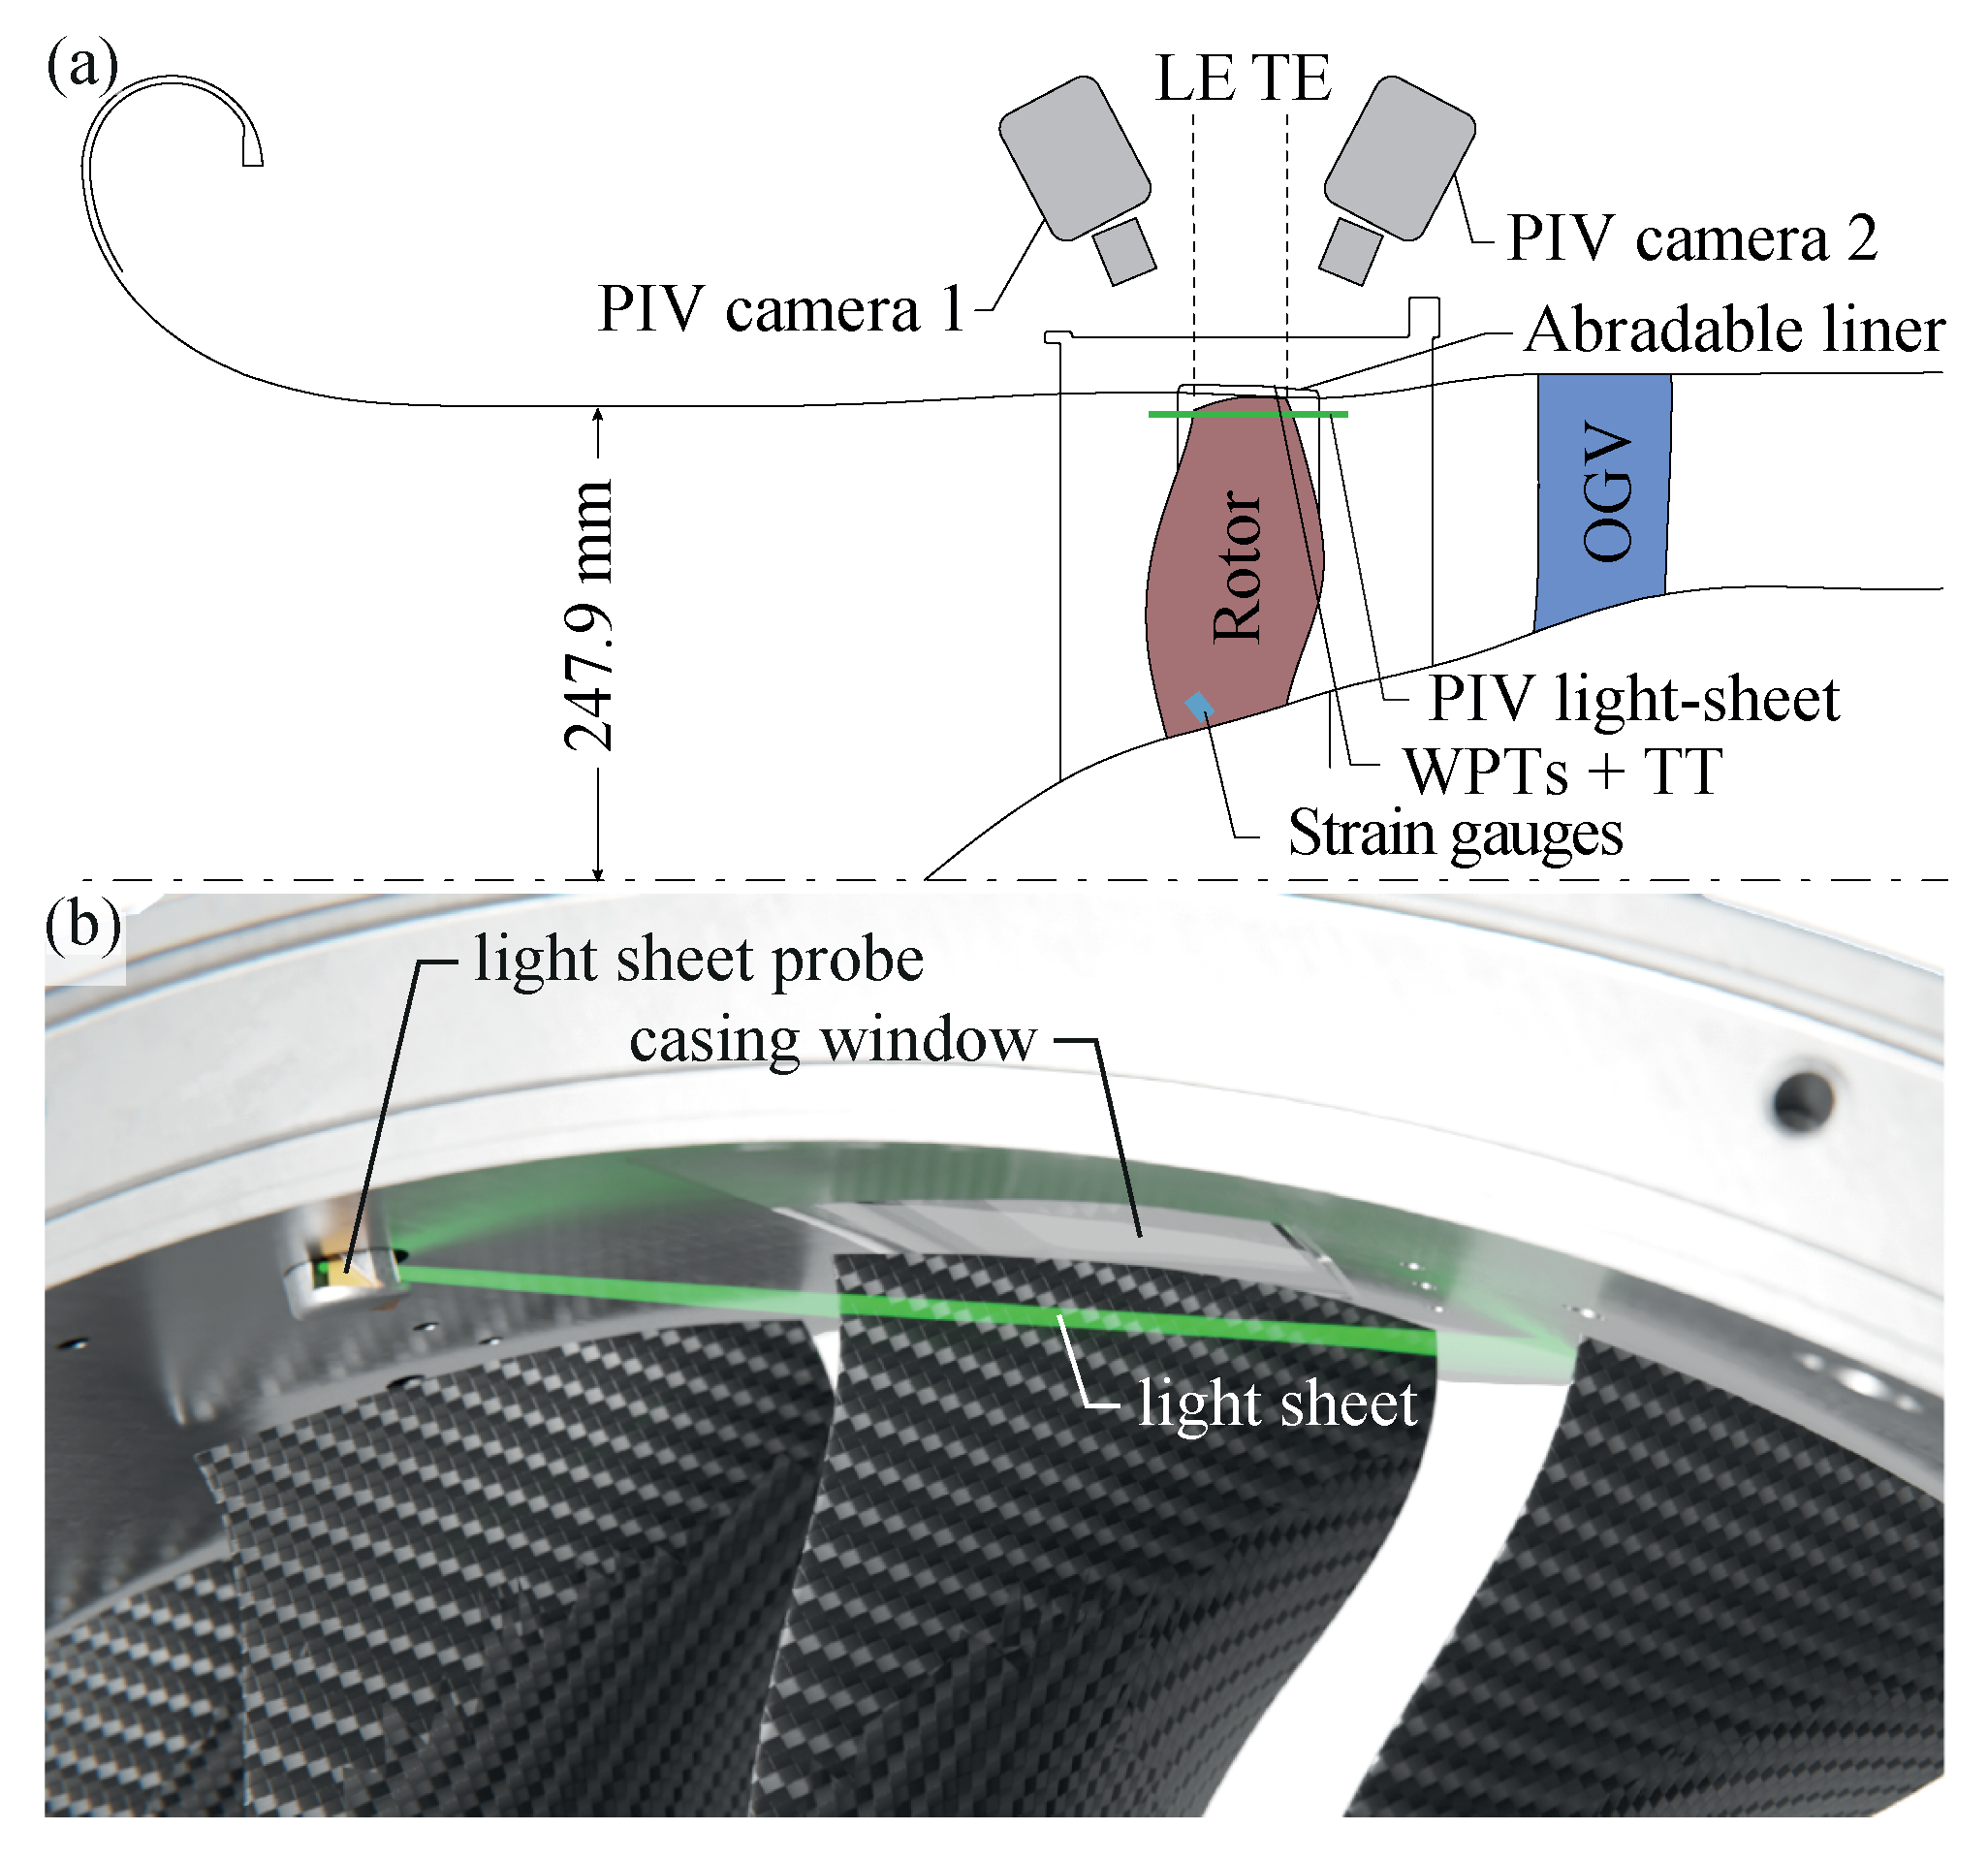
A schematic illustration of the instrumentation of the core section is provided in Figure 2, focusing on the instrumentation in the rotor section. A commercial capacitive tip timing/tip clearance system provided by MTU [30] is used to derive blade individual tip clearances and stagger angles during experiments. A multitude of unsteady wall pressure transducers (WPTs) in different axial and circumferential positions allows for the analysis of the flow field at the blade tip as well as to derive the characteristics of propagating disturbances (wave number and propagation speed). During machine operation, in particular for investigations of the highly throttled operating conditions, unsteady pressure signals are online-monitored to detect the onset of rotating stall. Blade-mounted strain gauge signals are used simultaneously to derive blade vibration amplitudes and frequencies to ensure structural integrity.
The light-sheet for the PIV measurements is introduced via a probe slightly upstream of the leading edge plane, and optical access for the cameras is provided by a casing window in the rotor section as presented in Figure 2b. In the following, the PIV setup is described in more detail; further information on all other measurement systems can be found in [28].

2.2. Stereo-PIV Setup

Particle image velocimetry (PIV) is an optical measurement technique that is used to derive velocity fields. The flow is enriched with petroleum oil fog (seeding particles), illuminated in one plane using a light-sheet optic and an Nd:YAG double-pulse laser (Bernoulli-PIV 200-15, Litron Lasers, wave length 532 nm) and recorded with a double-frame camera (LaVision Imager sCMOS resolution 2560 × 2160 px). Image cross-correlation methods are used to convert particle displacements between the first and the second frame into two-dimensional velocity fields based on the time delay between both images. Using a second double-frame camera with a different angle of view with respect to the illuminated plane enables the calculation of the third velocity component perpendicular to the measurement plane using stereo-reconstruction [31].
The experimental setup used for the stereo-PIV measurements is shown in Figure 2, providing a light-sheet position at approximately 93% channel height. The angle between both cameras is approximately 35°, resulting in higher uncertainties of the velocity component normal to the light-sheet plane [31]. To align the focal plane of the cameras with the illuminated plane, Scheimpflug adapters (LaVision) are utilized. The cameras are calibrated using a three-dimensional calibration target and refined after image acquisition using a self-calibration procedure with recorded particle images to compensate for potential misalignment between the light sheet and the calibration target as described by [32].
Seeding particles are introduced in the facility chamber. Vaporization of petroleum-based smoke oil provides particles with a diameter of 200 to 300 nm.
The system enables the acquisition of images with a fixed phase angle with respect to the rotor. This is required to derive statistically reliable velocity fields by recording several images at the same angular position (here, 100 images were recorded per phase angle).

2.3. Stereo-PIV Measurement Procedure and Post-Processing

The setup described above was used to record two double-frames (one for each camera) of the illuminated particles in the light-sheet plane using the acquisition parameters summarized in Table 1.

2.3.1. Image Pre-Processing, Cross-Correlation, and Post-Processing of Velocity Fields

To improve the quality of the recorded raw images, digital image processing methods were applied to correct camera and machine vibrations and to reduce reflections and noise [16].
After the pre-treatment, image cross-correlations were performed for each camera individually. To achieve a robust velocity detection for complex three-dimensional flows, a multi-grid procedure with decreasing interrogation window sizes was chosen, yielding a final resolution of 32 × 32 px, corresponding to approximately 1.34 × 1.34 mm.
Based on this procedure, one two-dimensional velocity field was obtained for each camera that corresponds to the projection of the actual three-dimensional field to the respective measurement planes. These velocity fields are used for a stereo-reconstruction as described in [31], which allows to calculate both in-plane velocity components u and v as well as the third velocity component w perpendicular to the light-sheet plane. Subsequently, this velocity field is transformed from the coordinate system, which is aligned with the calibration target, to the machine coordinate system with the components c ax , c θ and c r in axial, circumferential, and radial directions, respectively. The flow in the rotor relative frame of reference can be analyzed by subtracting the rotational speed U rot = Ω r   ·   r from the circumferential velocity component c θ . The relative in-plane velocity is then given by
c rel = c ax 2 + ( c θ U rot ) 2
To account for changes in atmospheric conditions, velocities are standardized with respect to measured total pressure and temperature in the facility chamber.

2.3.2. Phase Angle Superposition

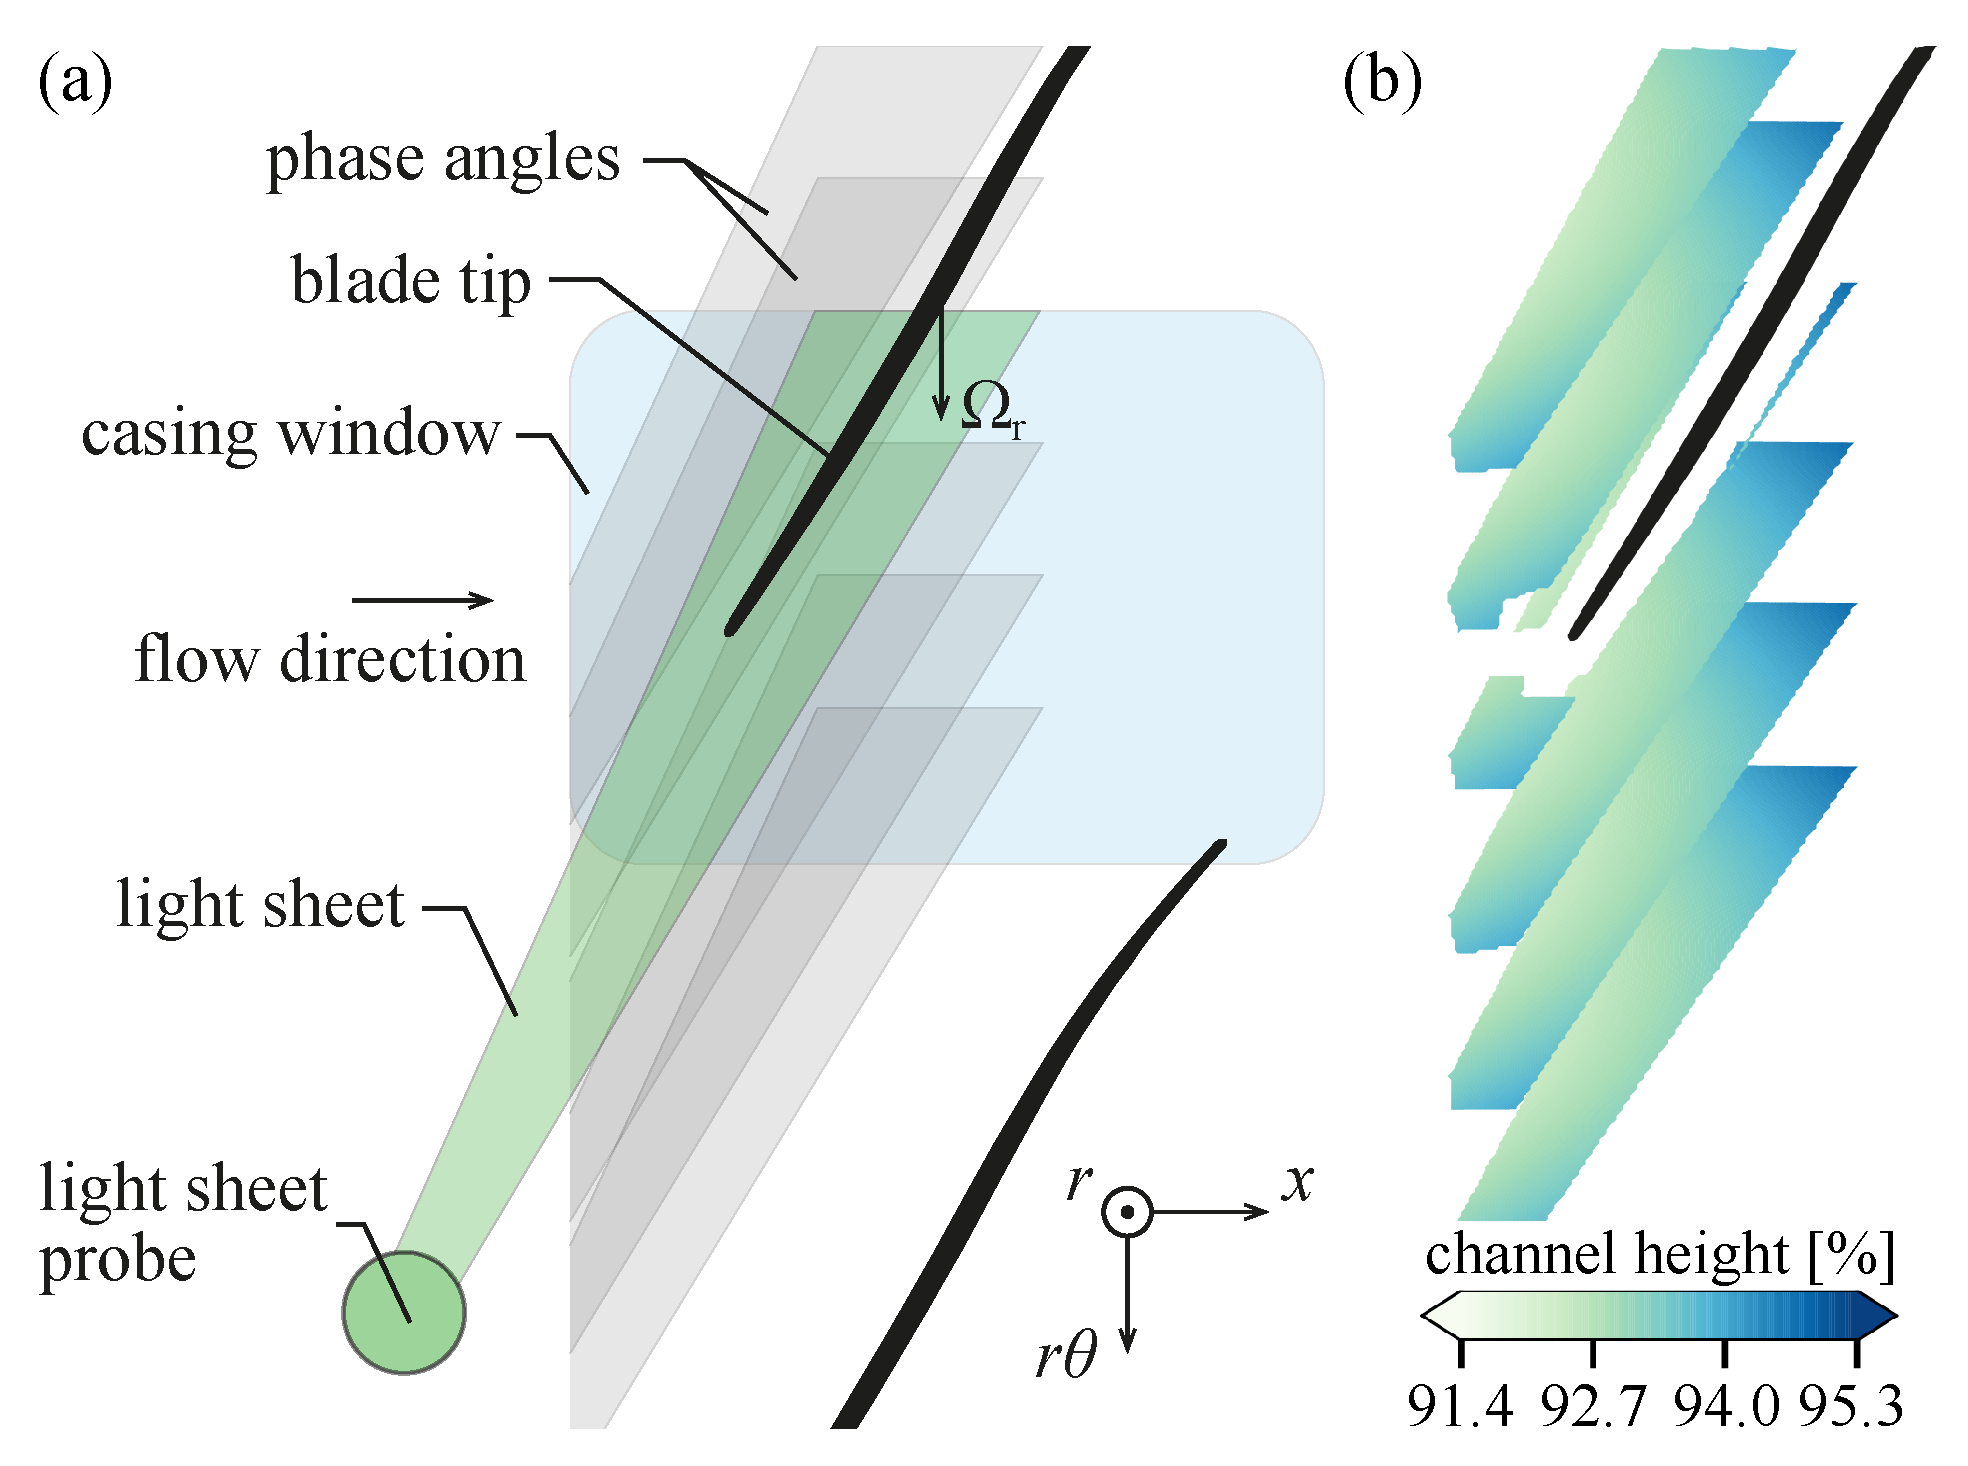
As schematically illustrated in Figure 3, the field of view of a single recording with a fixed angular position of the light sheet with respect to the rotor is limited, and multiple phase angles (i.e., angular positions with respect to the once-per-revolution trigger) are required to cover a full blade passage. After transformation to the machine coordinate system, data from different phase angles can be superimposed. To simplify visualization, data is projected to the x, r θ -plane at a constant radius. This projection results in a direct superposition of values from different channel heights, as visible in Figure 3b, showing the variation of the radius r within one phase angle and arising steps between adjacent angular measurement positions. They can cause discontinuities in the presented velocity contours between overlapping phase angles due to the presence of strong gradients in the flow field.

2.3.3. Measurement Uncertainty

The measurement conditions in the facility are far from ideal due to reflections, vibrations, and seeding deposition on the casing window. As a result, the uncertainty of image correlation is estimated to be around 4% of the measured velocity components based on the study with a comparable setup in [33]. In regions of increased secondary flows and mixing, particle segregation and reduced raw image quality can lead to locally higher uncertainties of up to 10% within individual frames, in particular at throttled operating conditions.
Further parameters that affect the overall accuracy of PIV measurements are (a) the spatial measurement uncertainty, i.e., the position of measured flow features such as the compression shock with respect to the blade, caused by particle inertia (see [34]) and (b) the transformation to the machine coordinate system, which causes inaccuracies as a result of variations of the rotor blade with the respect to the laser pulse (due to trigger inaccuracies) or slight deviations of the light-sheet position (due to machine vibration).
Even if described errors of measured instantaneous velocity fields are quite high compared to other instrumentation systems, the acquisition of 100 individual images per recording and the application of an outlier detection yields reliable averaged velocity fields; i.e., all PIV measurements presented below show converged statistical quantities. The average velocity is considered converged when the cumulative sliding average is within a ±1m/s range (approx. 0.5% with respect to the lowest velocity) with respect to the average of all images; for the standard deviation, a range of ±0.5 m/s is considered. In a large part of the measurement area, 40 images are sufficient to achieve convergence, and 100 images are only required in regions of high unsteadiness. Since the focus of the presented study is the qualitative comparison of the tip flow structure at different operating points, related uncertainties are considered as acceptable.

2.4. Machine Performance

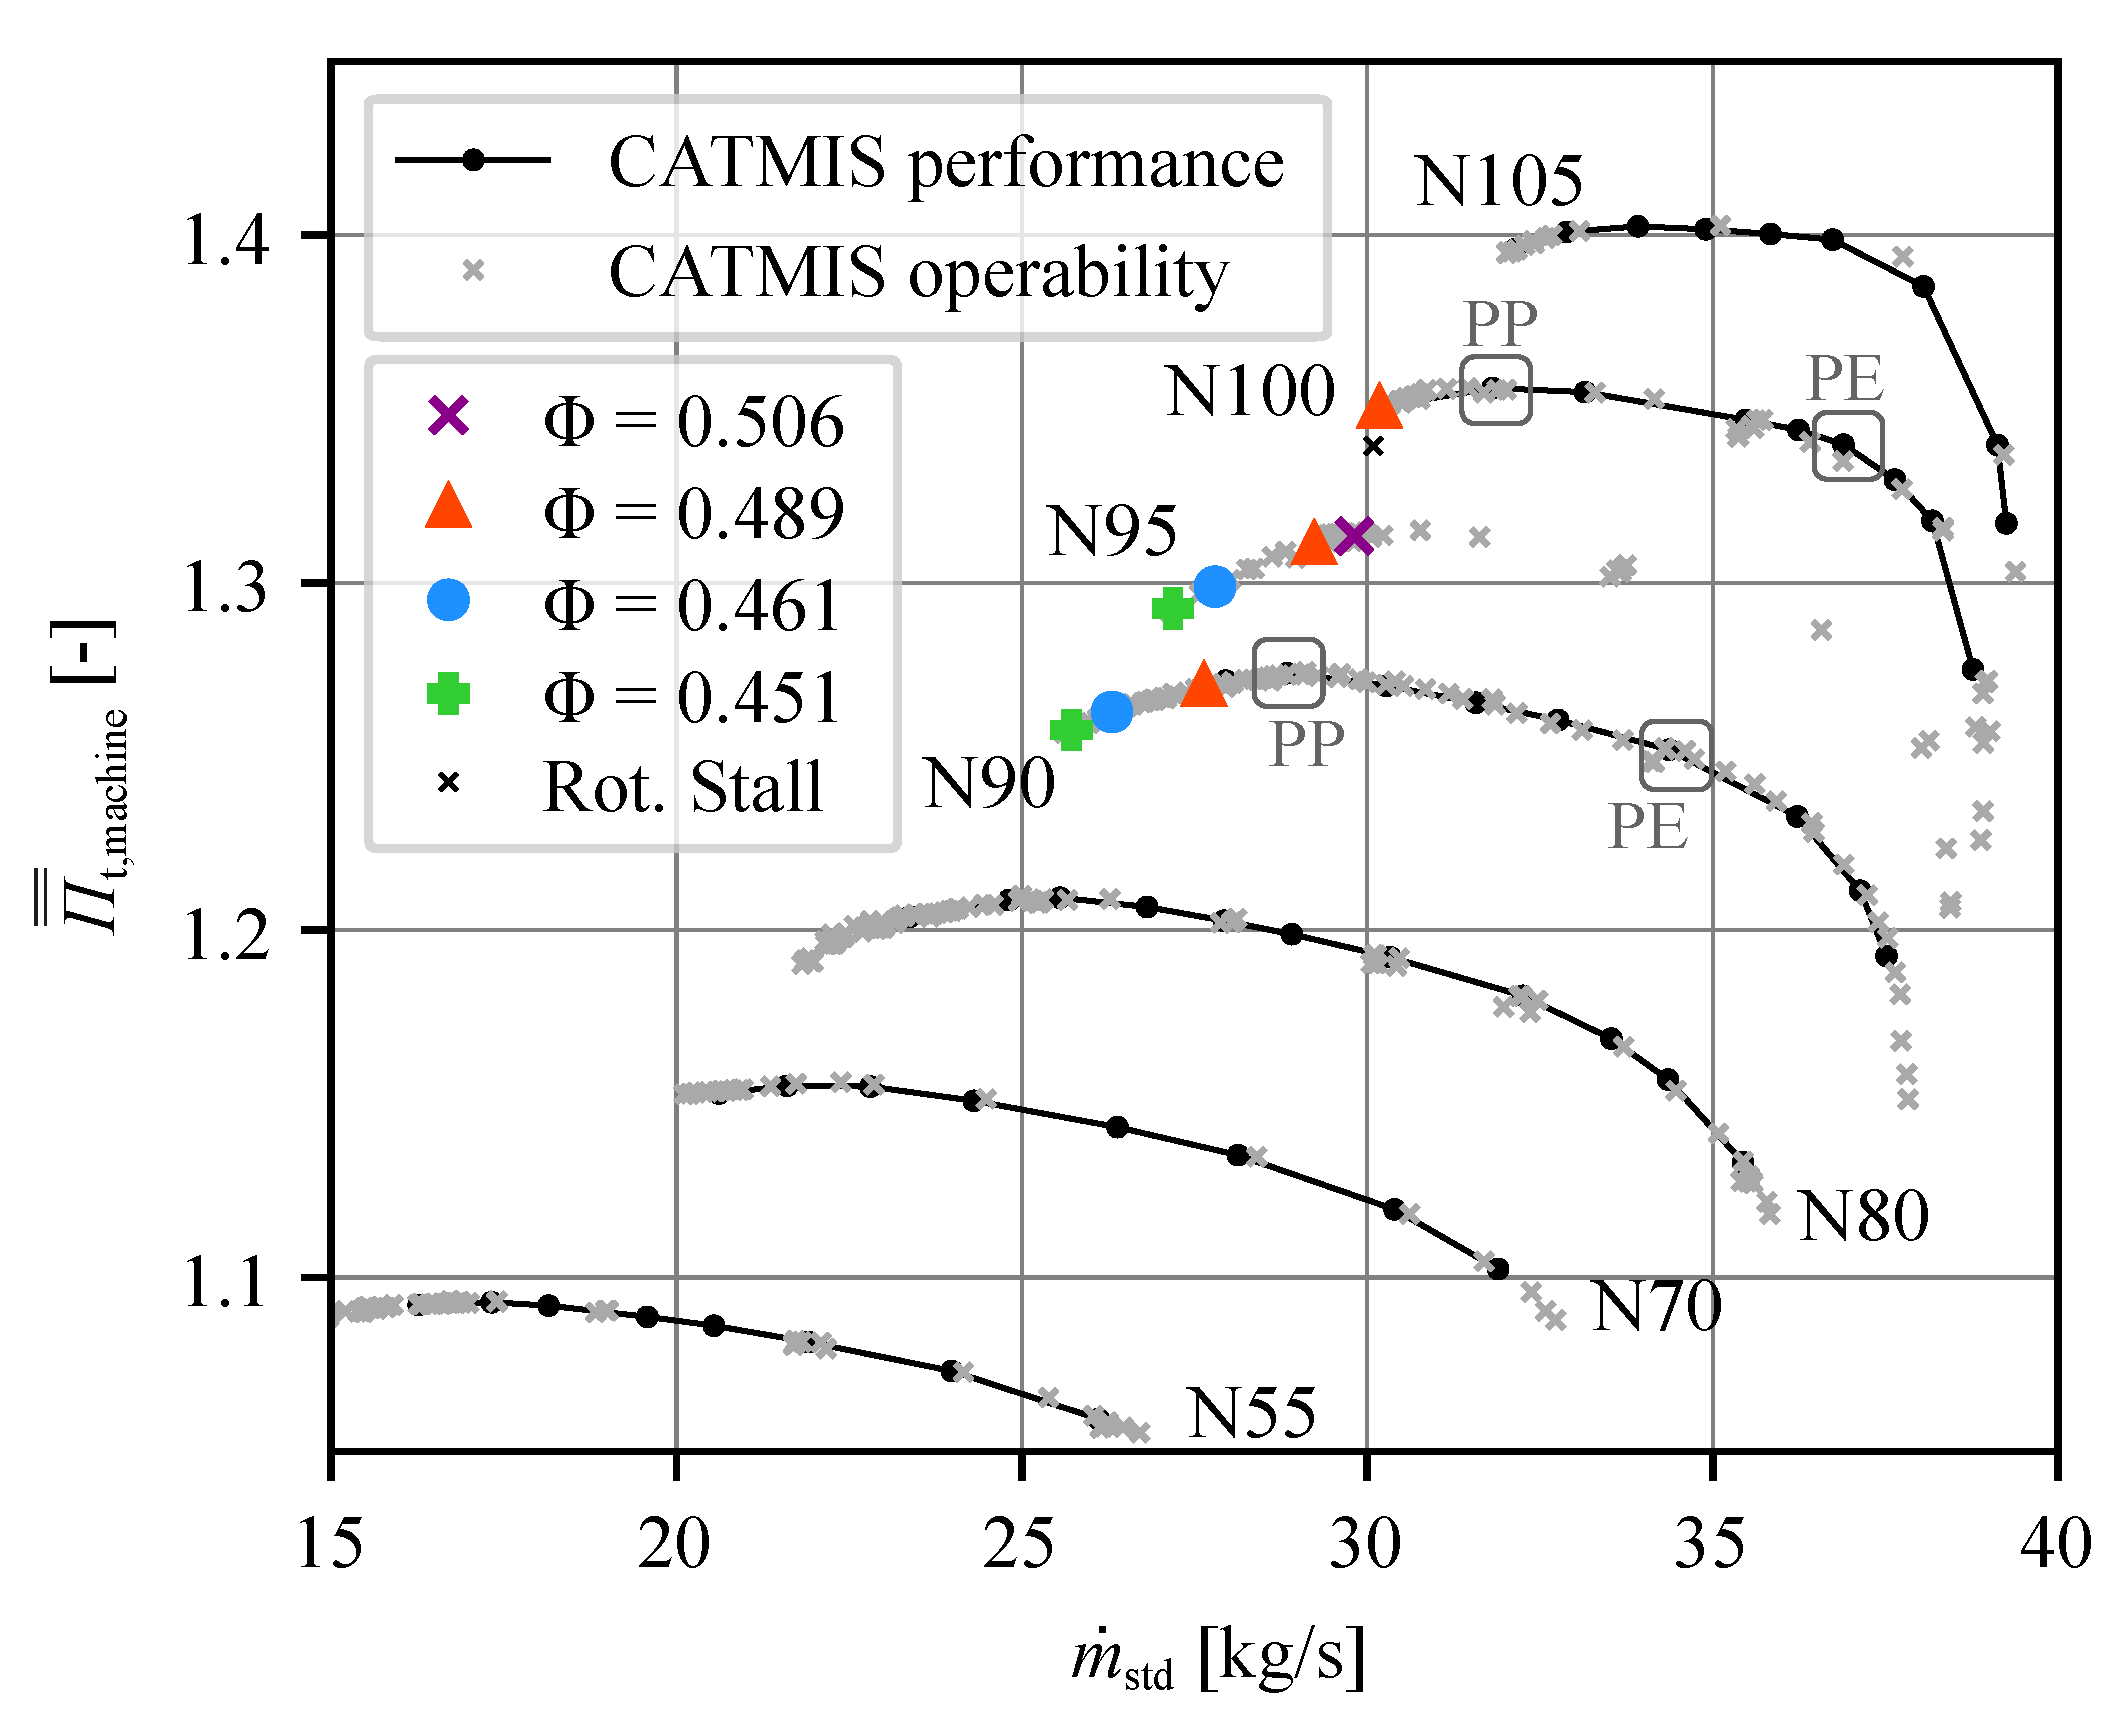
The experimental results presented in this study were obtained with the mistuned rotor CATMIS. Figure 4 shows the measured machine total pressure ratio as a function of massflow rate for different rotational speeds. Black lines correspond to performance measurements while gray crosses were obtained during operability measurements with less intrusive instrumentation (details can be found in [25,28]).
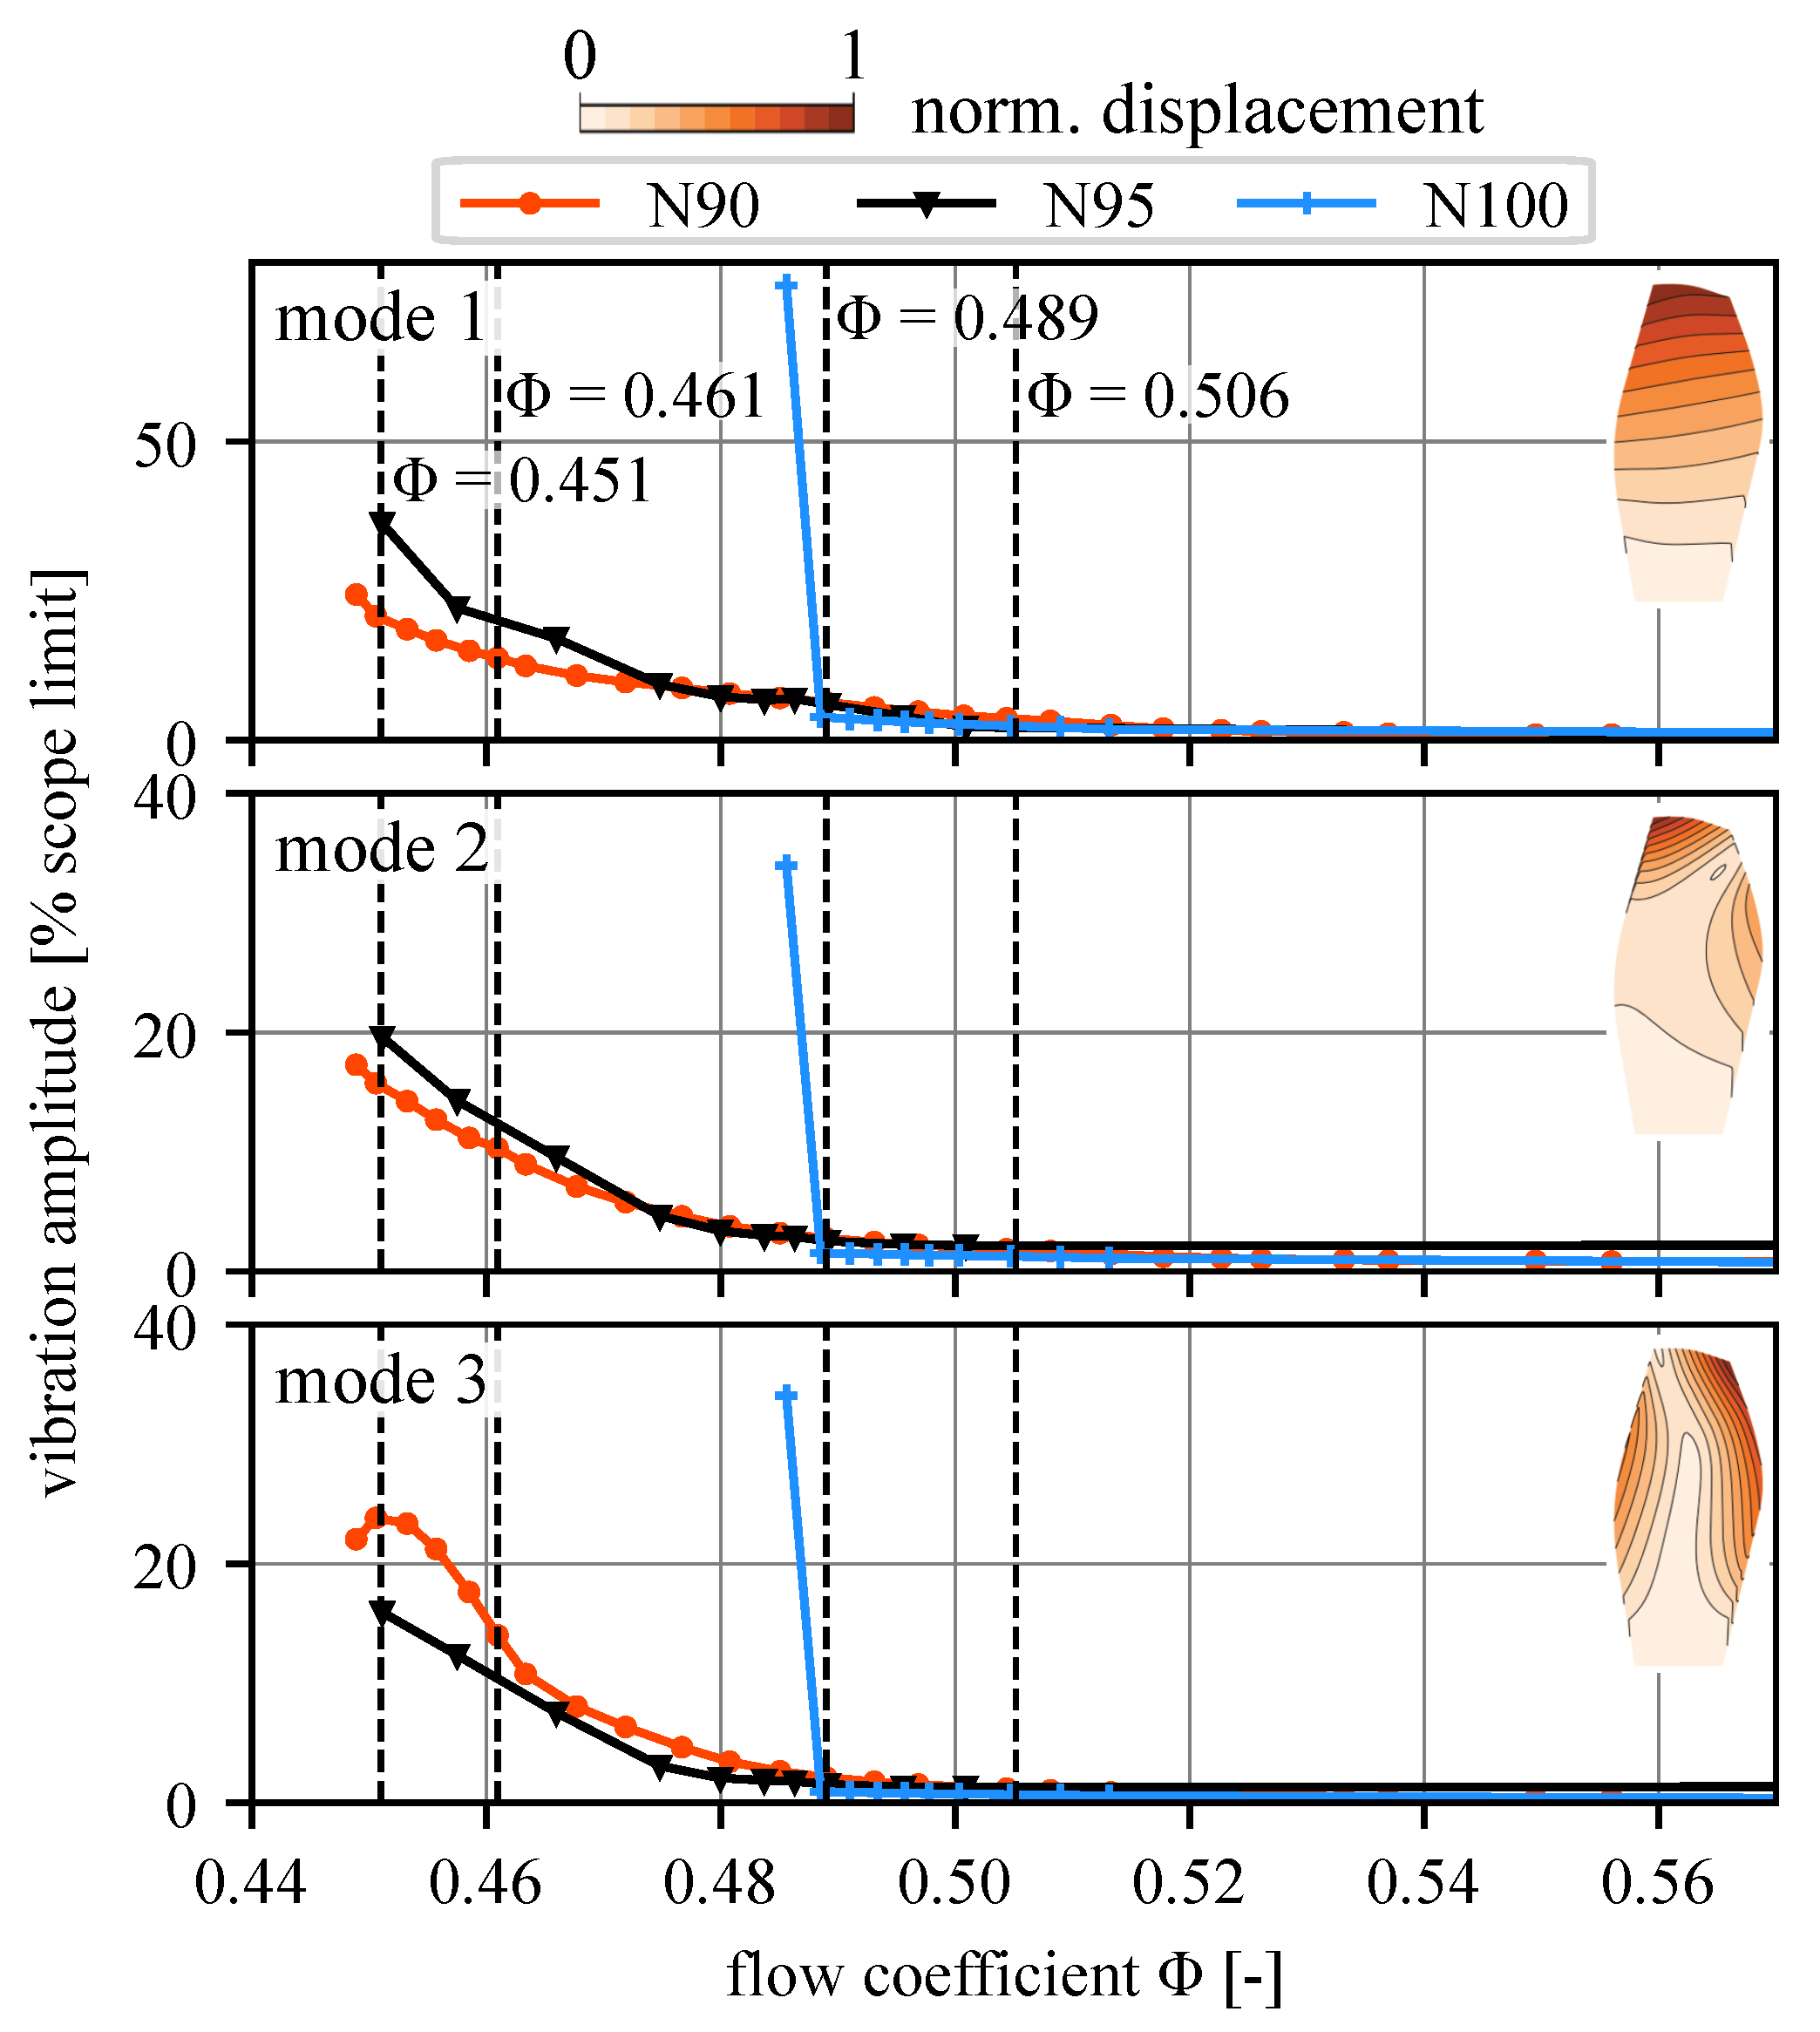
Within this study, the operating points highlighted by colored symbols at 90, 95, and 100% speed (denoted as N90, N95, and N100) are investigated in detail. For these operating points, uncertainties of measured standard massflow and total pressure ratio are below 0.2 and 0.02%, respectively, as shown in [28]. To ensure comparable throttle settings across speedlines, operating conditions at equal flow coefficients Φ = c ax / U rot are investigated, ranging from 0.506 to 0.451. As reported in [26] for the reference rotor configuration, significant differences regarding observed phenomena are observed in this region. While convective NSV is encountered at subsonic part speed conditions up to 90% speed, leading to high blade vibration amplitudes, the onset of rotating stall without any vibratory precursors is observed at 100% speed, where the rotor is running transonic. This behavior is visible in Figure 5, showing the evolution of average vibration amplitude of mode 1, 2, and 3 as a function of flow coefficient Φ for the mistuned rotor configuration. In this figure, the vibration amplitude of each mode is scaled with respect to the maximum allowed strain at the strain gauge position, i.e., in percentage scope limit. This scaling requires an accurate FEM model of the fan, a calibration of each strain gauge, and a correction to account for the influence of FFT evaluation parameters as discussed in detail in [35,36].
Figure 5 shows that at 90% speed, vibration amplitudes rise continuously from Φ = 0.52 , while they are negligible at design speed until a sharp rise occurs due to the onset of rotating stall at Φ = 0.489 . The amplitude evolution of N95 is comparable to the N90 case, but with increased amplitudes of modes 1 and 2 and decreased amplitudes of mode 3. This is attributed to the fact that rotating stall is observed prior to the occurrence of NSV signatures at this speedline, as is discussed in detail below. To better understand the transition between subsonic and transonic operations related changes in observed phenomena, a comprehensive analysis of the operating points highlighted in Figure 4 is presented in Section 3.2.
In a first step, wall pressure data, which is usually used to derive the flow characteristics at the blade tip, is compared to SPIV measurements in Section 3.1 for two different operating points at design speed. This allows to validate whether the footprint of the flow captured at the casing provides an accurate representation of the complex three-dimensional flow at the rotor tip. At the same time, SPIV measurements at highly throttled operating conditions did not yield satisfying results due to excessive condensation and oil deposition on the casing window in the area of interest and, thus, cannot be used for the analysis of all operating points highlighted in Figure 4. Hence, the cross-validation provided in Section 3.1 aims to prove that wall pressure measurements provide an adequate description of the aerodynamic field and are suitable for an in-depth analysis of blade tip aerodynamics. Particular focus is laid on the resolution of aerodynamic asymmetries, which are caused by geometrical blade-to-blade variations due to manufacturing inaccuracies (these geometrical variations are, hence, unintended and not correlated to the structural mistuning of the rotor). They can affect the behavior at throttled operating conditions as is discussed in Section 3.2.

3. Results

In the first part of this section, wall pressure measurements are compared to SPIV measurements at design speed. The second part focuses on the investigation of the operating points marked in Figure 4.

3.1. Cross-Validation of Measurement Systems

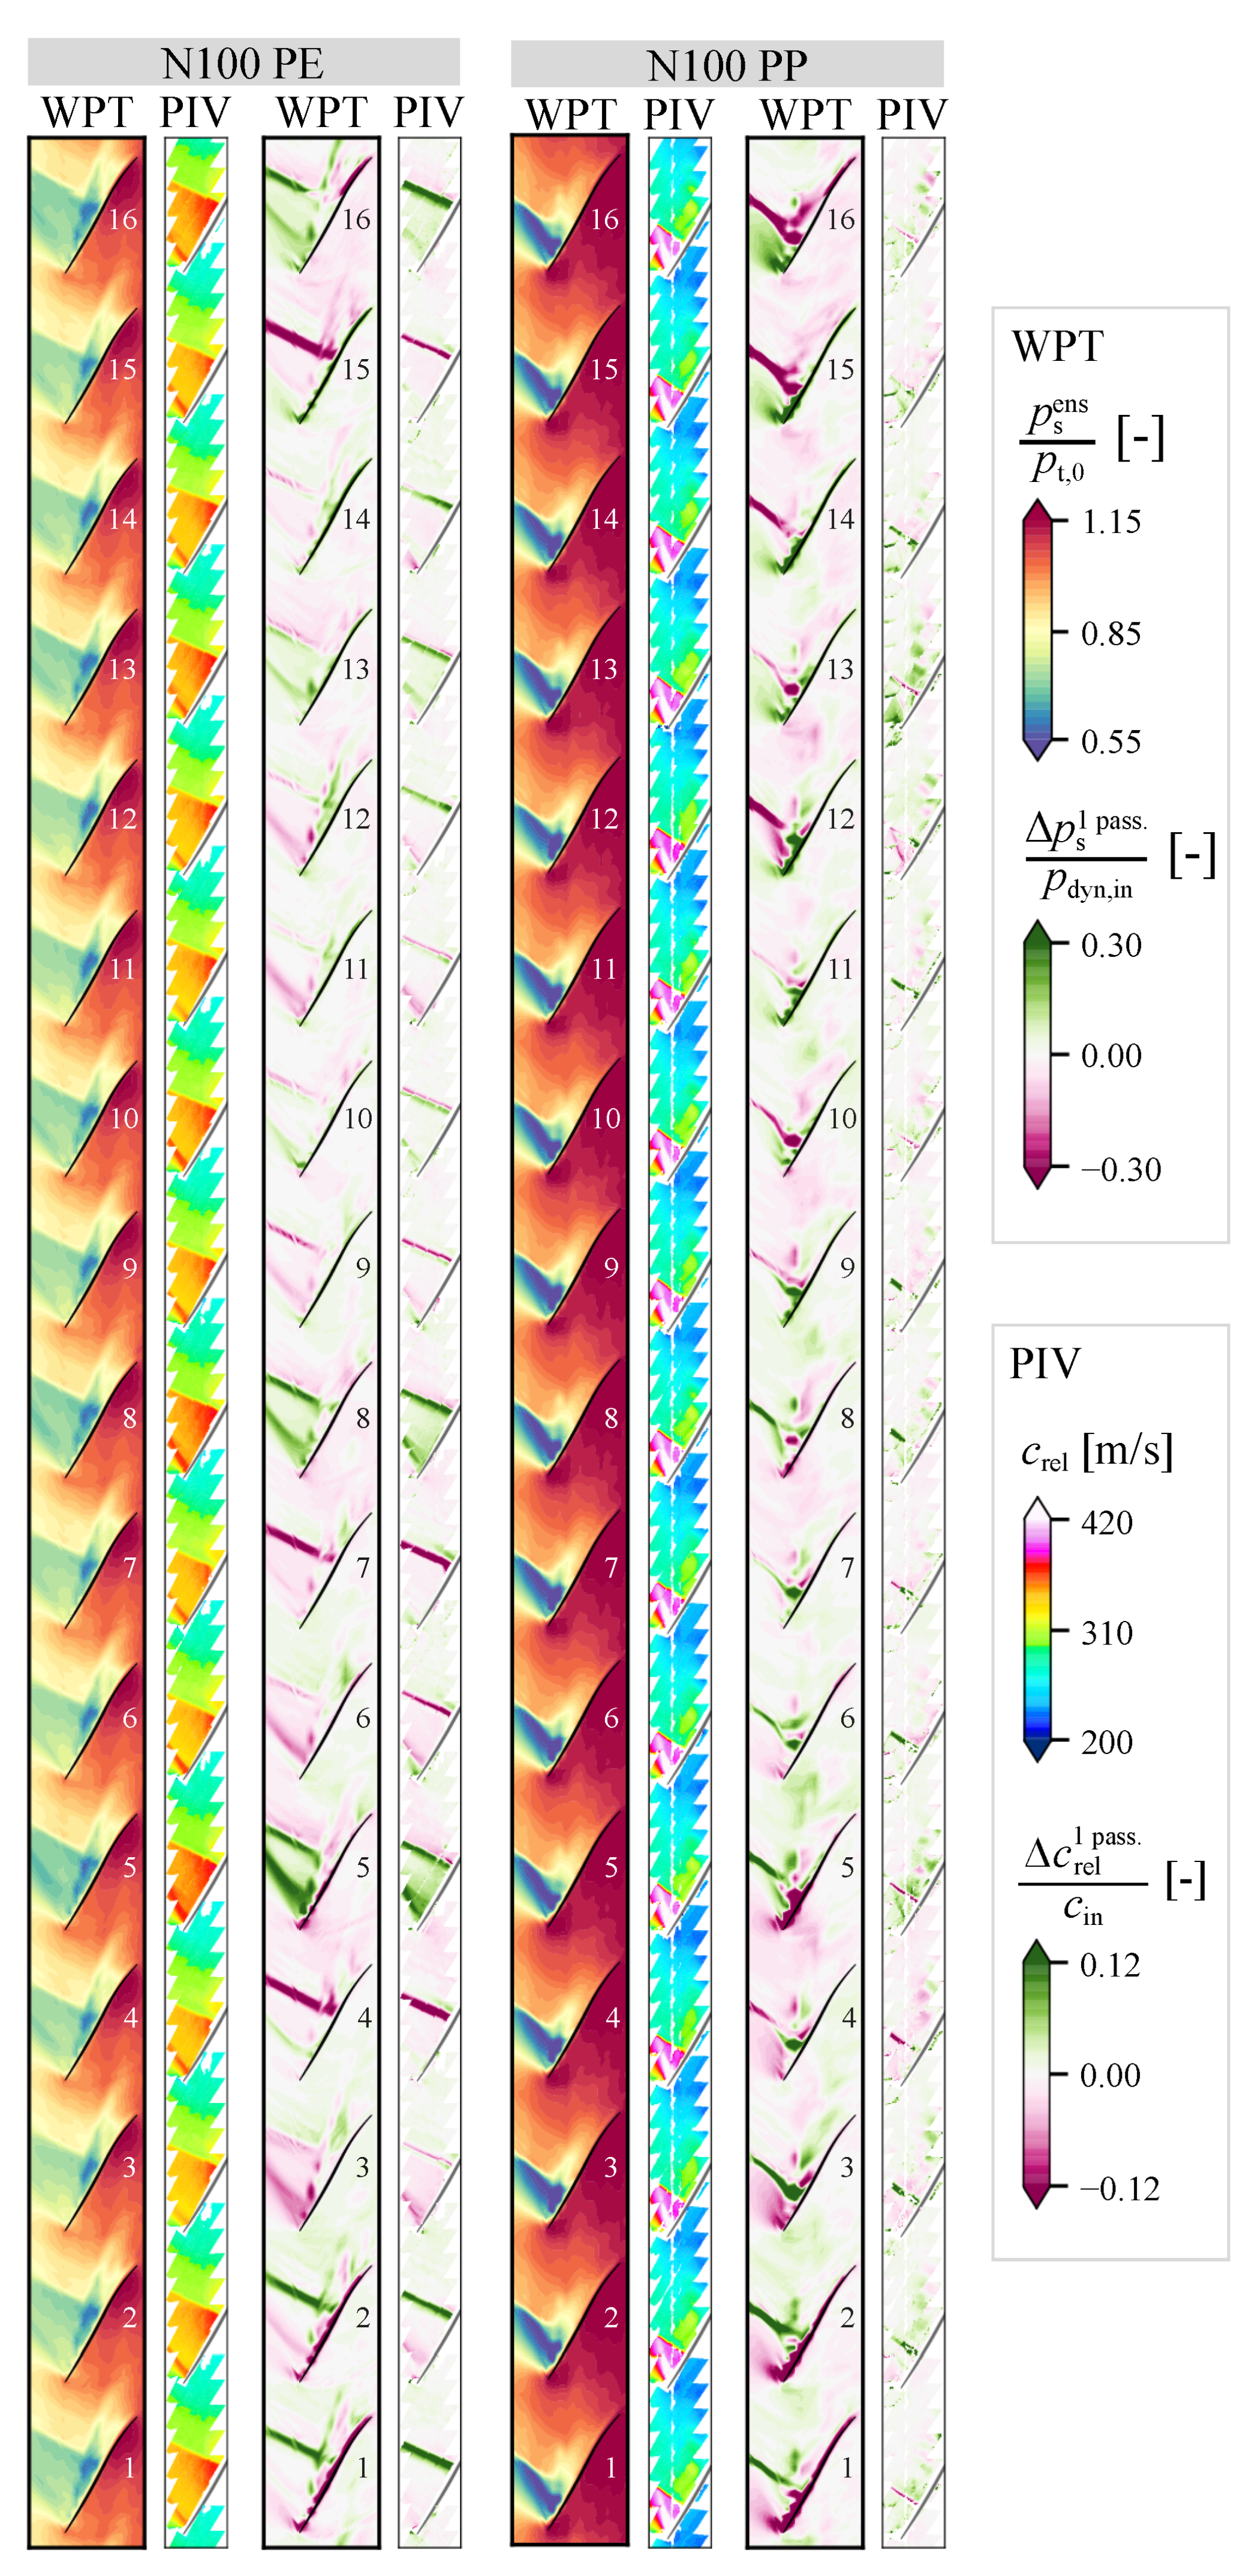
For the validation of wall pressure data, SPIV measurements consisting of 96 phase angles were performed at several operating points to cover the whole rotor and investigate local flow variations. Two of those 360° measurements that were conducted at peak efficiency (PE) and peak pressure (PP) operating conditions at design speed are presented in Figure 6 side-by-side with wall pressure measurements. On the left-hand side of each operating point; the ensemble averaged wall pressure field of 200 rotor revolutions p s ens is compared to the relative in-plane velocity c rel (average of 100 images per phase angle). The right-hand side compares the local deviation of the respective quantity of one passage Δ (   ·   ) 1 pass . from the average of all 16 blade passages to emphasize local (spatial) deviations of the flow field from the cyclic symmetry that would be observed for an ideal rotor. This quantity is referred to as aerodynamic asymmetry in the following.
Previous studies presented in [25,28] indicate based on wall pressure data that the highest aerodynamic asymmetry occurs at design speed for all ECL5 rotor configurations, reaching maximum deviations close to peak-efficiency operating conditions. The operating points shown in Figure 6 are, hence, considered suitable for the desired validation.
At peak efficiency conditions, the contours of relative in-plane velocity c rel show a strong acceleration of the flow within the supersonic expansion region on the blade’s suction sides before the flow is abruptly decelerated through the compression shock at approximately mid-chord. At this operating point, the shocks are already far detached from the leading edge of the trailing blade, and significant blade-to-blade variations of the flow field become apparent. For some blades, for example 5 and 8, the acceleration zone is larger, resulting in higher relative velocities, while other blades, for example blades 6 and 9, show reduced velocities. The corresponding wall pressure measurements consistently provide low static pressures for the first and higher static pressures for the latter in the respective regions.
The good agreement of PIV and wall pressure measurements is further confirmed by the contours of aerodynamic asymmetry. For both measurement systems, highest deviations from the all-blade average are observed in the sector from blade 4 to blade 9 and mainly attributed to variations of the shock position and the maximum velocity in the first acceleration zone close to the leading edge. For the other blades in the sector from blades 10 to 14, variations are low.
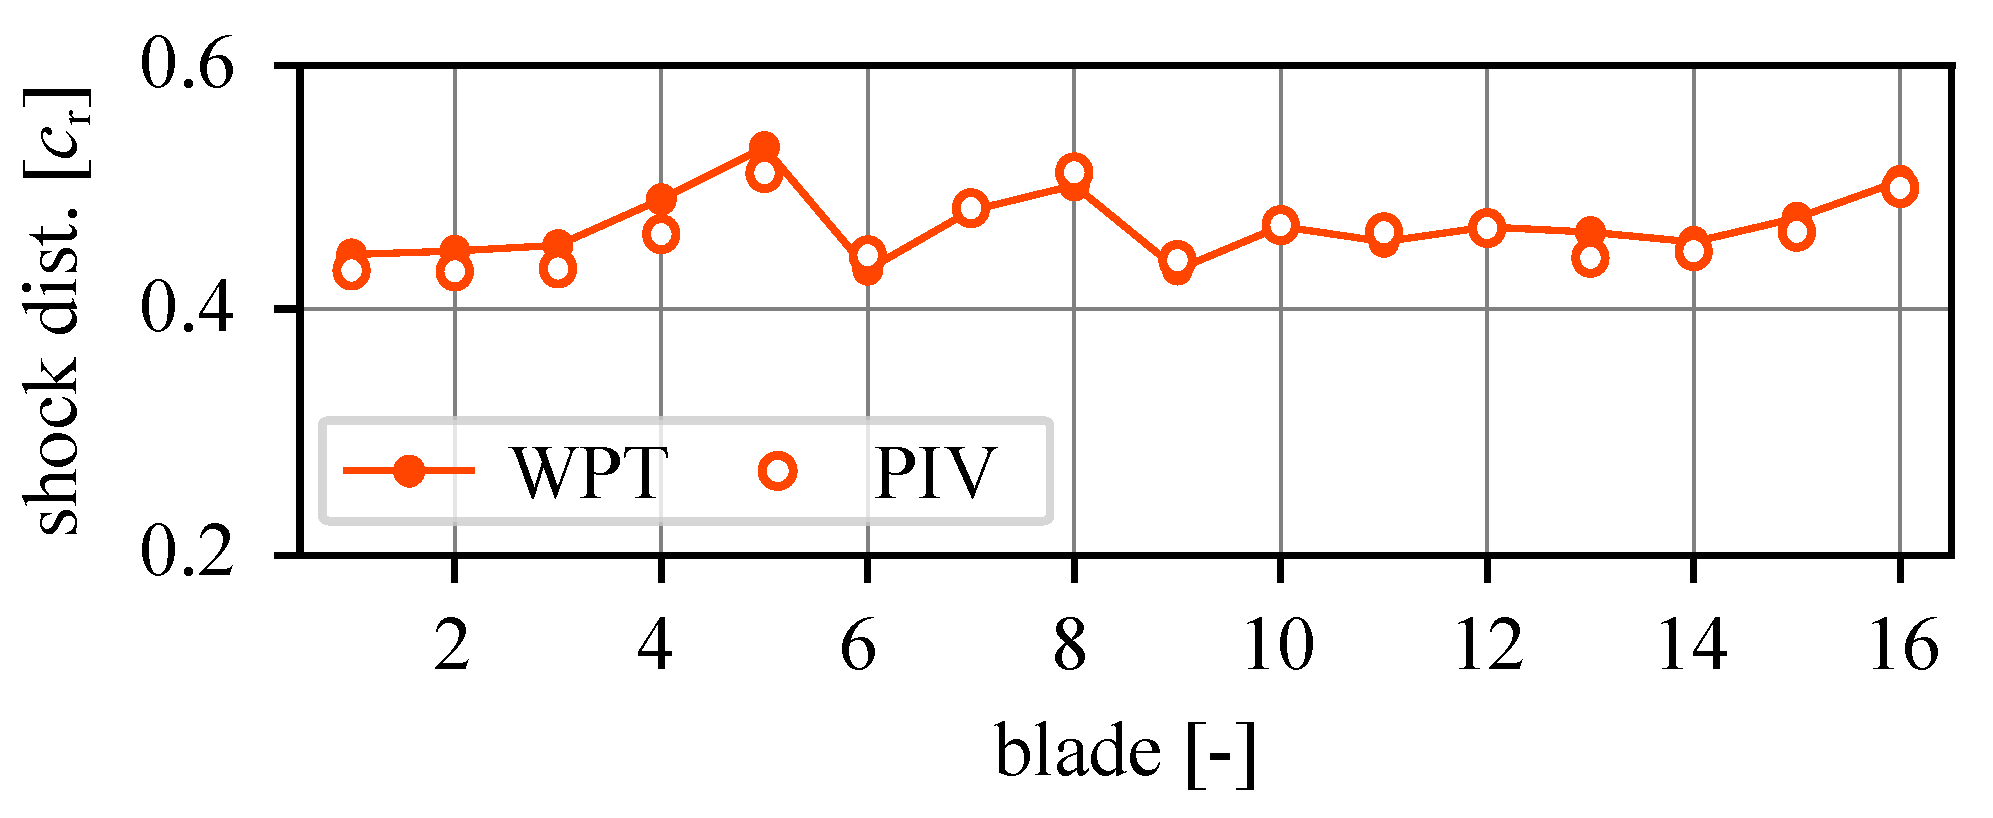
This is also visible in Figure 7, showing the shock distance (measured from the leading edge of the trailing blade) for each blade based on the measurements presented in Figure 6. While strong variations of around ±5% chord are present within the blade package 4–9, variations are below ±1% chord between blades 10 and 14. The quantitative comparison of the PIV and wall pressure data in Figure 7 further confirms the good agreement of both instrumentation systems despite different measurement locations (at the casing wall vs. at 93% channel height).
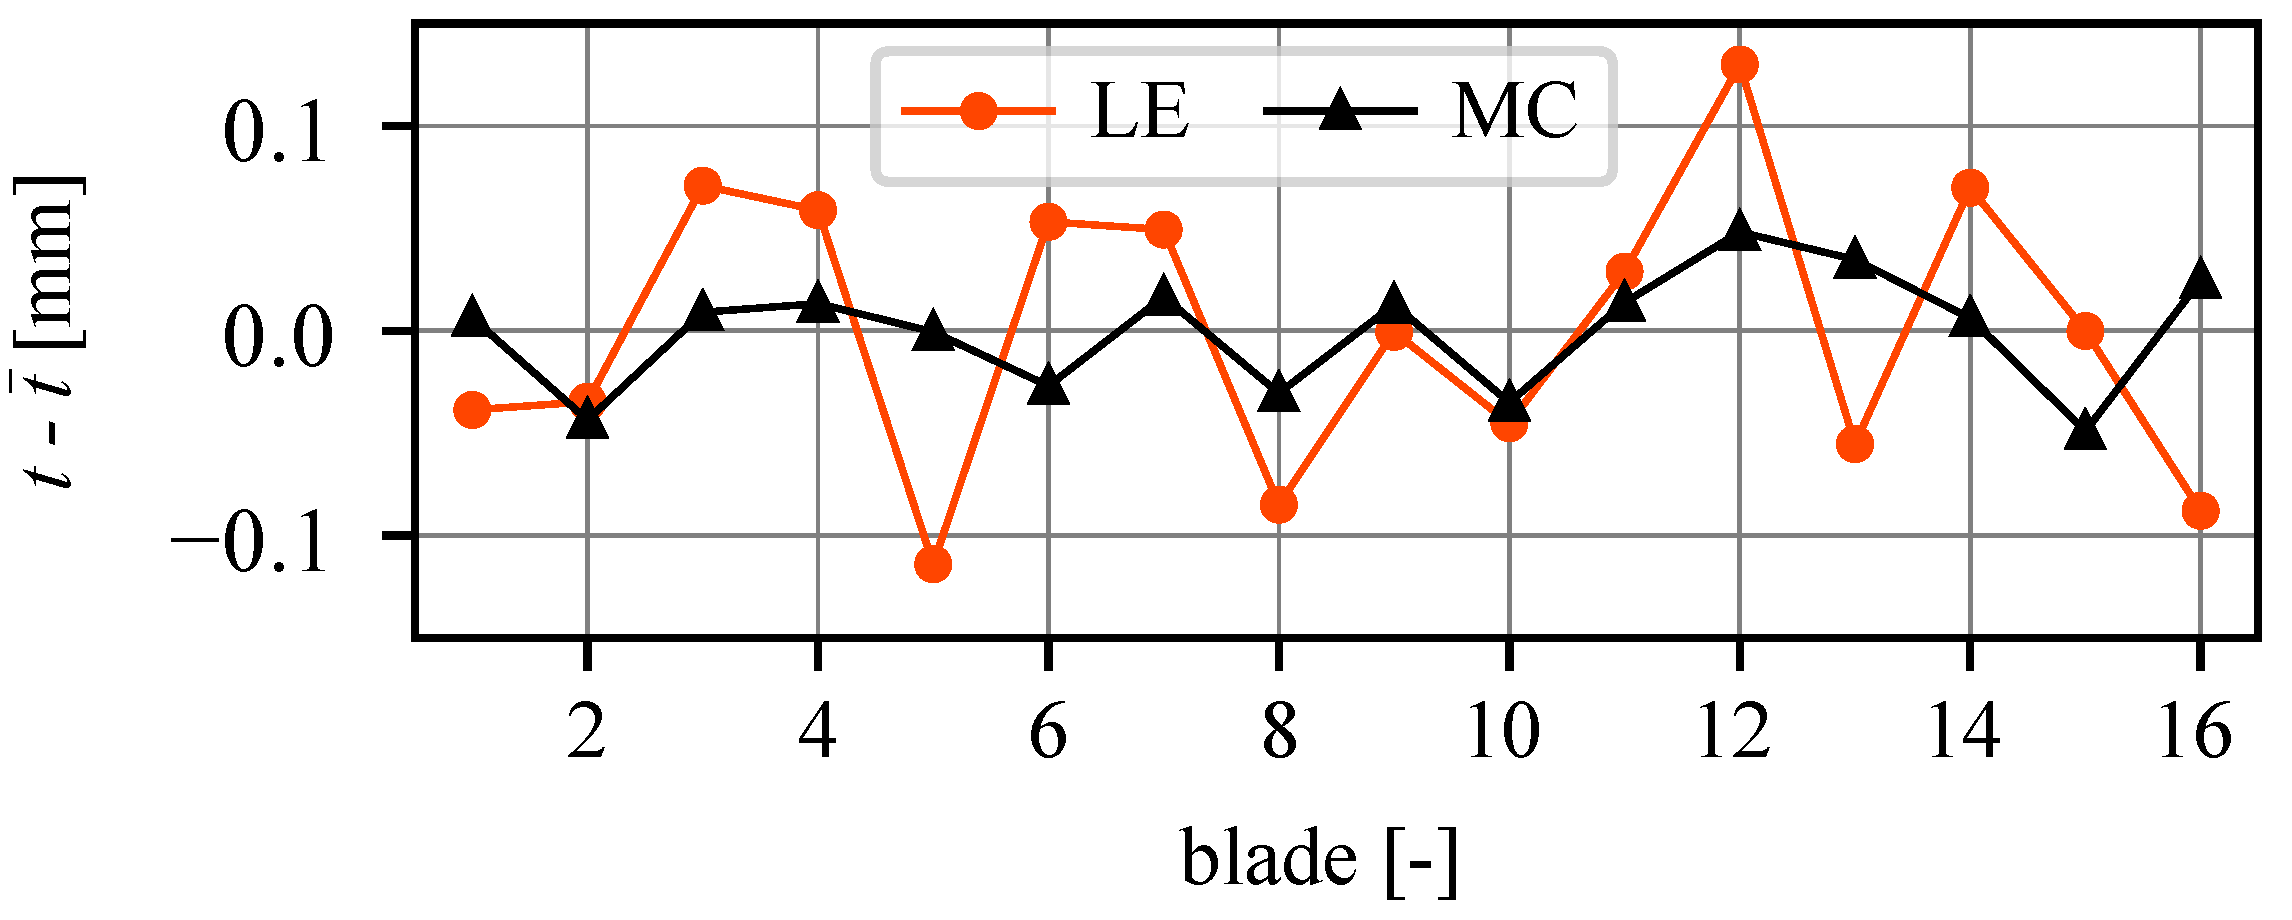
SPIV measurements provide a detailed image of the flow structure in the blade tip region and allow to derive characteristic velocities at a given channel height and to analyze correlations with the blade tip geometry. As an example, Figure 8 shows, for peak efficiency conditions at design speed, that tip clearance variations amount to approximately ±0.1 mm and ±0.05 mm at leading edge and mid chord, i.e., 10% of the respective nominal clearances (with respect to mid-chord blade height, these deviations correspond to approx. 0.1%, 0.05%, respectively). The presented blade-to-blade patterns were found during repeated measurements on different operating days within a range of ±0.01 mm and, hence, considered as significant.
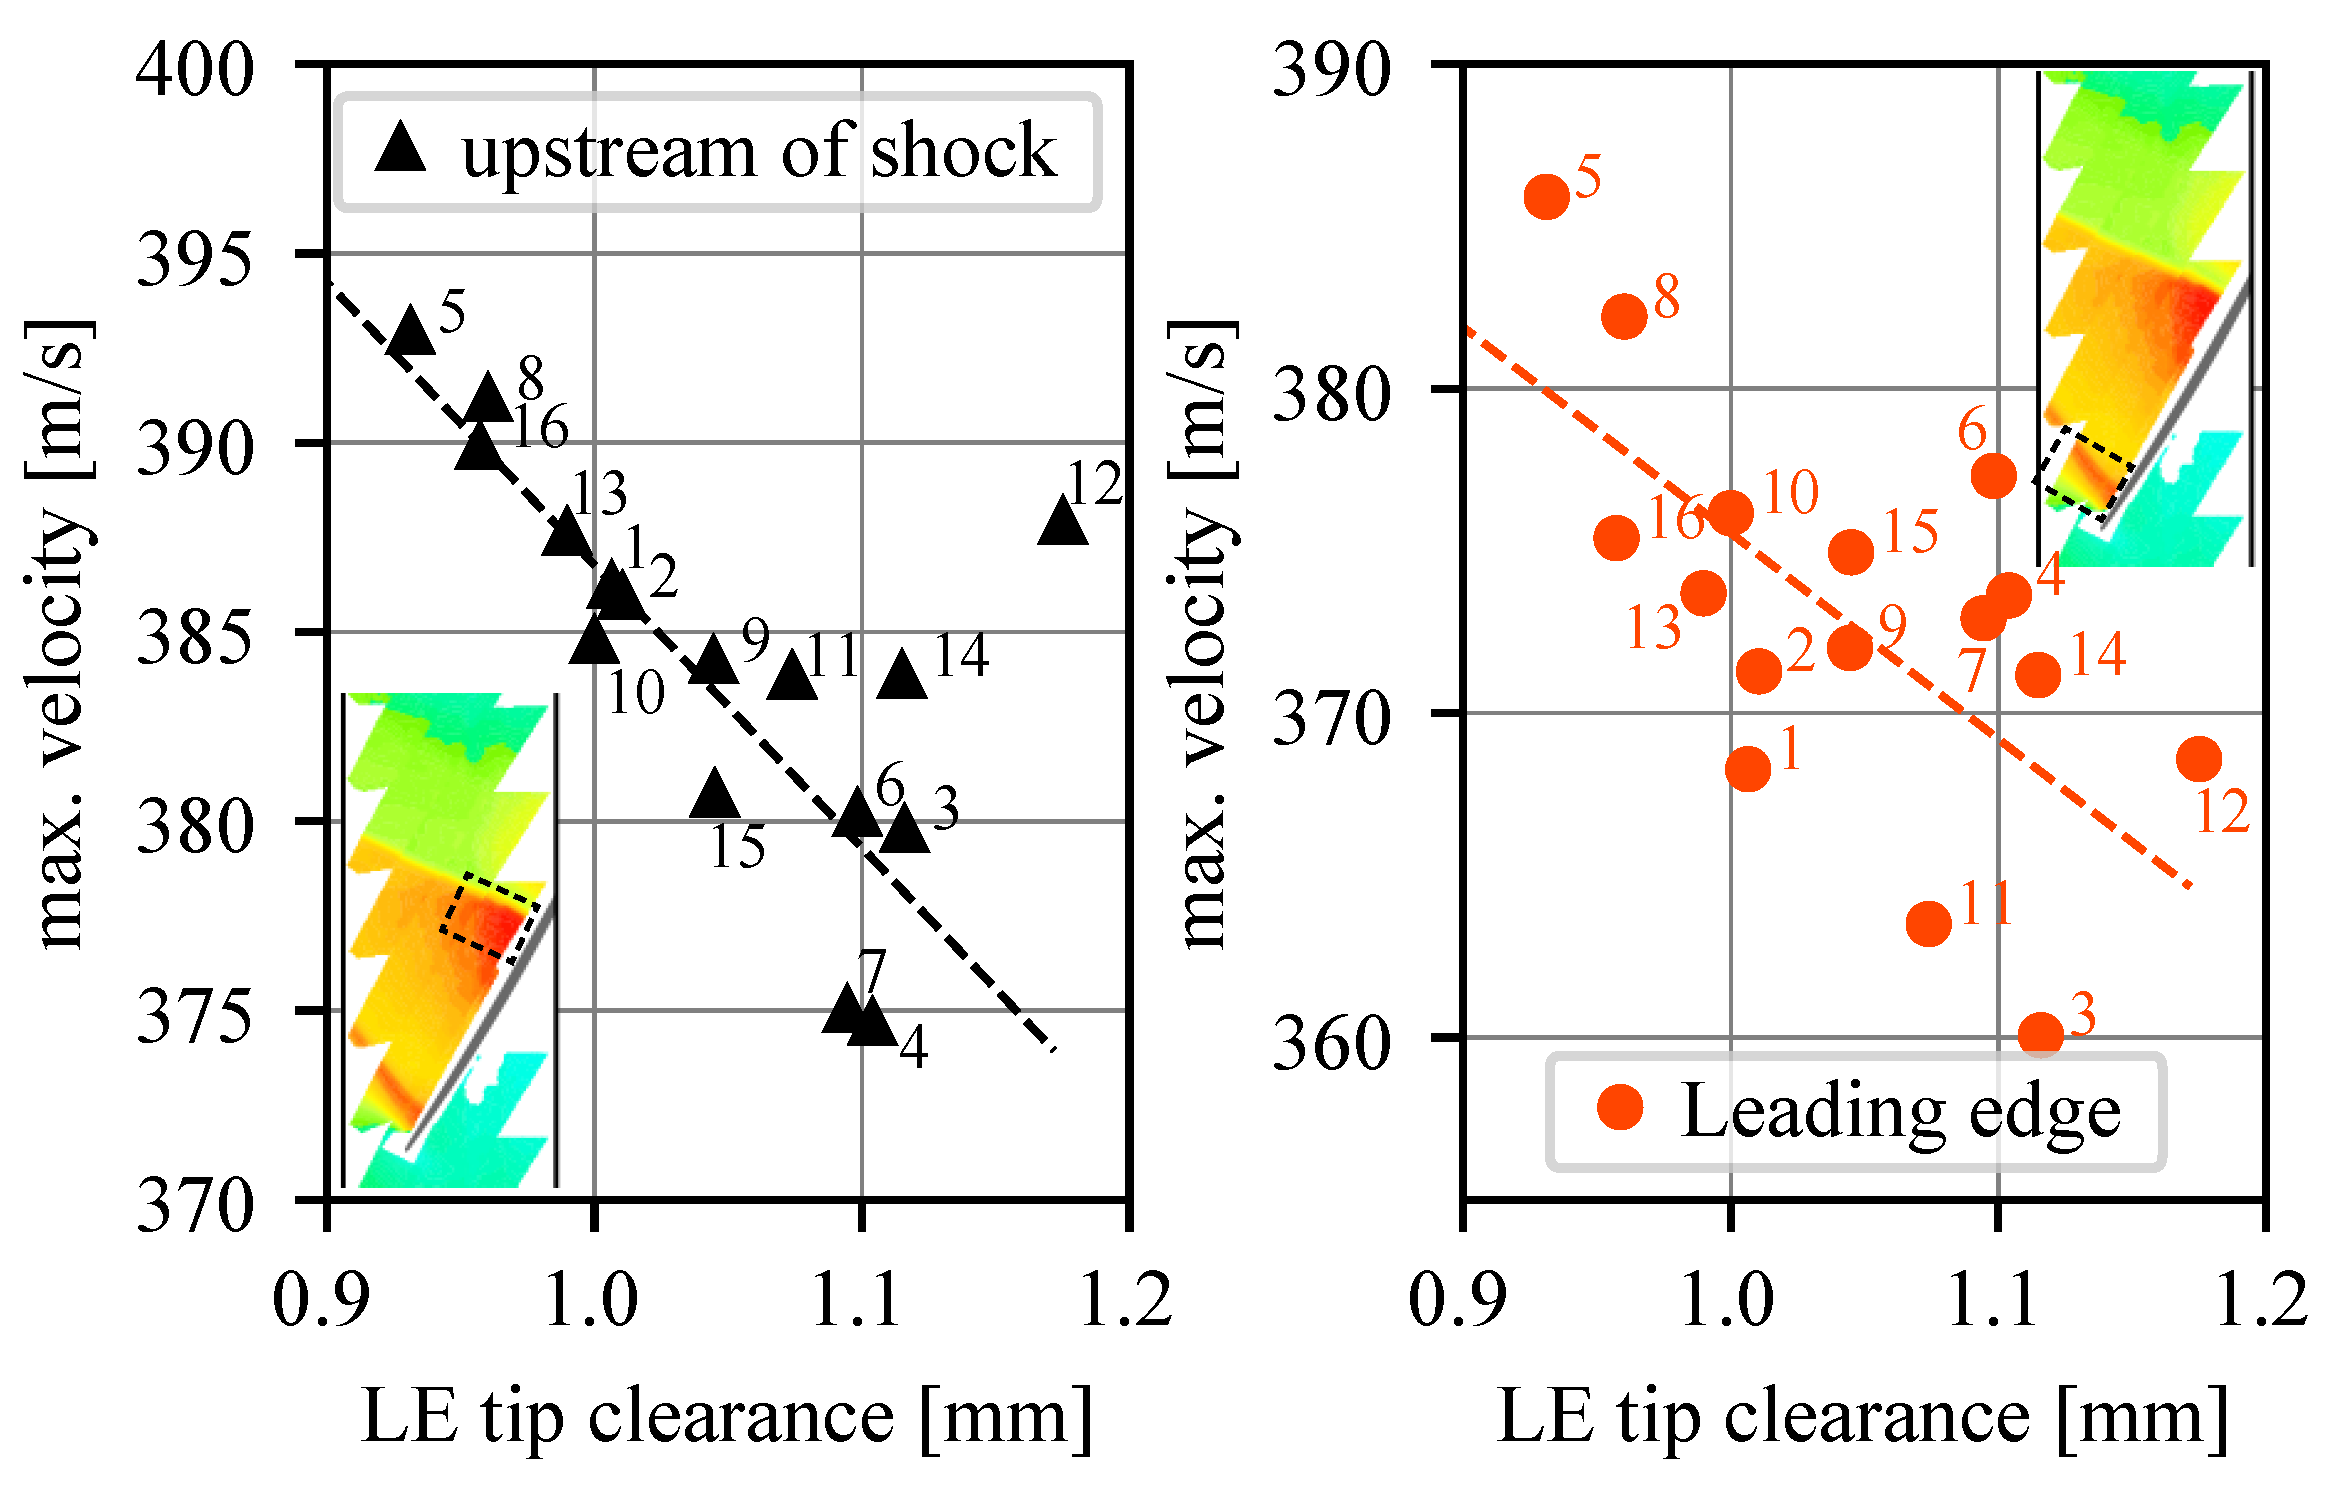
For peak efficiency conditions at design speed, Figure 9 indicates that the maximum velocity in the acceleration zone close to the leading edge as well as the maximum velocity directly upstream of the shock are correlated with individual tip clearances near the leading edge. For blades with high LE clearance, lower relative velocities are observed upstream of the shock, which is attributed to increased tip leakage flow and, hence, blockage in the blade tip region. For the location of the compression shock as presented in Figure 7, no significant correlation with stagger and tip-clearance could be identified, and the subject remains in the focus of further studies. But a complex dependency with the local passage shape and tip blockage is assumed.
The study presented in [25] using the reference rotor indicated that circumferential flow variations decrease towards higher and lower massflow rates along the design speedline with respect to peak efficiency. This observation is confirmed by the PIV measurement at peak pressure conditions, presented in Figure 6, which provides a mostly uniform flow field. This is particularly noticeable in the deviation plot of relative in-plane velocity, which provides even lower asymmetry than the respective wall pressure contour. As for peak efficiency, the main deviations are caused by variations of the shock position between neighboring blades and are consistently observed in wall pressure and PIV measurements. The comparison in Figure 6, thus, shows that wall pressure measurements yield a good representation of the flow field at slightly lower channel heights and can be effectively used for the investigation of flow topology and aerodynamic asymmetry.
The presented results emphasize again that the unintentional variation of tip clearance causes a systematic and stable variation of the flow field in the tip region. At peak efficiency, this effect is most pronounced and tightly correlated with the leading edge clearance.

3.2. Investigation of Throttled Operating Points

In this section, the operating points highlighted in Figure 4 corresponding to different flow coefficients are analyzed in detail to characterize occurring phenomena and differences between the speedlines N90, N95, and N100.

3.2.1. Φ = 0.506

At a flow coefficient of Φ = 0.506 , the flow field at 100% speed is, similar to the flow field at peak pressure in Figure 6, mostly uniform, and fluctuations are comparably low.
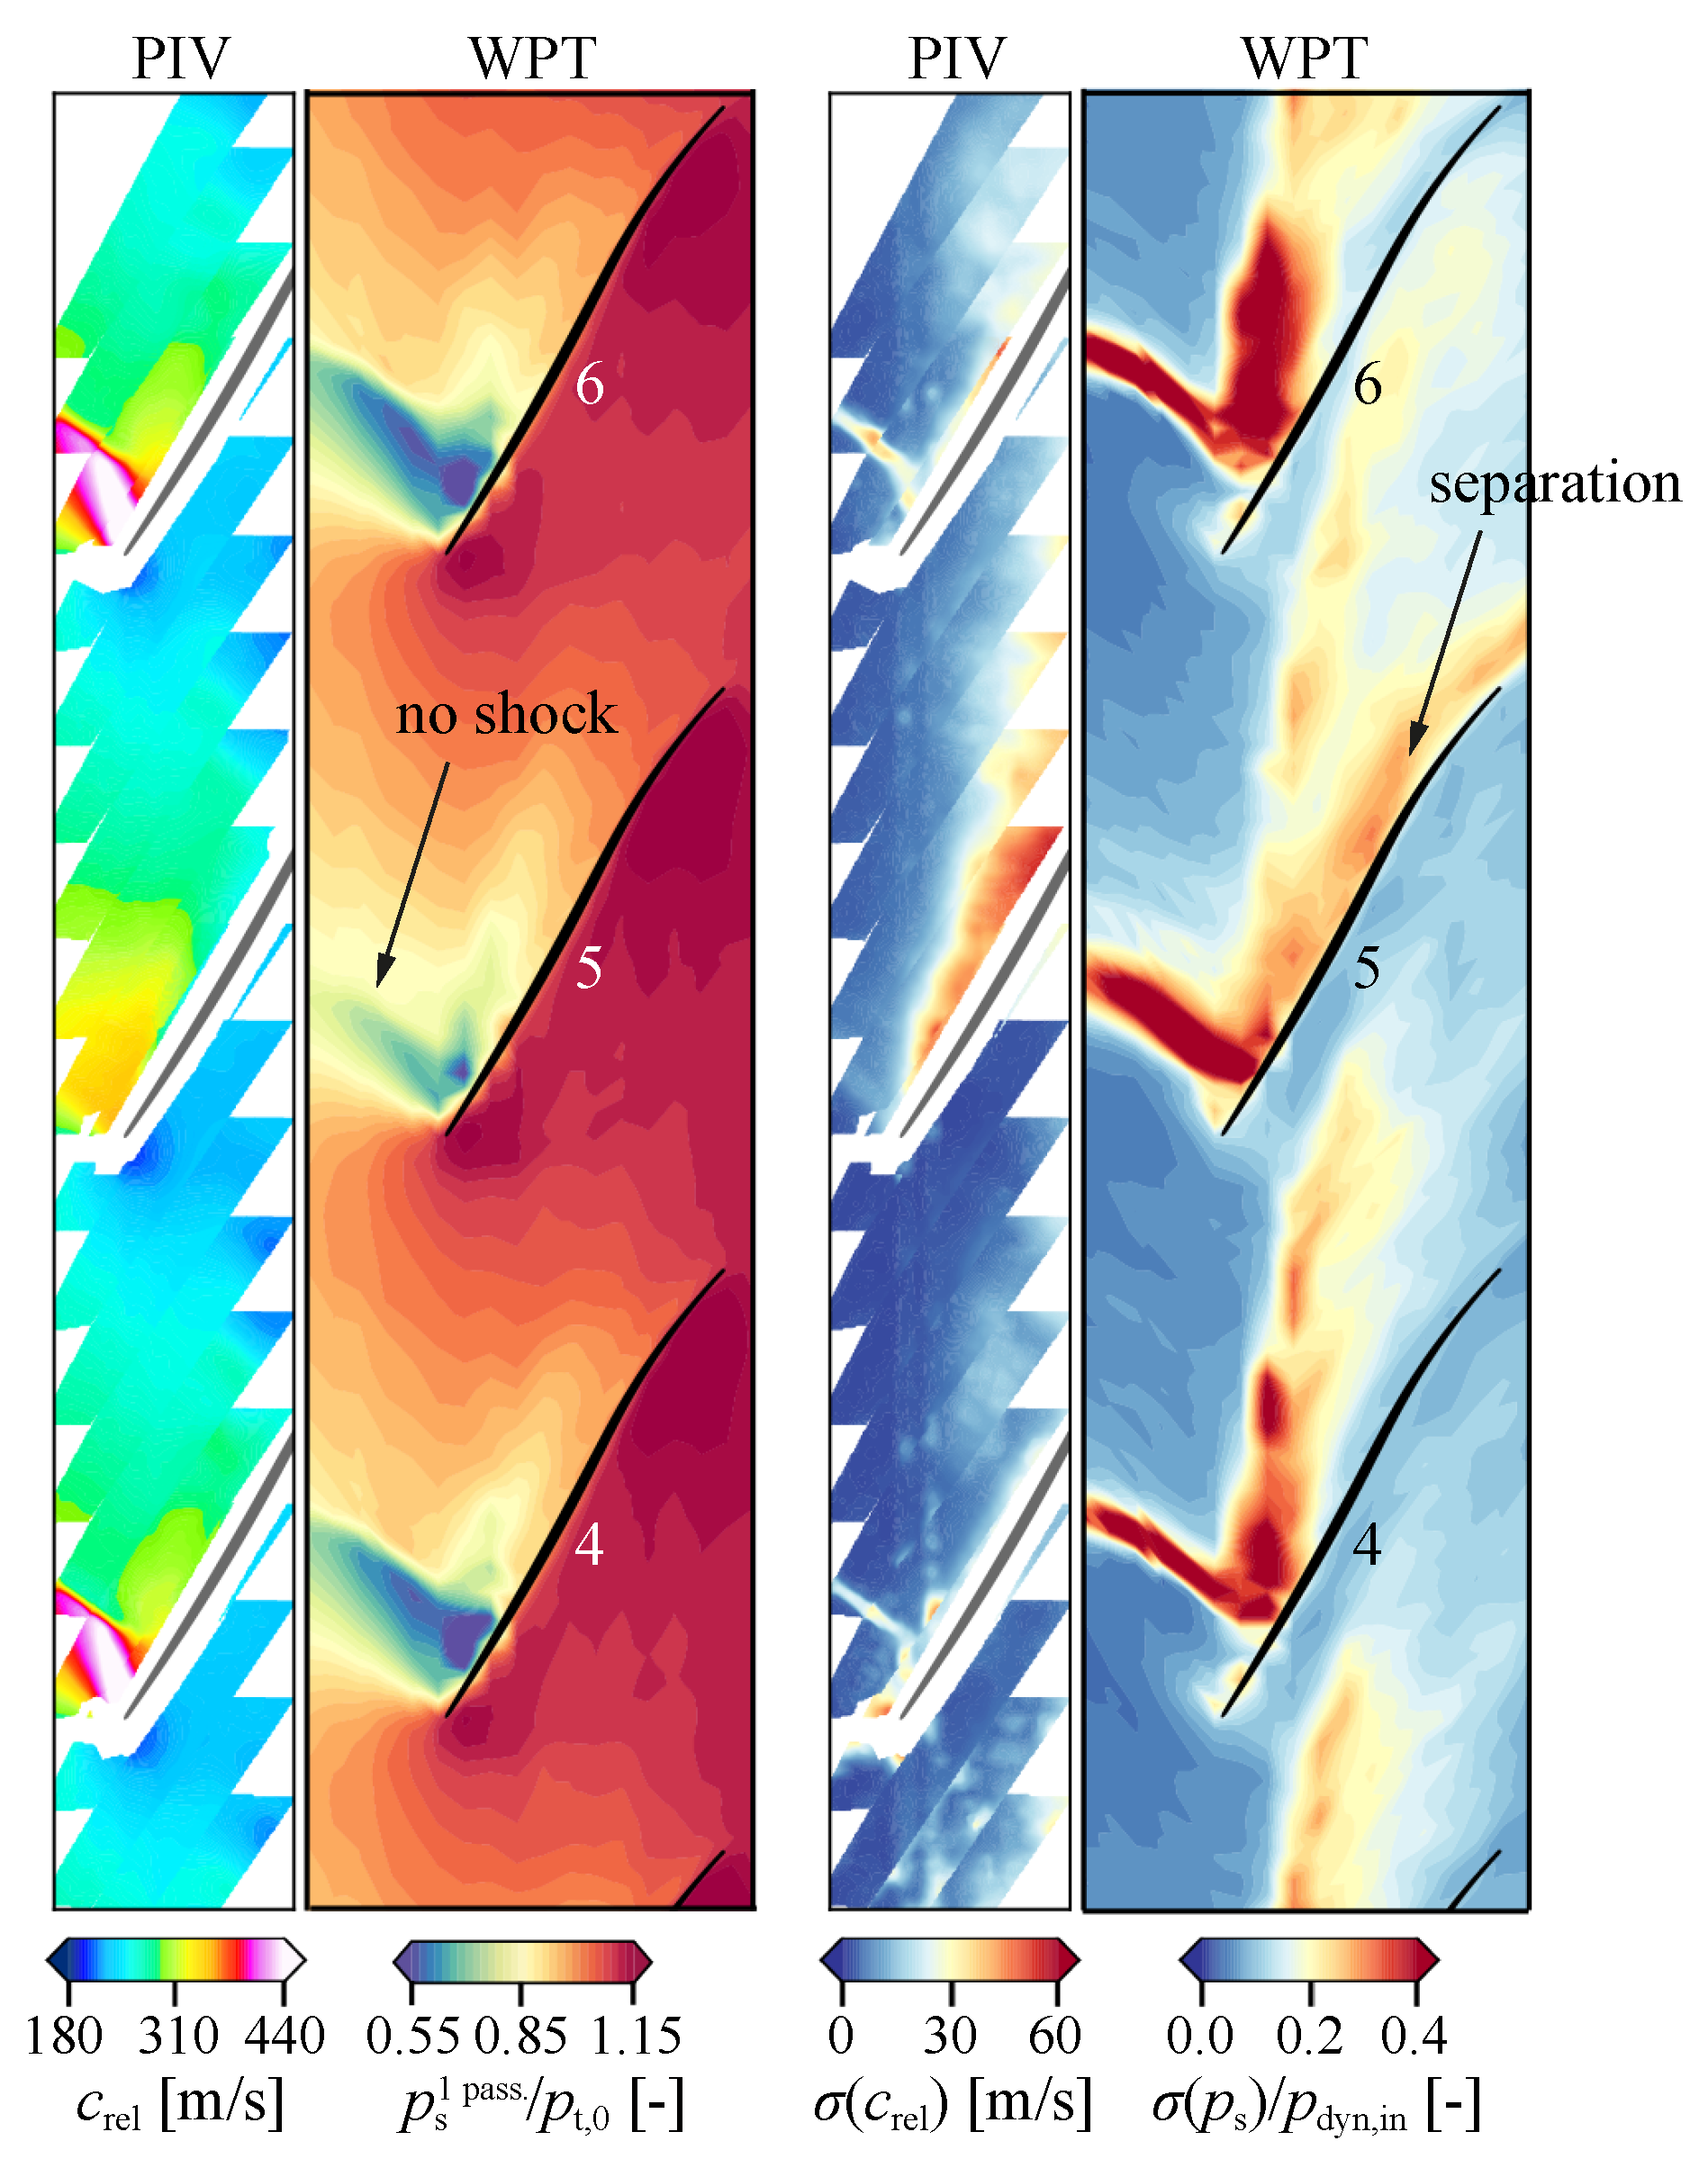
At 95% speed, in contrast, the wall pressure measurements indicate a significantly altered flow topology for blade 5 compared to its neighboring blades as visible in Figure 10. PIV measurements of the respective blade passages reveal that no compression shock is present on the suction side of blade 5 in contrast to the surrounding blades. The analysis of the corresponding temporal fluctuations shown on the right-hand side of the figure illustrates that the absence of shock is attributed to a flow separation on the respective blade, which results in a significantly increased unsteadiness along the suction side. The separation is fixed to blade 5 and temporally stable; hence, it is observed at every rotor revolution and different circumferential positions.
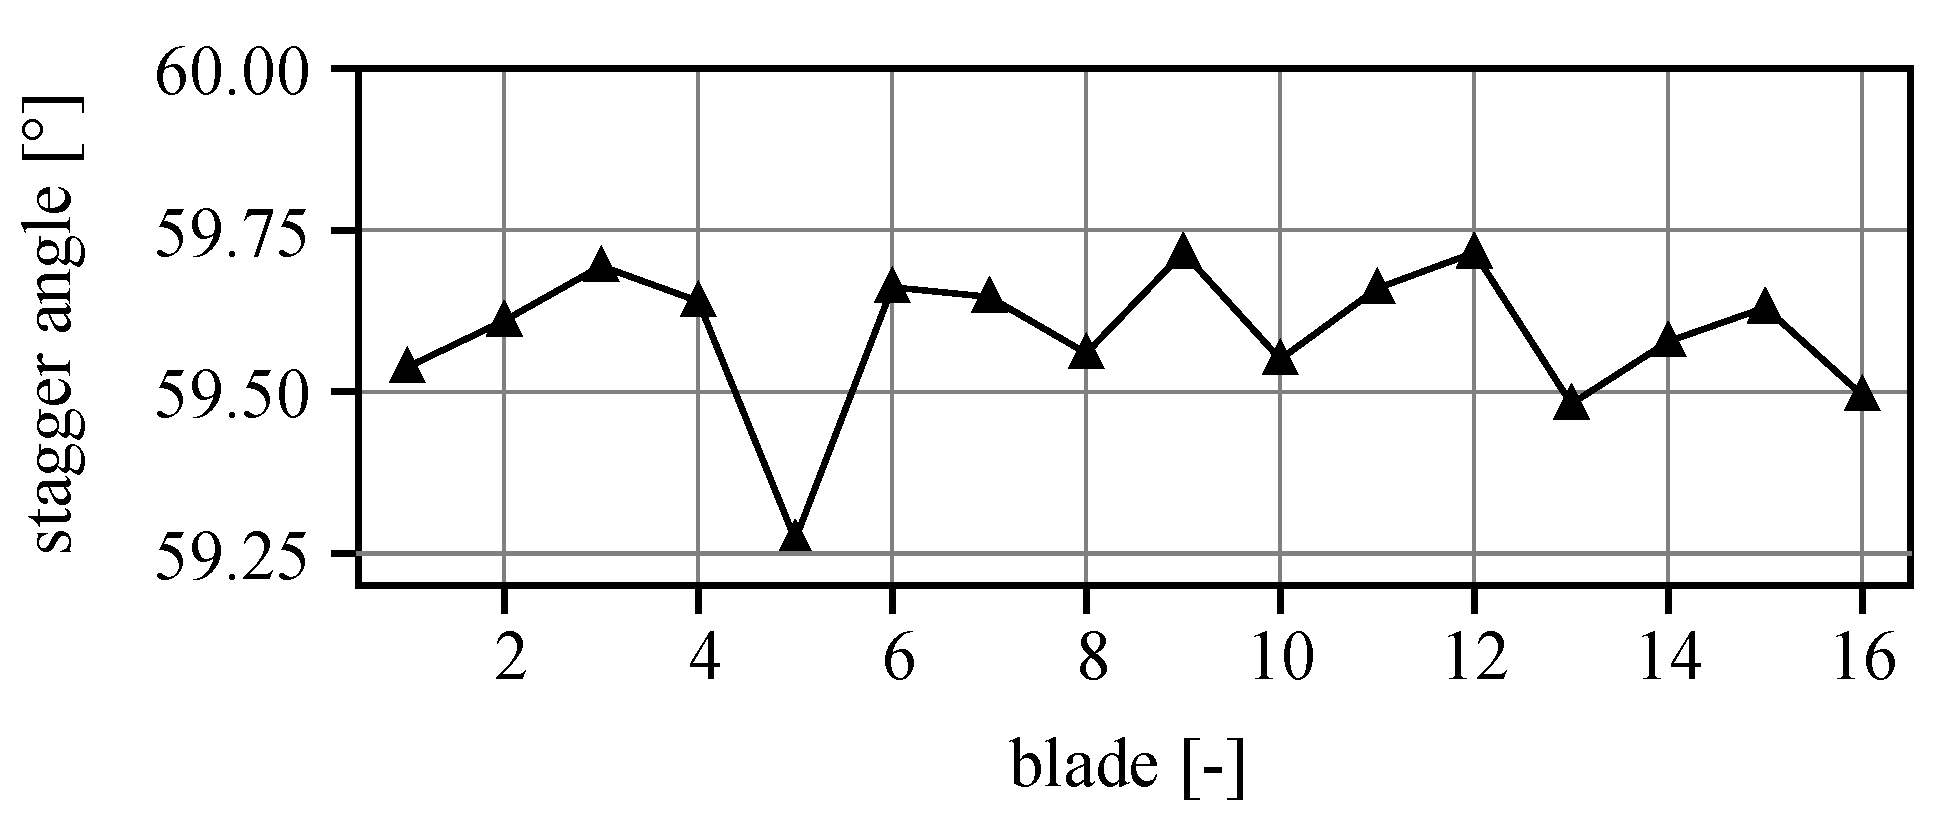
This observation could be confirmed throughout repeated measurements and can be explained with the stagger angle distribution shown in Figure 11. As for tip clearance, the stagger pattern is observed throughout repeated measurements within a range of ±0.04° and, hence, is significant. Figure 11 highlights a stagger angle of blade 5 that is approximately 0.3° smaller than the average value, leading to increased incidence and, thus, flow separation on the blade’s suction side. Despite this flow separation of a single blade, the fan operates stable, and no significant performance drop can be noticed in Figure 4.
This separation of blade 5 is neither observed at 100% speed nor at 90% speed. As visible from Figure 5, vibration amplitudes are negligible for all speedlines at a flow coefficient Φ = 0.506 ; corresponding wall pressure spectra do not show any distinct peaks and are omitted for brevity.

3.2.2. Φ = 0.489

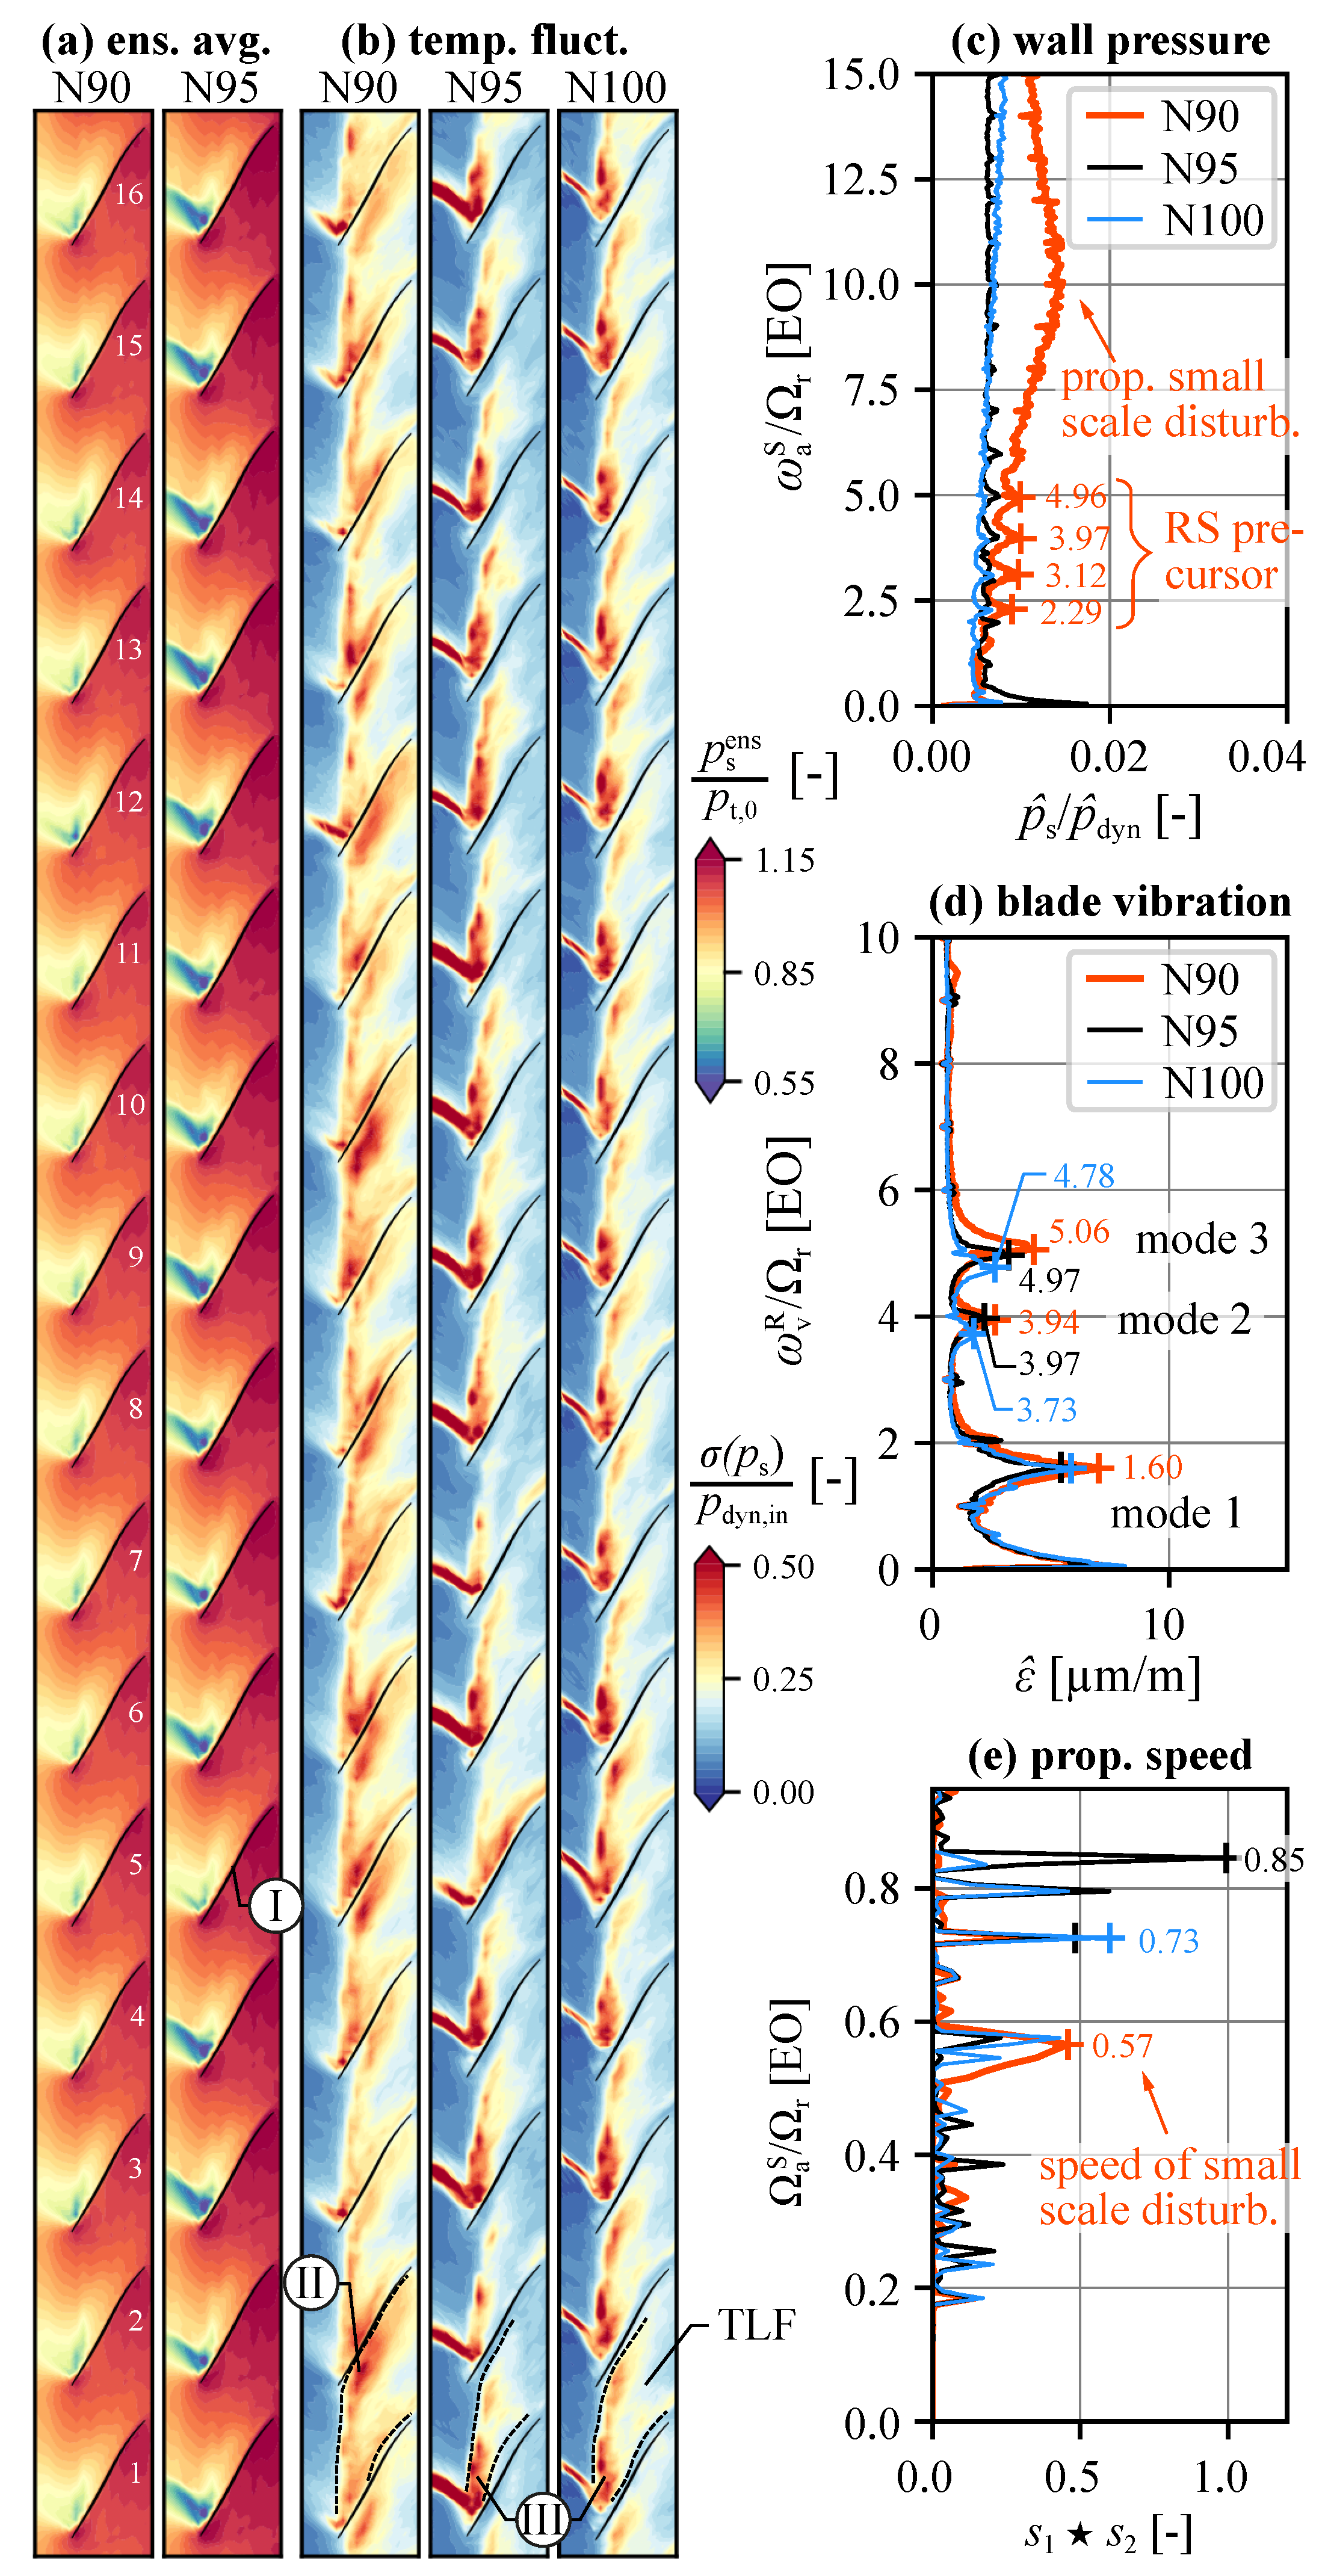
At a flow coefficient of Φ = 0.489 , the flow separation of blade 5   I   is still present at 95% speed as presented by the ensemble averaged wall pressure field in Figure 12a. In contrast, the 90% speedline provides uniform flow conditions.
Another difference becomes apparent from Figure 12b. At 90% speed, zones of increased unsteadiness show a tip leakage flow (TLF) that is nearly perpendicular to the main flow, and the highest fluctuations are observed in the region where the TLF impinges on the pressure side of the trailing blade II . At 95 and 100% speeds, the TLF is less inclined, and the highest unsteadiness is found in the region of the shock and in the zone where the shock interacts with the TLF III .
To investigate these differences in more detail, Figure 12c presents an average wall pressure spectrum of all probes in the leading edge plane. To emphasize non-synchronous pressure fluctuations, an ensemble average is subtracted before the FFT calculation [17].
For N90, a broadband hump around EO10 indicates the presence of convective disturbances, often confusingly referred to as rotating instabilities in the literature [13,15,24], that travel in the leading edge plane from one blade to another. However, at this operating point, no coherent wave patterns are formed, and no discrete peaks between EO6 and EO15 are visible. The absence of coherent waves is confirmed by the spectrum of propagation speed presented in Figure 12e, which is derived based on cross-correlations of unsteady pressure probes in different circumferential positions as described in detail in [17] and normalized with the maximum value of all presented measurements. The graph shows a broad peak around 57% rotor speed. Even if not organized around the circumference, the aerodynamic disturbances cause blade vibrations of different modes as visible in the average strain gauge spectrum in Figure 12d. These observations are clear indicators for the onset of convective NSV.
The four peaks below EO5 in the pressure spectrum of N90 indicate disturbances with an increased length-scale, i.e., reduced cell-count around the circumference. However, their amplitude and coherence is low at this throttle degree.
At 95% speed, no distinct peaks are observed in the wall pressure spectrum, and vibration amplitudes for all three modes are slightly lower compared to the measurement at 90% speed. The most coherent propagation speed is observed at 85% rotor speed, indicating the presence of stall precursors, as shown below. No NSV signatures are observed at this operating point.
At N100, a flow coefficient of Φ = 0.489 corresponds to the operating point just before the onset of rotating stall. The contour of temporal fluctuations indicates a TLF that is less inclined than at N90. Rotating stall is eventually initiated when spill forward occurs on one blade, leading to the formation of a spike that rapidly develops into a large cell of separated flow. However, just before the onset, no distinct peaks are visible in the wall pressure spectrum, and vibration amplitudes of all modes are very low. Only the spectrum of propagation speeds indicates the presence of some stall precursors that propagate with a speed around 73% of the rotor speed.

3.2.3. Φ = 0.461

At a flow coefficient of Φ = 0.461 , no data for the design speedline can be shown, since the fan stage always encountered an abrupt onset of rotating stall at Φ = 0.489 throughout repeated measurements. One to two stall cells are observed.
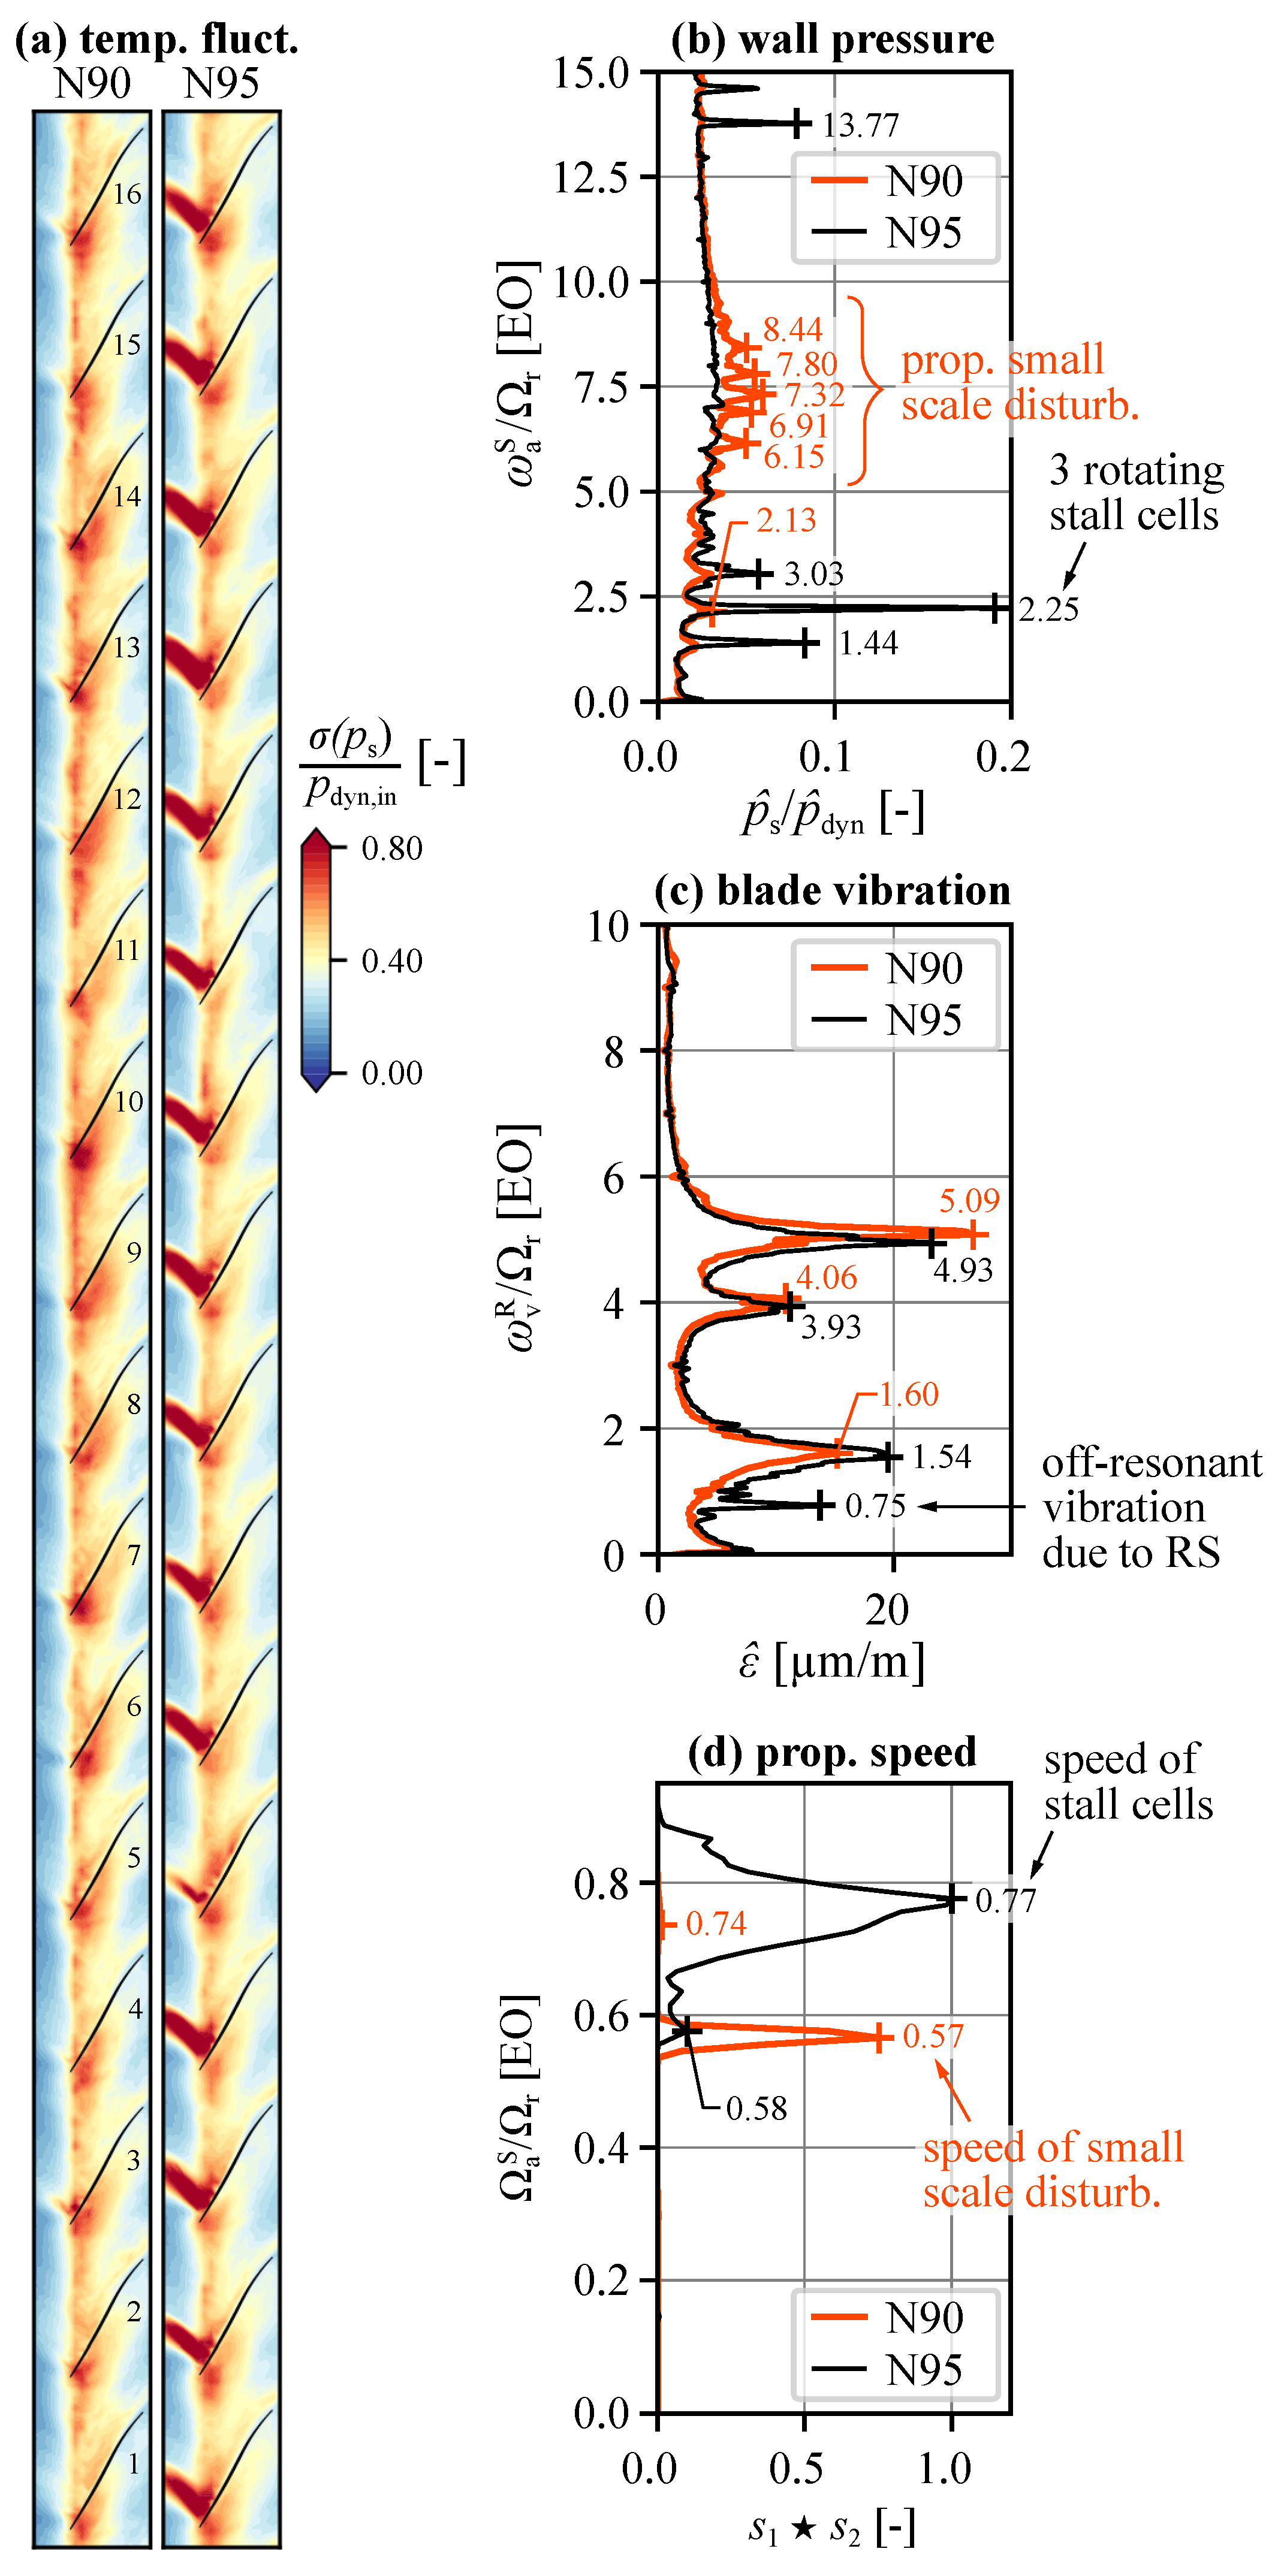
For 95% speed, the contour of temporal fluctuations in Figure 13a reveals a further inclined TLF compared to the operating point at Φ = 0.489 and increasing unsteadiness close to the leading egde on the blade’s pressure sides. However, the highest unsteadiness is still observed in the region of the compression shock. These fluctuations are the result of the presence of rotating stall cells, which is clearly visible in the wall pressure spectrum. The dominant peak at EO 2.25 = 3   ·   0.75 together with the vibration peak at EO 0.75 = | 2.25 3 | in Figure 13c indicates the presence of three stall cells that propagate with speeds around 0.75 Ω r as visible in Figure 13d according to Equations (1) and (2). Analogously, the peaks at EO 1.44 = 2   ·   0.77 and EO 3.03 = 4   ·   0.76 correspond to stall cell patterns with 2 and 4 cells, respectively, causing (low) off-resonant vibration peaks at EO 0.56 = 1.44 2 and EO 0.93 = 3.03 4 (not marked but visible next to the peak at EO0.75). The simultaneous presence of these peaks shows that the stall pattern is not stable in time but changes between spatial mode orders of 2, 3, and 4, with a dominant order of 3. Despite the presence of rotating stall, vibration amplitudes are still low compared to those that are observed in stall at 100% speed. Moreover, no significant performance drop is observed in Figure 4. Thus, measurements could be continued, i.e., the machine further throttled, in contrast to the measurement at design speed where the emergency throttle was activated as soon as rotating stall was encountered to avoid safety-critical blade vibrations.
For the 90% speedline, Figure 13 shows fully developed convective NSV characteristics. The contour of temporal fluctuations (a) yields increased unsteadiness, in particular close to the leading edge of the blade’s pressure sides, which was related to convected radial vortex disturbances in the leading edge plane in previous work [15,16]. The respective wall pressure spectrum shows several distinct peaks around EO8, corresponding to aerodynamic wave numbers between N a =11 and 15. High vibration amplitudes are observed, especially for mode 3 at EO5.09, due to a lock-in of an aerodynamic wave number N a = 12 (corresponding pressure peak at EO 6.91 = 12 5.09 according to Equation (2)) with a structural nodal diameter of N v = 4 = N b N a ; see Equation (4). The coherence of propagating disturbances is underlined by Figure 13d, showing a single clear peak at a propagation speed of 57% rotor speed, which agrees well with the propagation speed observed at different speedlines for this rotor (see [26,28]).

3.2.4. Φ = 0.451

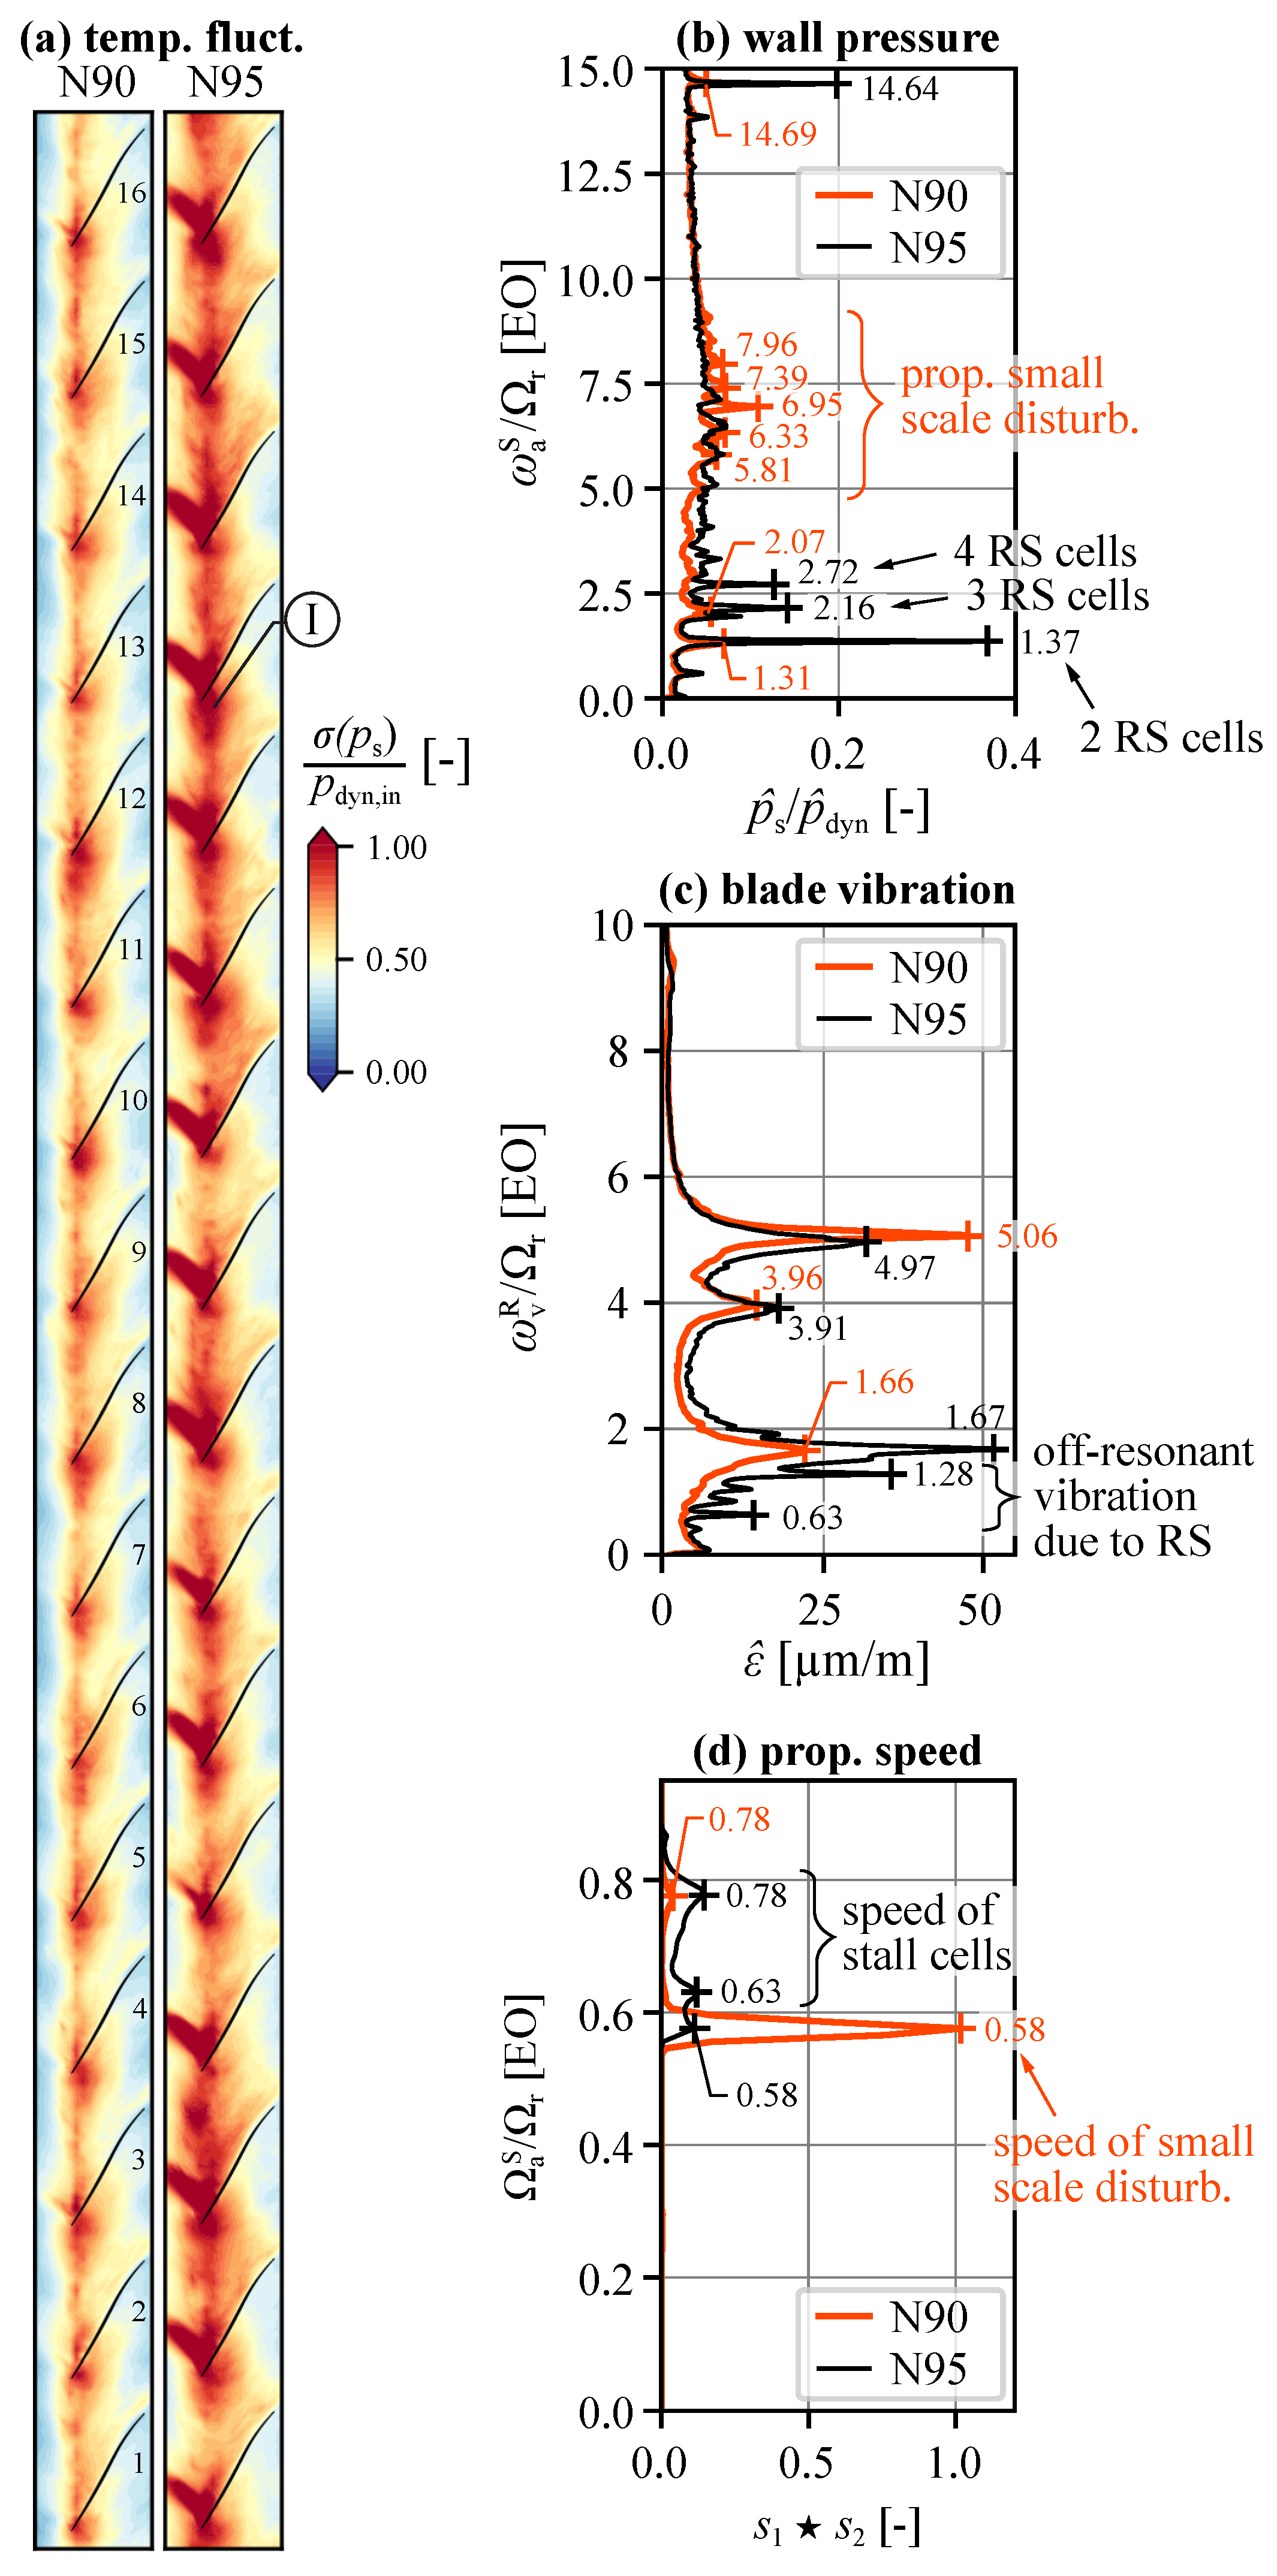
At a flow coefficient of Φ = 0.451 , the flow conditions change significantly for 90 and 95% speeds compared to Φ = 0.461 . For both speedlines, unsteady pressures presented in Figure 14a are increased, especially in the region close to the leading edge on the blade’s pressure sides at N95   I   .
This observation is supported by the spectra in Figure 14b–d. For 90% speed, the distinct peaks around EO8 are still present and result from aerodynamic disturbances that coherently propagate with a speed of approximately 58% rotor speed. However, additional peaks at EO 1.31 = 2   ·   0.66 and EO 2.07 = 3   ·   0.67 can be noticed in the wall pressure spectrum, indicating the presence of two to three stall cells that propagate more slowly compared to those at 95% speed at Φ = 0.461 (but still faster compared to the small-scale disturbances of higher wave numbers). Nevertheless, the vibration spectrum shows no traces of off-resonant excitation, and no related peak is visible in the propagation speed spectrum. Mode 3 vibration amplitudes reach a plateau, as visible in Figure 5, despite the persistent lock-in of N a = 12 = 6.95 / 0.58 and N v = 4 (resulting a vibration peak at EO 5.06 = | 6.95 12 | ). A slight reduction in the flow coefficient Φ even results in a decrease in mode 3 vibration, while mode 1 amplitudes further increase. It is, hence, considered that superimposed large-scale disturbances in the form of part-span rotating stall cells reduce the coherence of the small-scale disturbances, leading to the reduced vibration of mode 3.
At 95% speed, the pressure peaks around EO2 corresponding to two to four propagating stall cells are still the highest (and even higher than at Φ = 0.461 ), with a dominant peak at EO 1.37 = 2   ·   0.76 (i.e., two cells) that causes off-resonant vibrations at EO 0.63 = | 1.37 2 | . However, a noticeable broadband hump around EO8 with several peaks emerges. This indicates, consistent with the increased unsteadiness on the blade’s pressure sides in the leading edge region and the peak at EO0.58 in the propagation speed spectrum, the presence of coherently propagating small-scale disturbances and the onset of convective NSV alongside the presence of a multi-cell stall. Off-resonant excitation due to the stall cells is significant at this condition and leads to critical vibration amplitudes. The propagation speed spectrum shows a wide range of speeds, with a tendency towards higher values for longer wavelengths reaching 78% of rotor speed in the stationary frame.

4. Discussion and Conclusions

These findings emphasize a drastic change in occurring phenomena with the transition from transonic to subsonic operations:
1.
At 100% speed, the rotor experiences rotating stall with one to two cells and spike-type inception. The onset of rotating stall is accompanied by a strong performance drop and safety-critical vibration amplitudes that necessitate immediate measurement abortion.
2.
At 95% speed, significant aerodynamic asymmetry in the form of a single separated blade is observed, long before rotating stall or NSV occurs. This blade-boundary layer separation is attributed to an unintentional misstagger of 0.3° and does not propagate in the rotor system.
At lower flow coefficients, a multi-cell (2–4 cells) rotating stall is established that leads to moderate vibration amplitudes. The associated performance degradation is negligible. Further reducing the flow coefficient causes continuously increasing vibration amplitudes until safety limits are reached and the emergency bleed is opened. These vibrations are off-resonant with blade-eigenmodes and considered as non-synchronous forced-response.
3.
At 90% speed, small-scale convective disturbances form coherent aerodynamic waves, one of which locks in with the third blade eigenmode, resulting in non-synchronous vibration amplitudes that continuously increase with throttle degree until measurements are stopped at a comparably low flow coefficient.
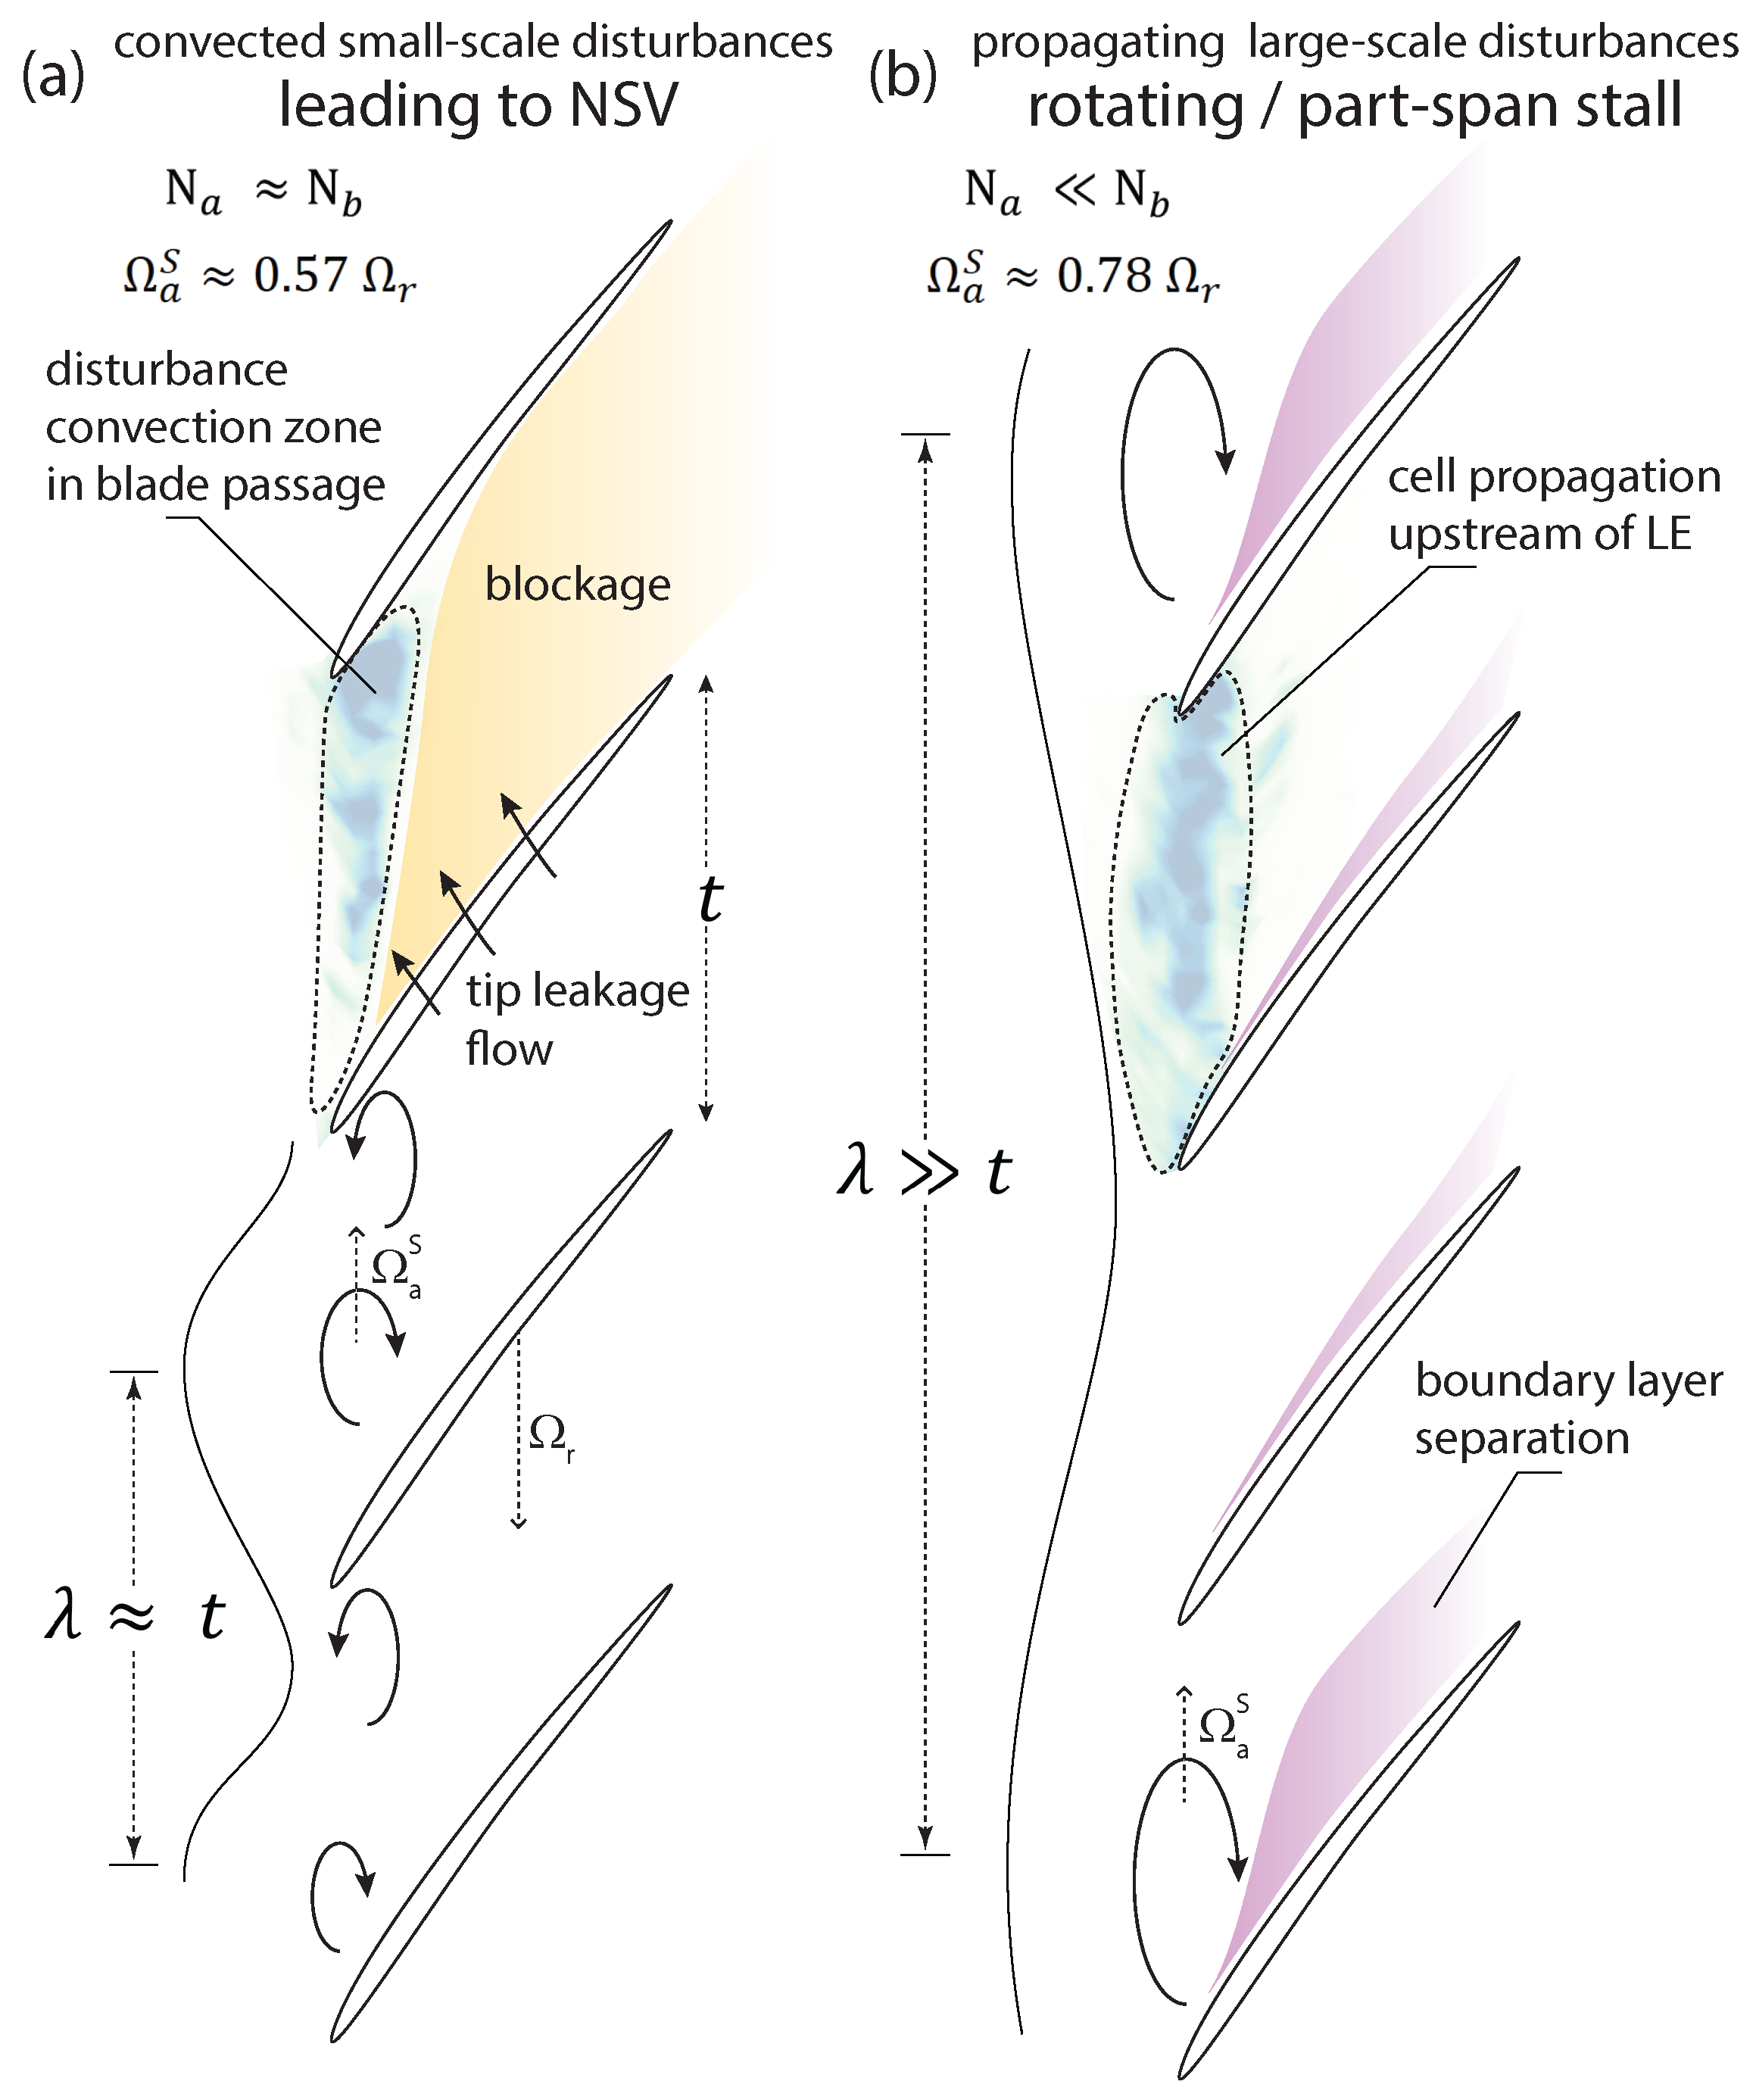
The presented study highlights that rotating stall and NSV have different wave characteristics as schematically illustrated in Figure 15. Rotating stall is observed with wave numbers of up to 4 that propagate with a speed of approximately 76–78% rotor speed. As a result, frequencies in the rotating frame of reference are low and cause mainly off-resonant vibrations. Lock-in with eigenmodes is not observed.
In contrast, small-scale disturbances related to NSV are convected at a mostly constant speed of 57% rotor speed and form patterns with higher wave numbers between 10 and 15. Thus, their frequency in the rotating frame is comparably high and can lock-in with a blade eigenmode. The intermediate range of wave numbers between 5 and 9 that is in between NSV and rotating stall is not observed for the investigated fan.
Another difference is observed in Figure 15 regarding the axial location of disturbances. The superimposed contours show an accumulation of unsteady pressure minima at Φ = 0.451 at 90% and 95% speed to identify the path of aerodynamic disturbances. The left plot illustrates the higher wave number disturbances convecting slightly downstream of the leading edges, whereas larger disturbances with a higher wavelength propagate further upstream in the right-hand case.
These findings imply that the prediction of NSV and rotating stall can only be successful if these characteristics are correctly captured, also considering that both types of disturbances might occur superimposed to each other.
The results, moreover, emphasize that a significant asymmetry of the aerodynamic field resulting from geometric non-uniformity in the blade tip region is present, which will affect the local propagation characteristics of aerodynamic disturbances, as is shown in [37]. Thus, numerical simulations that aim to investigate or predict these phenomena must consider non-periodic full-annulus simulations to capture aerodynamic asymmetry.
The instrumentation used was effective in investigating the observed phenomena. The synchronized wall pressure arrays and bladewise vibration sensors enable the identification of modal interactions. Phase-locked PIV helps examine local aerodynamic asymmetry and allows for correlation with geometric variations of tip-clearance and stagger, as measured by capacitive tip-timing. The data provided within this study forms the basis for the validation of numerical simulations at highly throttled operating conditions and for different phenomena.

Author Contributions

Conceptualization, A.P.S. and C.B.; methodology, A.P.S. and C.B.; software, A.P.S. and B.P.; validation, A.P.S., C.B., and A.-L.F.; formal analysis, A.P.S.; investigation, A.P.S., A.-L.F., and C.B.; resources, B.P. and N.G.; data curation, B.P., C.B., and N.G.; writing—original draft preparation, A.P.S. and C.B.; writing—review and editing, A.P.S., A.-L.F., X.O., and C.B.; visualization, A.P.S.; supervision, X.O. and C.B.; project administration, X.O. and C.B.; funding acquisition, X.O. and C.B. All authors have read and agreed to the published version of the manuscript.

Funding

The presented research was financed through the European Union’s Clean Sky 2 Joint Undertaking (JU) under grant agreement N864719, CATANA. The JU receives support from the European Union’s Horizon 2020 research and innovation program and the Clean Sky 2 JU members other than the Union. The paper reflects only the author’s view, and the JU is not responsible for any use that may be made of the information it contains. Assessment of the test facility was enabled through financial supports of Agence Nationale de la Recherche (ANR, Project d’EquipEx PHARE and industrial chair CONDOR supported by Safran Aircraft Engines) and Conseil pour la Recherche Aeronautique Civile (CORAC—Programme CUMIN). Buildings and infrastructure were supported by ECL and instrumentation supported by Institut Carnot (INGENIERIE@LYON—Project MERIT) and SAFRAN Aircraft Engines.

Institutional Review Board Statement

Not applicable.

Informed Consent Statement

Not applicable.

Data Availability Statement

The data presented in this study is available on request from the corresponding author.

Acknowledgments

The results presented in this paper are the outcome of contributions from a large research group, and the authors gratefully acknowledge the excellent collaboration and support over the past five years. We extend special thanks to Sébastien Goguey and Cédric Desbois of LMFA and Kévin Billon and Claude Gibert of LTDS for their support and contributions to the experiments. The open-test case ECL5 was developed in close collaboration with Safran Aircraft Engines. We are grateful for the continuous collaboration and financial support of SAFRAN throughout this project and specifically for the present measurement campaign, for which the MARLYSA test module was provided by SAFRAN. For the tip-timing measurements, we received extensive support from MTU Aero Engines.

Conflicts of Interest

The authors declare no conflicts of interest.

References

  1. Lee, K.B.; Wilson, M.; Vahdati, M. Numerical study on aeroelastic instability for a low-speed fan. J. Turbomach. 2016, 139, 071004. [Google Scholar] [CrossRef]
  2. Vahdati, M.; Cumpsty, N.A. Aeroelastic instability in transonic fans. J. Turbomach. 2016, 138, 022604. [Google Scholar] [CrossRef]
  3. Kielb, R.E.; Barter, J.W.; Thomas, J.P.; Hall, K.C. Blade Excitation by Aerodynamic Instabilities: A Compressor Blade Study. In Proceedings of the ASME Turbo Expo 2003, Atlanta, GA, USA, 16–19 June 2003. [Google Scholar]
  4. Stapelfeldt, S.; Brandstetter, C. Non-synchronous vibration in axial compressors: Lock-in mechanism and semi-analytical model. J. Sound Vib. 2020, 488, 115649. [Google Scholar] [CrossRef]
  5. Inoue, M.; Kuroumaru, M.; Tanino, T.; Furukawa, M. Propagation of multiple short-length-scale stall cells in an axial compressor rotor. J. Turbomach. 2000, 122, 45–54. [Google Scholar] [CrossRef]
  6. Young, A.; Day, I.; Pullan, G. Stall warning by blade pressure signature analysis. J. Turbomach. 2013, 135, 011033. [Google Scholar] [CrossRef]
  7. Pullan, G.; Young, A.; Day, I.J.; Greitzer, E.M.; Spakovsky, Z.S. Origins and structure of spike-type rotating stall. J. Turbomach. 2015, 137, 51007. [Google Scholar] [CrossRef]
  8. Camp, T.R.; Day, I.J. A study of spike and modal stall phenomena in a low-speed axial compressor. In Proceedings of the ASME Turbo Expo 1997, Orlando, FL, USA, 2–5 June 1997. [Google Scholar]
  9. Moore, F.K. A theory of rotating stall of multistage axial compressors: Part II - Finite disturbances. J. Eng. Gas Turbines Power 1984, 106, 321–326. [Google Scholar] [CrossRef]
  10. Greitzer, E.M. Review: Axial compressor stall phenomena. J. Fluids Eng. 1980, 102, 134–151. [Google Scholar] [CrossRef]
  11. Inoue, M.; Kuroumaru, M.; Yoshida, S.; Minami, T.; Yamada, K.; Furukawa, M. Effect of tip clearance on stall evolution process in a low-speed axial compressor stage. In Proceedings of the ASME Turbo Expo 2004, Vienna, Austria, 14–17 June 2004. [Google Scholar] [CrossRef]
  12. Day, I.J. Stall, surge, and 75 years of research. J. Turbomach. 2016, 138, 011001. [Google Scholar] [CrossRef]
  13. Baumgartner, M.; Kameier, F.; Hourmouziadis, J. Non-engine order blade vibration in a high pressure compressor. In Proceedings of the 12th International Symposium on Airbreathing Engines, Melbourne, Australia, 10–15 September 1995; Available online: https://hal.science/hal-01353829 (accessed on 12 June 2025).
  14. Thomassin, J.; Vo, H.D.; Mureithi, N.W. The tip clearance flow resonance behind axial compressor nonsynchronous vibration. J. Turbomach. 2011, 133, 041030. [Google Scholar] [CrossRef]
  15. Vo, H.D. Role of tip clearance flow in rotating instabilities and nonsynchronous vibration. J. Propuls. Power 2010, 26, 556–561. [Google Scholar] [CrossRef]
  16. Brandstetter, C.; Juengst, M.; Schiffer, H.P. Measurements of Radial Vortices, Spill Forward, and Vortex Breakdown in a Transonic Compressor. J. Turbomach. 2018, 140, 061004. [Google Scholar] [CrossRef]
  17. Brandstetter, C.; Ottavy, X.; Paoletti, B.; Stapelfeldt, S. Interpretation of stall precursor signatures. J. Turbomach. 2021, 143, 13. [Google Scholar] [CrossRef]
  18. Holzinger, F.; Wartzek, F.; Jüngst, M.; Schiffer, H.P.; Leichtfuss, S. Self-excited blade vibration experimentally investigated in transonic compressors: Rotating Instabilties and flutter. J. Turbomach. 2016, 138, 041006. [Google Scholar] [CrossRef]
  19. Franke, D.; Jüngst, M.; Möller, D.; Schiffer, H.P.; Giersch, T. Influence of pre-swirl, rotor speed and blade count on aeroelastic coupling mechanisms during stall inception of a transonic compressor. In Proceedings of the ASME Turbo Expo 2020, Virtual, 21–25 September 2020. [Google Scholar] [CrossRef]
  20. de Almeida, V.B.C.; Tüzüner, E.; Eck, M.; Peitsch, D. Numerical characterization of prestall disturbances in a compressor stage. J. Turbomach. 2024, 146, 081009. [Google Scholar] [CrossRef]
  21. Hernley, V.; Jemcov, A.; Kang, J.; Montgomery, M.; Morris, S.C. Relationship between casing pressure and non-synchronous vibration in an axial compressor. Int. J. Turbomach. Propuls. Power 2024, 9, 14. [Google Scholar] [CrossRef]
  22. März, J.; Hah, C.; Neise, W. An experimental and numerical investigation into the mechanisms of rotating instability. J. Turbomach. 2002, 124, 367–374. [Google Scholar] [CrossRef]
  23. Kameier, F.; Neise, W. Rotating blade flow instability as a source of noise in axial turbomachines. J. Sound Vib. 1997, 203, 833–853. [Google Scholar] [CrossRef]
  24. Mailach, R.; Lehmann, I.; Vogeler, K. Rotating instabilities in an axial compressor originating from the fluctuating blade tip vortex. J. Turbomach. 2001, 123, 453–460. [Google Scholar] [CrossRef]
  25. Schneider, A.; Fiquet, A.L.; Paoletti, B.; Ottavy, X.; Brandstetter, C. Experiments on tuned UHBR open-test-case fan ECL5/CATANA: Performance and aerodynamics. J. Turbomach. 2024, 146, 081001. [Google Scholar] [CrossRef]
  26. Fiquet, A.L.; Schneider, A.; Paoletti, B.; Ottavy, X.; Brandstetter, C. Experiments on Tuned UHBR Open-Test-Case Fan ECL5/CATANA: Stability Limit. J. Eng. Gas Turbines Power 2023, 146, 051011. [Google Scholar] [CrossRef]
  27. Brandstetter, C.; Schneider, A.P.; Fiquet, A.L.; Paoletti, B.; Ottavy, X. Experiments on structurally mistuned UHBR open-test-case fan ECL5/CATANA. J. Eng. Gas Turbines Power 2024, 147, 081010. [Google Scholar] [CrossRef]
  28. Schneider, A.P. Aerodynamic and Aeroelastic Investigation of a Composite Fan for Ultra-High-Bypass-Ratio Aircraft Engines. Ph.D. Thesis, Ecole Centrale de Lyon, Lyon, France, 2024. Available online: https://theses.fr/2024ECDL0018 (accessed on 12 June 2025).
  29. Schneider, A.; Paoletti, B.; Ottavy, X.; Brandstetter, C. Influence of a turbulence control screen on the aerodynamic and aeroelastic behavior of a UHBR fan. In Proceedings of the ASME Turbo Expo 2022, Rotterdam, The Netherlands, 13–17 June 2022. [Google Scholar] [CrossRef]
  30. Zielinski, M.; Ziller, G. Noncontact Vibration Measurements on Compressor Rotor Blades. Meas. Sci. Technol. 2000, 11, 847–856. [Google Scholar] [CrossRef]
  31. Raffel, M.; Willert, C.E.; Scarano, F.; Kähler, C.J.; Wereley, S.T.; Kompenhans, J. Particle Image Velocimetry: A Pratical Guide; Spinger: Berlin/Heidelberg, Germany, 2018. [Google Scholar]
  32. Wieneke, B. Stereo-PIV using self-calibration on particle images. J. Exp. Fluids 2005, 39, 267–280. [Google Scholar] [CrossRef]
  33. Voges, M.; Willert, C.; Mönig, R.; Schiffer, H.P. The effect of a bend-slot casing treatment on the blade tip flow flield of a transonic compressor rotor. In Proceedings of the ASME Turbo Expo 2013, San Antonio, TX, USA, 3–7 June 2013. [Google Scholar] [CrossRef]
  34. Brandstetter, C. Aerodynamische Stabilisierung Transsonischer Axialverdichter: Eine Experimentelle Untersuchung der Blattspitzenströmung Unter dem Einfluss von Gehäusestrukturierungen. Ph.D. Thesis, Technische Universität Darmstadt, Darmstadt, Germany, 2015. [Google Scholar]
  35. Brandstetter, C.; Schneider, A.P.; Fiquet, A.L.; Paoletti, B.; Billon, K.; Ottavy, X. ECL5/CATANA: Comparative analysis of advanced blade vibration measurement techniques. In Proceedings of the ETC16, Hannover, Germany, 24–28 March 2025. [Google Scholar]
  36. Schneider, A.; Paoletti, B.; Ottavy, X.; Brandstetter, C. Quantification of blade vibration amplitude in turbomachinery. Int. J. Turbomach., Propuls. Power 2024, 9, 10. [Google Scholar] [CrossRef]
  37. Tharreau, P.; Hardy-Falch, M.; Stapelfeldt, S.; Brandstetter, C. Non-synchronous vibration: Characterisation of the aerodynamic disturbance and its dependency on local tip clearance. J. Eng. Gas Turbines Power 2024, 147, 051029. [Google Scholar] [CrossRef]
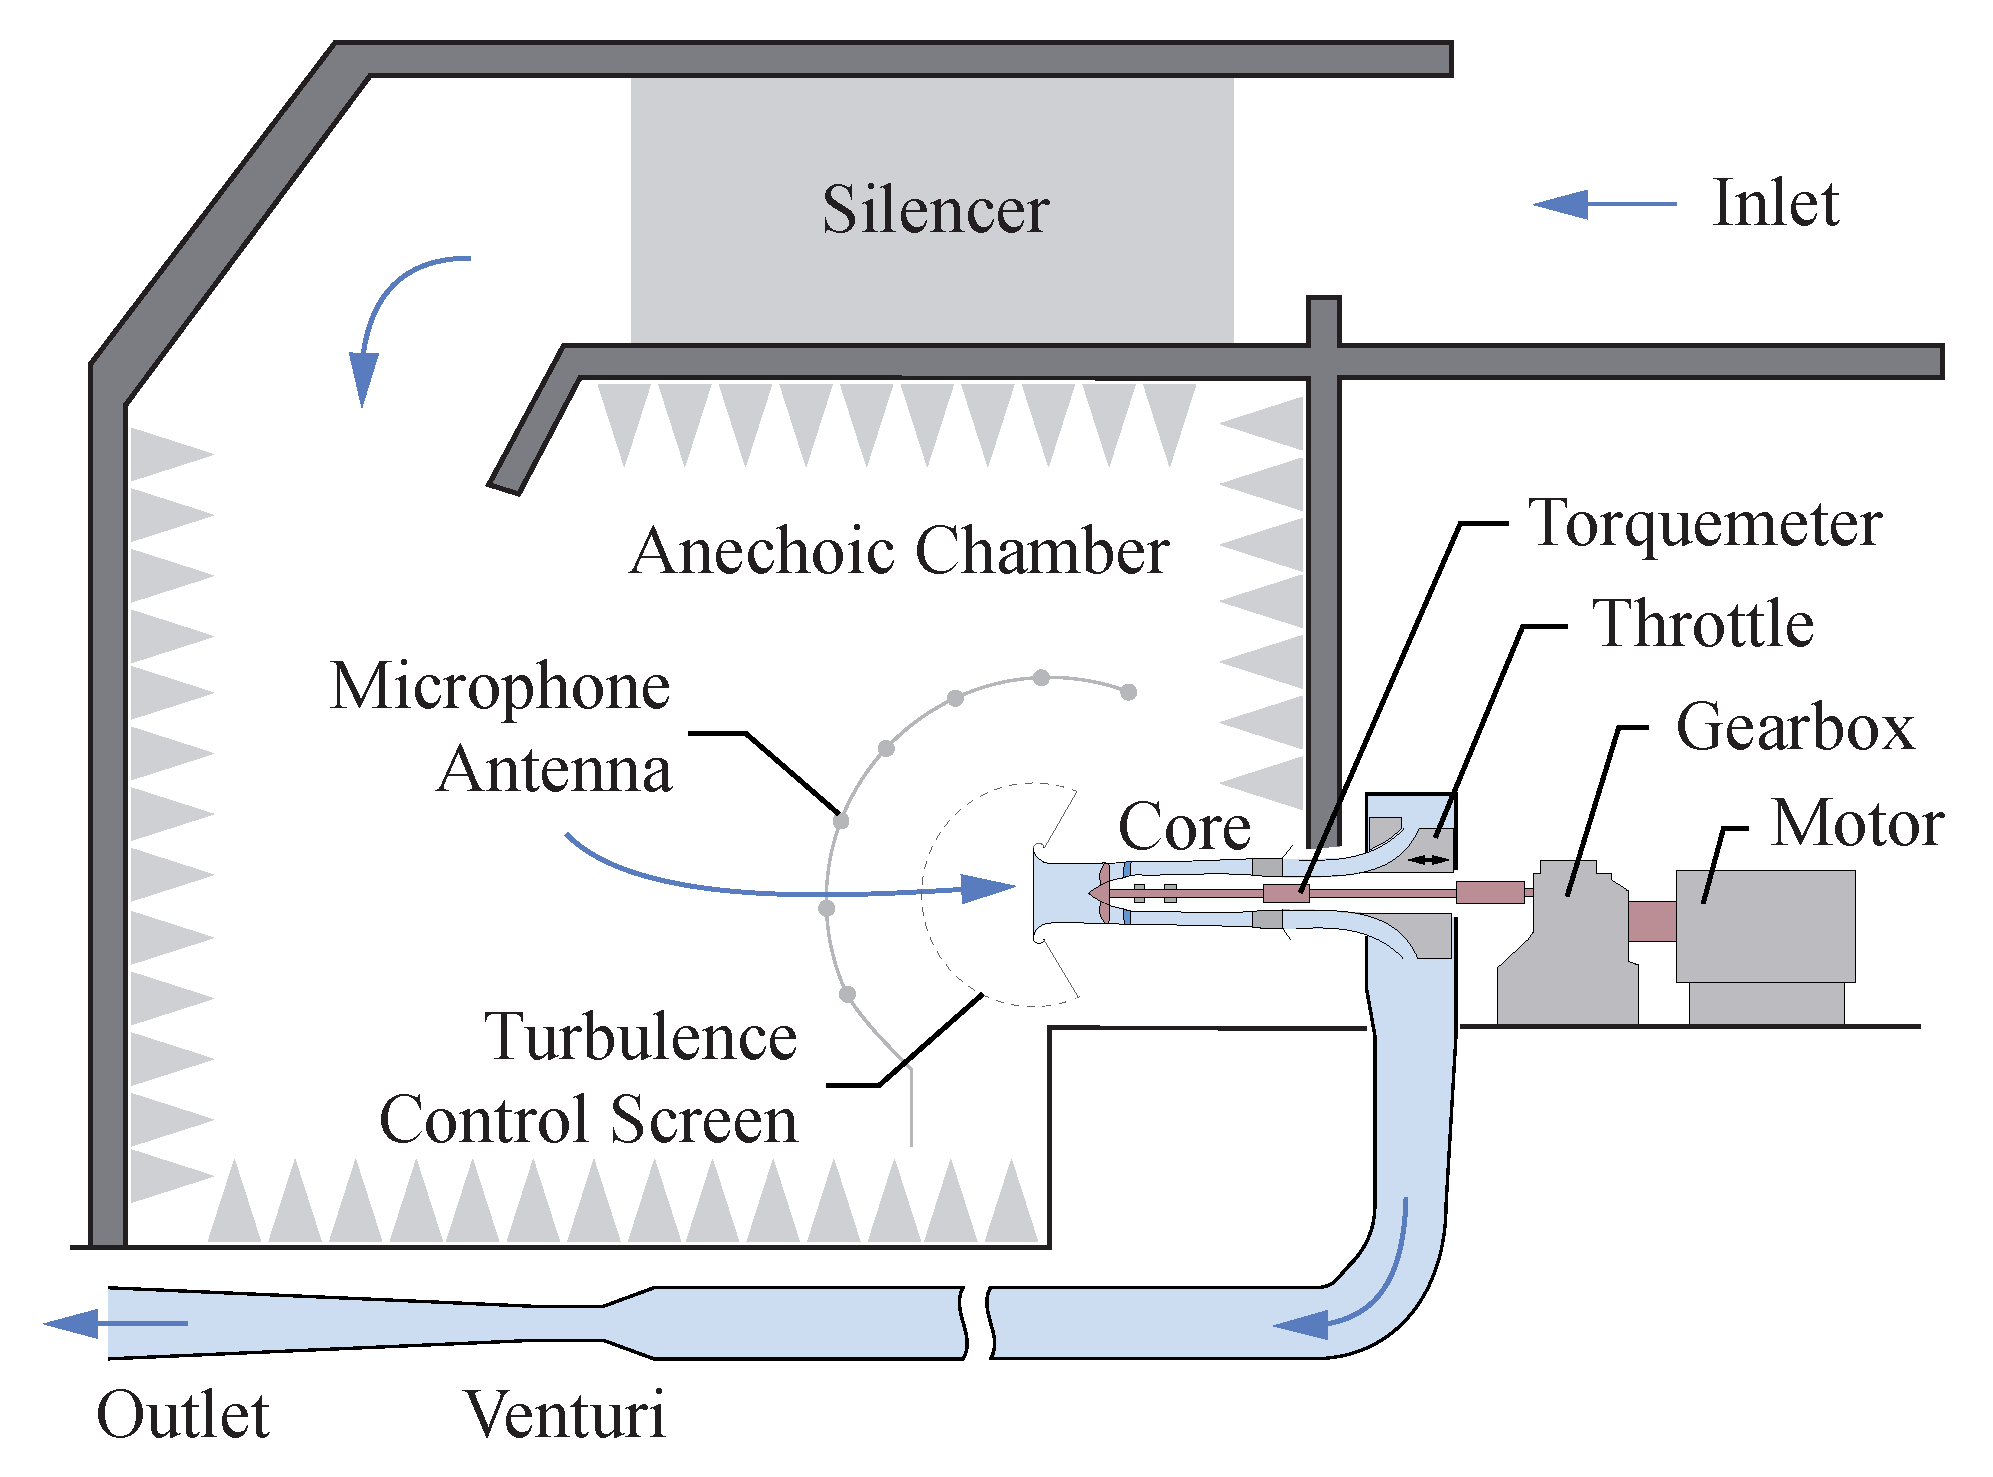
Figure 1. Test facility ECL-B3/Phare-2.
Ijtpp 10 00022 g001
Figure 2. Facility core section: (a) schematic illustration of instrumentation; (b) PIV light-sheet position.
Ijtpp 10 00022 g002
Figure 3. Phase angle superposition: (a) schematic illustration; (b) contour of radial positions of projected phase angles.
Ijtpp 10 00022 g003
Figure 4. Machine total pressure ratio for mistuned rotor configuration (CATMIS).
Ijtpp 10 00022 g004
Figure 5. Evolution of average vibration amplitude for modes 1, 2, and 3 with flow coefficient Φ from strain gauge data (scaled to modal scope limit, see [26]) for a CATMIS configuration. Contours indicate mode shapes by means of normalized displacement amplitudes.
Ijtpp 10 00022 g005
Figure 6. Comparison of ensemble averaged wall pressure, rel. in-plane velocity, and their respective passage-wise deviations from the all-blade average at peak efficiency (PE, Φ = 0.631 ) and peak pressure (PP, Φ = 0.521 ) at 100% speed.
Ijtpp 10 00022 g006
Figure 7. Comparison of shock distance from leading edge of trailing blade measured with WPTs and SPIV at peak efficiency at 100% speed.
Ijtpp 10 00022 g007
Figure 8. Tip clearance variation (leading edge, LE and mid chord, MC) at peak efficiency at 100% speed.
Ijtpp 10 00022 g008
Figure 9. Correlation of velocity in LE acceleration zone and upstream of shock with leading edge (LE) tip clearance at peak efficiency at 100% speed from SPIV measurements.
Ijtpp 10 00022 g009
Figure 10. Relative velocity, ensemble averaged static wall pressure, and related temporal fluctuations at Φ = 0.506 at 95% speed.
Ijtpp 10 00022 g010
Figure 11. Blade-to-blade variation of stagger angle at Φ = 0.506 at 95% speed.
Ijtpp 10 00022 g011
Figure 12. Comparison of operating points at Φ = 0.489 at 90% and 95% speed: (a) ensemble averaged wall pressure; (b) temporal fluctuations; (c) wall pressure spectra (LE plane); (d) strain gauge spectra; (e) propagation speed spectra.
Ijtpp 10 00022 g012
Figure 13. Comparison of operating points at Φ = 0.461 at 90 and 95% speeds: (a) temporal fluctuations; (b) wall pressure spectra (LE plane); (c) strain gauge spectra; (d) propagation speed spectra.
Ijtpp 10 00022 g013
Figure 14. Comparison of operating points at Φ = 0.451 at 90 and 95% speed: (a) temporal fluctuations; (b) wall pressure spectra (LE plane); (c) strain gauge spectra; (d) propagation speed spectra.
Ijtpp 10 00022 g014
Figure 15. Schematic illustration of wave characteristics of (a) NSV and (b) rotating stall with superimposed contours of the accumulation of unsteady pressure minima at Φ = 0.451 at 90% (right) and 95% (left) speed.
Ijtpp 10 00022 g015
Table 1. PIV recording parameters.
ParameterValueUnit
frequency≈14Hz
time delay2–2.5μs
image scale≈24px/mm
laser pulse energy40–60mJ
max. repetition rate14Hz
particle image diameter3–6px
camera openingF4–F5.6-
Disclaimer/Publisher’s Note: The statements, opinions and data contained in all publications are solely those of the individual author(s) and contributor(s) and not of MDPI and/or the editor(s). MDPI and/or the editor(s) disclaim responsibility for any injury to people or property resulting from any ideas, methods, instructions or products referred to in the content.