
Tuberculosis Disability Adjusted Life Years, Colombia 2010–2018


Abstract
1. Introduction
2. Materials and Methods
2.1. Variables Studied
2.2. Statistical Analysis
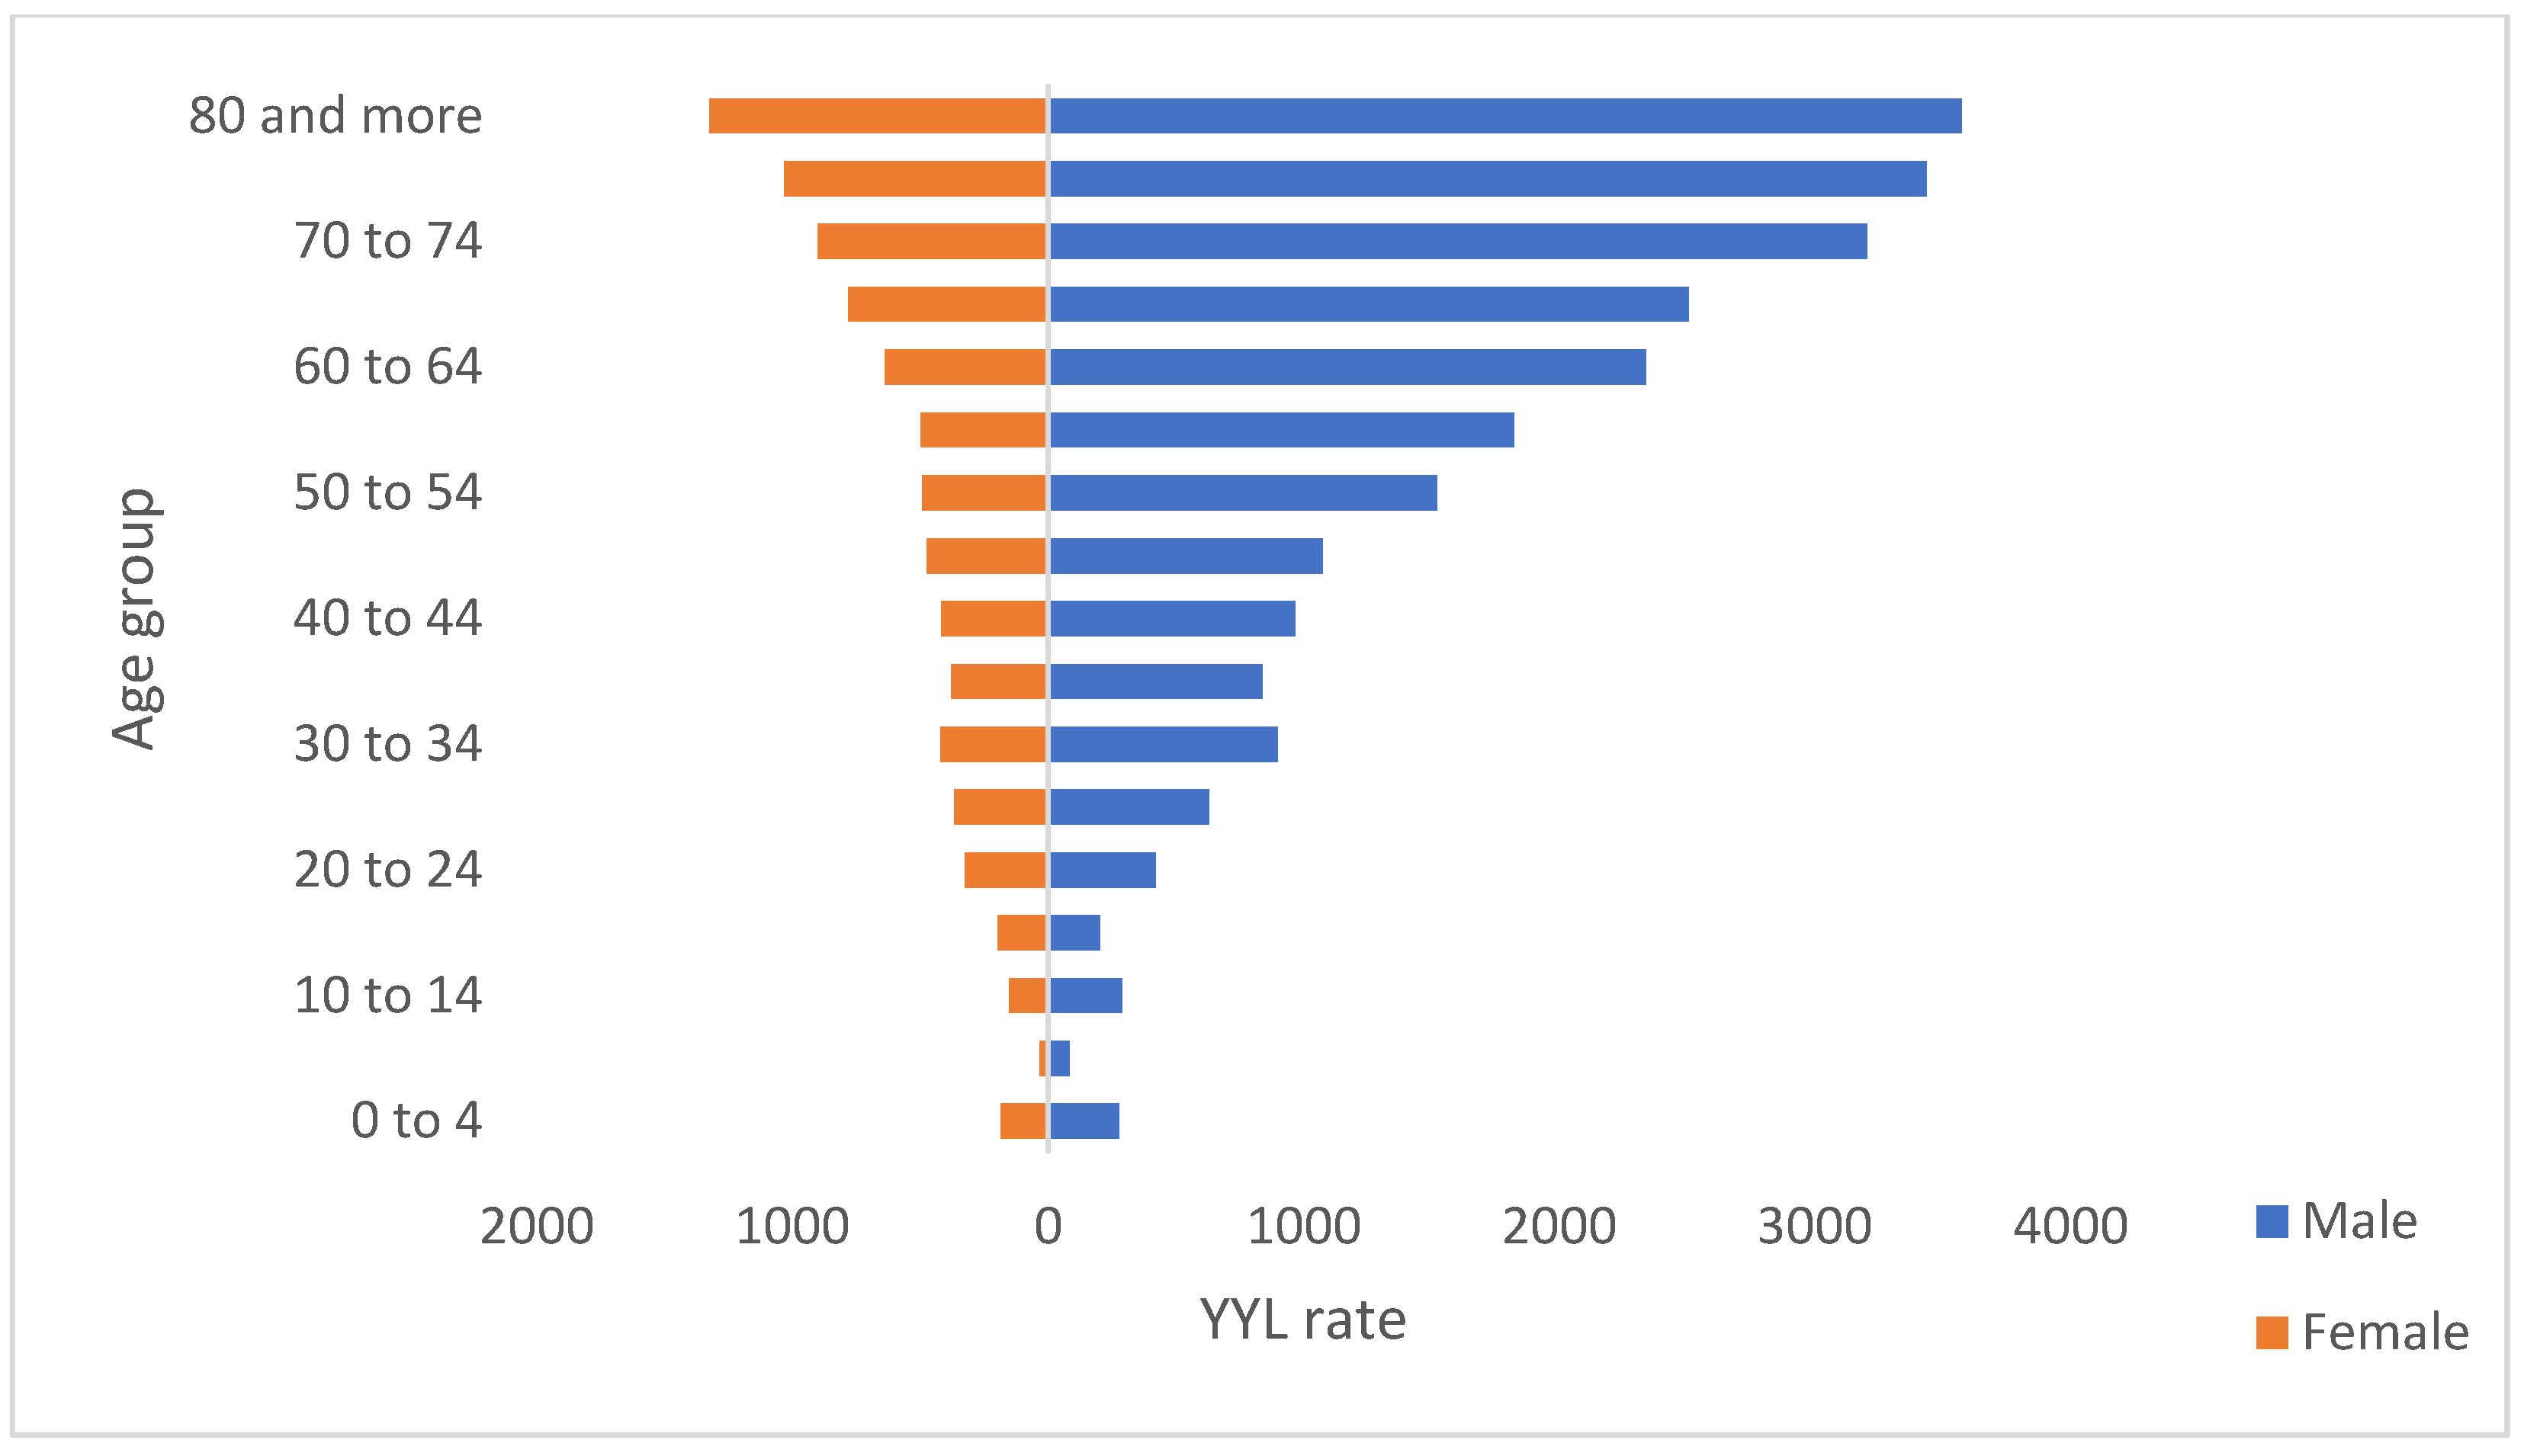
2.2.1. Years of Life Lost (YYL): Deadly Effects of TB
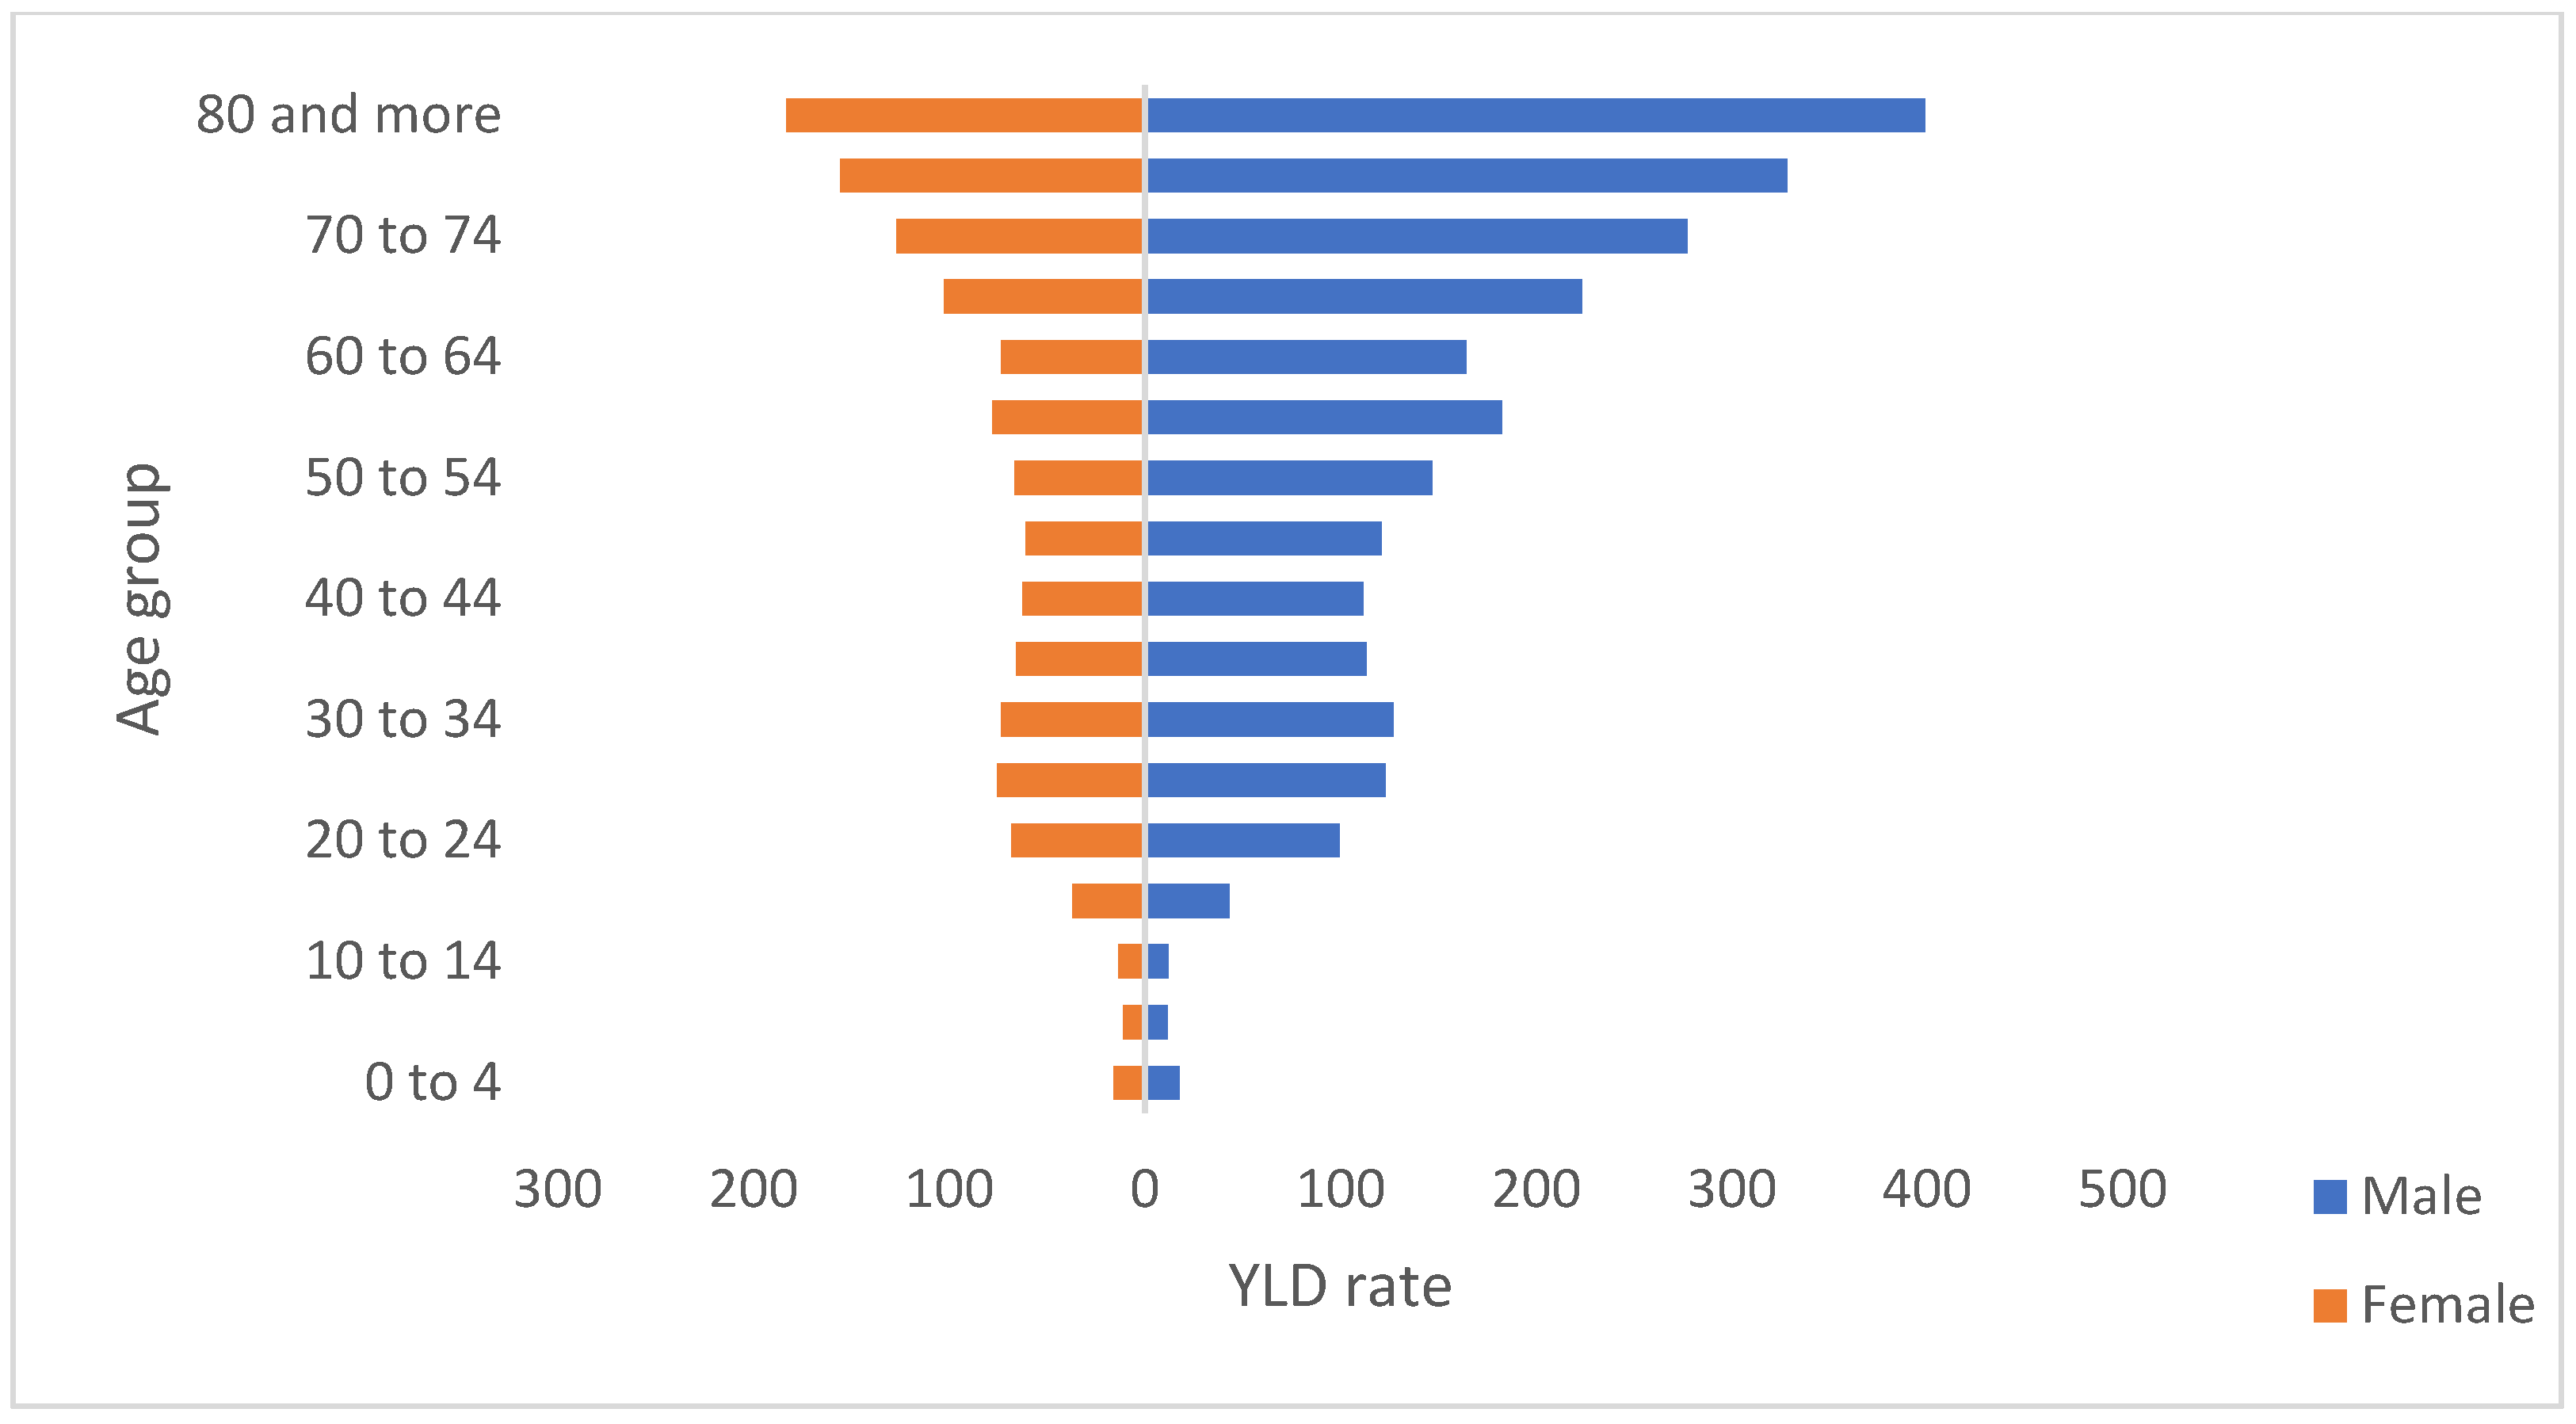
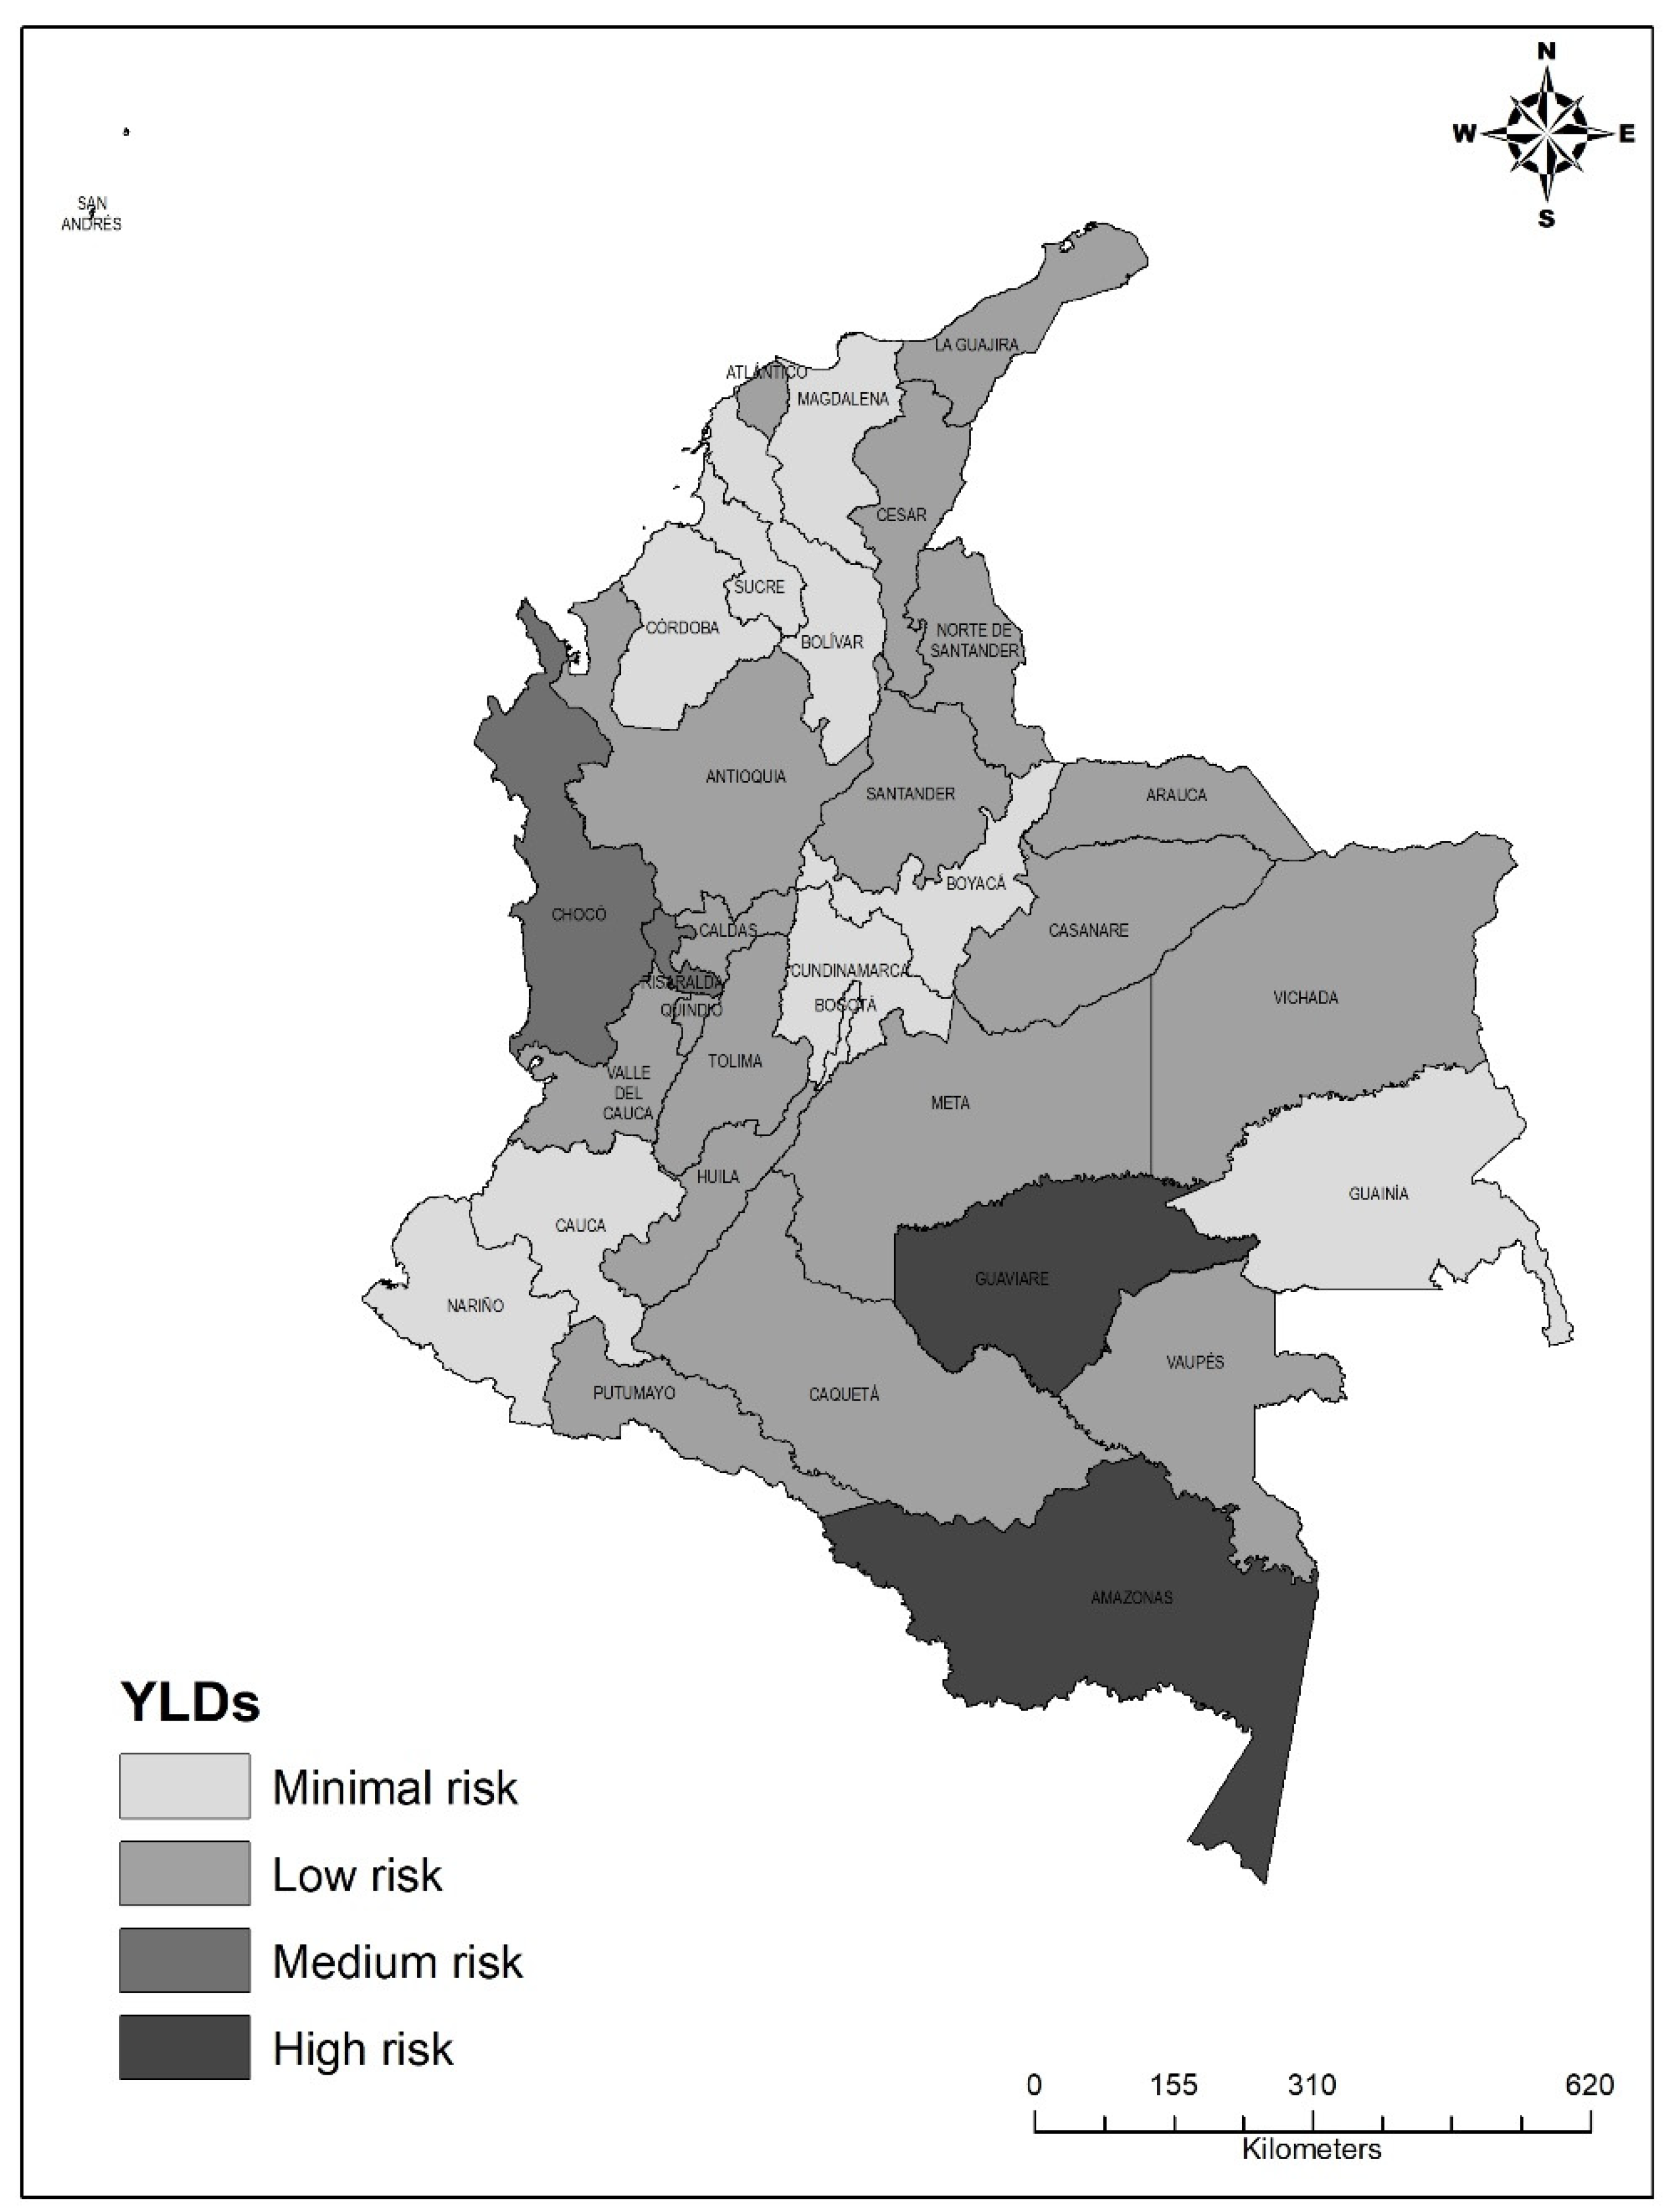
2.2.2. Years of Life with Disability (YLD): Non-Fatal Effects of TB
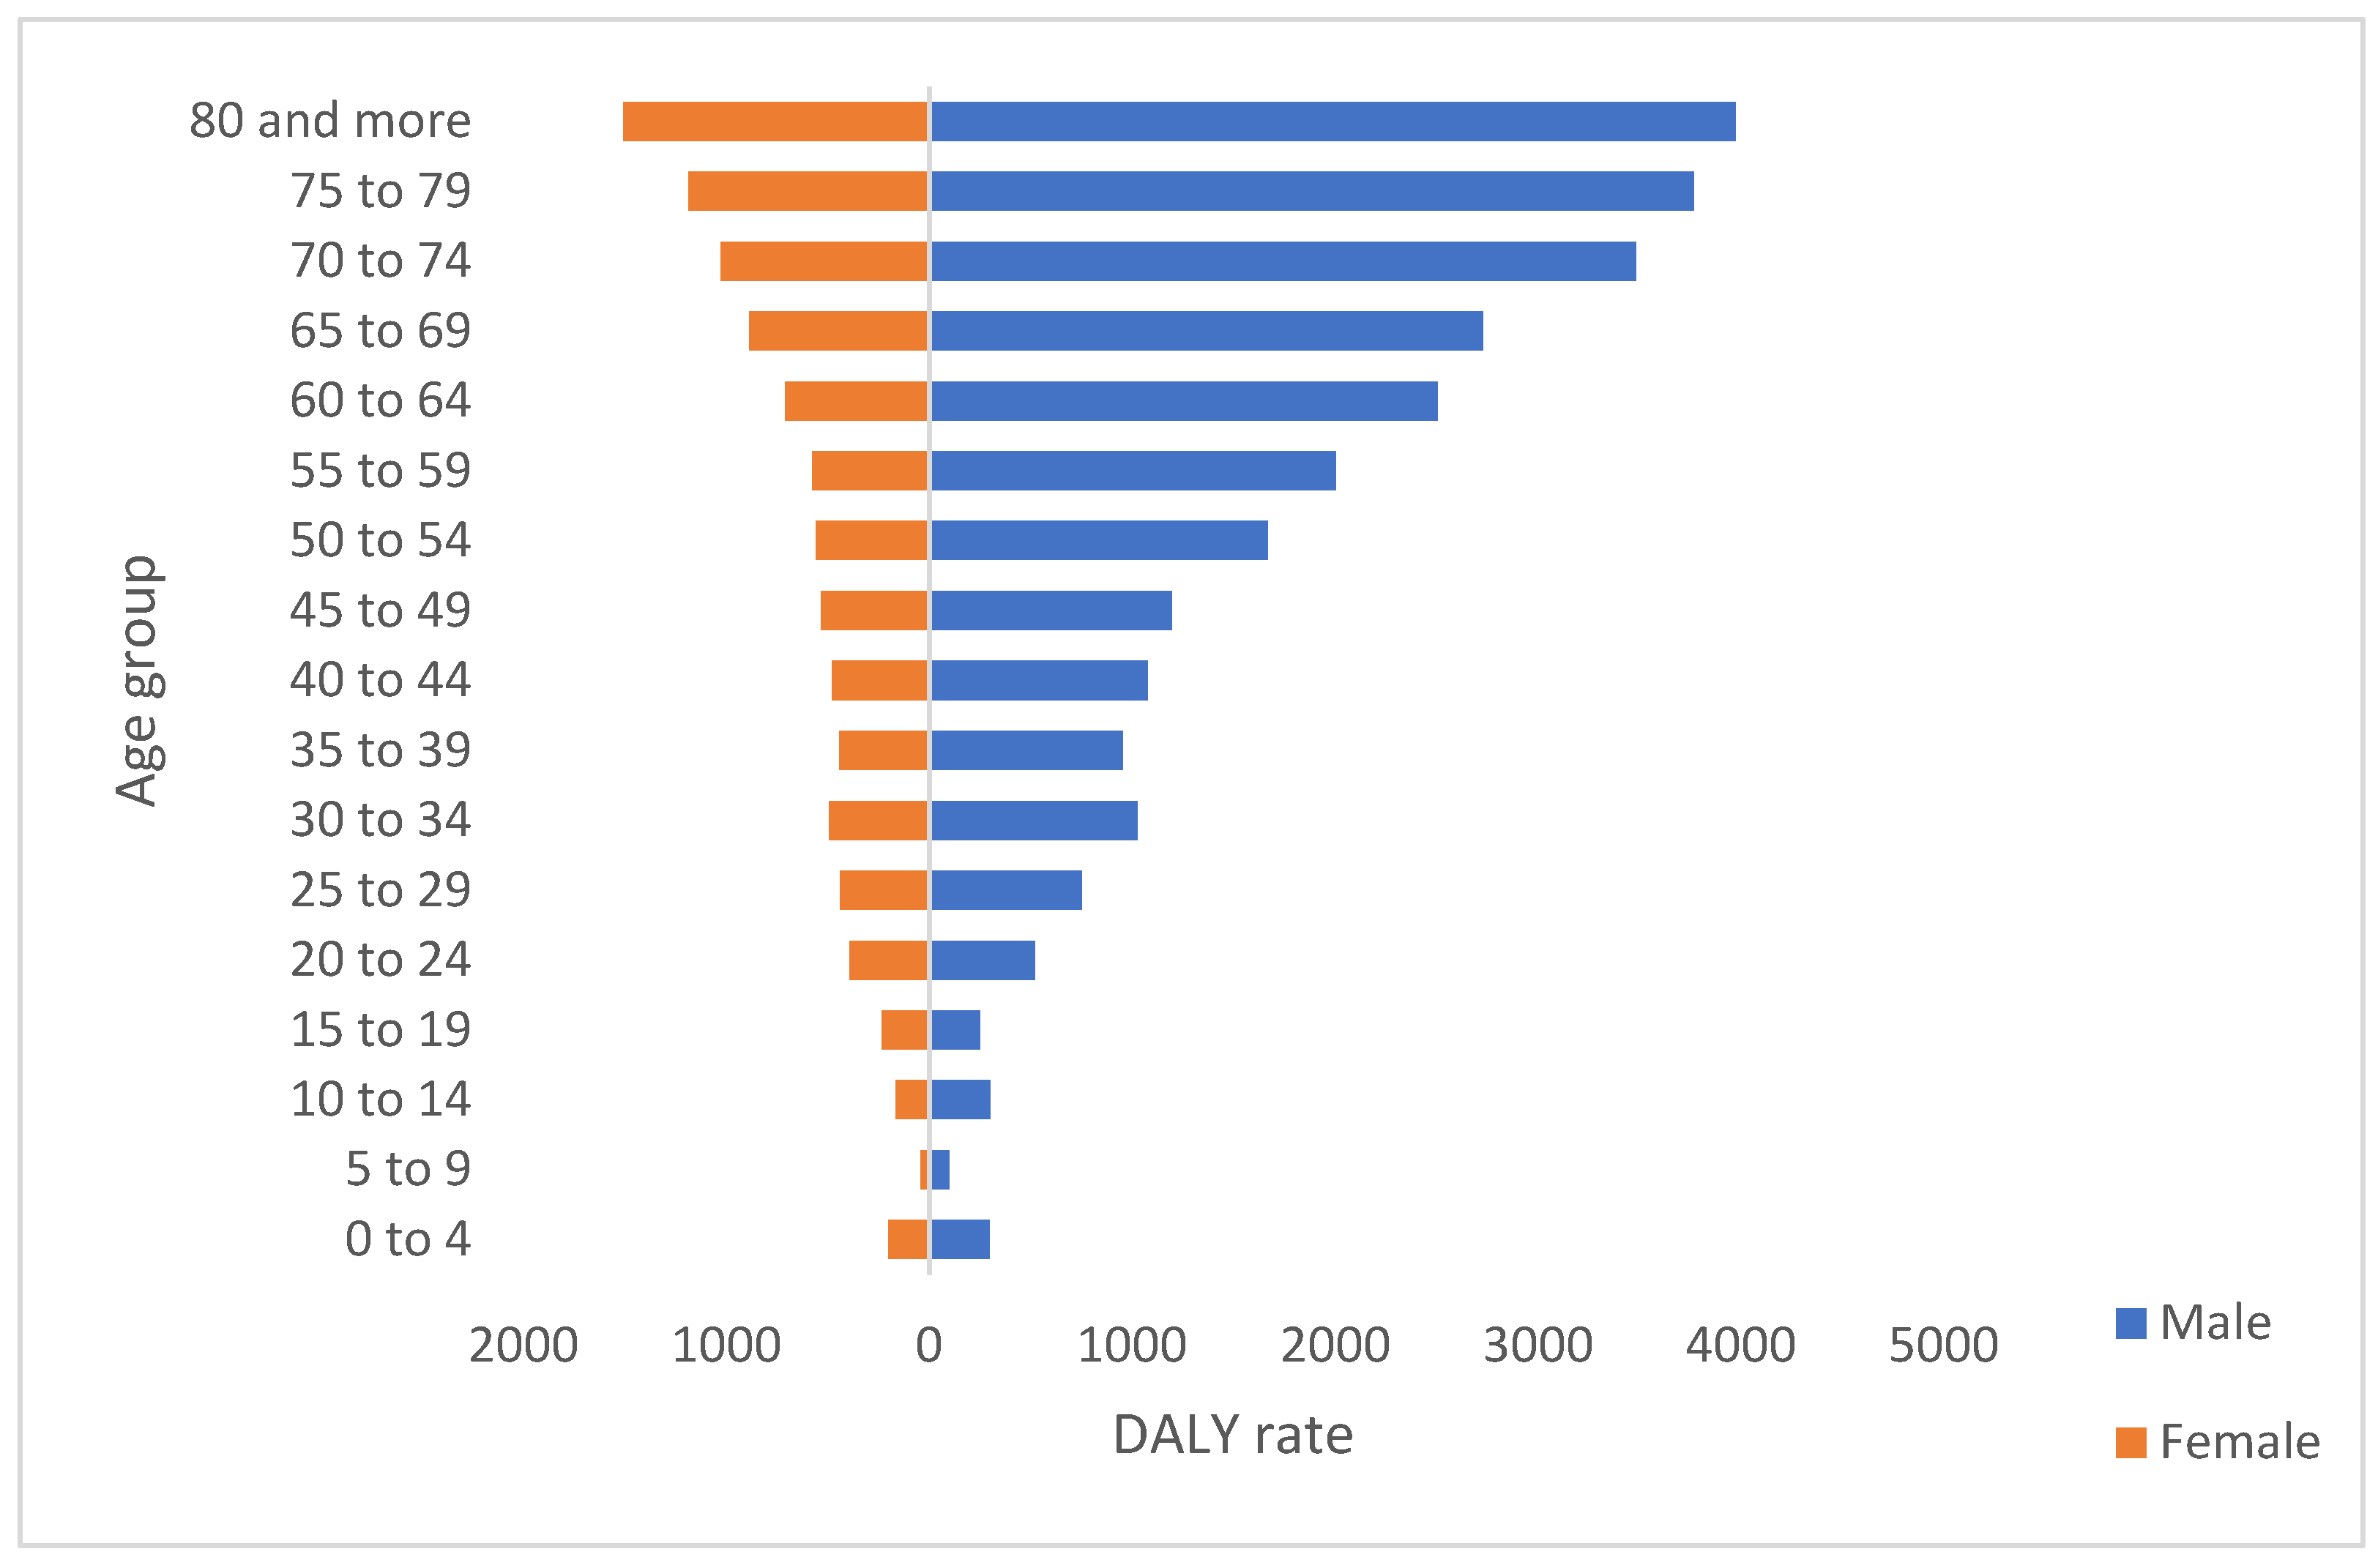
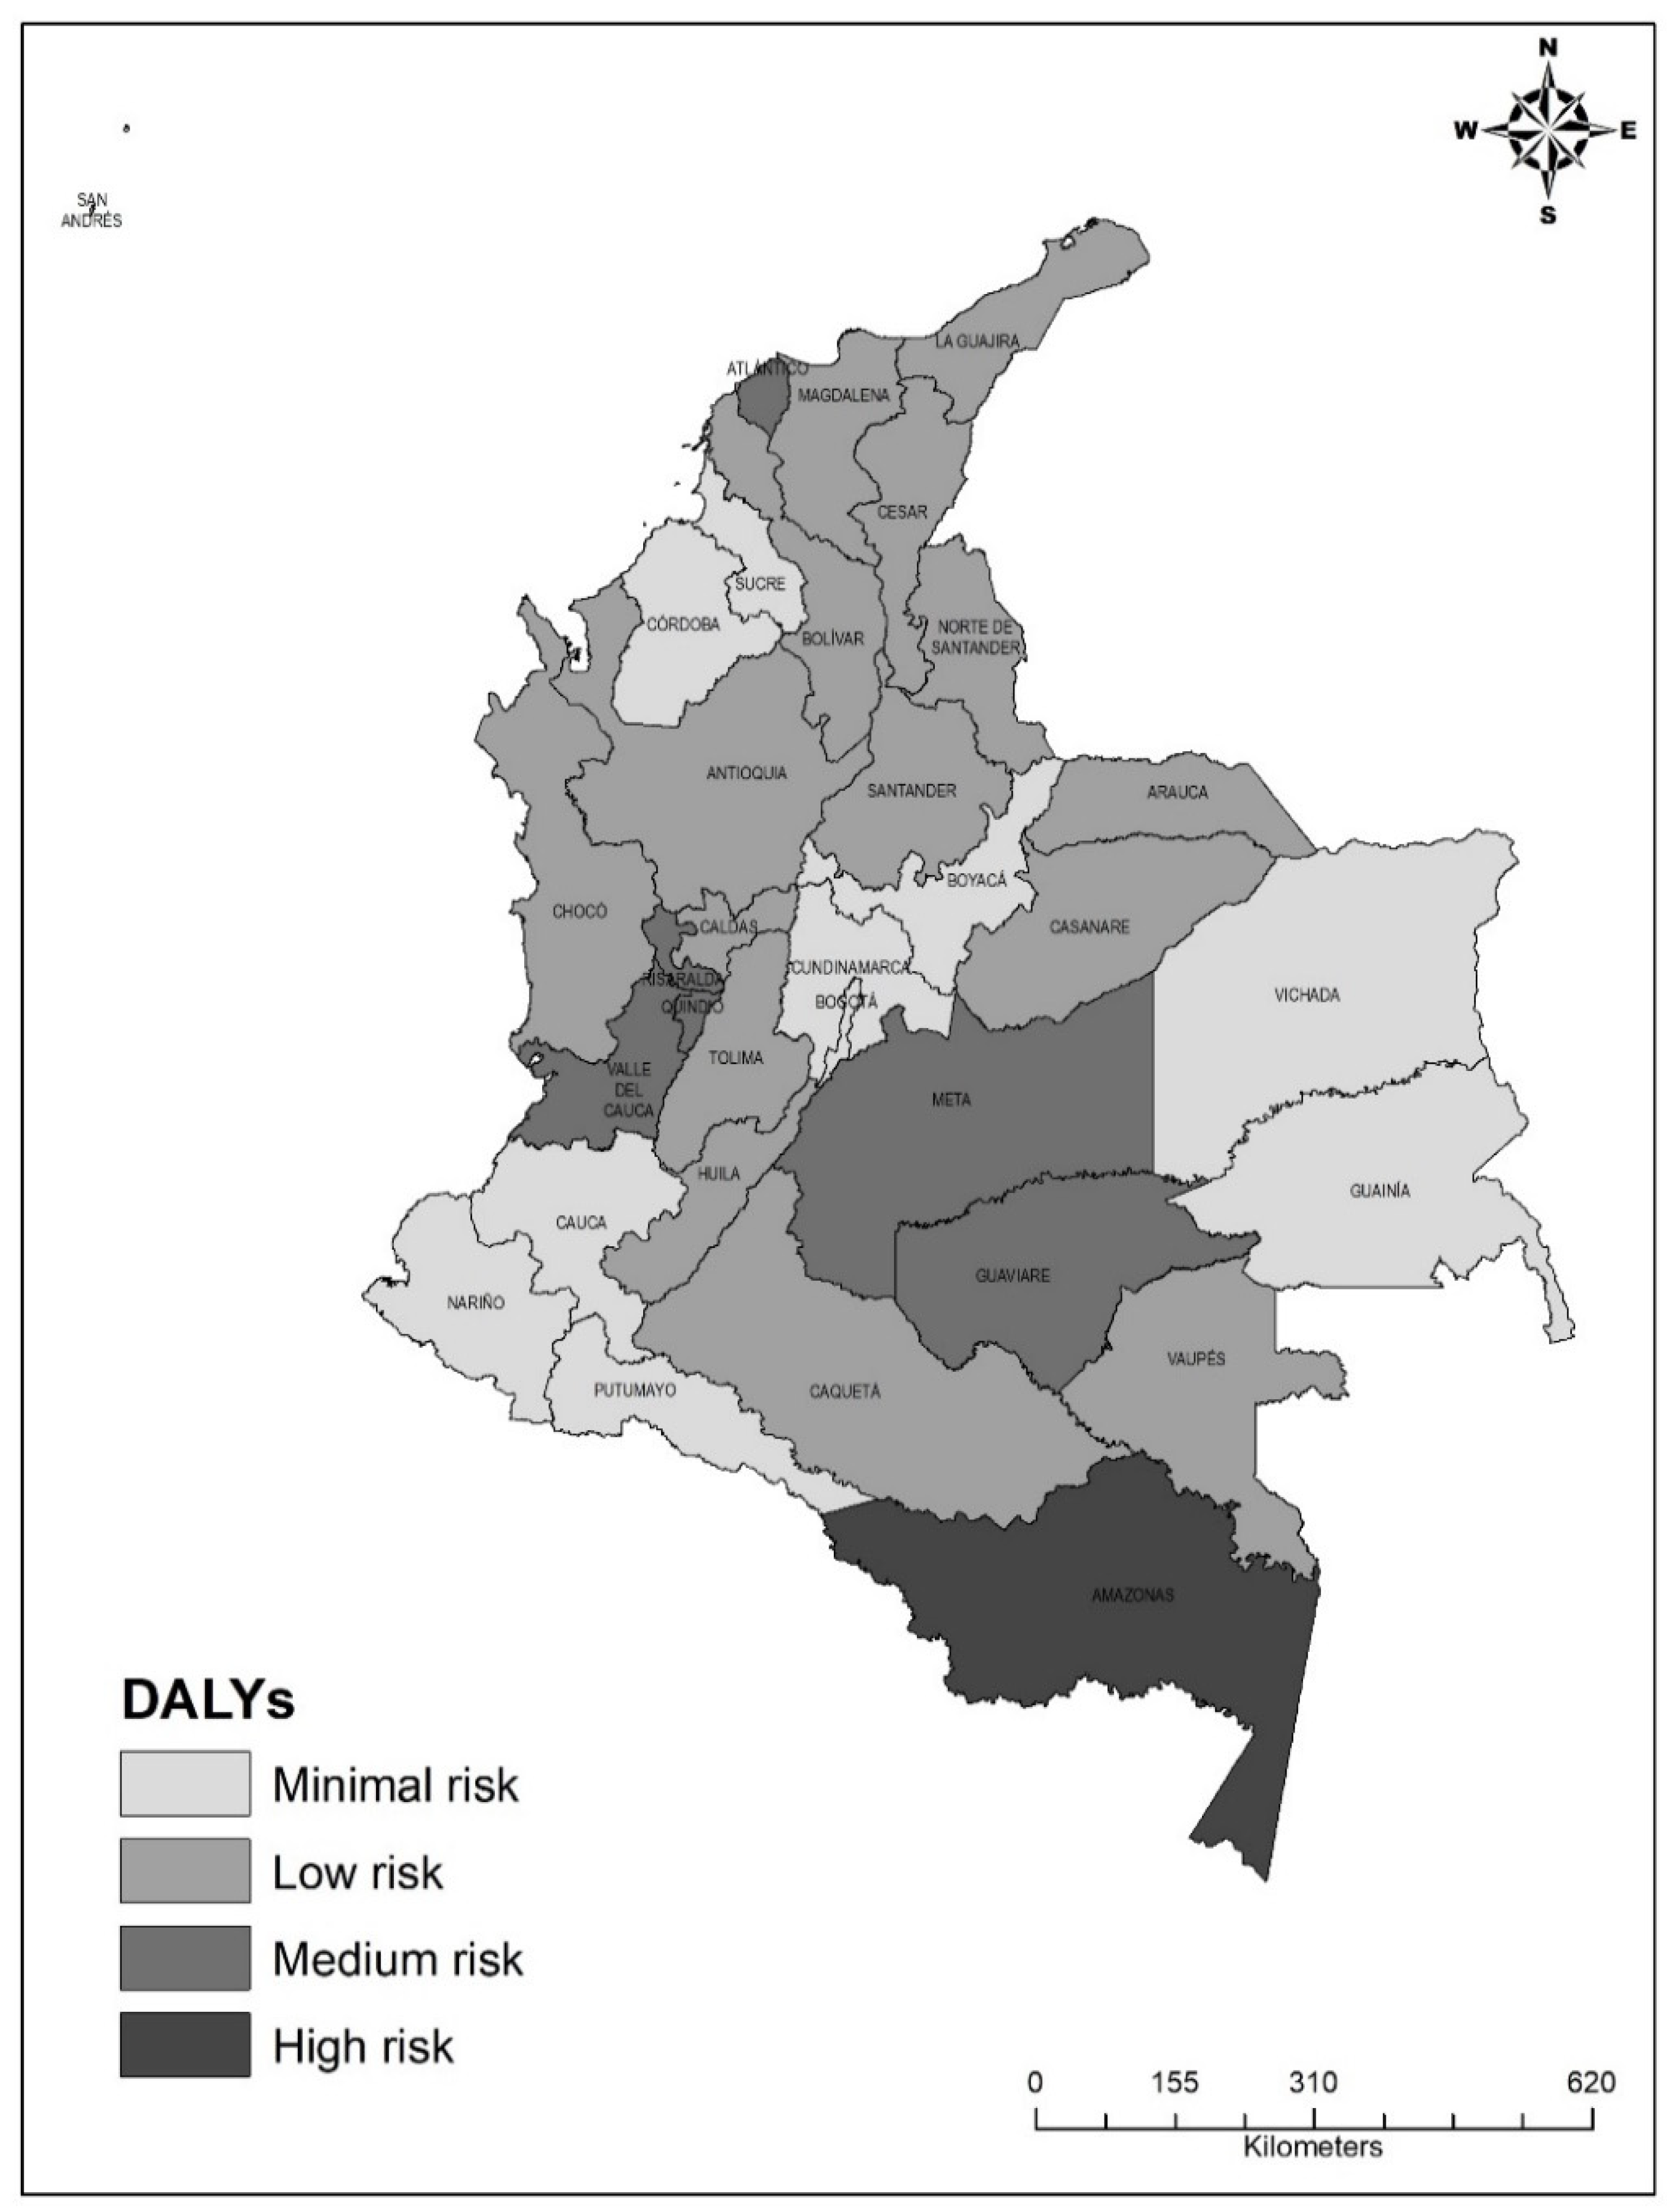
2.2.3. Disability-Adjusted Life Years (DALYs) or Healthy Life Years Lost to TB
2.3. Bias Control
2.4. Ethical Considerations
3. Results
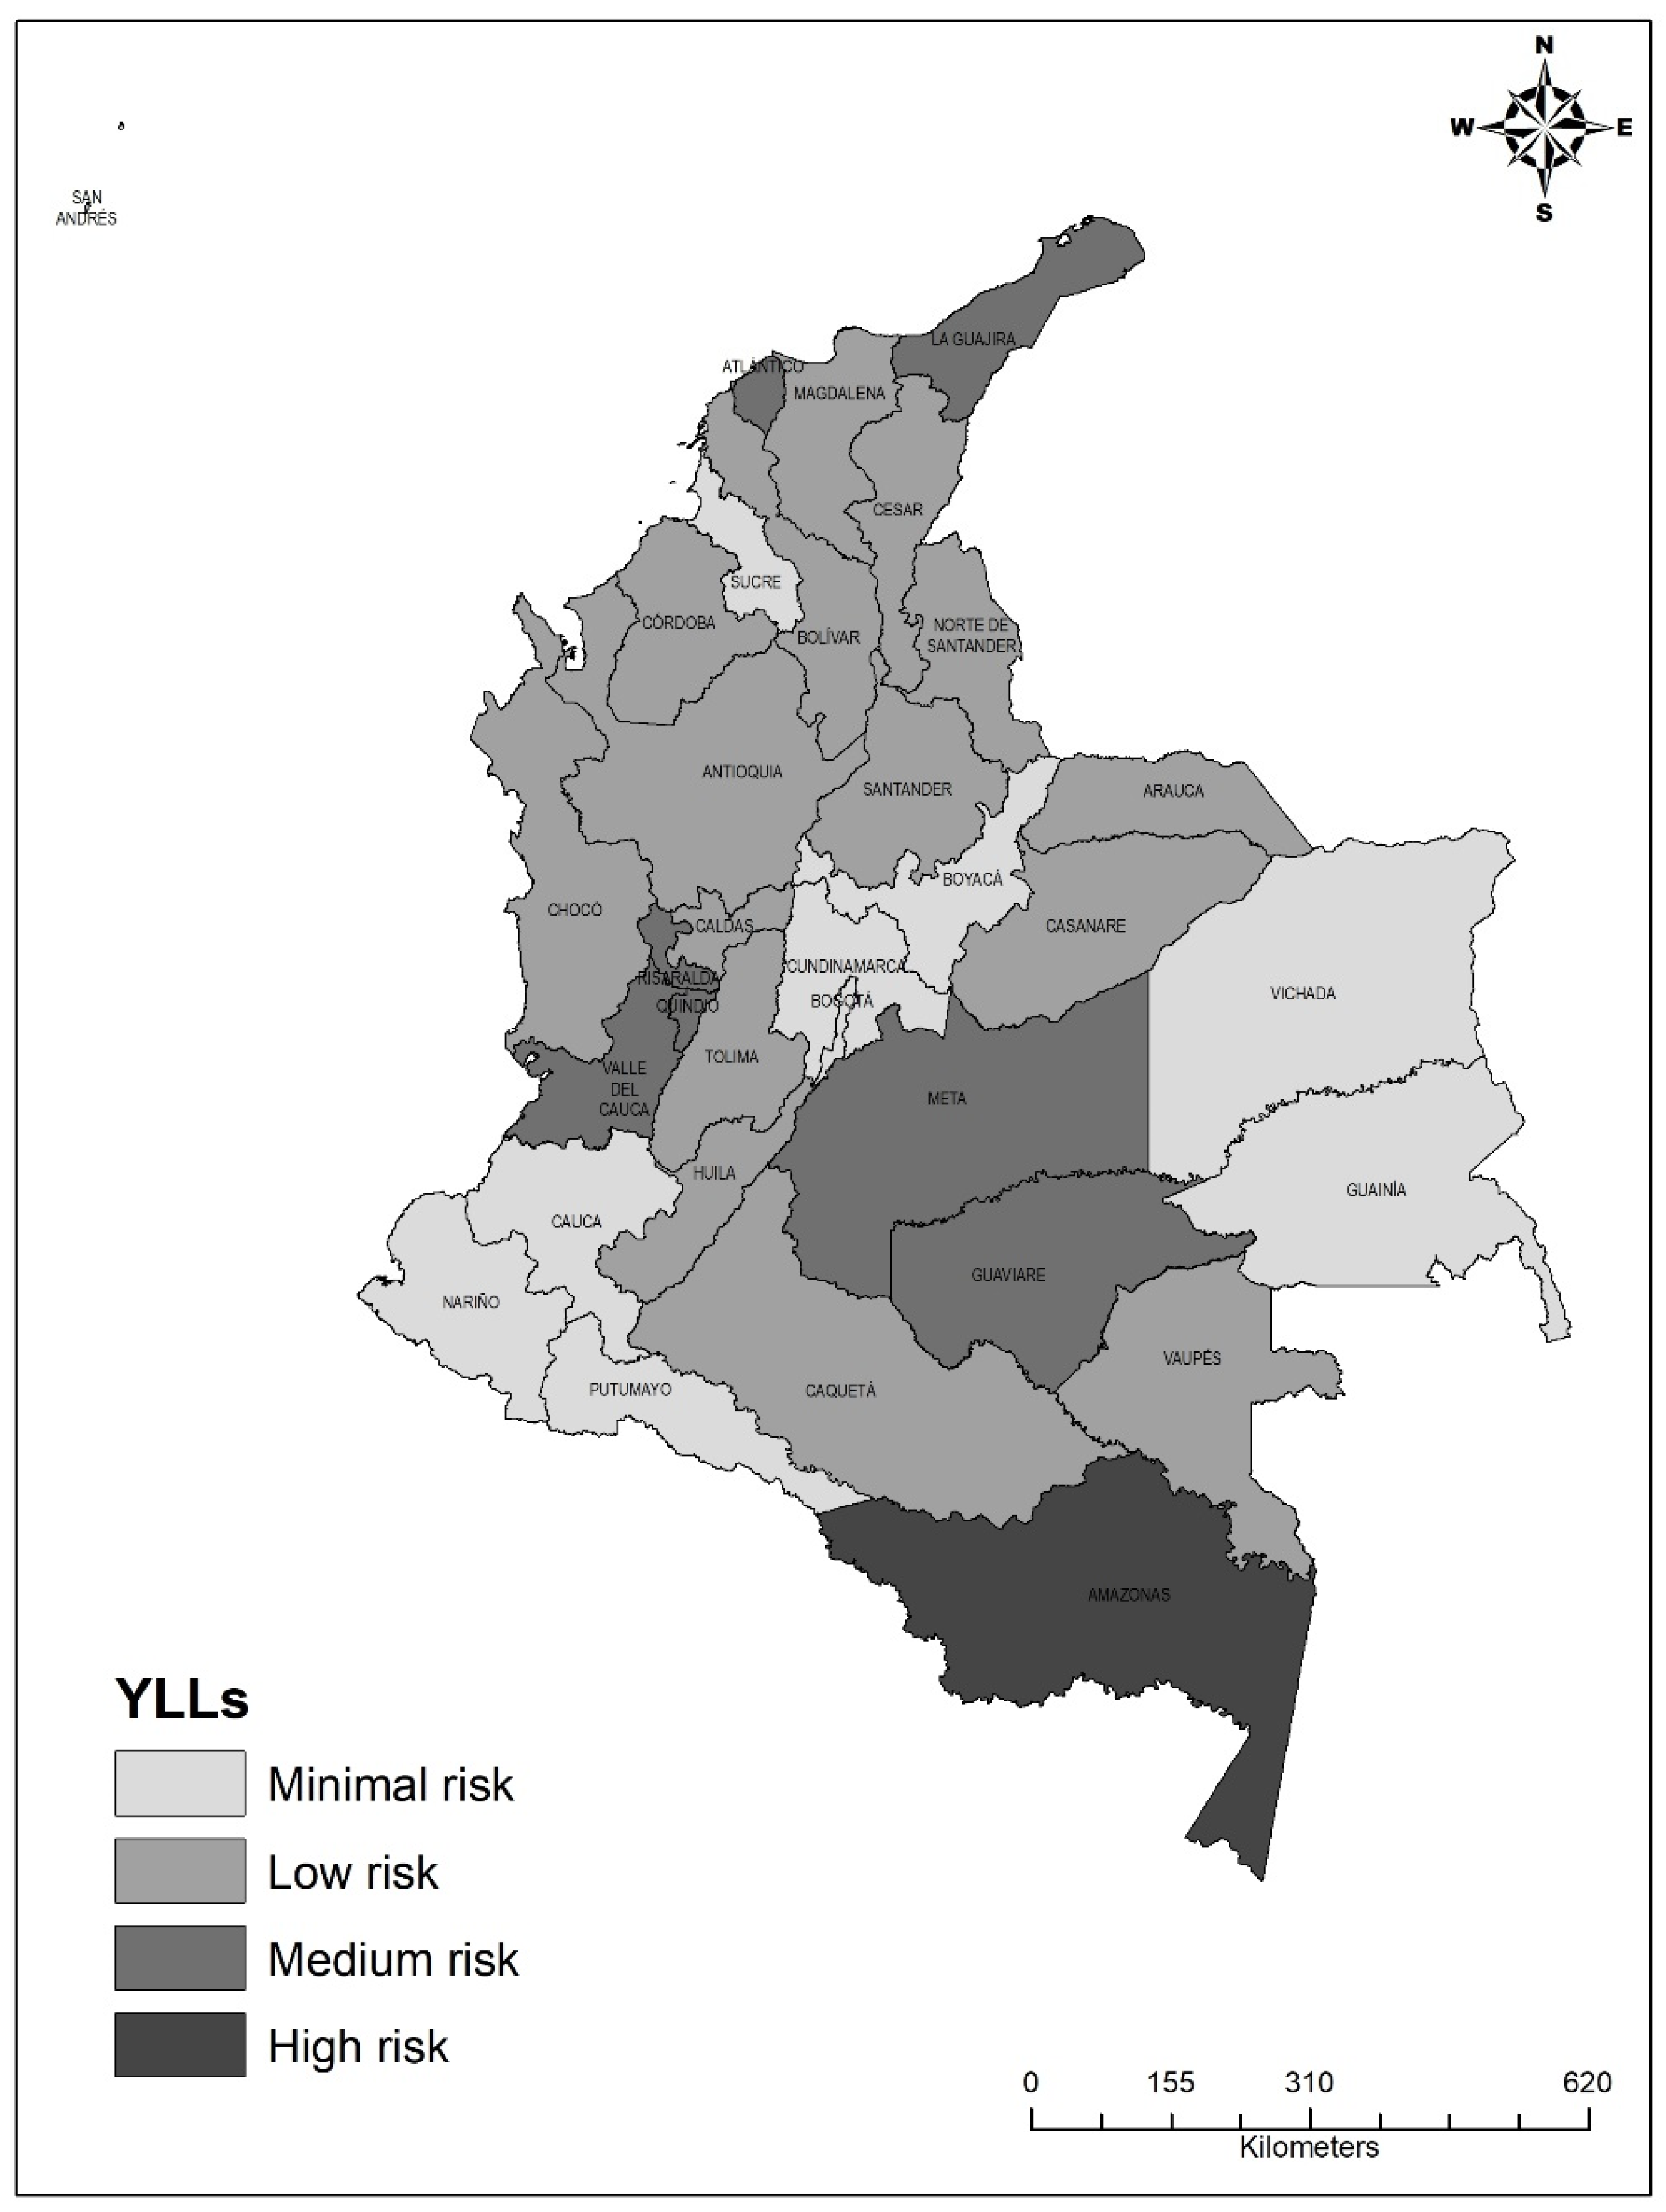
3.1. Years of Life Lost (YYL): Deadly Effects of TB
3.2. Years of Life with Disability (YLD): Non-Fatal Effects of TB
3.3. Disability-Adjusted Life Years (DALYs) or Healthy Life Years Lost to TB
4. Discussion
5. Limitations
Author Contributions
Funding
Institutional Review Board Statement
Informed Consent Statement
Data Availability Statement
Acknowledgments
Conflicts of Interest
Appendix A

| Territorial Entities | Year | YYL | YLD | DALY | ||||||
|---|---|---|---|---|---|---|---|---|---|---|
| Women Rate (CI 95%) | Men Rate (IC 95%) | Total Rate (CI 95%) | Women Rate (CI 95%) | Men Rate (IC 95%) | Total Rate (CI 95%) | Women Rate (CI 95%) | Men Rate (IC 95%) | Total Rate (CI 95%) | ||
| AMAZONAS | 2010 | 0 (0–0) | 537.2 (0–963.9) | 272.9 (53.2–593.1) | 40.4 (24.6–55.3) | 56.6 (46.5–67.5) | 48.6 (38.9–58.7) | 40.4 (26.8–57.6) | 593.5 (203.4–1158.3) | 321.5 (113.9–783.8) |
| 2011 | 362.9 (0–742.5) | 57.7 (0–115.4) | 208.2 (29.2–538.2) | 34.2 (24.2–45.9) | 37.9 (26.8–53.4) | 36.1 (27.5–45.3) | 397.4 (34.2–1250.1) | 95.6 (32.5–303.3) | 244.4 (61.2–684.6) | |
| 2012 | 84.4 (0–169) | 243.6 (0–809.3) | 165 (0–390.8) | 22.8 (14–35.5) | 35.6 (26.5–43.1) | 29.3 (22.5–36.6) | 107.5 (17.3–274.3) | 279.2 (80.7–929.4) | 194.3 (34.7–399.6) | |
| 2013 | 299.8 (0–599.6) | 485.3 (0–1097.2) | 393.5 (104.4–763.5) | 29 (20.4–38.5) | 40.6 (26.8–65.3) | 34.9 (25.1–47) | 328.9 (39.6–759.7) | 525.9 (183.6–1159.3) | 428.4 (166.2–766.3) | |
| 2014 | 348.5 (0–709.1) | 150.7 (0–363.1) | 248.7 (24.9–492) | 16.9 (8.3–23.8) | 25.5 (19.2–35.8) | 21.2 (15–27.1) | 365.4 (12.6–910.7) | 176.2 (24.7–384.7) | 269.9 (90.9–611.6) | |
| 2015 | 56.3 (0–112.7) | 123.8 (0–253.1) | 90.4 (0–176.3) | 13.2 (7.9–16.7) | 32.3 (22.9–40.3) | 22.7 (17.1–28.5) | 69.6 (10.6–181.5) | 156.1 (30.4–319.4) | 113.2 (32.4–216) | |
| 2016 | 0 (0–0) | 129.4 (0–258.9) | 65.1 (0–130.2) | 48.8 (30.8–64.7) | 67.8 (38.7–86.9) | 58.4 (43.6–71.2) | 48.8 (33.2–66.3) | 197.3 (51.3–480.9) | 123.5 (49.7–255) | |
| 2017 | 54.9 (0–109.9) | 90.9 (0–181.5) | 73 (0–191.5) | 14.7 (7.7–21.4) | 28.1 (21.2–36.5) | 21.4 (15.8–27.8) | 69.7 (8.5–207.7) | 118.7 (23–301.9) | 94.3 (20.5–216.4) | |
| 2018 | 0 (0–0) | 126.8 (0–253.7) | 63.7 (0–153.9) | 17.8 (9.7–26.7) | 31.1 (19.2–48.8) | 24.5 (16.5–32.9) | 17.8 (8.7–26.2) | 157.9 (21.5–412.6) | 88.2 (20.2–221.2) | |
| 2010–2108 | 1189.9 (381.7–2093.9) | 1925.8 (1098.6–2676.5) | 1561.1 (996.7–2232.5) | 236.4 (197.6–285.4) | 354.7 (297.4–416) | 296.1 (255.1–348.3) | 1426 (725.4–2541.4) | 2280.5 (1507.7–3351.2) | 1857.1 (1177.1–2389.6) | |
| ANTIOQUIA | 2010 | 51.4 (33.9–78.2) | 111.1 (67.1–179.8) | 80.5 (52.8–120.2) | 10 (7.3–13.5) | 14.8 (11.3–17.6) | 12.3 (10.1–14.7) | 61.4 (36–85.2) | 125.8 (77.6–188.1) | 92.9 (69.7–129.6) |
| 2011 | 42 (28.7–66) | 138.4 (80.5–199.7) | 89.1 (60.5–123.3) | 9.9 (7.7–13.2) | 15.9 (12.7–20) | 12.9 (10.5–15.4) | 51.9 (34.6–73.1) | 154.3 (93.2–206.9) | 101.9 (71.5–135) | |
| 2012 | 52.9 (31.3–81.8) | 130.8 (73.7–174.2) | 91 (69.8–116.4) | 9 (7–11.1) | 15.1 (10.4–18.9) | 12 (9.3–14.6) | 61.9 (38.8–90.3) | 146 (97.8–207.9) | 103 (69.5–124) | |
| 2013 | 65.3 (34.3–103.8) | 102.5 (71.4–136.2) | 83.5 (67–106) | 9.7 (7.2–12.4) | 15.3 (11.4–18.9) | 12.5 (10.1–15.3) | 75 (47.6–104.9) | 117.9 (91.1–148.1) | 96 (75.1–133.6) | |
| 2014 | 42.8 (24.4–56.9) | 129.1 (87.9–179) | 85 (60.5–112.1) | 9.5 (7.1–12.3) | 16.3 (12.1–19.9) | 12.8 (10.2–15.6) | 52.3 (37.7–69.3) | 145.4 (104.1–195) | 97.8 (65.8–117.5) | |
| 2015 | 38.3 (19.6–64.4) | 111.7 (72.7–175.6) | 74.1 (51.3–99.2) | 9.1 (7.2–12.6) | 16.5 (13–21.7) | 12.7 (10.1–15.5) | 47.4 (26.1–78.4) | 128.2 (79.6–182.8) | 86.9 (56.4–116.3) | |
| 2016 | 49 (32.1–67.6) | 125.9 (79.8–168.4) | 86.6 (57.6–114) | 9.1 (6.5–11.6) | 17.2 (11.3–21.4) | 13.1 (10.2–16.1) | 58.1 (37.8–81.3) | 143.1 (98.9–184.9) | 99.7 (76.6–129.4) | |
| 2017 | 40.1 (25.4–58.5) | 115 (68.3–140.4) | 76.7 (56.7–101.6) | 9.4 (6.8–11.8) | 17.6 (12.4–22.3) | 13.4 (10.3–16.9) | 49.5 (33.4–74.3) | 132.6 (78.7–166.2) | 90.1 (71–119.7) | |
| 2018 | 47.1 (32.7–62.7) | 140.9 (101.9–205.2) | 92.9 (64.8–119.8) | 9 (6.7–11.5) | 17 (12.4–25.1) | 12.9 (9.8–16.6) | 56.1 (38.4–73.5) | 158 (116.5–217.5) | 105.9 (73.3–145.4) | |
| 2010–2108 | 428 (317.3–544) | 1106.1 (794.9–1379.8) | 759.3 (606.7–950.2) | 84.8 (68.6–108.8) | 146.2 (115.8–186.9) | 114.8 (92.1–140.9) | 512.8 (394.1–682.2) | 1252.2 (937.1–1557.2) | 874.1 (707.4–1086.5) | |
| ARAUCA | 2010 | 17.4 (0–36.1) | 75.6 (0–211.7) | 46.7 (3.8–149.8) | 3.8 (2.1–5.5) | 12.6 (8.6–16.2) | 8.2 (5.7–11.6) | 21.2 (2.7–57.4) | 88.1 (10.6–227.7) | 54.9 (9.5–118.4) |
| 2011 | 46.9 (0–123.3) | 104.9 (13.5–237.8) | 76.1 (20.6–180) | 6.4 (4.8–8.4) | 9.5 (6.1–12.4) | 8 (6.1–10.1) | 53.3 (15.5–148) | 114.4 (10.4–303.6) | 84.1 (31.8–142.4) | |
| 2012 | 67.1 (10.3–210) | 33.8 (0–101.4) | 50.3 (13.7–110.1) | 7.2 (3.4–10.6) | 10.2 (7.3–12.7) | 8.7 (6.3–11.3) | 74.2 (18.3–209.5) | 44 (10.3–139.2) | 59 (20–107.5) | |
| 2013 | 17.4 (0–34.9) | 33.2 (0–73.4) | 25.4 (0.2–50.1) | 7.3 (4.7–9.7) | 20.1 (15.2–27) | 13.8 (9.7–17.9) | 24.8 (5.7–75.8) | 53.3 (20.9–118.5) | 39.1 (19.8–72) | |
| 2014 | 0 (0–0) | 155 (65.8–296.2) | 78 (14.3–156.5) | 9.9 (7.2–13.2) | 15.1 (12–18.4) | 12.4 (9.6–15.1) | 9.9 (7–12.7) | 170.1 (75–323.8) | 90.5 (41.8–164.8) | |
| 2015 | 23.5 (0–35.8) | 52.5 (0–106.5) | 38.2 (0–78.1) | 13 (10.2–17.2) | 18.2 (14.6–25.7) | 15.6 (12.9–18.9) | 36.6 (10.9–103) | 70.7 (13.7–150) | 53.8 (25.5–93.3) | |
| 2016 | 29 (0–75.6) | 81.4 (9.7–170.7) | 55.3 (12–118) | 12.4 (8.7–14.9) | 13.5 (7.7–18.5) | 12.9 (10.1–16) | 41.3 (10.4–71.9) | 94.9 (12.4–211.1) | 68.3 (25.9–118.9) | |
| 2017 | 9.7 (0–19.3) | 117 (5.9–237.3) | 63.5 (11.5–123.3) | 8.5 (5.5–11) | 14.6 (10.9–20.4) | 11.6 (9.1–14.6) | 18.1 (7–43.3) | 131.6 (13.2–227.6) | 75.1 (15.1–157.3) | |
| 2018 | 71 (0–172.6) | 200.8 (61.1–388.2) | 136.2 (33.9–210.5) | 8.9 (6.6–11.9) | 16.9 (12.7–21) | 12.9 (10–16.3) | 79.9 (9.6–175.2) | 217.7 (63.5–380.6) | 149.1 (66.9–269.3) | |
| 2010–2108 | 282.1 (156.2–450.9) | 860.6 (581.9–1161.7) | 573.2 (428.7–866.9) | 77.8 (67.2–90.5) | 130.9 (112–148.6) | 104.5 (90–122.1) | 359.9 (198.9–509.8) | 991.6 (724.5–1309.2) | 677.7 (463.8–873.9) | |
| ATLANTICO | 2010 | 81.8 (52.1–141.4) | 191.4 (118–286.9) | 135.9 (93–181.2) | 11.1 (8.1–13.1) | 15.1 (11.8–18.5) | 13 (11–15.4) | 92.8 (56.7–149.5) | 206.5 (148.1–287.1) | 148.9 (102.7–211.5) |
| 2011 | 48.9 (26–76.4) | 104.4 (58.9–148.5) | 76.3 (41.8–103.7) | 8.1 (6.6–9.5) | 12.5 (8.4–15.3) | 10.3 (8.5–12.1) | 57 (30.7–93.6) | 116.8 (77.3–171.7) | 86.5 (61.9–108.4) | |
| 2012 | 99.6 (60.1–168) | 155.6 (118.1–203.8) | 127.2 (80.3–166.1) | 8.6 (6.1–10.6) | 14.3 (10.3–18.3) | 11.4 (8.9–14.1) | 108.3 (63.1–159.3) | 169.8 (123.7–242.1) | 138.7 (108–188) | |
| 2013 | 80.1 (42.6–109.5) | 182.4 (114.7–277.5) | 130.6 (85.4–170) | 8.4 (5.9–10.6) | 15.9 (12.8–20.1) | 12.1 (9.5–15) | 88.5 (60.4–121) | 198.2 (120.4–310) | 142.7 (90.2–187.4) | |
| 2014 | 79.2 (46.1–111.2) | 176.2 (122.3–242.2) | 127.1 (98.5–179.8) | 9.4 (7.6–12.3) | 15.5 (10.6–19.9) | 12.4 (9.5–15.6) | 88.6 (42.3–115.3) | 191.7 (120.9–237.6) | 139.5 (112.6–183) | |
| 2015 | 73.7 (46.7–114.1) | 149.8 (85.6–187.1) | 111.3 (81.3–136.9) | 9.1 (7–10.8) | 16.8 (12.1–20.4) | 12.9 (10.3–16) | 82.8 (58.6–129) | 166.6 (109.7–227.8) | 124.2 (88.5–159.5) | |
| 2016 | 42.5 (21.3–67.2) | 147.7 (93.4–195) | 94.5 (66.9–137.7) | 8.4 (7.1–9.9) | 17 (12.5–20.7) | 12.6 (10.1–15.7) | 50.9 (31.4–83.3) | 164.7 (116.2–220) | 107.1 (77.3–145.6) | |
| 2017 | 62.8 (31.8–83.1) | 197.2 (154–247) | 129.2 (96.9–167.3) | 9.8 (6.4–12.2) | 14.6 (10.9–18.1) | 12.2 (9.7–14.7) | 72.6 (47.2–98.7) | 211.8 (173.3–268.3) | 141.4 (101.5–179.2) | |
| 2018 | 107.5 (76.6–151.9) | 189.9 (133.8–277.4) | 148.2 (109.7–199) | 8.3 (6.6–10.6) | 14.2 (9.9–18.6) | 11.2 (8.4–14) | 115.8 (75.4–156.2) | 204.1 (155.5–265.7) | 159.5 (119.3–204.6) | |
| 2010–2108 | 676.1 (557.7–828) | 1496.9 (1042.9–1748.7) | 1081.5 (891.7–1299.7) | 81.1 (61.7–100.5) | 135.8 (98.6–167.6) | 108.1 (89–129.2) | 757.2 (553.8–901.1) | 1632.7 (1232.9–1941) | 1189.6 (988.1–1392.5) | |
| BOGOTA | 2010 | 19.8 (9.9–28.1) | 63.6 (49.5–83) | 40.9 (30.2–50.7) | 3.1 (2.4–3.9) | 5.2 (4.1–6.3) | 4.1 (3.3–4.9) | 23 (13.7–34) | 68.8 (57.4–85.5) | 45 (36.1–56.3) |
| 2011 | 32.7 (20.8–41.5) | 54.5 (37.5–72.2) | 43.2 (30.2–54.9) | 2.9 (2.3–3.8) | 4.5 (3.6–5.4) | 3.7 (2.9–4.3) | 35.6 (26.7–47.2) | 59 (35.7–73.8) | 46.9 (36.9–61.7) | |
| 2012 | 25.8 (15.5–36.3) | 48 (30.6–63.6) | 36.5 (26.7–46.7) | 2.9 (2.1–3.4) | 5.2 (4.3–6.6) | 4 (3.1–4.7) | 28.7 (20.5–41.6) | 53.2 (36.5–67.3) | 40.5 (29.7–51) | |
| 2013 | 19 (12.3–26.6) | 59.9 (38.2–77.5) | 38.8 (29.3–57.3) | 2.3 (1.8–2.9) | 5.1 (4.2–6.2) | 3.6 (2.9–4.4) | 21.4 (12.4–32) | 65 (45.5–85.9) | 42.4 (28.5–59.3) | |
| 2014 | 22.5 (10.2–33.5) | 42.9 (28.5–64.1) | 32.4 (21.8–43.3) | 2.8 (2.1–3.5) | 5.4 (4.3–6.4) | 4.1 (3.3–4.9) | 25.3 (13.6–34.6) | 48.3 (29.8–62.5) | 36.4 (27.3–46.8) | |
| 2015 | 17.7 (7.9–26.5) | 49.5 (36.5–66.2) | 33.1 (24–43.1) | 2.6 (1.9–3.3) | 5.6 (4.4–6.7) | 4 (3.2–4.9) | 20.2 (13–31.1) | 55.2 (40.4–69.7) | 37.1 (25.4–48.2) | |
| 2016 | 19.1 (9.7–27.4) | 57.8 (41.2–76.5) | 37.8 (28.3–52.1) | 3.2 (2.5–4.5) | 6.1 (4.6–7.3) | 4.6 (3.8–5.5) | 22.2 (14.8–32.5) | 63.9 (47.4–79.8) | 42.4 (29.7–53.5) | |
| 2017 | 15.3 (5.9–25.4) | 49.4 (35.8–74.6) | 31.8 (19.9–45.6) | 3 (2.3–3.7) | 5.5 (4–6.7) | 4.2 (3.4–5) | 18.3 (9–29.9) | 54.9 (34.2–78.8) | 36 (24.7–53.1) | |
| 2018 | 21.2 (12.9–29.9) | 50.6 (38–66.6) | 35.5 (25.4–45.6) | 2.8 (1.9–3.9) | 5.2 (3.6–6.6) | 4 (2.9–4.9) | 23.9 (14.4–34.4) | 55.9 (42.5–74.8) | 39.4 (30–51.3) | |
| 2010–2108 | 192.4 (158.5–228.6) | 475.4 (361.4–580.1) | 329.1 (254.4–387) | 25.4 (19.8–30.7) | 47.9 (38.6–58) | 36.3 (29.4–43.2) | 217.8 (168.5–263) | 523.3 (400.5–663) | 365.4 (290.4–453.4) | |
| BOLIVAR | 2010 | 41.9 (26.2–68.9) | 54.6 (32.4–80.8) | 48.2 (36.5–69.7) | 3.1 (2–3.9) | 4.8 (3.7–5.9) | 4 (3.1–4.9) | 45 (22.2–62.7) | 59.4 (40.4–84.6) | 52.2 (33.5–67.6) |
| 2011 | 32.8 (12.2–61.5) | 66.7 (37.8–92.6) | 49.8 (33.1–70.4) | 3.3 (2.7–3.9) | 4.4 (2.8–5.5) | 3.8 (3–4.7) | 36.1 (17.5–79.5) | 71.1 (42.6–107.1) | 53.6 (37.1–78.8) | |
| 2012 | 48.9 (25.8–85.9) | 52.8 (30.9–77.1) | 50.8 (31.7–70) | 4 (3.3–5.2) | 6.2 (4.8–7.7) | 5.1 (4.2–6.2) | 52.9 (27.6–87.5) | 59 (32–76.6) | 55.9 (35.3–76.3) | |
| 2013 | 33.4 (15.9–61.2) | 42.2 (21.6–72.7) | 37.8 (21.4–54.1) | 4.4 (3.4–5.5) | 6.9 (5.4–9.4) | 5.6 (4.6–6.9) | 37.8 (18.5–62.4) | 49.1 (30.4–72.8) | 43.5 (22.6–56.8) | |
| 2014 | 37.3 (13.9–80.9) | 62.5 (33.9–108.7) | 49.9 (31.9–78.6) | 5.6 (4.1–7.1) | 7.9 (5.9–10) | 6.7 (5.4–8.3) | 42.9 (11.3–79.2) | 70.4 (37.9–104.3) | 56.6 (32.9–81.1) | |
| 2015 | 12.5 (2.5–23.3) | 65.3 (29.6–99) | 38.9 (21.7–60.4) | 4 (3–5) | 7.7 (5.4–9.3) | 5.8 (4.6–7.2) | 16.4 (7.7–28.6) | 72.9 (47.4–112.2) | 44.7 (30.6–69.6) | |
| 2016 | 39.5 (9.2–84.3) | 59.8 (34.8–88.1) | 49.7 (28.1–81.9) | 4.7 (3.4–6.3) | 7.1 (5.5–8.6) | 5.9 (4.6–7.4) | 44.2 (11.8–91.1) | 66.9 (38–98.3) | 55.6 (34–90.3) | |
| 2017 | 12.9 (0–31.6) | 59.5 (35.3–88.2) | 36.2 (18.2–52.4) | 5.3 (3.9–7.1) | 9.7 (7.2–11.6) | 7.5 (5.8–9.2) | 18.2 (4.4–38.1) | 69.2 (43.8–89.2) | 43.7 (30–59) | |
| 2018 | 33.5 (19.2–49.3) | 95.7 (64.5–129.8) | 64.6 (45–88.6) | 4.7 (3–6.1) | 7.9 (5.7–9.9) | 6.3 (4.9–7.9) | 38.3 (23.3–51.2) | 103.6 (69.2–150.5) | 70.9 (50.3–93.3) | |
| 2010–2108 | 291.3 (192.1–432.7) | 561.5 (478.8–651.1) | 426.4 (360.3–554.7) | 39.3 (30.5–47.5) | 63 (49.9–80.3) | 51.1 (41–61.3) | 330.6 (220.5–463.8) | 624.5 (512.5–759.1) | 477.6 (380–596.4) | |
| BOYACA | 2010 | 9.5 (0–19) | 39.1 (8.2–74.1) | 24.3 (7.8–46.3) | 1.8 (1–2.4) | 4.2 (3–5.2) | 3 (2.2–3.9) | 11.3 (1.5–35.7) | 43.3 (23.1–79) | 27.3 (10.3–49.3) |
| 2011 | 12.5 (2–27.8) | 24.6 (6.5–44.8) | 18.6 (8.8–32.6) | 1.5 (1–1.8) | 2.6 (2.2–3) | 2 (1.7–2.5) | 14 (3.8–38.2) | 27.2 (10.9–48) | 20.6 (10–34.5) | |
| 2012 | 22.2 (1.4–54.4) | 28.8 (3.3–53.6) | 25.5 (13.2–48.2) | 1.5 (0.9–2.2) | 3.1 (1.9–4.3) | 2.3 (1.7–3.1) | 23.8 (5.8–58.9) | 31.9 (11.6–60.2) | 27.9 (9.3–45.5) | |
| 2013 | 33.7 (1.1–64.3) | 23 (5–48.9) | 28.3 (9.6–51.5) | 2.5 (1.7–3.6) | 3.7 (2.5–4.9) | 3.1 (2.4–4.1) | 36.2 (4.6–67.9) | 26.8 (11.1–50.8) | 31.5 (16.7–55.3) | |
| 2014 | 14.8 (2–36.7) | 17.7 (3.3–35.5) | 16.3 (5.3–32.8) | 1.9 (1.1–2.7) | 3.8 (2.5–5.8) | 2.8 (1.9–4) | 16.7 (5.2–45.3) | 21.5 (5.8–45.6) | 19.1 (9.3–34.6) | |
| 2015 | 29.2 (11.4–68.1) | 21 (7.2–37.1) | 25.1 (9.5–42.2) | 1.8 (1.2–2.8) | 3.1 (2–4.3) | 2.5 (1.7–3.4) | 31 (12–61.9) | 24.1 (4.2–39.7) | 27.6 (14.6–45.4) | |
| 2016 | 16 (4.8–31.9) | 37.2 (16.5–68) | 26.6 (14.5–42.8) | 2.5 (1.8–3.3) | 3.9 (2.1–5.2) | 3.2 (2.4–4.1) | 18.5 (5.6–44.4) | 41.1 (18.8–68.3) | 29.8 (15.8–51.8) | |
| 2017 | 0 (0–0) | 13.4 (4.8–26.6) | 6.7 (0–13.1) | 1.5 (1–1.9) | 4.3 (3.1–5.8) | 2.9 (2–3.8) | 1.5 (0.9–2.1) | 17.6 (7.4–30.7) | 9.6 (4.1–18.4) | |
| 2018 | 14.4 (0–25.5) | 46.7 (13.9–87.7) | 30.6 (13.5–55.5) | 2.6 (1.5–3.5) | 4.5 (2.8–6.5) | 3.5 (2.5–4.6) | 16.9 (5.9–31.7) | 51.1 (24–99.7) | 34.1 (13–56.3) | |
| 2010–2108 | 152.3 (104.5–210.9) | 251.6 (162.4–361.9) | 202 (148.7–272) | 17.5 (13.5–21.5) | 33.1 (25.9–44.2) | 25.3 (20.1–31.6) | 169.8 (126.7–231.9) | 284.7 (193.2–377.3) | 227.4 (172.9–301.7) | |
| CALDAS | 2010 | 21.7 (6.4–42.9) | 109.6 (56.5–168.9) | 67.7 (35.5–103.4) | 4.2 (2.8–5.7) | 11.9 (9.5–15.9) | 8.5 (6.4–10.6) | 25.9 (8.4–47) | 121.4 (69–174.2) | 76.3 (46.5–112.5) |
| 2011 | 41 (2–76.1) | 100.9 (54–156.1) | 75.9 (48.7–115.5) | 3.8 (2.7–5) | 8.8 (6.4–11) | 6.8 (5.1–8.5) | 44.7 (7–78.5) | 109.8 (66–179.5) | 82.7 (51.7–125.8) | |
| 2012 | 5.6 (0–11.2) | 125 (62.7–201.2) | 64.8 (27.3–108.9) | 4 (2.9–5.2) | 10.3 (8.3–14.5) | 7.7 (6.1–9.9) | 9.6 (3.8–21.4) | 135.3 (74.7–229.2) | 72.4 (30.1–124.5) | |
| 2013 | 25.4 (3.4–62.8) | 109.5 (68–199) | 70 (33.2–112.9) | 4.2 (2.9–5.1) | 12.6 (9–16.4) | 8.9 (6.8–11.5) | 29.6 (7–57.8) | 122.1 (74.1–201.2) | 78.9 (49.4–147.3) | |
| 2014 | 45.9 (16.3–81.5) | 78.1 (26.1–122.8) | 67.8 (41.3–100.7) | 5.6 (4.1–7.5) | 13.4 (10.7–16.5) | 10.2 (7.9–12.8) | 51.5 (24.5–88.1) | 91.4 (47.4–138.3) | 78 (56–106.5) | |
| 2015 | 60.9 (8.4–133.8) | 201.9 (119–257.9) | 138 (89.4–195.6) | 6 (4.7–7.8) | 13.3 (9.5–16.6) | 10.4 (8.4–12.4) | 66.9 (17.9–145) | 215.2 (164.9–303.1) | 148.4 (94.4–193) | |
| 2016 | 27.2 (7.5–56.3) | 127.9 (71.9–185.9) | 80.1 (52.7–133.9) | 5.7 (4.3–7.5) | 14.9 (11.3–19.8) | 11 (8.4–14) | 32.9 (11.5–55.4) | 142.8 (96.1–222.5) | 91 (64.2–131.2) | |
| 2017 | 41.5 (11.5–76.9) | 126.7 (76.7–200.9) | 88.7 (57.1–128.9) | 6.3 (4.4–7.5) | 16.1 (13.1–22.2) | 11.9 (9.4–15.2) | 47.8 (19.7–90.9) | 142.8 (92.7–216.1) | 100.6 (67.9–138.2) | |
| 2018 | 29.3 (7.9–61) | 90.7 (55.5–132.7) | 63.2 (41.8–91.9) | 5.6 (4.6–6.8) | 13.6 (9.9–17.2) | 10.3 (8.1–12.6) | 35 (11.6–60.8) | 104.2 (64.6–151.8) | 73.4 (46.8–101.2) | |
| 2010–2108 | 298.7 (233.9–351.3) | 1070.4 (846.7–1360.2) | 716.4 (503.4–885.9) | 45.5 (36.1–55.8) | 114.9 (82.9–144.7) | 85.6 (68.3–104.8) | 344.1 (291.2–405.4) | 1185.3 (943.2–1514.5) | 802 (622.9–1050.3) | |
| CAQUETA | 2010 | 29.3 (0–58.7) | 35.9 (0–84.8) | 32.7 (4.5–78.7) | 1.7 (0.9–2.4) | 2.7 (1.4–3.9) | 2.2 (1.3–3.3) | 31 (1.5–99.6) | 38.6 (1.5–87.7) | 34.8 (8–79.2) |
| 2011 | 29.5 (0–59) | 46.6 (0–86.6) | 38.1 (8.9–91.1) | 1.8 (0.9–2.8) | 3.1 (1.2–4.8) | 2.4 (1.5–3.4) | 31.3 (1.3–73.7) | 49.7 (2.8–125) | 40.5 (11.1–91) | |
| 2012 | 44.7 (0–95.5) | 72.5 (27.9–132.7) | 58.7 (24.6–90.4) | 9.5 (6.3–14) | 14.4 (11.7–18.3) | 12 (9.4–15.1) | 54.2 (19.2–93.6) | 86.9 (36.3–165.6) | 70.6 (39.1–108.9) | |
| 2013 | 16.5 (0–42.2) | 30.4 (4–73.5) | 23.5 (4.6–45.5) | 7.6 (4.6–10.2) | 13.8 (9.5–16.6) | 10.7 (8.3–13.1) | 24.1 (7–53.7) | 44.2 (18.9–108.8) | 34.2 (17.6–54.8) | |
| 2014 | 58.9 (11–116.2) | 128.5 (52.4–241) | 93.8 (59.6–193.1) | 8.8 (5.3–13.2) | 15.8 (12.3–20.5) | 12.3 (8.9–16) | 67.6 (19–115.8) | 144.3 (52–261) | 106.1 (56.3–204.8) | |
| 2015 | 66.6 (14.2–122.3) | 88.7 (33.5–152.6) | 77.7 (37.9–117.5) | 7.1 (4.5–10) | 13.6 (10.3–17.2) | 10.4 (7.9–12.9) | 73.7 (31.3–154.5) | 102.3 (62.3–157.2) | 88.1 (47.8–145.9) | |
| 2016 | 37.5 (0–88.9) | 202.3 (116.2–305) | 120.1 (69–174.3) | 9.8 (7.2–13.3) | 15.4 (11.4–19.5) | 12.6 (9.9–15.5) | 47.4 (8.9–117.5) | 217.7 (116.5–290.6) | 132.7 (75.8–193.5) | |
| 2017 | 53.6 (7.4–168.5) | 143 (68.5–269.1) | 98.3 (52.1–168.8) | 12.5 (8.6–15) | 17.5 (11.9–21.9) | 15 (12–18) | 66.1 (17.3–199) | 160.5 (75.8–288.2) | 113.3 (60.6–203.8) | |
| 2018 | 63 (5.4–115.4) | 174.4 (83.7–319.5) | 118.7 (71.2–202.8) | 9 (5.4–12.8) | 18.4 (12.5–27.5) | 13.7 (9.5–18.1) | 72 (19.8–149.6) | 192.7 (85.2–287.7) | 132.4 (62.4–203.1) | |
| 2010–2108 | 403 (279.4–633.5) | 936.4 (700.1–1226.6) | 670.9 (530.2–910.2) | 68.7 (54.2–92.9) | 115.9 (92.4–153) | 92.4 (72.8–115.5) | 471.7 (297.4–678.8) | 1052.3 (758.4–1320.5) | 763.3 (551–989.3) | |
| CASANARE | 2010 | 51.7 (5.9–131.7) | 12.9 (0–31.1) | 31.9 (2.9–63.8) | 7.3 (4.5–9.6) | 11.9 (9.2–15.4) | 9.6 (7.4–12) | 59 (18.5–162.1) | 24.7 (9.4–45.7) | 41.6 (16.4–84.6) |
| 2011 | 7.9 (0–15.8) | 65.4 (0–138.5) | 37.2 (1.4–84) | 6.6 (4.2–9.2) | 7.5 (4.5–9.9) | 7 (5.4–9) | 14.4 (5.5–30.7) | 72.9 (7.7–192.7) | 44.2 (7.4–100.9) | |
| 2012 | 47 (5.7–130) | 89.4 (16.4–218.2) | 68.5 (24.5–142.1) | 8.4 (6.3–11.3) | 11.8 (8.6–15.4) | 10.2 (7.9–12.8) | 55.4 (15.2–139.8) | 101.2 (10.4–215.9) | 78.7 (34.6–150) | |
| 2013 | 57.5 (9.4–170.3) | 163.2 (35.2–295.7) | 111.2 (47.5–186.3) | 7.3 (4.5–8.7) | 12 (9–14.5) | 9.7 (7.6–11.9) | 64.8 (16–186.5) | 175.3 (50.4–314.2) | 120.9 (30.6–177.1) | |
| 2014 | 0 (0–0) | 66.2 (5.2–159) | 33.6 (1.8–73.5) | 8.9 (5.9–11.8) | 12.5 (8.6–15.7) | 10.8 (8.2–12.9) | 8.9 (6.7–11.7) | 78.8 (24.4–202.5) | 44.4 (15.8–93.9) | |
| 2015 | 32.2 (0–65.3) | 115.4 (56–217.2) | 74.4 (37.8–146.1) | 6.3 (4.2–8.7) | 10.3 (7.5–12.6) | 8.3 (6.3–10.5) | 38.4 (10.5–90.5) | 125.7 (60.5–250.1) | 82.7 (34.4–140.8) | |
| 2016 | 0 (0–0) | 75.4 (32.4–143.5) | 38.2 (9.3–62.8) | 8.8 (5.9–11.7) | 13.4 (10.2–17.5) | 11.1 (8.9–13.7) | 8.8 (6–11.2) | 88.8 (26.2–164) | 49.3 (17.4–84.4) | |
| 2017 | 7.1 (0–14.1) | 28.4 (0–61.2) | 17.8 (0–36.2) | 9.7 (7.1–11.9) | 19.4 (14.7–28.4) | 14.6 (11–20.2) | 16.8 (8.4–29.6) | 47.8 (16.6–89.6) | 32.5 (19.9–56.5) | |
| 2018 | 14 (0–42) | 125.2 (29–216.2) | 70.3 (22.1–130.4) | 9.2 (5.6–12) | 17 (11.2–22.4) | 13.1 (9.8–17.3) | 23.2 (6.3–69.1) | 142.2 (56.4–249.1) | 83.4 (42.5–154.9) | |
| 2010–2108 | 212.3 (52.7–397.9) | 746 (471.9–1160.2) | 483.2 (295.9–716) | 72.7 (53.9–85.4) | 116.9 (93.5–140.6) | 95.1 (78–110.5) | 285 (140.2–396.3) | 862.9 (592.7–1137.9) | 578.3 (418.2–780.8) | |
| CAUCA | 2010 | 46.9 (23.3–83) | 98.2 (53.1–146.3) | 72.9 (36.5–104.6) | 5.8 (4.4–7.3) | 9.7 (7.6–11.9) | 7.8 (6.4–9.3) | 52.7 (26.3–95.3) | 107.8 (62.8–164.8) | 80.6 (52.2–119.8) |
| 2011 | 64.2 (20.4–113.9) | 73.2 (30.1–128.9) | 68.8 (42.4–100.1) | 5.9 (4.6–7.1) | 10 (7.7–11.6) | 8 (6.6–9.5) | 70.1 (34–119.4) | 83.2 (44.3–128.9) | 76.7 (48–109.1) | |
| 2012 | 12.6 (0–27.9) | 68.7 (39.1–107.6) | 41 (25.5–66.6) | 4.8 (3.6–7.2) | 6.9 (5.3–8) | 5.9 (4.7–7.1) | 17.3 (9.6–29.7) | 75.6 (41.4–107.3) | 46.8 (31.1–74.8) | |
| 2013 | 30 (9.6–59.5) | 38.4 (15.3–74.6) | 34.3 (22–52.8) | 5.2 (4–6.9) | 6.7 (5.3–8.4) | 6 (5–7.1) | 35.2 (16.1–77.5) | 45.2 (16.6–71.2) | 40.2 (20.2–56.5) | |
| 2014 | 9.4 (0–24.2) | 67.3 (35.3–112.8) | 38.7 (21.6–68.2) | 5.3 (4.1–6.5) | 7.3 (5.8–8.9) | 6.3 (5.3–7.4) | 14.7 (5.7–31.1) | 74.6 (33.9–117.1) | 45 (20.7–73) | |
| 2015 | 18.3 (4.4–35) | 59.7 (34.2–94.3) | 39.2 (22.4–62.2) | 4.6 (3.7–5.6) | 6.9 (5.3–8.8) | 5.8 (4.6–7) | 22.9 (7.7–42.8) | 66.6 (35.6–107.8) | 45 (25–68.3) | |
| 2016 | 14.8 (1.8–27.6) | 36.3 (16.2–67.2) | 25.7 (13.9–43.2) | 4.3 (3.6–5.2) | 7.2 (4.9–9.1) | 5.8 (4.7–7.2) | 19.1 (9.6–36.5) | 43.6 (16.1–67.7) | 31.5 (17.1–47.1) | |
| 2017 | 16.9 (0–33.8) | 37.3 (8.8–67.2) | 27.2 (13.7–44.6) | 5.4 (4.2–7.2) | 6.9 (5.4–8.7) | 6.1 (5–7.3) | 22.3 (4.9–40.2) | 44.2 (23–70.9) | 33.4 (18.2–52.8) | |
| 2018 | 26.3 (9.1–51.4) | 43.4 (9–81.8) | 35 (20.4–61.4) | 3.3 (2.4–4.3) | 7.1 (5.2–9.4) | 5.2 (3.9–6.8) | 29.7 (11.7–52.5) | 50.5 (22.5–84.8) | 40.2 (20.6–62.6) | |
| 2010–2108 | 237.4 (141.6–329.5) | 519.2 (383.1–669.4) | 380.1 (273.3–475.2) | 44.5 (35.9–52.6) | 68.6 (58–84.4) | 56.7 (48.4–66.5) | 281.9 (196.2–413.5) | 587.8 (467.9–702.4) | 436.8 (352.3–522.7) | |
| CESAR | 2010 | 60.5 (13.3–126.4) | 108.5 (65.7–166.7) | 84.5 (46.7–119.5) | 7.5 (5.4–9.7) | 10.4 (8.4–12.9) | 8.9 (7.3–10.9) | 68 (19.7–130.2) | 118.9 (70.3–172) | 93.4 (51.4–133.4) |
| 2011 | 33.3 (0–93.4) | 60.6 (26.6–103.3) | 46.9 (23.3–75.7) | 7.1 (5.7–9.6) | 8.8 (7.2–11.4) | 8 (6.6–9.3) | 40.5 (7.3–80) | 69.4 (37.3–122.6) | 54.9 (31.7–98.2) | |
| 2012 | 43.1 (21.4–82.5) | 85 (47–140.5) | 64.1 (43–92.2) | 5.6 (4.5–6.4) | 8.7 (5.9–11.2) | 7.2 (5.7–8.7) | 48.7 (22.7–77.1) | 93.8 (46.7–136) | 71.2 (41.9–104.2) | |
| 2013 | 36.3 (9–71) | 47.5 (21.7–83.1) | 41.9 (18.4–62.3) | 6 (4.1–7.9) | 9 (6.4–11.3) | 7.5 (5.8–9.3) | 42.3 (15.8–87.3) | 56.5 (28.8–98.4) | 49.4 (27.2–77.2) | |
| 2014 | 34.2 (8.7–76) | 82.5 (41.4–147.9) | 58.4 (30–101.9) | 6.3 (4.5–7.9) | 10.6 (7.5–13.6) | 8.5 (6.7–10.4) | 40.5 (19.7–87.4) | 93.2 (38.7–150.2) | 66.8 (35–101.2) | |
| 2015 | 70.4 (27.4–116.3) | 64.9 (15.5–104.8) | 67.6 (32.7–103.8) | 7.4 (5.8–10) | 9.4 (7.3–11.6) | 8.4 (7–10) | 77.8 (33.1–128.4) | 74.3 (42.2–133.6) | 76 (50.8–109.5) | |
| 2016 | 53.2 (16.5–93.1) | 96.1 (52.1–170) | 74.6 (41–106.6) | 9.3 (7.9–11.7) | 12.8 (9.6–15.8) | 11 (9.4–12.9) | 62.5 (33.5–115.5) | 109 (52.7–166.2) | 85.7 (51.5–124.2) | |
| 2017 | 84.1 (31.3–128) | 91 (35.2–157.8) | 87.5 (57.4–130.8) | 8.9 (7.5–11.5) | 14.9 (10.4–18.2) | 11.9 (9.6–14.6) | 92.9 (57.3–148) | 105.9 (52.6–173.3) | 99.4 (61.3–142.5) | |
| 2018 | 110.4 (38.6–190.7) | 151.1 (83.5–242.8) | 130.8 (84.5–186.1) | 6.6 (4.6–8.6) | 13.5 (10.6–19) | 10 (7.8–13) | 117.1 (72.7–233.2) | 164.6 (94–263.7) | 140.8 (90.4–198.2) | |
| 2010–2108 | 530.5 (422.2–696.3) | 790.7 (567.6–1004.3) | 660.5 (545.5–825.6) | 64.7 (55.5–82.5) | 98.6 (74.3–113.4) | 81.7 (69.2–95.8) | 595.2 (460.9–737.7) | 889.4 (691.1–1076.6) | 742.1 (583.2–900.3) | |
| CHOCO | 2010 | 150.8 (69.5–239.7) | 135 (0–278.4) | 142.9 (72–271.5) | 16.9 (10.9–22.1) | 18.8 (14.8–25) | 17.9 (14.1–21.6) | 167.6 (79.6–247.2) | 153.9 (50.4–340.6) | 160.8 (79.3–242.2) |
| 2011 | 140.8 (57.4–236.3) | 52.7 (0–89.9) | 96.9 (51–154.6) | 11.7 (8.4–15.6) | 13.1 (9.8–19) | 12.4 (9.7–15.5) | 152.6 (49.3–256.6) | 65.7 (13.9–131.5) | 109.3 (61.9–178.3) | |
| 2012 | 18.5 (0–43.9) | 118.7 (53.2–231.7) | 68.5 (26.3–129.3) | 17.5 (12.3–25) | 19.6 (15.3–23.6) | 18.6 (15.4–22.7) | 36 (18.6–62) | 138.3 (60.1–256.3) | 87 (42.3–134.9) | |
| 2013 | 0 (0–0) | 82.8 (41.3–178) | 41.4 (15.5–82.4) | 17.4 (12.1–24.4) | 20 (14.3–26.3) | 18.7 (14.3–23.2) | 17.4 (12.6–23.4) | 102.8 (46.1–158.1) | 60 (22.1–101.5) | |
| 2014 | 4.6 (0–9.1) | 89 (0–238.1) | 46.8 (0–119.5) | 17.5 (13.3–23.2) | 17.4 (13.5–24.2) | 17.4 (14.2–21.8) | 22.1 (13.9–31.5) | 106.4 (18.4–327.9) | 64.2 (18.8–142.8) | |
| 2015 | 36 (0–72) | 130.6 (31.9–282.2) | 83.3 (23.6–162.6) | 15.9 (12–20.7) | 18.4 (14.3–23.8) | 17.1 (13.6–20.9) | 51.9 (13.4–162.3) | 148.9 (62.5–281.9) | 100.4 (26.9–184.2) | |
| 2016 | 115.6 (24–212.6) | 139.7 (59.5–241.3) | 127.7 (73.3–211.7) | 18.6 (12.8–25.3) | 20.3 (15.7–24.6) | 19.5 (15.4–23.4) | 134.2 (44.5–235.9) | 160 (90.3–232.8) | 147.1 (90.5–209) | |
| 2017 | 106 (29.5–243.1) | 90.4 (38.3–165.3) | 98.2 (42.6–167.4) | 13.6 (10.1–18) | 16.7 (11.7–22.1) | 15.2 (12–18.8) | 119.7 (39.7–265.6) | 107.1 (44.4–184.9) | 113.3 (68.6–174.1) | |
| 2018 | 33.4 (0–72.5) | 54.8 (14.2–108.9) | 44.2 (17.7–77.9) | 9.5 (6.7–12.3) | 14.4 (8.9–18.7) | 12 (8.9–15.3) | 42.9 (8.6–101.3) | 69.3 (19.7–127.7) | 56.1 (30.1–94.5) | |
| 2010–2108 | 603.1 (348.5–928.8) | 892.7 (531.2–1203.7) | 747.8 (532.7–946.6) | 138.4 (111.3–175) | 158.6 (127.6–200.9) | 148.5 (123.7–178.8) | 741.5 (543.9–1230.7) | 1051.3 (704.7–1382.7) | 896.4 (703–1137.1) | |
| CORDOBA | 2010 | 40.2 (21.7–72.9) | 44.9 (11.9–79.3) | 42.5 (23.5–66.6) | 4.7 (3.7–5.7) | 6.9 (6–7.9) | 5.8 (5–6.7) | 44.9 (23.8–74.5) | 51.8 (21–82.8) | 48.4 (30.4–68.8) |
| 2011 | 40.2 (16.1–62.5) | 63.5 (22.7–97) | 51.9 (35.1–72.4) | 3.9 (2.8–4.6) | 5.5 (4.3–6.9) | 4.7 (3.8–5.6) | 44.1 (26.5–64.8) | 69 (42.4–96.9) | 56.6 (37.4–87) | |
| 2012 | 25 (12.7–58.4) | 52.8 (18.5–98.9) | 38.9 (13.1–58.1) | 3.7 (2.8–4.8) | 6 (4.8–7.2) | 4.9 (4–5.8) | 28.7 (13–54.5) | 58.8 (24.6–89.8) | 43.8 (25.5–64.4) | |
| 2013 | 32.9 (13–63.6) | 74.8 (39.4–125.2) | 53.9 (33.4–83.8) | 3.5 (2.5–4.3) | 6.5 (4.8–7.8) | 5 (4–6.1) | 36.5 (16–66.3) | 81.3 (51.6–138.7) | 58.9 (39.9–85.7) | |
| 2014 | 52.4 (20.7–100.8) | 59.9 (16–100.8) | 56.1 (33.8–80.4) | 4 (2.6–4.9) | 6.2 (4.4–8.2) | 5.1 (4.1–6.2) | 56.3 (29.1–111.8) | 66.1 (26.4–109.4) | 61.2 (25.8–81.1) | |
| 2015 | 34.3 (13.2–57.9) | 33.6 (8.1–68.6) | 34 (17.4–52.2) | 3.7 (2.6–5) | 4.9 (3.9–6.1) | 4.3 (3.5–5.3) | 38 (14.7–63.4) | 38.6 (18.9–66.3) | 38.3 (22–50.8) | |
| 2016 | 25.1 (6.6–49.1) | 71.4 (43.4–111.2) | 48.3 (28.6–68.9) | 3.7 (2.9–5) | 5.6 (4.1–6.8) | 4.6 (3.7–5.5) | 28.8 (13.7–51.2) | 77 (48.1–105.1) | 52.9 (29.6–68.3) | |
| 2017 | 21.8 (3.2–42.3) | 72.6 (34.1–143.5) | 47.3 (20.4–78.3) | 4.3 (3.4–5.7) | 5.4 (4.1–6.3) | 4.8 (4–5.8) | 26.1 (11.5–51.5) | 78 (47.1–147.2) | 52.1 (27.8–84.8) | |
| 2018 | 37.4 (9.2–68.9) | 52.9 (30.9–73.2) | 45.1 (27.3–62.5) | 2.8 (2.2–3.7) | 5.5 (4.2–7.1) | 4.2 (3.2–5.1) | 40.2 (11.2–74) | 58.4 (26.4–78.1) | 49.3 (31.2–72.1) | |
| 2010–2108 | 308.4 (233.9–405.9) | 527.4 (394.1–647.4) | 418.2 (344.2–484.5) | 34.3 (29.1–42.6) | 52.4 (44.3–60.1) | 43.4 (36.5–50.8) | 342.7 (264.5–437.7) | 579.8 (417.7–704.4) | 461.6 (395.2–550.7) | |
| CUNDINAMARCA | 2010 | 11.1 (2.9–22.8) | 47.1 (21.8–70.5) | 29.1 (18.2–50.8) | 2.6 (1.8–3.4) | 5.8 (4–6.9) | 4.2 (3.1–5.2) | 13.7 (5.1–26.2) | 52.9 (32.2–75.8) | 33.3 (21.1–50.7) |
| 2011 | 7 (0.3–14.8) | 71.5 (54.3–91.8) | 39.2 (26.6–55.1) | 2.6 (1.8–3.6) | 5.3 (3.8–7.4) | 3.9 (2.9–4.9) | 9.6 (3.2–18.9) | 76.8 (58.5–94.5) | 43.1 (28.9–55) | |
| 2012 | 19.3 (3.4–39.4) | 31.1 (7.9–52.2) | 25.2 (15.2–42.1) | 2.7 (1.8–3.5) | 5.1 (3.5–7) | 3.9 (3–5) | 22 (9.5–43.7) | 36.2 (13.9–59.2) | 29.1 (15.6–43.1) | |
| 2013 | 6.4 (0.7–11.6) | 25.2 (10.1–47.3) | 15.8 (8.1–30.3) | 3.3 (2.5–4.2) | 4.9 (3.6–6.4) | 4.1 (3.3–5) | 9.7 (3.3–16.9) | 30.1 (16.4–50.7) | 19.9 (8.3–29.9) | |
| 2014 | 30.1 (18.2–43.6) | 38.2 (19.7–60.6) | 34.2 (19.2–45.9) | 2.8 (1.8–3.7) | 6.1 (4.5–7.3) | 4.4 (3.4–5.5) | 32.9 (19–44.8) | 44.3 (23–71.5) | 38.6 (24.7–51.8) | |
| 2015 | 14.4 (4.3–25.2) | 31.6 (16.6–50.5) | 23 (12.6–40.2) | 2.7 (1.8–3.4) | 6.5 (4.3–8.3) | 4.6 (3.5–5.8) | 17.1 (8.4–33.2) | 38.1 (19.3–59.5) | 27.5 (18.4–42.3) | |
| 2016 | 8.8 (0–21) | 38.7 (20.3–62.6) | 23.7 (10–34.1) | 2.6 (1.9–3.6) | 6.6 (4.6–8.2) | 4.6 (3.3–5.9) | 11.4 (2.3–23.3) | 45.3 (21.8–69.3) | 28.3 (18.1–41.3) | |
| 2017 | 10.4 (2.2–18.7) | 35.3 (22.8–54.1) | 22.8 (13.4–34.3) | 2.4 (1.5–3.4) | 7.1 (5.3–9.1) | 4.8 (3.6–6.1) | 12.8 (5.5–21.8) | 42.5 (24.4–55.8) | 27.6 (15.9–40) | |
| 2018 | 13.4 (2.3–26.2) | 39.6 (24.5–54.6) | 26.4 (16.4–41) | 2.7 (1.6–3.5) | 6.6 (4.3–8.7) | 4.6 (3.3–6) | 16.1 (5.3–28.8) | 46.1 (31.5–64.7) | 31.1 (19.8–45.1) | |
| 2010–2108 | 120.9 (79.9–161.4) | 356.8 (248.9–532.4) | 238.5 (171.8–316.5) | 24.4 (18.4–29.8) | 54.1 (37.5–64.8) | 39.2 (29.8–47.7) | 145.3 (110.1–188.9) | 410.9 (244.6–527.8) | 277.8 (181.7–338.6) | |
| GUAINIA | 2010 | 0 (0–0) | 0 (0–0) | 0 (0–0) | 4.1 (1.8–6.5) | 4.2 (1.3–6.6) | 4.2 (2.3–6.1) | 4.1 (1.2–6.1) | 4.2 (1.7–6.8) | 4.2 (2.5–6.7) |
| 2011 | 90.9 (0–181.8) | 0 (0–0) | 43.2 (0–86.4) | 2 (0–3.4) | 1.8 (0–3.6) | 1.9 (0.7–3.1) | 92.9 (0.6–336.2) | 1.8 (0–3.6) | 45.1 (1–175.4) | |
| 2012 | 0 (0–0) | 0 (0–0) | 0 (0–0) | 3.4 (0.6–6.1) | 2.3 (0.5–3.6) | 2.8 (1.2–4.9) | 3.4 (0.6–6.7) | 2.3 (0.5–3.6) | 2.8 (1.6–5.3) | |
| 2013 | 0 (0–0) | 0 (0–0) | 0 (0–0) | 0.6 (0–1.4) | 4.1 (1.1–7.1) | 2.5 (0.9–4.9) | 0.6 (0–1.9) | 4.1 (0.5–7.6) | 2.5 (0.9–4.7) | |
| 2014 | 0 (0–0) | 0 (0–0) | 0 (0–0) | 3.3 (1.1–5) | 4 (1.4–6.5) | 3.7 (1.8–5.5) | 3.3 (0.8–4.4) | 4 (0.7–5.8) | 3.7 (2.1–5.5) | |
| 2015 | 0 (0–0) | 86.6 (0–173.2) | 45.2 (0–90.4) | 1.3 (0–2.4) | 4 (1.2–6.4) | 2.7 (1.2–4.5) | 1.3 (0–2.4) | 90.5 (2.6–264.6) | 47.9 (1.8–153.6) | |
| 2016 | 66.1 (0–132) | 0 (0–0) | 31.6 (0–94.7) | 7.4 (3–15.2) | 4.6 (1.7–6.8) | 5.9 (3.2–8.9) | 73.3 (5–211) | 4.6 (2.2–7.7) | 37.5 (4.4–105.1) | |
| 2017 | 0 (0–0) | 0 (0–0) | 0 (0–0) | 1.8 (0–3.7) | 5 (2.5–7.2) | 3.5 (1.5–5.3) | 1.8 (0–3.1) | 5 (2.2–9.6) | 3.5 (1.2–5.3) | |
| 2018 | 0 (0–0) | 0 (0–0) | 0 (0–0) | 3.6 (0.5–6.1) | 6.1 (1.3–11.6) | 4.8 (2.2–8) | 3.6 (1.1–6.7) | 6.1 (2.2–11.4) | 4.8 (3.1–8.3) | |
| 2010–2108 | 154.9 (0–305.2) | 86.6 (0–173.2) | 119.7 (0–376.3) | 27.2 (18.2–36.2) | 36.5 (28.3–45.8) | 32.1 (24.5–39.9) | 182.1 (21.6–492.2) | 124.2 (32.1–356.8) | 151.8 (58.5–305.5) | |
| GUAVIARE | 2010 | 0 (0–0) | 556.5 (0–1641.8) | 289.1 (0–786.9) | 27.1 (14.7–40.2) | 30.1 (18.6–43.7) | 28.7 (18.3–39.1) | 27.1 (15.2–40.2) | 586.6 (31.1–1387.2) | 317.8 (35–1059.8) |
| 2011 | 0 (0–0) | 152.1 (0–456.7) | 78.8 (0–236.7) | 22.9 (14.4–33.6) | 21.3 (12.9–29.7) | 22.1 (15.4–29) | 22.9 (13.9–33) | 173.9 (14.9–484) | 101.2 (16.9–260.3) | |
| 2012 | 0 (0–0) | 371.7 (0–750.8) | 192.6 (0–452.8) | 24.6 (14.2–39.3) | 27.8 (14.6–42.4) | 26 (15.9–36.4) | 24.6 (12.1–36.2) | 399.6 (19.5–1078.6) | 218.6 (25.3–605.4) | |
| 2013 | 0 (0–0) | 0 (0–0) | 0 (0–0) | 10.3 (1.5–19.1) | 33.7 (25.5–46.2) | 22.4 (13.9–32.3) | 10.3 (1.5–22.2) | 33.7 (20.7–45.7) | 22.4 (13.4–33.1) | |
| 2014 | 0 (0–0) | 238.1 (0–476.2) | 122.9 (0–369) | 13.7 (5.1–20.8) | 37.9 (21.3–48.9) | 26 (17.1–36) | 13.7 (6.6–21.8) | 276.1 (31.8–747.1) | 149.1 (24.7–399.6) | |
| 2015 | 298.9 (0–598.2) | 60.4 (0–180.6) | 176 (0–466) | 14.9 (3.5–26.4) | 36 (23.4–50.1) | 25.6 (16.9–36.2) | 313.8 (6.5–952.3) | 95.9 (31.3–216.6) | 201.5 (23.9–538.8) | |
| 2016 | 0 (0–0) | 0 (0–0) | 0 (0–0) | 18.1 (8.3–32.8) | 27.6 (16.6–38.2) | 23 (15–32.5) | 18.1 (8.3–32.8) | 27.6 (18.4–37.8) | 23 (15.2–32.5) | |
| 2017 | 0 (0–0) | 273.1 (0–546.7) | 140.5 (0–281.2) | 14.4 (3.4–30.8) | 55.9 (28.6–74.5) | 35.8 (21–52.1) | 14.4 (1.4–31.3) | 329.5 (38.2–1155.6) | 176.3 (29–599.6) | |
| 2018 | 0 (0–0) | 159.4 (0–440.1) | 81.9 (0–245.6) | 17.5 (9.5–28.4) | 26.9 (16.6–35.8) | 22.3 (13.8–29.9) | 17.5 (9.5–27) | 186.2 (16.6–512.2) | 104 (19.1–273.4) | |
| 2010–2108 | 298.9 (0–598.2) | 1785.4 (794.5–2917.7) | 1069.1 (524–1789.2) | 161.5 (107.8–239.4) | 298.4 (231.5–371.9) | 232.1 (187.3–290.9) | 466.2 (108.3–1077.1) | 2083.8 (1073.9–3220.8) | 1301.2 (581.6–2127.6) | |
| HUILA | 2010 | 31.2 (14.7–58.3) | 104.6 (57.5–153.8) | 68.1 (45.5–104.8) | 5.6 (4.3–7.9) | 9.1 (7.4–11.1) | 7.4 (5.8–8.9) | 36.8 (15.6–59.2) | 113.8 (64.9–168) | 75.4 (46–106.1) |
| 2011 | 29.3 (8.9–68.2) | 41.7 (9.2–75) | 35.5 (21.5–55) | 6.2 (4.8–7.2) | 13.1 (9.5–15.8) | 9.6 (7.6–11.7) | 35.5 (8.7–61.5) | 54.7 (27.3–91.9) | 45.2 (24.9–65.9) | |
| 2012 | 36.5 (15.7–76.4) | 60.2 (32.6–86) | 48.4 (23–69.8) | 6.4 (5.3–7.6) | 12.2 (8.6–14.8) | 9.3 (7.7–11.1) | 42.9 (25.9–85.9) | 72.4 (40.9–103) | 57.7 (28.6–79.6) | |
| 2013 | 37.5 (4.4–74.5) | 104.9 (51.1–181.1) | 71.4 (41.1–104.2) | 5.9 (4.6–7.3) | 14 (10.2–16.4) | 10 (7.9–12.3) | 43.4 (18.7–87.8) | 119 (63.4–197.4) | 81.3 (49.2–125.2) | |
| 2014 | 30.3 (11.6–58) | 70.6 (17–123.2) | 50.5 (24.4–80.4) | 5.5 (4.1–6.6) | 11.6 (9.1–15.5) | 8.6 (6.9–10.4) | 35.8 (10.8–66.6) | 82.2 (37.2–138.9) | 59.1 (36.2–96.5) | |
| 2015 | 14 (0–28.1) | 86.7 (50.8–124.2) | 50.5 (21–78.7) | 7.1 (5–9.5) | 11.9 (9.7–14.7) | 9.5 (7.7–11.5) | 21.2 (6.1–49.5) | 98.5 (58.4–166.3) | 60 (37.7–87) | |
| 2016 | 21.4 (7.5–58.6) | 81.8 (39.7–140.6) | 51.7 (25.8–92.1) | 5.4 (4.1–6.6) | 12.6 (9.3–16.4) | 9 (7–11.7) | 26.8 (8.7–51.9) | 94.4 (51.3–145.1) | 60.7 (41.3–97.6) | |
| 2017 | 44.7 (13.4–81) | 139 (103.7–198.1) | 92 (57.1–127.2) | 5.8 (4.2–7.7) | 11.8 (8.4–14.5) | 8.8 (6.8–10.8) | 50.5 (20.6–85.8) | 150.8 (110.9–192.7) | 100.8 (72.4–136.4) | |
| 2018 | 90.7 (42.6–146.8) | 146.2 (63–228) | 118.5 (78.5–153.3) | 5.9 (4.3–7.8) | 10.5 (8–13.6) | 8.2 (6.4–10.2) | 96.5 (51.6–154.8) | 156.7 (98.1–247.8) | 126.7 (81.7–182.8) | |
| 2010–2108 | 338.6 (245.1–480.2) | 841.4 (623.2–1036) | 590.9 (441.8–765.2) | 53.7 (43.3–64.9) | 106.8 (87.4–127.8) | 80.3 (64.4–95) | 392.3 (280.5–517.7) | 948.2 (702.7–1250.7) | 671.3 (482–813) | |
| LA GUAJIRA | 2010 | 87.5 (30.5–176.4) | 122.7 (37–227.2) | 104.9 (44.9–162) | 13.4 (10.1–16.1) | 13 (9.3–17.5) | 13.2 (10.9–15.7) | 100.9 (39.8–188.5) | 135.7 (62.9–218.7) | 118.1 (72.5–194.1) |
| 2011 | 83.7 (41–123) | 61.3 (17.9–120.3) | 72.6 (36–114) | 7.3 (5.6–9.1) | 8.2 (6.4–9.6) | 7.8 (6.6–9.1) | 91.1 (42.3–147.1) | 69.5 (36.8–119.2) | 80.4 (53.1–117.5) | |
| 2012 | 12.6 (0–27) | 18.5 (3–49.5) | 15.5 (6.4–31.4) | 8.8 (6.6–11.1) | 8.1 (4.9–10.9) | 8.4 (6.6–10.6) | 21.4 (11.2–33.5) | 26.6 (10–54.4) | 23.9 (15.2–36.6) | |
| 2013 | 98.7 (40.5–163.6) | 43.5 (19.6–88.9) | 71.4 (42.1–117.5) | 9.9 (7.5–12.1) | 6.7 (5.1–9.3) | 8.3 (6.9–9.9) | 108.7 (49.1–192) | 50.2 (20.7–113.5) | 79.7 (50.3–126.1) | |
| 2014 | 110.6 (56.1–194.5) | 100.3 (40.8–187.7) | 105.5 (65–157.7) | 9.2 (6.9–10.6) | 8.1 (5.8–10.6) | 8.6 (7.2–10.1) | 119.7 (61.7–213.7) | 108.4 (49.9–183.5) | 114.1 (68.4–172.1) | |
| 2015 | 109.9 (41.5–254.9) | 69.4 (30.5–110.7) | 89.9 (47.7–139.8) | 7.9 (5.9–9.6) | 8.5 (6.6–11.3) | 8.2 (6.6–9.6) | 117.8 (39.9–237.2) | 77.9 (45.6–131.2) | 98 (63.1–161.5) | |
| 2016 | 175.3 (81.2–298.1) | 146 (59.8–215.9) | 160.8 (111.8–238.1) | 9.9 (7.3–11.5) | 9 (6.2–11.3) | 9.5 (7.7–11.3) | 185.2 (70.4–291.6) | 155 (81.9–241.3) | 170.2 (111.3–226.2) | |
| 2017 | 85.1 (42–162.1) | 49.3 (12.3–79.8) | 67.4 (35–114.5) | 10 (7.4–12.5) | 10 (6.8–12.8) | 10 (8–12.1) | 95.1 (40.7–164.8) | 59.3 (29–94.1) | 77.4 (48.9–119.1) | |
| 2018 | 136.3 (68.7–227.1) | 141.6 (64–194.9) | 138.9 (101.6–209.2) | 9.6 (6.6–12.2) | 12.3 (8.7–15.2) | 10.9 (8.7–13.3) | 145.8 (88.3–224.9) | 153.9 (87.4–225.1) | 149.8 (100.8–211) | |
| 2010–2108 | 915.4 (635.5–1175.8) | 761.8 (574.6–873.3) | 839.4 (672–992.2) | 85.7 (71.6–99.2) | 84.1 (68.7–101.8) | 84.9 (74.9–96.1) | 1001.1 (693.3–1260) | 845.8 (699.3–1024.2) | 924.2 (737.5–1099.7) | |
| MAGDALENA | 2010 | 56.3 (19.6–93.9) | 82.2 (44.5–140.3) | 69.4 (48.1–110.5) | 4.3 (2.9–5.4) | 5.5 (4–7.2) | 4.9 (4–5.9) | 60.5 (28.8–96.6) | 87.7 (44–147) | 74.2 (42.3–112.2) |
| 2011 | 25.2 (4.3–69.3) | 78.3 (27.9–127.7) | 52 (26.4–90.9) | 3.5 (2.4–4.7) | 4.6 (3.2–6.3) | 4 (3.2–5) | 28.7 (9–96.6) | 82.9 (37.9–126.9) | 56.1 (30.1–85.2) | |
| 2012 | 68 (32–130) | 92.2 (58.9–149) | 80.3 (55.1–120.6) | 4.5 (3.2–5.7) | 6 (4.4–8.5) | 5.3 (4.1–6.5) | 72.6 (28.7–137.2) | 98.2 (60.9–154.8) | 85.5 (45.8–114.1) | |
| 2013 | 52.4 (21.4–86.9) | 74 (36.8–120.6) | 63.3 (41–92) | 4.7 (3.7–5.6) | 6.4 (4.6–8) | 5.6 (4.5–6.8) | 57.2 (29.3–101.8) | 80.4 (45.9–124.5) | 68.9 (42.2–95.9) | |
| 2014 | 58.9 (32.2–92.9) | 70.6 (41.8–115.7) | 64.8 (45–89.2) | 5.5 (3.9–7.4) | 7.9 (6.3–9.4) | 6.7 (5.3–8) | 64.4 (35.5–105.5) | 78.5 (42.1–119.7) | 71.5 (46.6–90.4) | |
| 2015 | 44.3 (24.8–82.4) | 85.9 (44.5–179) | 65.3 (37.1–106) | 5.6 (3.9–7) | 8.6 (6.2–11.1) | 7.1 (5.8–8.7) | 49.9 (17.1–74.4) | 94.6 (31.2–158.5) | 72.5 (41–107.1) | |
| 2016 | 27.9 (8.8–52.3) | 91.1 (40.2–140.4) | 59.9 (31.6–89.4) | 6.8 (4.8–8.3) | 10 (7–13.1) | 8.5 (6.7–10.2) | 34.8 (14.7–62.3) | 101.1 (49.5–149.5) | 68.3 (40.9–101.6) | |
| 2017 | 24.8 (10.3–67.5) | 50.7 (23.2–94.8) | 37.9 (15.8–65) | 5.7 (4.6–7.3) | 9.6 (6.2–13.5) | 7.7 (5.7–10.3) | 30.5 (12.4–56.8) | 60.3 (21.7–100.3) | 45.6 (29.5–69.2) | |
| 2018 | 22.1 (1.9–51) | 46.1 (22.6–72.4) | 34.2 (17–50.2) | 5.2 (3.8–7.1) | 10.2 (6.5–13.3) | 7.7 (5.6–10.1) | 27.3 (6.5–53.6) | 56.3 (32.5–84.3) | 42 (24.5–62) | |
| 2010–2108 | 378.1 (264.1–527.2) | 669.5 (534.5–844.4) | 525.3 (394.6–636.8) | 46 (34.7–57) | 69.3 (52.9–85.9) | 57.8 (47.1–69.7) | 424.2 (311.8–538.6) | 738.8 (609.1–904.8) | 583.1 (511.4–724.8) | |
| META | 2010 | 120.4 (68–219.9) | 184.8 (110.4–285.1) | 152.7 (95.6–213.8) | 12.1 (8.2–15.4) | 15.5 (10.9–18.4) | 13.8 (11.2–16.2) | 132.4 (79.8–222.4) | 200.3 (122.4–286.8) | 166.6 (106.9–229.4) |
| 2011 | 85.1 (33.6–147.4) | 180.9 (81.5–319.6) | 133.2 (87.7–197.9) | 7.3 (5.1–9.6) | 14.2 (11–17.9) | 10.8 (8–13.1) | 92.4 (37.2–148.8) | 195.1 (103.5–304.4) | 143.9 (94–236.8) | |
| 2012 | 30.3 (10–75.3) | 118.9 (79.8–171.6) | 74.8 (40–107.4) | 9.7 (7.4–12.2) | 16.1 (11.7–19.9) | 12.9 (10.1–15.9) | 40.1 (11–84.7) | 135 (93.9–190.9) | 87.7 (57.9–149.4) | |
| 2013 | 93.5 (21.2–176.4) | 201.6 (119.8–292.1) | 147.7 (97–243.8) | 11 (8.1–14.6) | 17.8 (13.3–21) | 14.4 (11.5–17.4) | 104.6 (42.3–225.5) | 219.4 (144.1–304.5) | 162.1 (90.2–221.6) | |
| 2014 | 67.7 (28.9–116.7) | 169.5 (111.1–234.4) | 118.7 (72.4–166.2) | 10 (7.6–13.9) | 18.9 (13.9–22) | 14.4 (11.7–17.3) | 77.7 (42.5–118.7) | 188.4 (122.5–257.5) | 133.1 (100–187.3) | |
| 2015 | 85.1 (34.3–146) | 207.6 (140.6–274.1) | 146.4 (106.9–190.4) | 10 (7.2–12) | 18.8 (14.8–23.2) | 14.4 (11.8–18) | 95.2 (40–161) | 226.5 (156.6–315.1) | 160.8 (109.9–211.3) | |
| 2016 | 78.9 (43.3–125.5) | 87.1 (42.6–135.9) | 83 (57.6–115.8) | 11.7 (8.1–14.9) | 20.1 (14.3–24.1) | 15.9 (12.5–19.4) | 90.6 (58.1–133.5) | 107.2 (41.2–161) | 98.9 (68.7–143.2) | |
| 2017 | 60.2 (30.7–104.5) | 75.8 (20.1–130.8) | 68 (40–117.5) | 9.7 (7.3–12.7) | 20.9 (15.9–26.3) | 15.3 (11.7–19.1) | 69.9 (26.1–97.7) | 96.7 (38.2–183.8) | 83.3 (41.8–136.6) | |
| 2018 | 33.4 (6–74.8) | 225.3 (129–321.9) | 129.1 (81.3–187.1) | 10.1 (7.6–12.7) | 19.2 (13.7–25) | 14.6 (11–18.6) | 43.5 (13.5–81.1) | 244.5 (149.8–356.4) | 143.7 (97.3–212.4) | |
| 2010–2108 | 648.1 (483.1–804.6) | 1448.1 (1229.4–1779) | 1048.4 (858.7–1257) | 91.7 (69.2–115.4) | 162.5 (118.8–183.8) | 127.1 (103.4–150.7) | 739.8 (607.3–907.7) | 1610.7 (1340.2–1940.6) | 1175.6 (939.2–1363.4) | |
| NARIÑO | 2010 | 22.2 (6.7–45.2) | 52.3 (17.2–93.6) | 37.3 (17.4–74) | 2.7 (1.9–3.6) | 3.9 (2.8–5.3) | 3.3 (2.6–4.2) | 25 (7.3–49.9) | 56.2 (23.3–110.5) | 40.7 (19.2–64.1) |
| 2011 | 19.9 (4–40.6) | 77.4 (51–126.2) | 48.7 (23.3–69.2) | 2.8 (1.8–4.1) | 4.1 (3.1–5.2) | 3.5 (2.7–4.3) | 22.7 (5.5–41.8) | 81.5 (48.7–116.9) | 52.2 (29.8–75.3) | |
| 2012 | 45.3 (9–78) | 25.1 (6.2–50.1) | 35.2 (20.5–58.9) | 2.7 (1.9–3.4) | 4.3 (3.2–5.8) | 3.5 (2.8–4.5) | 48.1 (24–81.3) | 29.4 (10.8–55.9) | 38.7 (19.6–54.5) | |
| 2013 | 26.9 (13.9–51.3) | 52.1 (22.7–90.8) | 39.6 (21.3–65) | 2.7 (1.7–3.4) | 3.2 (2.2–4.3) | 2.9 (2.3–3.6) | 29.6 (9.4–49.2) | 55.3 (15.1–95.5) | 42.5 (25.4–68) | |
| 2014 | 15.6 (1.1–39) | 50.8 (28.8–73.5) | 33.3 (18.3–52.1) | 2.3 (1.7–3.1) | 3 (2.2–4) | 2.7 (2.1–3.2) | 17.9 (2.9–38.6) | 53.9 (36.3–82) | 36 (22.3–59.1) | |
| 2015 | 23.2 (7.9–53.5) | 56.3 (21.6–88.4) | 39.8 (21.2–66.7) | 2.3 (1.7–3.1) | 3.6 (2.7–4) | 3 (2.5–3.5) | 25.6 (11.8–48.7) | 59.9 (30.1–90.5) | 42.8 (22.8–63.4) | |
| 2016 | 33.1 (14.9–56.8) | 37.7 (12.5–63.3) | 35.4 (20.3–53.2) | 2.5 (1.7–3.2) | 3.8 (2.9–4.9) | 3.1 (2.5–3.8) | 35.6 (18.2–59.2) | 41.5 (20.9–76) | 38.5 (27.2–51.9) | |
| 2017 | 30 (7.7–57.3) | 30.7 (15.7–52.8) | 30.3 (11.3–45.5) | 2.2 (1.7–2.7) | 3.3 (2.5–4.5) | 2.8 (2.2–3.4) | 32.2 (9.3–56.5) | 34 (13.5–55.1) | 33.1 (19.4–56.1) | |
| 2018 | 6.5 (0–16.5) | 40.5 (23.1–69.7) | 23.6 (9.3–37.3) | 2.5 (1.7–3.4) | 3.7 (2.9–4.7) | 3.1 (2.4–3.8) | 8.9 (2.6–23.9) | 44.2 (24.9–70.8) | 26.6 (15–39.6) | |
| 2010–2108 | 222.1 (158.9–285.6) | 421.2 (318.3–521.9) | 322 (264.1–411.4) | 22.7 (16.8–26.8) | 32.9 (27.6–38.9) | 27.8 (23.7–32.4) | 244.8 (188.2–303.9) | 454.1 (357.5–590.2) | 349.8 (291–433.2) | |
| NORTE DE SANTANDER | 2010 | 67.6 (16.1–171.5) | 108 (47.7–173.7) | 87.7 (48.4–161.2) | 7.1 (5.7–8.5) | 11.6 (9.3–15.2) | 9.3 (7.4–11.2) | 74.7 (21–174.5) | 119.6 (66.7–179.8) | 97 (50.3–136.3) |
| 2011 | 43.8 (9.8–70.1) | 145.1 (93–205.5) | 94 (67.3–135.4) | 7 (5.2–9.5) | 11.6 (8.8–14) | 9.3 (7.4–11.3) | 50.8 (14.7–83.4) | 156.7 (96.8–201.5) | 103.3 (68.5–144.4) | |
| 2012 | 46.2 (9.4–72.7) | 144.3 (91.8–195.5) | 94.9 (58.7–135.1) | 6.2 (4.3–7.8) | 11 (8–13.8) | 8.6 (6.8–10.3) | 52.5 (29.1–92.5) | 155.3 (101.5–211.5) | 103.5 (68.9–144.3) | |
| 2013 | 41.5 (15.1–70.8) | 113.5 (59.9–165.6) | 77.2 (45.5–114.8) | 6.9 (5.4–10) | 12.1 (9.2–15.6) | 9.5 (7.5–11.6) | 48.4 (25.5–73.7) | 125.6 (78.2–183.7) | 86.7 (54.4–120.4) | |
| 2014 | 29.6 (11.6–49) | 120.5 (62.4–178.6) | 74.7 (37.2–112.7) | 7.5 (6–9) | 13.6 (10.3–16.7) | 10.5 (8.7–12.6) | 37.1 (16.1–62) | 134.1 (71.7–193.4) | 85.2 (48–116.7) | |
| 2015 | 57.7 (29.2–89.4) | 92.3 (51.7–150.9) | 74.9 (47.5–109.2) | 6.5 (4.9–8.1) | 14 (11.3–17.1) | 10.2 (8.1–12.2) | 64.2 (30.3–100.7) | 106.3 (63.7–146.8) | 85.1 (59.2–110.9) | |
| 2016 | 27.5 (9.4–49.7) | 118 (24.6–181.8) | 72.3 (37.4–115) | 6.7 (5.1–8.4) | 14.5 (11.8–18) | 10.6 (8.3–13.1) | 34.2 (16.1–49.9) | 132.5 (69.6–212.2) | 82.9 (58.3–132.8) | |
| 2017 | 31.9 (18.5–61.4) | 131.2 (77.9–184.3) | 81.1 (47.1–116.3) | 7 (5.4–8.2) | 14.2 (11.7–17) | 10.6 (8.3–13) | 38.9 (20.3–58.8) | 145.3 (87.8–188.2) | 91.6 (65–124.7) | |
| 2018 | 67 (36.6–105.3) | 168 (103.8–242.1) | 117 (81.3–170) | 7.6 (5.5–9.5) | 16.4 (9.9–22.1) | 12 (8.9–15.5) | 74.6 (43.5–108.9) | 184.4 (126.5–276.3) | 129 (91.6–181.6) | |
| 2010–2108 | 412.5 (303.1–530.1) | 1142 (928.5–1549.4) | 774.2 (606.7–992.2) | 62.5 (49.6–74.6) | 119.4 (99–145.8) | 90.7 (72.9–109.4) | 475.1 (360.1–570.2) | 1261.4 (943.9–1577.3) | 864.9 (709.9–1071.2) | |
| PUTUMAYO | 2010 | 40.6 (0–81.2) | 142.3 (23.7–372.7) | 92.3 (28.2–222.7) | 8.5 (6.1–10.4) | 15.9 (11.9–21.5) | 12.3 (9.5–15.7) | 49.2 (6.1–132.6) | 158.2 (18–422.2) | 104.6 (15.5–253) |
| 2011 | 29.4 (0–69.1) | 79.6 (15.5–140.7) | 54.9 (23.8–95.2) | 7.2 (4.5–9.7) | 13.9 (10.6–16.5) | 10.6 (8.1–13) | 36.6 (7–92.2) | 93.5 (25.9–169) | 65.5 (27.5–111.2) | |
| 2012 | 0 (0–0) | 0 (0–0) | 0 (0–0) | 7.1 (4.3–9.1) | 11.1 (7.6–15.6) | 9.1 (6.6–12) | 7.1 (4.2–9.6) | 11.1 (7.1–15.5) | 9.1 (7–11.9) | |
| 2013 | 34.1 (0–76.3) | 12.5 (0–27.2) | 23.1 (6.3–57.5) | 5.8 (3.6–8.8) | 9.4 (6.1–11.3) | 7.6 (5.6–9.7) | 39.9 (5.1–88.8) | 21.8 (7.4–45.7) | 30.7 (8.9–55.4) | |
| 2014 | 7.7 (0–15.3) | 32.9 (0–78.2) | 20.4 (0–47.4) | 7.5 (3.4–11.4) | 11 (7.6–14.9) | 9.3 (6.7–12.2) | 15.2 (5.8–31.1) | 43.9 (13.5–115.3) | 29.7 (12.1–54.8) | |
| 2015 | 52.8 (0–105.6) | 0 (0–0) | 26.1 (0–52.1) | 6.5 (4.8–8.3) | 12 (7.8–15.2) | 9.3 (6.7–11.8) | 59.2 (6–163.7) | 12 (7.3–15.1) | 35.3 (7.7–94) | |
| 2016 | 0 (0–0) | 41.3 (0–123.2) | 20.9 (0–41.8) | 9.1 (6.2–12.9) | 9.1 (6.8–13.1) | 9.1 (6.8–11.6) | 9.1 (5.2–13.3) | 50.4 (8.1–172.7) | 30 (8.8–92.1) | |
| 2017 | 17.5 (0–41.8) | 5.3 (0–10.5) | 11.3 (0–23.7) | 7.6 (5.1–11.5) | 10.2 (6.9–13.1) | 8.9 (6.6–11.7) | 25.1 (6.7–49) | 15.5 (10–30.2) | 20.2 (10.3–42.4) | |
| 2018 | 9.5 (0–19) | 26.1 (0–54.8) | 17.9 (0.9–43.3) | 8.4 (5.6–12.2) | 14.7 (9.5–20.4) | 11.6 (8.3–15) | 17.9 (5.9–38.4) | 40.8 (15–94.3) | 29.5 (12.6–50.6) | |
| 2010–2108 | 190.1 (86.7–291) | 334.1 (142.5–675.9) | 263 (135.2–401.1) | 67.9 (48.2–85.4) | 107.2 (79.7–134.8) | 87.8 (69.9–106.4) | 257.9 (153.2–434) | 441.3 (253.3–731.3) | 350.8 (233.7–532.8) | |
| QUINDIO | 2010 | 58.9 (12.1–180.8) | 198.1 (116.4–323) | 127.2 (70.3–200.5) | 11.8 (8.1–15.5) | 22.8 (17.1–29.5) | 17.2 (13.5–21.4) | 70.7 (20.9–156.7) | 220.9 (111.8–376.4) | 144.4 (79.1–209.7) |
| 2011 | 98.4 (0–169.9) | 193.4 (98.8–290.1) | 145.1 (88.2–225.6) | 12.2 (7.9–16.7) | 21.2 (14.7–29) | 16.6 (12.9–20.6) | 110.6 (31.3–227.8) | 214.6 (123–366.8) | 161.7 (98.2–269.9) | |
| 2012 | 58.4 (13.3–113.1) | 252.5 (121.5–478.6) | 153.7 (86.1–234.3) | 8.1 (5.4–11.1) | 18.5 (13.7–23) | 13.2 (9.9–16.8) | 66.5 (14.8–131.4) | 271.1 (133.1–466.9) | 166.9 (84.3–310.1) | |
| 2013 | 12 (0–31.2) | 160.1 (73.7–254.9) | 84.7 (44.4–142.3) | 7.4 (4.8–10.4) | 13.7 (9.1–18.1) | 10.5 (8–13) | 19.4 (7–41.3) | 173.8 (75.8–295.6) | 95.2 (35.5–142) | |
| 2014 | 48.2 (7.4–99.3) | 208 (126.3–321.5) | 126.7 (87.5–185) | 10.7 (7.6–13.7) | 19.4 (12.9–24.9) | 15 (11.8–19.1) | 58.9 (13.1–108.5) | 227.5 (122.3–330.5) | 141.6 (73.8–210.2) | |
| 2015 | 32.4 (9–82.3) | 65 (12.2–131.6) | 48.4 (18.6–82.4) | 6.9 (4.8–9.2) | 16.9 (12.8–24.4) | 11.9 (8.7–15.3) | 39.3 (8–85) | 81.9 (32.1–140.2) | 60.2 (30.3–101.3) | |
| 2016 | 27.2 (0–54.3) | 102.2 (56.9–157.4) | 64 (33.2–101.1) | 7.9 (5–10.7) | 16.7 (12.4–19.9) | 12.2 (9.6–15) | 35.1 (13.5–68.1) | 118.9 (67.1–178.3) | 76.2 (48.8–118.7) | |
| 2017 | 39.3 (0–102.7) | 48.3 (7.2–109.6) | 43.7 (13–76.4) | 7.2 (5–9.3) | 16.4 (9.9–21.6) | 11.7 (8.9–15) | 46.5 (7.1–121) | 64.7 (27.8–98.8) | 55.4 (23.3–87) | |
| 2018 | 58.9 (18.6–98.2) | 128.3 (43.1–268.9) | 93 (48.1–155.3) | 6.6 (4.5–8.8) | 17.6 (12.6–22.5) | 12 (9.1–15.8) | 65.5 (30.2–110.4) | 145.9 (62.4–271.8) | 105 (58–176.7) | |
| 2010–2108 | 432.6 (224.5–687.1) | 1350 (909.1–1675.2) | 882.9 (603.4–1086.7) | 78.7 (58.4–97.4) | 163.2 (124.9–192.7) | 120.2 (96.1–144.8) | 511.3 (310.8–719.6) | 1513.1 (1024.2–1888.5) | 1003.1 (755.5–1324.3) | |
| RISARALDA | 2010 | 74 (18.8–129.2) | 256.9 (135.1–410) | 163.2 (100.5–244.6) | 13.8 (10.3–17.9) | 18 (13.7–23.4) | 15.8 (12.5–18.9) | 87.8 (36.5–123.3) | 274.9 (180.8–496.2) | 179 (120.3–276.7) |
| 2011 | 50.4 (0–108.1) | 112.2 (58.6–170.5) | 80.5 (44.7–120.2) | 13.4 (9.9–17) | 17.5 (13.6–22) | 15.4 (12.3–18.8) | 63.8 (13.6–130.6) | 129.6 (83.2–234.6) | 95.9 (54.3–136.6) | |
| 2012 | 93.6 (49.3–125.9) | 167.9 (93.6–301.9) | 129.8 (79.1–184.6) | 13.3 (9.5–16) | 17.8 (14.4–22) | 15.5 (12.8–18.2) | 107 (51–152.2) | 185.7 (92.4–304.1) | 145.3 (88.1–201.8) | |
| 2013 | 67.8 (20.1–121.3) | 156.3 (89.1–249.8) | 110.9 (58.8–159.8) | 11.9 (9.2–15.3) | 20.6 (16.2–26.1) | 16.1 (12.9–19.7) | 79.7 (43.5–161.1) | 176.9 (104.5–257.6) | 127 (85.2–195.1) | |
| 2014 | 65.3 (19.2–145.6) | 164.6 (105.6–225.5) | 113.7 (58.9–149) | 12.2 (9.6–15.4) | 20.3 (16.7–24.6) | 16.2 (13.6–19.2) | 77.5 (27.1–149.1) | 184.9 (124–257) | 129.8 (88.6–168.8) | |
| 2015 | 21.8 (5.3–41.8) | 185.5 (101.6–262.9) | 101.5 (54.5–155.8) | 12.7 (9.8–15.8) | 21.9 (17–28.3) | 17.1 (13.5–20.5) | 34.5 (15.7–62.7) | 207.4 (131.1–278) | 118.7 (69.2–182.4) | |
| 2016 | 128.2 (71.3–201.9) | 258.2 (188.8–360) | 191.5 (146.6–254.8) | 13.8 (10.7–17.6) | 26.5 (21.5–35.1) | 20 (16.3–24.4) | 142 (90.9–191.9) | 284.7 (201.4–362.7) | 211.5 (134.6–265.3) | |
| 2017 | 39.8 (15.4–100.1) | 292.8 (182.8–479.2) | 163 (87.4–248) | 14 (10.7–19) | 21 (14.1–27.2) | 17.4 (13.6–21.8) | 53.8 (25.3–91.5) | 313.9 (206.2–453.1) | 180.4 (119.6–257.1) | |
| 2018 | 58.9 (27.5–95.6) | 169.7 (78.6–292.1) | 112.8 (63.8–178.5) | 10.9 (8.3–14.1) | 21.1 (14.9–32.2) | 15.9 (11.8–20.3) | 69.8 (34.3–117.6) | 190.8 (108.6–330.1) | 128.7 (72.3–192.4) | |
| 2010–2108 | 599.4 (449.7–733.7) | 1766.4 (1315.1–2246.8) | 1167.6 (891.4–1483.9) | 115.9 (92.8–134.8) | 185 (146.5–234.7) | 149.6 (121.8–174.9) | 715.3 (541.8–907.4) | 1951.3 (1489–2305.8) | 1317.1 (982.6–1683.8) | |
| SANANDRES | 2010 | 0 (0–0) | 156 (0–435.1) | 77.6 (0–223.4) | 5.4 (0–14.4) | 4.7 (0.8–6.3) | 4.9 (2–10) | 5.4 (0–13.3) | 160.4 (3.6–316.4) | 82.5 (4.5–163.5) |
| 2011 | 0 (0–0) | 0 (0–0) | 0 (0–0) | 3.5 (0.8–6.2) | 5.4 (1.9–10.6) | 4.5 (2.3–7.6) | 3.5 (0.8–5.4) | 5.4 (1.9–10.3) | 4.5 (1.8–7.6) | |
| 2012 | 45.1 (0–90.3) | 96 (0–191.7) | 70.3 (0–213.4) | 1.9 (0–3.5) | 10 (3.5–18.9) | 5.8 (1.3–10.7) | 47 (0.5–150.1) | 105.7 (3.5–371) | 76.2 (2.3–176) | |
| 2013 | 0 (0–0) | 69.5 (0–138.8) | 34.6 (0–83.4) | 3.4 (0–7.2) | 8.8 (5.3–16) | 6.3 (3.1–9.7) | 3.4 (0.8–8.7) | 78.3 (6.1–220) | 40.7 (3.9–144.3) | |
| 2014 | 0 (0–0) | 0 (0–0) | 0 (0–0) | 7.9 (4.5–13.1) | 3.4 (0–7.2) | 5.7 (2.6–9.2) | 7.9 (2.6–11.6) | 3.4 (0–7.2) | 5.7 (3–9.9) | |
| 2015 | 0 (0–0) | 0 (0–0) | 0 (0–0) | 0.8 (0–2.6) | 8.7 (4.5–14.2) | 4.8 (2.2–8.2) | 0.8 (0–1.8) | 8.7 (4.5–13.9) | 4.8 (2.6–8.2) | |
| 2016 | 0 (0–0) | 67.8 (0–135.3) | 33.7 (0–82.5) | 1.8 (0–2.8) | 11.2 (4.4–22.4) | 6.5 (2.2–12.1) | 1.8 (0–3.4) | 79 (6–294.3) | 40.2 (3–144.5) | |
| 2017 | 0 (0–0) | 0 (0–0) | 0 (0–0) | 3.3 (0–7.7) | 7.8 (2.6–15.5) | 5.5 (2.2–9) | 3.3 (0.5–7.7) | 7.8 (1.8–13.7) | 5.5 (1.7–8.6) | |
| 2018 | 0 (0–0) | 248.6 (0–781.6) | 123.7 (0–286.8) | 5.8 (2.8–8.4) | 9.5 (5.1–13.6) | 7.7 (4.6–11) | 5.8 (2.8–7.6) | 258.1 (6.9–550.1) | 131.4 (6.1–317.9) | |
| 2010–2108 | 45.1 (0–90.3) | 639.7 (56.5–1379.6) | 340.6 (103.7–714.6) | 33.9 (19.7–46.2) | 69.7 (40.3–97.8) | 51.7 (35.1–70.4) | 78.3 (26.3–206.9) | 709.4 (207–1323.4) | 392.3 (132.3–708.6) | |
| SANTANDER | 2010 | 60.2 (29.2–103) | 107.4 (64.8–154.3) | 83.5 (56.8–124.5) | 6.7 (5–8.5) | 9.7 (6.8–11.8) | 8.2 (6.5–10) | 66.9 (38.6–95.1) | 117.1 (71.9–160.5) | 91.7 (67.8–125.8) |
| 2011 | 32.7 (14.3–58.9) | 75.7 (47.6–126.1) | 53.9 (31.2–75.9) | 5.8 (4.5–7.2) | 11.1 (8.7–13.4) | 8.4 (6.8–9.9) | 38.5 (15.9–64.7) | 86.8 (56–142.1) | 62.4 (39.8–82.2) | |
| 2012 | 27.6 (6.1–45.8) | 90.1 (51.5–123.1) | 58.5 (37.2–82.9) | 5.2 (3.8–6.8) | 9.3 (7.7–11.3) | 7.2 (5.9–8.7) | 32.8 (15.5–53.9) | 99.5 (60.8–130.8) | 65.7 (50.1–95.8) | |
| 2013 | 47 (24–66.3) | 126.2 (76.1–200.5) | 86.1 (55.1–118.2) | 5.6 (4.7–7.6) | 10.2 (8.1–13.6) | 7.9 (6.1–9.6) | 52.6 (32.3–73.7) | 136.4 (81.6–204) | 94 (68.9–128.1) | |
| 2014 | 20.1 (5.6–35.1) | 134.8 (79.9–173.1) | 76.8 (48.2–107.6) | 5.9 (4.2–7.2) | 11.8 (8.8–15.6) | 8.8 (6.9–10.9) | 25.9 (13.6–44.7) | 146.6 (109.5–213.3) | 85.6 (60.4–119.1) | |
| 2015 | 46 (27.7–72) | 166.4 (116.6–243.6) | 105.5 (62–144.8) | 7.6 (6.1–9.6) | 12.2 (8.3–14.9) | 9.9 (7.9–11.9) | 53.5 (31.9–72.3) | 178.6 (100.4–245.4) | 115.4 (81.9–161.2) | |
| 2016 | 25.7 (1.7–54.8) | 124.9 (69.7–180.2) | 74.8 (45.2–116.1) | 6.5 (5–7.7) | 13.1 (9.8–15.9) | 9.8 (7.9–12.1) | 32.2 (11.2–77.7) | 138.1 (92.1–201.7) | 84.6 (58.4–125.7) | |
| 2017 | 38 (16.4–62.3) | 128.7 (74.4–191) | 82.8 (49.1–128.4) | 6.3 (4.7–8.2) | 13.4 (9.9–16.7) | 9.8 (7.5–12.3) | 44.3 (21.5–71.5) | 142.2 (66.7–201.6) | 92.7 (57.3–129.8) | |
| 2018 | 31.2 (14.9–55.2) | 119.1 (72.2–171.1) | 74.7 (47.5–105.4) | 5.9 (4.4–7.3) | 13.8 (10.1–19.2) | 9.8 (7.4–12.6) | 37.1 (17.2–57.8) | 132.8 (79.9–187) | 84.4 (56.7–117.8) | |
| 2010–2108 | 327.9 (264.2–381) | 1074.8 (771.9–1302.7) | 697 (559.7–930.9) | 55.5 (41.8–67.9) | 104.8 (79.2–127) | 79.9 (64.7–98.2) | 383.4 (317.3–455.2) | 1179.6 (870.1–1518.4) | 776.9 (600.8–1038.3) | |
| SUCRE | 2010 | 10.1 (0–20.2) | 35.5 (10.4–79.8) | 23 (5–49) | 2 (0.9–2.8) | 3.8 (2.8–4.7) | 2.9 (2.1–3.8) | 12.1 (1.3–32.5) | 39.3 (8.5–78.2) | 25.9 (8.9–52.7) |
| 2011 | 0 (0–0) | 25.4 (0–52.7) | 12.9 (0–31) | 2.2 (1.1–3.3) | 3.2 (2.3–4.2) | 2.7 (2–3.6) | 2.2 (1.1–3.3) | 28.6 (3.3–74.4) | 15.6 (2.9–47.4) | |
| 2012 | 60.7 (6.4–105.9) | 14.7 (0–35.4) | 37.4 (12.7–69.1) | 1.7 (0.8–2.6) | 2.6 (1.6–3.4) | 2.2 (1.6–2.9) | 62.4 (22–125) | 17.3 (2.6–38.2) | 39.6 (17.3–67.4) | |
| 2013 | 0 (0–0) | 7.3 (0–14.5) | 3.7 (0–7.4) | 1.7 (0.8–2.5) | 3.2 (2.2–4.7) | 2.5 (1.7–3.3) | 1.7 (1–2.7) | 10.5 (2.6–24.9) | 6.2 (2.2–15.8) | |
| 2014 | 17.9 (0–49.2) | 8.3 (0–16.6) | 13 (0–28) | 1.6 (1–2.2) | 3.7 (2.2–4.8) | 2.6 (1.8–3.6) | 19.5 (1.4–60.7) | 12 (2.5–29.1) | 15.7 (3–29.7) | |
| 2015 | 8.5 (0–25.4) | 35.1 (5.8–83.2) | 21.9 (5.8–56.6) | 2.6 (1.7–3.8) | 2.2 (1.3–3.9) | 2.4 (1.6–3.2) | 11.1 (2–28.4) | 37.3 (3.4–80.6) | 24.4 (8.7–45.8) | |
| 2016 | 44.9 (8.6–79.4) | 12.7 (0–25.3) | 28.5 (12.9–51.6) | 2.7 (1.8–4) | 3.3 (2.1–4.6) | 3 (2.1–3.8) | 47.5 (16.1–86.4) | 15.9 (2.3–41.4) | 31.5 (10.7–51.5) | |
| 2017 | 5 (0–9.9) | 40.9 (12.7–83.5) | 23.2 (5.3–50.8) | 2.8 (1.8–3.5) | 3.9 (2.6–5.1) | 3.4 (2.6–4.3) | 7.8 (2.6–18.2) | 44.8 (17.7–97.7) | 26.5 (12.5–49.9) | |
| 2018 | 26.2 (0–61.1) | 53.8 (23.2–92.8) | 40.2 (19.6–64.8) | 1.8 (1.1–2.4) | 4.2 (2.9–5.2) | 3 (2.2–4) | 28.1 (7.3–83.2) | 58 (26.5–103.5) | 43.2 (22.3–68.4) | |
| 2010–2108 | 173.9 (104.3–271.1) | 235 (166–314.5) | 204.9 (153–262) | 19.2 (11.8–22.6) | 30.3 (22.5–36.4) | 24.8 (20.2–29.6) | 193.1 (121.6–309.2) | 265.3 (192.8–351.8) | 229.7 (171.7–281.6) | |
| TOLIMA | 2010 | 58.4 (32.3–94.7) | 113.6 (79.3–161.5) | 86.2 (63.6–111.6) | 5.8 (4.3–7.6) | 10.9 (8–12.8) | 8.4 (6.8–10) | 64.2 (39.4–94.2) | 124.5 (78–166.9) | 94.5 (57.6–125.3) |
| 2011 | 43.2 (14.6–73) | 117.4 (75.3–159.2) | 80.5 (54.8–110.2) | 5.6 (4.6–6.9) | 10.7 (7.9–13.2) | 8.2 (6.5–10.1) | 48.8 (22.6–75.4) | 128.1 (79.5–178.6) | 88.6 (63.6–120.1) | |
| 2012 | 46.8 (6.1–110.2) | 94.7 (51.6–129.1) | 70.8 (35.2–128.4) | 6.8 (4.3–8.2) | 11.7 (8.5–14.7) | 9.3 (7.3–11.3) | 53.6 (13.3–142.4) | 106.4 (77.6–148.1) | 80.1 (47.8–126.9) | |
| 2013 | 8.7 (0–21.6) | 101.8 (59.4–146) | 55.4 (33.5–93.9) | 6.9 (5.1–8.7) | 12.2 (8.7–14.5) | 9.6 (7.7–11.4) | 15.6 (9.7–32.6) | 114 (70.8–163.1) | 65 (42.8–99.4) | |
| 2014 | 70.6 (25.4–116.7) | 86 (46.8–121.8) | 78.3 (51–124.5) | 6.5 (4.8–7.6) | 12.3 (9.7–15) | 9.4 (7.6–11.5) | 77.2 (30.3–136.4) | 98.3 (51.8–136.1) | 87.8 (50.9–113.4) | |
| 2015 | 48.4 (20.2–83.1) | 116.5 (73.8–181.9) | 82.5 (42.1–117.2) | 8.4 (6.2–10.5) | 13 (10.2–16.4) | 10.7 (8.8–12.8) | 56.8 (29.7–81.6) | 129.5 (74.6–194.6) | 93.2 (67.4–139.5) | |
| 2016 | 41.3 (15.1–71.9) | 97.4 (59.8–151.7) | 69.4 (41–99.5) | 7.7 (6–9.4) | 13.1 (9.5–15.9) | 10.4 (8.5–12.4) | 49 (26–77.2) | 110.5 (68.4–162.3) | 79.8 (55.9–112.7) | |
| 2017 | 60.6 (19.3–128) | 148.4 (99.4–210.6) | 104.5 (57.5–145.9) | 6.7 (5–8.9) | 15.8 (11–21.5) | 11.2 (8.1–14.9) | 67.3 (31.3–135.4) | 164.2 (107.5–220.8) | 115.7 (62.3–146.1) | |
| 2018 | 55.6 (26.8–91.4) | 86.4 (50.8–140.4) | 71 (43.5–102.2) | 6 (4.2–7.8) | 13.8 (9.1–18.9) | 9.9 (7.3–13.2) | 61.6 (31.2–91.8) | 100.2 (61.9–139) | 80.9 (56.7–110.9) | |
| 2010–2108 | 433.8 (303.7–554.7) | 962.1 (707.4–1208.6) | 698.5 (540.9–908.6) | 60.5 (46.7–76.2) | 113.7 (90.2–134.6) | 87.1 (71.7–105.5) | 494.3 (345.8–631.1) | 1075.8 (844.3–1284.4) | 785.6 (613.2–938.6) | |
| VALLE | 2010 | 70.5 (51.5–95.5) | 197.3 (132.7–240.7) | 132 (104.2–167.3) | 11.2 (8.8–14.7) | 16.7 (13.6–20.8) | 13.9 (11.7–16.7) | 81.7 (62.5–115) | 214 (163.2–266.4) | 145.9 (112.2–175.9) |
| 2011 | 77.1 (57.7–115.7) | 171.3 (125.2–221.5) | 122.8 (96.5–164.3) | 9.6 (7.6–11.5) | 15.9 (12.8–18.9) | 12.6 (10.7–14.9) | 86.7 (65.3–114.9) | 187.1 (125.8–248.8) | 135.4 (103.9–160.2) | |
| 2012 | 79.3 (46.2–106.8) | 199.6 (150.4–253.3) | 137.6 (105.2–169.8) | 11.2 (9.6–13.6) | 17.5 (14.1–20.9) | 14.3 (12.2–16.3) | 90.5 (63.5–119.5) | 217.1 (167.5–260.4) | 151.9 (123.5–195.2) | |
| 2013 | 59.8 (40.4–76.7) | 127.4 (86–177.7) | 92.5 (71.8–119.4) | 8.2 (6–9.7) | 14.5 (11.2–18.1) | 11.3 (9.1–13.8) | 68 (52.1–87.9) | 141.9 (106.7–199.1) | 103.8 (75.4–135) | |
| 2014 | 61 (35.2–88.8) | 115.9 (81.1–151.2) | 87.6 (62.5–109.6) | 9.6 (7.5–11.7) | 16.4 (12.7–21.6) | 12.9 (10.5–15.5) | 70.5 (47–102.6) | 132.3 (99.7–188.4) | 100.5 (81.5–128.6) | |
| 2015 | 57.8 (34.6–74.9) | 127.6 (86–180.7) | 91.7 (68–112.6) | 9 (7–10.8) | 16.3 (12.9–20.5) | 12.5 (10.2–15.2) | 66.8 (49.9–91.4) | 143.9 (105.8–190.2) | 104.2 (83.2–133.1) | |
| 2016 | 63.2 (41.2–82.2) | 136.7 (100.5–190.5) | 98.8 (75.7–125.8) | 9.6 (7.2–11.2) | 17.7 (13.7–23.3) | 13.5 (10.9–16.9) | 72.8 (52.6–101.2) | 154.4 (109.5–203.1) | 112.3 (86.3–140.9) | |
| 2017 | 41.5 (28.8–60.6) | 133.4 (88.9–177.5) | 86 (60–119.4) | 8.8 (6.7–10.4) | 18.4 (12.9–26.1) | 13.4 (10.3–17.4) | 50.3 (35.5–78.7) | 151.8 (97–203.6) | 99.4 (69.1–138.5) | |
| 2018 | 49.7 (30.8–73.1) | 144 (101.2–195.9) | 95.3 (72.1–134.4) | 8 (6.2–10.5) | 18.4 (11.4–25.6) | 13 (9.8–17.5) | 57.7 (39.1–80) | 162.4 (118.6–220.4) | 108.4 (81.5–140.1) | |
| 2010–2108 | 557.6 (461.2–648.6) | 1349 (1111.9–1520) | 941.1 (802.3–1098.2) | 85 (72.6–103.7) | 152.1 (123.7–194.3) | 117.5 (94.7–143.3) | 642.6 (534.9–783.8) | 1501.1 (1221.6–1755.9) | 1058.6 (872.4–1293.3) | |
| VAUPES | 2010 | 0 (0–0) | 0 (0–0) | 0 (0–0) | 4.9 (0–8.3) | 6.1 (1.4–10.9) | 5.5 (1.7–8.7) | 4.9 (0–9.8) | 6.1 (1.4–9.5) | 5.5 (1.9–7.9) |
| 2011 | 81.9 (0–163.8) | 0 (0–0) | 40.3 (0–80.5) | 11.1 (3.4–23.3) | 9.4 (4.7–14.1) | 10.2 (4.8–17.4) | 93 (4.8–257.3) | 9.4 (4.7–12.2) | 50.5 (7.9–153.9) | |
| 2012 | 0 (0–0) | 0 (0–0) | 0 (0–0) | 3.4 (0–6.2) | 14 (1.4–24.2) | 8.7 (3.1–15.8) | 3.4 (0–6.2) | 14 (3.3–24.6) | 8.7 (4–14.6) | |
| 2013 | 0 (0–0) | 300.4 (0–600.8) | 152 (0–304.1) | 6.1 (1.4–9.5) | 9.2 (4.6–16.6) | 7.7 (4–13.1) | 6.1 (0–9.9) | 309.6 (6–941.8) | 159.7 (4.9–463.8) | |
| 2014 | 0 (0–0) | 0 (0–0) | 0 (0–0) | 7.9 (1.4–10.7) | 26.1 (13.7–41.7) | 16.9 (9.3–25.4) | 7.9 (3.3–12.1) | 26.1 (13.3–36.6) | 16.9 (9.9–25.4) | |
| 2015 | 0 (0–0) | 0 (0–0) | 0 (0–0) | 6 (0–12) | 12.3 (4.5–18.2) | 9.2 (5.3–14.4) | 6 (1.4–10.6) | 12.3 (5.9–19.5) | 9.2 (5.3–14.4) | |
| 2016 | 280.7 (0–824.3) | 392.4 (0–948.1) | 336.9 (80.8–753.2) | 5.9 (1.4–14.1) | 10.4 (4.1–14.9) | 8.2 (4.5–12.7) | 286.6 (0.9–639.9) | 402.8 (6.8–1352.3) | 345.1 (47.6–735.5) | |
| 2017 | 0 (0–0) | 153 (0–385.5) | 76.9 (0–182.5) | 7.7 (1.4–14.9) | 16.5 (8.9–23.7) | 11.9 (6.7–18) | 7.7 (2.3–13.5) | 169.1 (15.7–382.4) | 88.8 (10.6–221.1) | |
| 2018 | 0 (0–0) | 136.3 (0–273.1) | 68.3 (0–136.9) | 7.6 (1.3–10.3) | 13.3 (7.5–20.4) | 10.2 (5.8–14.7) | 7.6 (1.3–11.6) | 149.6 (8.9–420.5) | 78.8 (9.6–215.5) | |
| 2010–2108 | 366.2 (0–844.6) | 993.9 (315.6–1949.3) | 683.2 (326.8–1097.1) | 60.3 (37.8–89.2) | 116.8 (84.3–144.7) | 89 (66.6–112.9) | 426.5 (114.4–824) | 1110.7 (464–1849) | 772 (448.9–1108.2) | |
| VICHADA | 2010 | 0 (0–0) | 185 (0–370.2) | 94.4 (0–283.3) | 13.8 (4.5–22.5) | 21.5 (12.3–33.9) | 17.7 (11–24.5) | 13.8 (6.4–24.4) | 206.5 (12–581.6) | 112.1 (12.7–355) |
| 2011 | 0 (0–0) | 0 (0–0) | 0 (0–0) | 7.2 (3.7–13.4) | 6.9 (3–12) | 7 (3.5–10.7) | 7.2 (2.2–10.6) | 6.9 (3–11.7) | 7 (4.6–11.6) | |
| 2012 | 0 (0–0) | 27.6 (0–82.5) | 14 (0–28.1) | 0.9 (0–2.1) | 13.5 (4.1–22.3) | 7.5 (3–12.4) | 0.9 (0–2.1) | 41.1 (9.7–106.3) | 21.5 (3.3–45.4) | |
| 2013 | 0 (0–0) | 0 (0–0) | 0 (0–0) | 6.8 (2.4–11) | 9.5 (5.7–14.1) | 8.2 (4.8–11.7) | 6.8 (3–11.6) | 9.5 (6.6–14.3) | 8.2 (5.2–11.5) | |
| 2014 | 0 (0–0) | 0 (0–0) | 0 (0–0) | 5.8 (2–8.7) | 8.4 (2.8–14) | 7.1 (3.7–10.4) | 5.8 (2–8.7) | 8.4 (2.8–13.5) | 7.1 (4.3–10.4) | |
| 2015 | 0 (0–0) | 178.3 (0–356.7) | 90.4 (0–271.3) | 11.3 (4.5–20.6) | 11.8 (6.3–23.8) | 11.5 (6.5–16.3) | 11.3 (5.6–17.8) | 190.1 (8.2–722.7) | 102 (8.3–280.5) | |
| 2016 | 0 (0–0) | 0 (0–0) | 0 (0–0) | 11.8 (7.1–18.7) | 13.4 (7.2–19.3) | 12.6 (9–17.2) | 11.8 (5.5–17.3) | 13.4 (8.6–19.6) | 12.6 (8.5–16.7) | |
| 2017 | 0 (0–0) | 0 (0–0) | 0 (0–0) | 4.6 (0.8–7) | 14.9 (6–24.4) | 9.7 (5.3–14.2) | 4.6 (0–7) | 14.9 (7.9–23) | 9.7 (5.3–13.9) | |
| 2018 | 0 (0–0) | 0 (0–0) | 0 (0–0) | 7.1 (2.6–11.2) | 8.5 (3.3–15.4) | 7.8 (4.3–11.6) | 7.1 (2.4–13.9) | 8.5 (4.4–15.1) | 7.8 (3.6–12) | |
| 2010–2108 | 0 (0–0) | 377.3 (26.3–923) | 191.6 (13.4–468.7) | 68.8 (46.6–97.7) | 107.9 (81.8–131.7) | 88.8 (67.7–114.7) | 69.1 (48–98.6) | 485.2 (144.1–976.3) | 280.4 (89.2–530.7) | |
| Colombia | 2010 | 46.6 (38–59.5) | 105.6 (87.6–125.8) | 75.8 (60.5–88.5) | 6.8 (5.5–8.2) | 10.3 (8.1–12.4) | 8.5 (7.3–9.9) | 53.5 (41.4–61.8) | 115.9 (96–136.1) | 84.3 (72.1–100.5) |
| 2011 | 42.7 (36.3–49.7) | 93.5 (74.9–117.2) | 67.8 (52.4–79.4) | 6.1 (4.9–7.3) | 9.7 (7.9–11.5) | 7.9 (6.7–8.9) | 48.8 (42–57.3) | 103.2 (83.5–125.6) | 75.6 (60.3–91.7) | |
| 2012 | 44.4 (33.7–51.5) | 93.7 (70.1–108.7) | 68.7 (58.1–81.8) | 6.3 (5–7.5) | 10.2 (7.9–12) | 8.2 (7–9.6) | 50.6 (40.9–60.1) | 103.9 (84.6–124.6) | 76.9 (63.3–89.4) | |
| 2013 | 41.2 (33.7–49.2) | 87.4 (65–108.1) | 64 (51.3–77.3) | 6.1 (4.6–7.3) | 10.2 (8.4–12.7) | 8.1 (7–9.8) | 47.3 (40–56.8) | 97.7 (73.8–117.7) | 72.2 (56.7–84.2) | |
| 2014 | 40.6 (30.5–47.4) | 89.5 (69–104.8) | 64.7 (52.5–77) | 6.4 (5.1–7.5) | 10.9 (8.4–13.1) | 8.7 (7.6–11.1) | 47 (36.5–60.2) | 100.4 (76.8–115) | 73.4 (59.1–86.1) | |
| 2015 | 38.6 (32.1–45.2) | 90.5 (72.1–109) | 64.2 (51.3–78.3) | 6.3 (5–7.5) | 11 (8–13) | 8.6 (6.9–10.1) | 44.8 (35.1–52.6) | 101.5 (76.1–123.2) | 72.8 (60.5–91.7) | |
| 2016 | 40.1 (29.5–48.5) | 94.4 (67.4–118.5) | 66.9 (53.5–84.2) | 6.7 (5.3–7.8) | 11.8 (9.2–14.3) | 9.2 (7.8–10.5) | 46.8 (38.8–63) | 106.2 (82.3–130.3) | 76.1 (57–94.1) | |
| 2017 | 33.6 (27.6–39.4) | 91.6 (70.1–112.3) | 62.3 (43.4–73.7) | 6.5 (5–8.1) | 11.9 (8.6–14.9) | 9.2 (7.7–10.9) | 40.1 (31.2–44.8) | 103.5 (76.1–129.1) | 71.4 (57.4–85.5) | |
| 2018 | 42.9 (33.9–48.4) | 103.3 (74.8–128.4) | 72.7 (58.6–88.6) | 5.9 (4.7–7.1) | 11.6 (7.7–14.8) | 8.7 (7.4–11.6) | 48.8 (39.8–56.4) | 114.9 (89.5–144.6) | 81.4 (63–100) | |
| 2010–2108 | 370.1 (315.9–416.8) | 849.5 (694–987.9) | 606.8 (491.6–713.8) | 57.1 (42.6–67.8) | 97.8 (79.6–117.9) | 77.2 (64.8–90.6) | 427.2 (353–492.3) | 947.3 (785–1136.2) | 684 (581.2–809.1) | |


References
- Xie, Y.; Han, J.; Yu, W.; Wu, J.; Li, X.; Chen, H. Survival Analysis of Risk Factors for Mortality in a Cohort of Patients with Tuberculosis. Can. Respir. J. 2020, 2020, 1654653. [Google Scholar] [CrossRef]
- Global Health Organization. Global Tuberculosis Report. 2020. Available online: https://apps.who.int/iris/bitstream/handle/10665/336069/9789240013131-eng.pdf (accessed on 14 July 2022).
- Cohen, A.; Mathiasen, V.D.; Schön, T.; Wejse, C. The global prevalence of latent tuberculosis: A systematic review and metaanalysis. Eur. Respir. J. 2019, 54, 1900655. Available online: https://erj.ersjournals.com/content/54/3/1900655 (accessed on 15 July 2022). [CrossRef] [PubMed]
- Organización Mundial de la Salud. Tuberculosis: Datos Clave. 2020. Available online: https://www.who.int/news-room/fact-sheets/detail/tuberculosis (accessed on 16 July 2022).
- Ministerio de la Protección Social. Decreto 3518 de 2006. Por el Cual se Crea y Reglamenta el Sistema de Vigilancia en Salud Pública y se Dictan Otras Disposiciones. Diario Oficial 46417 de Octubre 6. Available online: https://www.suin-juriscol.gov.co/viewDocument.asp?ruta=Decretos/1529807 (accessed on 10 July 2022).
- Ministerio de la Protección Social. Resolución 227 de 2020. Por Medio de la Cual se Adopta Lineamientos Técnicos y Operativos del Programa Nacional de Prevención y Control de la Tuberculosis y se Dictan Otras Disposiciones. Available online: https://www.minsalud.gov.co/Normatividad_Nuevo/Resoluci%C3%B3n%20No.%20227%20de%202020.pdf (accessed on 10 July 2022).
- Ministerio de Salud y Protección Social. Plan Decenal de Salud Pública. Available online: https://www.minsalud.gov.co/sites/rid/Lists/BibliotecaDigital/RIDE/VS/ED/PSP/documento-plan-decenal-salud-publica-2022-2031.pdf (accessed on 7 July 2022).
- Instituto Nacional de Salud. Protocolo Tuberculosis. Available online: https://www.ins.gov.co/buscador-eventos/Lineamientos/Pro_Tuberculosis%202022.pdf (accessed on 27 July 2022).
- Instituto Nacional de Salud. Protocolo Tuberculosis Farmacorresistente. Available online: https://www.ins.gov.co/buscador-eventos/Lineamientos/PRO_Tuberculosis_farmacorresistente.pdf (accessed on 27 July 2022).
- Huang, K.; Hu, C.Y.; Yang, X.Y.; Zhang, Y.; Wang, X.Q.; Zhang, K.D.; Li, Y.Q.; Wang, J.; Yu, W.J.; Cheng, X.; et al. Contributions of ambient temperature and relative humidity to the risk of tuberculosis admissions: A multicity study in Central China. Sci. Total Environ. 2022, 838, 156272. [Google Scholar] [CrossRef] [PubMed]
- Khurana, A.K.; Aggarwal, D. The (in)significance of TB and COVID-19 co-infection. Eur. Respir. J. 2020, 56, 2002105. [Google Scholar] [CrossRef] [PubMed]
- Visca, D.; Ong, C.W.M.; Tiberi, S.; Centis, R.; D’Ambrosio, L.; Chen, B.; Mueller, J.; Mueller, P.; Duarte, R.; Dalcolmo, M.; et al. Tuberculosis and COVID-19 interaction: A review of biological, clinical and public health effects. Pulmonology 2021, 27, 151–165. [Google Scholar] [CrossRef]
- Menzies, N.A.; Quaife, M.; Allwood, B.W.; Byrne, A.L.; Coussens, A.K.; Harries, A.D.; Marx, F.M.; Meghji, J.; Pedrazzoli, D.; Salomon, J.A.; et al. Lifetime burden of disease due to incident tuberculosis: A global reappraisal including post-tuberculosis sequelae. Lancet Glob. Health 2021, 9, e1679–e1687. [Google Scholar] [CrossRef]
- Chakaya, J.; Khan, M.; Ntoumi, F.; Aklillu, E.; Fatima, R.; Mwaba, P.; Kapata, N.; Mfinanga, S.; Hasnain, S.E.; Katoto, P.D.; et al. Global Tuberculosis Report 2020—Reflections on the Global TB burden, treatment and prevention efforts. Int. J. Infect. Dis. 2021, 113 (Suppl. 1), S7–S12. [Google Scholar] [CrossRef]
- Global Health Metrics. Drug-susceptible tuberculosis Multidrug-resistant tuberculosis without extensive drug resistance Other causes. Lancet 2020, 396, 1. Available online: https://ghdx.healthdata.org/ (accessed on 24 July 2022).
- Organización Panamericana de la Salud. Tuberculosis en las Américas. Informe Regional 2020. Available online: https://iris.paho.org/handle/10665.2/55047 (accessed on 24 July 2022).
- Organización Mundial de la Salud. Primera Conferencia Ministerial Mundial de la OMS. 2017. Available online: https://www.who.int/es/director-general/speeches/detail/first-who-global-ministerial-conference-ending-TB-in-the-sdg-era (accessed on 26 July 2022).
- López, A.; Murray, C. La carga mundial de morbilidad, 1990–2020. Nat. Med. 1998, 4, 1241–1243. [Google Scholar] [CrossRef]
- Martinez, R.; Soliz, P.; Caixeta, R.; Ordunez, P. Reflection on modern methods: Years of life lost due to premature mortality-a versatile and comprehensive measure for monitoring non-communicable disease mortality. Int. J. Epidemiol. 2019, 48, 1367–1376. [Google Scholar] [CrossRef]
- Salomon, J.A.; Vos, T.; Hogan, D.R.; Gagnon, M.; Naghavi, M.; Mokdad, A.; Begum, N.; Shah, R.; Karyana, M.; Kosen, S.; et al. Common values in assessing health outcomes from disease and injury: Disability weights measurement study for the Global Burden of Disease Study 2010. Lancet 2012, 380, 2129–2143. [Google Scholar] [CrossRef]
- World Heatlh Organization. WHO Methods and Data Sources for Global Burden of Disease Estimates 2000–2015. In Global Health Estimates Technical Paper WHO/HIS/IER/GHE/; Department of Information EaRW: Geneva, Switzerland, 2017; p. 52. Available online: https://cdn.who.int/media/docs/default-source/gho-documents/global-health-estimates/ghe2019_daly-methods.pdf?sfvrsn=31b25009_7 (accessed on 22 July 2022).
- Rodríguez-García, J.; Peñaloza-Quintero, R.; Amaya-Lara, J. Estimación de la carga global de enfermedad en Colombia 2012: Nuevos aspectos metodológicos. Rev. Salud Pública 2017, 19, 235–240. [Google Scholar] [CrossRef] [PubMed]
- Bernal-Villegas, J.; Suárez-Obando, F. La carga de la enfermedad en Colombia. Univ. Méd. 2008, 49, 12–28. Available online: https://www.redalyc.org/articulo.oa?id=231016462002 (accessed on 24 July 2022).
- Triana, J.J.; Aristizábal-Mayor, J.D.; Plata, M.C.; Medina, M.; Baquero, L.; Gil-Tamayo, S.; Leguizamón, A.M.; Leonardi, F.; Castañeda-Cardona, C.; Rosselli, D. Disease Burden of Gastric Cancer in Disability-Adjusted Life Years in Colombia. Rev. Colomb. Gastroenterol. 2017, 32, 326–331. Available online: http://www.scielo.org.co/scielo.php?script=sci_arttext&pid=S0120-99572017000400326&lang=en%0Ahttp://www.scielo.org.co/pdf/rcg/v32n4/0120-9957-rcg-32-04-00326.pdf (accessed on 31 July 2022).
- Ministerio de Salud y Protección Social. Análisis de la Situación en Salud en Colombia 2021. Available online: https://es.scribd.com/document/584723560/Analisis-Situacion-Salud-Colombia-2021 (accessed on 1 August 2022).
- Congreso de la República de Colombia. Ley Estatutaria 1751/2015. Por Medio de la Cual se Regula el Derecho Fundamental a la Salud y se Dictan Otras Disposiciones. Diario Oficial No. 49.427 Febrero 16. Available online: http://secretariasenado.gov.co/senado/basedoc/ley_1751_2015.html (accessed on 1 August 2022).
- Congreso de la República de Colombia. Ley 100/1993. Por la Cual se Crea el Sistema de Seguridad Social Integral y se Dictan otras Disposiciones. Diario Oficial 41.148 de Diciembre 23. Available online: https://funcionpublica.gov.co/eva/gestornormativo/norma.php?i=5248 (accessed on 1 August 2022).
- Presidencia de la República de Colombia. Decreto 780 de 2016. Por Medio del Cual se Expide el Decreto Único Reglamentario del Sector Salud y Protección Social. Diario Oficial No. 49.865 de 6 de Mayo. Available online: https://funcionpublica.gov.co/eva/gestornormativo/norma.php?i=77813 (accessed on 1 August 2022).
- Congreso de la República de Colombia. Ley 1122/2007. Por la Cual se Hacen Algunas Modificaciones en el Sistema General de Seguridad Social en Salud y se Dictan Otras Disposiciones. Diario Oficial 46.506 de 9 de Enero. Available online: http://www.secretariasenado.gov.co/senado/basedoc/ley_1122_2007.html (accessed on 1 August 2022).
- Ministerio de Salud y Protección Social. Resolución 1036/2022. Por la Cual se Reglamenta el Registro Individual de Prestación de Servicios de Salud. Available online: https://www.minsalud.gov.co/Normatividad_Nuevo/Resoluci%C3%B3n%20No.%201036%20de%202022.pdf (accessed on 1 August 2022).
- World Health Organization. Methods and Data Sources for Global Burden of Disease Estimates 2010–2019. In Global Health Estimates Technical Paper; Department of Information EaRW: Geneva, Switzerland, 2019; Available online: https://cdn.who.int/media/docs/defaultsource/gho-documents/global-health-estimates/ghe2019_daly-methods.pdf?sfvrsn=31b25009_7 (accessed on 28 June 2022).
- The US Burden of Disease Collaborators. The state of US health, 1990-2016: Burden of diseases, injuries, and risk factors among US states. JAMA 2018, 319, 1444–1472. [Google Scholar] [CrossRef]
- Ministerio de Protección Social, Instituto Nacional de Salud, Organización Panamericana de la Salud. Plan Estratégico Colombia Libre de Tuberculosis 2010-2015 Para la Expansión y Fortalecimiento de la Estrategia Alto a la TB. Para la Expansión y Fortalecimiento de la Estrategia Alto a la TB. 2009. Available online: http://www.paho.org/col/index.php?option=com_content&view=article&id=431:plan-estrategico-colombia-libre-de-tuberculosis-2010-2015&Itemid=361 (accessed on 28 June 2022).
- Gutiérrez-Lesmes, O.; Grisales-Romero, H. Completitud de los reportes de mortalidad en el sistema de estadísticas vitales en la Orinoquía colombiana, 2017. Rev. Salud Pública 2020, 22, e203. Available online: https://revistas.unal.edu.co/index.php/revsaludpublica/article/view/86460 (accessed on 26 June 2022). [CrossRef]
- Ministerio de Salud y Protección Social. Resolución 8430/1993. Por la Cual se Establecen las Normas Científicas, Técnicas y Administrativas Para la Investigación en Salud; Imprenta Nacional: Bogotá, Colombia, 1993. Available online: https://minsalud.gov.co/sites/rid/Lists/BibliotecaDigital/RIDE/DE/DIJ/RESOLUCION-8430-DE-1993.pdf (accessed on 1 August 2022).
- Vos, T.; Lim, S.S.; Abbafati, C.; Abbas, K.M.; Abbasi, M.; Abbasifard, M.; Abbasi-Kangevari, M.; Abbastabar, H.; Abd-Allah, F.; Abdelalim, A.; et al. Global burden of 369 diseases and injuries in 204 countries and territories, 1990–2019: A systematic analysis for the Global Burden of Disease Study 2019. Lancet 2020, 396, 1204–1222. Available online: https://linkinghub.elsevier.com/retrieve/pii/S0140673620309259 (accessed on 2 August 2022). [CrossRef]
- Lee, S.; Kim, M.J.; Lee, S.H.; Kim, H.Y.; Kim, H.S.; Oh, I.H. Comparison of Disability-Adjusted Life Years (DALYs) and Economic Burden on People With Drug-Susceptible Tuberculosis and Multidrug-Resistant Tuberculosis in Korea. Front. Public Health 2022, 10, 848370. [Google Scholar] [CrossRef]
- Rumisha, S.F.; George, J.; Bwana, V.M.; Mboera, L.E.G. Years of potential life lost and productivity costs due to premature mortality from six priority diseases in Tanzania, 2006–2015. PLoS ONE 2020, 15, e0234300. [Google Scholar] [CrossRef]
- Hertz, D.; Schneider, B. Sex differences in tuberculosis. Semin. Immunopathol. 2019, 41, 225–237. [Google Scholar] [CrossRef]
- Horton, K.C.; Sumner, T.; Houben, R.M.G.J.; Corbett, E.L.; White, R.G. A Bayesian Approach to Understanding Sex Differences in Tuberculosis Disease Burden. Am. J. Epidemiol. 2018, 187, 2431–2438. [Google Scholar] [CrossRef]
- Thomas, B.E.; Thiruvengadam, K.; Kadam, D.; Ovung, S.; Sivakumar, S.; Shivakumar, S.V.B.Y.; Paradkar, M.; Gupte, N.; Suryavanshi, N.; Dolla, C.K.; et al. Smoking, alcohol use disorder and tuberculosis treatment outcomes: A dual co-morbidity burden that cannot be ignored. PLoS ONE 2019, 14, e0224914, Erratum in PLoS ONE 2019, 14, e0220507. [Google Scholar] [CrossRef]
- Chikovore, J.; Pai, M.; Horton, K.C.; Daftary, A.; Kumwenda, M.K.; Hart, G.; Corbett, E.L. Missing men with tuberculosis: The need to address structural influences and implement targeted and multidimensional interventions. BMJ Glob. Health 2020, 5, e002255. Available online: https://gh.bmj.com/content/5/5/e002255.citation-tools (accessed on 1 August 2022). [CrossRef] [PubMed]
- Wang, H.; Abbas, K.M.; Abbasifard, M.; Abbasi-Kangevari, M.; Abbastabar, H.; Abd-Allah, F.; Abdelalim, A.; Abolhassani, H.; Abreu, L.G.; Abrigo, M.R.; et al. Global age-sex-specific fertility, mortality, healthy life expectancy (HALE), and population estimates in 204 countries and territories, 1950–2019: A comprehensive demographic analysis for the Global Burden of Disease Study 2019. Lancet 2020, 396, 1160–1203. Available online: https://linkinghub.elsevier.com/retrieve/pii/S0140673620309776 (accessed on 4 August 2022). [CrossRef]
- Cravo, J.; Marques, M.A.T. Endobronchial foreign bodies in adults—Flexible bronchoscopy as a first approach. Pulmonology 2018, 24, 198–199. [Google Scholar] [CrossRef]
- Martial, N.T.; Mubarik, S.; Yu, C. Long-term trends of tuberculosis incidence and mortality in four central African countries. Sci. Rep. 2021, 11, 16624. [Google Scholar] [CrossRef]
- Duarte, R.; Lönnroth, K.; Carvalho, C.; Lima, F.; Carvalho, A.C.C.; Muñoz-Torrico, M.; Centis, R. Tuberculosis, social determinants and co-morbidities (including HIV). Pulmonology 2018, 24, 115–119. [Google Scholar] [CrossRef]
- Negin, J.; Abimbola, S.; Marais, B.J. Tuberculosis among older adults—Time to take notice. Int. J. Infect. Dis. 2015, 32, 135–137. [Google Scholar] [CrossRef]
- Ananthakrishnan, R.; Jeyaraj, A.; Palani, G.; Sathiyasekaran, B.W. Socioeconomic impact of TB on patients registered within RNTCP and their families in the year 2007 in Chennai, India. Lung India 2012, 29, 221–226. [Google Scholar] [CrossRef]
- Musso, M.; Di Gennaro, F.; Gualano, G.; Mosti, S.; Cerva, C.; Fard, S.N.; Libertone, R.; Di Bari, V.; Cristofaro, M.; Tonnarini, R.; et al. Concurrent cavitary pulmonary tuberculosis and COVID-19 pneumonia with in vitro immune cell anergy. Infection 2021, 49, 1061–1064. [Google Scholar] [CrossRef]
- Tan, L.; Wang, Q.; Zhang, D.; Ding, J.; Huang, Q.; Tang, Y.Q.; Wang, Q.; Miao, H. Lymphopenia predicts disease severity of COVID-19: A descriptive and predictive study. Signal Transduct. Target. Ther. 2020, 5, 33, Erratum in Signal Transduct. Target Ther. 2020, 5, 61. [Google Scholar] [CrossRef] [PubMed]
- Weiskopf, D.; Schmitz, K.S.; Raadsen, M.P.; Grifoni, A.; Okba, N.M.A.; Endeman, H.; van den Akker, J.P.C.; Molenkamp, R.; Koopmans, M.P.G.; van Gorp, E.C.M.; et al. Phenotype and kinetics of SARS-CoV-2-specific T cells in COVID-19 patients with acute respiratory distress syndrome. Sci. Immunol. 2020, 5, eabd2071. [Google Scholar] [CrossRef] [PubMed]
- Di Gennaro, F.; Gualano, G.; Timelli, L.; Vittozzi, P.; Di Bari, V.; Libertone, R.; Cerva, C.; Pinnarelli, L.; Nisii, C.; Ianniello, S.; et al. Increase in Tuberculosis Diagnostic Delay during First Wave of the COVID-19 Pandemic: Data from an Italian Infectious Disease Referral Hospital. Antibiotics 2021, 10, 272. [Google Scholar] [CrossRef] [PubMed]
- Cilloni, L.; Fu, H.; Vesga, J.F.; Dowdy, D.; Pretorius, C.; Ahmedov, S.; Nair, S.A.; Mosneaga, A.; Masini, E.; Sahu, S.; et al. The potential impact of the COVID-19 pandemic on the tuberculosis epidemic a modelling analysis. EClinicalMedicine 2020, 28, 100603. [Google Scholar] [CrossRef] [PubMed]
- Silva, S.; Arinaminpathy, N.; Atun, R.; Goosby, E.; Reid, M. Economic impact of tuberculosis mortality in 120 countries and the cost of not achieving the Sustainable Development Goals tuberculosis targets: A full-income analysis. Lancet Glob. Health 2021, 9, e1372–e1379. [Google Scholar] [CrossRef]
- Di Gennaro, F.; Pizzol, D.; Cebola, B.; Stubbs, B.; Monno, L.; Saracino, A.; Luchini, C.; Solmi, M.; Segafredo, G.; Putoto, G.; et al. Social determinants of therapy failure and multi drug resistance among people with tuberculosis: A review. Tuberculosis 2017, 103, 44–51. [Google Scholar] [CrossRef]
- Hogan, A.B.; Jewell, B.L.; Sherrard-Smith, E.; Vesga, J.F.; Watson, O.J.; Whittaker, C.; Hamlet, A.; Smith, J.A.; Winskill, P.; Verity, R.; et al. Potential impact of the COVID-19 pandemic on HIV, tuberculosis, and malaria in low-income and middle-income countries: A modelling study. Lancet Glob. Health 2020, 8, e1132–e1141. [Google Scholar] [CrossRef]
- Alene, K.A.; Wangdi, K.; Clements, A.C.A. Impact of the COVID-19 Pandemic on Tuberculosis Control: An Overview. Trop. Med. Infect. Dis. 2020, 5, 123. [Google Scholar] [CrossRef]
- Sheerin, D.; Abhimanyu Wang, X.; Johnson, W.E.; Coussens, A. Systematic evaluation of transcriptomic disease risk and diagnostic biomarker overlap between COVID-19 and tuberculosis: A patient-level meta-analysis. medRxiv 2020, 2020.11.25.20236646. [Google Scholar] [CrossRef]
- Institute for Health Metrics and Evaluation. Global Health Data Exchange GBD 2019. 2020. Available online: http://ghdx.healthdata.org/gbd−2019 (accessed on 2 August 2022).
- de Paiva, J.P.S.; Magalhães, M.A.F.M.; Leal, T.C.; da Silva, L.F.; da Silva, L.G.; do Carmo, R.F.; de Souza, C.D.F. Time trend, social vulnerability, and identification of risk areas for tuberculosis in Brazil: An ecological study. PLoS ONE 2022, 17, e0247894. [Google Scholar] [CrossRef]
- Mendivil, C.; Amaya-Montoya, M.; Hernández-Vargas, J.; Ramírez-García, N.; Romero-Díaz, C.; Pérez-Londoño, A.; Guatibonza-García, V.; Acuña-Merchán, L. Achievement of treatment goals among adults with diabetes in Colombia, 2015–2019: Results from a national registry. Diabetes Res. Clin. Pract. 2022, 186, 109823. [Google Scholar] [CrossRef] [PubMed]
- Lönnroth, K.; Castro, K.G.; Chakaya, J.M.; Chauhan, L.S.; Floyd, K.; Glaziou, P.; Raviglione, M.C. Tuberculosis control and elimination 2010–50: Cure, care, and social development. Lancet 2010, 375, 1814–1829. [Google Scholar] [CrossRef]
- Alene, K.A.; Wangdi, K.; Colquhoun, S.; Chani, K.; Islam, T.; Rahevar, K.; Morishita, F.; Byrne, A.; Clark, J.; Viney, K. Tuberculosis related disability: A systematic review and meta-analysis. BMC Med. 2021, 19, 203. [Google Scholar] [CrossRef] [PubMed]
- Mendes, M.D.S.; Oliveira, A.L.S.; Pimentel, L.M.L.M.; Figueiredo, T.M.R.M.; Schindler, H.C. Spatial analysis of tuberculosis in children under 15 years of age and socioeconomic risk: An ecological study in Paraíba, Brazil, 2007–2016. Epidemiol. Serv. Saude 2021, 30, e20201038. [Google Scholar] [CrossRef]
- Gele, A.A.; Bjune, G.; Abebe, F. Pastoralism and delay in diagnosis of TB in Ethiopia. BMC Public Health 2009, 9, 5. [Google Scholar] [CrossRef]
- Seid, A.; Metaferia, Y. Factors associated with treatment delay among newly diagnosed tuberculosis patients in Dessie city and surroundings, Northern Central Ethiopia: A cross-sectional study. BMC Public Health 2018, 18, 931. [Google Scholar] [CrossRef]
- Shiferaw, M.B.; Zegeye, A.M. Delay in tuberculosis diagnosis and treatment in Amhara state, Ethiopia. BMC Health Serv. Res. 2019, 19, 232. [Google Scholar] [CrossRef]
- Wailoo, K. Spectacles of Difference: The Racial Scripting of Epidemic Disparities. Bull. Hist. Med. 2020, 94, 602–625. [Google Scholar] [CrossRef]
- McMillen, C. Pueblos Indígenas, investigación sobre tuberculosis y cambio de ideas sobre la raza en la década de 1930. CMAJ 2021, 193, E1666–E1668. [Google Scholar] [CrossRef]
- Krishnan, L.; Akande, T.; Shankar, A.V.; McIntire, K.N.; Gounder, C.R.; Gupta, A.; Yang, W.T. Gender-related barriers and delays in accessing tuberculosis diagnostic and treatment services: A systematic review of qualitative studies. Tuberc. Res. Treat. 2014, 2014, 215059. [Google Scholar] [CrossRef]
- Robsky, K.O.; Hughes, S.; Kityamuwesi, A.; Kendall, E.A.; Kitonsa, P.J.; Dowdy, D.W.; Katamba, A. Is distance associated with tuberculosis treatment outcomes? A retrospective cohort study in Kampala, Uganda. BMC Infect. Dis. 2020, 20, 406. [Google Scholar] [CrossRef] [PubMed]
- Jenkins, H.E.; Ayuk, S.; Puma, D.; Brooks, M.B.; Millones, A.K.; Jimenez, J.; Lecca, L.; Galea, J.T.; Becerra, M.; Keshavjee, S.; et al. Geographic accessibility to health facilities predicts uptake of community-based tuberculosis screening in an urban setting. Int. J. Infect. Dis. 2022, 120, 125–131. [Google Scholar] [CrossRef] [PubMed]
- Gianella, C.; Ugarte-Gil, C.; Caro, G.; Aylas, R.; Castro, C.; Lema, C. TB in Vulnerable Populations: The Case of an Indigenous Community in the Peruvian Amazon. Health Hum. Rights J. 2016, 18, 55. Available online: https://www.hhrjournal.org/2016/06/tuberculosis-in-vulnerable-populations-the-case-of-an-indigenous-community-in-the-peruvian-amazon/ (accessed on 3 August 2022).
- Sánchez, A.I.M.; Mesa, Y.L.R. Meanings of “tuberculosis” in rural indigenous communities from a municipality in the Colombian Amazon. Investig. Educ. Enfermería 2017, 35, 165–173. [Google Scholar] [CrossRef][Green Version]
- Valencia-Aguirre, S.; Arroyave, I.; García-Basteiro, A.L. Educational level and tuberculosis mortality in Colombia: Growing inequalities and stagnation in reduction. Cad. Saude Publica 2022, 38, e00031721. [Google Scholar] [CrossRef] [PubMed]
- Plata-Casas, L.; González-Támara, L.; Cala-Vitery, F. Tuberculosis Mortality in Children under Fifteen Years of Age: Epidemiological Situation in Colombia, 2010-2018. Trop. Med. Infect. Dis. 2022, 7, 117. [Google Scholar] [CrossRef]
- Plata-Casas, L.; Gutiérrez-Lesmes, O.; Herrán-Falla, O. Infección concomitante por tuberculosis y el virus de la inmunodeficiencia humana: Situación epidemiológica en el departamento del Meta, 2010–2015. Biomedica 2018, 38 (Suppl. 2), 68–69. Available online: https://revistabiomedica.org/index.php/biomedica/article/view/3930 (accessed on 15 August 2022). [CrossRef]
- Cerezo-Correa, M.; Gómez-Forero, D.; Palacios-Martínez, Y. Carga de enfermedad por tuberculosis en el municipio de Pereira 2010–2015. Rev. Gerenc. Políticas Salud 2019, 18, 1–15. [Google Scholar] [CrossRef]


| Territorial Entities | Morbility | Mortality | ||
|---|---|---|---|---|
| Total Female | Total Male | Total Female | Total Male | |
| AMAZONAS | 659 | 1064 | 27 | 45 |
| ANTIOQUIA | 21,530 | 35,208 | 1191 | 2152 |
| ARAUCA | 791 | 1304 | 43 | 78 |
| ATLANTICO | 7727 | 12,626 | 665 | 1165 |
| BOGOTA | 8000 | 13,410 | 743 | 1355 |
| BOLIVAR | 3119 | 5079 | 232 | 392 |
| BOYACA | 893 | 1528 | 74 | 142 |
| CALDAS | 2460 | 4125 | 184 | 341 |
| CAQUETA | 1271 | 2095 | 83 | 156 |
| CASANARE | 961 | 1585 | 54 | 102 |
| CAUCA | 2263 | 3689 | 132 | 232 |
| CESAR | 2412 | 3915 | 182 | 326 |
| CHOCO | 2185 | 3364 | 83 | 138 |
| CORDOBA | 2101 | 3429 | 184 | 331 |
| CUNDINAMARCA | 2874 | 5014 | 188 | 379 |
| GUAINIA | 105 | 168 | 3 | 4 |
| GUAVIARE | 280 | 469 | 9 | 18 |
| HUILA | 2628 | 4463 | 191 | 356 |
| LA GUAJIRA | 2336 | 3498 | 183 | 280 |
| MAGDALENA | 2124 | 3436 | 160 | 279 |
| META | 3480 | 5783 | 256 | 462 |
| NARIÑO | 1400 | 2254 | 140 | 240 |
| NORTE DE SANTANDER | 3554 | 5942 | 286 | 528 |
| PUTUMAYO | 881 | 1437 | 25 | 42 |
| QUINDIO | 1956 | 3308 | 129 | 235 |
| RISARALDA | 4139 | 6699 | 273 | 499 |
| SANANDRES | 116 | 195 | 9 | 17 |
| SANTANDER | 4726 | 7915 | 383 | 731 |
| SUCRE | 603 | 991 | 41 | 70 |
| TOLIMA | 3541 | 5943 | 277 | 492 |
| VALLE | 15,738 | 25,845 | 1072 | 1890 |
| VAUPES | 113 | 190 | 8 | 14 |
| VICHADA | 186 | 302 | 2 | 5 |
| COLOMBIA | 107,152 | 176,273 | 7512 | 13,496 |
Publisher’s Note: MDPI stays neutral with regard to jurisdictional claims in published maps and institutional affiliations. |
© 2022 by the authors. Licensee MDPI, Basel, Switzerland. This article is an open access article distributed under the terms and conditions of the Creative Commons Attribution (CC BY) license (https://creativecommons.org/licenses/by/4.0/).
Share and Cite
Plata-Casas, L.; Gutierrez-Lesmes, O.; Cala-Vitery, F. Tuberculosis Disability Adjusted Life Years, Colombia 2010–2018. Trop. Med. Infect. Dis. 2022, 7, 250. https://doi.org/10.3390/tropicalmed7090250
Plata-Casas L, Gutierrez-Lesmes O, Cala-Vitery F. Tuberculosis Disability Adjusted Life Years, Colombia 2010–2018. Tropical Medicine and Infectious Disease. 2022; 7(9):250. https://doi.org/10.3390/tropicalmed7090250
Chicago/Turabian StylePlata-Casas, Laura, Oscar Gutierrez-Lesmes, and Favio Cala-Vitery. 2022. "Tuberculosis Disability Adjusted Life Years, Colombia 2010–2018" Tropical Medicine and Infectious Disease 7, no. 9: 250. https://doi.org/10.3390/tropicalmed7090250
APA StylePlata-Casas, L., Gutierrez-Lesmes, O., & Cala-Vitery, F. (2022). Tuberculosis Disability Adjusted Life Years, Colombia 2010–2018. Tropical Medicine and Infectious Disease, 7(9), 250. https://doi.org/10.3390/tropicalmed7090250