Trends in Influenza Infections in Three States of India from 2015–2021: Has There Been a Change during COVID-19 Pandemic?
Abstract
:1. Introduction
2. Materials and Methods
2.1. Study Design
2.2. Study Settings
General Setting: India
2.3. Study Population
2.4. Case Definitions
2.5. Clinical Data and Sample Collection and Transportation
2.6. Testing at the Laboratory
2.7. Analysis and Statistics
3. Results
4. Discussion
5. Conclusions
Supplementary Materials
Author Contributions
Funding
Institutional Review Board Statement
Informed Consent Statement
Data Availability Statement
Acknowledgments
Conflicts of Interest
References
- Javanian, M.; Barary, M.; Ghebrehewet, S.; Koppolu, V.; Vasigala, V.; Ebrahimpour, S. A brief review of influenza virus infection. J. Med. Virol. 2021, 93, 4638–4646. [Google Scholar] [CrossRef] [PubMed]
- WHO/Europe|Burden of Influenza. Available online: https://www.euro.who.int/en/health-topics/communicable-diseases/influenza/seasonal-influenza/burden-of-influenza (accessed on 25 September 2021).
- World Health Organization. Influenza (Seasonal). Available online: https://www.who.int/en/news-room/fact-sheets/detail/influenza-(seasonal) (accessed on 4 July 2020).
- State/UT—Wise, Year-Wise Number of Cases and Deaths from 2016–2021: Ministry of Health and Family Welfare. Available online: https://ncdc.gov.in/showfile.php?lid=280 (accessed on 24 September 2021).
- Olsen, S.J.; Azziz-Baumgartner, E.; Budd, A.P.; Brammer, L.; Sullivan, S.; Pineda, R.F.; Cohen, C.; Fry, A.M. Decreased Influenza Activity During the COVID-19 Pandemic—United States, Australia, Chile, and South Africa, 2020. Am. J. Transpl. 2020, 20, 3681–3685. [Google Scholar] [CrossRef] [PubMed]
- Haider, M.; Parvaiz, A.K. Negligible circulation of influenza in COVID times in Northern India. Lung India 2021, 38, 401–402. [Google Scholar]
- Demographics of India—Wikipedia. Available online: https://en.wikipedia.org/wiki/Demographics_of_India (accessed on 22 September 2021).
- Sheikh, K.; Saligram, P.S.; Hort, K. What explains regulatory failure? Analysing the architecture of health care regulation in two Indian states. Health Policy Plan. 2015, 30, 39–55. [Google Scholar] [CrossRef] [PubMed] [Green Version]
- Laboratories under the IDSP (NCDC) and ICMR Network with Capacity of Testing Influenza Virus IDSP Network of Laboratories. Available online: https://main.mohfw.gov.in/sites/default/files/58722977381424952600.pdf (accessed on 1 May 2022).
- Influenza Surveillance Lab Network: Integrated Disease Surveillance Programme(IDSP). Available online: https://idsp.nic.in/index1.php?lang=1&level=1&sublinkid=5789&lid=3722 (accessed on 22 September 2021).
- Hay, A.J.; McCauley, J.W. The WHO global influenza surveillance and response system (GISRS)—A future perspective. Influenza Other Resp. Viruses 2018, 12, 551. [Google Scholar] [CrossRef] [PubMed]
- Ziegler, T.; Mamahit, A.; Cox, N.J. 65 years of influenza surveillance by a World Health Organization-coordinated global network. Influenza Other Resp. Viruses 2018, 12, 558–565. [Google Scholar] [CrossRef] [PubMed]
- Chow, A.; Aung, A.H.; Tin, G.; Ooi, C.-K. Performance of WHO and CDC influenza-like illness (ILI) case definitions in detecting influenza in the tropics. Int. J. Infect. Dis. 2020, 101, 370–371. [Google Scholar] [CrossRef]
- Soo, R.J.J.; Chiew, C.J.; Ma, S.; Pung, R.; Lee, V.; Lee, V.J. Decreased Influenza Incidence under COVID-19 Control Measures, Singapore. Emerg. Infect. Dis. 2020, 26, 1933. [Google Scholar] [CrossRef] [PubMed]
- Wang, L.; Wang, K.; Zhong, H.; Zhao, N.; Xu, W.; Yang, Y.; He, Y.; Liu, S. The Effect of Coronavirus 2019 Disease Control Measures on the Incidence of Respiratory Infectious Disease and Air Pollutant Concentrations in the Yangtze River Delta Region, China. Int J. Environ. Res. Public Health 2022, 19, 1286. [Google Scholar] [CrossRef] [PubMed]
- Cowling, B.J.; Ali, S.T.; Ng, T.W.Y.; Tsang, T.K.; Li, J.C.M.; Fong, M.W.; Liao, Q.; Kwan, M.Y.W.; Lee, S.L.; Chiu, S.S.; et al. Impact assessment of non-pharmaceutical interventions against coronavirus disease 2019 and influenza in Hong Kong: An observational study. Lancet Public Health 2020, 5, e279–e288. [Google Scholar] [CrossRef]
- Von Elm, E.; Altman, D.G.; Egger, M.; Pocock, S.J.; Gøtzsche, P.C.; Vandenbroucke, J.P. The Strengthening the Reporting of Observational Studies in Epidemiology (STROBE) statement: Guidelines for reporting observational studies. J. Clin. Epidemiol. 2008, 61, 344–349. [Google Scholar] [CrossRef] [PubMed] [Green Version]


| Parameters | Pre-COVID-19 (2015 to 2019) | COVID-19 (2020 to 2021) | p Value | ||
|---|---|---|---|---|---|
| Testing | |||||
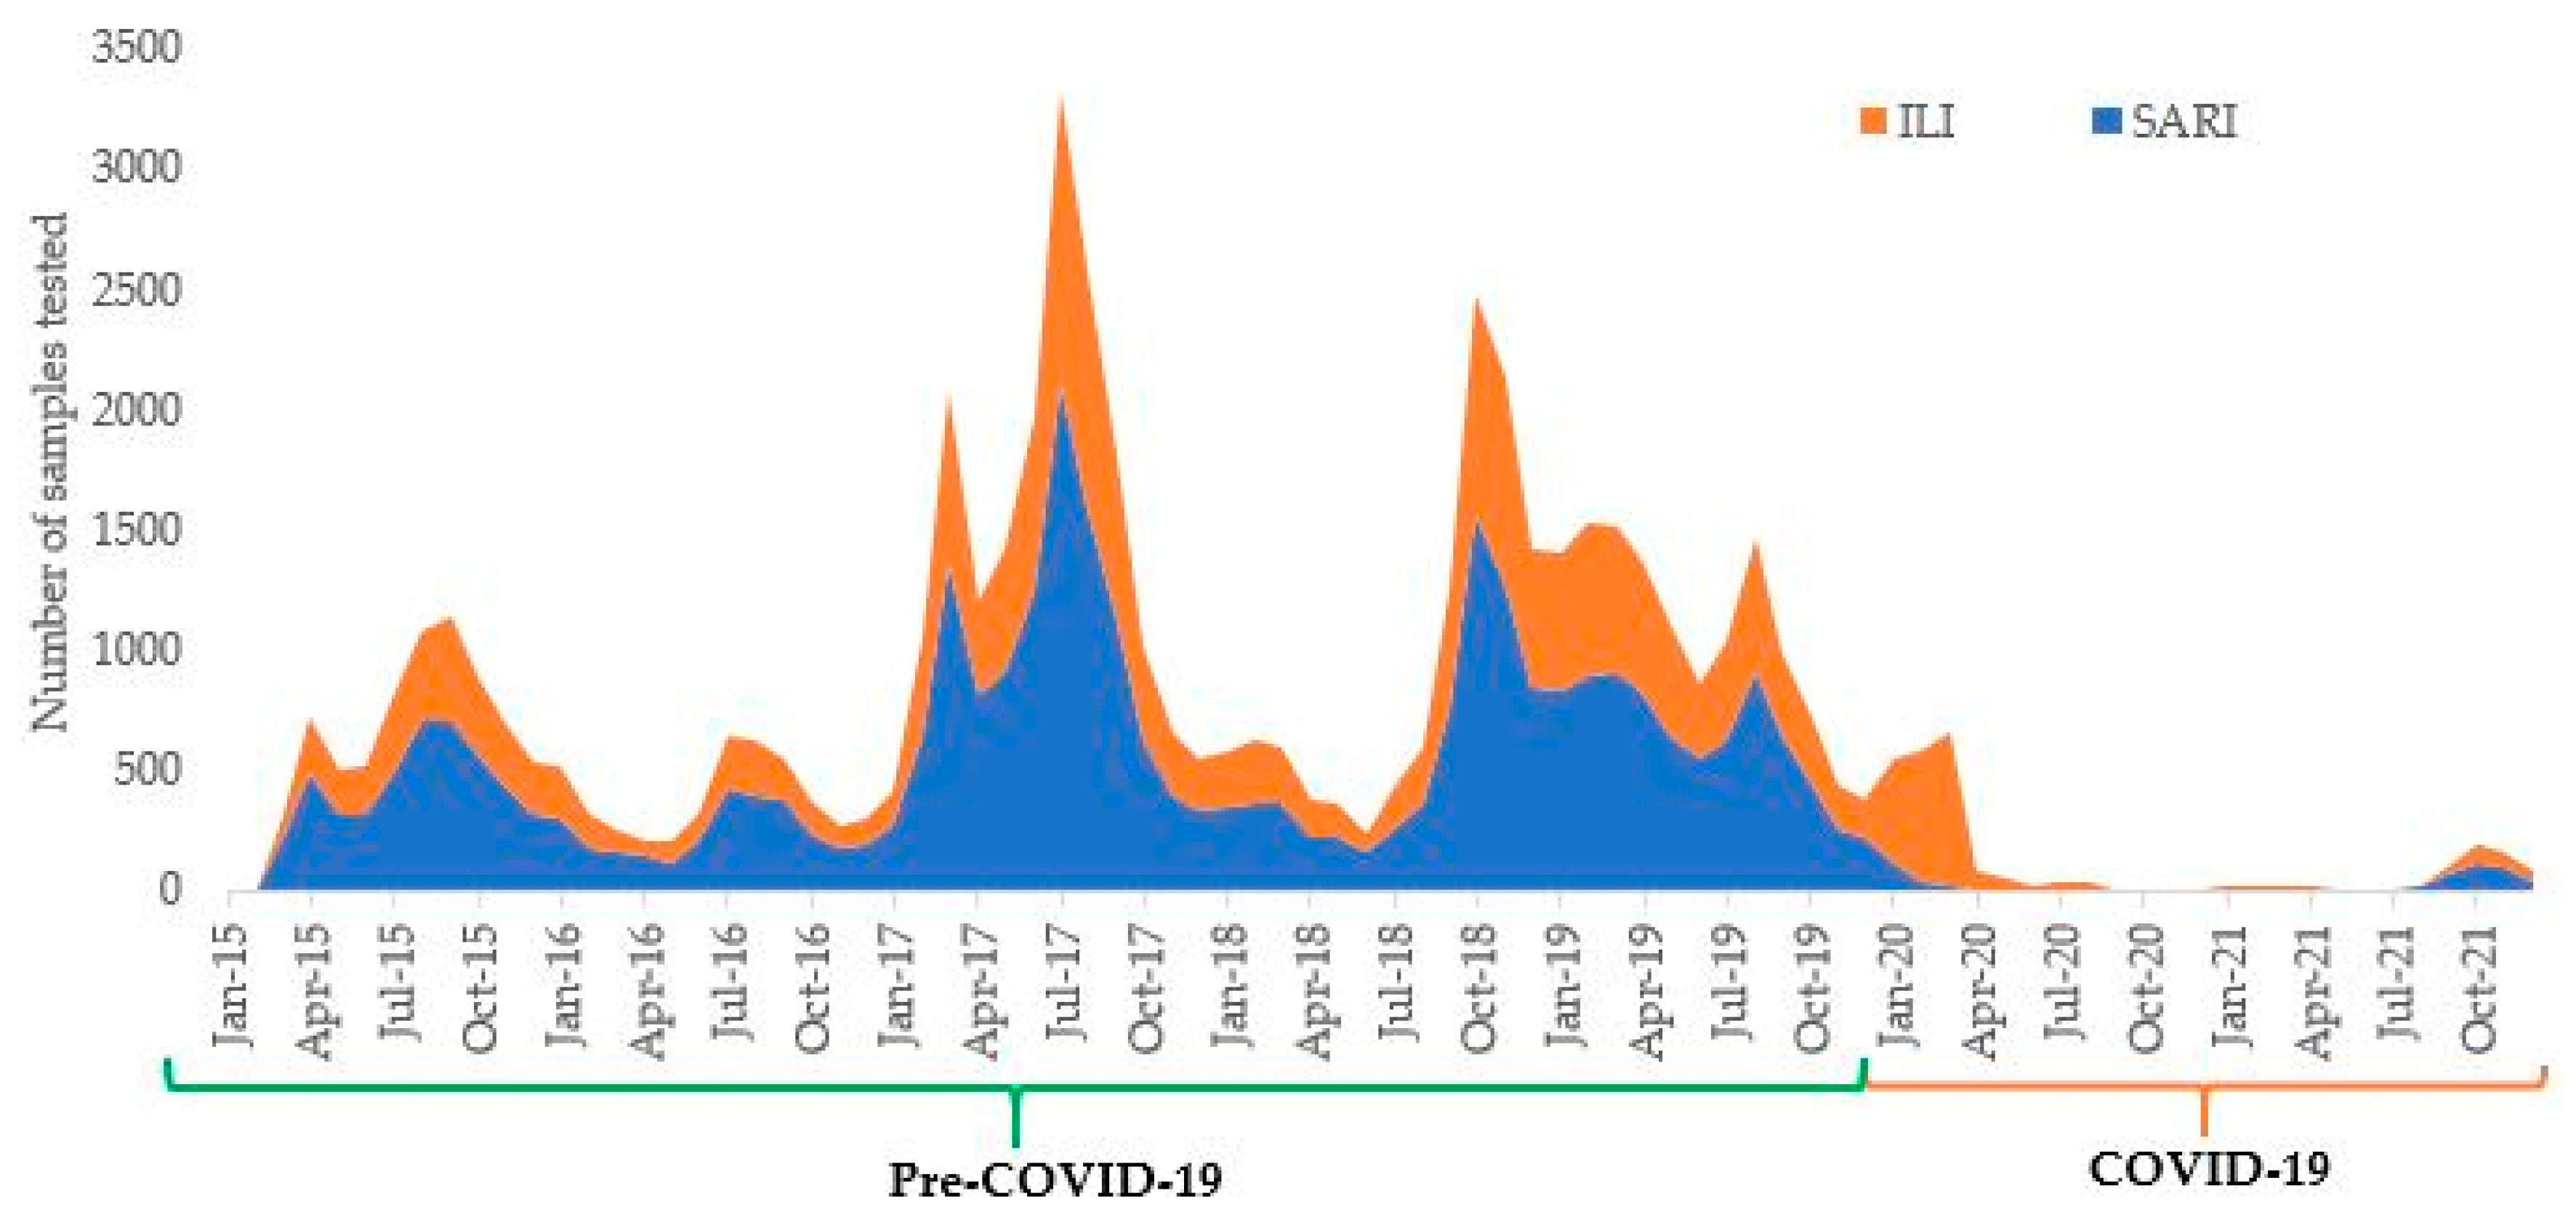
| Number of samples tested (a) | 54,262 | 2720 | |||
| Median (IQR) number of samples tested per month [all samples] | 653 | (395-1245) | 27 | (11–98) | <0.001 * |
| ILI | 253 | (155-493) | 21 | (7–54) | <0.001 * |
| SARI | 415 | (246-795) | 8 | (0–29) | <0.001 * |
| Influenza cases detected | |||||
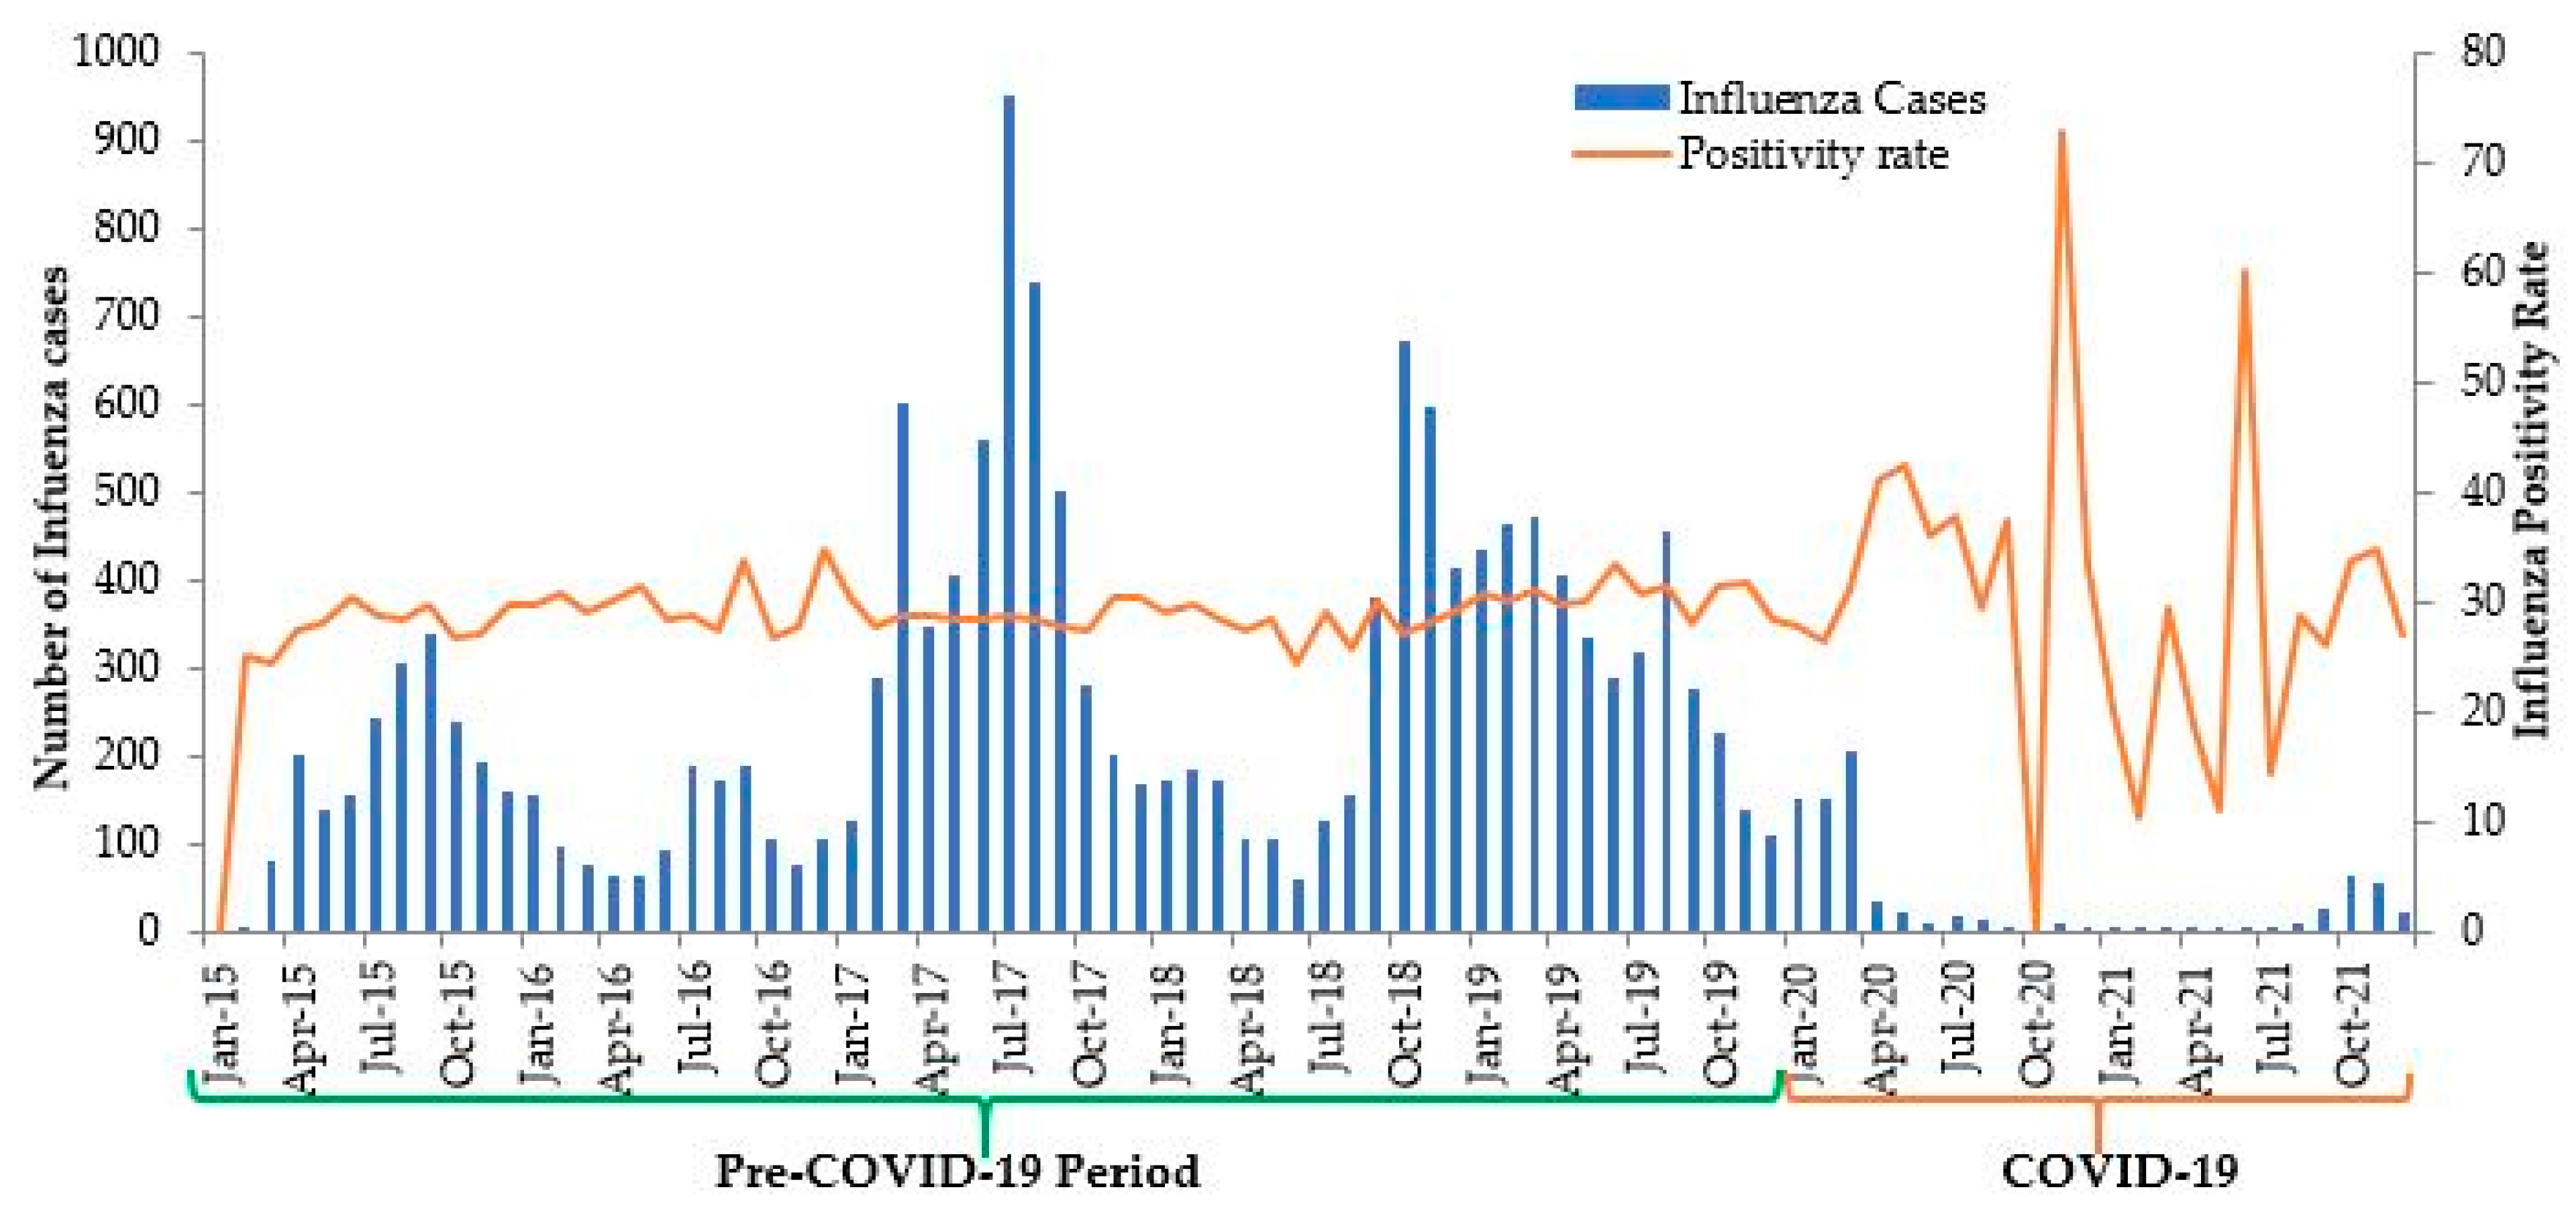
| Number of influenza cases detected (b) | 15,752 | 812 | |||
| Median (IQR) number of influenza cases detected per month | 190 | (113-372) | 29 | (27–30) | <0.001 * |
| Overall positivity rate (b*100/a) | 29.0% | 29.9% | 0.356 | ||
| Pattern of influenza | |||||
| Number (%) $ of A (H1N1) pdm09 | 9359 | (59.4) | 473 | (58.3) | 0.510 # |
| Number (%) $ of A/H3N2 | 3485 | (22.1) | 174 | (21.4) | 0.641 # |
| Number (%) $ of Influenza B | 2908 | (18.5) | 165 | (20.3) | 0.184 # |
| Characteristics | Pre-COVID-19 (2015–2019) | COVID-19 (2020–2021) | p Value $ | ||||||
|---|---|---|---|---|---|---|---|---|---|
| Tested | Positive | Tested | Positive | ||||||
| n | (%) * | n | (%) # | n | (%) * | n | (%) # | ||
| Total | 54,262 | (100) | 15752 | (29.0) | 2720 | (100) | 812 | (29.9) | 0.356 |
| Age in years | |||||||||
| <5 | 6925 | (12.8) | 1844 | (26.6) | 168 | (6.2) | 39 | (23.2) | 0.322 |
| 5-14 | 3989 | (7.4) | 1374 | (34.4) | 125 | (4.6) | 43 | (34.4) | 0.992 |
| 15-24 | 6323 | (11.7) | 1760 | (27.8) | 508 | (18.7) | 159 | (31.3) | 0.095 |
| 25-34 | 8191 | (15.1) | 1937 | (23.7) | 470 | (17.3) | 101 | (21.5) | 0.283 |
| 35-44 | 6040 | (11.1) | 1996 | (33.1) | 269 | (9.9) | 86 | (32.0) | 0.713 |
| 45-54 | 6602 | (12.2) | 1814 | (27.5) | 260 | (9.6) | 63 | (24.2) | 0.249 |
| 55-64 | 7023 | (12.9) | 1824 | (26.0) | 361 | (13.3) | 110 | (30.5) | 0.058 |
| >65 | 9169 | (16.9) | 3203 | (34.9) | 559 | (20.6) | 211 | (37.8) | 0.176 |
| Gender | |||||||||
| Male | 25,784 | (47.5) | 7175 | (27.8) | 1303 | (47.9) | 375 | (28.8) | 0.454 |
| Female | 28,478 | (52.5) | 8577 | (30.1) | 1417 | (52.1) | 437 | (30.8) | 0.563 |
| State | |||||||||
| Karnataka | 31,905 | (58.8) | 9187 | (28.8) | 1647 | (60.6) | 486 | (29.5) | 0.533 |
| Goa | 3472 | (6.4) | 974 | (28.1) | 124 | (4.6) | 30 | (24.2) | 0.347 |
| Kerala | 17,332 | (31.9) | 5111 | (29.5) | 877 | (32.2) | 269 | (30.7) | 0.453 |
| Others | 1553 | (2.9) | 480 | (30.9) | 72 | (2.6) | 27 | (37.5) | 0.238 |
| Clinical Case | |||||||||
| ILI | 20,545 | (37.9) | 5837 | (28.4) | 2145 | (78.9) | 639 | (29.8) | 0.178 |
| SARI | 33,717 | (62.1) | 9915 | (29.4) | 575 | (21.1) | 173 | (30.1) | 0.723 |
| Type of Sample | |||||||||
| Diagnosis | 43,093 | (79.4) | 12340 | (28.6) | 2220 | (81.6) | 669 | (30.1) | 0.128 |
| Surveillance | 11,169 | (20.6) | 3412 | (30.6) | 500 | (18.4) | 143 | (28.6) | 0.354 |
| Particulars | Pre-COVID-19 Trend (Segment-1) | LVC Versus without COVID-19 | COVID-19 Trend (Segment-2) | |||
|---|---|---|---|---|---|---|
| Unadjusted | ||||||
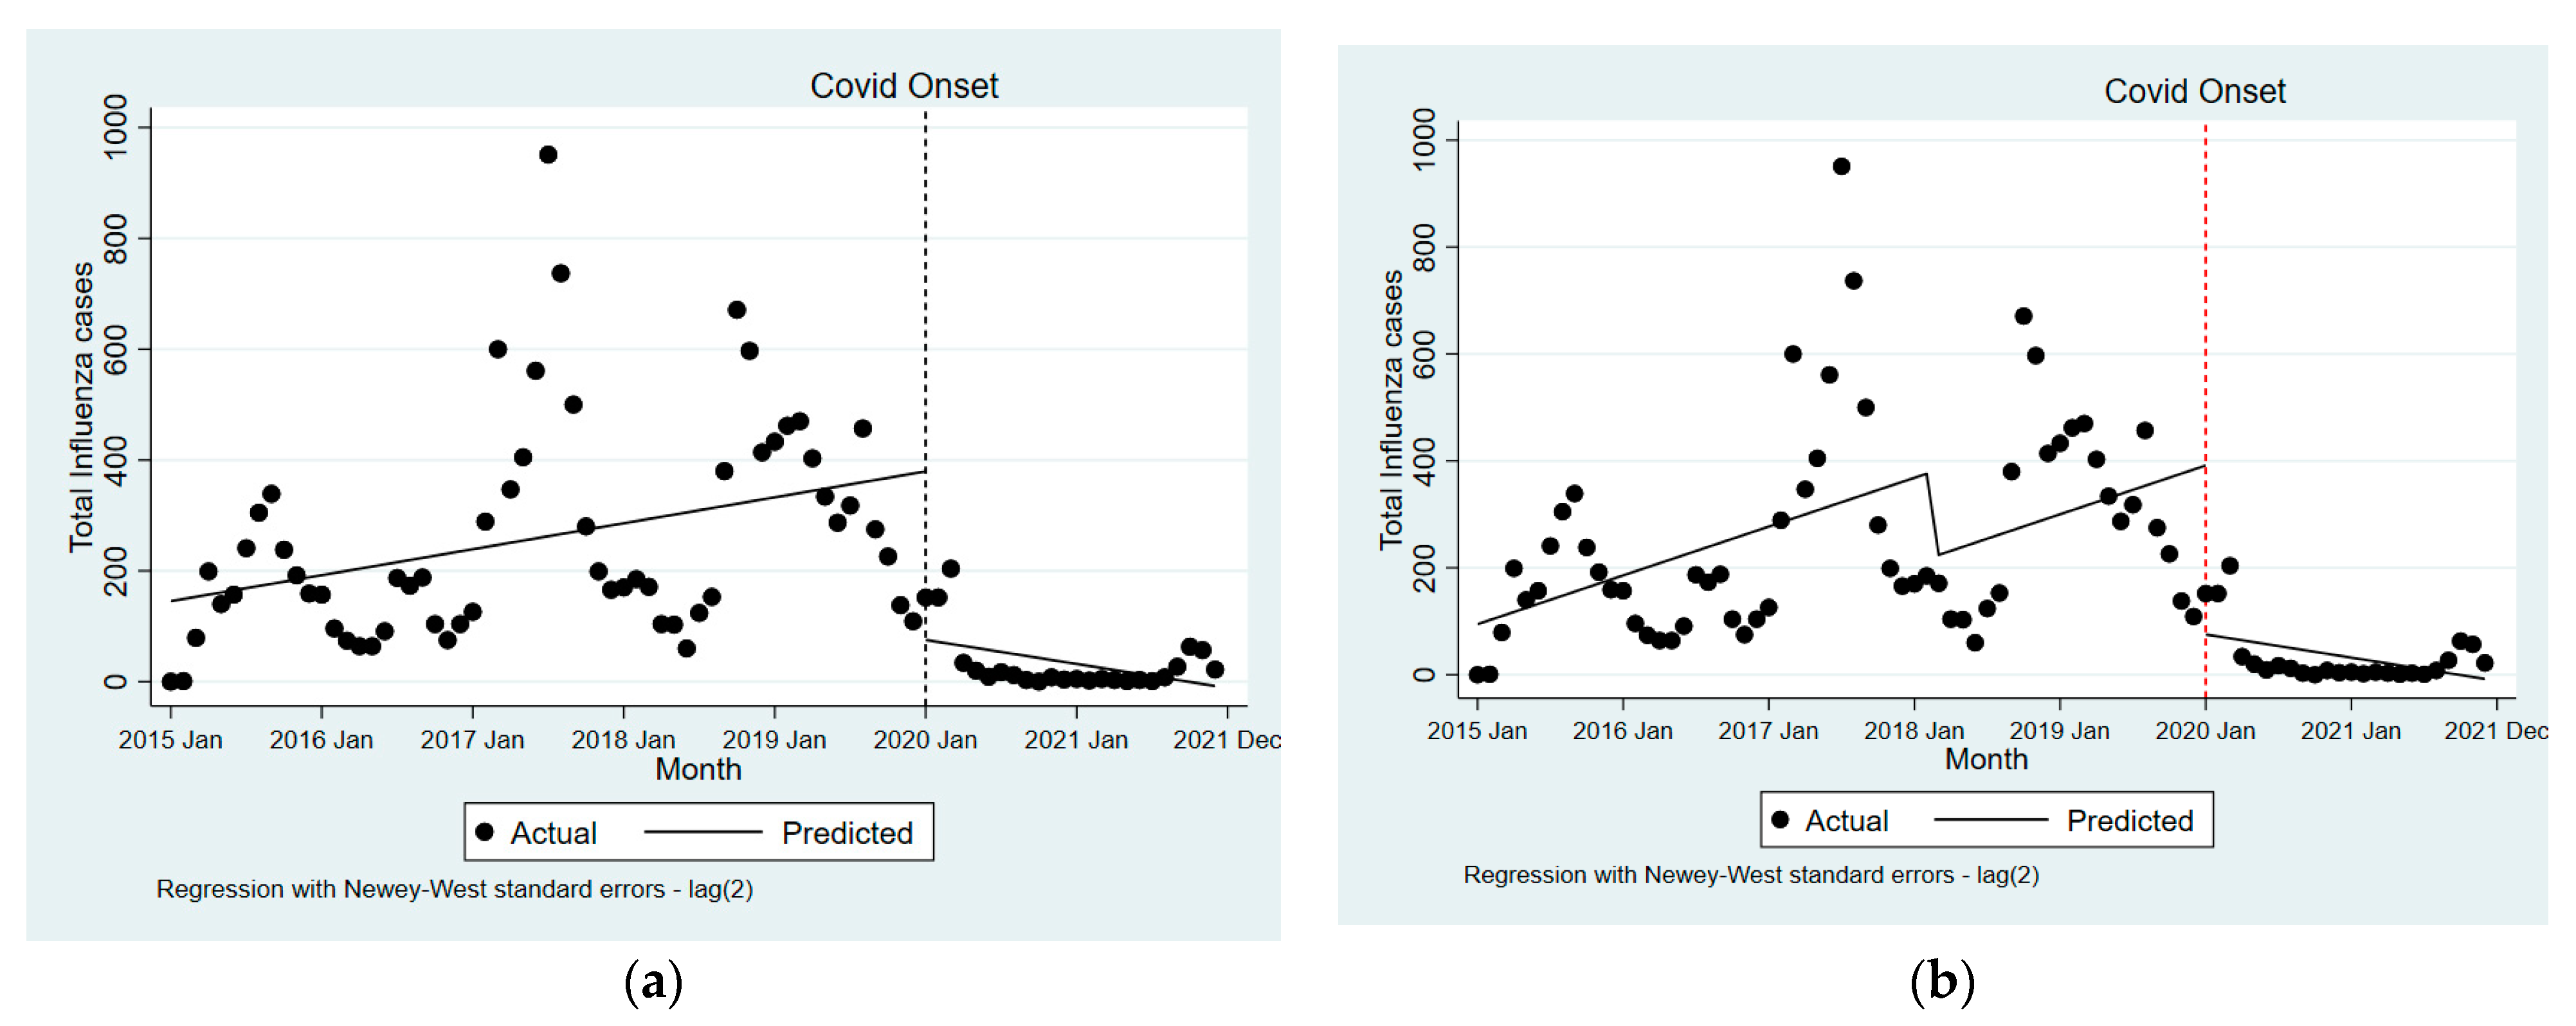
| Total samples tested | 12.7 | (2.3 to 23.1) | −1025.6 | (−1588.5 to −462.6) | −25.3 | (−45.3 to −5.4) |
| ILI samples tested | 5.3 | (1.2 to 9.4) | −248.9 | (−561.2 to 63.4) | −19.5 | (−34.8 to −4.2) |
| SARI samples tested | 7.4 | (1.0 to 13.7) | −776.7 | (−1068.3 to −485.0) | −5.8 | (−12.6 to 1.0) |
| Influenza cases detected | 3.9 | (0.9 to 6.9) | −304.2 | (−463.7 to −144.6) | −7.5 | (−13.2 to −1.8) |
| Adjusted * | ||||||
| Total samples tested | 25.5 | (−0.9 to 51.9) | −1067.1 | (−1657.2 to −477.0) | −38.2 | (−69.5 to −6.9) |
| ILI samples tested | 9.5 | (−0.2 to 19.2) | −262.5 | (−582.0 to 57.0) | −23.7 | (−41.4 to −6.0) |
| SARI samples tested | 16.0 | (−0.7 to 32.8) | −804.6 | (−1116.8 to −492.4) | −14.5 | (−31.3 to 2.4) |
| Influenza cases detected | 7.6 | (0.1 to 15.1) | −316.1 | (−483.3 to −149.0) | −11.2 | (−20.1 to −2.3) |
Publisher’s Note: MDPI stays neutral with regard to jurisdictional claims in published maps and institutional affiliations. |
© 2022 by the authors. Licensee MDPI, Basel, Switzerland. This article is an open access article distributed under the terms and conditions of the Creative Commons Attribution (CC BY) license (https://creativecommons.org/licenses/by/4.0/).
Share and Cite
Jayaram, A.; Jagadesh, A.; Kumar, A.M.V.; Davtyan, H.; Thekkur, P.; Vilas, V.J.D.R.; Mandal, S.K.; Sudandiradas, R.; Babu, N.; Varamballi, P.; et al. Trends in Influenza Infections in Three States of India from 2015–2021: Has There Been a Change during COVID-19 Pandemic? Trop. Med. Infect. Dis. 2022, 7, 110. https://doi.org/10.3390/tropicalmed7060110
Jayaram A, Jagadesh A, Kumar AMV, Davtyan H, Thekkur P, Vilas VJDR, Mandal SK, Sudandiradas R, Babu N, Varamballi P, et al. Trends in Influenza Infections in Three States of India from 2015–2021: Has There Been a Change during COVID-19 Pandemic? Tropical Medicine and Infectious Disease. 2022; 7(6):110. https://doi.org/10.3390/tropicalmed7060110
Chicago/Turabian StyleJayaram, Anup, Anitha Jagadesh, Ajay M. V. Kumar, Hayk Davtyan, Pruthu Thekkur, Victor J. Del Rio Vilas, Shrawan Kumar Mandal, Robin Sudandiradas, Naren Babu, Prasad Varamballi, and et al. 2022. "Trends in Influenza Infections in Three States of India from 2015–2021: Has There Been a Change during COVID-19 Pandemic?" Tropical Medicine and Infectious Disease 7, no. 6: 110. https://doi.org/10.3390/tropicalmed7060110
APA StyleJayaram, A., Jagadesh, A., Kumar, A. M. V., Davtyan, H., Thekkur, P., Vilas, V. J. D. R., Mandal, S. K., Sudandiradas, R., Babu, N., Varamballi, P., Shetty, U., & Mukhopadhyay, C. (2022). Trends in Influenza Infections in Three States of India from 2015–2021: Has There Been a Change during COVID-19 Pandemic? Tropical Medicine and Infectious Disease, 7(6), 110. https://doi.org/10.3390/tropicalmed7060110


