
Prevalence of Malaria and Chikungunya Co-Infection in Febrile Patients: A Systematic Review and Meta-Analysis


Abstract
1. Introduction
2. Methods
2.1. Protocol and Registration
2.2. Information Sources and Search Strategy
2.3. Eligibility Criteria
2.4. Study Selection
3. Data Extraction
3.1. Risk of Bias
3.2. Outcomes
3.3. Data Synthesis
4. Results
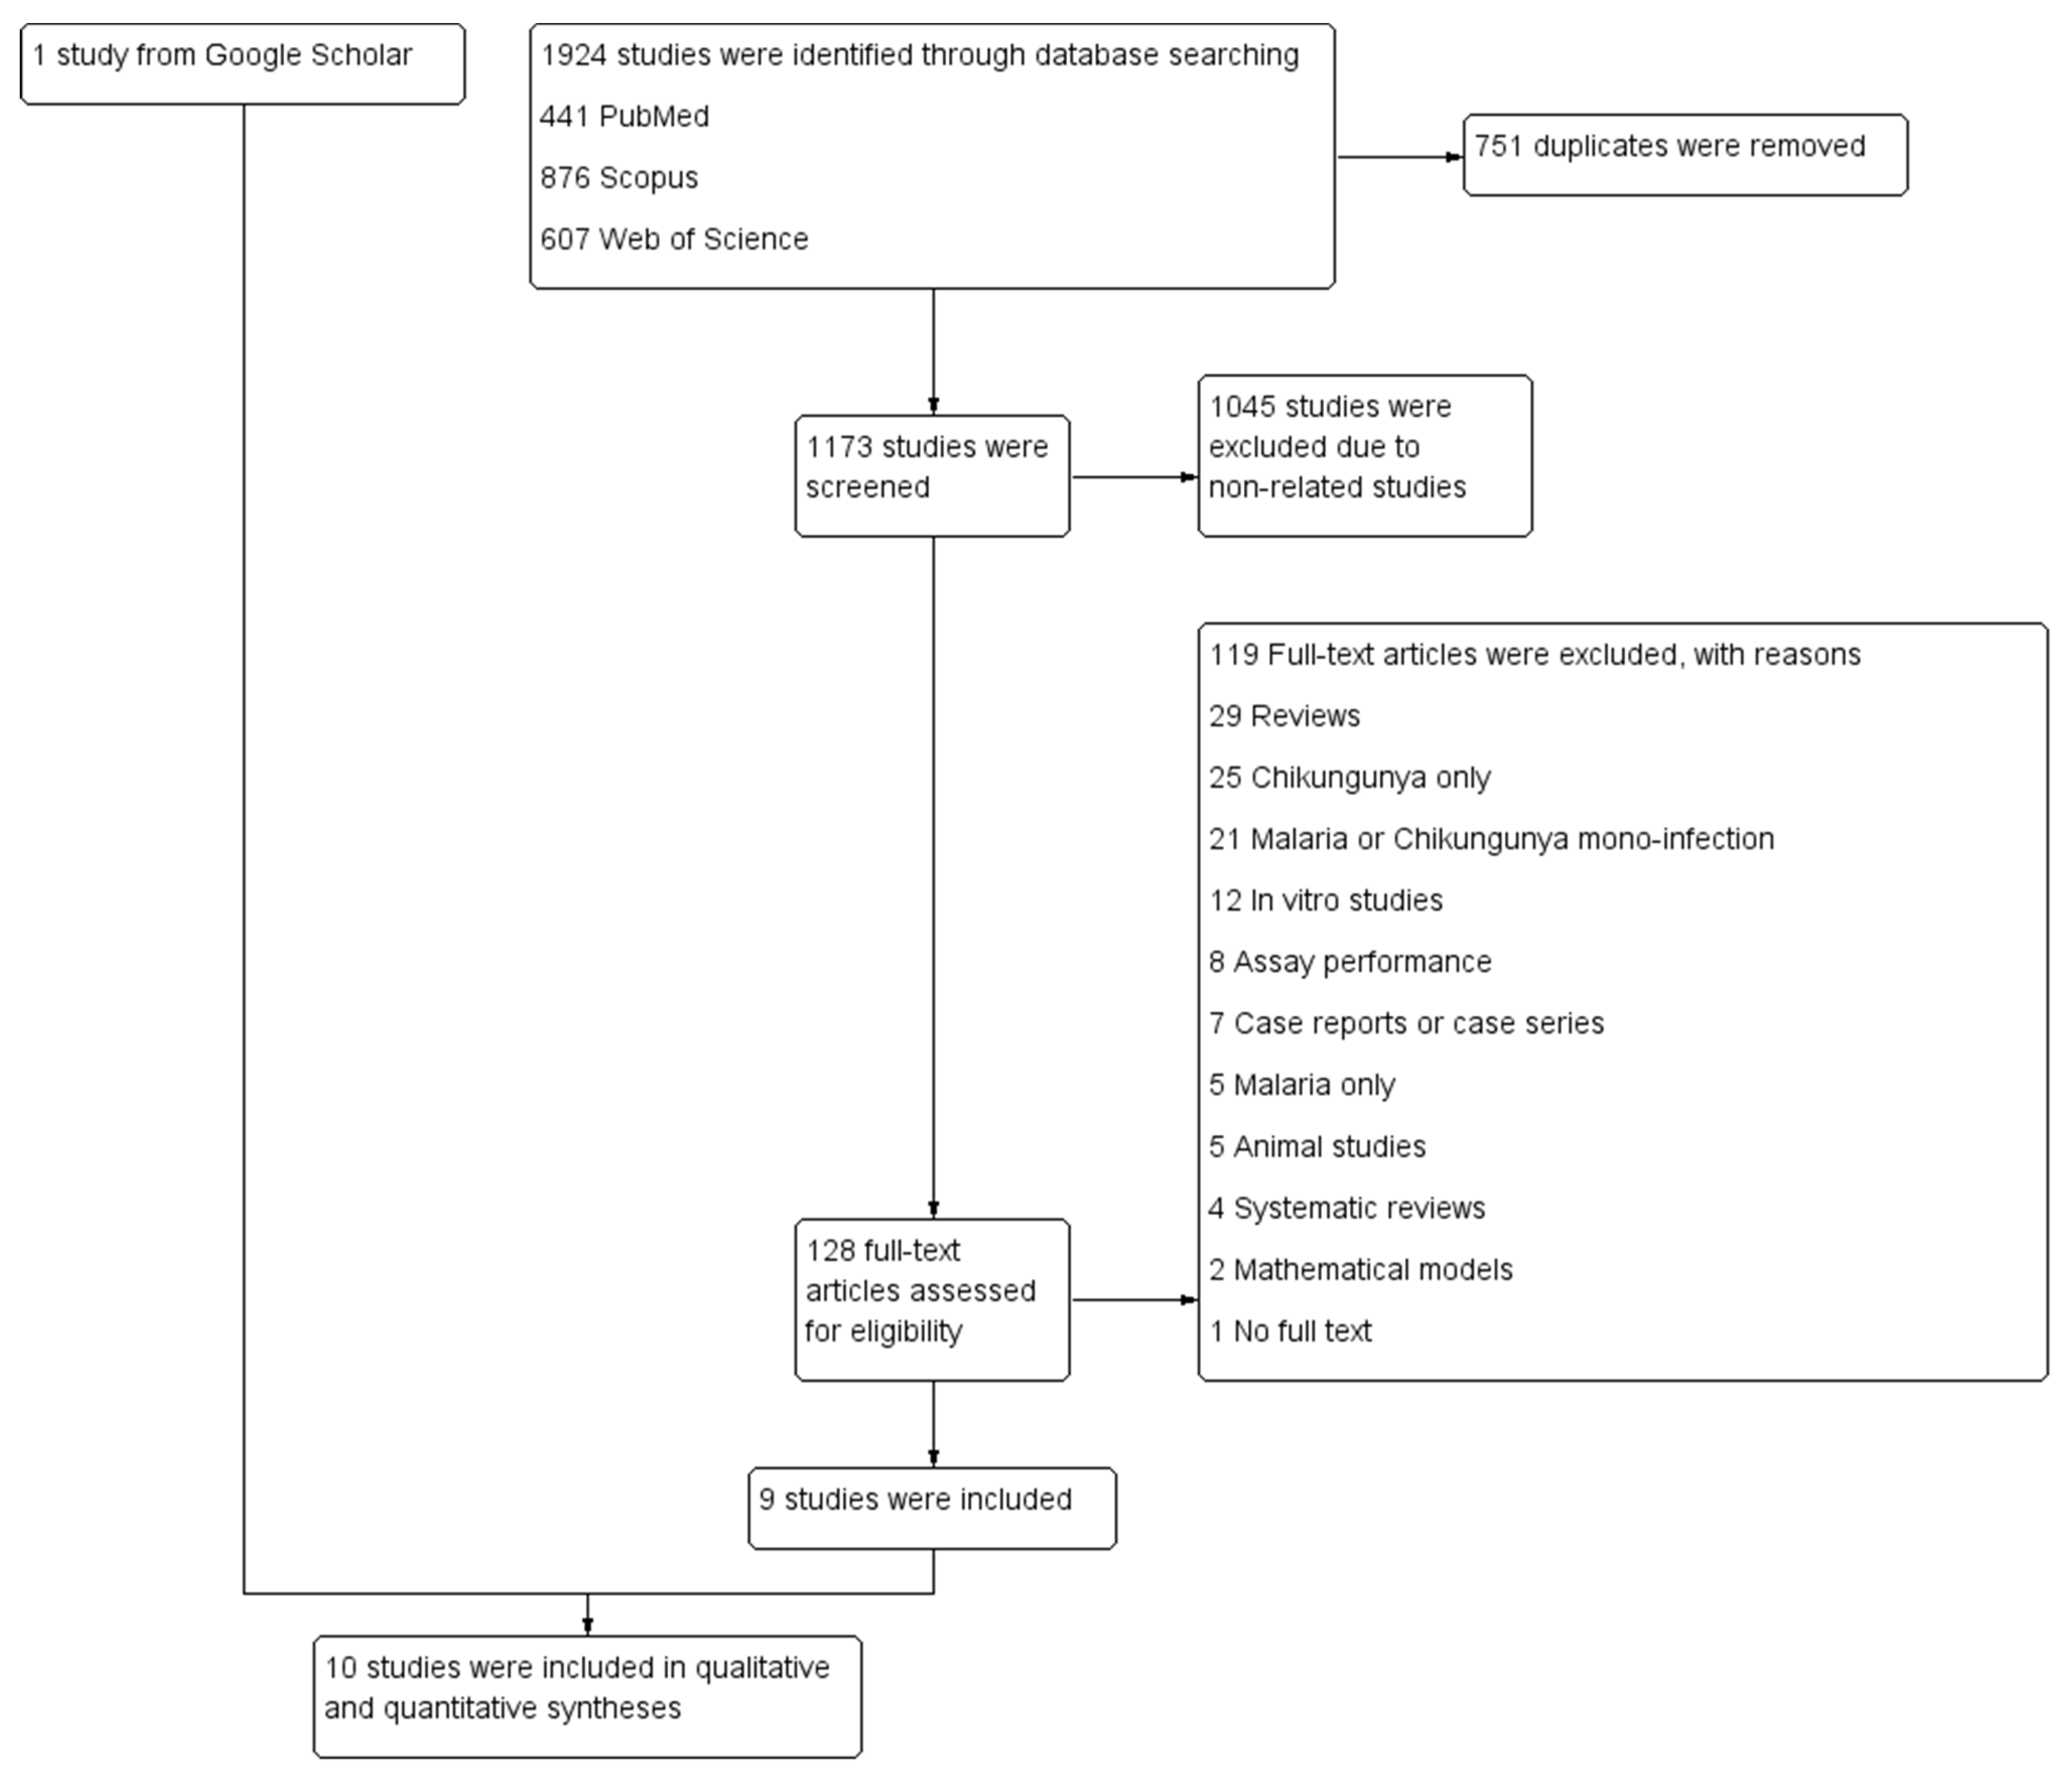
4.1. Search Results
4.2. Characteristics of the Included Studies
4.3. Risk of Bias
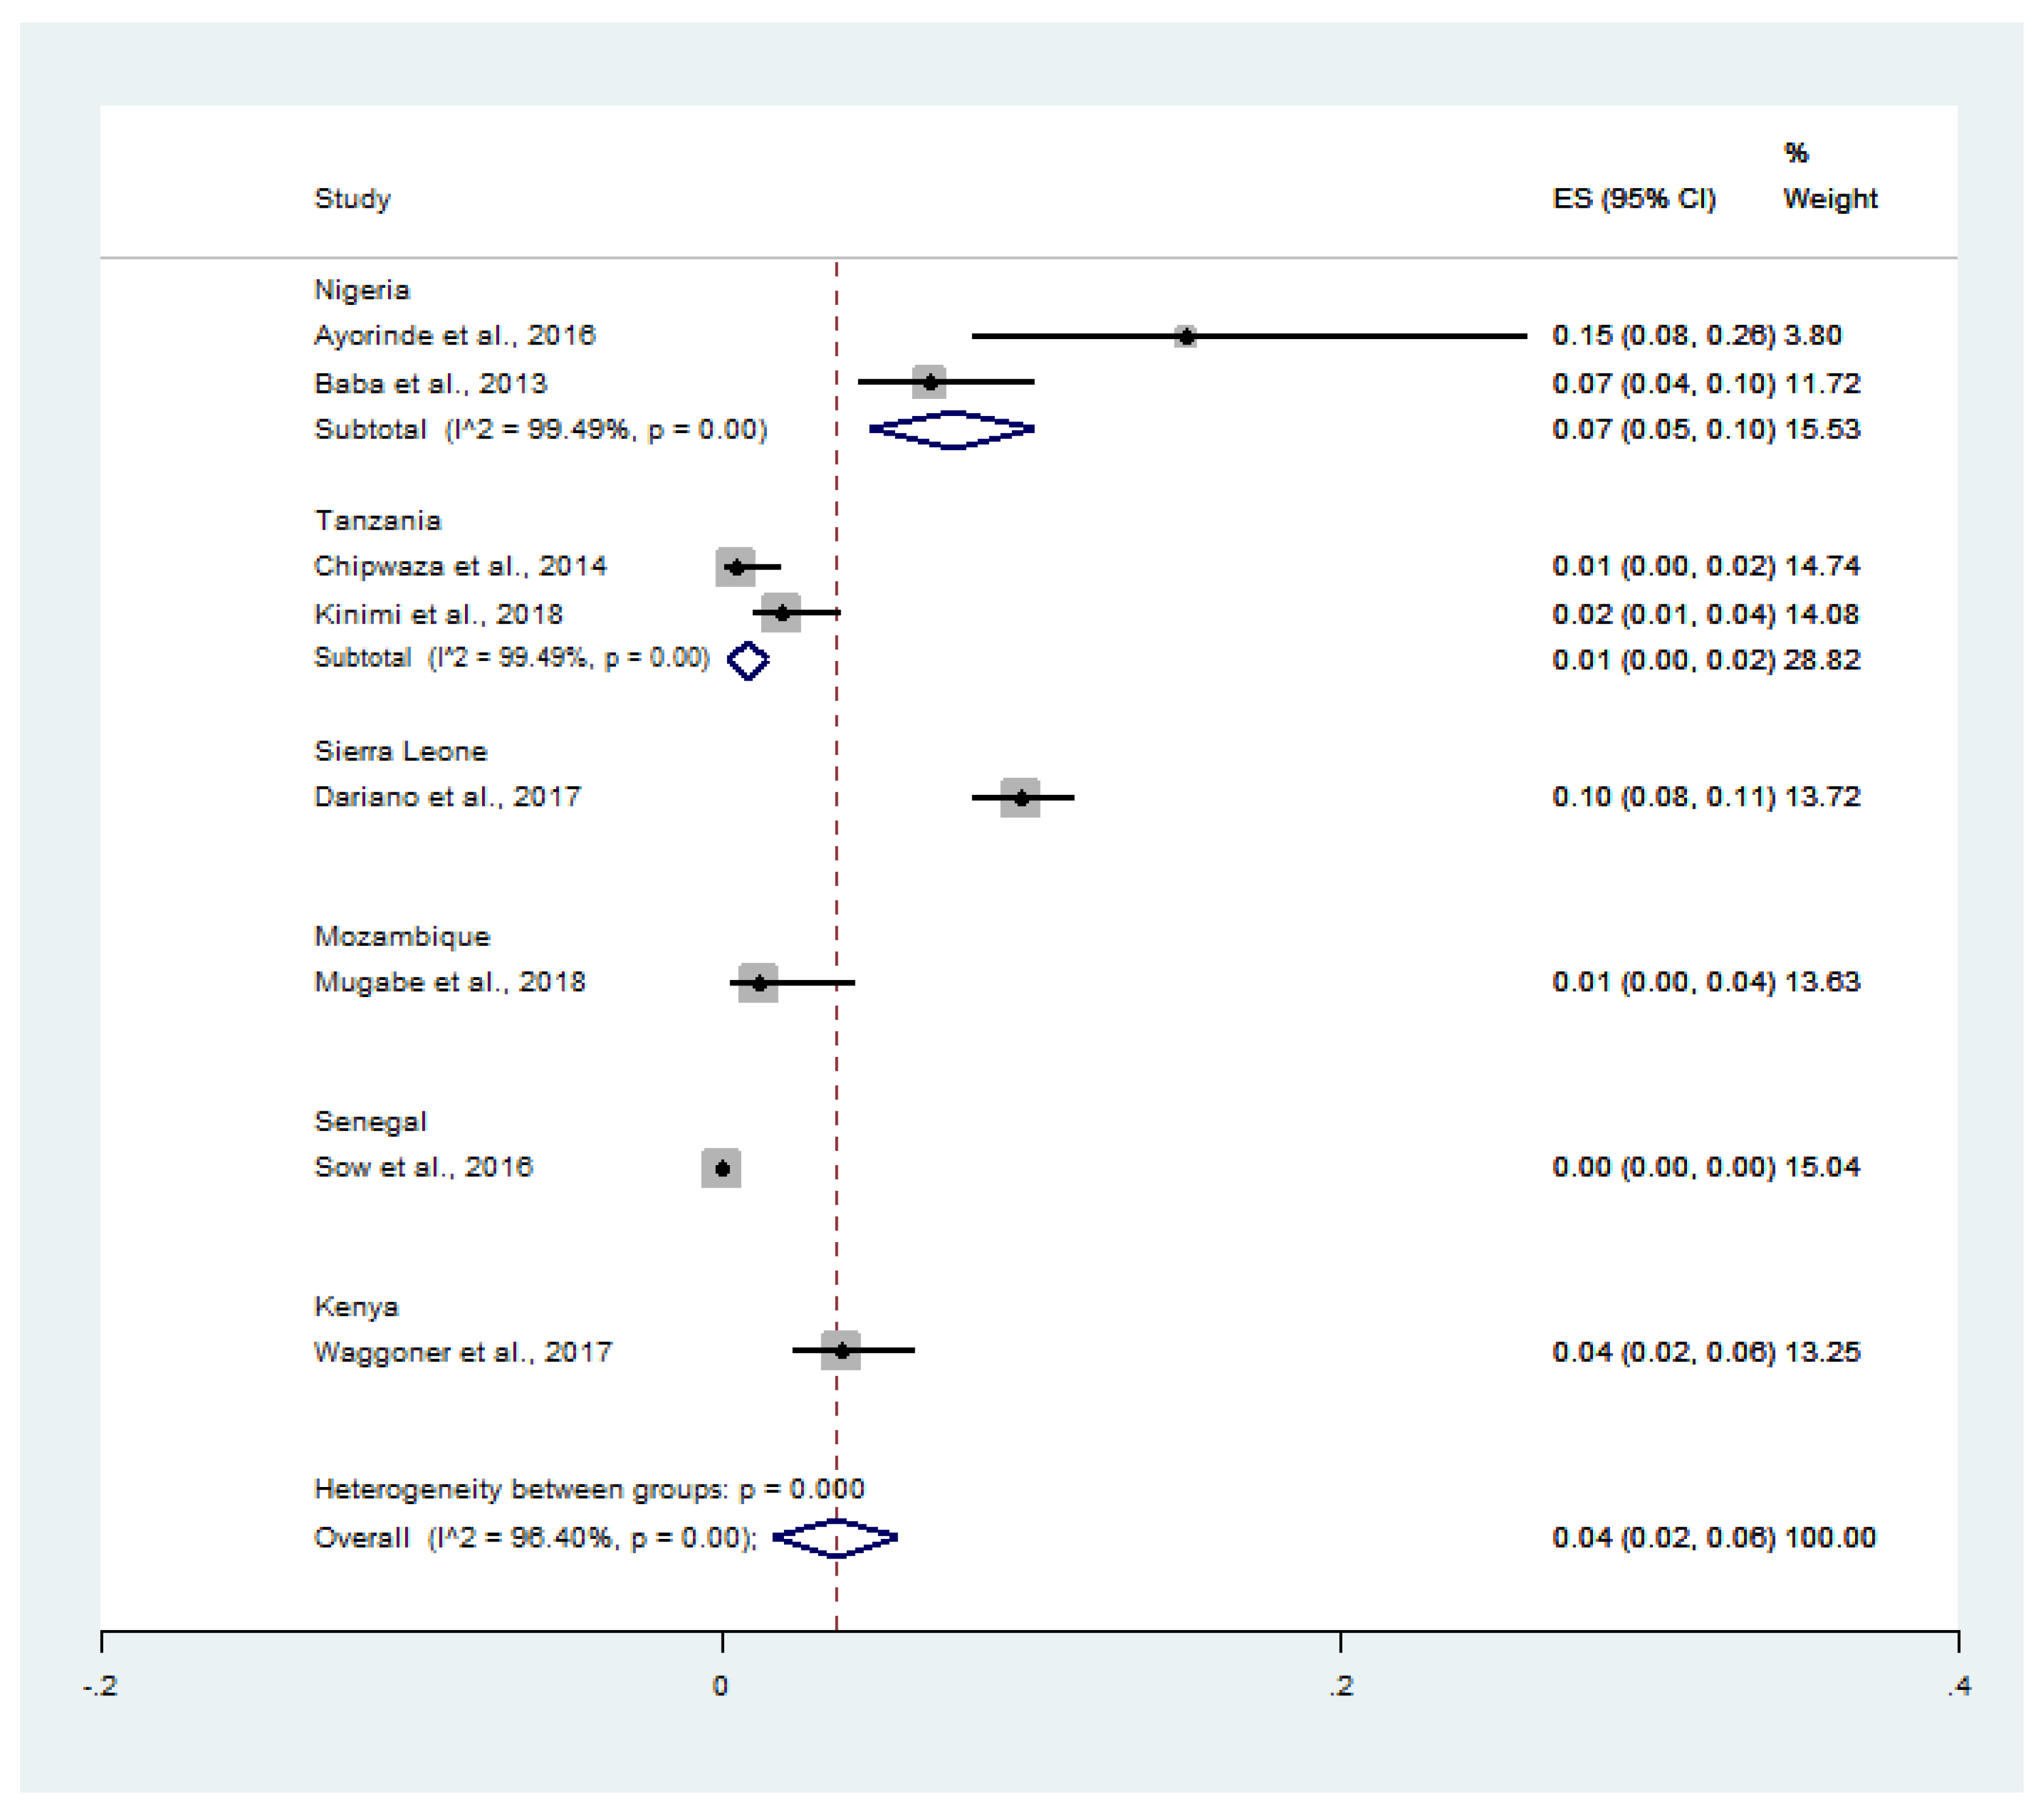
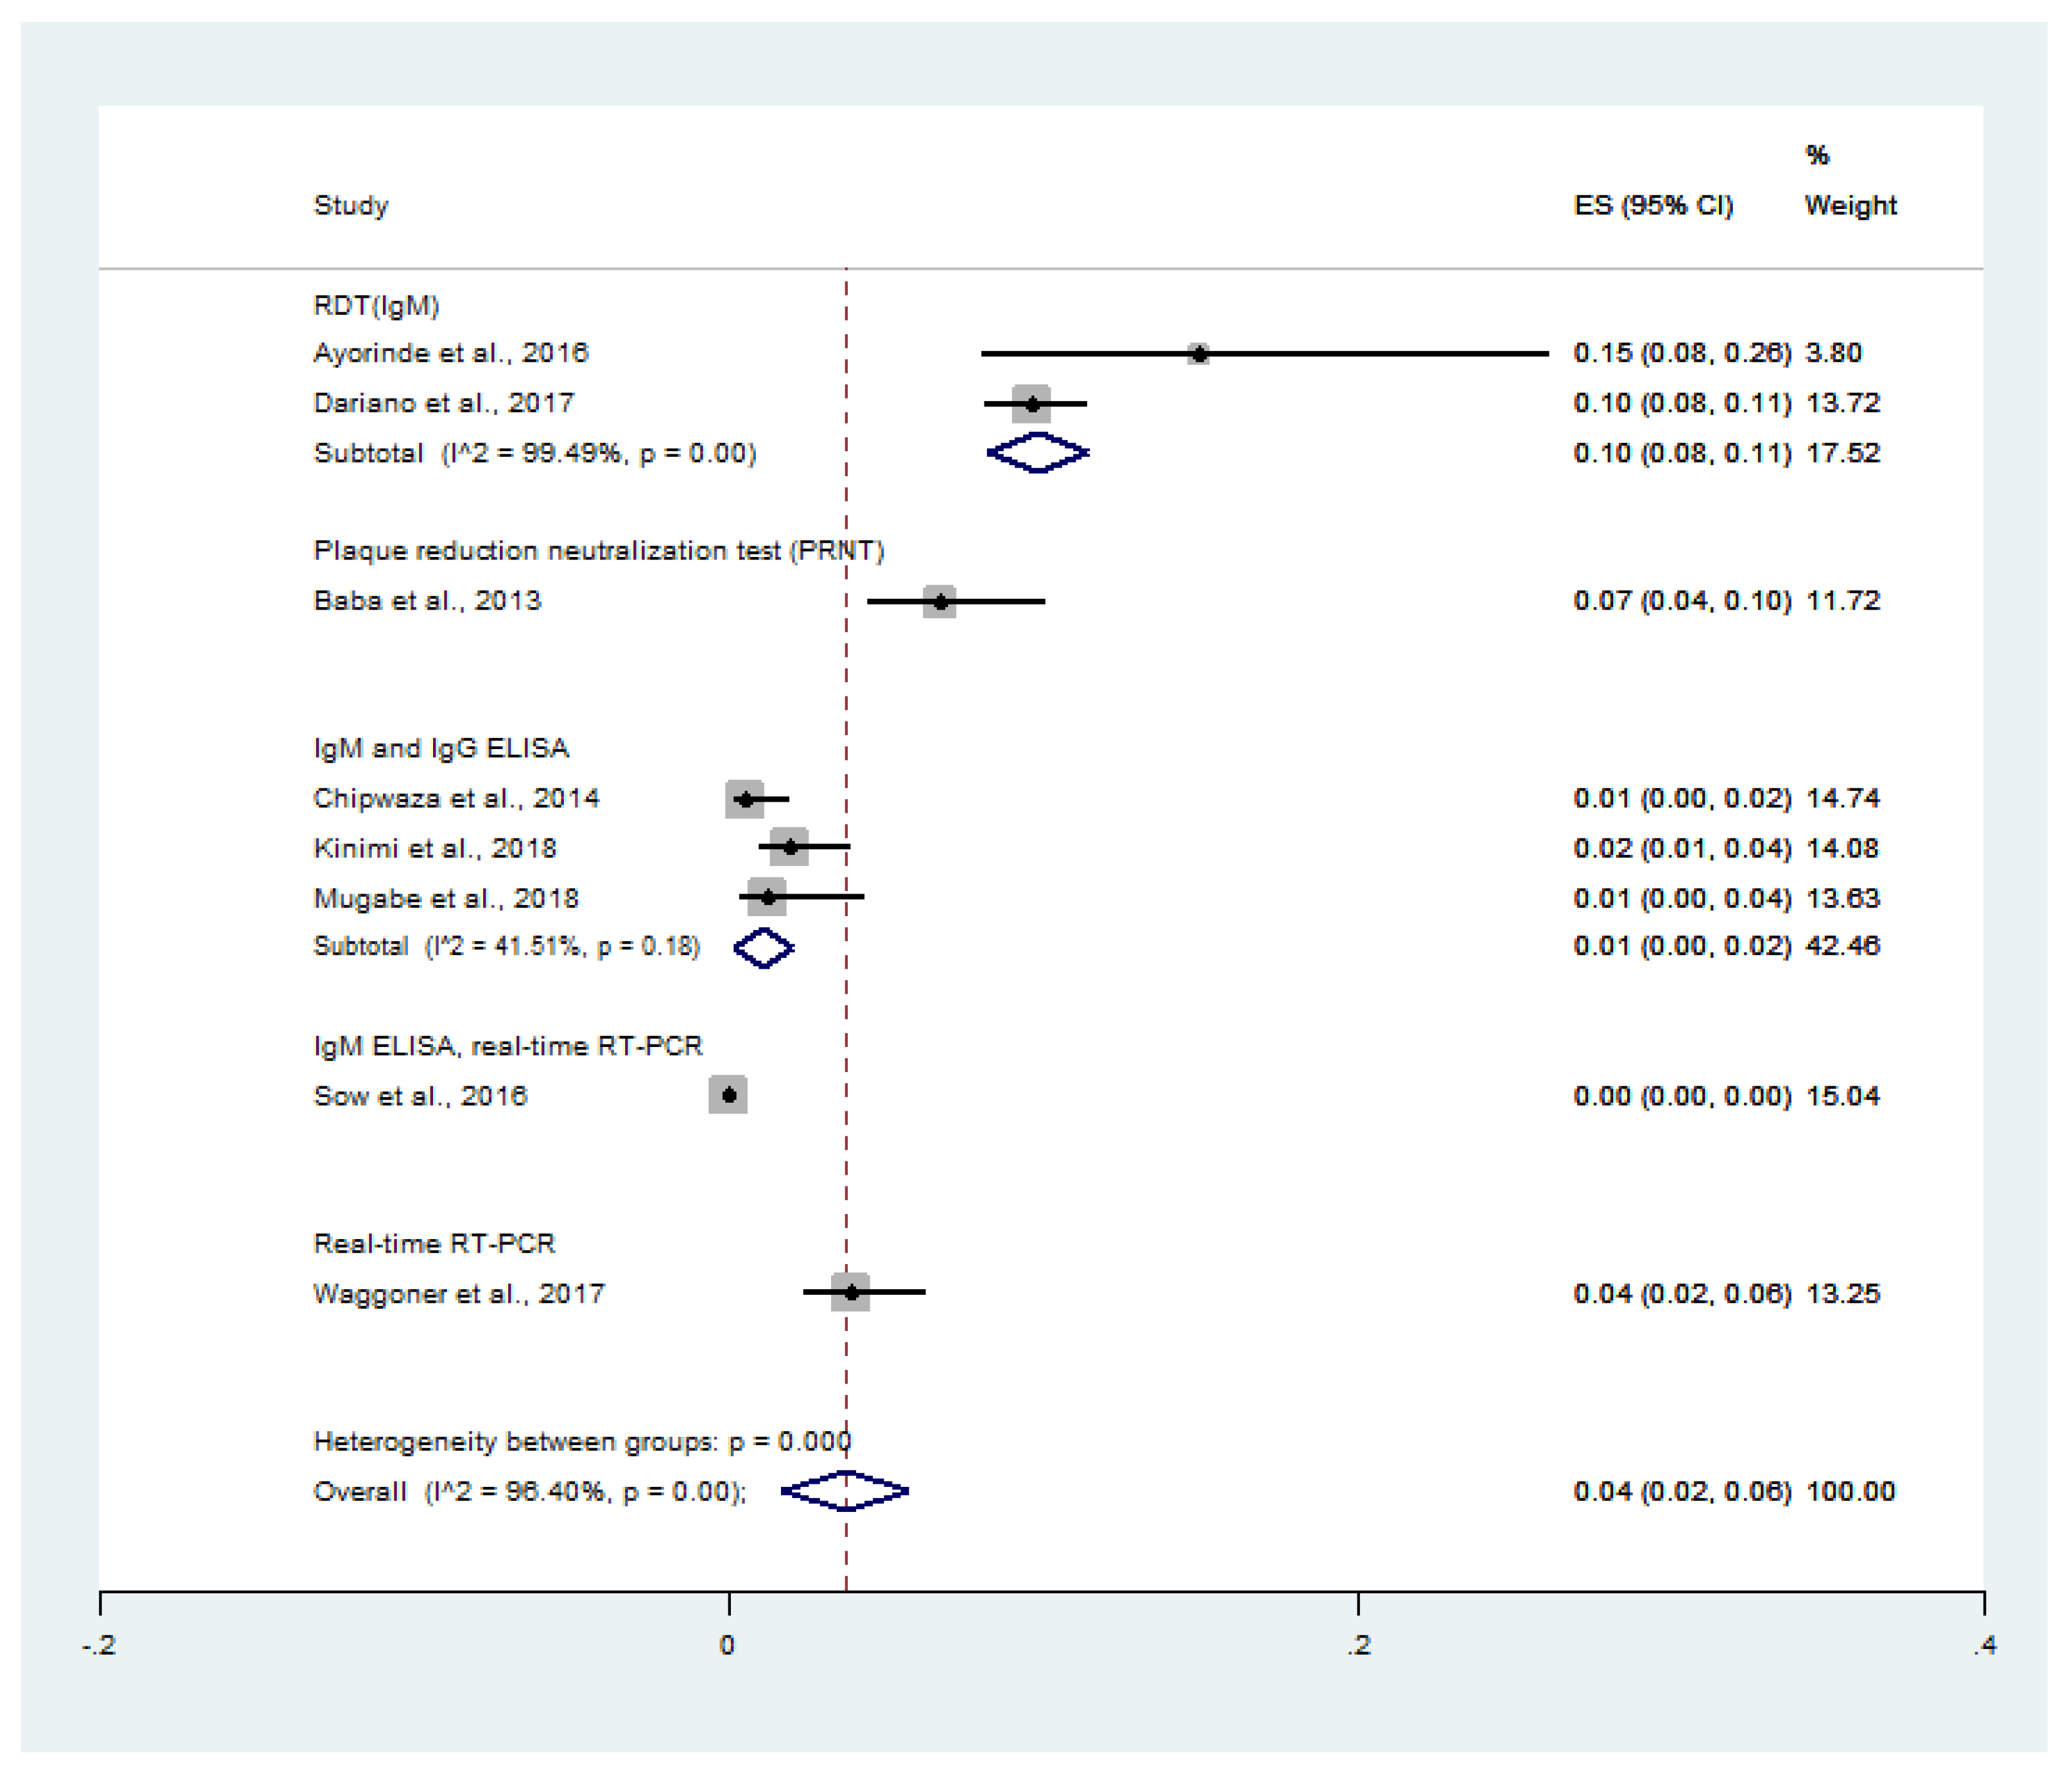
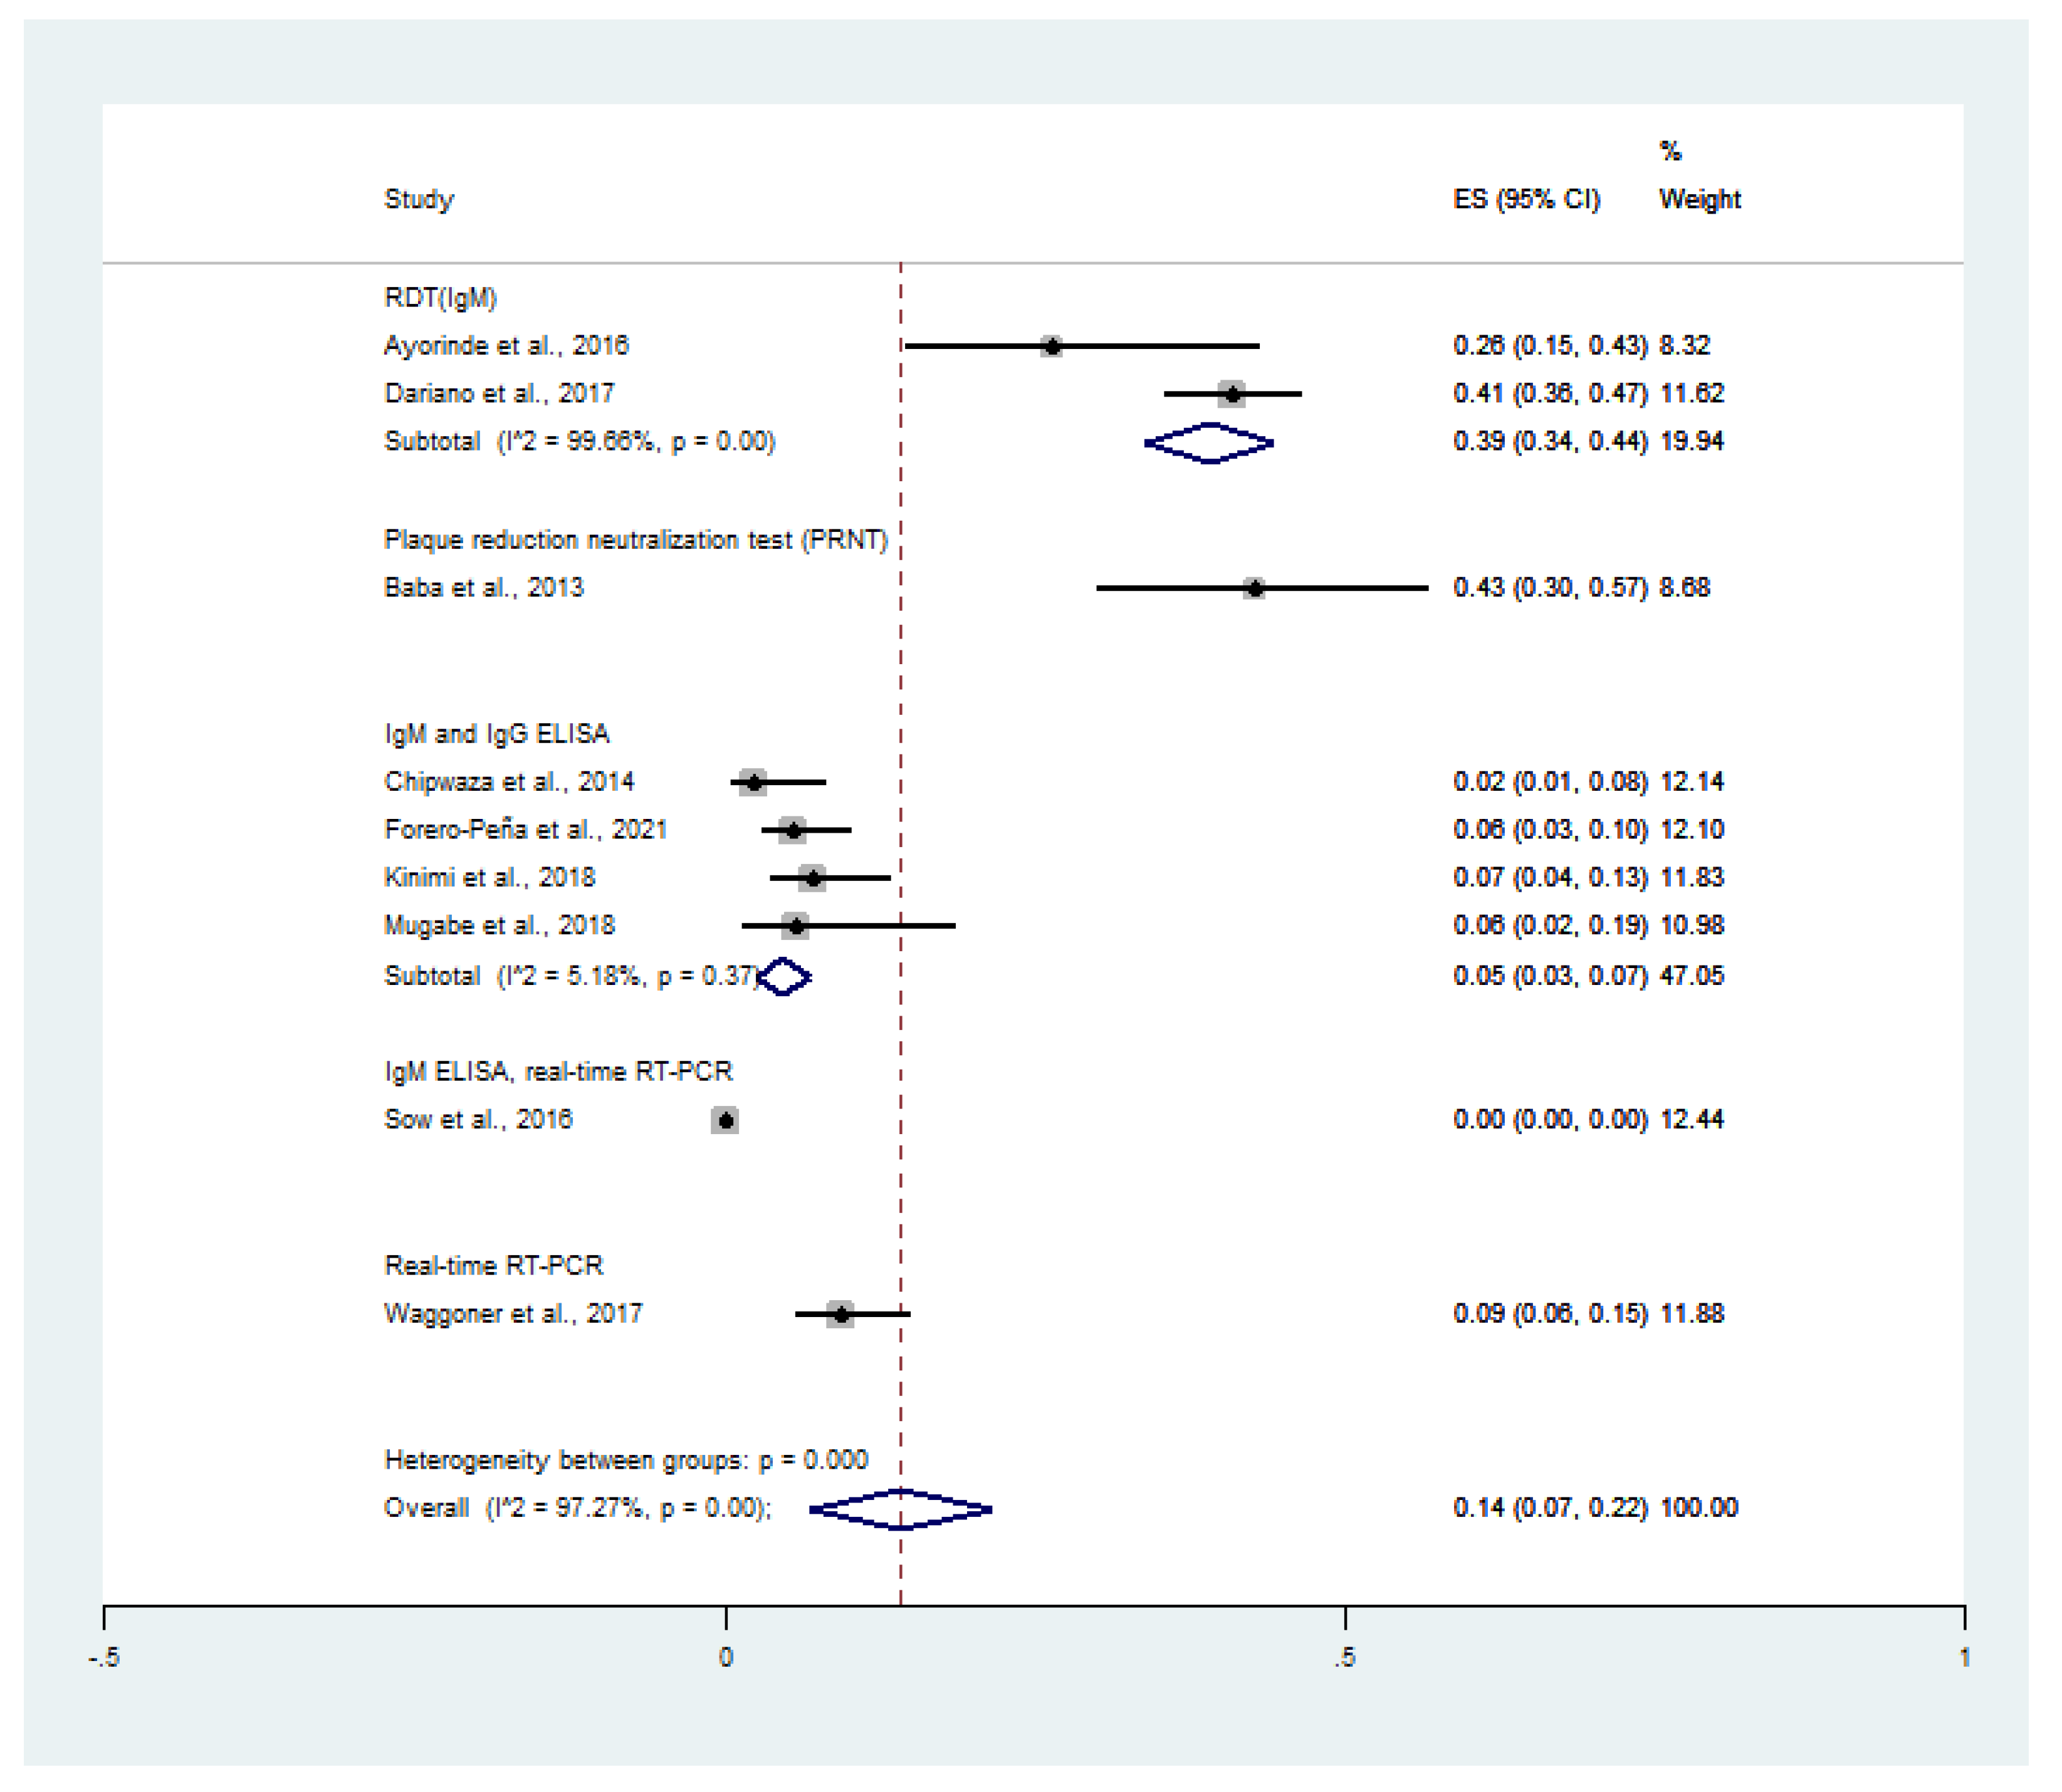
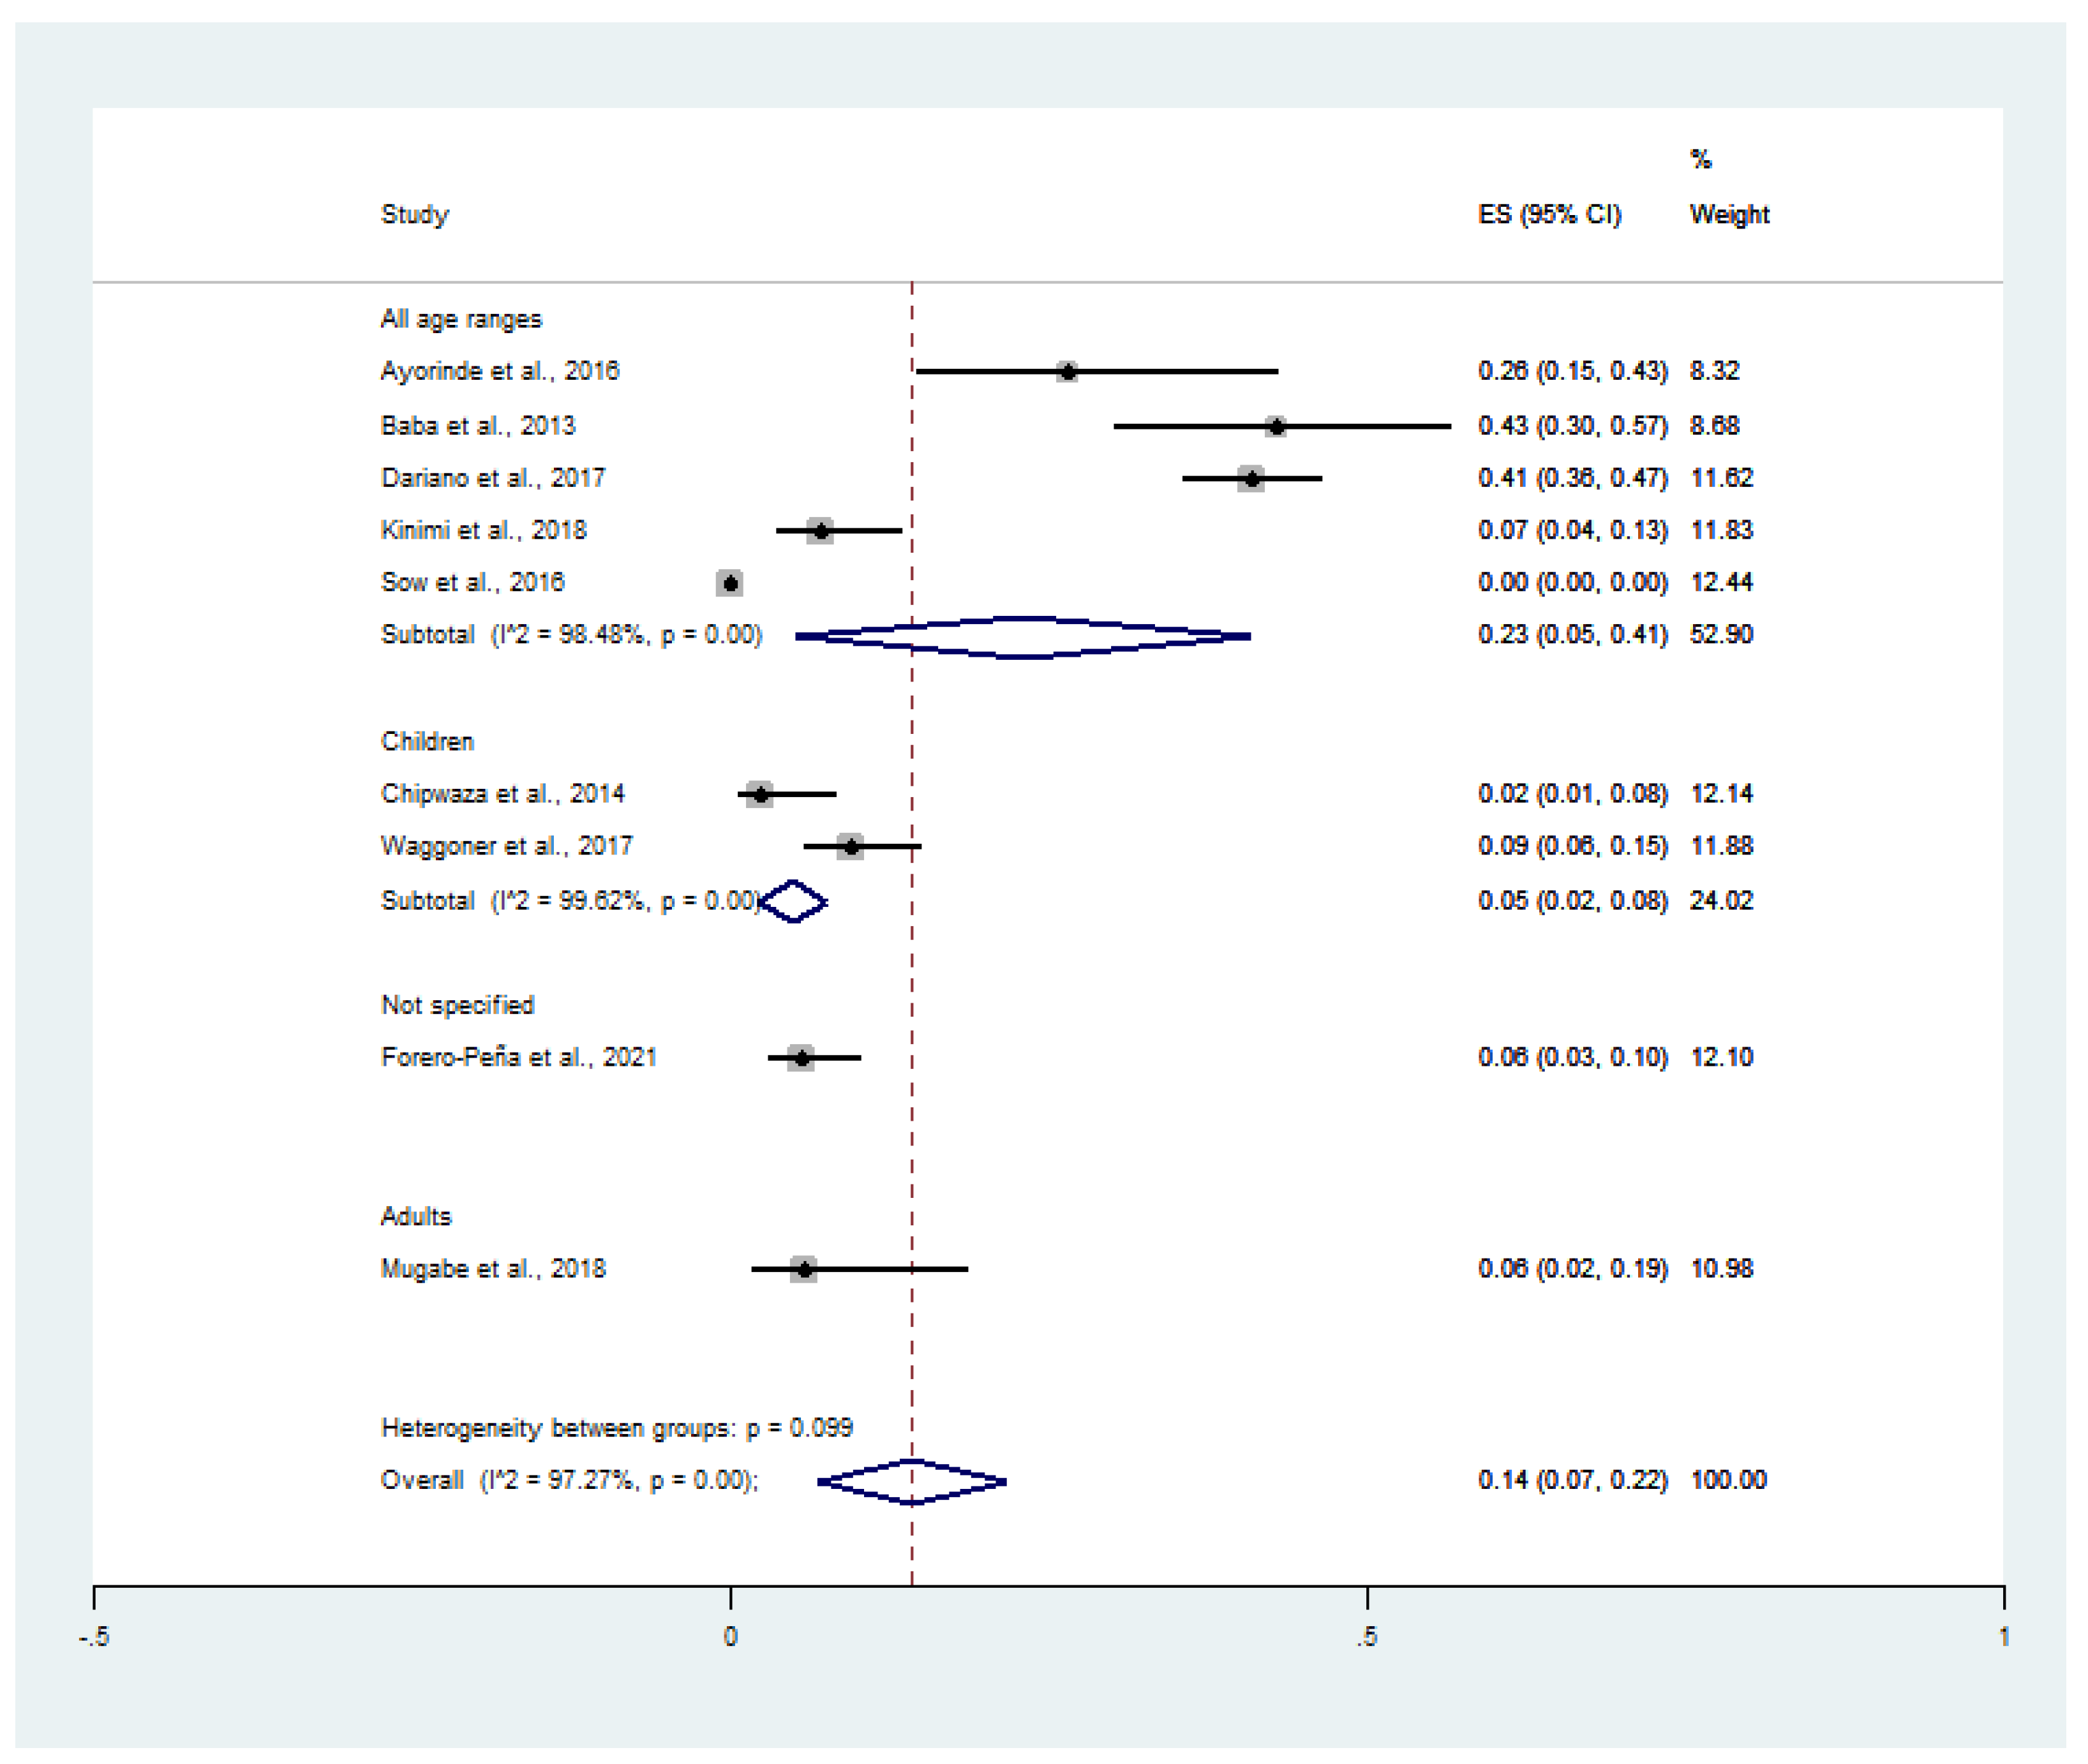
4.4. Prevalence of Malaria and Chikungunya Co-Infection among Febrile Patients
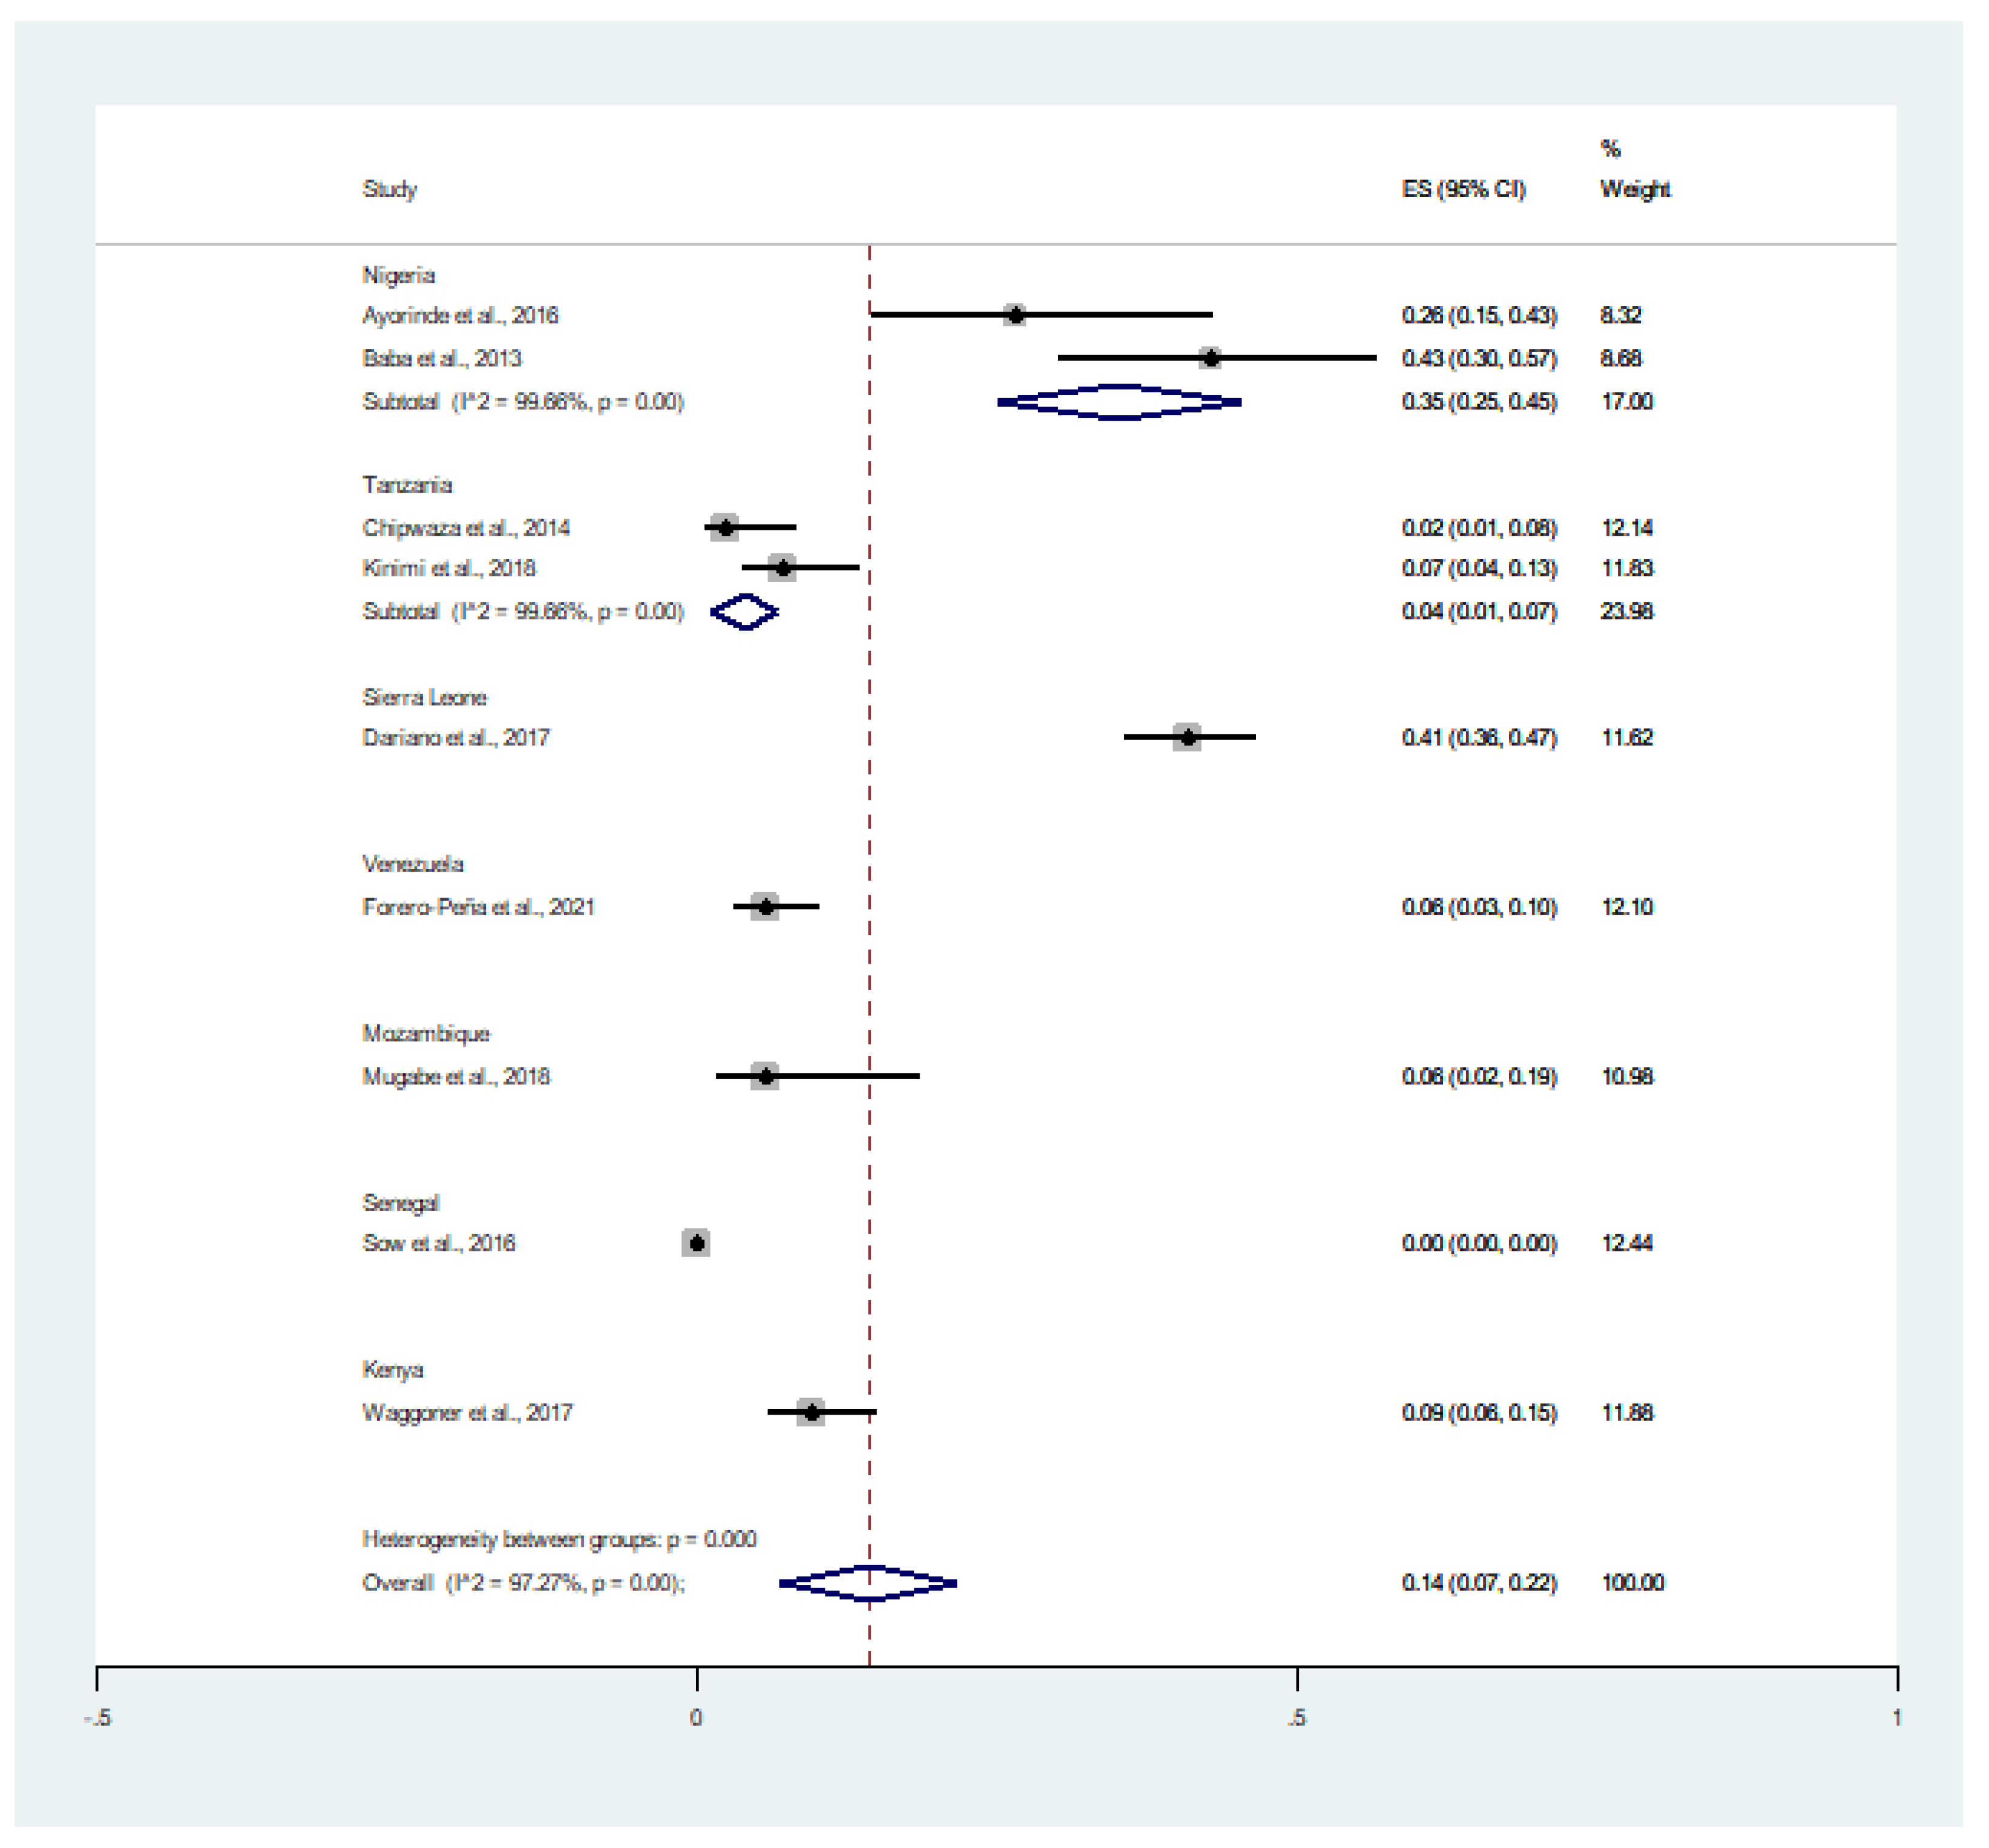
4.5. Prevalence of CHIKV Infection among Malaria Patients
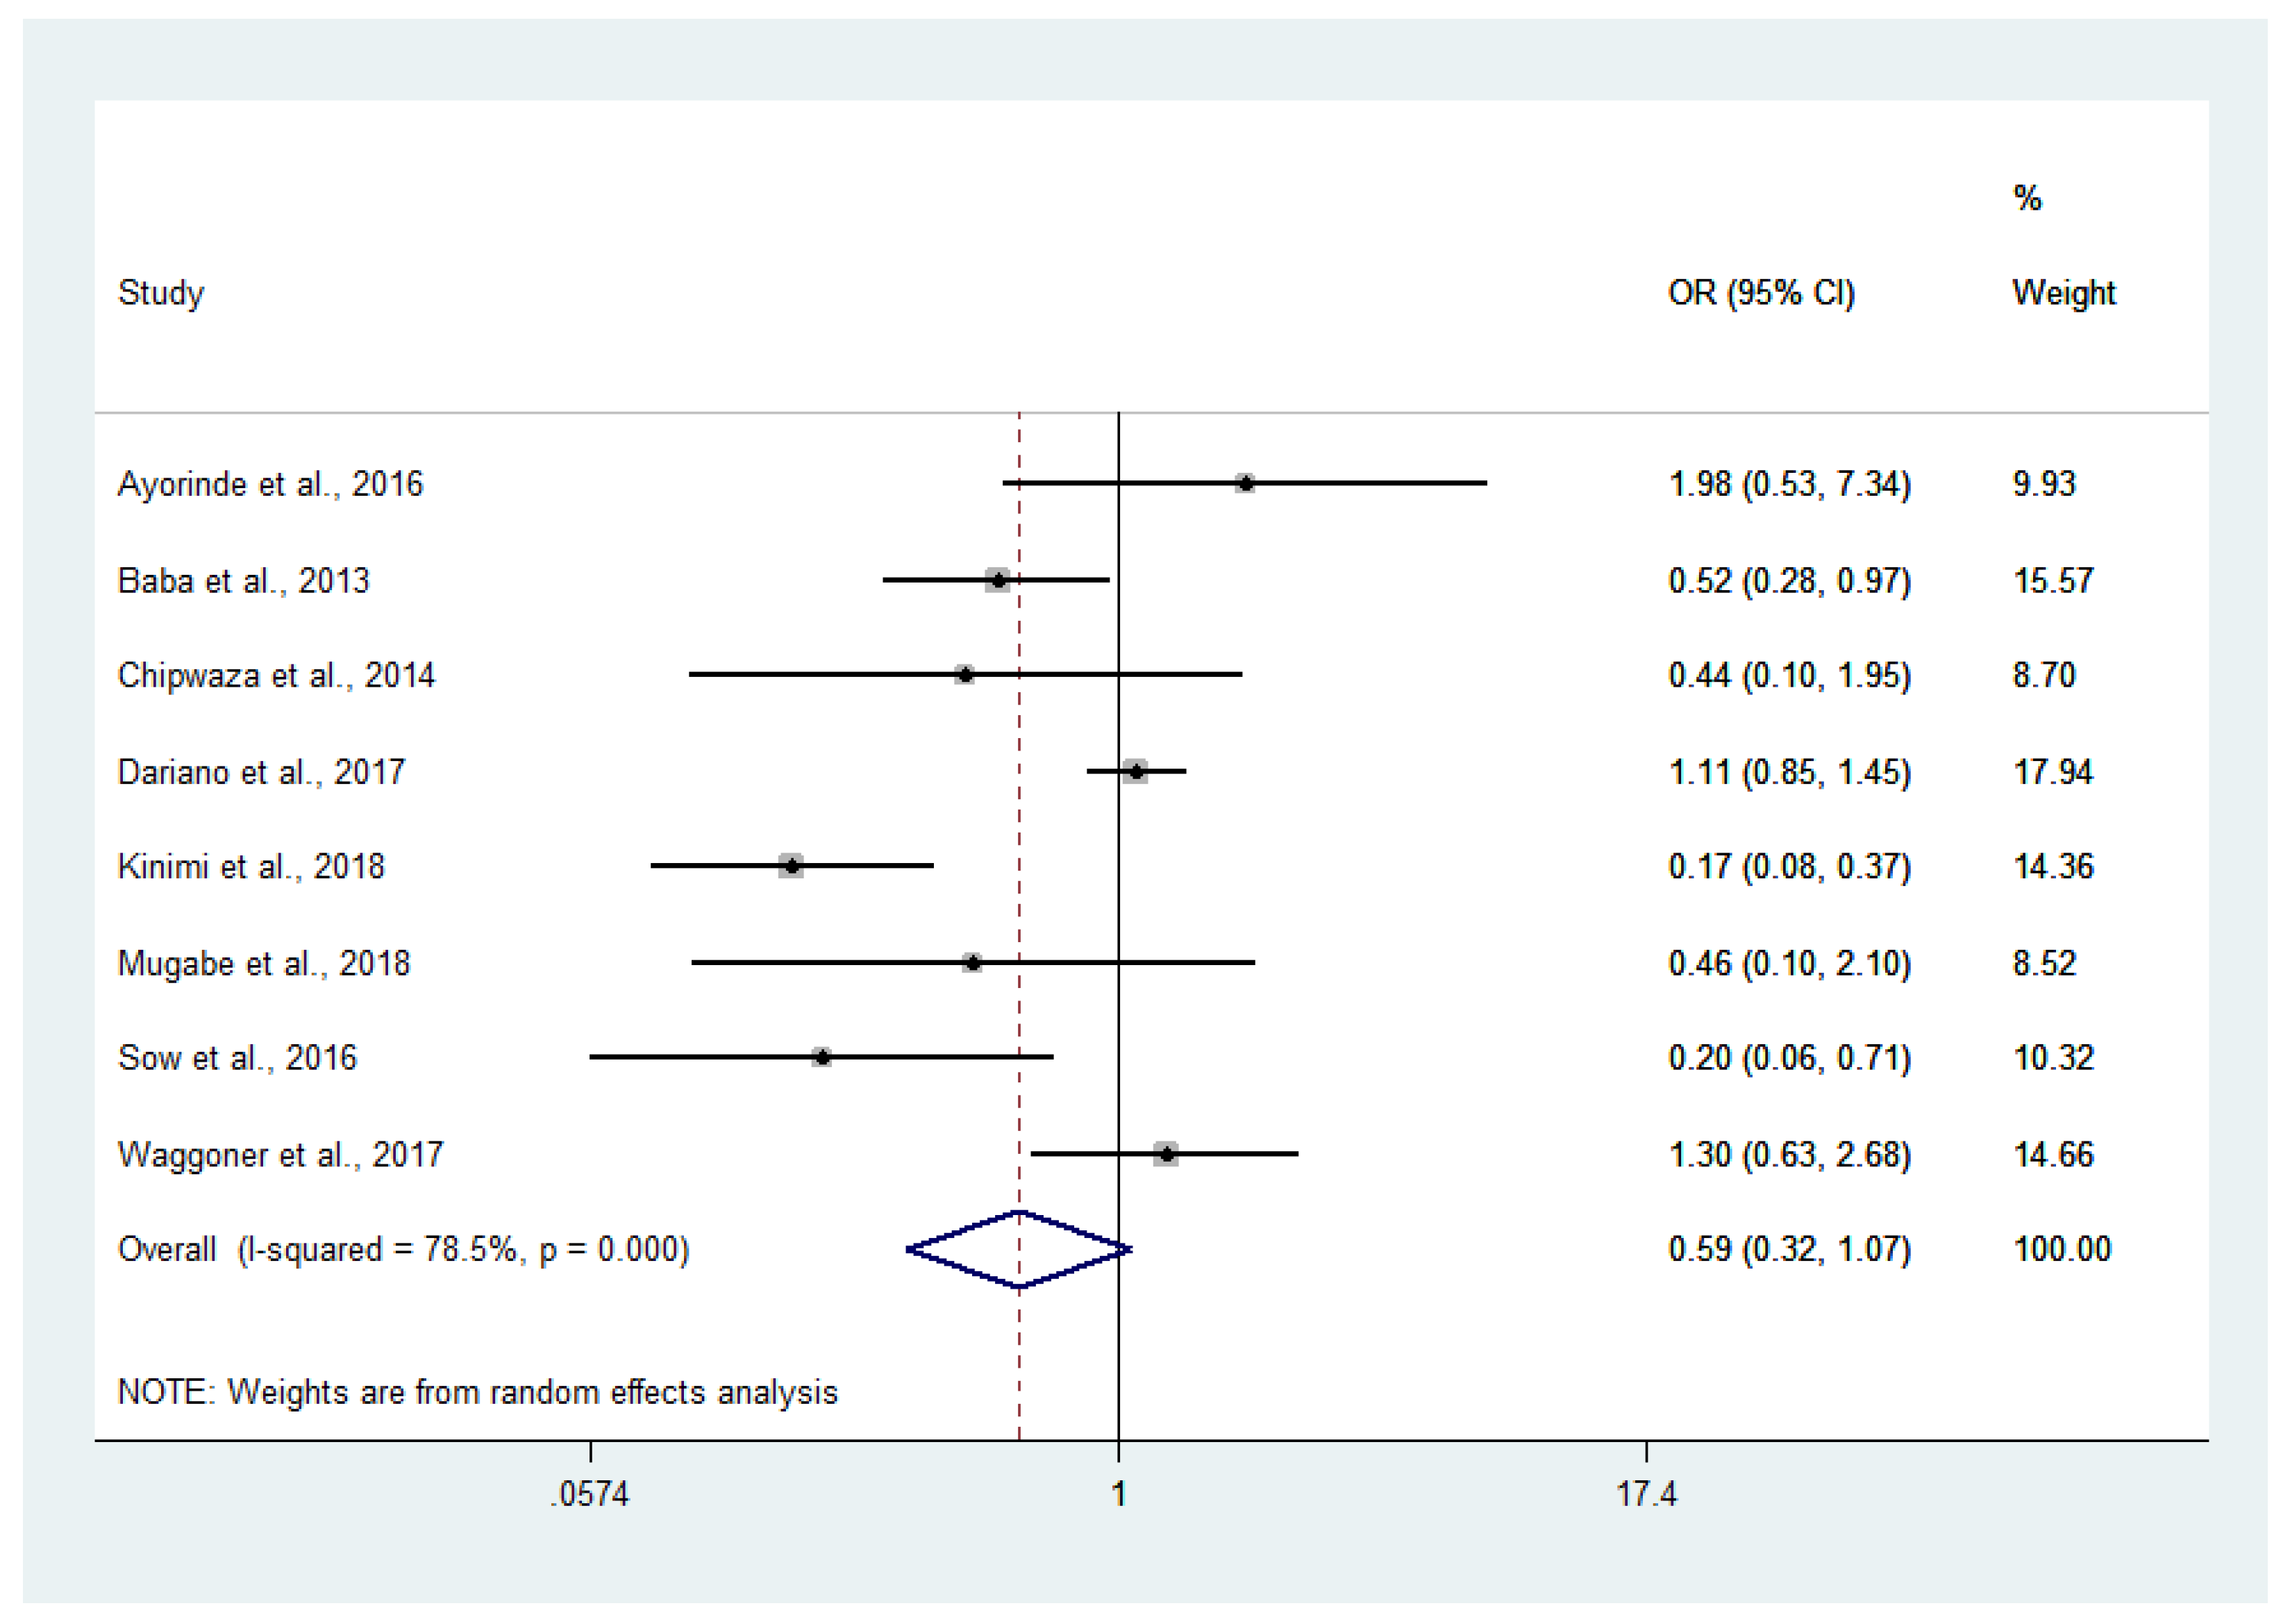
4.6. Odds of Malaria and Chikungunya Co-Infections
4.7. Meta-Regression
4.8. Publication Bias
5. Discussion
6. Conclusions
Supplementary Materials
Author Contributions
Funding
Institutional Review Board Statement
Informed Consent Statement
Data Availability Statement
Acknowledgments
Conflicts of Interest
References
- Ferede, G.; Tiruneh, M.; Abate, E.; Wondimeneh, Y.; Gadisa, E.; Howe, R.; Aseffa, A.; Tessema, B. Evidence of chikungunya virus infection among febrile patients in northwest Ethiopia. Int. J. Infect. Dis. 2021, 104, 183–188. [Google Scholar] [CrossRef]
- Salam, N.; Mustafa, S.; Hafiz, A.; Chaudhary, A.A.; Deeba, F.; Parveen, S. Global prevalence and distribution of coinfection of malaria, dengue and chikungunya: A systematic review. BMC Public Health 2018, 18, 1–20. [Google Scholar] [CrossRef]
- Grandadam, M.; Caro, V.; Plumet, S.; Thiberge, J.-M.; Souarès, Y.; Failloux, A.-B.; Tolou, H.J.; Budelot, M.; Cosserat, D.; Leparc-Goffart, I.; et al. Chikungunya virus, southeastern France. Emerg. Infect. Dis. 2011, 17, 910–913. [Google Scholar] [CrossRef]
- Prat, C.M.; Flusin, O.; Panella, A.; Tenebray, B.; Lanciotti, R.; Leparc-Goffart, I. Evaluation of commercially available serologic diagnostic tests for chikungunya virus. Emerg. Infect. Dis. 2014, 20, 2129–2132. [Google Scholar] [CrossRef] [PubMed]
- Kilpatrick, A.M.; Randolph, S.E. Drivers, dynamics, and control of emerging vector-borne zoonotic diseases. Lancet 2012, 380, 1946–1955. [Google Scholar] [CrossRef]
- Robinson, M.L.; Kadam, D.; Khadse, S.; Balasubramanian, U.; Raichur, P.; Valvi, C.; Marbaniang, I.; Kanade, S.; Sachs, J.; Basavaraj, A.; et al. Vector-borne disease is a common cause of hospitalized febrile illness in India. Am. J. Trop. Med. Hyg. 2018, 98, 1526–1533. [Google Scholar] [CrossRef] [PubMed]
- Kotepui, M.; Kotepui, K.U. Prevalence and laboratory analysis of malaria and dengue co-infection: A systematic review and meta-analysis. BMC Public Health 2019, 19, 1–12. [Google Scholar] [CrossRef] [PubMed]
- Kotepui, M.; Kotepui, K.U.; Milanez, G.D.J.; Masangkay, F.R. Prevalence of and risk factors for severe malaria caused by Plasmodium and dengue virus co-infection: A systematic review and meta-analysis. Infect. Dis. Poverty 2020, 9, 1–14. [Google Scholar] [CrossRef]
- Moher, D.; Liberati, A.; Tetzlaff, J.; Altman, D.G.; The PRISMA Group. Preferred reporting items for systematic reviews and meta-analyses: The PRISMA statement. PLoS Med. 2009, 6, e1000097. [Google Scholar] [CrossRef]
- Moola, S.M.Z.; Tufanaru, C.; Aromataris, E.; Sears, K.; Sfetcu, R.; Currie, M.; Qureshi, R.; Mattis, P.; Lisy, K.; Mu, P.-F. Chapter 7: Systematic Reviews of Etiology and Risk JBI. 2020. Available online: https://synthesismanual.jbi.global (accessed on 6 June 2021).
- Azizi, M.R.; Atlasi, R.; Ziapour, A.; Abbas, J.; Naemi, R. Innovative human resource management strategies during the COVID-19 pandemic: A systematic narrative review approach. Heliyon 2021, 7, e07233. [Google Scholar] [CrossRef]
- Kotepui, M.; Masangkay, F.R.; Kotepui, K.U.; Milanez, G.D.J. Preliminary review on the prevalence, proportion, geographical distribution, and characteristics of naturally acquired Plasmodium cynomolgi infection in mosquitoes, macaques, and humans: A systematic review and meta-analysis. BMC Infect. Dis. 2021, 21, 1–14. [Google Scholar] [CrossRef]
- Lebni, J.Y.; Abbas, J.; Khorami, F.; Khosravi, B.; Jalali, A.; Ziapour, A. Challenges facing women survivors of self-immolation in the Kurdish regions of Iran: A Qualitative Study. Front. Psychiatry 2020, 11, 778. [Google Scholar] [CrossRef]
- Ayorinde, A.F.; Oyeyiga, A.M.; Nosegbe, N.O.; Folarin, O.A. A survey of malaria and some arboviral infections among suspected febrile patients visiting a health centre in Simawa, Ogun State, Nigeria. J. Infect. Public Health 2016, 9, 52–59. [Google Scholar] [CrossRef][Green Version]
- Baba, M.; Logue, C.H.; Oderinde, B.; Abdulmaleek, H.; Williams, J.; Lewis, J.; Laws, T.R.; Hewson, R.; Marcello, A.; Agaro, P.D. Evidence of arbovirus co-infection in suspected febrile malaria and typhoid patients in Nigeria. J. Infect. Dev. Ctries. 2013, 7, 51–59. [Google Scholar] [CrossRef]
- Bower, H.; El Karsany, M.; Adam, A.A.A.H.; Idriss, M.I.; Alzain, M.A.; Alfakiyousif, M.E.A.; Mohamed, R.; Mahmoud, I.; Albadri, O.; Mahmoud, S.A.A.; et al. “Kankasha” in Kassala: A prospective observational cohort study of the clinical characteristics, epidemiology, genetic origin, and chronic impact of the 2018 epidemic of Chikungunya virus infection in Kassala, Sudan. PLoS Negl. Trop. Dis. 2021, 15, e0009387. [Google Scholar] [CrossRef]
- Chipwaza, B.; Mugasa, J.P.; Selemani, M.; Amuri, M.; Mosha, F.; Ngatunga, S.D.; Gwakisa, P.S. Dengue and chikungunya fever among viral diseases in outpatient febrile children in Kilosa district hospital, Tanzania. PLoS Negl. Trop. Dis. 2014, 8, e3335. [Google Scholar] [CrossRef] [PubMed]
- Dariano, D.F.; Bockarie, A.S.; Taitt, C.R.; Yasuda, C.; Jacobsen, K.H.; Stenger, D.A.; Lamin, J.M.; Bockarie, M.J.; Bangura, U.; Ansumana, R.; et al. Surveillance of vector-borne infections (chikungunya, dengue, and malaria) in Bo, Sierra Leone, 2012–2013. Am. J. Trop. Med. Hyg. 2017, 97, 1151–1154. [Google Scholar] [CrossRef] [PubMed]
- Kinimi, E.; Patrick, B.N.; Misinzo, G. Serological evidence of chikungunya and malaria co-infection among febrile patients seeking health care in Karagwe district, Tanzania. Tanzan. J. Health Res. 2018, 20, 20. [Google Scholar] [CrossRef]
- Mugabe, V.A.; Ali, S.; Chelene, I.; Monteiro, V.O.; Guiliche, O.; Muianga, A.F.; Mula, F.; António, V.; Chongo, I.; Oludele, J.; et al. Evidence for chikungunya and dengue transmission in Quelimane, Mozambique: Results from an investigation of a potential outbreak of chikungunya virus. PLoS ONE 2018, 13, e0192110. [Google Scholar] [CrossRef] [PubMed]
- Sow, A.; Loucoubar, C.; Diallo, D.; Faye, O.; Ndiaye, Y.; Senghor, C.S.; Dia, A.T.; Faye, O.; Weaver, S.C.; Diallo, M.; et al. Concurrent malaria and arbovirus infections in Kedougou, southeastern Senegal. Malar. J. 2016, 15, 1–7. [Google Scholar] [CrossRef] [PubMed]
- Waggoner, J.; Brichard, J.; Mutuku, F.; Ndenga, B.; Heath, C.J.; Mohamed-Hadley, A.; Sahoo, M.K.; Vulule, J.; Lefterova, M.; Banaei, N.; et al. Malaria and chikungunya detected using molecular diagnostics among febrile Kenyan children. Open Forum Infect. Dis. 2017, 4, ofx110. [Google Scholar] [CrossRef]
- Forero-Peña, D.A.; de Mora, M.S.; Amaya, I.; Gamardo, A.F.; Chavero, M.; Figuera, L.; Camejo-Ávila, N.A.; Marcano, M.V.; Hidalgo, M.; Arenas, C.J.; et al. High prevalence of viral and bacterial coinfections in malaria in Venezuela. 2021. Preprint. [Google Scholar] [CrossRef]
- Higgins, J.P.T.; Thomas, J.; Chandler, J.; Cumpston, M.; Li, T.; Page, M.J.; Welch, V.A. (Eds.) Cochrane Handbook for Systematic Reviews of Interventions Version 6.2; updated February 2021; Cochrane: London, UK, 2021. [Google Scholar]
- Teo, T.-H.; Lum, F.-M.; Ghaffar, K.; Chan, Y.-H.; Amrun, S.N.; Tan, J.J.L.; Lee, C.Y.P.; Chua, T.-K.; Carissimo, G.; Lee, W.W.L.; et al. Plasmodium co-infection protects against chikungunya virus-induced pathologies. Nat. Commun. 2018, 9, 1–13. [Google Scholar] [CrossRef] [PubMed]
- Local Burden of Disease HIV Collaborators. Mapping subnational HIV mortality in six Latin American countries with incomplete vital registration systems. BMC Med. 2021, 19, 4. [Google Scholar]
- Shuja, K.H.; Shahidullah; Aqeel, M.; Khan, E.A.; Abbas, J. Letter to highlight the effects of isolation on elderly during COVID-19 outbreak. Int. J. Geriatr. Psychiatry 2020, 35, 1477–1478. [Google Scholar] [CrossRef] [PubMed]
- Burdino, E.; Calleri, G.; Caramello, P.; Ghisetti, V. Unmet needs for a rapid diagnosis of chikungunya virus infection. Emerg. Infect. Dis. 2016, 22, 1837–1839. [Google Scholar] [CrossRef]
- Kikuti, M.; Tauro, L.B.; Moreira, P.S.; Nascimento, L.C.J.; Portilho, M.M.; Soares, G.C.; Weaver, S.C.; Reis, M.G.; Kitron, U.; Ribeiro, G.S. Evaluation of two commercially available chikungunya virus IgM enzyme-linked immunoassays (ELISA) in a setting of concomitant transmission of chikungunya, dengue and Zika viruses. Int. J. Infect. Dis. 2020, 91, 38–43. [Google Scholar] [CrossRef]
- Johnson, B.W.; Russell, B.J.; Goodman, C.H. Laboratory diagnosis of chikungunya virus infections and commercial sources for diagnostic assays. J. Infect. Dis. 2016, 214, S471–S474. [Google Scholar] [CrossRef]
- Lima, M.; de Lima, R.C.; de Azeredo, E.L.; Dos Santos, F.B. Analysis of a routinely used commercial anti-chikungunya IgM ELISA reveals cross-reactivities with dengue in Brazil: A new challenge for differential diagnosis? Diagnostics 2021, 11, 819. [Google Scholar] [CrossRef]
- Li, Z.; Wang, J.; Cheng, X.; Hu, H.; Guo, C.; Huang, J.; Chen, Z.; Lu, J. The worldwide seroprevalence of DENV, CHIKV and ZIKV infection: A systematic review and meta-analysis. PLoS Negl. Trop. Dis. 2021, 15, e0009337. [Google Scholar] [CrossRef]
- Chung, W.-C.; Hwang, K.Y.; Kang, S.-J.; Kim, J.-O.; Song, M.J. Development of a neutralization assay based on the pseudotyped chikungunya virus of a Korean isolate. J. Microbiol. 2019, 58, 46–53. [Google Scholar] [CrossRef] [PubMed]
- Azami, N.A.M.; Moi, M.L.; Takasaki, T. Neutralization assay for chikungunya virus infection: Plaque reduction neutralization test. Adv. Struct. Saf. Stud. 2016, 1426, 273–282. [Google Scholar] [CrossRef]
- Hu, D.; Zhang, J.; Wang, H.; Liu, S.; Yu, L.; Sun, L.; Qu, Y. Chikungunya virus glycoproteins pseudotype with lentiviral vectors and reveal a broad spectrum of cellular tropism. PLoS ONE 2014, 9, e110893. [Google Scholar] [CrossRef] [PubMed]
- Lee, H.-J.; Min, K.-I.; Park, K.H.; Choi, H.J.; Kim, M.-K.; Ahn, C.-Y.; Hong, Y.-J.; Kim, Y.B. Comparison of JEV neutralization assay using pseudotyped JEV with the conventional plaque-reduction neutralization test. J. Microbiol. 2014, 52, 435–440. [Google Scholar] [CrossRef]


| Author | Study Site | Year of Conducted | Study Design | Participants | Age | % Male | Co-Infection | All Malaria Cases | Malaria without CHIKV Infection | CHIKV Infection without Malaria | Test for Malaria | Test for CHIKV | Risk of Bias (High, Moderate, Low) |
|---|---|---|---|---|---|---|---|---|---|---|---|---|---|
| Ayorinde et al., 2016 | Nigeria | 2014 | Cross-sectional study | 60 febrile patients | 3–70 years | 26.7 | 9 | 34 | 25 | 4 | Microscopy, RDT, PCR | RDT (IgM) | Moderate |
| Baba et al., 2013 | Nigeria | 2008 | Cross-sectional study | 310 febrile patients | <1–80 years | 45.2 | 21 | 49 | 28 | 154 | Microscopy | Plaque reduction neutralization test (PRNT) | Moderate |
| Bower et al., 2021 | Sudan | 2018 | Prospective observational study | 102 adults and 40 children presenting with chikungunya-like illness | 4 months–70 years | 34 | 39 | 5 | 84 | RDT | Real-time RT-PCR | Moderate | |
| Chipwaza et al., 2014 | Tanzania | 2013 | Cross-sectional study | 364 febrile patients | 2–13 years | 51.1 | 2 | 83 | 81 | 15 | Microscopy | IgM and IgG ELISA | Moderate |
| Dariano et al., 2017 | Sierra Leone | 2012–2013 | Cross-sectional study | 1260 febrile patients | 6–45 years | NS | 122 | 298 | 176 | 370 | RDT | RDT (IgM) | Moderate |
| Forero-Peña et al., 2021 | Venezuela | 2018 | Cross-sectional study | 161 malaria-positive cases | Mean 34 years | NS | 9 | 161 | 152 | NS | Microscopy | IgM and IgG ELISA | Moderate |
| Kinimi et al., 2018 | Tanzania | 2015 | Cross-sectional study | 400 febrile patients | 1–50 years | 38 | 8 | 112 | 104 | 89 | Microscopy, RDT | IgM and IgG ELISA | Moderate |
| Mugabe et al., 2018 | Mozambique | 2016 | Cross-sectional study | 163 febrile patients | ≥5 years | 39.3 | 2 | 35 | 33 | 15 | RDT | IgM and IgG ELISA | Moderate |
| Sow et al., 2016 | Senegal | 2009–2013 | Prospective observational study | 13,845 febrile patients (7387 malaria and 44 arboviral-infected individuals) | 1–90 years | 20 | 3 | 7387 | 7384 | 13 | Microscopy, RDT | IgM ELISA, real-time RT-PCR | Low |
| Waggoner et al., 2017 | Kenya | 2014–2015 | Cross-sectional study | 385 febrile patients | <18 years | 49.9 | 15 | 158 | 143 | 17 | Microscopy, PCR | Real-time RT-PCR | Low |
Publisher’s Note: MDPI stays neutral with regard to jurisdictional claims in published maps and institutional affiliations. |
© 2021 by the authors. Licensee MDPI, Basel, Switzerland. This article is an open access article distributed under the terms and conditions of the Creative Commons Attribution (CC BY) license (https://creativecommons.org/licenses/by/4.0/).
Share and Cite
Mala, W.; Wilairatana, P.; Kotepui, K.U.; Kotepui, M. Prevalence of Malaria and Chikungunya Co-Infection in Febrile Patients: A Systematic Review and Meta-Analysis. Trop. Med. Infect. Dis. 2021, 6, 119. https://doi.org/10.3390/tropicalmed6030119
Mala W, Wilairatana P, Kotepui KU, Kotepui M. Prevalence of Malaria and Chikungunya Co-Infection in Febrile Patients: A Systematic Review and Meta-Analysis. Tropical Medicine and Infectious Disease. 2021; 6(3):119. https://doi.org/10.3390/tropicalmed6030119
Chicago/Turabian StyleMala, Wanida, Polrat Wilairatana, Kwuntida Uthaisar Kotepui, and Manas Kotepui. 2021. "Prevalence of Malaria and Chikungunya Co-Infection in Febrile Patients: A Systematic Review and Meta-Analysis" Tropical Medicine and Infectious Disease 6, no. 3: 119. https://doi.org/10.3390/tropicalmed6030119
APA StyleMala, W., Wilairatana, P., Kotepui, K. U., & Kotepui, M. (2021). Prevalence of Malaria and Chikungunya Co-Infection in Febrile Patients: A Systematic Review and Meta-Analysis. Tropical Medicine and Infectious Disease, 6(3), 119. https://doi.org/10.3390/tropicalmed6030119