


AI-Driven Tuberculosis Hotspot Mapping to Optimize Active Case-Finding: Implementing the Epi-Control Platform in Uganda
 , , , , and
Abstract
1. Introduction
- Use bacteriological confirmed TB positivity rate from ACF interventions along with local contextual data to predict TB positivity rate at sub-parish level across the four regions.
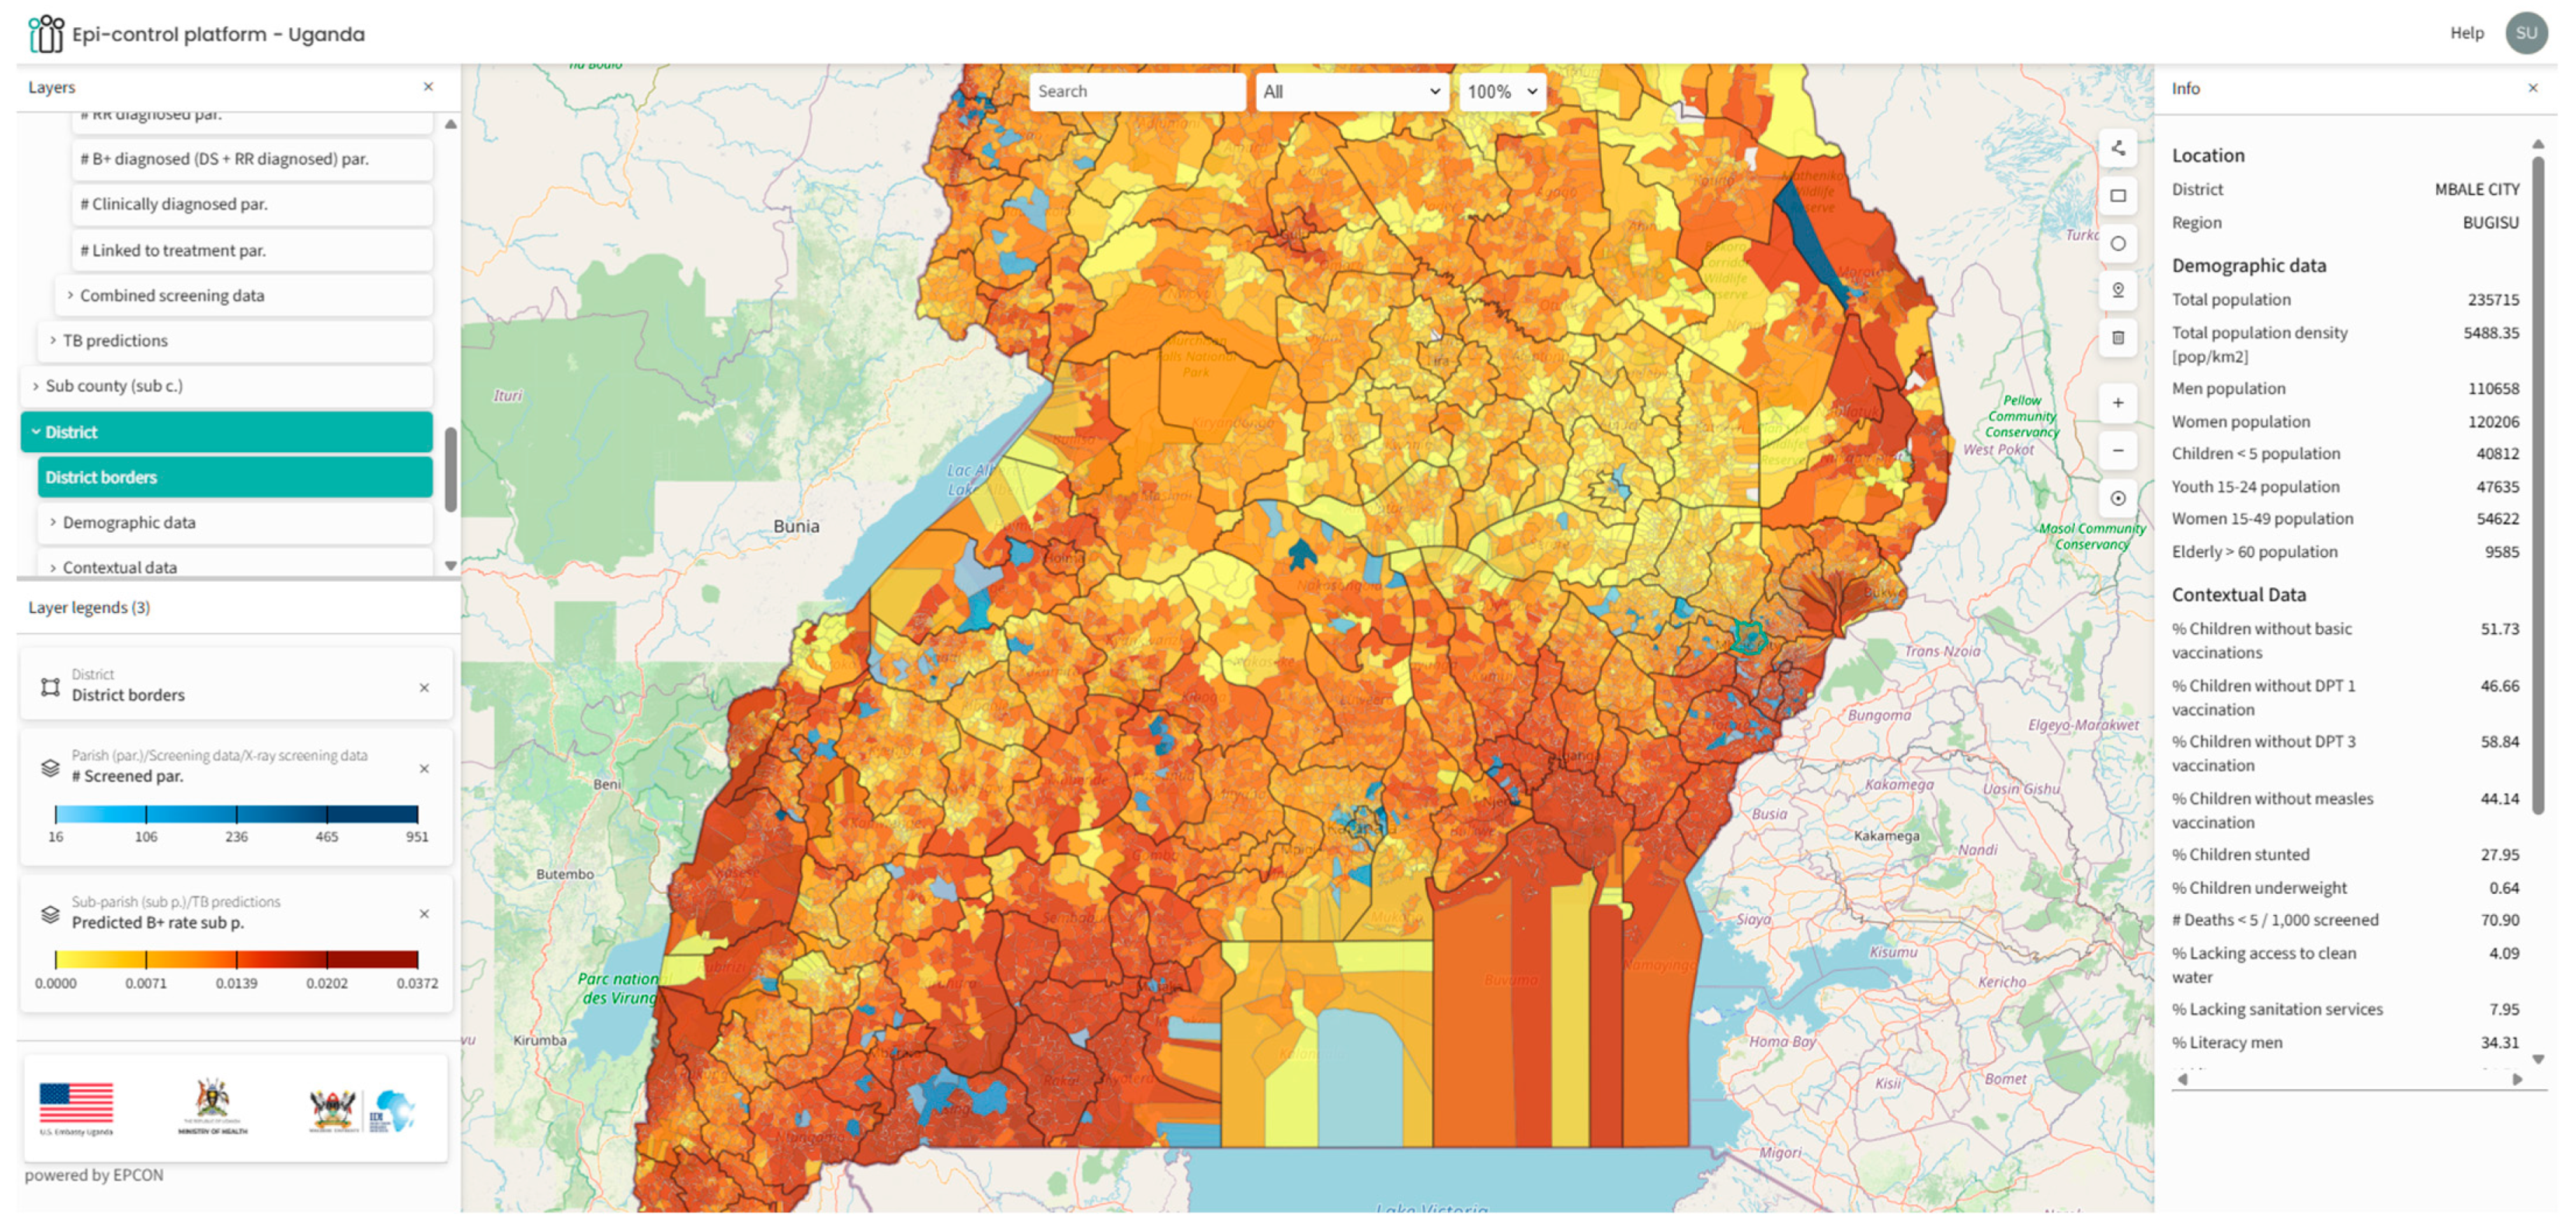
- Map the predicted output, the bacteriological confirmed TB positivity rate on a customized geoportal for geospatial visualization and local stakeholder engagement in Uganda.
- Estimate the difference in yield (bacteriological confirmed TB cases/screened) by comparing predicted ‘hotspots’ with ‘non-hotspots.’
2. Materials and Methods
2.1. Study Design and Setting
2.2. Inclusion and Exclusion Criteria
2.3. Input and Outcome Variables
2.4. Covariates
2.5. Resolution, Data Preparation, and Model Training
2.6. Modelling Approach
2.7. Model Evaluation and Comparison
3. Results
4. Discussion
Author Contributions
Funding
Institutional Review Board Statement
Informed Consent Statement
Data Availability Statement
Conflicts of Interest
Abbreviations
| ACF | Active Case-Finding |
| AI | Artificial Intelligence |
| CSO | Civil Society Organizations |
| CPD | Conditional Probability Distribution |
| DHS | Demographic and Health Survey |
| DCXR | Digital Chest X-Ray |
| GIS | Geographic Information System |
| GRDI | Gridded Relative Wealth Index |
| IDI | Infectious Disease Institute |
| LPHS-TB | Local Partner Health Services for Tuberculosis |
| MoH | Ministry of Health |
| NTLP | National TB and Leprosy Control Program |
| TB | Tuberculosis |
| USG | United States Government |
| VHTs | Village Health Teams |
| WHO | World Health Organization |
Appendix A

| Variable Name | Definition/Description | Source | Resolution | Year |
|---|---|---|---|---|
| Overall population density | Number of people per square kilometre | 30 m | 2016 | |
| Elderly (ages 60+) population | Counts of people over the age of 60 per square kilometre | |||
| Female population | Counts of females per square kilometre | |||
| Male population | Counts of males per square kilometre | |||
| Distance to major roads | Distance from OpenStreetMap major roads to the centroid of a population cluster, measured in kilometres | WorldPop | 3 arc s/~100 m at the equator | 2018 |
| DPT 1 vaccination received | Percentage of children 12–23 months who had received DPT 1 vaccination | Uganda Bureau of Statistics (UBOS) and ICF | 5 × 5 km | 2018 |
| DPT 3 vaccination received | Percentage of children 12–23 months who had received DPT 3 vaccination | |||
| Fully vaccinated (8 basic antigens) | Percentage of children 12–23 months who were fully vaccinated with 8 basic antigens (BCG, Polio 1–3, DPT 1–3, Measles) | |||
| Measles vaccination received | Percentage of children 12–23 months who had received Measles vaccination | |||
| Prevalence of stunting among children under 5 years of age | Percentage of children stunted (below −2 SD of height for age according to the WHO standard) | |||
| Literacy men and women | Mean years of educational attainment in men (ages 15–49) and women (ages 15–49) | Institute For Health Metrics and Evaluation | 5 × 5 km | 2019 |
| Prevalence of underweight among children younger than 5 years of age | Percentage of children under the age of 5 with weight-for-age Z-score (WAZ) less than −2 standard deviations from the WHO Child Growth Standards | Institute For Health Metrics and Evaluation | 5 × 5 km | 2019 |
| Under 5 (0–5 years old) mortality probability | Probability of death for children under 5—mean estimates. | Institute for Health Metrics and Evaluation | 5 × 5 km | 2019 |
| Access to any improved water source | Percentage of the de jure population living in households whose main source of drinking water is an improved source | Institute for Health Metrics and Evaluation | 5 × 5 km | 2019 |
| Reliance on open defecation | Percentage of the de jure population living in households whose main type of toilet facility is no facility (open defecation) | Institute for Health Metrics and Evaluation | 5 × 5 km | 2019 |
| HIV prevalence | Estimated prevalence among individuals aged 15–59 years | Institute for Health Metrics and Evaluation | 5 × 5 km | 2019 |
| Elevation | Elevation above sea level (in metres) | WorldPop | 100 m | |
| Motorized travel time to health facility | Optimal travel time to healthcare with access to motorized transport | Malaria Atlas | 1 km | |
| Nightlights [nanoWatts/cm2/sr] | VIIRS data measured in nanoWatts/cm2/sr | Earth Observation Group | 100 m | |
| Relative deprivation index | Composite socioeconomic deprivation index (2010–2020 average) | NASA Socioeconomic Data and Applications Center | 1 km |
References
- WHO. WHO Conducts Mid-Term Review of Uganda’s Response to TB|WHO|Regional Office for Africa [Internet]. 2023. Available online: https://www.afro.who.int/countries/uganda/news/who-conducts-mid-term-review-ugandas-response-tb (accessed on 12 August 2025).
- Aceng, F.L.; Kabwama, S.N.; Ario, A.R.; Etwom, A.; Turyahabwe, S.; Mugabe, F.R. Spatial distribution and temporal trends of tuberculosis case notifications, Uganda: A ten-year retrospective analysis (2013–2022). BMC Infect. Dis. 2024, 24, 46. [Google Scholar] [CrossRef] [PubMed]
- Ho, J.; Fox, G.J.; Marais, B.J. Passive case finding for tuberculosis is not enough. Int. J. Mycobacteriology 2016, 5, 374–378. [Google Scholar] [CrossRef]
- Henry, N.J.; Zawedde-Muyanja, S.; Majwala, R.K.; Turyahabwe, S.; Barnabas, R.V.; Reiner, R.C., Jr.; Moore, C.; Ross, J. Mapping TB incidence across districts in Uganda to inform health program activities. IJTLD Open 2024, 1, 223–229. [Google Scholar] [CrossRef]
- Ayabina, D.V.; Gomes, M.G.M.; Nguyen, N.V.; Vo, L.; Shreshta, S.; Thapa, A.; Codlin, A.J.; Mishra, G.; Caws, M. The impact of active case finding on transmission dynamics of tuberculosis: A modelling study. PLoS ONE 2021, 16, e0257242. [Google Scholar] [CrossRef]
- Sekandi, J.N.; List, J.; Luzze, H.; Yin, X.P.; Dobbin, K.; Corso, P.S.; Oloya, J.; Okwera, A.; Whalen, C.C. Yield of undetected tuberculosis and human immunodeficiency virus coinfection from active case finding in urban Uganda. Int. J. Tuberc. Lung Dis. Off. J. Int. Union. Tuberc. Lung Dis. 2014, 18, 13–19. [Google Scholar] [CrossRef] [PubMed]
- Robsky, K.O.; Kitonsa, P.J.; Mukiibi, J.; Nakasolya, O.; Isooba, D.; Nalutaaya, A.; Salvatore, P.P.; Kendall, E.A.; Katamba, A.; Dowdy, D. Spatial distribution of people diagnosed with tuberculosis through routine and active case finding: A community-based study in Kampala, Uganda. Infect. Dis. Poverty 2020, 9, 73. [Google Scholar] [CrossRef]
- Kazibwe, A.; Twinomugisha, F.; Musaazi, J.; Nakaggwa, F.; Lukanga, D.; Aleu, P.; Kiyemba, T.; Nkolo, A.; Kirirabwa, N.S.; Lopez, D.B.F.; et al. Comparative yield of different active TB case finding interventions in a large urban TB project in central Uganda: A descriptive study. Afr. Health Sci. 2021, 21, 975–984. [Google Scholar] [CrossRef] [PubMed]
- Ochom, E.; Robsky, K.O.; Gupta, A.J.; Tamale, A.; Kungu, J.; Turimumahoro, P.; Nakasendwa, S.; Rwego, I.B.; Muttamba, W.; Joloba, M.; et al. Geographic distribution and predictors of diagnostic delays among possible TB patients in Uganda. Public Health Action 2023, 13, 70–76. [Google Scholar] [CrossRef]
- Aturinde, A.; Farnaghi, M.; Pilesjö, P.; Mansourian, A. Spatial analysis of HIV-TB co-clustering in Uganda. BMC Infect. Dis. 2019, 19, 612. [Google Scholar] [CrossRef]
- Mergenthaler, C.; Mathewson, J.D.; Lako, S.; van der Merwe, A.W.; Potgieter, M.; Meurrens, V.; Latif, A.; Tahir, H.; Ahmed, T.; Samad, Z.; et al. Predicting communities with high tuberculosis case-finding efficiency to optimise resource allocation in Pakistan: Comparing the performance of a negative binomial spatial lag model with a Bayesian machine-learning model. BMJ Public Health 2025, 3, e001424. [Google Scholar] [CrossRef]
- Alege, A.; Hashmi, S.; Eneogu, R.; Meurrens, V.; Budts, A.L.; Pedro, M.; Daniel, O.; Idogho, O.; Ihesie, A.; Potgieter, M.G.; et al. Effectiveness of Using AI-Driven Hotspot Mapping for Active Case Finding of Tuberculosis in Southwestern Nigeria. Trop. Med. Infect. Dis. 2024, 9, 99. [Google Scholar] [CrossRef]
- Koura, K.G.; Hashmi, S.; Menon, S.; Gando, H.G.; Yamodo, A.K.; Budts, A.L.; Meurrens, V.; Lapelou, S.-C.S.K.; Mbitikon, O.B.; Potgieter, M.; et al. Leveraging Artificial Intelligence to Predict Potential TB Hotspots at the Community Level in Bangui, Republic of Central Africa. Trop. Med. Infect. Dis. 2025, 10, 93. [Google Scholar] [CrossRef]
- EPCON. EPCON|Bayesian Network Approach [Internet]. Available online: https://www.epcon.ai/bayesiannetworkapproach (accessed on 28 October 2025).
- Rood, E.; Khan, A.H.; Modak, P.K.; Mergenthaler, C.; Van Gurp, M.; Blok, L.; Bakker, M. A Spatial Analysis Framework to Monitor and Accelerate Progress towards SDG 3 to End TB in Bangladesh. ISPRS Int. J. Geo-Inf. 2019, 8, 14. [Google Scholar] [CrossRef]
- John, S.; Abdulkarim, S.; Usman, S.; Rahman, M.d.T.; Creswell, J. Comparing tuberculosis symptom screening to chest X-ray with artificial intelligence in an active case finding campaign in Northeast Nigeria. BMC Glob. Public Health 2023, 1, 17. [Google Scholar]
- Babayi, A.P.; Odume, B.B.; Ogbudebe, C.L.; Chukwuogo, O.; Nwokoye, N.; Dim, C.C.; Useni, S.; Nongo, D.; Eneogu, R.; Chijioke-Akaniro, O.; et al. Improving TB control: Efficiencies of case-finding interventions in Nigeria. Public Health Action 2023, 13, 90–96. [Google Scholar] [CrossRef]
- van Gurp, M.; Rood, E.; Fatima, R.; Joshi, P.; Verma, S.C.; Khan, A.H.; Blok, L.; Mergenthaler, C.; Bakker, M.I. Finding gaps in TB notifications: Spatial analysis of geographical patterns of TB notifications, associations with TB program efforts and social determinants of TB risk in Bangladesh, Nepal and Pakistan. BMC Infect. Dis. 2020, 20, 490. [Google Scholar] [CrossRef] [PubMed]
- Rahman, M.S.; Shiddik, A.B. Utilizing artificial intelligence to predict and analyze socioeconomic, environmental, and healthcare factors driving tuberculosis globally. Sci. Rep. 2025, 15, 13619. [Google Scholar] [CrossRef] [PubMed]
- Facebook Connectivity Lab and Center for International Earth Science Information Network—CIESIN—Columbia University. Global High Resolution Population Density Maps (Facebook Connectivity Lab, CIESIN)|UN-SPIDER Knowledge Portal [Internet]. High Resolution Settlement Layer (HRSL). 2016. Available online: https://www.un-spider.org/links-and-resources/data-sources/global-high-resolution-population-density-maps-facebook (accessed on 15 October 2025).
- WorldPop. Global 100m Covariates [Internet]; University of Southampton: Southampton, UK, 2018; Available online: https://www.worldpop.org/doi/10.5258/SOTON/WP00644 (accessed on 13 October 2025).
- Uganda Bureau of Statistics (UBOS) and ICF. Uganda Demographic and Health Survey 2016; UBOS and ICF: Kampala, Uganda; Rockville, MD, USA, 2018.
- Institute for Health Metrics and Evaluation (IHME). Low- and Middle-Income Country Educational Attainment Geospatial Estimates 2000–2017; Institute for Health Metrics and Evaluation (IHME): Seattle, WA, USA, 2019. [Google Scholar]
- Institute for Health Metrics and Evaluation (IHME). Global Under-5 Child Growth Failure Geospatial Estimates 2000–2019; Institute for Health Metrics and Evaluation (IHME): Seattle, WA, USA, 2019. [Google Scholar]
- Institute for Health Metrics and Evaluation [IHME]. Low- and Middle-Income Country Neonatal, Infant, and Under-5 Mortality Geospatial Estimates 2000–2017 [Internet]; Institute for Health Metrics and Evaluation [IHME]: Seattle, WA, USA, 2017; Available online: http://ghdx.healthdata.org/record/ihme-data/lmic-under5-mortality-rate-geospatial-estimates-2000-2017 (accessed on 27 October 2025).
- Local Burden of Disease WaSH Collaborators. Mapping geographical inequalities in access to drinking water and sanitation facilities in low-income and middle-income countries, 2000–2017. Lancet Glob. Health 2020, 8, e1162–e1185.
- Dwyer-Lindgren, L.; Cork, M.A.; Sligar, A.; Steuben, K.M.; Wilson, K.F.; Provost, N.R.; Mayala, B.K.; VanderHeide, J.D.; Collison, M.L.; Hall, J.B.; et al. Mapping HIV prevalence in sub-Saharan Africa between 2000 and 2017. Nature 2019, 570, 189–193. [Google Scholar] [CrossRef]
- VIIRS Nighttime Light. Available online: https://eogdata.mines.edu/products/vnl/ (accessed on 13 November 2025).
- Global Gridded Relative Deprivation Index (GRDI); Version 1; NASA: Washington, DC, USA, 2025. Available online: https://www.earthdata.nasa.gov/es/data/catalog/sedac-ciesin-sedac-pmp-grdi-2010-2020-1.00 (accessed on 13 October 2025).
- Malaria Atlas Project. Malaria Atlas Project. Available online: https://data.malariaatlas.org/trends?year=2024&metricGroup=Malaria&geographicLevel=admin0&metricSubcategory=Pf&metricType=rate&metricName=incidence (accessed on 13 October 2025).
- Ankan, A.; Textor, J. pgmpy: A python toolkit for bayesian networks. J. Mach. Learn. Research. 2024, 25, 1–8. [Google Scholar]
- Data Tools and Practices. Institute for Health Metrics and Evaluation. Available online: https://www.healthdata.org/data-tools-practices (accessed on 13 October 2025).
- Maps and Regions—Office of the Vice President of Uganda. Available online: https://www.vicepresident.go.ug/maps-and-regions/ (accessed on 29 October 2025).
- Mortazavi, S.A.; Swartwood, N.A.; Singh, N.; Can, M.H.; Cui, H.; Ryuk, D.K.; Horton, K.C.; Menzies, N.A.; MacPherson, P. Urban and rural prevalence of tuberculosis in low- and middle-income countries: A systematic review and meta-analysis. medRxiv 2025. [Google Scholar] [CrossRef]
- Wynne, A.; Richter, S.; Banura, L.; Kipp, W. Challenges in tuberculosis care in Western Uganda: Health care worker and patient perspectives. Int. J. Afr. Nurs. Sci. 2014, 1, 6–10. [Google Scholar] [CrossRef]
- Johnson-Peretz, J.; Chamie, G.; Kakande, E.; Christian, C.; Kamya, M.R.; Akatukwasa, C.; Atwine, F.; Havlir, D.V.; Camlin, C.S. Geographical, social, and political contexts of tuberculosis control and intervention, as reported by mid-level health managers in Uganda: ‘The activity around town’. Soc. Sci. Med. 2023, 338, 116363. [Google Scholar] [CrossRef] [PubMed]
- Seyedmehdi, S.M.; Jamaati, H.; Varahram, M.; Tabarsi, P.; Marjani, M.; Moniri, A.; Alizadeh, N.; Hassani, S. Barriers and facilitators of tuberculosis treatment among immigrants: An integrative review. BMC Public Health 2024, 24, 3514. [Google Scholar] [CrossRef] [PubMed]

| Indicator | Source | Year |
|---|---|---|
| Overall population density Elderly (ages 60+) population Female population Male population | Facebook’s Connectivity Lab and the Center for International Earth Science Information Network | 2016 |
| Distance to major Roads Elevation | WorldPop | 2018 |
| % children with DPT-1, DPT-3, Measles vaccination Fully vaccinated (8 basic antigens) | Uganda Bureau of Statistics (UBOS) and ICF | 2018 |
| Under 5 (0–5 years old) mortality probability Access to any improved water source Reliance on open defecation HIV prevalence Literacy in male and females Percentage of children underweight | Institute For Health Metrics and Evaluation | 2019 |
| Motorized travel time to health facility | Malaria Atlas Project (MAPS) | 2019 |
| Nightlights (nanoWatts/cm2/sr) | Earth Observation Group | 2023 |
| Relative Deprivation Index | NASA Socioeconomic Data and Applications Centre | 2020 |
| Region | Metrics | N |
|---|---|---|
| Country | Total parishes | 10,864 |
| Total Sub-parishes | 11,153 | |
| Sub-parishes screened | 243 | |
| Screening coverage | 2.18% | |
| Total Individuals screened | 33,427 | |
| TB diagnosed | 465 | |
| Central Region | Total parishes | 1765 |
| Total Sub-parishes | 1958 | |
| Sub-parishes screened | 71 | |
| Screening coverage | 3.63% | |
| Total Individuals screened | 11,322 | |
| TB diagnosed | 111 | |
| Eastern Region | Total parishes | 3599 |
| Total Sub-parishes | 3626 | |
| Sub-parishes screened | 98 | |
| Screening coverage | 2.70% | |
| Total Individuals screened | 10,288 | |
| TB diagnosed | 146 | |
| Northern Region | Total parishes | 2628 |
| Total Sub-parishes | 2654 | |
| Sub-parishes screened | 32 | |
| Screening coverage | 1.21% | |
| Total Individuals screened | 6206 | |
| TB diagnosed | 115 | |
| Western Region | Total parishes | 2872 |
| Total Sub-parishes | 2915 | |
| Sub-parishes screened | 42 | |
| Screening coverage | 1.44% | |
| Total Individuals screened | 5611 | |
| TB diagnosed | 93 |
| Region | Total Hotspots | Total Non-Hotspots | Total Sub-Parishes | Proportion of Hotspots | Proportion of Non-Hotspots |
|---|---|---|---|---|---|
| Central | 954 | 1004 | 1958 | 48.7% | 51.3% |
| Eastern | 822 | 2804 | 3626 | 22.7% | 77.3% |
| Northern | 320 | 2334 | 2654 | 12.1% | 87.9% |
| Western | 1249 | 1666 | 2915 | 42.8% | 57.2% |
| Region | Hotspots | Non-Hotspots | Risk Ratio | 95% CI (Risk Ratio) | Relative Risk Increase | Fischer’s Exact p-Value |
|---|---|---|---|---|---|---|
| Country | TB positive: 215 | TB positive: 250 | 1.69 | 1.41–2.02 | 0.69 | <0.001 |
| TB negative: 11,064 | TB negative: 21,898 | |||||
| Central | TB positive: 18 | TB positive: 93 | 2.18 | 1.32–3.60 | 1.18 | 0.004 |
| TB negative: 905 | TB negative: 10,306 | |||||
| Eastern | TB positive: 75 | TB positive: 71 | 1.52 | 1.10–2.10 | 0.52 | 0.011 |
| TB negative: 4140 | TB negative: 6002 | |||||
| Northern | TB positive: 49 | TB positive: 66 | 1.74 | 1.21–2.51 | 0.74 | 0.003 |
| TB negative: 1805 | TB negative: 4286 | |||||
| Western | TB positive: 54 | TB positive: 39 | 2.04 | 1.35–3.06 | 1.04 | <0.001 |
| TB negative: 2217 | TB negative: 3301 |
Disclaimer/Publisher’s Note: The statements, opinions and data contained in all publications are solely those of the individual author(s) and contributor(s) and not of MDPI and/or the editor(s). MDPI and/or the editor(s) disclaim responsibility for any injury to people or property resulting from any ideas, methods, instructions or products referred to in the content. |
© 2026 by the authors. Licensee MDPI, Basel, Switzerland. This article is an open access article distributed under the terms and conditions of the Creative Commons Attribution (CC BY) license.
Share and Cite
Amanya, G.; Hashmi, S.; Stow, J.S.; Tumwesigye, P.; Nkhata, B.; Mubiru, K.R.; Budts, A.-L.; Potgieter, M.G.; Balcha, S.D.; Bamuloba, M.; et al. AI-Driven Tuberculosis Hotspot Mapping to Optimize Active Case-Finding: Implementing the Epi-Control Platform in Uganda. Trop. Med. Infect. Dis. 2026, 11, 36. https://doi.org/10.3390/tropicalmed11020036
Amanya G, Hashmi S, Stow JS, Tumwesigye P, Nkhata B, Mubiru KR, Budts A-L, Potgieter MG, Balcha SD, Bamuloba M, et al. AI-Driven Tuberculosis Hotspot Mapping to Optimize Active Case-Finding: Implementing the Epi-Control Platform in Uganda. Tropical Medicine and Infectious Disease. 2026; 11(2):36. https://doi.org/10.3390/tropicalmed11020036
Chicago/Turabian StyleAmanya, Geofrey, Sumbul Hashmi, Jessica Sarah Stow, Philip Tumwesigye, Bernadette Nkhata, Kelvin Roland Mubiru, Anne-Laure Budts, Matthys Gerhardus Potgieter, Seyoum Dejene Balcha, Muzamiru Bamuloba, and et al. 2026. "AI-Driven Tuberculosis Hotspot Mapping to Optimize Active Case-Finding: Implementing the Epi-Control Platform in Uganda" Tropical Medicine and Infectious Disease 11, no. 2: 36. https://doi.org/10.3390/tropicalmed11020036
APA StyleAmanya, G., Hashmi, S., Stow, J. S., Tumwesigye, P., Nkhata, B., Mubiru, K. R., Budts, A.-L., Potgieter, M. G., Balcha, S. D., Bamuloba, M., Zitho, A., Henry, L., Nabukenya-Mudiope, M. G., & Van Cauwelaert, C. (2026). AI-Driven Tuberculosis Hotspot Mapping to Optimize Active Case-Finding: Implementing the Epi-Control Platform in Uganda. Tropical Medicine and Infectious Disease, 11(2), 36. https://doi.org/10.3390/tropicalmed11020036