Article

Impact of Nutritional Counselling and Support on Body Mass Index Recovery and Treatment Outcomes Among Tuberculosis Patients in the Lao People’s Democratic Republic

by
Donekham Inthavong
1,
Hend Elsayed
2,
Phonesavanh Keonakhone
3,
Vilath Seevisay
4,
Somdeth Souksanh
4,
Sakhone Suthepmany
1,
Misouk Chanthavong
1,
Xaysomvang Keodavong
1,
Phonesavanh Kommanivanh
1,
Phitsada Siphanthong
1,
Phengsy Sengmany
3,
Buahome Sisounon
3,
Jacques Sebert
1,
Manami Yanagawa
5,
Fukushi Morishita
2,*,
Nobuyuki Nishikiori
6 and
Takuya Yamanaka
6
1
National Tuberculosis Control Centre, Vientiane 01160, Laos
2
Integrated Communicable Disease Control, World Health Organization Regional Office for the Western Pacific, Manila 1000, Philippines
3
National Nutrition Centre, Vientiane 01160, Laos
4
World Health Organization Country Office for Lao People’s Democratic Republic, Vientiane 01030, Laos
5
The Research Institute of Tuberculosis, Japan Anti-Tuberculosis Association, Tokyo 204-8533, Japan
6
Global Tuberculosis Programme, World Health Organization, 1211 Geneva, Switzerland
*
Author to whom correspondence should be addressed.
Trop. Med. Infect. Dis. 2025, 10(7), 198; https://doi.org/10.3390/tropicalmed10070198
Submission received: 30 April 2025 / Revised: 4 July 2025 / Accepted: 11 July 2025 / Published: 15 July 2025
(This article belongs to the Special Issue Tuberculosis Control in Africa and Asia)

Abstract

Tuberculosis (TB) and undernutrition are intricately linked, significantly impacting health outcomes. However, nutritional support for TB patients is not systematically implemented in Lao People’s Democratic Republic (Lao PDR). This study evaluated the effects of nutritional counselling and support on nutritional recovery and TB treatment outcomes. A longitudinal study involved 297 individuals with drug-susceptible TB, 39.4% of whom had a body mass index (BMI) below 18.5 kg/m2. Participants were divided into an observation group and an intervention group, the latter receiving nutritional support. Nutritional support included ready-to-use therapeutic food and therapeutic milk products, tailored to patients’ nutritional status. Data collection was conducted at four intervals during treatment. By the end of treatment, 84.3% of participants improved their nutritional status to a BMI of 18.5 kg/m2 or higher. The intervention group showed early nutritional recovery, particularly during the intensive phase of TB treatment, although the p-value (p = 0.067) should be interpreted with caution. The overall treatment success rate was high at 90.6%, with no significant difference between groups. Factors associated with treatment success included age under 45, HIV-negative status, a BMI of 18.5 kg/m2 or higher, and clinically diagnosed pulmonary TB. Further assessment is required for the operational feasibility to provide systematic nutritional assessment and counselling for people with TB in Lao PDR.

1. Introduction

Tuberculosis (TB) is a cause of mortality, long-term disability and poverty, and it continues to be a global public health issue [1]. The World Health Organization (WHO) estimated that 10.8 million people newly fell ill with TB in 2023, and reported the highest number of TB case diagnosed (8.2 million) since WHO began global TB monitoring in 1995 [2]. This increase in case notifications is largely attributed to intensified case-finding efforts by national TB programs in the post-COVID-19 period. Although estimated TB mortality continued to decrease after the COVID-19 pandemic, TB became once again the leading cause of death from a single infectious agent in 2023, surpassing COVID-19 [2,3,4,5].
Undernutrition is frequently observed in people with TB and is recognized as a significant risk factor for active TB disease [6]. The relationship between TB and undernutrition is complex and bidirectional [7,8]. Undernutrition leads to an increased risk of developing active TB, with evidence suggesting that each unit increase body mass index (BMI) corresponds to a 13.8% reduction in the incidence of active TB [9]. Conversely, TB can contribute to undernutrition, as people with TB often suffer from reduced appetite and weight loss due to the metabolic changes associated with TB treatment [9,10,11,12,13]. A recent Cochrane review showed that undernutrition likely increases the risk of TB two-fold [14]. Recognizing the critical role of nutritional management in TB care, the WHO recommends that all people with TB receive nutritional assessment and receive appropriate nutritional counselling and care when needed, in line with general standards for the management of undernutrition [15,16].
Undernutrition not only increases the risk of active TB disease but also magnifies the severity of the disease and worsens the treatment outcomes, including increasing mortality rates [13,17,18,19]. The impact of undernutrition on TB treatment outcomes is particularly concerning. Studies have consistently shown that people with concurrent TB and undernutrition face higher risks of unfavorable TB treatment outcomes, including death [20,21,22,23]. This association is particularly pronounced in the context of drug-resistant TB (DR-TB) [10,24].
In Lao People’s Democratic Republic (Lao PDR), despite a steady annual decline in TB incidence since 2000, the rate remained high in 2023 at 132 cases per 100,000 population, surpassing both the WHO Western Pacific Region average and the global estimate [2,3]. TB treatment coverage (notified cases divided by estimated incidence) improved markedly from 37% in 2015 to 90% in 2023, driven by the scale-up of rapid molecular testing at diagnosis and active case finding in high-risk populations. However, TB prevalence among people screened remains high in certain localities, particularly in closed settings and remote areas with limited access to health services.
The country’s National Plan of Action on Nutrition 2021–2025 includes strategic objectives to prevent TB-related undernutrition [25]. However, systematic nutritional assessments and counselling are not routinely provided to people with TB, partly due to absence of national guidelines. Food support, previously offered as small daily incentives for TB patients, was discontinued over a decade ago due to limited resources. In addition, routine TB surveillance does not capture comprehensive data on nutritional status, such as weight, height and BMI. This study aimed to assess the impact of nutritional counselling and support on the recovery of nutritional status during TB treatment and on TB treatment outcomes.

2. Materials and Methods

2.1. Study Setting

Lao PDR is a lower-middle-income country with a population of approximately 7.7 million, the majority of whom reside in rural areas. The country has made significant strides in socio-economic development, particularly in poverty reduction and access to basic services. However, undernutrition remains a major public health concern, with 5.4% of the population undernourished [26], 24% of children under five classified as underweight and one-third experiencing stunting [27,28]. National nutrition priorities in Lao PDR are outlined in the National Socio-Economic Development Plan and the health sector reform strategy to achieve Universal Health Coverage [29,30]. These frameworks emphasize improving access to quality health and nutrition services for vulnerable populations, including through outreach services that integrate TB, HIV, and maternal and child health care.
Lao PDR also bears a high burden of TB with an incidence of 132 per 100,000 in 2023 [2]. TB diagnosis and treatment are provided for free of charge by the Lao National TB Programme (NTP) and the national health insurance (NHI) scheme. Social support equivalent to approximately USD 5 per day is provided by the NTP only for people with DR-TB [31]. In 2018–2019, Lao NTP conducted a national survey of costs incurred by people with TB and their households (national TB household cost survey) using the WHO recommended methods [32]. The survey recommended a wide range of policy interventions to minimize costs incurred by TB affected households. One of the recommendations is to improve nutritional support for TB patients including systematic nutrition assessment, counselling, and therapeutic and supplementary feeding for those in need, in coordination with the national nutrition centre and in line with the national nutrition strategy [31].

2.2. Study Design

This study was nested in a larger study assessing the impact of nutritional counselling and support on TB treatment outcomes and the financial burden due to TB. The description of the intervention is available elsewhere [33,34]. As a secondary objective, this study aimed to evaluate the effect of nutritional counselling and support on the early recovery of BMI during TB treatment, as well as its impact on TB treatment outcomes.
The study was conducted in six central and provincial hospitals, purposively selected based on operational feasibility and high TB case notification volumes (Supplementary Text S1). To account for site-wise differences in TB caseload, the sample size was allocated using a probability proportional to size (PPS) approach, based on the total number of notified TB cases in 2022. A total of 312 people with TB were enrolled in the larger study, corresponding to the planned sample size required to achieve 80% power to detect a minimum of 12.6% reduction in the proportion of TB-affected households facing catastrophic total costs due to TB, as estimated from the results of the national TB patient cost survey [31,35]. For this study, only people with drug-susceptible TB was included in the analysis.
The nutritional interventions of this study were provided by trained dieticians who were hired by the national nutrition programme of the Lao Ministry of Health. Eligible patients received either therapeutic milk products (F-75 and F-100) or ready-to-use therapeutic food (RUTF) such as Plumpy’Nut according to their clinical assessment. Study participants with very severe undernutrition (BMI ≤ 16.5 in adults or the mid-upper arm circumference (MUAC) < 11.5 cm in children) who had medical complication and/or no/poor appetite were provided with therapeutic milk products (F-75 and F-100) based on national guidelines on Integrated Management of Acute Malnutrition (IMAM) until they could receive RUTF. RUTF was provided from the start for participants who had a good appetite with severe malnutrition (BMI ≤ 16.5 in adults or MUAC < 11.5 cm in children) until they recovered to the level of BMI ≥ 16.5 in adults or MUAC ≥ 11.5 cm and < 12.5 cm in children. The necessary amount was calculated based on daily calorie intake per patient’s weight—40 kcal/kg/day. Given one package of RUTF has 500 kcal/package, for a patient with body weight of 60 kg, the necessary amount was four packages (fraction rounded down). For the patients getting to moderate malnutrition level (16.5 < BMI ≤ 18.5 in adult or MUAC ≥ 11.5 cm and < 12.5 cm in children), we maintained provision of micronutrients as a supplement or one package of Plumpy’Nut per day until recovery of BMI to the level of ≥ 18.5 in adults or MUAC ≥ 12.5 cm in children, after which we only provided nutritional monitoring and counselling. Nutritional supplements were distributed during routine drug pick-up or DOTS visits. Clinical dieticians provided repeated counselling to reinforce adherence and explain the role of supplementation in recovery. For the observation group, only standard TB care was provided, including general health education. Additional information on the intervention is provided in Supplementary Text S2.

2.3. Data Collection

Data collection items include (1) demographic information, e.g., age, sex, education, marital status, household size, employment status, and insurance status; (2) clinical information, e.g., mode of TB diagnosis, previous TB history, HIV status, smoking/alcohol behavior, drug use, and other comorbidities; (3) nutritional assessment, e.g., weight, height, BMI, and current appetite; and (4) TB treatment outcome at four time points, at approximately every two months during treatment. Anthropometric data were measured using standardized weight and height scales. We collected the data of BMI, self-reported weight and appetite changes at four standardized time points: (1) at time of TB diagnosis and starting TB treatment, (2) at the end of the TB treatment intensive phase, (3) during the middle, and (4) at the end of the TB treatment continuation phase. These follow-up assessments were conducted during routine TB care visits and were identical in timing and frequency for both the observation and intervention groups.
Clinical dieticians assigned at each study site served as interviewers for participant recruitment. Prior to being deployed to each study site, clinical dieticians received a 5-day training course on the study objectives, methods, and data collection tools. In addition to this, we conducted a 5-day pilot data collection to familiarize them with the process. During participants’ enrolment, clinical dieticians explained the purpose of the study and shared a written information sheet, in relevant local languages. Those who agreed to participate in the research and signed the informed consent form were enrolled. The data collection was conducted via in-person interviews at study sites, and the interview time was around 30–45 min.
This study used a non-randomized before-and-after design. Participants enrolled during the first three months were assigned to the observation group, and those enrolled during the subsequent three months were assigned to the intervention group. This sequential enrolment approach was used to reduce selection bias. Data were collected and entered at the time of interviews using tablet-based questionnaires with Ona and Open Data Kit (ODK) collect. Participant enrolment and data collection commenced on 10 January 2023, and all follow-up interviews were completed by 25 January 2024.

2.4. Data Analysis

Data cleaning and processing, statistical analyses, and data visualizations were performed using R4.4.1 software (CRAN: Comprehensive R Archive Network). For continuous data, descriptive statistics included mean with standard deviation (SD) and 95% confidence interval (CI), and median with interquartile range (IQR). Categorical data were presented as frequencies with proportion (%). A cut-off of BMI 18.5 kg/m2 was used to define undernutrition at the time of TB diagnosis (BMI < 18.5 kg/m2 categorized as undernutrition) [36,37]. Statistical differences between people with and without a low BMI were tested using a chi-square test for categorical data and either the t-test or Kruskal–Wallis test for continuous data. Statistical significance was defined as a p-value less than 0.05. Additionally, to assess the impact of the nutritional intervention on BMI recovery over the course of TB treatment, we fitted a linear mixed-effects model with BMI as the outcome, and treatment phase, study group (intervention vs. observation), and their interaction as fixed effects. Patient-level random intercepts were included to account for repeated BMI measures. Participants were included in the analysis up to the point of death, loss to follow-up, or withdrawal. Data collected prior to these events were retained, and no imputation was performed for missing values. Univariate logistic regression analysis was conducted to identify variables associated with undernutrition. Multivariate backward stepwise logistic regression was performed to identify the best model based on the Akaike information criterion. The selected final model was used for multivariate logistic regression analysis to calculate AOR and 95% CI.

2.5. Ethical Considerations
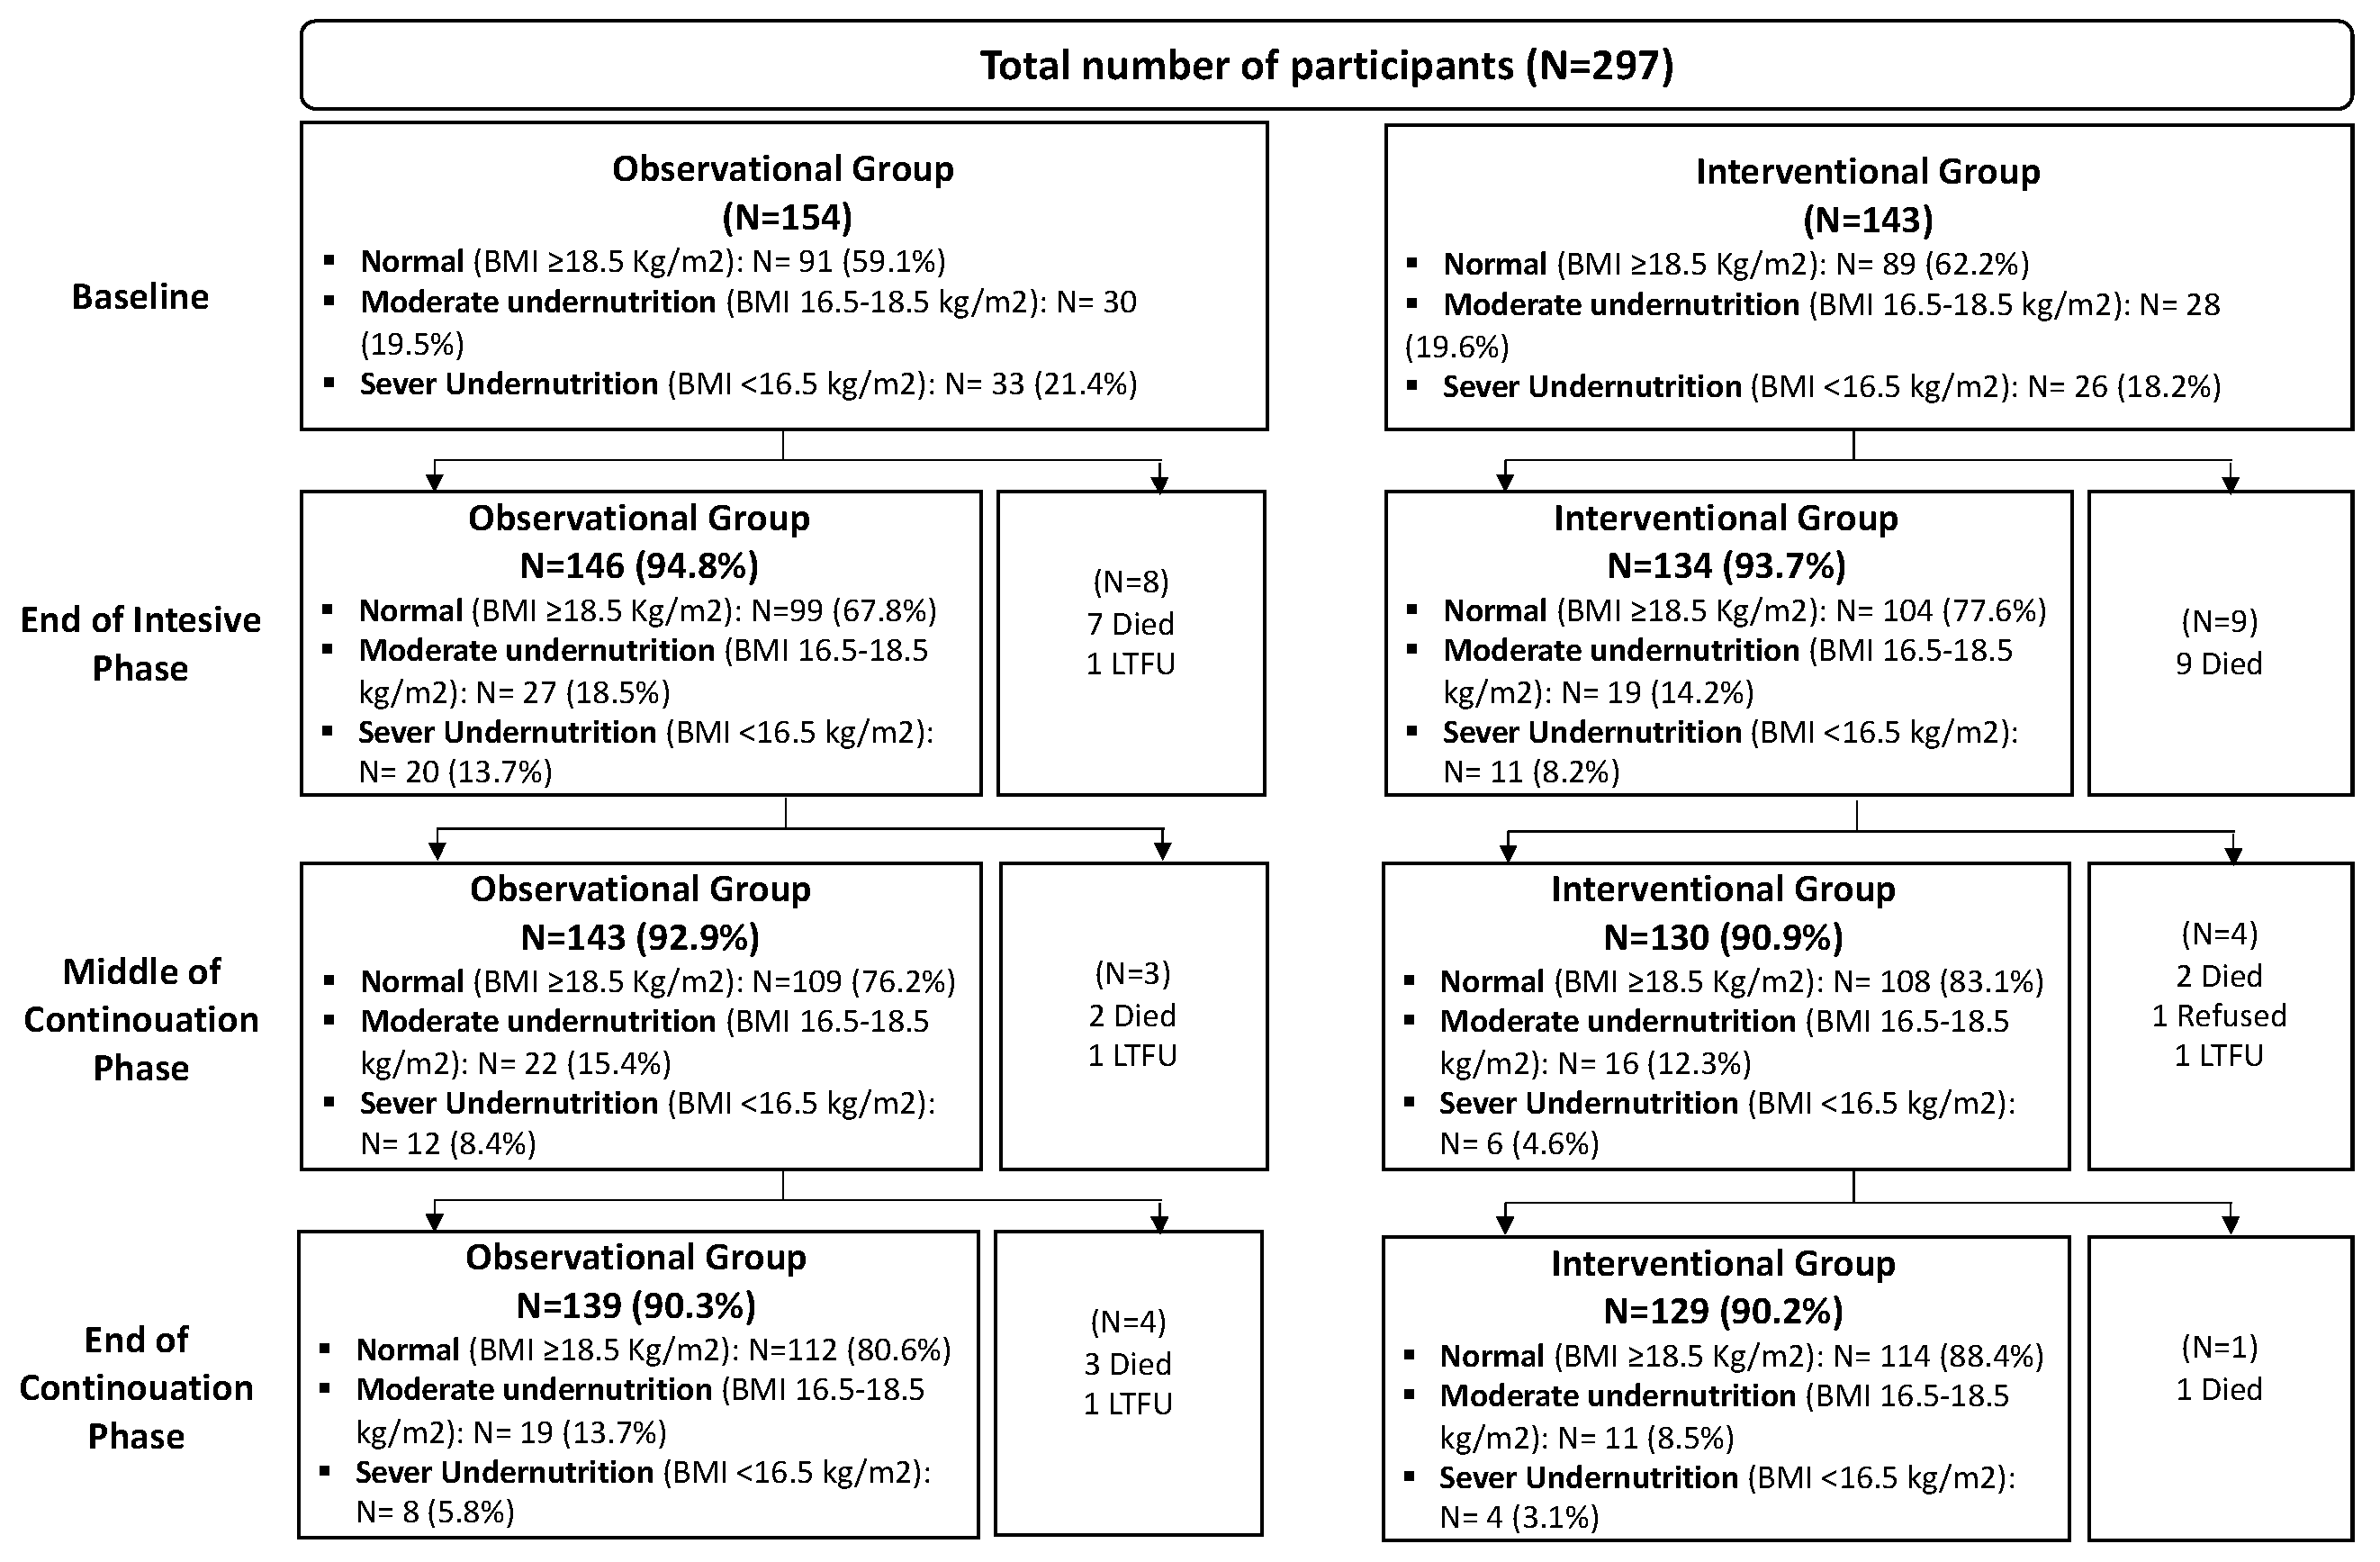
A written consent form was obtained from each participant prior to enrolment, explicitly stating that only the principal investigator (PI) and co-PIs were able to access the study dataset. Prior to obtaining a written informed consent, data collectors explained the purpose of this research with a written information sheet at each study site. Each participant’s voluntary will to continue participating in this study was also asked and confirmed at each data collection. Ethics approvals were also obtained from the Lao PDR National Ethics Committee for Health Research (Ref: 021/NECHR) and the Ethics Review Committee of the WHO Regional Office for the Western Pacific (Ref: 2022.3.LAO.1.ETB). Additionally, we obtained permission/endorsement from NTP and the department of disease control of Lao PDR Ministry of Health as well as from the hospital director of each study site, to conduct the data collection.

3. Results

A total of 297 participants were enrolled in the study, with 154 in the observational group and 143 in the interventional group. Reasons for not completing four data collections included death (N = 24), loss-to-follow-up (N = 4) and refusal to continue the study participation (N = 1) (Figure 1).

3.1. Demographic and Clinical Characteristics

The mean age of participants was 48.3 years, and 10.1% had no formal education. Overall, 54.5% were covered by NHI and 36.4% reported no insurance (Table 1). Employment status showed a statistically significant difference between groups, as more participants in the intervention group were engaged in informal paid work compared to the observation group (51.7%) (p = 0.038). Half of the participants had smoking experience (40.1% were ex-smokers and 9.8% were current smokers), and the majority (71.4%) reported rarely or never consuming alcohol.
The majority of the TB cases (71.4%) were pulmonary TB with bacteriological confirmation. HIV status was predominantly negative (85.9%). Half of all participants experienced a diagnostic delay of more than 4 weeks from the onset of TB symptoms. This delay was slightly more prevalent in the observation group (53.2%) compared to the intervention group (44.8%), although the difference was not statistically significant (p = 0.178). Further comparisons by the status of completion of the four data collections are available in Supplementary Table S1. Data obtained from those who completed all four data collections (N = 268) were used as the basis for the analysis of the prevalence of undernutrition to ensure consistency in longitudinal comparisons.

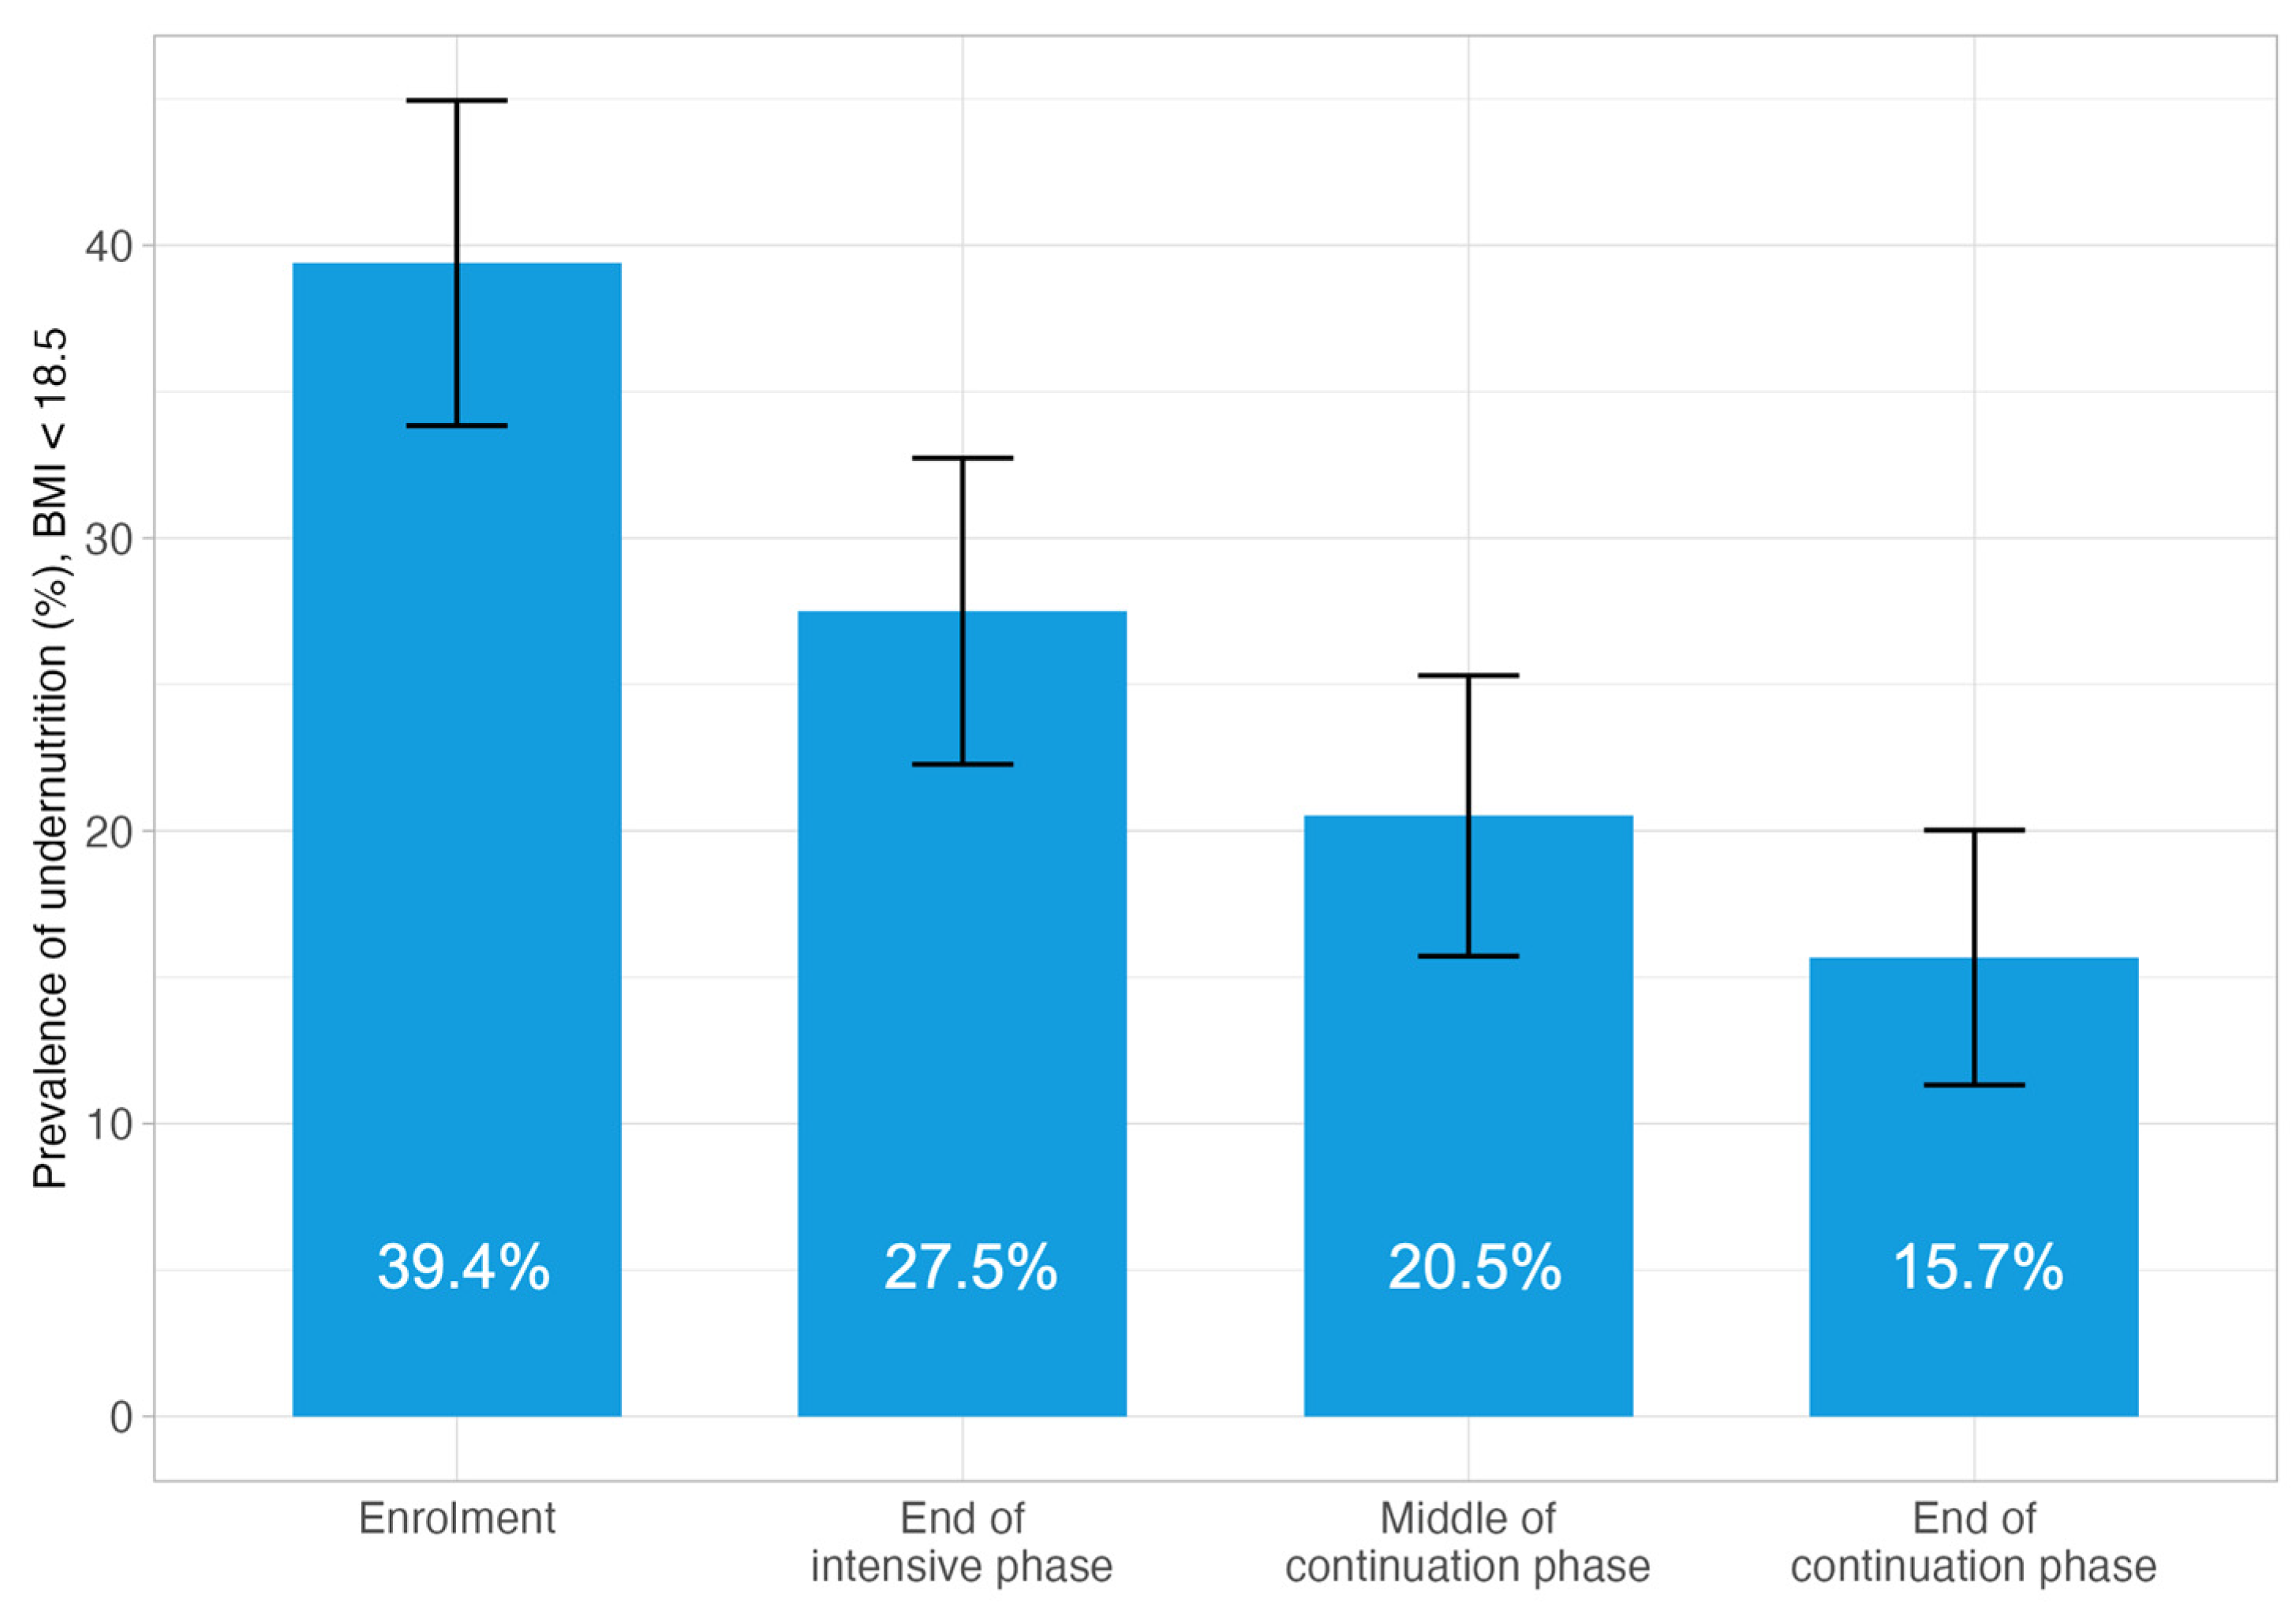
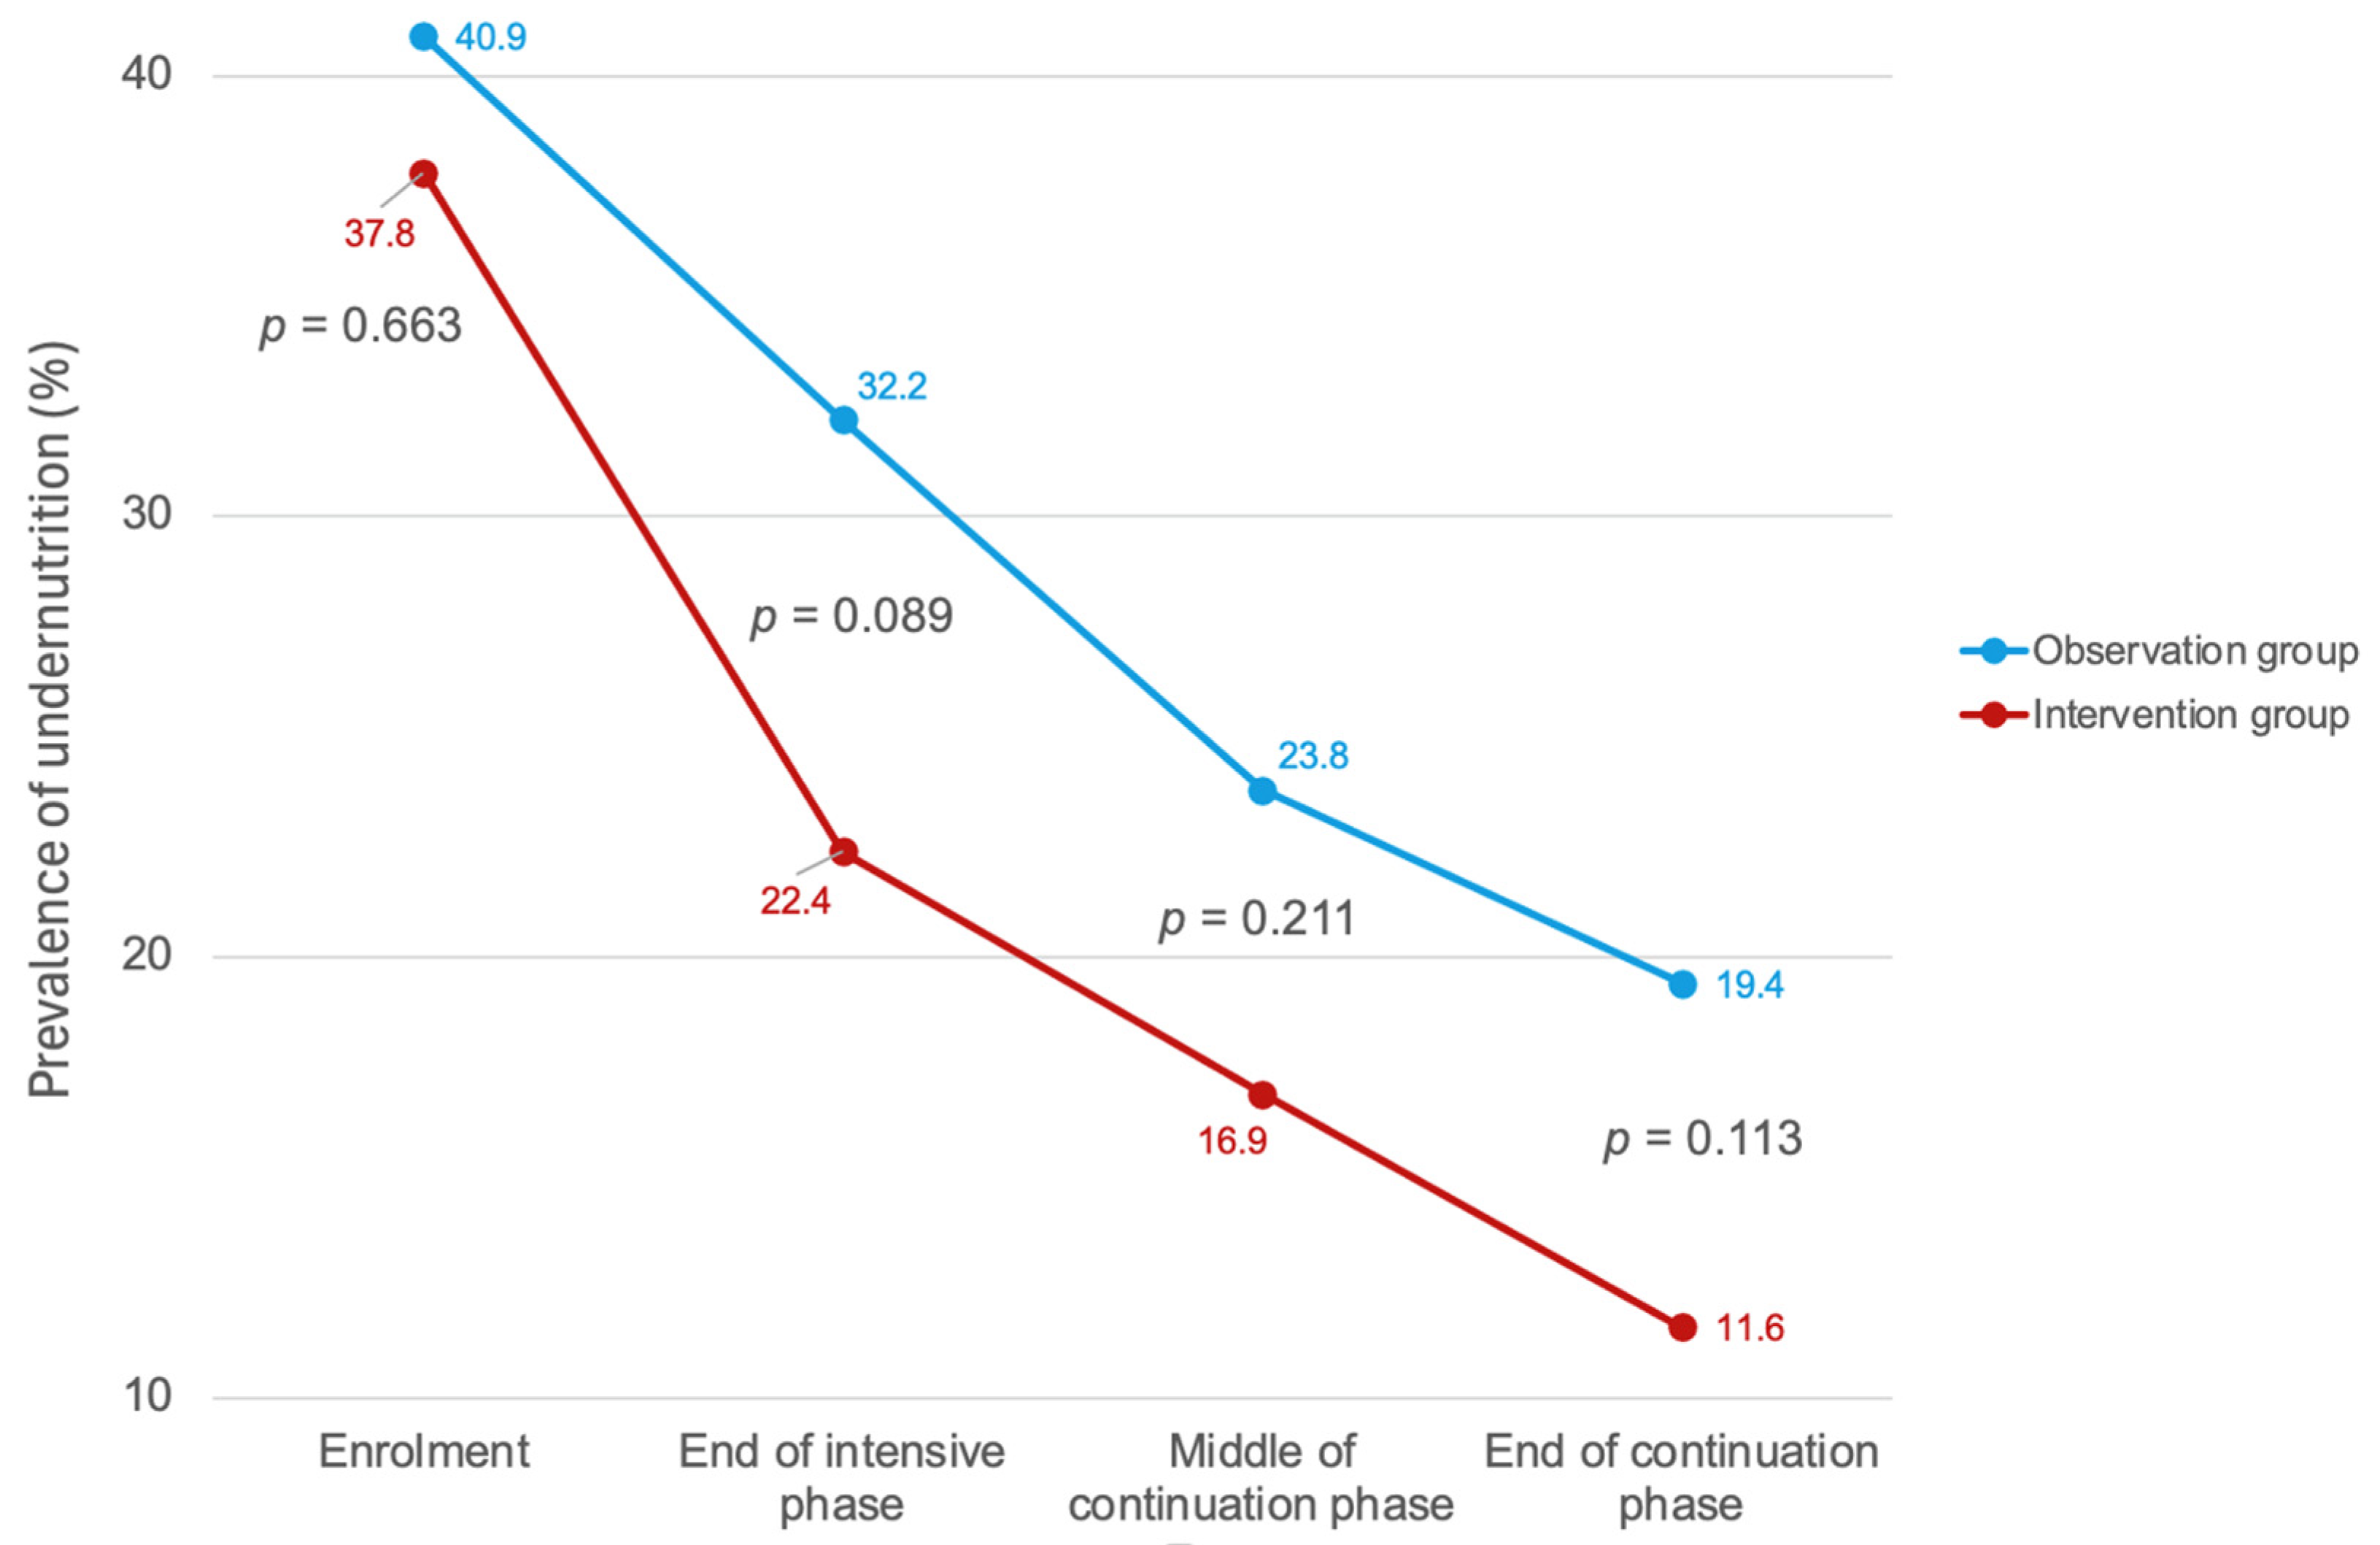
3.2. Changes in BMI During TB Treatment

At the TB diagnosis, the mean BMI for all participants was 19.7 (SD 3.6), and it recovered to 20.5 (SD 3.5) at the end of the TB intensive phase, 21.2 (SD 3.3) and 21.7 (SD 3.3) at the midpoint and endpoint of the TB continuation phase (Supplementary Table S2). Overall, the proportion of the study participants with BMI < 18.5 was 39.4%, and in line with the improvement in the mean BMI, the proportion reduced to 27.5% at the end of the TB intensive phase, and further to 20.5% and 15.7% at the midpoint and endpoint of the TB continuation phase (Figure 2).
Comparing the proportion of the study participants with BMI < 18.5 in two groups, at the TB diagnosis, there was no significant difference between groups (40.9% in the observation group vs. 37.8% in the intervention group, p = 0.663) (Figure 3 and Table 2). At the end of the TB intensive phase, the intervention group showed a greater reduction in the proportion with BMI < 18.5, dropping to 22.4%, compared to 32.2% in the observation group (p = 0.089). This trend continued toward the end of the continuation phase; the proportion further decreased to 19.4% in the observation group and 11.6% in the intervention group, again with no significant difference observed (p = 0.113) (Figure 3 and Table 2).
The linear mixed-effects model showed a significant increase in BMI over time in both study groups. However, there was no statistically significant difference in BMI between the intervention and observation groups at any time point, as indicated by the non-significant group main effect (p = 0.51) and non-significant interaction terms (p > 0.1 for all time points). (Supplementary Table S3).

3.3. TB Treatment Outcomes

The proportion of participants achieving treatment success was high at 90.6%, with no significant difference between two groups, with 139 (90.3%) in the observation group and 130 (90.9%) in the intervention group (p = 0.639). Death occurred in 12 participants (7.8%) in the observation group and 12 participants (8.4%) in the intervention group, representing an overall death rate of 8.1% (N = 24). Similarly, the number of participants lost to follow-up (LTFU) was low, with three (1.9%) in the observation group and one (0.6%) in the intervention group, for a combined LTFU rate of 1.3% (Table 3).
A univariate logistic regression showed that providing nutritional counselling and support was not associated with TB treatment success (OR = 1.08, p = 0.848). Multivariate logistic regression identified other factors associated with a higher TB treatment success rate: age group 0–44 years compared to 65 years or more (AOR = 4.26, p = 0.031), HIV-negative compared to HIV-positive (AOR = 9.49, 95% CI: 2.83–34.67, p < 0.001), clinically diagnosed pulmonary TB to bacteriologically confirmed cases (AOR = 3.26, p = 0.060), female compared to male (AOR = 2.30, p = 0.094) and BMI ≥ 18.5 at TB diagnosis compared to BMI <18.5 (AOR = 1.85, p = 0.153) (Table 4). Factors associated with deaths due to TB were presented in Supplementary Table S4.

4. Discussion

Undernutrition is known as a risk factor of active TB disease and also of unfavorable TB treatment outcomes, including increased TB mortality [13,17,18,19]. This study observed a trend suggesting that the nutritional counselling and support may have contributed to early BMI recovery among people with TB. At enrolment, 39.4% of the participants were classified as undernourished, which decreased to 27.5% by the end of the intensive treatment phase. This trend continued through the middle of the continuation phase, where the prevalence of undernutrition further declined to 20.5%, and reached its lowest point at the end of the continuation phase at 15.7%. These results indicate a progressive improvement in nutritional status over the course of TB treatment. The most notable reduction in undernutrition occurred between enrolment and the intensive phase. However, this did not translate into significant differences in TB treatment outcomes, due to the limitation of study sample size.
A recent meta-analysis revealed that people with TB and undernutrition face an increased likelihood of unfavorable treatment outcomes (AOR = 1.7, 95% CI: 1.4–1.9), a higher risk of mortality (AOR = 3.1, 95% CI: 2.4–3.9), and an elevated chance of treatment failure or recurrence (AOR = 1.6, 95% CI: 1.2–2.0) compared to those with adequate nutritional status [38]. A retrospective cohort study conducted in Taiwan indicated that undernutrition was a significant predictor of all causes of TB mortality (AOR = 2.22, 95% CI, 1.45–3.40) [39]. These findings from previous studies underscore the potential importance of early BMI improvement in enhancing TB treatment outcomes.
Another systematic review found that nutritional support was associated with improved treatment adherence in five out of eight studies which reflect positively on treatment outcomes [40]. A retrospective cohort study in India demonstrated significantly improved treatment outcomes in people with TB who received nutritional supplementation. The cure rate was substantially higher in the intervention group (74.7% vs. 50.9%) (OR = 2.86, 95% CI: 2.26–3.61, p < 0.001), and mortality was significantly reduced (1.1% vs. 5.7%) (OR = 0.18, 95% CI: 0.08–0.41, p < 0.001) [41]. Similarly, a large cohort study in India demonstrated that patients who gained at least 5% of their baseline weight in the first 2 months of treatment had a 61% reduced hazard of death (adjusted hazard ratio 0.39, 95% CI: 0.18–0.86) [10]. Although this study was not able to detect a significant difference in TB treatment outcomes between the observation and intervention groups, the observed trend of early BMI recovery and supporting evidence from other settings underscore the potential value of integrating nutritional support into TB care.
To further explore this finding, we examined subgroup characteristics and potential confounding factors. Although the prevalence of undernutrition (BMI < 18.5 kg/m2) at TB diagnosis was slightly lower in the intervention group (37.8% vs. 40.9%), the death rate among participants with undernutrition was higher (14.8% vs. 9.4%). The intervention group also had a slightly higher proportion of individuals with known risk factors for TB mortality, including males (67.8% vs. 57.1%), HIV-positive status (15.4% vs. 12.3%), and current or former smokers (53.9% vs. 48.1%). Notably, half of the deaths in the intervention group (N = 6/12) occurred among HIV-positive individuals, compared to 25% (N = 3/12) in the observation group. These differences may reflect the influence of limited sample size and sequential enrollment, which can increase variability and lead to imbalances in baseline characteristics. Such confounding factors may have attenuated the observed impact of nutritional support on treatment success.
This study contributes to addressing a critical knowledge gap in Lao PDR by exploring the potential effects of nutritional interventions on TB treatment outcomes. Based on the observed trends and existing evidence from other settings, it may be beneficial for the Lao NTP to consider piloting systematic nutritional assessments for people diagnosed with TB and exploring options for integrating this data into the digital case-based surveillance system. While the study showed promising trends in nutritional improvement, especially during the intensive phase, future research with larger sample sizes and longer follow-up periods is needed to measure the impact of nutritional interventions on TB treatment outcomes. Meanwhile, continued monitoring of TB treatment outcomes, particularly among older adults, people living with HIV, and people with low BMI at diagnosis, through the real-time case-based TB information system (TB tracker) remains an important component of programmatic surveillance.
Our study found that younger individuals (<45 years) had significantly higher treatment success rates compared to older adults (≥65 years) (AOR = 4.26, 95% CI: 1.17–17.1, p = 0.031). This aligns with findings from a study done in eastern Ethiopia, which reported that patients aged 46–54 years had 10.4 times higher odds of unsuccessful treatment outcomes compared to younger people (AOR = 10.41, 95% CI: 1.86–58.30) [42]. Another study in Zambia found that patients aged ≥ 65 years had 72.4% lower odds of treatment success compared to those aged 15–24 years (OR = 0.276, 95% CI: 0.086–0.881, p = 0.030) [43]. A meta-analysis found that patients younger than 65 years were twice as likely to succeed in treatment (OR = 2.0, 95% CI: 1.7–2.4) [44]. A study in Lesotho showed that the odds of successful TB treatment outcome were higher for the 20–24 years age group (88.2% vs. 65.3%, OR = 3.98, 95% CI: 1.42–11.22, p = 0.009) and 55–59 years (91.7% vs. 65.3%, OR = 5.84, 95% CI: 1.56–21.88, p = 0.009), compared to ≥ 65 years age group [45]. The consistency across these studies highlights age as a key factor influencing TB treatment outcomes. Younger individuals may achieve higher success rates due to factors such as stronger immune systems [46], fewer comorbidities [47], better adherence to treatment, and greater tolerance to medication side effects [46].
The strong association between HIV-negative status and treatment success (AOR = 9.49, 95% CI: 2.83–34.67, p < 0.001) in our study is supported by a study in Thailand reported that people with TB-HIV-positive had 3.1 times higher risk of unsuccessful treatment outcomes compared to HIV-negative patients [48]. A study in South Africa found that HIV-negative individuals had nearly five times greater odds of having a successful TB treatment outcome compared to HIV-positive (OR = 4.98, 95% CI: 2.07–11.25) [49]. This trend is further corroborated by a study in Addis Ababa, Ethiopia, which found that HIV-positive TB patients had 2.7 times higher odds of unsuccessful treatment outcomes [42]. The consistency of these findings across different geographical locations underscores the need for differentiated care models tailored to the specific needs of TB–HIV co-infected individuals. Integrated TB–HIV services, enhanced clinical monitoring, and targeted nutritional and psychosocial support may be critical to improving outcomes in this high-risk population.
Although not statistically significant, our study observed a trend suggesting that people with higher BMI at the time of TB diagnosis may experience better treatment outcomes (92.8% vs. 87.2%, AOR = 1.85, p = 0.153). This trend aligns with findings from a study in Ethiopia, which demonstrated that patients with a BMI ≥ 18.5 kg/m2 at treatment initiation had 2.15 times higher odds of treatment success (AOR = 2.15, 95% CI: 1.05–4.39), with a success probability of 92.9% compared to 86.5% for those with a BMI < 18.5 kg/m2 [40]. Similarly, a study in South Korea found that normal or overweight patients had three times higher odds of successful treatment outcomes versus those who were underweight (OR = 0.33, 95% CI:  0.20–0.54) [50]. Patients with higher BMIs may benefit from a stronger immune function [51], improved drug metabolism [40], and greater physical strength [38], contributing to more favorable TB treatment outcomes.
Although smoking and alcohol use are known to influence TB treatment outcomes [52,53], our study did not find statistically significant associations between these behaviors and treatment success. The prevalence of current smoking in our sample was slightly lower than national estimates, which may reflect behavior change following TB symptom onset or diagnosis. While we believe underreporting was minimized through careful questionnaire design and interviewer training, some degree of social desirability bias cannot be ruled out. Additionally, the lack of statistical significance may be due to the limited sample size in this study. TB treatment outcomes are influenced by a complex interplay of factors, including medication adherence, socioeconomic conditions, and comorbidities, which may have confounded or masked the effect of the nutritional intervention.
This study has several limitations. First, the limited sample size and the suboptimal intensity and design of the intervention may have constrained the ability to detect statistically significant differences in BMI and TB treatment outcomes between the intervention and observation groups. The current analysis focuses on a secondary objective of the broader study; therefore, the sample size was not specifically powered for comparisons related to nutritional recovery or treatment outcomes. Additionally, approximately 60% of participants in both study groups had a BMI ≥ 18.5 kg/m2 at enrolment and thus did not receive supplementary or therapeutic feeding. This likely diluted the measurable impact of the intervention. We also acknowledge that some participants in the observation group may have received informal nutritional advice from data collectors who were trained clinical dieticians. This was not part of the planned intervention but may have occurred naturally during interactions at the study sites. Such instances could have contributed to a narrowing of the difference between the two groups. These findings suggest the need for future studies with larger sample sizes and more intensive or personalized nutritional support strategies, particularly targeting individuals with moderate or severe undernutrition. In addition, identifying and promoting the use of nutritious, locally available foods could enhance the sustainability and cultural acceptability of nutritional interventions, particularly in rural or resource-constrained settings.
Second, the study was conducted in purposively selected central and provincial hospitals, which limits the generalizability of the findings. Health facilities in rural areas where undernutrition is often more prevalent [54,55] were not included. A nationwide intervention study would be required to comprehensively assess the association between nutritional support and TB treatment outcomes across diverse settings. Scaling up such an initiative would require strategic discussions at the national and provincial levels on the integration of a monitoring mechanism of nutritional status of people with TB into routine TB surveillance systems.
Third, this study did not include people with DR-TB due to the limited number of cases notified in the country. Since people with DR-TB are more likely to experience undernutrition and have lower TB treatment success rates, future national and subnational policies addressing TB-related undernutrition should explicitly include this population [33,56].

5. Conclusions

This study was the first in Lao PDR to assess the impact of nutritional counselling and support on early recovery of BMI during TB treatment and on TB treatment success rate. We observed a trend suggesting that the nutritional counselling and support may have contributed to early BMI recovery, particularly during the intensive phase of TB treatment. However, this did not translate into statistically significant differences in TB treatment outcomes, possibly due to limitations in sample size and intervention intensity. While these findings do not yet provide definitive evidence to support nationwide scale-up, they offer important operational insights and highlight the potential value of integrating nutrition into TB care. Further assessment is required to confirm the impact of such interventions on clinical outcomes at scale and to evaluate their operational feasibility and scalability in the Lao PDR context.

Supplementary Materials

The following supporting information can be downloaded at https://www.mdpi.com/article/10.3390/tropicalmed10070198/s1, Text S1: Additional information on study design; Text S2: Additional information on the intervention; Table S1: Demographic and clinical characteristics of study participants, by status of the completion of data collection; Table S2: Body mass index at four-time points of data collection, by study group; Table S3: Results of linear mixed-effect model assessing BMI change over TB treatment phases, by study group; Table S4: Factors associated with deaths due to TB.

Author Contributions

Conceptualization, D.I., P.K. (Phonesavanh Keonakhone), N.N. and T.Y.; methodology, N.N. and T.Y.; data validation and curation, H.E. and S.S. (Somdeth Souksanh); formal analysis, H.E. and T.Y.; investigation, D.I., P.K. (Phonesavanh Keonakhone), V.S., S.S. (Somdeth Souksanh), S.S. (Sakhone Suthepmany), M.C., X.K., P.K. (Phonesavanh Kommanivanh), P.S. (Phitsada Siphanthong), P.S. (Phengsy Sengmany), B.S. and J.S.; writing—original draft preparation, H.E. and T.Y.; writing—review and editing, F.M. and J.S.; supervision, T.Y., H.E., V.S., J.S., D.I. and P.K. (Phonesavanh Keonakhone); funding acquisition, F.M. and M.Y. All authors have read and agreed to the published version of the manuscript.

Funding

This study was funded by the Government of the Republic of Korea through the Korean Disease Control and Prevention Agency and the Government of Japan through the Ministry of Health, Labour and Welfare.

Institutional Review Board Statement

This study was approved by the Lao PDR National Ethics Committee for Health Research (Ref: 021/NECHR) (approval date: 10 March 2022) and the Ethics Review Committee of the WHO Regional Office for the Western Pacific (Ref: 2022.3.LAO.1.ETB) (approval date: 4 March 2022).

Informed Consent Statement

Informed consent was obtained from all subjects involved in the study.

Data Availability Statement

The study dataset contains privacy-sensitive information including participants’ individual and household income that formed a core part of the analysis. Even though we removed patients’ identifiers such as patient number and name, there is still a possibility that those who are familiar with the project sites and beneficiaries may be able to identify participants and their households. The informed consent signed by all participants explicitly mentioned that only the research team have access to the dataset. Due to such ethical and confidentiality restrictions, the survey dataset will be made available only upon request and with permission from the National Tuberculosis Control Programme (NTP), Ministry of Health, Lao PDR. All interested researchers may contact the NTP of Lao PDR (ndonekham@gmail.com and phonesavanh_33@hotmail.com), and/or, for non-author contact, the WHO/WPRO ERC (wproethicsreviewcomm@wpro.who.int).

Acknowledgments

We first would like to thank study participants and their household members who consented to participate in this study. Also, we acknowledge the contribution of clinical dieticians, medical doctors, nurses who participated in the training sessions and contributed to data collections in study sites.

Conflicts of Interest

The authors declare no conflicts of interest. The funders had no role in the design of the study, in the collection, analyses, or interpretation of data, in the writing of the manuscript, or in the decision to publish the results. V.S., F.M. and T.Y. are staff members of WHO. The authors alone are responsible for the views expressed in this publication and they do not necessarily represent the decisions or policies of WHO.

References

  1. Portnoy, A.; Yamanaka, T.; Nguhiu, P.; Nishikiori, N.; Baena, I.G.; Floyd, K.; A Menzies, N. Costs incurred by people receiving tuberculosis treatment in low-income and middle-income countries: A meta-regression analysis. Lancet Glob. Health 2023, 11, e1640–e1647. [Google Scholar] [CrossRef]
  2. World Health Organization. Global Tuberculosis Report 2024; World Health Organization: Geneva, Switzerland, 2024. [Google Scholar]
  3. World Health Organization. Global Tuberculosis Report 2023; World Health Organization: Geneva, Switzerland, 2023. [Google Scholar]
  4. WHO Report Shows Global Tuberculosis Cases Are Rising [Internet]. 2024. Available online: https://www.cidrap.umn.edu/tuberculosis/who-report-shows-global-tuberculosis-cases-are-rising (accessed on 30 April 2025).
  5. Global Fund. Tuberculosis; Global Fund: Geneva, Switzerland, 2024. [Google Scholar]
  6. Sinha, P.; Ponnuraja, C.; Gupte, N.; Babu, S.P.; Cox, S.R.; Sarkar, S.; Mave, V.; Paradkar, M.; Cintron, C.; Govindarajan, S.; et al. Impact of Undernutrition on Tuberculosis Treatment Outcomes in India: A Multicenter, Prospective, Cohort Analysis. Clin. Infect. Dis. 2023, 76, 1483–1491. [Google Scholar] [CrossRef] [PubMed] [PubMed Central]
  7. Dauphinais, M.R.; Koura, K.G.; Narasimhan, P.B.; Mehta, S.; Finkelstein, J.L.; Heysell, S.K.; Sinha, P. Nutritionally acquired immunodeficiency must be addressed with the same urgency as HIV to end tuberculosis. BMC Glob. Public. Health 2024, 2, 4. [Google Scholar] [CrossRef] [PubMed] [PubMed Central]
  8. Scrimshaw, N.S.; SanGiovanni, J.P. Synergism of nutrition, infection, and immunity: An overview. Am. J. Clin. Nutr. 1997, 66, 464S–477S. [Google Scholar] [CrossRef] [PubMed]
  9. Lonnroth, K.; Williams, B.G.; Cegielski, P.; Dye, C. A consistent log-linear relationship between tuberculosis incidence and body mass index. Int. J. Epidemiol. 2010, 39, 149–155. [Google Scholar] [CrossRef] [PubMed]
  10. Bhargava, A.; Bhargava, M.; Meher, A.; Teja, G.S.; Velayutham, B.; Watson, B.; Benedetti, A.; Barik, G.; Singh, V.P.; Singh, D.; et al. Nutritional support for adult patients with microbiologically confirmed pulmonary tuberculosis: Outcomes in a programmatic cohort nested within the RATIONS trial in Jharkhand, India. Lancet Glob. Health 2023, 11, e1402–e1411. [Google Scholar] [CrossRef] [PubMed]
  11. Darnton-Hill, I.; Mandal, P.P.; de Silva, A.; Bhatia, V.; Sharma, M. Opportunities to prevent and manage undernutrition to amplify efforts to end TB. Int. J. Tuberc. Lung Dis. 2022, 26, 6–11. [Google Scholar] [CrossRef] [PubMed] [PubMed Central]
  12. Franke, M.A.; Emmrich, J.V.; Ranjaharinony, F.; Ravololohanitra, O.G.; Andriamasy, H.E.; Knauss, S.; Muller, N. A cross-sectional analysis of the effectiveness of a nutritional support programme for people with tuberculosis in Southern Madagascar using secondary data from a non-governmental organisation. Infect. Dis. Poverty 2024, 13, 13. [Google Scholar] [CrossRef] [PubMed] [PubMed Central]
  13. Padmapriyadarsini, C.; Shobana, M.; Lakshmi, M.; Beena, T.; Swaminathan, S. Undernutrition & tuberculosis in India: Situation analysis & the way forward. Indian. J. Med. Res. 2016, 144, 11–20. [Google Scholar] [CrossRef] [PubMed] [PubMed Central]
  14. Franco, J.V.; Bongaerts, B.; Metzendorf, M.-I.; Risso, A.; Guo, Y.; Silva, L.P.; Boeckmann, M.; Schlesinger, S.; Damen, J.A.; Richter, B.; et al. Undernutrition as a risk factor for tuberculosis disease. Cochrane Database Syst Rev. 2024, 6, CD015890. [Google Scholar] [CrossRef] [PubMed] [PubMed Central]
  15. World Health Organization. The End TB Strategy; World Health Organization: Geneva, Switzerland, 2013. [Google Scholar]
  16. World Health Organization. Guideline: Nutritional Care and Support for Patients with Tuberculosis; World Health Organization: Geneva, Switzerland, 2013. [Google Scholar]
  17. Yen, Y.-F.; Chuang, P.-H.; Yen, M.-Y.; Lin, S.-Y.; Chuang, P.; Yuan, M.-J.; Ho, B.-L.; Chou, P.; Deng, C.-Y. Association of Body Mass Index with Tuberculosis Mortality: A Population-Based Follow-Up Study. Medicine 2016, 95, e2300. [Google Scholar] [CrossRef] [PubMed] [PubMed Central]
  18. Bhargava, A.; Bhargava, M. Tuberculosis deaths are predictable and preventable: Comprehensive assessment and clinical care is the key. J. Clin. Tuberc. Other Mycobact. Dis. 2020, 19, 100155. [Google Scholar] [CrossRef] [PubMed] [PubMed Central]
  19. Wondmieneh, A.; Gedefaw, G.; Getie, A.; Demis, A. Prevalence of undernutrition among adult tuberculosis patients in Ethiopia: A systematic review and meta-analysis. J. Clin. Tuberc. Other Mycobact. Dis. 2021, 22, 100211. [Google Scholar] [CrossRef] [PubMed] [PubMed Central]
  20. Ockenga, J.; Fuhse, K.; Chatterjee, S.; Malykh, R.; Rippin, H.; Pirlich, M.; Yedilbayev, A.; Wickramasinghe, K.; Barazzoni, R. Tuberculosis and malnutrition: The European perspective. Clin. Nutr. 2023, 42, 486–492. [Google Scholar] [CrossRef] [PubMed]
  21. Bhargava, A.; Chatterjee, M.; Jain, Y.; Chatterjee, B.; Kataria, A.; Bhargava, M.; Kataria, R.; D’sOuza, R.; Jain, R.; Benedetti, A.; et al. Nutritional status of adult patients with pulmonary tuberculosis in rural central India and its association with mortality. PLoS ONE 2013, 8, e77979. [Google Scholar] [CrossRef] [PubMed] [PubMed Central]
  22. Zachariah, R.; Spielmann, M.P.; Harries, A.D.; Salaniponi, F.M. Moderate to severe malnutrition in patients with tuberculosis is a risk factor associated with early death. Trans. R. Soc. Trop. Med. Hyg. 2002, 96, 291–294. [Google Scholar] [CrossRef] [PubMed]
  23. Kumar, N.P.; Nancy, A.P.; Moideen, K.; Menon, P.A.; Banurekha, V.V.; Nair, D.; Nott, S.; Babu, S. Low body mass index is associated with diminished plasma cytokines and chemokines in both active and latent tuberculosis. Front. Nutr. 2023, 10, 1194682. [Google Scholar] [CrossRef] [PubMed]
  24. Carwile, M.E.; Hochberg, N.S.; Sinha, P. Undernutrition is feeding the tuberculosis pandemic: A perspective. J. Clin. Tuberc. Other Mycobact. Dis. 2022, 27, 100311. [Google Scholar] [CrossRef] [PubMed] [PubMed Central]
  25. Ministry of Health, Lao People’s Democratic Republic. National Nutrition Strategy to 2025 and Plan of Action 2016–2020; Ministry of Health, Lao People’s Democratic Republic: Vientiane, Laos, 2016.
  26. United Nations. Department of Economic and Social Affairs. SDG Indicator Database; SDG Country Profile, Lao People’s Democratic Republic. Available online: https://unstats.un.org/sdgs/dataportal/countryprofiles/lao#goal-3 (accessed on 30 April 2025).
  27. World Bank Open Data [Internet]. Available online: https://data.worldbank.org/indicator/SH.STA.MALN.ZS?locations=LA (accessed on 30 April 2025).
  28. World Bank Open Data [Internet]. Available online: https://data.worldbank.org/indicator/SH.STA.STNT.ZS?locations=LA (accessed on 30 April 2025).
  29. Ministry of Planning and Investment, Lao People’s Democratic Republic. 9th Five-Year National Socio-Economic Development Plan (2021–2025); Ministry of Planning and Investment, Lao People’s Democratic Republic: Vientiane, Laos, 2021.
  30. Ministry of Health, Lao People’s Democratic Republic. Health Sector Reform Strategy and Framework till 2025; Ministry of Planning and Investment, Lao People’s Democratic Republic: Vientiane, Laos, 2016.
  31. Chittamany, P.; Yamanaka, T.; Suthepmany, S.; Sorsavanh, T.; Siphanthong, P.; Sebert, J.; Viney, K.; Vixaysouk, T.; Nagai, M.; Seevisay, V.; et al. First national tuberculosis patient cost survey in Lao People’s Democratic Republic: Assessment of the financial burden faced by TB-affected households and the comparisons by drug-resistance and HIV status. PLoS ONE 2020, 15, e0241862. [Google Scholar] [CrossRef] [PubMed]
  32. World Health Organization. Tuberculosis Patient Cost Surveys: A Hand Book; World Health Organization: Geneva, Switzerland, 2017. [Google Scholar]
  33. Inthavong, D.; Elsayed, H.; Keonakhone, P.; Seevisay, V.; Souksanh, S.; Suthepmany, S.; Chanthavong, M.; Keodavong, X.; Kommanivanh, P.; Siphanthong, P.; et al. The prevalence of undernutrition and associated risk factors in people with tuberculosis in Lao People’s Democratic Republic. PLoS ONE 2025, 20, e0324838. [Google Scholar] [CrossRef] [PubMed] [PubMed Central]
  34. Inthavong, D.; Elsayed, H.; Keonakhone, P.; Seevisay, V.; Souksanh, S.; Suthepmany, S.; Siphanthong, P.; Sengmany, P.; Sisounon, B.; Sebert, J.; et al. Does nutritional support contribute to mitigating the financial burden faced by TB-affected households? IJTLD Open 2025, 2, 260–268. [Google Scholar] [CrossRef] [PubMed]
  35. World Health Organization. National Surveys of Costs Faced by Tuberculosis Patients and Their Households 2015–2021; World Health Organization: Geneva, Switzerland, 2022. [Google Scholar]
  36. Ter Beek, L.; Bolhuis, M.S.; Jager-Wittenaar, H.; Brijan, R.X.D.; Sturkenboom, M.G.G.; Kerstjens, H.A.M.; de Lange, W.C.M.; Tiberi, S.; van der Werf, T.S.; Alffenaar, J.-W.C.; et al. Malnutrition assessment methods in adult patients with tuberculosis: A systematic review. BMJ Open 2021, 11, e049777. [Google Scholar] [CrossRef] [PubMed] [PubMed Central]
  37. Gupta, K.B.; Gupta, R.; Atreja, A.; Verma, M.; Vishvkarma, S. Tuberculosis and nutrition. Lung India 2009, 26, 9–16. [Google Scholar] [CrossRef] [PubMed] [PubMed Central]
  38. Campbell, J.R.; Chan, E.D.; Falzon, D.; Trajman, A.; Keshavjee, S.; Leung, C.C.; Miller, A.C.; Monedero-Recuero, I.; Rodrigues, D.S.; Seo, H.; et al. Low Body Mass Index at Treatment Initiation and Rifampicin-Resistant Tuberculosis Treatment Outcomes: An Individual Participant Data Meta-Analysis. Clin. Infect. Dis. 2022, 75, 2201–2210. [Google Scholar] [CrossRef] [PubMed]
  39. Lai, H.H.; Lai, Y.J.; Yen, Y.F. Association of Body Mass Index with Timing of Death during Tuberculosis Treatment. PLoS ONE 2017, 12, e0170104. [Google Scholar] [CrossRef] [PubMed] [PubMed Central]
  40. Sahile, Z.; Tezera, R.; Haile Mariam, D.; Collins, J.; Ali, J.H. Nutritional status and TB treatment outcomes in Addis Ababa, Ethiopia: An ambi-directional cohort study. PLoS ONE 2021, 16, e0247945. [Google Scholar] [CrossRef] [PubMed] [PubMed Central]
  41. Shah, V.; Murugan, Y.; Patel, S.S.; Trivedi, N.S.; Pithadiya, D.; Makwana, N.; Parmar, D. Nutritional Supplementation in Tuberculosis Treatment: A Mixed Methods Study of Clinical Outcomes and Patient Perceptions in Jamnagar, India. Cureus 2024, 16, e70300. [Google Scholar] [CrossRef] [PubMed] [PubMed Central]
  42. Tola, A.; Minshore, K.M.; Ayele, Y.; Mekuria, A.N. Tuberculosis Treatment Outcomes and Associated Factors among TB Patients Attending Public Hospitals in Harar Town, Eastern Ethiopia: A Five-Year Retrospective Study. Tuberc. Res. Treat. 2019, 2019, 1503219. [Google Scholar] [CrossRef] [PubMed] [PubMed Central]
  43. Chilyabanyama, R.; Kamanga, N.; Mwandia, J.N. Factors associated with tuberculosis treatment outcomes among TB patients aged 15 years and older at chawama level one hospital in Lusaka, Zambia. Glob. Public Health 2024, 19, 2307979. [Google Scholar] [CrossRef] [PubMed]
  44. Chaves Torres, N.M.; Quijano Rodriguez, J.J.; Porras Andrade, P.S.; Arriaga, M.B.; Netto, E.M. Factors predictive of the success of tuberculosis treatment: A systematic review with meta-analysis. PLoS ONE 2019, 14, e0226507. [Google Scholar] [CrossRef] [PubMed] [PubMed Central]
  45. Kabuya, M.; Musekiwa, A.; Takuva, S.; Thabane, L.; Mbuagbaw, L. Predictors of tuberculosis treatment outcome at Senkatana clinic in Lesotho. Pan Afr. Med. J. 2024, 49, 91. [Google Scholar] [CrossRef] [PubMed]
  46. Sariem, C.N.; Odumosu, P.; Dapar, M.P.; Musa, J.; Ibrahim, L.; Aguiyi, J. Tuberculosis treatment outcomes: A fifteen-year retrospective study in Jos-North and Mangu, Plateau State, North—Central Nigeria. BMC Public Health 2020, 20, 1224. [Google Scholar] [CrossRef] [PubMed] [PubMed Central]
  47. Zenatti, G.; Raviglione, M.; Tesfaye, F.; Bobosha, K.; Björkman, P.; Walles, J. High variability in tuberculosis treatment outcomes across 15 health facilities in a semi-urban area in central Ethiopia. J. Clin. Tuberc. Other Mycobact. Dis. 2023, 30, 100344. [Google Scholar] [CrossRef] [PubMed] [PubMed Central]
  48. Gatechompol, S.; Kawkitinarong, K.; Suwanpimolkul, G.; Kateruttanakul, P.; Manosuthi, W.; Sophonphan, J.; Ubolyam, S.; Kerr, S.J.; Avihingsanon, A.; Ruxrungtham, K. Treatment outcomes and factors associated with mortality among individuals with both TB and HIV in the antiretroviral era in Thailand. J. Virus Erad. 2019, 5, 225–230. [Google Scholar] [CrossRef] [PubMed] [PubMed Central]
  49. van de Water, B.J.; Fulcher, I.; Cilliers, S.; Meyer, N.; Wilson, M.; Young, C.; Gaunt, B.; le Roux, K.; Isaakidis, P. Association of HIV infection and antiretroviral therapy with the occurrence of an unfavorable TB treatment outcome in a rural district hospital in Eastern Cape, South Africa: A retrospective cohort study. PLoS ONE 2022, 17, e0266082. [Google Scholar] [CrossRef] [PubMed] [PubMed Central]
  50. Choi, H.; Lee, M.; Chen, R.Y.; Kim, Y.; Yoon, S.; Joh, J.S.; Park, S.K.; E Dodd, L.; Lee, J.; Song, T.; et al. Predictors of pulmonary tuberculosis treatment outcomes in South Korea: A prospective cohort study, 2005-2012. BMC Infect. Dis. 2014, 14, 360. [Google Scholar] [CrossRef] [PubMed] [PubMed Central]
  51. Wagnew, F.; Gray, D.; Tsheten, T.; Kelly, M.; Clements, A.C.A.; Alene, K.A. Effectiveness of nutritional support to improve treatment adherence in patients with tuberculosis: A systematic review. Nutr. Rev. 2024, 82, 1216–1225. [Google Scholar] [CrossRef] [PubMed] [PubMed Central]
  52. Thomas, B.E.; Thiruvengadam, K.; Rani, S.; Kadam, D.; Ovung, S.; Sivakumar, S.; Shivakumar, S.V.B.Y.; Paradkar, M.; Gupte, N.; Suryavanshi, N.; et al. Smoking, alcohol use disorder and tuberculosis treatment outcomes: A dual co-morbidity burden that cannot be ignored. PLoS ONE 2019, 14, e0220507, Erratum in PLoS ONE 2019, 14, e0224914. 10.1371/journal.pone.0224914. [Google Scholar] [CrossRef] [PubMed] [PubMed Central]
  53. Ragan, E.J.; Kleinman, M.B.; Sweigart, B.; Gnatienko, N.; Parry, C.D.; Horsburgh, C.R.; LaValley, M.P.; Myers, B.; Jacobson, K.R. The impact of alcohol use on tuberculosis treatment outcomes: A systematic review and meta-analysis. Int. J. Tuberc. Lung Dis. 2020, 24, 73–82. [Google Scholar] [CrossRef] [PubMed] [PubMed Central]
  54. Miyoshi, M.; Phommasack, B.; Nakamura, S.; Kuroiwa, C. Nutritional status of children in rural Lao PDR: Who are the most vulnerable? Eur. J. Clin. Nutr. 2005, 59, 887–890. [Google Scholar] [CrossRef] [PubMed]
  55. Multi-Sector Convergence Approach to Reducing Malnutrition in Lao PDR [Internet]. 2022. Available online: https://www.worldbank.org/en/country/lao/brief/multi-sector-convergence-approach-to-reducing-malnutrition-in-lao-pdr (accessed on 30 April 2025).
  56. Li, A.; Yuan, S.Y.; Li, Q.G.; Li, J.X.; Yin, X.Y.; Liu, N.N. Prevalence and risk factors of malnutrition in patients with pulmonary tuberculosis: A systematic review and meta-analysis. Front. Med. 2023, 10, 1173619. [Google Scholar] [CrossRef] [PubMed] [PubMed Central]
Figure 1. Study participant flowchart at each timepoint.
Tropicalmed 10 00198 g001
Figure 2. Prevalence of BMI < 18.5 at four time points during TB treatment, participants completed four data collections (N = 268). Error bars represent the 95% confidence interval.
Tropicalmed 10 00198 g002
Figure 3. Prevalence of BMI < 18.5 at four time points during TB treatment, observation group vs. intervention group. Error bars represent the 95% confidence interval.
Tropicalmed 10 00198 g003
Table 1. Socio-demographic, and TB-related characteristics by study group.
VariableCategoryObservation Group
N (%)
Intervention Group
N (%)
Total
N (%)
p-Value
Total154 (51.9)143 (48.1)297 (100)-
Demographic characteristics
Age group (years)Mean (SD)48.9 (18.3)47.7 (16.1)48.3 (17.3)0.567
0–141 (0.6)0 (0.0)1 (0.3)0.347
15–2416 (10.4)11 (7.7)27 (9.1)
25–3428 (18.2)25 (17.5)53 (17.8)
35–4417 (11.0)23 (16.1)40 (13.5)
45–5426 (16.9)30 (21.0)56 (18.9)
55–6428 (18.2)31 (21.7)59 (19.9)
65+38 (24.7)23 (16.1)61 (20.5)
SexFemale66 (42.9)46 (32.2)112 (37.7)0.075
Male88 (57.1)97 (67.8)185 (62.3)
Marital statusSingle40 (26.0)32 (22.4)72 (24.2)0.289
Married87 (56.5)93 (65.0)180 (60.6)
Divorced/separated/widowed27 (17.5)18 (12.6)45 (15.2)
Insurance typeNone52 (33.8)56 (39.2)108 (36.4)0.557
National Health Insurance86 (55.8)76 (53.1)162 (54.5)
Community-Based Health Insurance2 (1.3)1 (0.7)3 (1.0)
Social Security Organization5 (3.2)4 (2.8)9 (3.0)
State Authority for Social Security6 (3.9)5 (3.5)11 (3.7)
Private health insurance3 (1.9)0 (0.0)3 (1.0)
Other0 (0.0)1 (0.7)1 (0.3)
SmokerNo smoking experience83 (53.9)66 (46.2)149 (50.2)0.383
Current smoker13 (8.4)16 (11.2)29 (9.8)
Ex-smoker58 (37.7)61 (42.7)119 (40.1)
Alcohol useDaily10 (6.5)15 (10.5)25 (8.4)0.324
Weekly13 (8.4)18 (12.6)31 (10.4)
Monthly17 (11.0)12 (8.4)29 (9.8)
Rarely/Never114 (74.0)98 (68.5)212 (71.4)
Educational levelNo education20 (13.0)10 (7.0)30 (10.1)0.249
Primary40 (26.0)36 (25.2)76 (25.6)
Lower/higher secondary69 (44.8)65 (45.5)134 (45.1)
Diploma or higher, vocational, other25 (16.2)32 (22.4)57 (19.2)
Employment status
before TB
Unemployed44 (28.6)31 (21.7)75 (25.3)0.038
Formal paid work19 (12.3)27 (18.9)46 (15.5)
Informal paid work67 (43.5)74 (51.7)141 (47.5)
Retired/student/housework/other24 (15.6)11 (7.7)35 (11.8)
Clinical characteristics
TB typePulmonary, bacteriologically confirmed111 (72.1)101 (70.6)212 (71.4)0.800
Pulmonary, bacteriologically unconfirmed (clinically diagnosed)36 (23.4)33 (23.1)69 (23.2)
Extrapulmonary7 (4.5)9 (6.3)16 (5.4)
HIV statusHIV negative135 (87.7)120 (83.9)255 (85.9)0.428
HIV positive19 (12.3)22 (15.4)41 (13.8)
HIV test not done0 (0.0)1 (0.7)1 (0.3)
Treatment historyNew145 (94.2)136 (95.1)281 (94.6)0.227
Relapse6 (3.9)7 (4.9)13 (4.4)
Retreatment3 (1.9)0 (0.0)3 (1.0)
Diagnostic delayNo72 (46.8)79 (55.2)151 (50.8)0.178
Yes (>4 weeks from onset of TB symptoms)82 (53.2)64 (44.8)146 (49.2)
Table 2. Prevalence and reduction of undernutrition and severe undernutrition over treatment phases.
VariablesPhaseObservation GroupIntervention Groupp-Value
Prevalence of
BMI * < 18.5
At TB diagnosis40.9%37.8%0.663
End of intensive phase32.2%22.4%0.089
Middle of continuation phase23.8%16.9%0.211
End of continuation phase19.4%11.6%0.113
Prevalence of
BMI * < 16.5
At TB diagnosis21.4%18.2%0.773
End of intensive phase13.7%8.2%0.164
Middle of continuation phase8.4%4.6%0.311
End of continuation phase5.8%3.1%0.211
* BMI: Body Mass Index.
Table 3. TB treatment outcomes by study group.
VariableCategoryObservation Group; N (%)Intervention Group; N (%)Total; N (%)p-Value
Treatment outcomesTreatment success139 (90.3)130 (90.9)269 (90.6)0.639
Treatment failure0 (0.0)0 (0.0)0 (0.0)
Died12 (7.8)12 (8.4)24 (8.1)
Lost to follow-up3 (1.9)1 (0.6)4 (1.3)
Occurrence of deaths during TB treatmentEnd of intensive phase7 (4.6)9 (6.3)16 (5.4)0.929
Middle of continuation phase2 (1.3)2 (1.4)4 (1.4)
End of continuation phase3 (1.9)1 (0.7)4 (1.4)
Table 4. Factors determining TB treatment success.
VariableCategoryNn (%)p-ValueCrude OR
(95% CI, p-Value)
Adjusted OR
(95% CI, p-Value)
Age group65+6154 (88.5%)0.781RefRef
0–44121111 (91.7%) 1.44 (0.50–3.95, p = 0.484)4.26 (1.17–17.01, p = 0.031)
45–64115104 (90.4%) 1.23 (0.43–3.29, p = 0.691)1.44 (0.48–4.11, p = 0.504)
SexMale185163 (88.1%)0.096RefRef
Female112106 (94.6%) 2.38 (0.99–6.65, p = 0.069)2.30 (0.92–6.62, p = 0.094)
Marital statusSingle7265 (90.3%)0.897Ref-
Married180164 (91.1%) 1.10 (0.41–2.72, p = 0.836)-
Divorced/separated/widowed4540 (88.9%) 0.86 (0.26–3.08, p = 0.810)-
Insurance typeNo insurance10895 (88.0%)0.339Ref-
With insurance189174 (92.1%) 1.59 (0.72–3.48, p = 0.248)-
Smoking statusCurrent smoker2923 (79.3%)0.059Ref-
No smoking experience149139 (93.3%) 3.63 (1.14–10.77, p = 0.022)-
Ex-smoker119107 (89.9%) 2.33 (0.75–6.67, p = 0.125)-
Alcohol useDaily2523 (92.0%)0.580Ref-
Weekly3126 (83.9%) 0.45 (0.06–2.32, p = 0.369)-
Monthly2927 (93.1%) 1.17 (0.13–10.42, p = 0.877)-
Rarely/Never212193 (91.0%) 0.88 (0.14–3.32, p = 0.873)-
HIV statusHIV positive4132 (78.0%)0.012RefRef
HIV negative255236 (92.5%) 3.49 (1.40–8.22, p = 0.005)9.49 (2.83–34.67, p < 0.001)
Status unknown11 (100.0%) --
Educational levelNo education3026 (86.7%)0.717Ref-
Primary7671 (93.4%) 2.18 (0.51–8.88, p = 0.270)-
Lower/higher secondary134121 (90.3%) 1.43 (0.38–4.43, p = 0.557)-
Diploma or higher, vocational, other5751 (89.5%) 1.31 (0.31–4.99, p = 0.697)-
Employment status before TBUnemployed7569 (92.0%)0.820Ref-
Formal paid work4640 (87.0%) 0.58 (0.17–1.97, p = 0.372)-
Informal paid work141128 (90.8%) 0.86 (0.29–2.27, p = 0.763)-
Retired/student/housework/other3532 (91.4%) 0.93 (0.23–4.61, p = 0.919)-
Nutritional interventionWithout any intervention154139 (90.3%)1.000Ref-
With nutritional intervention143130 (90.9%) 1.08 (0.49–2.39, p = 0.848)-
TB typePulmonary, bacteriologically confirmed212190 (89.6%)0.480RefRef
Pulmonary, clinically diagnosed6965 (94.2%) 1.88 (0.69–6.61, p = 0.261)3.26 (1.05–12.87, p = 0.060)
Extrapulmonary1614 (87.5%) 0.81 (0.21–5.38, p = 0.790)1.17 (0.24–9.11, p = 0.859)
Treatment historyRelapse/retreatment1614 (87.5%)1.000Ref-
New281255 (90.7%) 1.40 (0.21–5.39, p = 0.667)-
Household size≥5149131 (87.9%)0.170RefRef
<5148138 (93.2%) 1.90 (0.86–4.41, p = 0.121)2.21 (0.95–5.49, p = 0.073)
Diagnostic delayNo151136 (90.1%)0.916Ref-
Yes146133 (91.1%) 1.13 (0.52–2.50, p = 0.762)-
BMI at TB diagnosis<18.5117102 (87.2%)0.159RefRef
≥18.5180167 (92.8%) 1.89 (0.86–4.19, p = 0.111)1.85 (0.79–4.37, p = 0.153)
Ref: reference category used for comparison when calculating odds ratios.
Disclaimer/Publisher’s Note: The statements, opinions and data contained in all publications are solely those of the individual author(s) and contributor(s) and not of MDPI and/or the editor(s). MDPI and/or the editor(s) disclaim responsibility for any injury to people or property resulting from any ideas, methods, instructions or products referred to in the content.

