The results were categorized into quantitative and qualitative metrics. Quantitative metrics assessed usability and cognitive load. The NASA-TLX framework provides six key dimensions that collectively address various aspects of the cognitive load experienced by the user. However, assessing usability for speech-driven systems requires a different focus compared to traditional system usability evaluation, particularly in light of the evolving user expectations from modern voice interfaces.
Users today are increasingly familiar with interacting with voice systems such as Alexa, Siri, and ChatGPT, which shape their expectations regarding naturalness, responsiveness, accuracy, etc. Accordingly, the usability parameters selected in this study, as outlined in the research questions (RQs), were specifically curated to comprehensively evaluate the unique usability aspects relevant to speech-based interaction systems, distinct with no similar-sounding parameters.
4.1. Quantitative Results
The results for the total, mean (
M), and standard deviation (
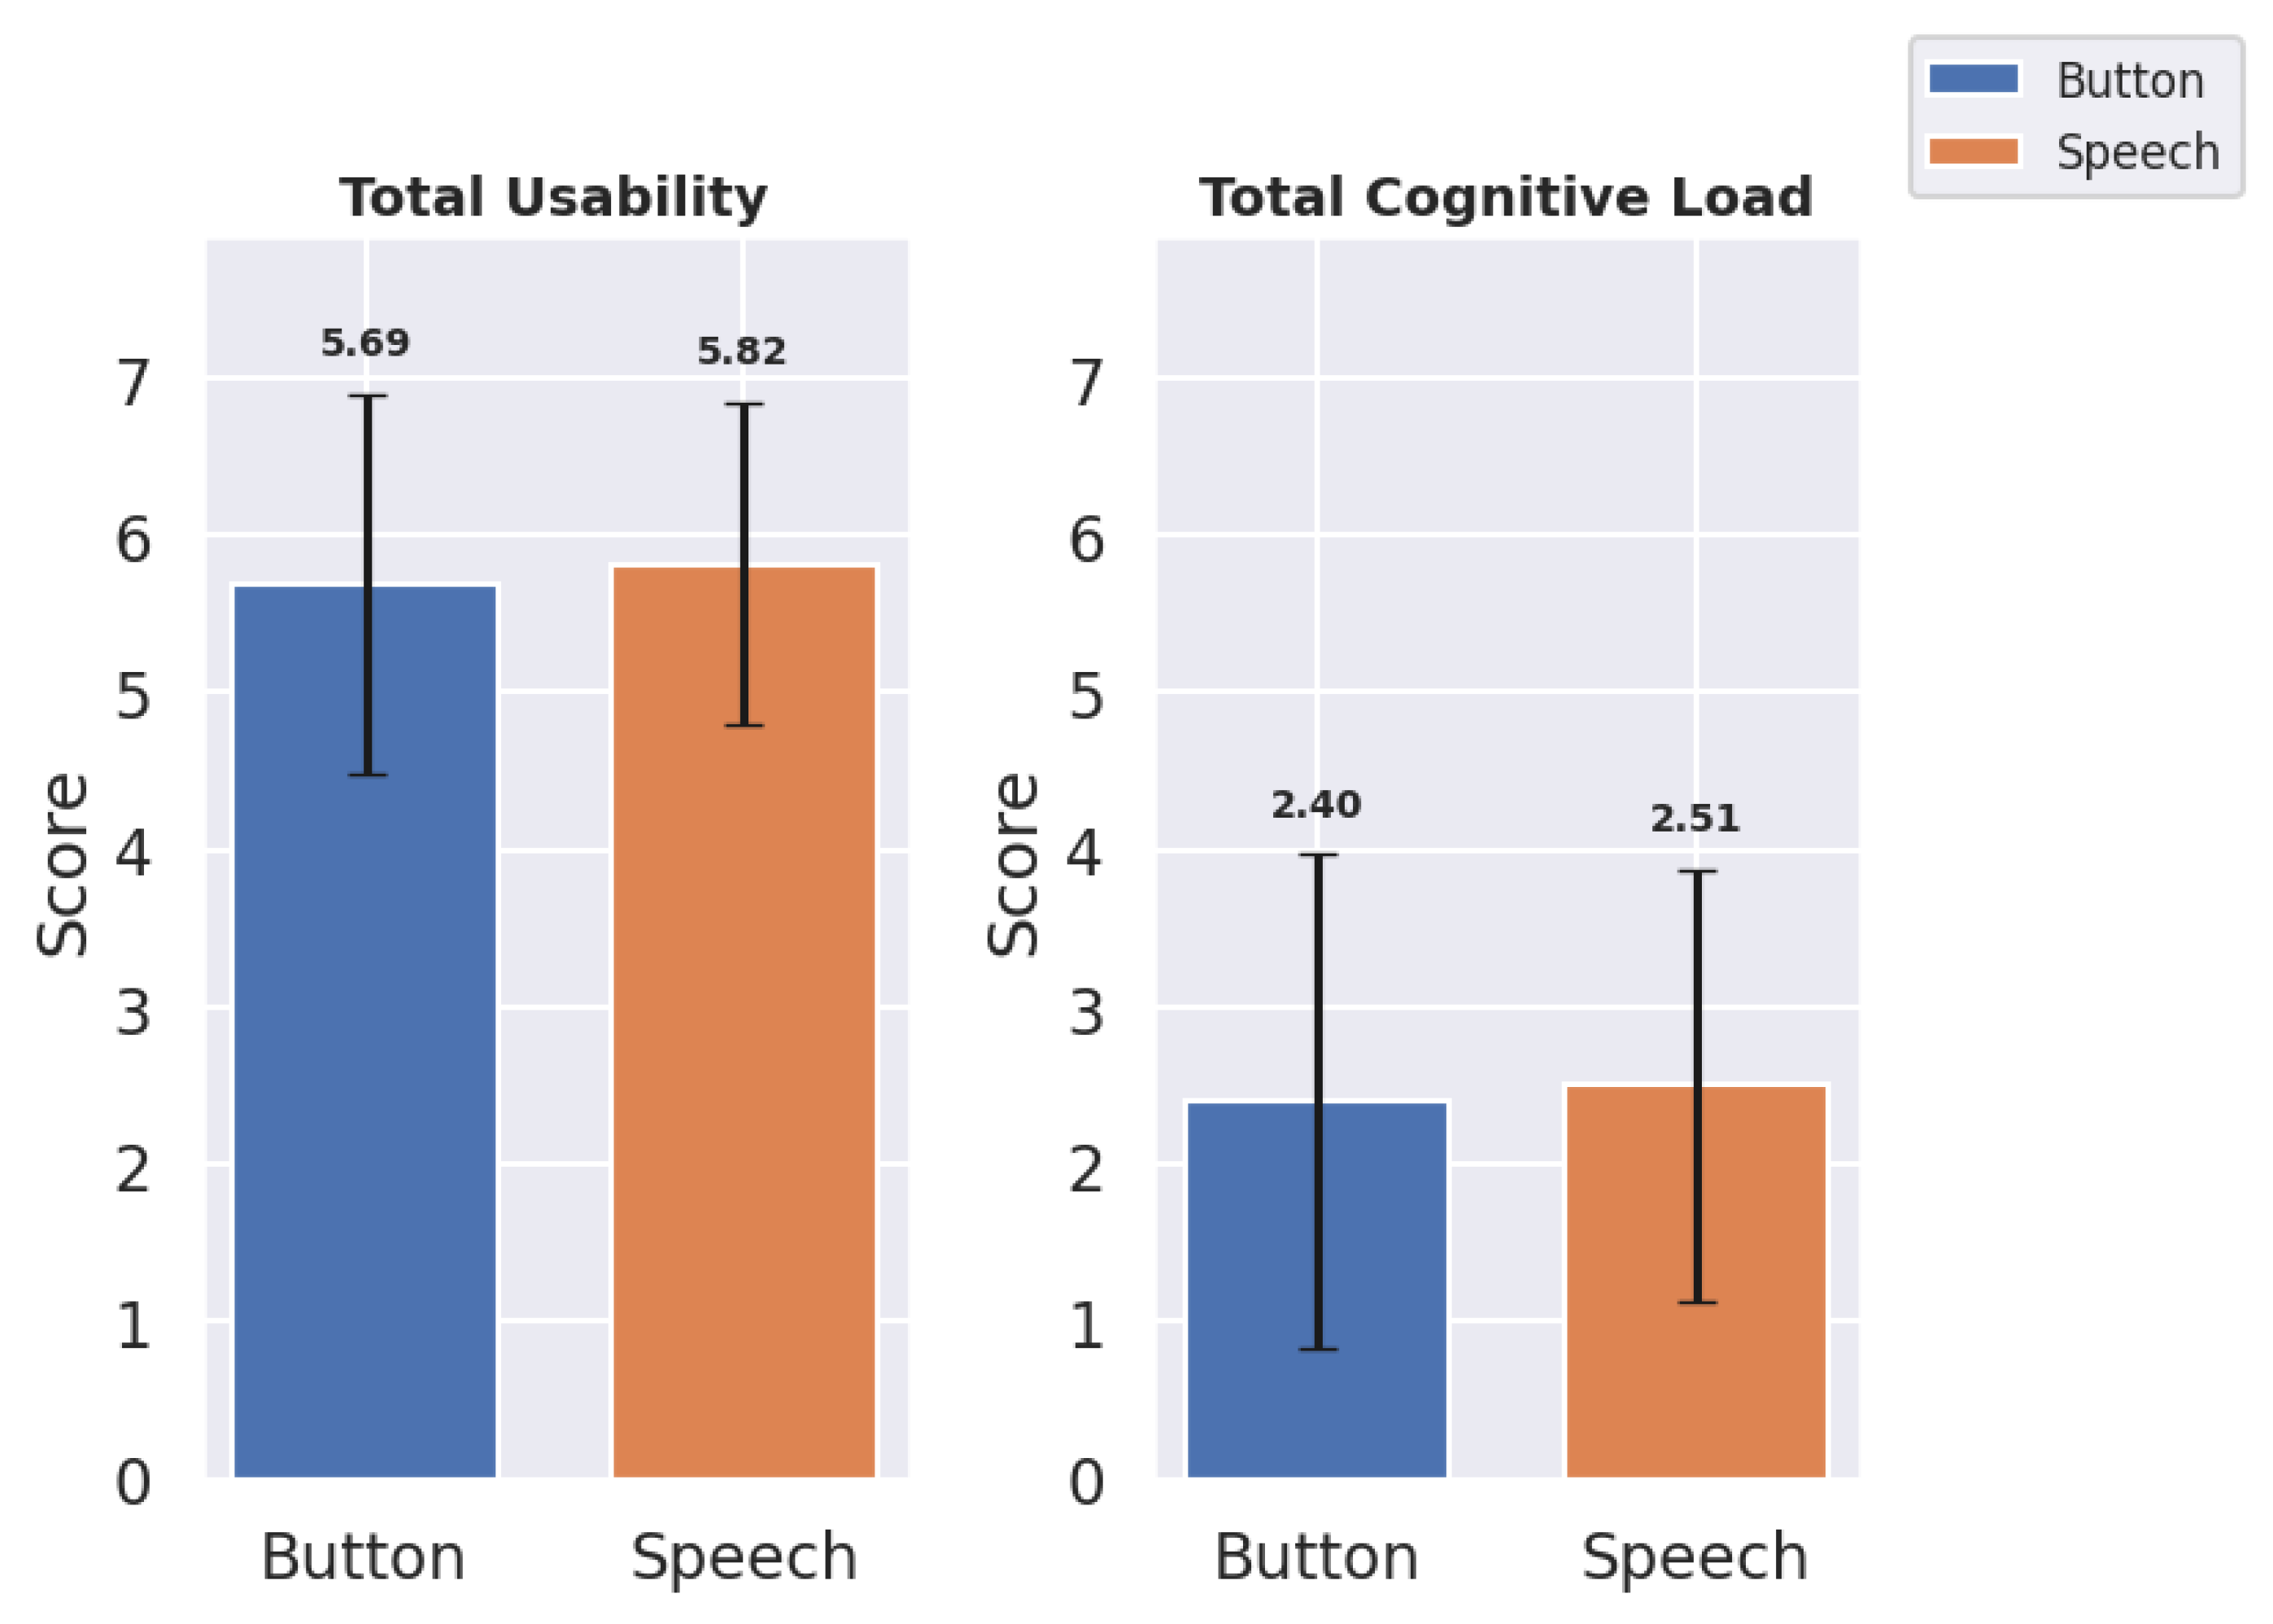
) of usability and cognitive load indicate an overall preference for the speech interface in regard to usability but suggest less overall cognitive load with the button panel interface (
Table 1,
Figure 6):
The speech interface achieved an overall similar total usability score () in comparison with the button panel interface (). The mean usability score also demonstrated similar behavior for the speech and button panel interfaces, with scores of () and (), respectively. The button panel interface exhibited a lower mean cognitive load () than the speech interface (), suggesting that speech may slightly increase cognitive load due to recognition inaccuracies. These findings demonstrate the overall results. But for in-depth analysis, the metrics used for usability and cognitive load were analyzed.
4.1.1. Usability Metrics
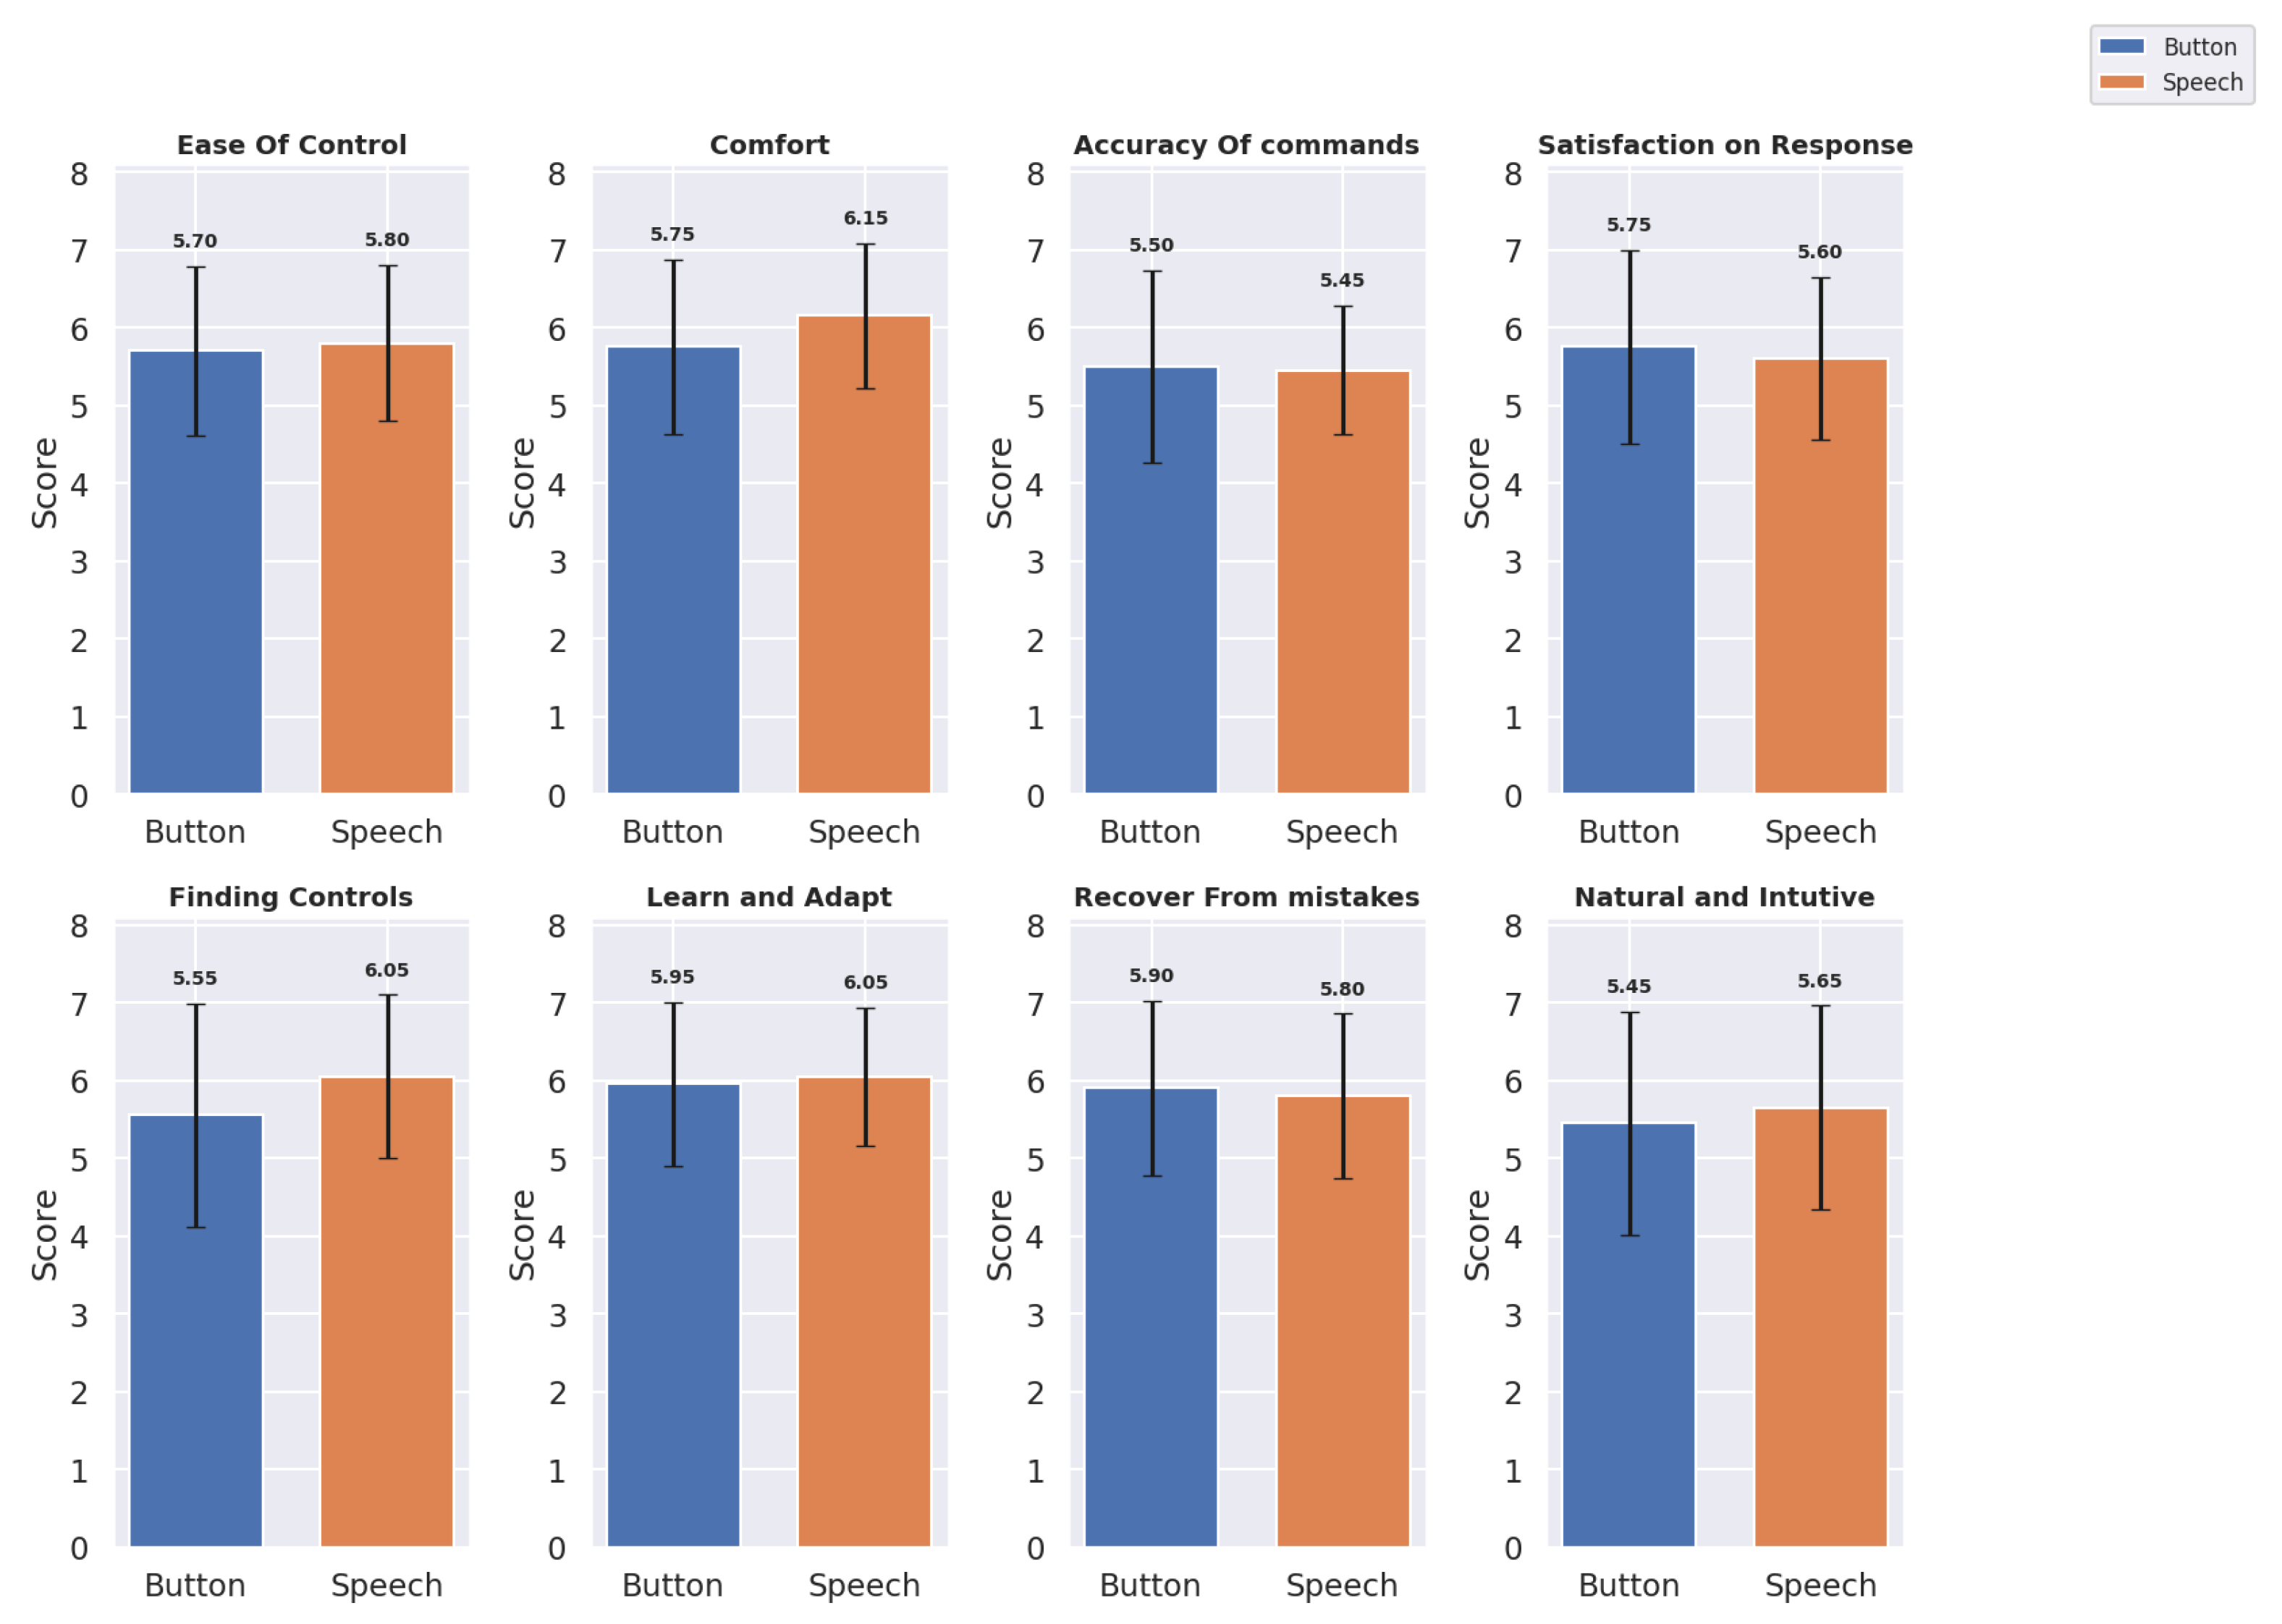
The usability metrics were evaluated across eight domains for both the button panel and speech interfaces:
Ease of Control, Comfort, Accuracy of Commands, Satisfaction with Response, Finding Controls, Learning and Adapting, Recover from Mistakes, and Natural and Intuitive Use. The mean scores (
M) and standard deviation (
) provided insights into the user experiences with each interface.
Table 2 shows the mean and standard deviation of the button panel and speech interfaces for each usability metric, and
Figure 7 shows a bar graph of the same.
Based on the updated usability metrics, we observed slight variations between the button panel and speech interfaces across several dimensions:
For Ease of Control, the speech interface scored marginally higher () compared to the button panel interface (), indicating a slight preference for speech-based control. The Comfort ratings also favored the speech interface () over the button panel interface (), suggesting that the users found voice commands less physically and mentally demanding. For Accuracy of Commands, the button panel interface performed slightly better () than the speech interface (). However, in terms of Satisfaction with Response, the speech interface received slightly lower ratings () compared to the button panel interface (). The speech interface was rated higher in Finding Controls () and Learn and Adapt (), indicating that the users found the speech interface more intuitive for these aspects. However, the button panel interface scored slightly better on Recovery from Mistakes () compared to the speech interface (). For Natural and Intuitive Use, the speech interface scored slightly higher () than the button panel interface (), suggesting that the users found the speech interface somewhat more natural and intuitive.
Overall, the usability metrics indicated a nuanced user preference. While the button panel interface excelled in Accuracy of Commands, Satisfaction with Response, and Recovery from Mistakes, the speech interface provided more ease in terms of Ease of Control, Comfort, Finding Controls, Learn and Adapt, and Natural and Intuitive Use.
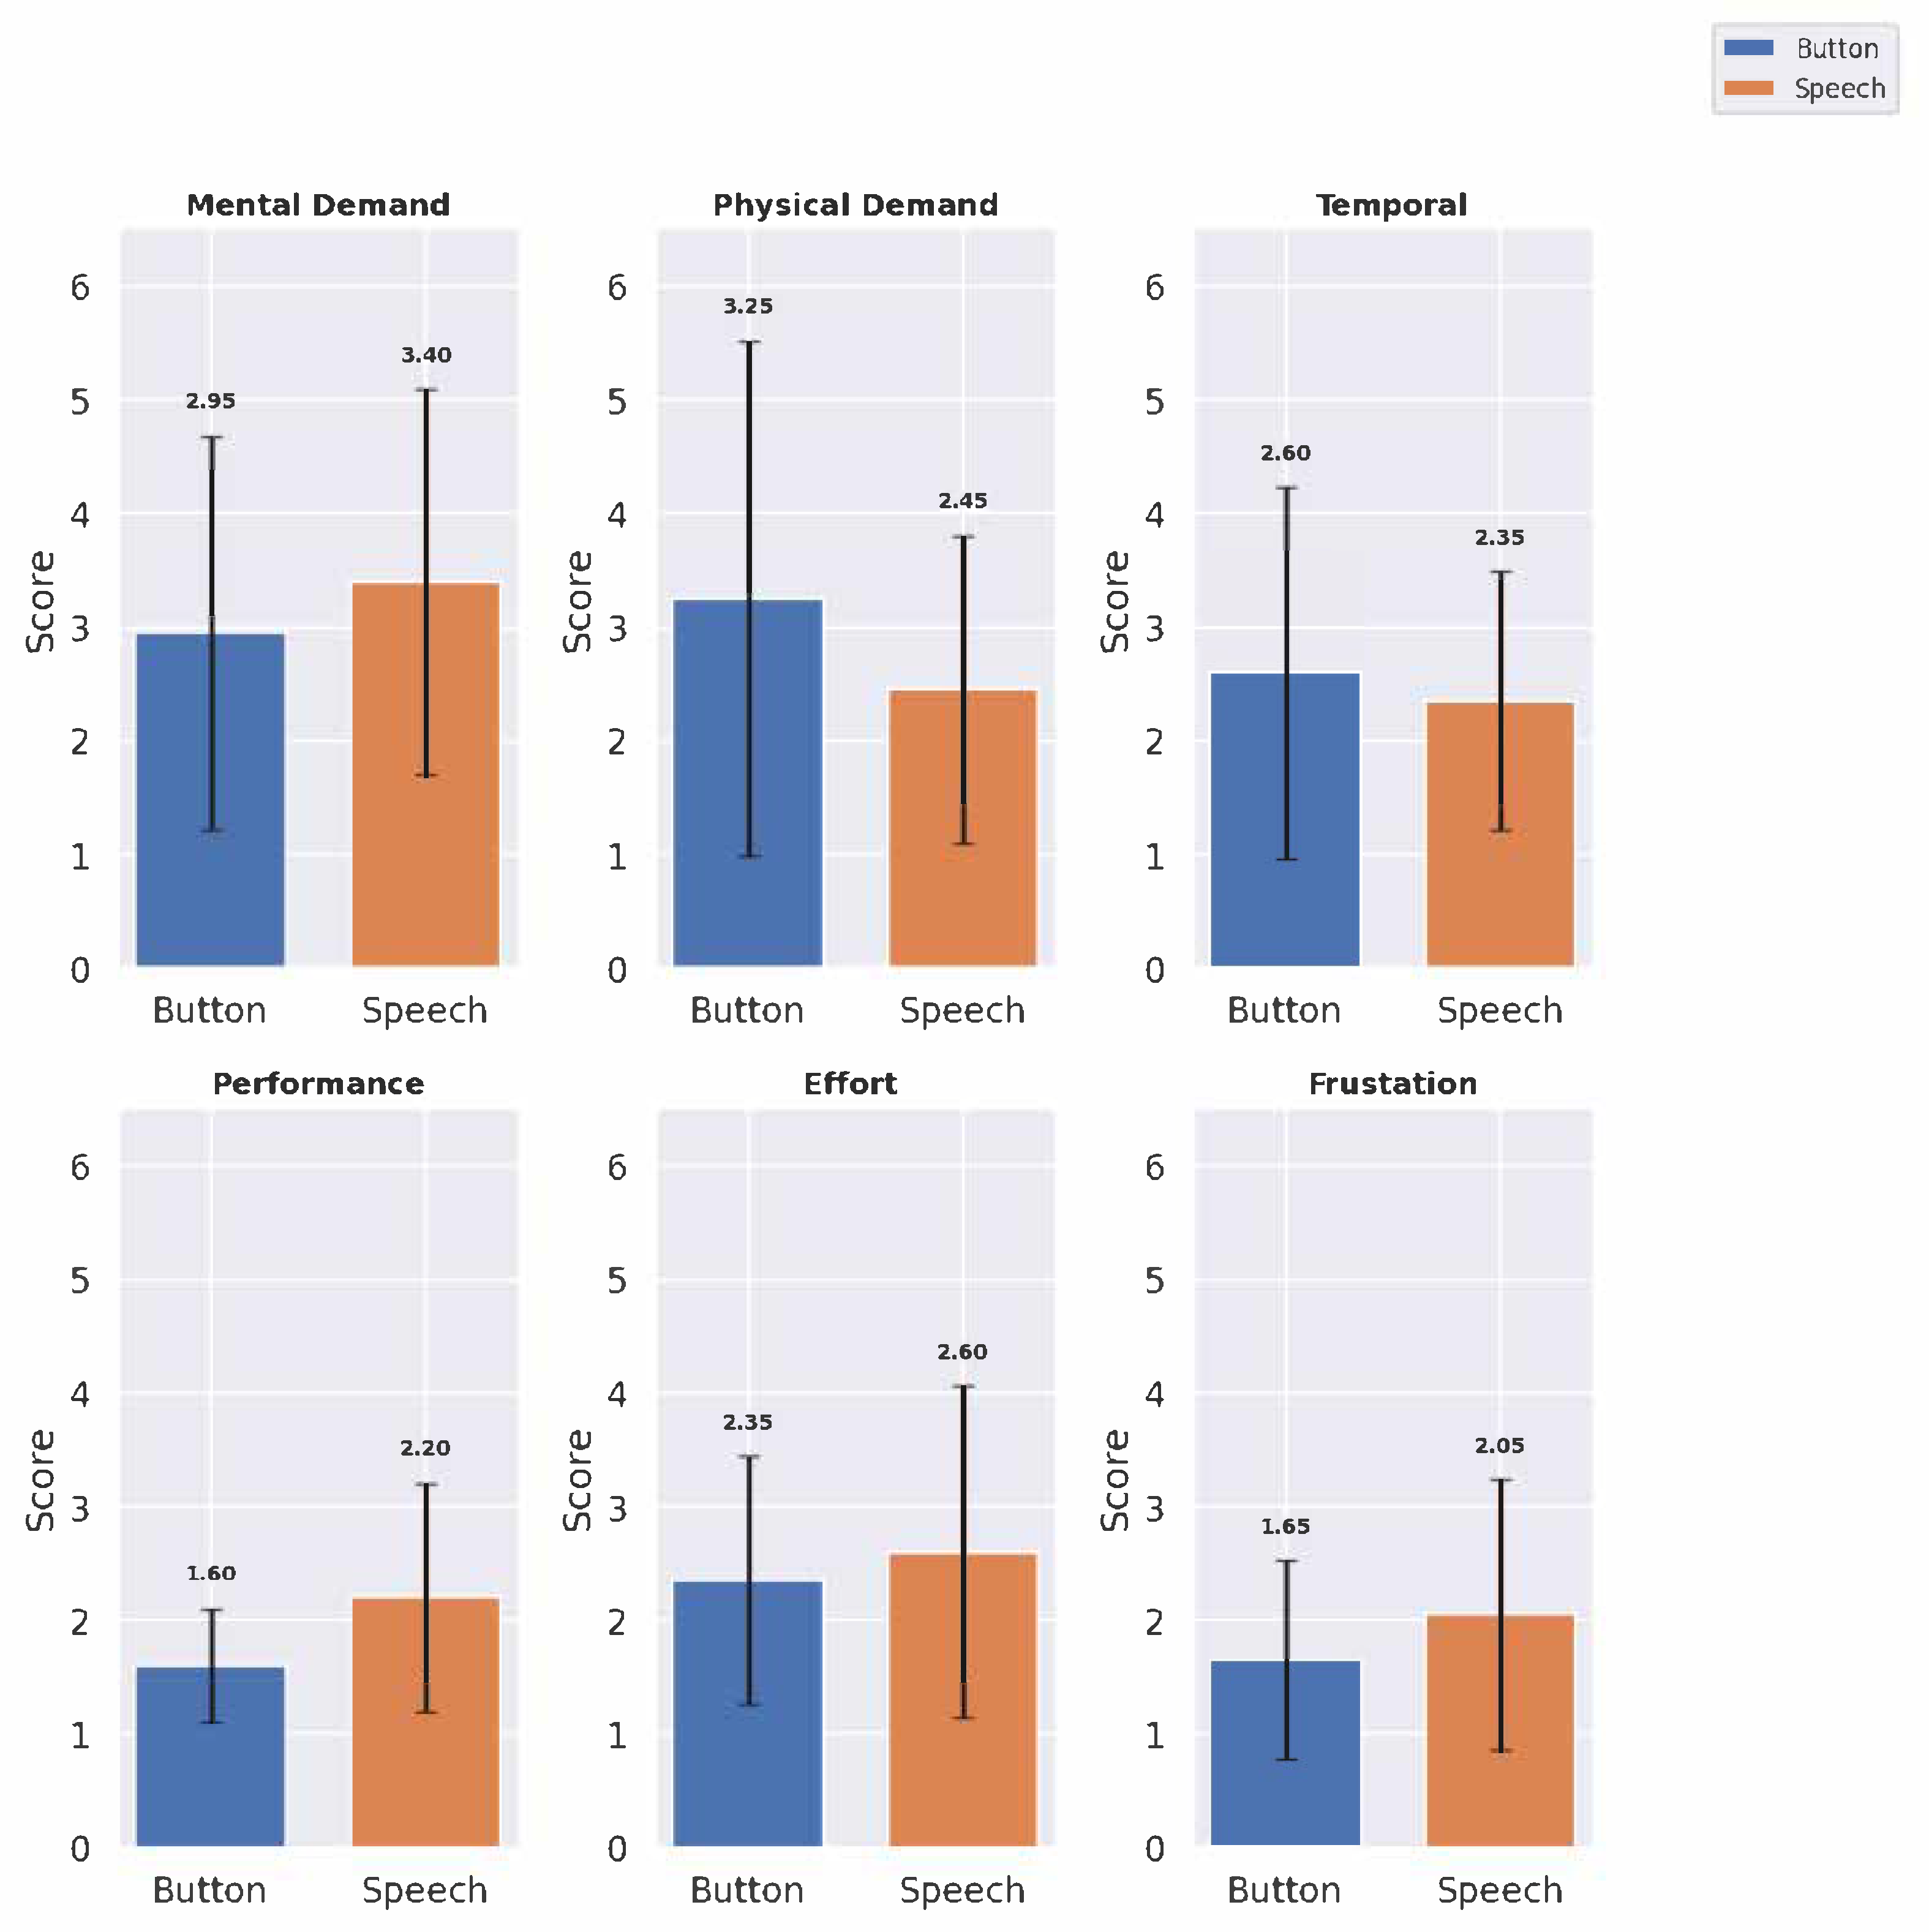
4.1.2. Cognitive Load Metrics
The cognitive load metrics were evaluated across six domains:
Mental Demand,
Physical Demand,
Temporal Demand,
Performance,
Effort, and
Frustration. The mean scores and standard deviations provide insight into the cognitive load associated with each interface (see
Table 3 and
Figure 8):
The speech interface showed higher Mental Demand () than the button panel interface (), though it scored lower on Physical Demand (), suggesting that speech may reduce physical effort but increase cognitive processing. Temporal Demand was rated similarly across the interfaces, with the button panel interface at and the speech interface at , indicating that neither interface added significant time pressure. The button panel interface scored higher on affected Performance (), reflecting user confidence with button panel interface interactions (here, Performance was evaluated using NASA TLX cognitive load scoring, where a lower score indicates better performance and a higher score means bad performance). The speech interface required more Effort (). The speech interface had a higher Frustration score () compared to the button panel interface (), potentially due to inaccuracies in voice recognition.
4.1.3. Effect of Participant’s Past Experience
Out of the 20 participants in the study, 19 were using medical VR systems for the first time, while only 1 had prior experience with such applications. However, when considering general VR usage, 15 participants had used VR in some form before, whereas 5 reported no prior VR experience at all. Due to the imbalance in prior experience with medical VR (19 vs. 1) and the modest size of the dataset, formal statistical testing was not conducted with this. Instead, we performed a preference-based exploratory comparison limited to those participants who had some form of prior VR experience (n = 15), and, later, we took percentages of distribution for normal comparison, allowing for better interpretation within a semi-homogeneous group. Preferences were measured within-subject, for each usability and cognitive load metric. At each decision point, the participant’s preferred input method (speech interface or button panel interface) was determined, based on their score for the same metric under both conditions. The goal was to identify which modality was favored per metric by participants who had prior exposure to VR environments.
From
Table 4, Participants with prior VR experience showed a preference for speech input in the metrics Comfort and Finding Controls, while button input was favored for the metrics Satisfaction with Response, Recovery from Mistakes, Mental Demand, and Performance. Preferences for other metrics, including Ease of Control, Natural and Intuitive Use, and Effort, were mixed or inconclusive, though such findings remain indicative rather than definitive, due to the data limitations.
4.1.4. Significance Test
A Shapiro–Wilk test indicated that the data were not normally distributed. Given that the study employed a within-subjects design, where each participant interacted with both interfaces (button panel and speech), related (paired) measurements were obtained for each usability and cognitive load metric. Consequently, the Wilcoxon signed-rank test was selected, as it is appropriate for analyzing paired or matched samples when the assumption of normality is violated. This approach allowed each participant to serve as their own control, enabling a more accurate comparison of score differences between the two interfaces. The resulting W-statistics and corresponding
p-values are presented in
Table 5.
Usability metrics: No statistically significant differences were observed in the usability metrics between the button panel and speech interfaces, as all comparisons yielded p-values greater than 0.05. The test revealed no statistically significant differences between the button panel and speech interfaces across most of the usability metrics, including Ease of Control (, ), Comfort (, ), Accuracy of Commands (, ), and Satisfaction with Response (, ). However, Finding Controls approached significance (, ), suggesting a trend in which users might have found the control features easier to locate on one interface than on the other. The other metrics, including Learn and Adapt (, ), Recovery from Mistakes (, ), and Natural and Intuitive Use (, ), also showed no significant differences, indicating comparable ease in learning and adapting, error recovery, and intuitiveness between the interfaces.
Cognitive load metrics: The Performance metric showed a statistically significant difference between the button panel and speech interfaces (, ), suggesting a notable variation in the cognitive load associated with performance across the two interfaces. Additionally, Physical Demand and Frustration demonstrated marginally non-significant p-values ( for Physical Demand and for Frustration), indicating a trend approaching a significance but not exactly statistically significant.
4.2. Qualitative Results
The qualitative analysis of the user feedback on the speech interface was conducted by codes and themes, where the code represented more granular detail while theme presented the overall category that the code belonged to.
Table 6 (Qp) and
Table 7 (Qn) show some distinct positive and negative remarks from the participants, respectively.
Many of the participants highlighted the speech interface’s ease of use, specifically noting its capacity to simplify tasks and reduce physical demands compared to button-based interaction. Qp1, Qp2, Qp9 are some examples of those instances. Responsiveness was another aspect that was commented on in multiple instances (Qp1, Qp9). The participants also stated its ease of use through Qp4, Qp5, Qp6. Some also commented about the ease of finding controls and commands by using the speech interface, which sometimes proved difficult with the button panel interface (Qp8). Many also commented about workflow efficiency and the natural flow of things when using the speech interface (Qp10, Qp11).
There were negative aspects of the speech interface as well, mostly due to inaccuracy for speech recognition (Qn1, Qn2, Qn3) and overall accuracy (Qn4) leading to bad user experience. The primary reasons behind this were varying accents and pitch of the voice, the results being misinterpretation of full or half sentences, leading to wrong results. Many commented on the overall task limitation in the speech interface (Qn4, Qn6, Qn7), stating that a major aspect of the whole setup was manual work, like placing the dental implant. This was also in line with the expectation for completely hands-free interaction with speech, as in Qn6, where the expectation was that manual placement of the dental implant be done by speech, and as in Qn5, where there was a suggestion that no hand controller button be used for speech activation, thus automating the whole process.


