Article

Methods and Findings in the Analysis of Alignment of Bodily Motion in Cooperative Dyadic Dialogue

Computational Linguistics Group, Trinity Centre for Computing and Language Studies, Trinity College Dublin, The University of Dublin, 2 Dublin, Ireland
*
Author to whom correspondence should be addressed.
Multimodal Technol. Interact. 2025, 9(6), 51; https://doi.org/10.3390/mti9060051
Submission received: 11 March 2025 / Revised: 19 May 2025 / Accepted: 21 May 2025 / Published: 27 May 2025

Abstract

:
This research analyses the temporal flow of motion energy (ME) in dyadic dialogues using alternating lagged correlation tests on consecutive windows and also Granger causality (GC) tests. This research considers both alternatives of lagged values, those of the more dominant party preceding those of the less and vice versa (with relative dominance independently determined) and labels the resulting lagged windows according to the category of correlation (CC) that holds (positive, negative or none, if the correlation is not significant). Similarly, windows are labeled in relation to the significance of GC (one party causing the other, mutual causation, or no causation). Additionally, occurrences of gestures or speech within windows by an interlocutor whose ME precedes are identified. Then, the ME GC labels are compared with labels derived from simple lagged correlation of ME values to identify whether GC or CC is more efficacious in highlighting which participant independent observers classify as the more dominant party, potentially the “leader” for the conversation. In addition, the association between speech, gestures, dominance, and leadership is explored. This work aims to understand how the distributions of these labels interact with independent perceptions of dominance, to what extent dominant interlocutors lead, and the extent to which these labels “explain” variation in ME within any dialogue. Here, the focus is on between speakers dynamics. It shows dominant speakers have measurable influence on their conversation partners through bodily ME, as they are more likely to lead motion dynamics, though moments of mutual influence also occur. While GC and lagged correlation both capture aspects of leadership, GC reveals directional influence, whereas correlation highlights behavioural alignment. Furthermore, ME contrast during speaking and interaction of ME and gestures indicate that bodily movement synchronisation is shaped not only by dominance but also by gesture types and speaking states: speech affects leadership more than gestures. The interactions highlight the multimodal nature of conversational leadership, where verbal and nonverbal modalities interact to shape dialogue dynamics.

1. Introduction

In human–human conversation, the movement and action of one party influences the other. Human nonverbal communication is mutual, and is a process involving two-sided adaptation and mutual influence [1]. This dynamic process is closely linked to behavioural synchronisation, a form of coordination which exists in daily interactions. “Synchronisation” emphasises the temporal coordination of behaviours between individuals, involving simultaneous occurrence of movements, speech rhythms, or physiological responses. Synchronisation can depend on two factors: (1) similarity/complementarity between behaviour produced by dialogue participant A and participant B; and (2) time between these behaviours, which can occur simultaneously or with a delay between behaviour of A and B [2]. Finding this delay or interval can help in identifying any real synchrony that exists. Synchronisation is dynamic: A performs movement X and B performs movement Y simultaneously with A or B performing a movement within a delay in time span; X and Y can correlate or not. This alternation and delay may vary during a conversation. Synchronisation movement in dyadic coordination can result in a successful interaction and mutual goal achievements in social interaction and many studies show a positive relationship between the quality of social interaction and movement synchronisation [3,4,5]. It strengthens relationships within a group, leading to higher performance on cooperative tasks [6]. However, the performance of the interlocutors that results in synchronisation does not always involve an equal workload. Sometimes, there is imbalance; while one is free to act, the other one has to keep pace [7].
Synchrony is also described as “alignment”, a term used to emphasise the tendency for individuals to repeat aspects of each other’s communicative behaviour to demonstrate involvement and understanding. This concept was introduced as “interaction alignment” by Pickering and Garrod [8], referring to the interpersonal alignment of mental representations underlying linguistics behaviour [9]. Researchers use the term “alignment” to describe observable similarities in communicative behaviours [10], such as lexical choices or co-speech gestures, referred to as lexical or gesture alignment. Different labels like repetition, imitation, mimicry, and matching are used to describe alignment in various contexts. Studies often compare behaviours between interlocutors, such as gaze, laughter, or sequences of body movements. These alignments, which are cross-participant paired behaviours, not only highlight similarities in one or more dimensions [9] but they can shape the dynamics of interaction. Alignment in communicative behaviours—whether lexical, gestural, or rhythmic—has various benefits in conversational interactions, including enhancing mutual understanding and improving problem-solving, while also providing a foundation for interlocutors to manage complex social dynamics, such as adaptation of roles like “leader” and “follower”.
In a social interaction task with two interlocutors, there may exist two roles: a leader, who keeps her or his own pace and rhythm, and a follower, who may follow the pace of their interlocutor [11,12]. In small group interactions, leaders may arise naturally by showing leading characteristics without having been assigned to the role of leader [13]. Thus, interlocutors may have roles that change over time, and they behave differently in different segments of dialogue. In some segments, one of the party leads and in some the other one leads. In some segments, no one leads. This role changes several times and there may be no clear pattern for that. Although synchronisation is induced by mutual interaction, in dyadic conversation it is unclear whether both individuals have equal influence. While alignment exists between co-speakers for segments of time, there may be no leader–follower dynamic between them. This begs the question of what decision procedures are available to identify what the situation is in any dialogue and for what stretches of time within.
It remains a challenge to understand what bodily motions might mean [14]—whether any action intended gesture or unconscious bodily adjustment—but independently of what the motions might mean (cf. [15]), one may study the nature and extent of influence of bodily motion of one dialogue party on the motions of others. One common approach to identifying synchrony is computing cross-correlation between bodily motion energy (ME) of interlocutors in the conversation. This may be accompanied by analysis of activity in other modalities, such as linguistic content. However, ME synchronisation patterns are of interest in their own right, as behaviours observers may note even without understanding the language used by interlocutors. Researchers commonly compute cross-correlations between ME of speakers in conversations, who act simultaneously or with a delay [16,17,18,19,20,21]. Additionally, this method along with windowing is often employed to determine whether an interlocutor leads the conversation [16,18,21].
While a correlation exists between bodily ME of interlocutors or other modalities of conversation and synchronisation, a bidirectional casual relationship exists [20] between synchronisation and movements in the conversation. Correlation, positive or negative, between behaviours of two communicating agents is not sufficient to identify which agent, if any, is leading the shared behaviour over any time span of focus. However, examining the behaviours through a temporal lag of one participant may enable insights into which participant is causing the aligned behaviours. One method to identify this casual relationship is the application of Granger causality (GC). GC aims to find cause–effect relations. It assumes the past values of other time series can provide predictive information on the current or future values of the time series, within a framework that often uses fixed lag structures. That is, GC examines whether one time series can provide statistically significant information about predicting another time series, under the assumption that causation is reflected through predictability [22]. X Granger-causes Y if past information on X predicts the behaviour of Y better than the past information of Y alone. GC uses auto-regressive models to measure the causation relationship between two time series, is widely used, and indicates that causes not only precede but also help predict their effects [23]. The method makes possible (depending on the data) the conclusion that X and Y mutually cause each other. GC is employed in a variety of fields such as economics [24], climate changes [25], neural interaction in neuroscience [26].
In this work, the conversational behaviour that we focus on is ME, a measure of the bodily movement of each interlocutor over the course of conversation. We endeavour to observe the nature of ME Granger causation in natural dyadic dialogue. We do this by exploring the relations between GC and simple lagged temporal correlations of ME of interlocutors over fixed length windows. Lagged correlation is used to capture the possibility that the ME values of one party during one stretch of time may correlate (positively or negatively) with the ME values of the other at the next stretch of time (the intuition is that positive correlation corresponds to behavioural similarity and negative correlation corresponds to behavioural complementarity; sometimes we consider the three possibilities of positive correlation, negative correlation or none, and sometimes we consider the binary contrast between significant correlation (positive or negative) and none). We can use GC to analyse the direction of influence of interlocutors on each other over time, and in relation to other qualities associated with the interlocutors. ME is a modality of body movement, and therefore we also consider what is happening with gestures in the same windows. Additionally, we consider whether the speech modality is also in use during the windows.
Other research has explored the cross modal interactions between gesture and a less shallow view of content [27], and we recognise the value of such perspectives. However, here we have consider only whether an agent is speaking or not in a window (cf. Bouamrane and Luz (2007) [28]). We use a dataset in which independent annotators have made judgments of the conversational dominance of the speakers, and we imagine that judgments are influenced by both the fine grained linguistic content and by the bodily motions of interlocutors. Here, we address data for which the independent annotators determined the interlocutors had unequal levels of dominance. We can use this to reflect on natural data in asking, essentially, how often is it the case that the more dominant participant leads the discussion. This is made operational by asking for what proportion of windows does the ME of the more dominant party GC the ME of the other party, the less dominant party (and in answering this, we might want to know how GC and basic correlation categories classify the same windows). One might ask of ME values themselves whether variation in them is “explained” best by Granger causation, by basic correlation categories, by whether the more dominant party is gesturing, by whether the more dominant party is speaking. These are issues we address here.
The analyses reported here are anchored in ME values, as described above. We examine windows of time and the relationship between ME values of dialogue partners during those windows, classifying the windows with categories according to the correlation type that is visible and according to the Granger causation type that is visible. We consider cross classifications according to those categories and the other behavioural categories associated with the windows (related to speech being present, or gesture types being present, as elaborated later). These analyses are complemented by analyses of how the various categories addressed impact the values witnessed for ME—we examine what the ME values are during windows classified using the categories. We do this by defining multi-nomial categorial variables that classify temporal windows of ME values, using those variables as predictors of ME, and evaluate resulting models, including with interactions of the predictor variables. We also focus on subsets of interactions among the predictors, the levels of ME differentiated by categories of windows. The research design emphasises both categorial and continuous views of ME. Both views on ME values—the fully cross-categorial and the relations on ME that follow the categories—are important to an overall perspective.
We use an observational paradigm in studying these qualities in the context of a multi-modal dialogue corpus [29]. The method of analysis may be applied to other datasets and other qualities associated with interlocutors, although even with respect to perceived dominance, the precise relationships that are reported here may be different in other dialogue datasets. Our purpose is to contribute to the understanding of observable qualities of natural dialogue, even apart from the linguistic content. We seek to understand the information encapsulated by categories of interlocutor ME correlation and causation, towards establishing their merit in classifying types of conversations and behaviours therein. We feel that this has value in its own right, just as ecological inventories have value. However, in an age in which generative AI is capable of producing synthetic interaction data, there may be relevance also to the problem of detection of synthetic interactions. One challenge in analysis of correlation and causation in dyadic dialogues is that timing and durations of acts within dialogue are variant. This can result in significant variety and volatility in time spans in which temporal nonverbal cause–effect behaviour of dialogues’ interlocutors is visible [1].
First, we describe past research that provides the method we adapt to general dialogue as recorded in multi-modal corpora (Section 2). We then describe a multi-modal corpus of interactions used in this research (Section 2.2), and the methods used to analyse the dialogue data (Section 3). Then, we present results derived from those methods (Section 4) and discuss our interpretation of these results (Section 4.2). The paper concludes (Section 5) with observations about the relevance of this work to multi-media computing.

2. Background

2.1. Prior Work

While some worked on statistical features of bodily position in natural dialogue [30], other researchers have analysed dynamics of synchrony [31] or dynamics in relation to other conservational features [32]. Here, we analyse the dynamics of bodily synchrony in natural dialogue, using ME as a measure of bodily motion.
Important work [33,34] applied windowing and cross-correlation on the bodily ME of patients and therapists to find synchrony between them. In addition to finding synchrony measures, they explored lagged windows to find when the patient leads or follows the therapist in therapy sessions. Expanding on this, researchers have used windowed cross-lagged correlation (leading) and the peak-pick algorithm [35] to explore the association between movement synchrony and social anxiety disorder. To clarify the leader–follower relationship between two interlocutors in a conversation and the division of these roles, Takamizawa and Kawasaki (2019) [7] applied transfer entropy between the behavioural rhythms of two participants on a cooperative task which needs interlocutors to synchronise their behaviour. The behaviour includes tapping intervals from a two-person cooperative tapping task. Further exploring leader–follower dynamics, Tomyta et al. (2023) [11] used a state-space model to identify leaders and followers in a dyadic tapping task. They defined two parameters: aSelf, indicating leader-like behaviour by maintaining independent rhythm, and aPair, reflecting follower-like behaviour by adapting to the partner’s rhythm. The study also recorded heart rate variability via ECG and brain activity through EEG to analyse physiological and neural correlates. Roles were assigned based on these parameters, with higher aSelf indicating leaders and higher aPair indicating followers. In a study on unconscious body movement synchrony and interpersonal interaction between two participants, Yun et al. (2012) [36] used EEG data that are produced during hand movement in a task where one of the participants is a leader and the other one is a follower. Their aim was to evaluate neural correlates and functional connectivity within and among the brain regions. The results of this work indicate that an increase in interpersonal body movement can be a measurement of social interaction.
Considering that not all conversations involve just two people, and in many, there are more than two interlocutors, and that these persons may align themselves with each other to reach their goals, the authors of ref. [19] explore aligned body motion correlation in triads conversation using a windowing method with a fixed length of 10 s. In this research, authors use the bodily ME of three persons in a conversation. They measured time-aligned bodily covariation and correlated it with various covariates (such as linguistic style matching and liking) related to interaction outcomes. Finally, Ravreby et al. (2022) [20] investigated how synchronisation, complexity, and novelty contribute to positive social bonding, while also exploring whether in dyads, one person is leading and the other is following, or if both alternatively change leader and follower roles. ME was analysed to measure synchronisation through Pearson correlation using windowing that the length of each window is defined dynamically. The dynamic roles of leader and follower were examined using GC analysis, specifically through pairwise conditional GC tests applied to participants’ movement data for each segment. This involved testing whether the movement of one participant could predict the movements of the other participant after accounting for the predictive power of their own movements. Their findings revealed that in 95% of the dyads, both participants alternated between leader and follower roles, displaying bidirectional coupling, either of participant causes or both. This dynamic mutual adaptation was more beneficial than a unidirectional leader–follower dynamic, which occurred in only 5% of the dyads. Altogether, the results demonstrated that in all the dyads at least one participant’s movements Granger-caused those of the other, indicating that partners mirrored each other’s movements. These findings suggest that all dyads followed the instructions and moved in a coordinated manner, and that in the vast majority displayed bidirectional coupling rather than unidirectional adaptation.
In the research reported here, we analyse the temporal flow of ME in dyadic dialogues using alternating lagged correlation tests on consecutive windows and also GC testing. Within the lagged correlations, we consider alternatives for designating which party is which (e.g., more dominant, …) and label the resulting lagged windows according to the category of correlation that holds (positive, negative or none, if the correlation is not significant). Similarly, we label windows in relation to the significance of GC (one party causing the other, mutual causation or no causation). We compare the ME GC labels with labels derived from simple lagged correlation of ME values to identify whether GC or correlation category (CC) is more efficacious in highlighting which participant independent observers classify as the more dominant party, potentially the “leader” for the conversation.
We aim to understand how the distributions of these labels interact with independent perceptions of dominance, to what extent dominant interlocutors lead, and the extent to which these labels “explain” variation in ME within any dialogue. The next sections provide more detail on the methods deployed, starting with a description of the dataset analysed.

2.2. Dataset

This research uses a multi-modal dataset called MULTISIMO [37]. MULTISIMO includes 18 videos of dialogue sessions in English (see https://multisimo.eu/, last verified 19 May 2025). In each session two interlocutors cooperate with each other to answer three very general knowledge questions asked by a moderator. Subsequently, they rank the responses based on the perceived popularity of responses, imagining the responses of external groups. There exist 36 participants who were randomly paired across these 18 sessions. Videos of paired interlocutors are synchronised and each video is a high-quality zoomed front view of an interlocutor. Camera angles, lighting, and background are fixed setup and only the interlocutor moves in each screen of video. Only the upper body of an interlocutor can be seen in each video. The entire dataset is approximately 4 h of video. The data are independently classified in relation to participant dominance. For each session, the dominance score, on a five point scale, for each participant is recorded separately by 5 annotators. We use the median of those values, and analyse the 15 of the 18 sessions for which the dominance values of the two participants was not equal. Annotators had access to both the audio and video, and thus the bodily motion modality and linguistic content modality. Annotators were not instructed to attend to any modality in particular, but it is natural to imagine that both behaviours in both modalities contributed to perceptions of dominance. Hand gestures were manually annotated, and each identified gesture was assigned with one of the following semiotic type values: beat, deictic, iconic, symbolic and arbitrary hand movement (AHM) (used for non-conversational gesture types, e.g., adapters).

2.3. Hypotheses

Our starting point assumption is that there is a very close relationship between classifications anchored in Granger causation with respect to ME values and simple lagged correlation of ME, where we consider across conversations the ME values of the more dominant (MD) participant in relation to those of the less dominant (LD) participant. By default, we expect the MD participant to be found to “lead” more than the LD participant. Given that we expect the annotations of dominance to have been influenced by bodily motion of participants and that gesturing entails bodily motion, we anticipate that there will be different sorts of interactions between semiotic types of gestures and categories of causation/correlation. In thinking about the values of ME and variation in ME overall, we expect that who is calculated to be leading ME will not be reducible to simply who is speaking.
In analysing values of ME, we have two ways of lagging the data—taking values of MD as preceding those of LD or those of LD preceding those of MD. The correlation categories (Pos, Open and Neg) and the Granger causation categories are such that if definite relationships exist for one lag (e.g., Neg or MD causes LD), then it could easily appear with insignificantly different strength for the complementary lag. We expect to see similar patterns in relationships for both sorts of lags.

3. Method

In this research, we are interested to analyse the temporal flow of ME in dyadic dialogues using alternating lagged correlation tests and GC. We construct a data frame containing normalised ME of the more dominant (MD) interlocutor and less dominant (LD) per frame who are paired in each dialogue. The conversation-level dominance determinations were obtained as described in Section 2.2—our intuition is that the MD participant is likely to be found to lead (using GC labeling or lagged correlation labeling) more windows than the LD participant in any conversation.
We identify from the annotations which interlocutor has been MD and which one has been LD in each dialogue. Then, we design ME data frame with three columns, frame number, ME of MD and ME of LD. In the next step, a lagged window (with a 0.3 s duration) is rolled on ME of paired interlocutor; lagged window consists of present ME of the interlocutor who is MD and lagged ME (ME occurs later) of the interlocutor who is LD in the dialogue. We call it MD interlocutor preceding. Separately, a lagged window is rolled on ME when the LD interlocutor precedes; lagged window covers present ME of the interlocutor who is LD and the lagged ME of the interlocutor who is perceived as MD in dialogue. For each lagged window, features such as correlation and GC between ME values of MD and LD are computed.
The reason we consider both sorts of lag, with ME of MD preceding that of LD in one case, and ME of LD preceding that of MD in the other case is that there is not a pre-defined priority for either. Over the course of a conversation in which, overall, one party is perceived as more dominant than the other who is evidently “leading” the linguistic or non-linguistic action may vary. The lagged correlations allow classification of windows in relation to whether the ME values of the preceding party “anticipate” values for the other, whether that is in positively corresponding values or negative, complementary values. Computing GC labels over the same data supports an alternative classification of the same windows. For either the lagged correlation or the GC labels, as stated in Section 2.3, we expect the same overall patterns.
Additionally, the mean and median ME, gesture types, and speaking state of the interlocutor—who is the owner of the present ME and whose ME precedes—are extracted. Finally, a labeling approach is performed for these features and statistical methods are employed to investigate their interaction. Figure 1 and Figure 2 show a drawing of the method applied on each data construction. The depiction at the top of each is meant to indicate that the data of the “present” participant is considered in a manner that takes values for that participant (MD in Figure 1 and LD in Figure 2) in relation to values of the other participant from one window-length later.

3.1. Motion Energy Computing

A video is composed of a series of still images known as frames. Each frame involves multiple coloured pixels and when an object moves, the colours of these pixels change in the next frame. The difference between colours of pixels in two successive frames is referred to as motion energy (ME) [33]. ME is quantified by the number and amount of pixel changes summed between each frame and its prior frame. The first frame has an ME of zero since there exists no preceding frame. This technique belongs to frame-difference algorithms, which detect changes but do not indicate the direction of movement [33]. To effectively apply frame-difference methods, certain conditions must be stabilised; the camera, background, and lighting should remain unchanged, as alterations in these can be computed as ME. Additionally, objects within the frame should have distinct boundaries and not be obscured, as frame-difference algorithms detect pixel changes rather than identifying objects themselves. In frame-difference algorithms, the areas of target objects are defined to calculate their movement called region of interest (ROI). Since in MULTISIMO, only interlocutors move, while the camera, lighting, and environmental conditions are controlled and constant, the MEA tool [33,34,38] is applied in this research. The MEA tool extracts the ME of video frames utilising the frame-difference algorithm while it has an interface for easy interaction. Initially, the video is loaded into the tool, and the whole body of an interlocutor is manually defined as the ROI using a mouse. Then, the tool computes the motion of each frame and provides these as an output series in a text file.
In other work [39], we have provided a validation of ME measurements using MEA through comparison of MEA values in actual data and perturbed data and in relating MEA calculations to calculations based on an independent video-analysis system.

3.2. Rolling Lagged Window

In a dialogue, an interlocutor may lead, follow the other interlocutor, or have no roll, neither leading nor following. However, these roles change from one role to another in different segments of dialogues. Either leading or not, interlocutors may align their behaviours with each other. Each of these phenomena, leading and alignment, may exist independent of each other. In dialogue’s dynamic and human–human interaction analysis, the cross windowing method is applied to determine the relationship between the ME of interlocutors at different segments of conversation. This approach involves rolling a window over the ME series to capture the dynamic changes that occur in each segment of the dialogue. Thus, a window is a duration of a segment of sequential measurements taken from a time series which here is ME. While synchronised movement might occur simultaneously, there can also be instances where one person’s movement precedes the other person’s movement by a certain delay. This delay duration is termed “lag”, representing the time difference between two similar features in two-time series. Windowing on the present ME along with a lagged ME can capture the synchronisation that does not occur simultaneously but unfolds at different time spans and as a result, sequentially influences dynamics in a conversation; lagged ME refers to ME that occurs with a lag relative to ME of the present time; synchronisation refers to temporal alignment between ME of paired time series; sequential influence dynamics refers to how one action temporally impacting another action.
To clarify and explain lagged synchronisation, synchronisation between ME that occurs first and then another ME occurs, this work uses “precede” to indicate which ME happens first. For instance, if interlocutor MD moves at time k and interlocutor LD at time k + 1, MD precedes LD, since MD moves first and then LD initiates a movement while there is a delay. This work utilises this lagged windowing method to assess alignment and subsequent, sequential influencing of dynamics between the MEs of the interlocutors over various time spans of the dialogue. Assessment is conducted per window by using Spearman correlation and GC.
To apply the lagged windowing approach on ME when MD precedes LD, a lagged window covers the ME of interlocutor MD at the present time and the ME of interlocutor LD at the later time. This means the interlocutor MD is ahead of person LD by a lag. Then, the Spearman correlation between these ME time series inside the lagged window is computed. For example, to compute the preceding of interlocutor MD, a lagged window covers ME of MD from 0 to 0.3 s and ME of interlocutor LD from 0.3 to 0.6 s. Then, the Spearman ranked correlation of ME covered by the window is computed. Figure 1 shows the lagged window when MD precedes. Concurrently, the GC of the lagged window is computed. With respect to the GC, two different conditions are computed, MD causes LD and also LD causes MD while MD precedes. The extracted coefficients are profiled under the words “MD precedes”, referring to the moment interlocutor MD precedes and happens first and its influence. In the next state, the window transitions to the next point, maintaining a constant length. The start point of the subsequent window is set to the endpoint of the proceeding previous window, and the process is executed again. This process is carried out until the rolling window reaches the end of the conversation. The same process as above is applied to moments of LD preceding. The lagged window covers the present ME of interlocutor LD and lagged ME of MD. Then, their Spearman-ranked correlation and GC are computed. These coefficients are profiled under the words “LD precedes”, which refers to the preceding moment for interlocutor LD in which the LD interlocutor moves first for a short segment of time.
Windowing presents various parameters: window length and window step size or overlap. In our study, the window length was set to 0.3 s. To avoid repetition, we opted not to use overlaps, ensuring no shared time between the window and subsequent window. The reason for the 0.3 s window length is taken as an intermediate view between 30 and 3000 ms as minimal durations of perception and cognitive integration of temporal information [40]. Note that lagged window offsets may be located outside of the time range, since it moves forward and for the last windows renders them undefined. Thus, their correlation is set to 0 and the p-value to 1. The same holds for GC. The rolling lagged window approach aims to determine the temporal dynamics between time series of ME by correlation and causality that vary across time intervals within the dialogue. Time intervals, within which causality or correlation is visible, can span from 0.03 s up to 3 s. These may reoccur several times but could be disrupted by scenes that are unrelated, such as a participant speaking while the other one is listening, with these disruptions being different in length. The direction of influence in a sub-interval, a window, can either be bidirectional, unidirectional driven by either interlocutor MD or LD, or no causation. Thus, if the full time span is analysed first, temporal relations are not found at all. Also, bidirectional relations mask temporal unidirectional relations and a unidirectional relation from X to Y masks temporal bidirectional influence or unidirectional influence from Y to X.

3.3. Window Labeling

After applying the lagged windowing method on ME times-series of paired interlocutors (MD and LD), there exists a series of correlation and causation coefficients for each window that were profiled as “MD Precedes” and “LD Precedes” (see in Section 3.2 the material pointed at by arrows in Figure 1 and Figure 2). In addition to the mentioned features, for each lagged window, the mean and median of ME of the preceding interlocutor (who is the owner of the present ME) is computed and whether the interlocutor speaks and also gestures during the window are identified. Thus, the profile “MD Precedes” includes features as the correlation coefficient, and its p-value, MD causes LD, LD causes MD, mean and median of ME of interlocutor MD, gesture types and speaking of interlocutor MD. These features are provided when LD precedes as well, profiled as “LD Precedes”. Then, each of these features are labeled. Experiments include analysis of the cross classification induced by the distinct categories of labeling (GC, lagged correlation status, gesture type, speaking presence). In the following, different labeling is detailed.

3.3.1. Correlation Labeling

To investigate temporal flow and dynamic influence in the conversation for each interlocutor (MD and LD), we label the correlations as follows:
  • If the p-value of correlation for a window is non-significant ( p 0.05 ), its correlation is labeled “Open”.
  • If the p-value of the window is significant and its correlation is positive ( ρ 0 ,   p < 0.05 ), it is labeled “Pos”.
  • If the p-value is significant and its correlation is negative ( ρ < 0 ,   p < 0.05 ), it is labeled “Neg”.
The “Pos” label indicates a positive correlation between the ME of the MD and LD interlocutors within a lagged window, meaning their ME are aligned with a delay corresponding to behavioural similarity. The “Neg” label shows a negative correlation, meaning their behaviours move in opposite directions and are not aligned under a delay corresponding to behavioural complementarity. The “Open” label refers to ME of the MD and LD are not correlated—no behaviours alignment. This labeling approach is applied to correlations for “MD Precedes” and also “LD Precedes”. Also, a binary labeling is designed:
  • If the p-value of the correlation for a window is non-significant ( p 0.05 ), its correlation is labeled “Open”.
  • If the p-value of the window is significant and its correlation is positive ( p < 0.05 ), it is labeled “Correlated”.

3.3.2. Granger Causation Labeling

As mentioned already in this work, the direction of influence in a sub-interval, a window, can either be bidirectional, unidirectional, or no causation driven by either interlocutor MD or LD. During computing GC, there exist two statuses for each lagged window, i.e., MD causes LD and LD causes MD. If both of these have significant p-values, it means both have causation (both influence each other); if neither of these are significant, it means none have causation. Thus, there exist four conditions: MD causes LD; LD causes MD; MD and LD cause each other; and none causes another. For each lagged window, we define the window’s causation conditions, using the p-value of the window’s GC as follows:
  • If the p-values of MD causes LD and LD causes MD are significant ( p < 0.05 ), the window is labeled “Bi-Causation” (MD and LD cause each other).
  • If the p-value is significant for none of them ( p 0.05 ), it is labeled “No Causation”.
  • If the p-value is significant only for MD causes LD ( p < 0.05 ), it is labeled “MD Causes LD”.
  • If the p-value is significant only for LD causes MD ( p < 0.05 ), it is labeled “LD Causes MD”.
This labeling has been applied to the “MD Precedes” data and also “LD Precedes” data. Also, a binary labeling is designed:
  • If the p-values of MD causes LD or LD causes MD are significant ( p < 0.05 ), the window is labeled “Causation” (any GC exists).
  • If the p-value is significant for none of them ( p 0.05 ), it is labeled “No Causation”.

3.3.3. Gesture Labeling

In the next step, the occurrence of a gesture in each lagged window is examined. In each lagged window, it is determined whether the gestures occur by the interlocutor whose movements occur first, preceding the other interlocutor (already named “MD Precedes” and “LD Precedes”, see Section 3.2). If the interlocutor who is preceding performs a gesture, the window is labeled by the type of gesture, either Beat, Iconic, Deictic, Symbolic, or AHM. If there are no gestures, the window is labeled Agestural. For concision, each window for “MD Precedes” is labeled either Beat, Iconic, Deictic, AHM, Symbolic or Agestural. The same process is carried out for “LD Precedes” windows. The applied test detailed in Section 4 shows the count of Symbolic gestures are not enough to have a valid test. Thus, Symbolics are counted as Iconic since Symbolic and Iconic both involve representation and abstraction. After counting Symbolic as Iconic, the tests are valid.

3.3.4. Speaking Time Labeling

Similar to gesture labeling, it is determined whether the preceding interlocutor (the owner of present ME in the window) is speaking in the window. In each window, the preceding interlocutor may speak or not. If that person speaks in the window, the window is labeled “Speaking”, and if he does not speak, it is labeled “Silent”. This labeling is applied to “MD Precedes” and “LD Precedes” windows.

3.3.5. Final Features

We form the labels for “MD Precedes” and “LD Precedes” profiles to examine whether causality and correlation are independent and whether the direction of influencing is in the dialogue. As explained above, MD refers to more dominant interlocutors and LD refers to less dominant interlocutors. Each lagged window covers the ME of paired interlocutor for a specific time of 0.3 s with a delay of 0.3 s. Each profile of “MD Precedes” and “LD Precedes” has four labels and ME measurements:
  • Correlation: “Open”, “Pos”, and “Neg”.
  • Correlation: “Open”, “Correlated” (binary labeling).
  • GC: “MD Causes LD”, “LD causes MD”, “Bi-Causation”, and “No Causation”.
  • GC: “Causation”, and “No Causation” (binary labeling).
  • Gesture type: “Beat”, “Iconic”, “Deictic”, “AHM”, and “Agestural”.
  • Speaking state: “Speaking” and “Silent”.
  • Median and mean of ME.
“MD Causes LD” labels refer to the lagged window concerning the bodily movement correlation between paired interlocutors, showing statistical significance of the MD interlocutor’s actions causally influence the LD interlocutor’s response. “LD Causes MD” is the opposite of the above; LD interlocutors influence the MD interlocutor’s response.

3.4. Summary

We have detailed how we have determined labels for successive temporal windows of dialogue, as recorded in frames of video in a multi-modal corpus. The labels are constructed from sorts of lagged correlations that hold between ME values of the participant externally perceived as more dominant and the party perceived as less dominant. We also construct labels derived from natural categories of Granger causation from the same data. Separately, windows are labeled with respect to the gesture sort, if any, of the preceding interlocutor (the owner of present ME in the window) and whether he/she is speaking or not. We also analyse the mean and median of the ME and the impacts of the other categories we consider on measurements of the preceding interlocutor’s ME. The next section reports the outcomes of these experiments.

4. Experiments and Their Results

We begin by testing an intuition articulated at the start of Section 2.3, namely that we expect the MD participant to be found to “lead” more than the LD participant. Using the GC labels, this is evident, as indicated in Table 1. A χ 2 test of the interaction between the lag type and causation categories ( χ 2 = 2.8984 ,   d f = 3 ,   p = 0.4076 ) indicates that there is not a significant difference in the GC category label distributions in relation to the lag types. Regardless of the dominance of the party whose ME values are lagged ahead, the more dominant party is calculated with ME values that GC those of LD more often ( p < 0.02 ) (this is computed using a binomial distribution for the two definite cause cases, for 3135 observations where MD precedes and 3214 observations where LD precedes) than those of LD being seen to GC those of MD.

4.1. Categorial Interactions with Categorial Representations of Relationships Between Interlocutors’ Motion Energy

4.1.1. Interaction of Causation and Correlation

As explained in Section 3.3, windows are labeled. To explore the interaction between correlation and GC in the profile of MD interlocutors preceding, a contingency table cross classifies GC labels and correlation labels of the windows. In Table 2, the first row of the “Player” column illustrates the rows of the contingency table, observations for each category of GC and correlation. Then, the Chi-squared test is applied on the table which is significant ( χ 2 = 1555.5 ,   d f = 6 ,   p < 2.2 × 10 16 ) and indicates that there exists interaction between GC and correlation categories. We measure the degree of association between correlation and GC using Cramer’s V test. The strength of association between two categorical variables of correlation and GC labels is Cramér’s V = 0.1659 .
The same process is applied on the profile of LD interlocutors preceding. In Table 2, the second row of the “Player” column illustrates observations for the “LD Precedes” profile. Applying a Chi-squared test on the cross classification between GC and correlation labels shows significant interaction between these categories ( χ 2 = 1648.7 ,   d f = 6 , p < 2.2 × 10 16 ) when LDs precede. The degree of association between correlations is Cramér’s V = 0.1708 .
Since interaction is significant for both profiles, we computed adjustment residuals to find where these interactions are significant, between which categories, whether there is no causation when there is no correlation, to find the direction of the correlation and to identify who is leading at that moment. Table 3 depicts the results of the standard residual for GC and correlation categories for these profiles. Bonferroni adjustment is applied to α = 0.05 for 12 comparisons, α = 0.0042 , and the critical value for N ( 0 ,   1 ) α = 2.8653 .
The adjusted residual for the moment MD interlocutors precede (see the first row of the “Player” column in Table 3) shows the interaction between Pos-MD causes LD labels (e.g., 18.418) indicates that positive correlation, where both interlocutors’ ME align in the same direction, has a high magnitude when the MD interlocutor influences the LD interlocutor. Also, the standard residuals between Pos-LD Causes MD (e.g., 20.3539) illustrate a positive correlation also occurs significantly with a high magnitude when the LD interlocutor influences ME of the MD interlocutor. Neg-MD causes LD (e.g., 9.4538) show a positive (significant) high magnitude adjusted residual. Neg-LD causes MD is, e.g., 7.9003 suggests that while LD interlocutor has a positive high magnitude, it is smaller than Neg-MD causes LD. It indicates, in moments of negative correlation when LD influences MD interlocutor, the MD interlocutor may respond in an opposing or misaligned manner. These results and patterns visible during MD preceding emerge when LD precedes in the conversation too. The adjusted residuals for the moments that LD interlocutors precede (see the second row of the “Player” column in Table 3) show that the difference between the observed and expected frequencies for Pos-MD Causes LD labels is 19.6139, for Pos-LD Causes MD is 19.3959, for Neg-MD Causes LD is 13.2908, and for the Neg-LD Causes MD category, the standard residual is 11.2631. All these values are positive with a magnitude that entails statistical significance: there are many more observations in these cross classifications than would be visible with no meaningful interaction between the GC classification and lagged correlation classification. Regardless of the lagged precedence (MD preceding or LD preceding), labels of definite causality (MD causes LD, LD causes MD, or Bi-causation) are witnessed in greater excess expectation for positive lagged correlation than negative lagged correlation and for negative lagged correlation than open correlation. In the later cases—definite causality but open lagged correlation—a significant dearth of observations is noted. Colors are used in tables and text to help readers identify and track key data points that we discuss and included solely for clarity.
As explained in Section 3.3.1 and Section 3.3.2, binary labels of correlations and GC are examined as well. Considering correlation either as significant or non-significant abstracts over the correlation direction. Considering GC either as significant or non-significant similarly binarises Granger causality. Table 4 shows observations for each category. Chi-squared is computed for MD preceding ( χ 2 = 1336.3 ,   d f = 1 ,   p < 2.2 × 10 16 ) and LD preceding ( χ 2 = 1506.6 ,   d f = 1 ,   p < 2.2 × 10 16 ), applying Bonferroni adjustment to α = 0.05 for four comparisons, α = 0.0125 , and the critical value for N ( 0 ,   1 ) α = 2.498 . The degree of association between these categories, Cramer’s V, for each is Cramér’s V = 0.2174 and Cramér’s V = 0.2309 . Table 5 depicts the standard residual for the binary categories. As can be seen in the table, for the profile of “MD Precedes”, Correlated-Causation is more than expected if there were no interactions and Open-Causation is less than expected values. It is opposite for the No Causation category. This pattern is true for the profile of “LD Precedes”. However, the magnitude is higher in all categories when LD precedes. That is, regardless of whether LD or MD values of ME are taken as preceding the other, a causality condition (MD causes LD, LD causes MD, or Bi-Causation) corresponds to a clear lagged correlation condition (Pos or Neg) and, conversely, the lack of causation corresponds to open lagged correlation far more than would be expected with a random interaction between the categorisations.

4.1.2. Interaction of Causation and Gesture

As described in Section 3 and Section 3.3.3, it is identified whether the interlocutor ME precedes (i.e., occurs earlier than their partner’s) gestures within each window. In this experiment, the chi-squared test is applied on a contingency table of GC and gesture labels to explore their interaction. The test is significant for MD preceding moments ( χ 2 = 69.861 ,   d f = 12 ,   p < 3.401 × 10 10 ) and also LD preceding ( χ 2 = 412.94 , d f = 12 , p < 2.2 × 10 16 ), which demonstrates a significant interaction between GC and gestures. Cramer’s V shows weak association for both tests Cramér’s V = 0.0287 and Cramér’s V = 0.0698 . The third and fourth rows of the “Player” column in Table 3 show the standard residuals of the tests. Applying Bonferroni adjustment to α = 0.05 for 20 comparisons, α = 0.0025 , and the critical value for N ( 0 ,   1 ) α = 3.0233 . The standard residuals indicate where MD precedes, and MD causes LD, Beat, AHM, and Agest are significant; MD causes LD is dominated by observation of Beat and AHM; there is a lack of observations of Agest. On the other hand, for LD causes MD, observations are not significant. Conversely, where LD precedes, all residual values are significant for all GC and gesture categories either MD Precedes or LD Precedes. In both categories of MD causes LD and LD causes MD, Agest shows a lack of observation relative to what would be expected with no interaction, and Beat, Iconic, Deictic, and AHM are dominated by observations relative to what would be expected with no interaction. However, comparison between these two categories, MD causes LD and LD causes MD, represents the magnitude of residuals are higher when MD causes LD. Regardless on which participant’s ME is taken as preceding the other, there are fewer windows where the preceding individual does not gesture where a GC condition holds on ME values than where no GC is seen, compared to what would be expected without a dependence between gesture types and causality types. The strength of patterns for each gesture type varies between MD preceding and LD preceding.

4.1.3. Interaction of Causation and Speaking

As described in Section 3 and Section 3.3.4, it is identified whether the interlocutor ME precedes (i.e., occurs earlier than their partner’s) speaking during each window. Thus, next, the interaction of speaking state and GC is tested for significance. Table 2 illustrates the observations for these categories. For MD preceding moments, the interaction is significant ( χ 2 = 217.21 ,   d f = 3 ,   p < 2.2 × 10 16 ). The association between categories is Cramér’s V = 0.0877 . When LD precedes interaction is significant χ 2 = 250.89 ,   d f = 3 , p < 2.2 × 10 16 and the degree of association is Cramér’s V = 0.0942 . The fifth and sixth rows of the “Player” column in Table 3 show residuals for speaking and GC categories. Applying Bonferroni adjustment to α = 0.05 for eight comparisons, α = 0.0063 , and the critical value for N ( 0 ,   1 ) α = 2.7344 . All residual values are significant and their magnitude is high. There is greater abundance of instances for speaking moments than would be expected with no interaction in both MD causes LD and LD causes MD, and a dearth of observation of Silent, either MD precedes or LD precedes. However, the magnitude of residuals is bigger for the LD causes MD category in both profiles, MD precedes and LD precedes and even bigger in both categories when LD precedes.
By applying binary classification to the GC of each window, a contingency table of binary GC category and speaking is designed (see Table 4 for observations). Chi-squared is computed for MD preceding ( χ 2 = 213.01 ,   d f = 1 ,   p < 2.2 × 10 16 ), and the Cramer’s V for each is Cramér’s V = 0.0868 . The interaction is significant for LD preceding ( χ 2 = 250.02 , d f = 1 ,   p < 2.2 × 10 16 ), and the degree of association is Cramér’s V = 0.09404 . Table 4 shows the standard residual. Applying Bonferroni adjustment to α = 0.05 for four comparisons, α = 0.0125 , and the critical value for N ( 0 ,   1 ) α = 2.498 . As the results show, for the profile of “MD Precedes”, Speaking-Causation is more than expected if there were no interactions and Silent-Causation is less than expected values. It is opposite for the No Causation category. This pattern is true for the profile of “LD Precedes”. However, the magnitude is higher in all categories when LD precedes.

4.1.4. Interim Conclusion

We understand from these analyses of the interactions between categorial representations that categories derived from simple lagged correlation and from Granger causation, both capturing relationships between measures of dialogue participants’ ME, both have merit in classifying ME activity in windows. It has been shown that the categories have a non-empty intersection in classifying windows, but that they are not identical and engage with other categorial relationships differently. Inasmuch as the vocabulary of Granger causation lends well to the discussion of “leadership” in a conversation, we see merit in adopting Granger causation evaluation as a means of classifying temporal windows of interaction, notwithstanding the demonstration we have provided that simple lagged correlation is also meaningful.

4.2. Discussion

This study provides insights into the dynamics of ME and its relationship with dominance, causality, correlation, speech, and gesture modalities in dialogues. By analysing a multimodal dataset, the movements of interlocutors are examined in relation to other modalities, investigating how these dynamics associate with perceived dominance and how often the more dominant participant leads the discussion. The findings unfold complex temporal patterns of non-verbal communication and behavioural coordination. Recall that independent observations of which participant is more dominant than the other in each of the dialogues considered provides a separate indication of which party “leads” the interaction. It has been shown that the labeling of windows according to ME GC conditions is compatible with these independent observations (which this work noted were also potentially influenced by spoken content).
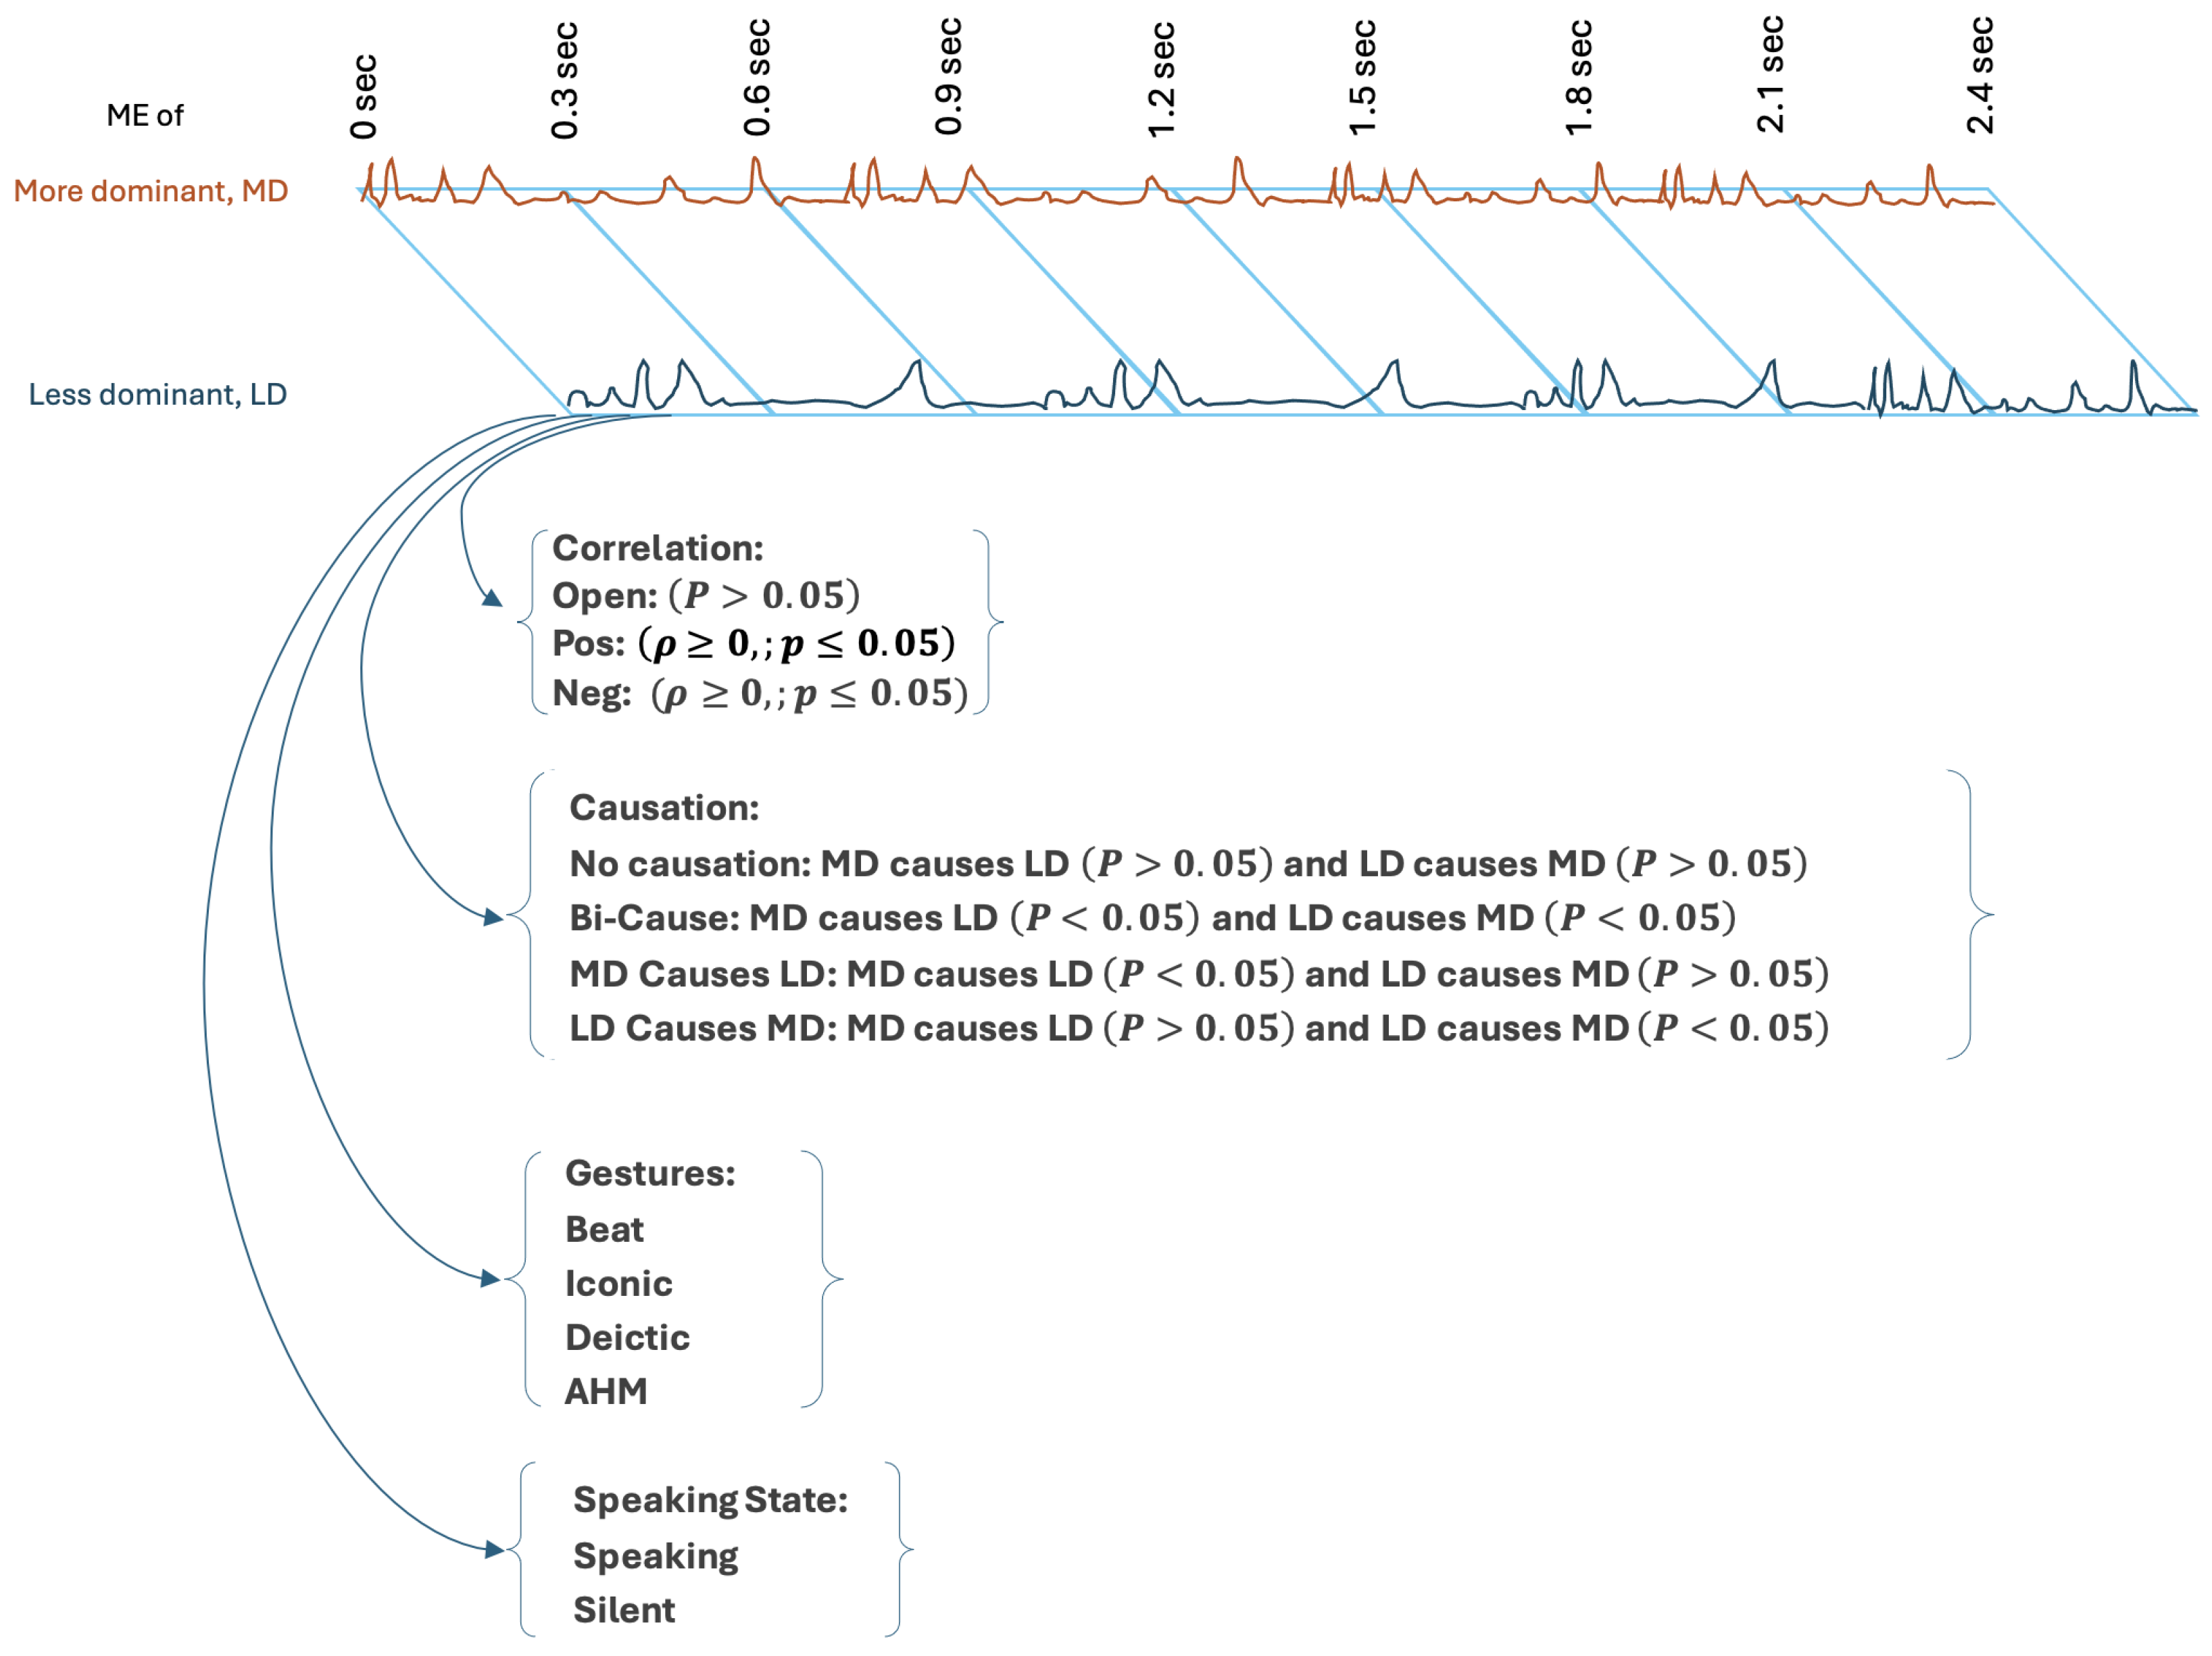
Synchronisation is an indication of temporal alignment and simple lagged correlations of ME capture aspects of temporal alignment in ME, while Granger causation provides insights into the directional influence between interlocutors. Positive correlations are often associated with cooperative alignment, whereas negative correlations are complementary and might indicate moments of changes or transitions between roles such as leading and speaking. The results reported in Section 4.1.1 demonstrate that lagged correlation and GC are related but distinct phenomena. Of course, this is an analytical truth, based on their definitions; however, here this study demonstrates the use and interactions of both methods in classifying ME synchronisation. These findings suggest that correlation and causation are interdependent in conversation, with the effect of one influenced by the level of the other, regardless of whether the MD or LD interlocutor initiates movement. Specifically, analysis using GC reveals that the ME of MD interlocutors frequently Granger-cause the ME of LD interlocutors across multiple segments of time, demonstrating a relationship between dominance perception and leading behaviours. This supports the hypothesis that interlocutors perceived as dominant often lead during conversations.
However, the LD interlocutor also exhibits some moments of influence, particularly during cooperative alignment–positive correlation (Pos-LD causes MD when MD precedes) and speaking (see Table 3). This can suggest bidirectional causation; while one interlocutor may be perceived as MD in a conversation, they do not exclusively control or direct the interaction all the time. Instead, both interlocutors can influence the dialogue, even if one is generally MD and influences more. These findings align with prior research emphasising mutual adaptation in interpersonal coordination and also studies on alternating leadership dynamics draw attention to the fact that while dominance influences leadership frequency, conversational leadership is dynamic and bidirectional, and this role changes over time. Negative correlation during moments when MD interlocutors precede (Neg-MD Causes LD) and when MD interlocutors respond to LD interlocutors (Neg-LD Causes MD) reflects moments when the influence from MD is aligned with the LD’s movements but in the opposite direction (complementary alignment). This can refer to challenges in maintaining synchronisation. On the other hand, this complementary alignment may indicate a transition between the interlocutors. Not only positive correlations can show leadership, but also negative correlations might show the leader adjusting their ME—either reducing or increasing it—to allow their interlocutor to follow, effectively managing the conversation. This suggests that negative correlation could be part of a deliberate strategy to transition roles and maintain the leading process.
The incorporation of gesture and speech modalities highlights their significant roles in ME synchronisation and causation dynamics. When MD interlocutors gesture, their influence on the LD interlocutor’s ME is significantly increased. This suggests that gestures promote dominance (perhaps due to their conveying additional information beyond the linguistic content; perhaps due to their mere occupation of the visual field), and shape the conversation and as a result, attract attention of observers. Results show that leading behaviour is often accompanied by specific gesture types, such as Beats and Iconic gestures. For example, MD interlocutors frequently employ Beat gestures during windows classified as “MD Causes LD”—the nonverbal modality evidently strengthens their leading role. Iconic and Beat gestures employed by the leader can emphasise their role in emphasising and structuring the conversation. Beat gestures, in particular, help emphasise rhythm and alignment in communication, while Iconic gestures convey meaning and empower the leader’s role in managing the dialogue. Whether an interlocutor takes up such a gesture is not addressed here, even though the implication of the label “MD Causes LD” in any window is that the ME of LD is influenced by the ME of MD and that includes the ME of the gesture itself. This can be partly assessed using distributions of gesture sequence labelings corresponding to the interlocutors’ individual and joint activity—this is a separate set of investigations.
We explore how the temporal flow of ME values relates to categories of interaction through regression analysis (see Appendix A). Regression analyses show that causation, correlation, gestures, and speaking modalities affect variability in ME across segments of time captured by each window. ME variability increased by adding these conversational features to the regression model as predictors. This proves the need to consider multiple interacting factors to fully grasp the complexity of conversational dynamics. However, regression models do not show any ME pattern shaped by dominance, referring to the complexity of dynamics in human–human interactions, shaped by interlocutors’ roles and multimodal behaviours (detailed in Appendix A.1).
The analysis of interaction differences between categories provided further evidence of relationships among causation, correlation, and speech modality. Pairwise comparisons show contrasts on ME depend on GC categories, particularly during speaking and alignment moments—positive and negative correlation (see Table A6 and Table A7). When ME data of MD interlocutors are lagged to precede LD, and correlation is significant, and MD speaks, ME values were more significantly different, indicating a stronger influence of MD interlocutors during windows that are either positively or negatively correlated in interlocutors’ ME values, particularly positive correlation. This contrast of ME cannot be seen where LD participants precede. Speaking moments consistently show higher ME than silent ones, emphasising the importance of vocal communication and validate that speaking increases motion energy compared to silent moments. During alignment, MD interlocutors have stronger influences on ME when they lead, while LD interlocutors have a more limited impact.
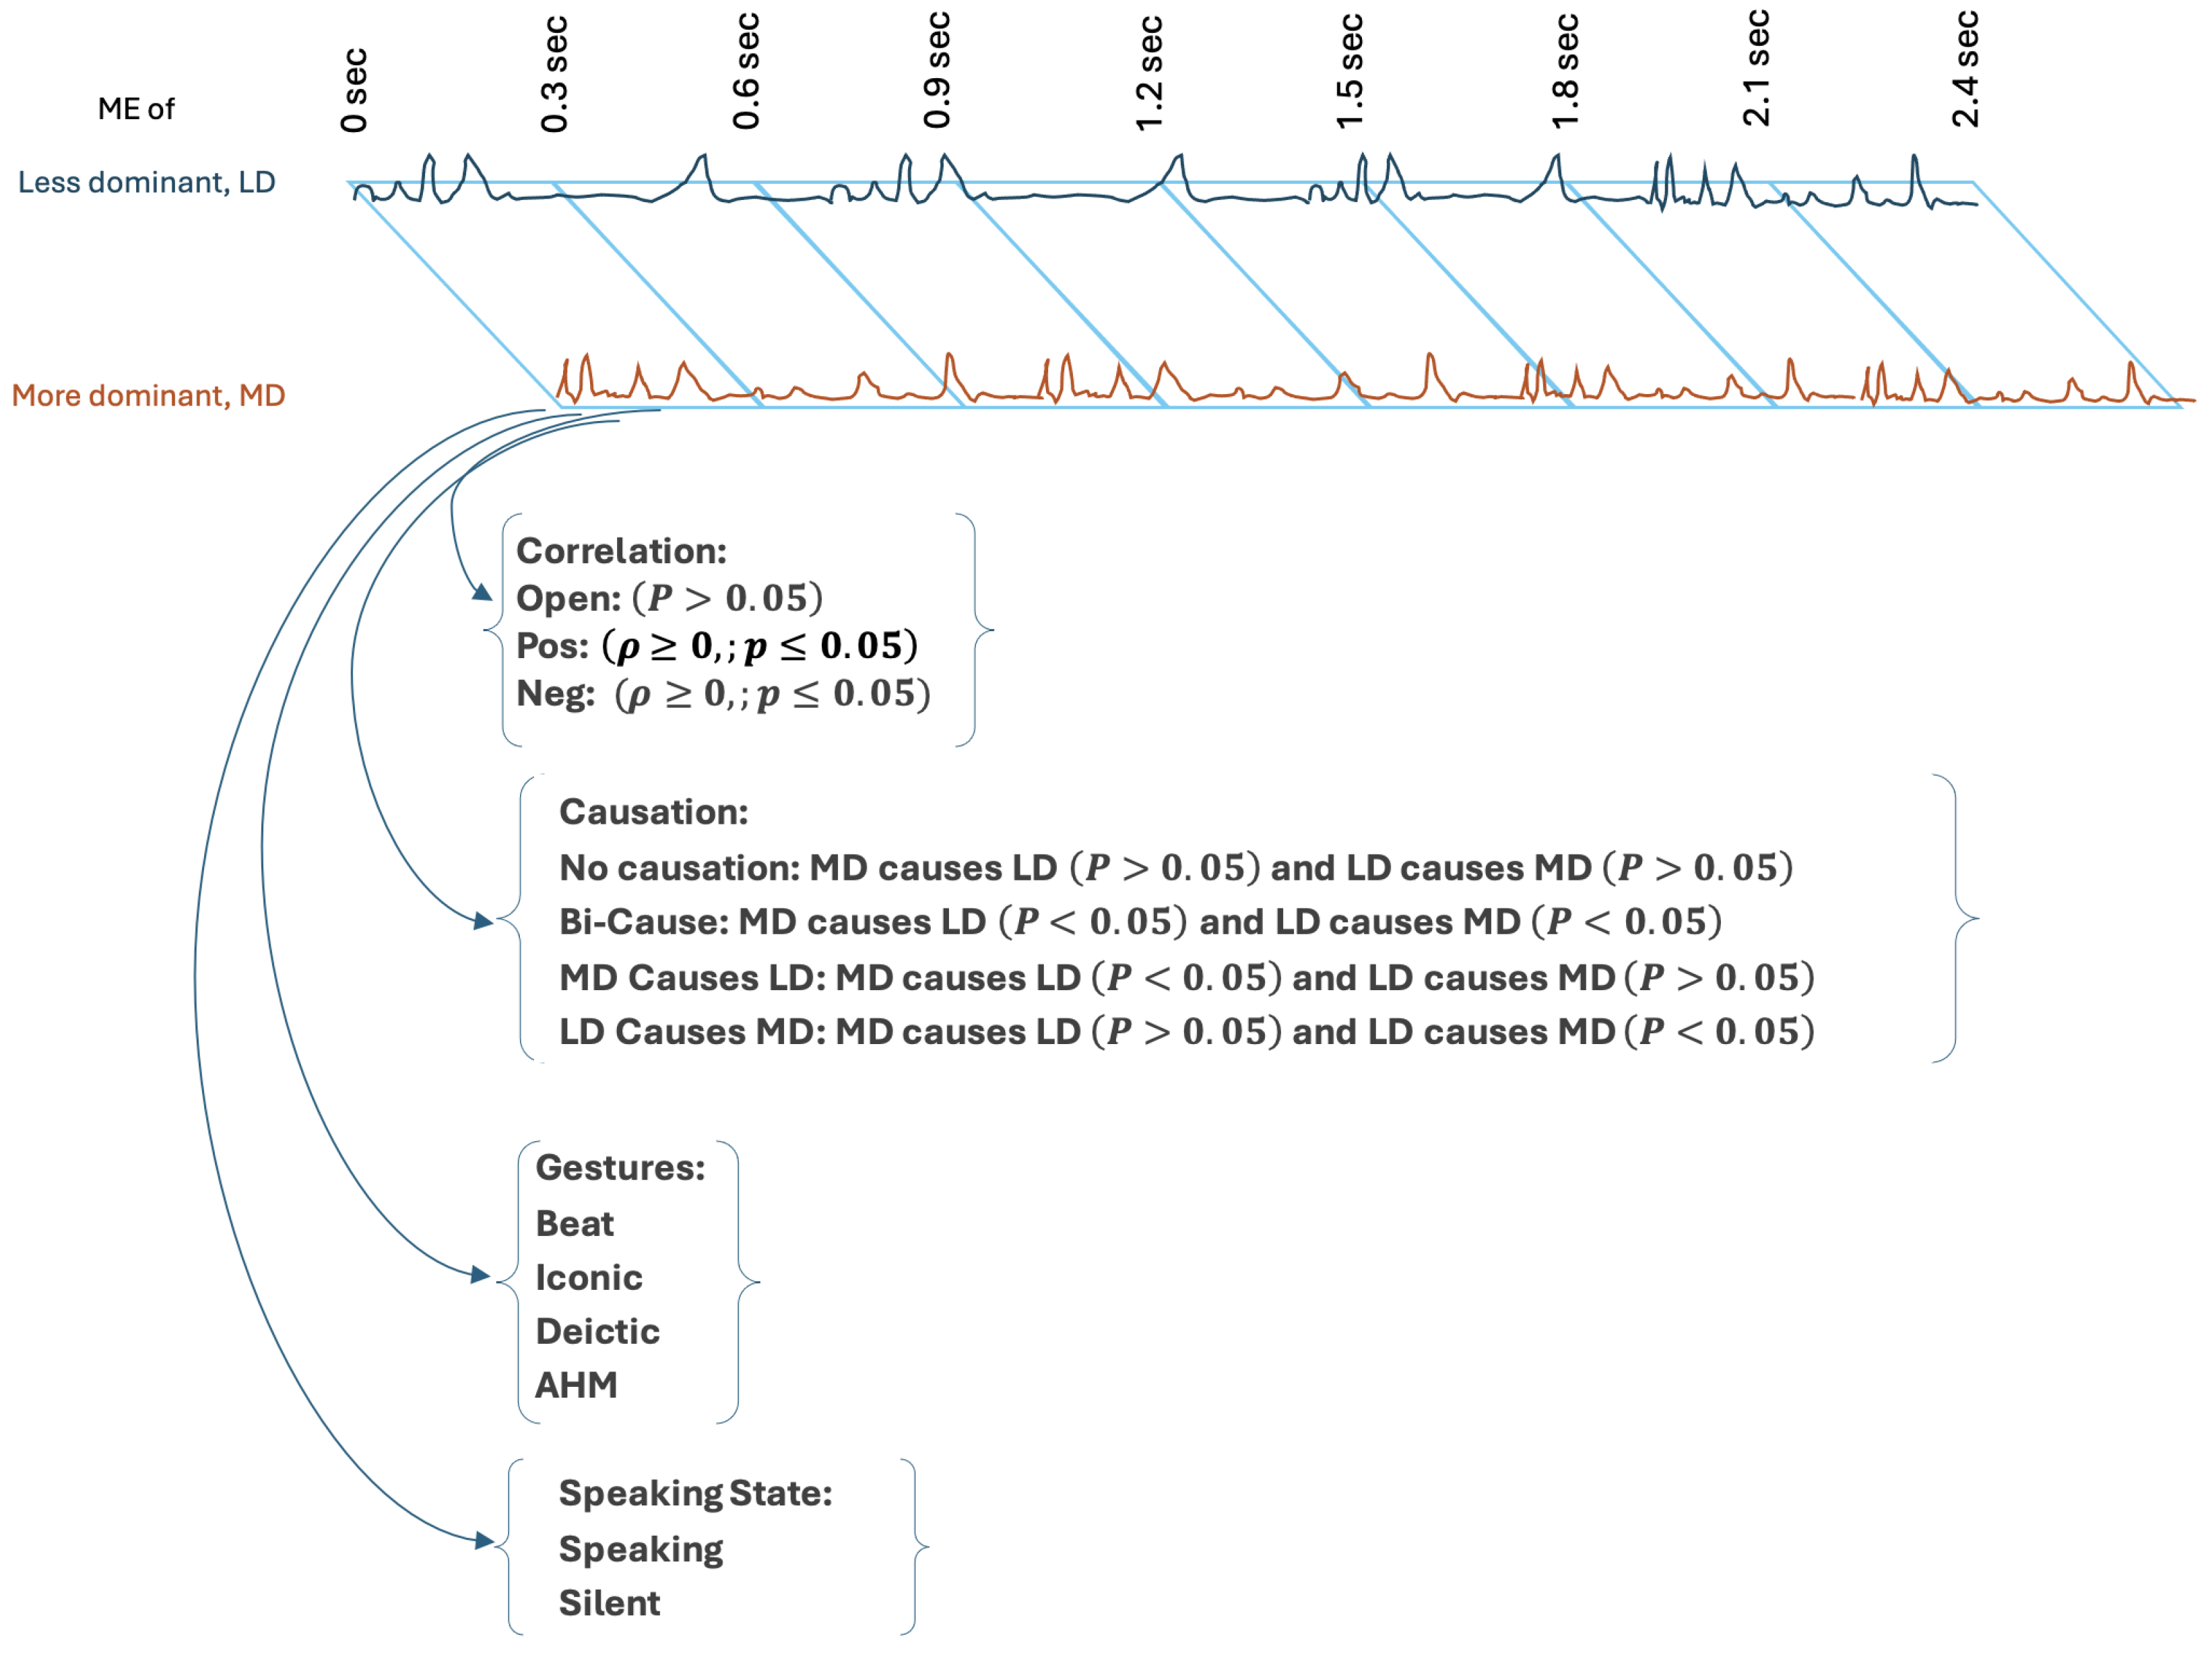
When examining a dataset and intending to address the question of who is leading the conversation on whatever measurement (here we measure ME) for any particular stretch of time (such as we have characterised with windows), it is necessary to examine the data from the perspective of lagged values. This creates the question of whether simple lagged correlations are adequate or whether, instead, GC provides a clearer picture. Here, we used GC on the same lagged data. For arbitrary conversations, it is not clear which party should be taken as preceding the other. This leads to examining both forms for the dyadic conversations we have studied. In these data, there is a justification for focusing on only one of the two parties in that independent assessments determine that in each, one of the interlocutors is MD than the other. Further, many of the results reported have involved similar effects, if differencing magnitudes, regardless of whether the ME values of the MD party are lagged ahead of those of the LD, or the other way around.
A next step in interpreting these results involves additional analysis, equating windows between the two lagged versions of the data in an ordinal manner (by virtue of the lags, they do not contain identical values). One may then consider the agreement on labels for the ith window between the two views of the data—whether and to what extent the two laggings agree on labels for the ith window, using both the GC labels and the lagged correlation labels. For example, the first window in the MD precedes LD ME lagged data may be given the lagged correlation label “open” and the first window in the LD precedes MD data may have the label “open”, too; or, the first window may have different labels between the two lagged views of the data; and so on, for each successive window, and also in relation to the GC labels. Given the lagged correlation labels for each of the 28,266 windows in the data, the “confusion” matrix depicted in Table 6 emerges. To assess the degree of association between the categorisation schemes, we see that Cramér’s V = 0.129 , a weak association. To clarify this further may arbitrarily assign one lagged precedence categorisation scheme as a reference (LD precedes) and compute the “accuracy” of the other (MD precedes). A majority classifier (always assign “Open” correlation) would have an overall accuracy measure of 0.87; here, the overall accuracy score is 0.7998. Thus, a majority classifier would produce more agreement than using the labels of one lagged order of the data to guess the labels for the windows in the other lagged order. Table 7 shows the resulting precision, recall, and F1 scores, by category (note that if the reference categorisations were switched, so, too, would values for precision and recall across the categories). However, it can be demonstrated using the Pearson residuals from a Chi-squared test of the contingency Table 6 that significant agreement falls exactly along the diagonal, where the largest positive magnitudes in any row/column are witnessed ( χ 2 = 940.32 ,   d f = 4 ,   p < 2.2 × 10 16 )—see Table 8. This entails that for the labeling of the ith window as computed for the MD precedes LD lagged ME data and for the LD precedes MD lagged ME data, there is significant divergence, and also, there is significant agreement.
Similar reasoning applies to the labels provided through GC tests of windows. Here, the association is even less strong (Cramér’s V = 0.08839 ). Again, arbitrarily holding the LD preceding MD lagged data as the source of “true” reference labels, we analyse the “accuracy” of the labels that are computed for MD preceding windows. A majority classifier assigns “No Causation” with an accuracy score of 0.86; here, overall accuracy is 0.7769. Table 9 shows the precision, recall, and F1 scores, by category. The Bi-Causation label yields the worst “performance”. Finally, based on of the contingency table given in (Table 10) we use the adjusted standard residuals (Table 11) from a Chi-squared test ( χ 2 = 662.57 ,   d f = 9 ,   p < 2.2 × 10 16 ) to explore the diagonal of the cross-classification. We note that a Bonferroni adjustment to α = 0.05 , provides α = 0.0035 , and a critical value of 2.96 for significance. The largest positive magnitudes in the residuals (note that all of the residuals are significant) for any row and column fall along the diagonal, except for the Bi-Causation label. Where there is agreement between two classifications, the (significant) residuals along the diagonal being positive is indicative of the instances of observed agreement being significantly greater than would be expected if there were no relationship between the label for windows according to the two classification schemes.
The comparison of agreement on correlation labeling of windows and on GC labeling of windows depending on whether the MD precedence or LD precedence view of the data is chosen indicates that the precedence selected is an important decision to make if only one precedence is to be explored. With the GC labels, one might have anticipated that the LD causes MD labels on the LD preceding lags to mirror the MD causes LD labels on the MD preceding lags; however, this is not observed. Nonetheless, for all the disagreements on labels applied to windows between the two lag precedence possibilities, we note significant agreement, as well.
In relation to methods and next steps, this points to the possibility of taking an intersective approach, analysing the interactions reported here throughout (relations to speaking or not, gesture types, and specific interactions with levels of ME) with a focus on the windows according to the ordinal sequence where the two precedence views lead to agreement. It also suggests more detailed examination of the complement, the windows where the distinct lag precedence possibilities and the labeling computations lead to disagreement over labels.
These findings and the relationship between causation, correlation, gesture and speaking reveal aspects of the dynamic of leadership and alignment of bodily motion in cooperative dyadic conversations. We also see emergent recommendations with respect to methods of computing motion energy correlation and GC labels for temporal windows within the lagged data.

5. Conclusions

In this study, the observed interaction between ME, causation, correlation, and multimodal behaviours provides a framework for analysis leadership and ME dynamics in conversations. Employing GC and lagged windowed correlations results in identifying patterns of influence and synchronisation in dialogue interaction. The findings confirm that dominance influences leadership, gestures and speech empower leading behaviours, and correlation types reflect distinct interaction dynamics. The results also illustrate LD interlocutors are also capable of influencing, suggesting that real-world conversations are adaptive, involving continuous shifts in influence and leading where both interlocutors change their roles dynamically. However, MD interlocutors lead over variant time intervals. In relating ME values of interlocutors in conversation using both lagged correlation and GC, we find that the vocabulary provided by GC has considerable merit, even though it does not capture the conformity/complementarity distinction that is inherent in the contrast between positive and negative correlations. The lagged correlation labels and Granger causation labels are shown to have substantial agreement in their binary forms (significantly correlated vs. open and causation vs. no causation), and to contain complementary information in their full label sets in interaction with other classification schemes, such as gesture types witnessed during matched windows. The implication is that where a choice between lagged correlation and Granger causation labels is necessary, the nature of the application must determine the choice. For example, for some analysis, it may be that the direction of “causation” is important or it may be more important that the quantities are related by the same behaviours (measurements of the relevant quantity increasing for both or decreasing for both) or complementary behaviours (where one decreases as the other increases).
This work has shown that the method of computing ME leadership across successive temporal windows, with lags, has an interaction with whichever participant in a dyad is selected as the one whose ME values are taken as preceding those of the others. We have shown that agreement between precedence orderings is weak when measured as a cross-categorial association, but also that agreement is statistically significant. While some of the interactions we have reported are such that either ordering would suffice in support of associated inferences, the disagreements anchored in the precedence orderings open new possibilities for exploring the interactions that obtain for temporal windows that have a shared correlation labeling or GC labeling separately from the windows where disagreements are evident. Further, the extent to which any disagreements have a systematic nature also merit additional exploration.
As this study has adopted an observational method, we acknowledge that relationships reported may manifest differently in other datasets. However, we think that the overall approach that we have used is appropriate for analysing motion energy in relation to other qualities in dyadic interactions. Even in the data used here, the MULTISIMO dataset, there is a third party, the moderator, whose influence on the two directly involved parties is not examined (and whose role may be assumed to introduce rather much of the “noise” noted in relationships studied here). It involves another step in the overall programme of research to consider the influence of third parties and other dynamic features of context into the flow of bodily motions of the dialogue participants. Nonetheless, we see the methods we have explored here as contributing to the inventory of tools available to motion energy analysis in assessing the role of bodily motion in dialogue. The same style of analysis may be applied to alternative continuous measures of behaviours of interlocutors, not just motion energy assessments. For example, it would be analogous to consider the flow of vocal intensity among interlocutors over the course of conversations. It is to be hoped that by considering the dynamics of individual behaviours for each such sort of measurement (that is, bodily motion, vocal intensity, gesture selection, linguistic content, and so on) and how behaviours in each dimension align among dialogue participants over time, according to the type of interaction, one may have greater insight into what is normal or abnormal for the interaction type.
To see the potential impact of increased knowledge about the dynamics of multi-modal synchrony, note that an aesthetic applied to interactions between medical professionals and patients is in the experience of shared decision making [41,42]. A transcript of such an interaction may give a view of the extent and quality of shared decision making distinct from what one might obtain by also attending to the dynamics of behaviours such as we have reported here. One can imagine an arrangement in which such interactions are monitored by video and audio equipment that enables processing along these lines, with an accumulation of values across successive windows, yet without recording data beyond the seconds required to process and therefore not compromising privacy, but able to emit warnings that one party is dominating the interaction, thereby enabling corrective action. This is just one direction of potential application of increased knowledge about the dynamics of cross-modal synchrony of communication behaviours in dialogue.

Author Contributions

Conceptualisation, Z.K., M.K. and C.V.; Methodology, Z.K. and C.V.; Software, Z.K. and C.V.; Validation, Z.K. and M.K.; Formal analysis, Z.K., M.K. and C.V.; Investigation, Z.K. and C.V.; Data curation, Z.K.; Writing—original draft, Z.K. and M.K.; Writing—review & editing, Z.K., M.K. and C.V.; Supervision, C.V. All authors have read and agreed to the published version of the manuscript.

Funding

This work was conducted with the financial support of Taighde Éireann—Research Ireland: 18/CRT/6223.

Institutional Review Board Statement

This work relies upon the data collected separately (see MULTISIMO.EU), the independent research ethics approval was granted by the School of Computer Science and Statistics Research Ethics Committee, University of Dublin. The approving application number is 20161218, approval dated is 22 March 2017.

Informed Consent Statement

This work relies upon the data collected separately (see https://multisimo.eu/—verified 19 May 2025); informed consent was obtained from all participants in that dataset.

Data Availability Statement

Data files involving the measurements used in this research will be made available via http://www.scss.tcd.ie/CLG/MEA-Granger-Lagged-Correlation/ (verified 19 May 2025).

Conflicts of Interest

The authors declare no conflicts of interest. The funders had no role in the design of the study; in the collection, analyses, or interpretation of data; in the writing of the manuscript; or in the decision to publish the results.

Appendix A. Influences on Motion Energy of Categories of Interaction and Individual Behaviours

Appendix A.1. Regression

In another experiment, we explore the main effect and interaction between different quantities to predict ME. In a linear regression model with complex interaction, ME is considered as a dependent variable and other labels as independent variables. The significant effects and interactions provide insights into how different conditions such as correlation, GC, gesture, and speaking impact ME.
The purpose of the regression experiments is to consider the values of ME of one of the participants in each dialogue in relation to the categories of relationship to ME of the other participant and the separate properties of the participant. The cross-categorisation experiments showed that the types of lagged correlation interact with the types of GC, and both of those with other categorial properties of participants and the dialogue. Here, we seek to know the “influence” of those category levels on ME for the participant whose ME values are taken as preceding those of the other in the lags. We focus first on the values of ME for the participant externally observed to have been more dominant in the dialogues (ME).
As explained in Section 3.2, two data profiles are designed including the extracted coefficients of each window. The profile of “MD Precedes” refers to the moment the interlocutor MD precedes and happens first for a segment of time and its influence; “LD Precedes” refers to the preceding moment for interlocutor LD in which the LD interlocutor moves first for a short segment of time. For the profile of “MD Precedes”, regression models with different independent variables are designed. First, there is a regression model (Model A) with complex interaction in which ME is considered as a dependent variable and correlation and GC labels are considered as independent variables. The model was used to predict ME using correlation and GC features, examining both the main effects of these variables and their interaction to understand how they influence ME. The regression shows the combination of categories influence the overall ME. In total, the main effects are significant for all categories and the interactions are significant for all combinations except one of them. This could suggest that the correlation and GC influence ME, both independently and in interaction with each other, and the effect of correlation on ME depends on the levels of GC, and vice versa. Multiple R-squared shows about 4.983% of variability in ME is explained by the model. So, this suggests that other factors which are not used in this model are important to predict ME. However, our goal is not ME prediction but understanding influences on and of ME.
In another model (Model B), gesture features are fed into the regression model as an independent variable along with correlation and GC to determine whether this feature can increase the prediction of ME and its effect in ME. Results show that the intercept and main effects of predictors significantly affect ME. The main effect is significant for all categories and interactions are significant in 12 of 50 combinations, which suggests that the relationship between predictors (gesture, GC, and correlation) and ME is influenced by the contribution of different modalities, where the effect of one predictor can depend on the level of another. Likewise, by adding gestures to independent variables, the variability in the ME explained by the model increased from 4.983% to 10.29%.
The last feature is used in the regression model (Model C) in speaking state. In each window, the preceding interlocutor speaks or not. This feature is fed to the regression along with correlation and GC features (gestures are excluded). Results show significant intercept and main effects are significant for all independent variables; the interaction is significant for 6 of 11 combinations of independent categories. The variability in ME explained by the model is 7.976%.
In the final model (Model D), all features are fed into the regression model to analyse the effect of correlation, GC, the speaking state, and the gestures along with all possible interactions between these features on the dependent variable ME. This model unfolds the important insights into the features influencing ME and it allows for the main effects of each predictor and also all possible interactions (two-way, three-way, and four-way) between correlation, GC, speaking state, and gesture type. The outputs of the model show the intercept is significant and main effect is significant for 8 of 10 independent variables. The interaction is significant for 24 of 109 category combinations. The effect of each predictor depends on the other predictors which indicates the influence of combined features on ME. Residuals that show the difference between observed and predicted values of ME are close to zero. This means the predicted values are close to the observed values. However, the maximum residual is bigger than others which can show some outliers far from the predictions of the model. The F-statistic test shows the model is statistically significant overall ( p < 2.2 × 10 16 ), indicating that some predictors have a significant relationship with ME. This model has the highest variability in ME between all models and model explanation for the total variance in ME is 13.29%.
For the profile of “LD Precedes”, regression Model A shows the significant main effect and interaction for all combinations. The ME variability explained by the model is 5.348%. Model B shows the main effects are significant for all categories and interaction is significant for 23 of 50 combinations. ME variability is 14.1%. In Model C, all main effects are significant and interaction is significant for 5 of 11 combinations. ME variability explained by the model is 9.232%. The final model, which is Model D, shows the main effects are significant for 9 of 10 category combinations, and the interactions of combinations are significant for 51 of 109 instances and variability of ME as 17.67%.
Regression models on “LD Precedes” show the influence of different modalities on ME is more compared to ME of “MD Precedes”. Table A1 shows a summary of varied regression models according to the independent predictors.
Table A1. Regression models arisen from cross classification between different quantities as independent predictors, with ME as the dependent variable, for MDs precede profile and LDs precede profile. An arrow pointing up with two lines, ⇑, indicates that the independent variable increases ME and their effect is significant ( p < 0.5 ). An arrow pointing up with one line, ↑, indicates that their effect is not significant.
PlayerIndependent VariablesEffect of Independent Variables on Dependent Variable, MESignificant InteractionsME Variability
MDModel A, Correlation, GCNeg ⇑ Pos ⇑Bi-Causation ⇑LD Causes MD ⇑MD Causes LD ⇑5 of 64.946%
Model B, Correlation, GC, GestureNeg ⇑ Pos ⇑Bi-Causation ⇑LD Causes MD ⇑MD Causes LD ⇑AHM ⇑ Beat ⇑Deictic ⇑ Iconic ⇑12 of 5010.1%
Model C, Correlation, GC, SpeakingNeg ⇑ Pos ⇑Bi-Causation ⇑LD Causes MD ⇑MD Causes LD ⇑Speaking ⇑6 of 117.902%
Model D, Correlation, GC, Speaking, GestureNeg ⇑Pos ⇑Bi-Causation ⇑LD Causes MD ⇑MD Causes LD ⇑AHM ⇑ Iconic ⇑Speaking ⇑Beat ↑ Deictic ↑24 of 10912.95%
LDModel A, Correlation, GCNeg ⇑ Pos ⇑Bi-Causation ⇑LD Causes MD ⇑MD Causes LD ⇑6 of 65.312%
Model B, Correlation, GC, GestureNeg ⇑ Pos ⇑Bi-Causation ⇑LD Causes MD ⇑MD Causes LD ⇑AHM ⇑ Beat ⇑Deictic ⇑ Iconic ⇑23 of 501393%
Model C, Correlation, GC, SpeakingNeg ⇑ Pos ⇑Bi-Causation ⇑LD Causes MD ⇑MD Causes LD ⇑Speaking ⇑5 of 119.158%
Model D, Correlation, GC, Speaking, GestureNeg ⇑ Pos ⇑Bi-Causation ⇑LD Causes MD ⇑MD Causes LD ⇑AHM ⇑Iconic ⇑Beat ⇑Speaking⇑Deictic ↑51 of 10917.33%
The scale of interactions among the levels of the predictors reveals considerable complexity—more than we anticipated. As the model comparison led to the acceptance of the more complex model, given the significant increase in adjusted R2 noted we felt it necessary to explore interactions at a smaller scale—with focus on individual predictors and the contrasts on ME within those predictors and within a subset of the interactions considered in the regression models. This is described in Appendix A.2.

Appendix A.2. Interaction Differences Between Categories

Interactions with ME of the categories that have been considered are best addressed by first showing the central tendencies of ME as measured within those categories—see Table A2, Table A3, Table A4 and Table A5.
Table A2. “MD Precedes”, mean and median of ME for correlation and GC categories by speaking states for “MD Precedes” profile. Values in blue and teal are noted in the main text.
Granger Categories
Bi-Causation MD Causes LD LD Causes MD No Causation
Speaking State Correlation Type Mean Median Mean Median Mean Median Mean Median
SilentOpen0.720.310.330.040.440.070.120.00
Neg0.820.310.580.150.680.240.420.09
Pos0.500.130.450.140.470.090.490.09
SpeakingOpen0.850.380.590.150.650.230.380.04
Neg1.140.961.110.720.650.300.700.27
Pos0.800.360.820.290.490.160.780.33
Table A3. “LD Precedes”, mean and median of ME for correlation and GC categories by speaking states for “LD Precedes” profile. Values in red are noted in the main text.
Granger Categories
Bi-Causation MD Causes LD LD Causes MD No Causation
Speaking State Correlation Type Mean Median Mean Median Mean Median Mean Median
SilentOpen0.670.240.400.070.300.030.110.00
Neg0.760.360.670.210.860.310.460.10
Pos0.470.120.490.130.470.130.370.08
SpeakingOpen0.930.500.760.290.560.150.410.04
Neg1.040.600.630.391.010.550.700.32
Pos0.650.310.840.370.660.260.750.29
Table A4. Mean and median of ME under correlation and GC type by gesture types for “MD Precedes” profile.
Granger Categories
Bi-Causation MD Causes LD LD Causes MD No Causation
Gesture Type Correlation Type Mean Median Mean Median Mean Median Mean Median
AgestNeg0.890.480.750.250.580.230.490.13
Open0.740.330.390.060.490.130.170.00
Pos0.600.170.590.160.460.120.570.14
AHMNeg1.641.641.030.430.600.380.820.19
Open0.830.310.580.190.840.230.430.05
Pos0.530.530.890.230.540.370.610.24
BeatNeg1.420.801.341.481.340.940.910.32
Open0.890.410.620.240.730.510.600.17
Pos0.740.490.890.380.800.260.900.65
DeicticNeg2.852.85NANA2.622.621.100.72
Open1.471.400.850.301.701.001.080.76
Pos1.632.210.180.180.570.041.471.34
IconicNeg1.030.871.070.641.251.181.090.51
Open1.560.421.390.731.020.320.900.42
Pos1.150.681.451.560.440.071.761.39
Table A5. Mean and median of ME under correlation and GC type by gesture types for “LD Precedes” profile.
Granger Categories
Bi-Causation MD Causes LD LD Causes MD No Causation
Gesture Type Correlation Type Mean Median Mean Median Mean Median Mean Median
AgestNeg0.740.290.540.230.780.300.430.11
Open0.690.240.430.100.310.040.150.00
Pos0.400.140.370.130.490.160.470.12
AHMNeg1.351.031.010.702.161.341.310.79
Open1.130.651.000.440.670.300.750.20
Pos1.241.202.170.800.630.080.720.25
BeatNeg1.531.401.090.580.830.500.940.75
Open0.960.591.210.961.060.770.900.45
Pos1.120.451.630.970.950.350.940.42
DeicticNeg0.900.890.310.310.380.371.130.49
Open1.291.421.531.371.280.780.880.29
Pos0.960.961.611.461.181.440.940.54
IconicNeg1.110.841.030.701.721.441.040.58
Open1.220.711.180.701.010.620.820.32
Pos1.440.441.110.691.040.470.920.40
Pairwise comparisons were conducted to compare ME differences across different GC categories within speaking and silent states, and correlation directions. Table A6 indicates p-values of contrasts for the profile of “MD Precedes” and Table A7 for the profile of “LD Precedes”. p-value shows whether the difference between categories is significant; *** p < 2 × 10 16 ; NS = not significant. Table A2 and Table A3 outline the mean and median of ME for comparison categories (reported in Table A6 and Table A7, respectively) of GC and correlation during speaking and silent moments.
Table A6. “MD Precedes”, p-values of pairwise Wilcoxon tests of ME of each GC by speaking moments and correlation direction. *** p < 2 × 10 16 ; NS = not significant. The central tendencies of the values compared are shown in Table A2. An arrow pointing up indicates that the median for the corresponding row category is greater than for the corresponding column category as shown in Table A2 (⇑, when the difference is significant, and ↑ when not significant). An arrow pointing down indicates that the median for the corresponding column category is greater than that for the row category (⇓ when the difference is significant and ↓ when not significant). When the values are equal to two significant digits, ≃ is used. Values marked with blue are addressed in the main text to make more clear which values are under discussion in support of clarifying their interpretation.
Causation Type
Speaking Situation Correlation Type No Causation Bi-Causation MD Causes LD
SilentOpenBi-Causation*** ⇑--
MD Causes LD*** ⇑*** ⇓-
LD Causes MD*** ⇑ 1.1 × 10 10 0.015 ⇑
NegBi-Causation0.00092 ⇑--
MD Causes LD0.03945 ⇑NS ↓-
LD Causes MD0.00658 ⇑NS ↓NS ↑
PosBi-CausationNS ↑-
MD Causes LDNS ↑NS ↑
LD Causes MDNS ≃NS ↓NS ↓
SpeakingOpenBi-Causation***--
MD Causes LD*** 2.5 × 10 06 -
LD Causes MD***0.0032 ≃NS ↑
NegBi-Causation 6.1 × 10 05 --
MD Causes LD0.00024NS-
LD Causes MDNS0.000790.02257
PosBi-CausationNS--
MD Causes LDNSNS-
LD Causes MD0.0054NS0.0292
Table A7. “LD Precedes”, p-values of pairwise Wilcoxon tests of ME of each GC by speaking moments and correlation direction. *** p < 2 × 10 16 ; NS = not significant. The central tendencies of the values compared are shown in Table A3. An arrow pointing up indicates that the median for the corresponding row category is greater than for the corresponding column category as shown in Table A3 (⇑, when the difference is significant, and ↑ when not significant). An arrow pointing down indicates that the median for the corresponding column category is greater than that for the row category (⇓ when the difference is significant and ↓ when not significant). When the values are equal to two significant digits, ≃ is used. Values marked with red are addressed in the main text to make more clear which values are under discussion in support of clarifying their interpretation.
Causation Type
Speaking State Correlation Type No Causation Bi-Causation MD Causes LD
SilentOpenBi-Causation*** ⇑--
MD Causes LD*** ⇑ 1.7 × 10 10 -
LD Causes MD*** ⇑*** ⇓0.0012 ⇓
NegBi-Causation0.00087 ⇑ -
MD Causes LD0.02843 ⇑NS ↓-
LD Causes MD 3.7 × 10 05 NS ↓NS ↓
PosBi-CausationNS ↑--
MD Causes LDNS ↑NS ↑-
LD Causes MDNS ↑NS ↑Ns ≃
SpeakingOpenBi-Causation*** -
MD Causes LD***0.03988 ⇓-
LD Causes MD*** 6 × 10 08 0.00038 ⇓
NegBi-CausationNS -
MD Causes LDNSNS-
LD Causes MD0.011NSNS
PosBi-CausationNS -
MD Causes LDNSNS-
LD Causes MDNSNSNS
The results of the pairwise Wilcox test of ME differences between causation types within each of the speaking types and correlation types show a major interaction with those other classifications of windows where MD precedes. In particular, during speaking and existence of alignment, these differences are statistically significant (p-values written in blue in Table A6) rather than where ME of LD precedes; Table A7 shows a slight interaction and differences significancy during speaking and alignment where LD precedes (p-values written in red)—only ME difference between “No Causation” and “LD Causes MD” is significant.
Table A6, with p-values written in bold, shows that ME differences across a speaking situation where there is any type of causation are generally statistically significant in combination with “No Causation”—that is, ME differences between combinations of “No Causation” within any types of causation is significant where MD precedes in comparison with LD precedes, with p-values written in bold, as shown in Table A7).
Where ME of MD precedes and alignments exist, ME differences of “MD Causes LD” and “LD Causes MD” are statistically significant while we cannot see this significance when ME of LD precedes (p-values written in italics in Table A6 and Table A7).
Not only are ME differences for MD Causes LD and LD Causes MD combination statistically significant where MD Precedes, MD Causes LD has generally higher influence on ME when there is alignment (mean and median written in blue in Table A2) and LD Causes MD has generally the lowest influence on ME (mean and median written in green in Table A2).
Comparing mean and median ME values between silent and speaking moments reported in Table A2 and Table A3 indicate that ME is always greater in windows where speaking is happening than in windows where speaking is not happening.
Furthermore, blue downward arrows with two lines in Table A6 illustrate when alignment exists and ME differences are significant, the amount of mean and median of LD Causes MD is lower than other causation in comparison to their corresponding value in Table A7. That is, where MD precedes, LD has the lowest influence on ME of MD. In addition, Table A3 with mean and median written in red shows when LD precedes, during positive alignment, ME of MD has the greatest influence in comparison with other causations.
Moreover, the mean and median of ME GC and correlation for different gesture types are calculated and illustrated in Table A4 and Table A5 where “MD Precedes” and where “LD Precedes”, respectively. The reported results do not have a clear pattern. For example, it is not the case, when taking the ME values of MD preceding those of LD, that for each gesture type and both positive and negative lagged correlation, the mean and median of ME is greater where MD ME Granger causes LD ME, although this is so when there is no gesture (Agest) and for Beats. Moreover, the symmetric observations are not visible when taking the ME values of LD preceding those of MD. While specific pairwise interactions are visible and illuminate the meaning of the significant predictors and interactions in the regression model, a clear pattern of the interactions among gesture type, correlation type, and causation type on ME does not hold for both versions of lagging data (MD preceding or LD preceding).

Appendix A.3. Regression Conclusion

From the analysis of regression models on ME and the influence of different interaction categories—including simple lagged correlation, GC, gestures, and speaking— it is witnessed that these factors significantly contribute to ME variability and interact with one another. The differences comparison of ME across these categories highlight significant contrast, particularly in relation to dominant interlocutors. The work suggests that the ME of more dominant interlocutors in dialogues has a greater influence compared to that of less dominant interlocutors. We infer this from the observations of similar patterns of effects, whether the ME values of MD are taken in precedence over those of LD or ME values for LD preceding those of MD. The magnitudes of values have tended to be greater for the “MD preceding” views of the data.

References

  1. Müller, L.; Shadaydeh, M.; Thümmel, M.; Kessler, T.; Schneider, D.; Denzler, J. Causal inference in nonverbal dyadic communication with relevant interval selection and granger causality. arXiv 2018, arXiv:1810.12171. [Google Scholar]
  2. Grammer, K.; Kruck, K.B.; Magnusson, M.S. The courtship dance: Patterns of nonverbal synchronization in opposite-sex encounters. J. Nonverbal Behav. 1998, 22, 3–29. [Google Scholar] [CrossRef]
  3. Hale, J.; Hamilton, A.F.d.C. Cognitive mechanisms for responding to mimicry from others. Neurosci. Biobehav. Rev. 2016, 63, 106–123. [Google Scholar] [CrossRef]
  4. Lakin, J.L.; Chartrand, T.L. Using nonconscious behavioral mimicry to create affiliation and rapport. Psychol. Sci. 2003, 14, 334–339. [Google Scholar] [CrossRef]
  5. McEllin, L.; Knoblich, G.; Sebanz, N. Synchronicities that shape the perception of joint action. Sci. Rep. 2020, 10, 15554. [Google Scholar] [CrossRef]
  6. Wiltermuth, S.S.; Heath, C. Synchrony and cooperation. Psychol. Sci. 2009, 20, 1–5. [Google Scholar] [CrossRef]
  7. Takamizawa, K.; Kawasaki, M. Transfer entropy for synchronized behavior estimation of interpersonal relationships in human communication: Identifying leaders or followers. Sci. Rep. 2019, 9, 10960. [Google Scholar] [CrossRef]
  8. Pickering, M.J.; Garrod, S. Toward a mechanistic psychology of dialogue. Behav. Brain Sci. 2004, 27, 169–190. [Google Scholar] [CrossRef]
  9. Rasenberg, M.; Özyürek, A.; Dingemanse, M. Alignment in multimodal interaction: An integrative framework. Cogn. Sci. 2020, 44, e12911. [Google Scholar] [CrossRef]
  10. Fusaroli, R.; Tylén, K.; Garly, K.; Steensig, J.; Christiansen, M.H.; Dingemanse, M. Measures and mechanisms of common ground: Backchannels, conversational repair, and interactive alignment in free and task-oriented social interactions. In Proceedings of the the 39th Annual Conference of the Cognitive Science Society (CogSci 2017), London, UK, 26–29 July 2017; pp. 2055–2060. [Google Scholar]
  11. Tomyta, K.; Saito, N.; Ohira, H. The physiological basis of leader–follower roles in the dyadic alternating tapping task. Front. Psychol. 2023, 14, 1232016. [Google Scholar] [CrossRef]
  12. Konvalinka, I.; Vuust, P.; Roepstorff, A.; Frith, C.D. Follow you, follow me: Continuous mutual prediction and adaptation in joint tapping. Q. J. Exp. Psychol. 2010, 63, 2220–2230. [Google Scholar] [CrossRef] [PubMed]
  13. Beyan, C.; Capozzi, F.; Becchio, C.; Murino, V. Multi-task learning of social psychology assessments and nonverbal features for automatic leadership identification. In Proceedings of the 19th ACM International Conference on Multimodal Interaction, Boulder, CO, USA, 16–20 October 2017; pp. 451–455. [Google Scholar]
  14. Dritsas, E.; Trigka, M.; Troussas, C.; Mylonas, P. Multimodal Interaction, Interfaces, and Communication: A Survey. Multimodal Technol. Interact. 2025, 9, 6. [Google Scholar] [CrossRef]
  15. Vogel, C.; Koutsombogera, M.; Murat, A.C.; Khosrobeigi, Z.; Ma, X. Gestural linguistic context vectors encode gesture meaning. In Proceedings of the Gesture and Speech in Interaction (GeSpIn) Conference, Nijmegen, The Netherlands, 13–15 September 2023; Pouw, W., Trujillo, J., Rutger, H., Drijvers, L., Hoetjes, M., Judith, H., Kadava, S., Van Maastricht, L., Ezgi, M., Ozyurek, A., Eds.; Max Planck Institute for Psycholinguistics: Nijmegen, The Netherlands, 2023. [Google Scholar] [CrossRef]
  16. Ramseyer, F.; Tschacher, W. Nonverbal Synchrony or Random Coincidence? How to Tell the Difference. In Development of Multimodal Interfaces: Active Listening and Synchrony; Esposito, A., Campbell, N., Vogel, C., Hussain, A., Nijholt, A., Eds.; Springer: Berlin/Heidelberg, Germany, 2010; LNCS 5967; pp. 182–196. [Google Scholar]
  17. Boker, S.M.; Rotondo, J.L.; Xu, M.; King, K. Windowed cross-correlation and peak picking for the analysis of variability in the association between behavioral time series. Psychol. Methods 2002, 7, 338. [Google Scholar] [CrossRef]
  18. Ramseyer, F.; Tschacher, W. Synchrony in dyadic psychotherapy sessions. In Simultaneity: Temporal Structures and Observer Perspectives; World Scientific Publishing Company: Singapore, 2008; pp. 329–347. [Google Scholar]
  19. Dale, R.; Bryant, G.A.; Manson, J.H.; Gervais, M.M. Body synchrony in triadic interaction. R. Soc. Open Sci. 2020, 7, 200095. [Google Scholar] [CrossRef]
  20. Ravreby, I.; Shilat, Y.; Yeshurun, Y. Liking as a balance between synchronization, complexity and novelty. Sci. Rep. 2022, 12, 3181. [Google Scholar] [CrossRef]
  21. Glass, D.; Yuill, N. Evidence of mutual non-verbal synchrony in learners with severe learning disability and autism, and their support workers: A motion energy analysis study. Front. Integr. Neurosci. 2024, 18, 1353966. [Google Scholar] [CrossRef]
  22. Granger, C.W. Investigating causal relations by econometric models and cross-spectral methods. Econom. J. Econom. Soc. 1969, 37, 424–438. [Google Scholar] [CrossRef]
  23. Granger, C.W. Testing for causality: A personal viewpoint. J. Econ. Dyn. Control 1980, 2, 329–352. [Google Scholar] [CrossRef]
  24. Granger, C.W.; Huangb, B.N.; Yang, C.W. A bivariate causality between stock prices and exchange rates: Evidence from recent Asianflu. Q. Rev. Econ. Financ. 2000, 40, 337–354. [Google Scholar] [CrossRef]
  25. Zhang, D.D.; Lee, H.F.; Wang, C.; Li, B.; Pei, Q.; Zhang, J.; An, Y. The causality analysis of climate change and large-scale human crisis. Proc. Natl. Acad. Sci. USA 2011, 108, 17296–17301. [Google Scholar] [CrossRef]
  26. Ding, M.; Chen, Y.; Bressler, S.L. Granger causality: Basic theory and application to neuroscience. In Handbook of Time Series Analysis: Recent Theoretical Developments and Applications; Wiley-VCH: Weinheim, Germany, 2006; pp. 437–460. [Google Scholar]
  27. Khosrobeigi, Z.; Koutsombogera, M.; Vogel, C. Gesture and Part-of-Speech Alignment in Dialogues. In Proceedings of the 26th Workshop on the Semantics and Pragmatics of Dialogue, Dublin, Ireland, 22–24 August 2022; pp. 172–182. [Google Scholar]
  28. Bouamrane, M.M.; Luz, S. An analytical evaluation of search by content and interaction patterns on multimodal meeting records. Multimed. Syst. 2007, 13, 89–102. [Google Scholar] [CrossRef]
  29. Vogel, C.; Koutsombogera, M.; Esposito, A. Aspects of Methodology for Interaction Analysis. In Proceedings of the 11th IEEE International Conference on Cognitive Infocommunications (CogInfoCom2020), Online, 23–25 September 2020; pp. 141–146. [Google Scholar] [CrossRef]
  30. Scheflen, A.E. The significance of posture in communication systems. Psychiatry 1964, 27, 316–331. [Google Scholar] [CrossRef]
  31. Bernieri, F.J.; Davis, J.M.; Rosenthal, R.; Knee, C.R. Interactional synchrony and rapport: Measuring synchrony in displays devoid of sound and facial affect. Personal. Soc. Psychol. Bull. 1994, 20, 303–311. [Google Scholar] [CrossRef]
  32. Khosrobeigi, Z.; Koutsombogera, M.; Vogel, C. Interaction of motion energy with gesture, extroversion, dominance, and collaboration in dialogue. In Proceedings of the 2023 International Conference on Multimedia Computing, Networking and Applications (MCNA), Valencia, Spain, 19–22 June 2023; pp. 5–12. [Google Scholar] [CrossRef]
  33. Ramseyer, F.T. Motion energy analysis (MEA): A primer on the assessment of motion from video. J. Couns. Psychol. 2020, 67, 536–549. [Google Scholar] [CrossRef]
  34. Ramseyer, F.; Tschacher, W. Nonverbal synchrony in psychotherapy: Coordinated body movement reflects relationship quality and outcome. J. Consult. Clin. Psychol. 2011, 79, 284–295. [Google Scholar] [CrossRef]
  35. Altmann, U.; Schoenherr, D.; Paulick, J.; Deisenhofer, A.K.; Schwartz, B.; Rubel, J.A.; Stangier, U.; Lutz, W.; Strauss, B. Associations between movement synchrony and outcome in patients with social anxiety disorder: Evidence for treatment specific effects. Psychother. Res. 2020, 30, 574–590. [Google Scholar] [CrossRef]
  36. Yun, K.; Watanabe, K.; Shimojo, S. Interpersonal body and neural synchronization as a marker of implicit social interaction. Sci. Rep. 2012, 2, 959. [Google Scholar] [CrossRef]
  37. Koutsombogera, M.; Vogel, C. Modeling Collaborative Multimodal Behavior in Group Dialogues: The MULTISIMO Corpus. In Proceedings of the Eleventh International Conference on Language Resources and Evaluation (LREC), Miyazaki, Japan, 7–12 May 2018; Calzolari, N., Choukri, K., Cieri, C., Declerck, T., Goggi, S., Hasida, K., Isahara, H., Maegaard, B., Mariani, J., Mazo, H., et al., Eds.; European Language Resources Association (ELRA): Paris, France, 2018; pp. 2945–2951. [Google Scholar]
  38. Kleinbub, J.R.; Ramseyer, F.T. rMEA: An R package to assess nonverbal synchronization in motion energy analysis time-series. Psychother. Res. 2021, 31, 817–830. [Google Scholar] [CrossRef]
  39. Khosrobeigi, Z.; Koutsombogera, M.; Vogel, C. Motion Energy Alignment Analysis in Dialogue. In Proceedings of the 15th IEEE International Conference on Cognitive Infocommunications—CogInfoCom 2024, Tokyo, Japan, 16–18 September 2024; IEEE: New York, NY, USA; pp. 91–96. [Google Scholar]
  40. Smith, T. An Attentional Theory of Continuity Editing. Ph.D. Thesis, University of Edinburgh, Edinburgh, UK, 2005. [Google Scholar]
  41. Kane, B.T.; Toussaint, P.J.; Luz, S. Shared decision making needs a communication record. In Proceedings of the 2013 Conference on Computer Supported Cooperative Work, San Antonio, TX, USA, 23–27 February 2013; pp. 79–90. [Google Scholar]
  42. Ryan, P.; Luz, S.; Albert, P.; Vogel, C.; Normand, C.; Elwyn, G. Using artificial intelligence to assess the quality of communication in clinical encounters. Br. Med. J. 2019, 364, l161. [Google Scholar] [CrossRef]
Figure 1. Windowed ME of paired interlocutors with a lag of 0.3 s when MD precedes. A lagged window covers present ME of MD and ME of LD with a delay of 0.3 s. Then, correlation and GC between these MEs are computed; either any gestures occur by MD or MD speaks in this time line. Next, each of these features are labeled.
Mti 09 00051 g001
Figure 2. Windowed ME of paired interlocutors with a lag of 0.3 s when LD precedes. A lagged window covers present ME of LD and ME of MD with a delay of 0.3 s. Then, correlations and GC between these MEs are computed; either any gestures occur by LD or LD speaks in this time line. Next, each of these features are labeled.
Mti 09 00051 g002
Table 1. Granger Causation (GC) window label counts according to whether lags are computed with respect to the More Dominant (MD) lagged ahead or Less Dominant (LD) party lagged ahead. MD causes LD significantly more than LD causes MD.
LagNo CausationBi-CausationLD Causes MDMD Causes LD
MD precedes2442670515121623
LD precedes2437068215991615
Table 2. Counts of observed windows classified by GC, lagged correlation categories, the presence of interlocutor gestures, and whether the interlocutor is speaking.
PlayerLabelBi-CausationMD Causes LDLD Causes MDNo Causation
MDNeg891901661310
Open4421148105622,009
Pos1742852901107
LDNeg772322111308
Open4471090109921,971
Pos1582932891091
MDAgest6041361130321,716
AHM238470884
Beat3811471999
Deictic8811115
Iconic325657712
LDAgest5281281131122,091
AHM329478601
Beat459491696
Deictic102120129
Iconic6712599853
MDSilent32782173915,040
Speaking3788027739386
LDSilent37386785616,285
Speaking3097487438085
Table 3. Standard residuals arisen from cross classification by GC, lagged correlation, the presence of interlocutor gestures, and whether the interlocutor is speaking for data profiles of “MD Precedes” and “LD Precedes”. Residuals in cells which are bold are significantly more than would be expected with no interaction between the categories and GC. Residuals in cells which are italic are significantly less than would be expected with no interaction between the categories and GC. Values marked with distinctive colors are addressed in the main text.
PlayerLabelBi-CausationMD Causes LDLD Causes MDNo Causation
MDNeg7.14839.45387.9003−14.8607
Open−19.7594−20.5005−20.813936.5817
Pos19.665318.41820.3539−34.8228
LDNeg5.184313.290811.2631−18.8043
Open−16.9411−24.1184−22.472938.8400
Pos17.925319.613919.3959−34.1832
MDAgest−2.2789−5.8700−2.75926.8349
AHM−0.69493.10441.8421−3.0012
Beat1.41055.51050.7321−4.8643
Deictic2.4051−0.05551.2728−1.8929
Iconic2.36351.01281.7201−2.8930
LDAgest−10.0238−13.1607−9.551219.7237
AHM2.93097.39595.0245−9.6514
Beat4.93385.91575.5854−9.9223
Deictic2.75663.45213.1776−5.6808
Iconic7.74957.75524.4793−11.6728
MDSilent−7.4072−7.8730−8.977414.6126
Speaking7.40727.87308.9774−14.6126
LDSilent−5.7301−9.8455−9.923815.8300
Speaking5.73019.84559.9238−15.8300
Table 4. Counts of observed windows classified binary by GC, lagged correlation categories, the presence of interlocutor gestures, and whether the interlocutor is speaking.
PlayerLabelCausationNo Causation
MDOpen264622,009
Correlated11942417
LDOpen263621,971
Correlated12602399
MDSilent188715,040
Speaking19539386
LDSilent209616,285
Speaking18008085
Table 5. Standard residuals arisen from binary cross classification by GC, lagged correlation, and whether the interlocutor is speaking for data profiles of “MD Precedes” and “LD Precedes”. Residuals in cells which are bold are significantly more than would be expected with no interaction between the categories and GC. Residuals in cells which are italic are significantly less than would be expected with no interaction between the categories and GC.
PlayerLabelCausationNo Causation
MDOpen−36.581736.5817
Correlated36.5817−36.5817
LDOpen−38.8438.84
Correlated38.84−38.84
MDSilent−14.612614.6126
Speaking14.6126−14.6126
LDSilent−15.8315.83
Speaking15.83−15.83
Table 6. Cross classification, using correlation labels, of sequential windows within ME data lags for MD preceding LD and LD preceding MD.
Less Dominant Preceding
More Dominant Preceding Open Neg Pos
Open22,00712871361
Neg1220332203
Pos1380209267
Table 7. “Accuracy” of labels for successive windows as calculated for MD preceding LD, taking those of LD preceding MD as a “true” reference.
Correlation Label
Open Neg Pos
Precision0.890.190.14
Recall0.890.180.15
F10.890.190.14
Table 8. Standard Pearson residuals of the cross classification using correlation labels applied to successive windows reported in Table 6 (where the significant positive residual with greatest magnitude for a row and column falls on the diagonal, the value is bold).
Less Dominant Preceding
More Dominant Preceding Open Neg Pos
Open3.71−7.70−5.91
Neg−7.8820.518.38
Pos−5.868.1213.39
Table 9. Goodness-of-fit measures of GC labels applied to successive windows in the MD precedes LD lags, given the GC labels for successive windows in the LD precedes MD view of the data as a “true” reference.
Granger Causality label
No Causation Bi-Causation LD Causes MD MD Causes LD
Precision0.880.060.120.11
Recall0.880.060.110.11
F10.880.060.110.11
Table 10. Cross classification, using GC labels, of sequential windows in the ME data and contrasting lags: MD preceding LD and LD preceding MD.
Less Dominant Preceding
More Dominant Preceding No Causation Bi-Causation LD Causes MD MD Causes LD
No cause21,55847411781216
Bi-cause497428284
LD causes MD111882178134
MD causes LD119784161181
Table 11. Adjusted standardised residuals of cross classification of sequential windows between MD preceding LD and LD preceding MD, using GC labels (where the significant positive residual with greatest magnitude for a row and column falls on the diagonal, the value is bold; where not, the diagonal values are underlined).
Less Dominant Preceding
More Dominant Preceding No Causation Bi-Causation LD Causes MD MD Causes LD
No cause25.11−13.05−15.31−13.43
Bi-cause−12.266.216.957.18
LD causes MD−14.237.8410.585.42
MD causes LD−15.007.477.669.72
Disclaimer/Publisher’s Note: The statements, opinions and data contained in all publications are solely those of the individual author(s) and contributor(s) and not of MDPI and/or the editor(s). MDPI and/or the editor(s) disclaim responsibility for any injury to people or property resulting from any ideas, methods, instructions or products referred to in the content.

