1. Introduction
Creating a seamless integration of various sensory inputs poses a notable challenge in the domain of virtual reality (VR) [
1]. While substantial progress in computer graphics and sound rendering over the past five decades has resulted in highly realistic visual and auditory experiences in VR [
1,
2], achieving genuine immersion, interactivity, and the stimulation of imagination [
3] necessitates the integration of realistic tactile experiences, often facilitated through haptic feedback [
4]. Haptic feedback encompasses diverse tactile stimulation methods, including vibrations, forces, and motions, all aimed at conveying information and enriching user experiences [
5]. This paper’s specific focus lies in vibrotactile feedback, a haptic feedback form utilizing controlled vibrations to replicate sensations on the skin [
6]. This technology seamlessly integrates into various devices, such as touchscreens, game controllers, and wearables, offering users realistic and immersive sensations that closely mimic physical attributes like texture, shape, weight, temperature, or resistance [
7,
8,
9]. Consequently, the incorporation of vibrotactile feedback in VR allows users to fully engage their sense of touch, enabling them to explore, grasp, and manipulate virtual objects as if they were interacting with them in the physical world [
9,
10,
11].
In the domain of haptic perception, a noteworthy area of research explores the ‘funneling effect,’ initially observed by v. Békésy [
12]. The ‘tactile funneling illusion’ is characterized by the emergence of phantom tactile sensations through the application of vibrotactile feedback [
13]. In this context, ‘phantom’ sensations refer to illusory tactile experiences, often perceived as occurring between distant points of skin stimulation [
14,
15,
16,
17]. This research aims to better understand and manipulate the tactile perception of users by exploring how vibrotactile feedback can create these intriguing illusory sensations. The tactile funneling technique has regained significant attention, especially in the contexts of virtual and augmented reality [
8,
13,
18,
19,
20,
21,
22,
23,
24]. It has the potential to expand users’ perception of touch to virtual objects they interact with. For instance, in VR environments, when handheld controllers deliver vibrotactile sensations, the funneling illusion creates a compelling sensation for users. It makes them feel as if they are genuinely touching virtual objects or sensing the impact on a virtual object caused by interactions with other virtual objects, simulating forces [
13,
20,
21,
22]. This unique phenomenon significantly elevates the immersive quality of VR experiences by effectively bridging the gap between the digital and physical worlds.
The robustness of the funneling effect has been evident across various skin locations, including the palms, fingers, arms, and even the forehead [
18]. However, despite its demonstrated reliability, prior research on the tactile funneling illusion has exhibited limitations in its scope. The majority of studies have primarily focused on a limited set of skin locations, typically involving just five intended illusory points [
8,
13,
19,
20,
21,
22,
23]. In a few instances, researchers have expanded their investigations to include up to seven points [
18,
25]. Nevertheless, these studies have often overlooked multisensory environments, particularly neglecting audio stimulation. As a result, a notable gap remains in our understanding of how the tactile funneling illusion operates in multisensory contexts, where the integration of various sensory modalities has the potential to enhance its effectiveness. Furthermore, our current knowledge gap extends to understanding how these factors may interact and potentially reduce the perceived workload, a crucial aspect of enhancing user experiences in such settings [
26].
Moreover, in VR studies that specifically examine the funneling effect, questionnaires employing Likert scale responses have been a common means of assessing participants’ perceptions [
8,
13,
20,
21,
23]. It is important to recognize that such methods have a subjective nature. In contrast, certain studies have adopted a raycasting method [
19,
22], wherein participants use a foot pedal to accurately pinpoint the location of the phantom tactile sensation. Nevertheless, it is essential to acknowledge that these assessment methods introduce potential delays between experiencing the illusion and reporting it. These delays may impact response accuracy and our comprehension of the phenomenon. In our current study, we employ a VR system integrated with eye-tracking technology, presenting a novel and precise approach to investigating phantom stimuli. This approach enhances result accuracy and reliability, eliminating the need for subjective reporting. Eye-tracking systems monitor users’ gaze movements and fixation points, offering insights into visual attention, spatial perception, sensory integration, and stimulus localization [
27].
In our study, we introduce the “Extended Funneling” technique, a distinctive VR vibrotactile feedback method that sets itself apart from existing funneling methods. We hypothesize that participants exposed to the extended funneling technique will demonstrate significant improvement in spatial localization for audio–vibrotactile stimuli compared to their counterparts receiving generic vibrotactile feedback. Furthermore, we hypothesize that participants utilizing the extended funneling technique will display significantly lower overall workload scores than those experiencing no funneling. To systematically evaluate our hypotheses, we have structured our study into two participant groups. Each group will receive vibrotactile feedback to elicit touch sensations at specific locations, complemented by spatial audio corresponding to the stimuli’s spatial positions. The experimental group will experience feedback through the extended funneling technique, characterized by predefined amplitude modulations. In contrast, the control group will receive generic vibrotactile feedback without any specific predefined pattern. Our evaluation will primarily focus on participants’ ability to accurately localize stimuli, serving as an objective measure to assess the effectiveness of our approach.
H1:
Participants exposed to the extended vibrotactile funneling technique will demonstrate a significant improvement in spatial localization for audio–vibrotactile stimuli compared to their counterparts receiving generic vibrotactile feedback.
H2:
Participants utilizing the extended funneling technique are expected to display significantly lower overall workload scores than those without funneling.
In summary, this article aims to investigate the efficacy of the “Extended Vibrotactile Funneling” technique in enhancing participants’ stimulus localization and reducing mental workload in VR experiences. Despite the expected improvement in users’ perception, a comparative approach is crucial for empirical research due to the method’s novelty. The first hypothesis (
H1) focuses on our primary objective—assessing the impact of the extended vibrotactile funneling technique on participants’ ability to localize audio–vibrotactile stimuli. This comparative design isolates the technique’s influence, ensuring precision and reliability in our findings. The second hypothesis (
H2) directs attention to assessing how the extended funneling technique influences the cognitive demands placed on participants during the VR experience. The paper is structured as follows: it begins with
Section 2, providing context for the study.
Section 3 outlines the experimental design, while
Section 3.5 details the implementation.
Section 4 presents the findings, followed by
Section 5, where implications are explored. Finally, the paper concludes with the acknowledgments of
Section 6.
3. Methodology
3.1. Participants
In the study, a total of 32 participants were included, consisting of 16 females and 16 males. These participants were randomly assigned to two distinct groups: the experimental group (including 5 females) and the control group (including 11 females). The random assignment process resulted in an unintentionally balanced gender distribution. The participants’ ages ranged from 23 to 43 years (M = 30.0, SD = 6.05). Regarding prior VR experience, 30 participants had experience, with 18 categorizing themselves as beginners, 6 as intermediates, and 6 as advanced users. These categorizations were based on self-reported proficiency and familiarity with VR technology. Hand dominance varied, with 28 participants reporting right-handedness, one participant left-handed, and three participants as ambidextrous. All participants had no neurological impairments affecting vision, hearing, or touch.
Recruitment was conducted through electronic advertisements sent via email to the research center’s contacts, including interns, university students, and researchers from diverse academic backgrounds. No incentives were offered to maintain voluntary participation. This study was conducted in accordance with the ethical guidelines and received approval, ensuring the protection of participants’ rights and well-being. Predefined exclusion criteria, mainly focused on eye-tracking issues, led to the removal of 4 participants from the initial dataset of 36. Instances of excessive blinking during the experiment made their eye-tracking data unusable. Our recruitment target exceeded 31 participants, aligning with the desired effect size, as elaborated in the statistical analysis section.
3.2. Virtual Environment
The VR experimental application was developed in Unity 3D Software (version 2022.2.7f1) [
36] and presented with Meta Quest Pro head-mounted display (HMD) (standalone, resolution 1800 × 1920 pixels per eye, 106° horizontal and 96° vertical field of view, 90 Hz refresh rate). Additionally, it included eye-tracking functionality.
The virtual environment was designed to simulate an outdoor setting, complete with a skybox and a grass texture at floor level. Participants interacted within the VR environment using a pair of VR controllers, which effectively tracked their hand movements and provided vibrotactile feedback. In the VR scene, participants could observe only a pair of virtual hands, representing the approximate positions of their physical hands; the controller models were intentionally excluded.
Participants were offered a selection of hand textures attained from the ‘Hafnia Hands’ resource [
37], which covered all six skin-tone levels of the Fitzpatrick scale [
38]. This set of hand textures has proven instrumental in numerous embodiment and remote VR studies, consistently demonstrating its capacity to heighten participants’ sense of body ownership, particularly when the chosen ‘Hafnia hands’ closely resembled the participants’ own skin tone.
3.3. Virtual Objects
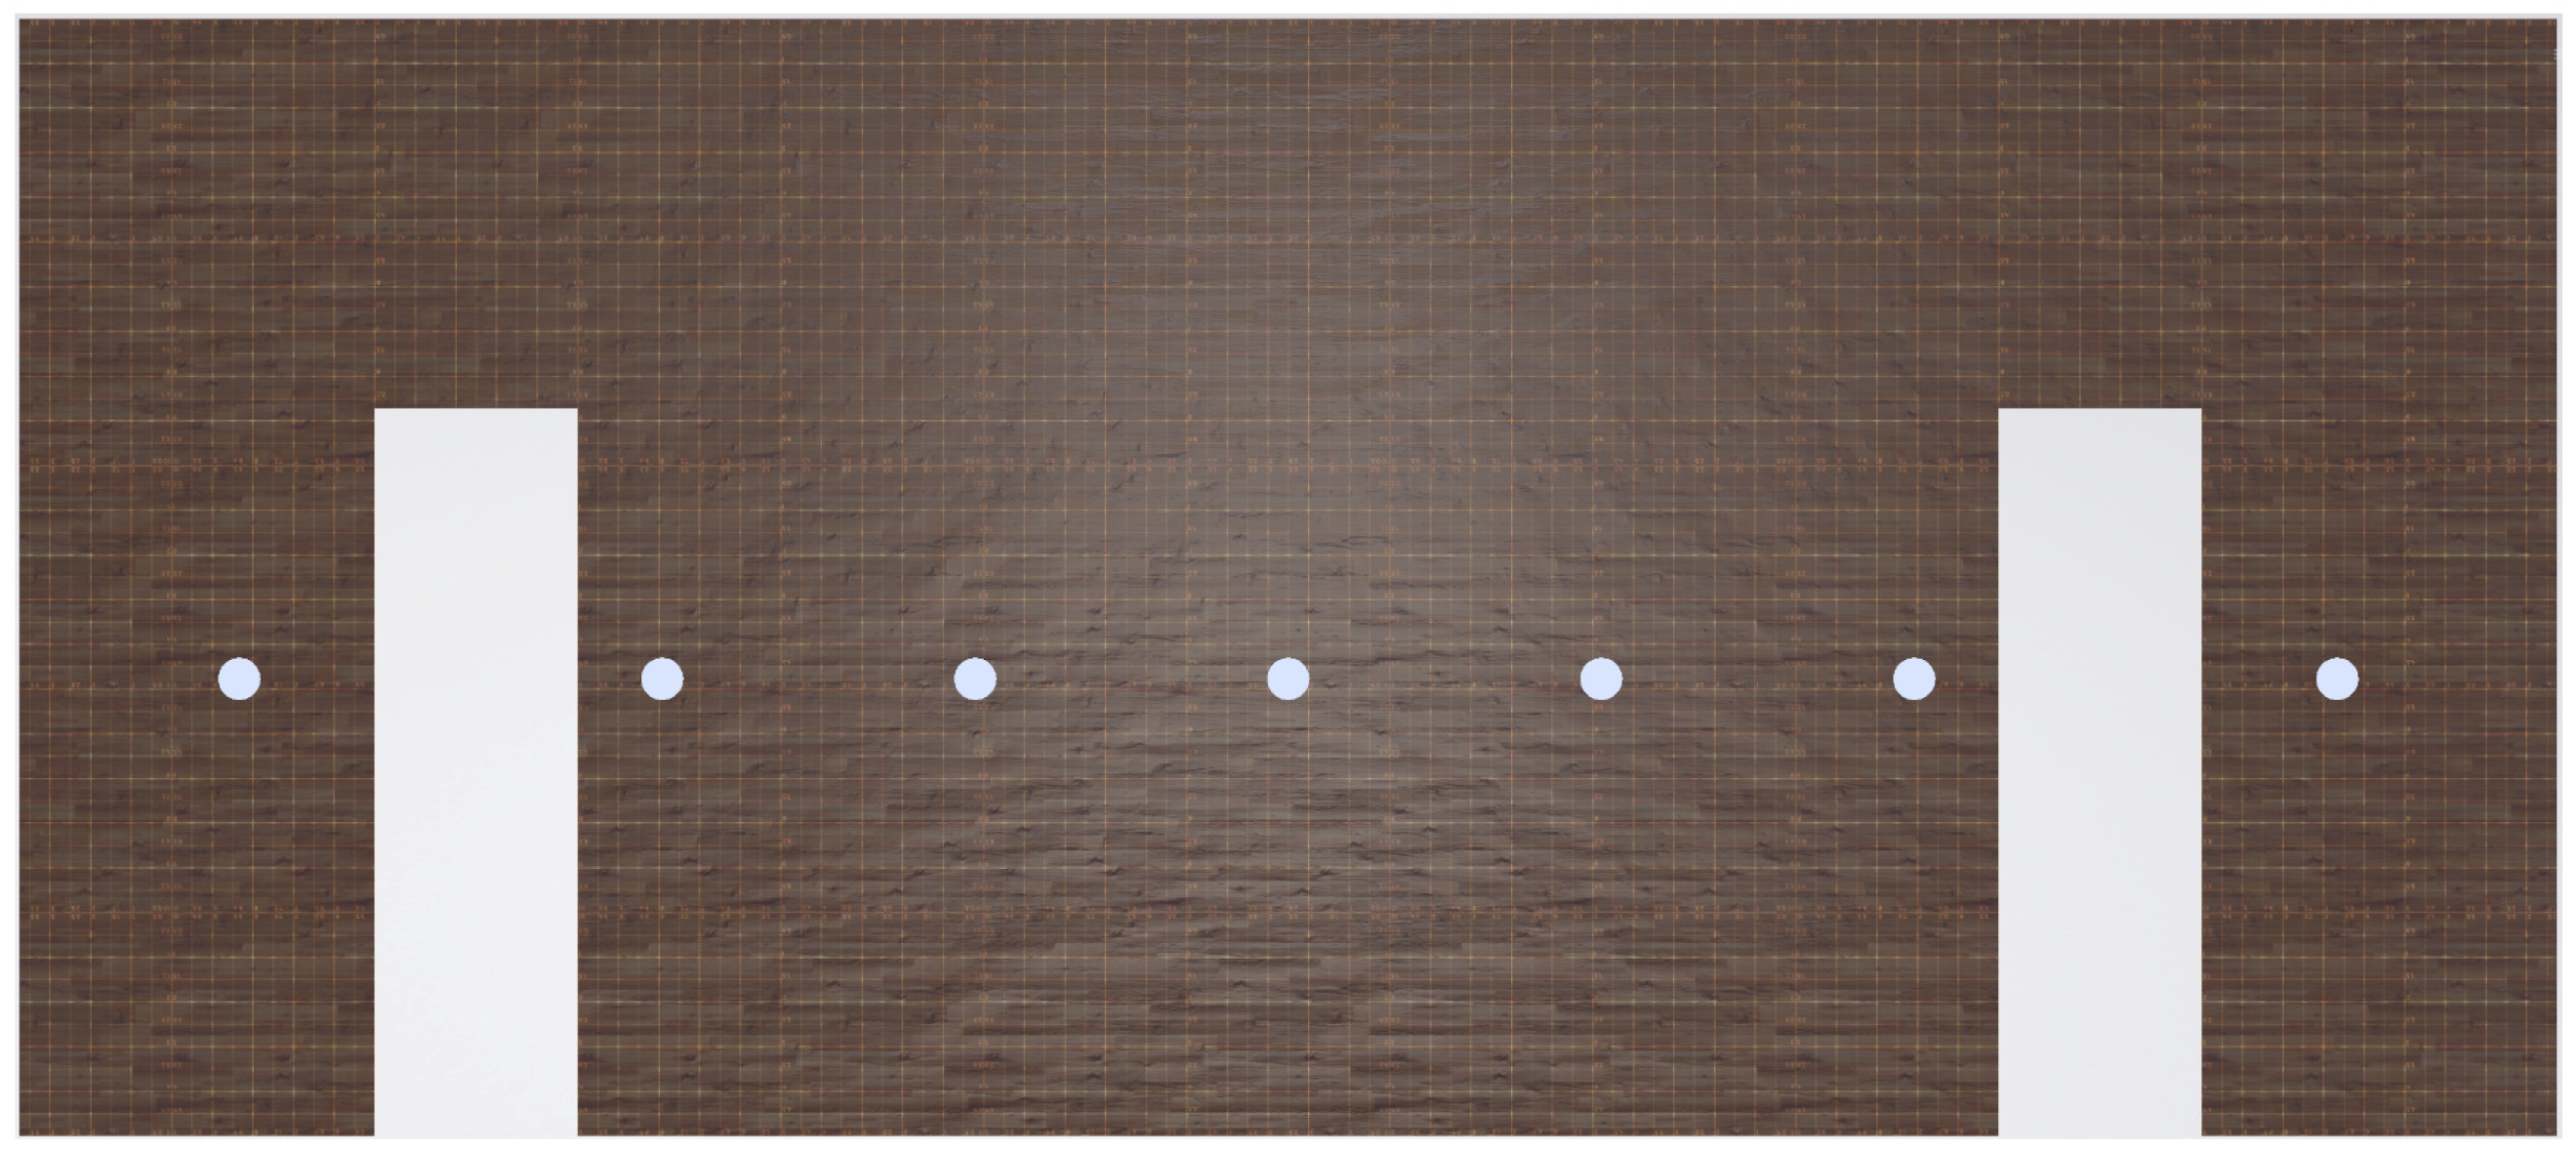
The virtual board used in the experiment measured 75 centimeters (cm) in width, 33 cm in length, and 2.5 cm in thickness (
Figure 1). Visual markers on the board helped participants pinpoint contact points, with seven reference points: outer left, mid left, inner left, center, inner right, mid right, and outer right. These points were crucial for recording eye-tracking responses in the localization task. The landing locations were positioned as follows: ‘Center’ in the middle, ‘Inner’ 9.25 cm from Center, ‘Mid’ 18.5 cm from Center, and ‘Outer’ 31 cm from Center.
The virtual board also featured two 6 cm-wide holes for participants’ virtual hands. This design matched the grip pose of their virtual hands holding the VR controllers, ensuring seamless interaction. The board’s width was intentionally aligned with the chair’s armrests, providing natural hand placement. The virtual board’s positioning and orientation within the virtual environment were automatically adjusted in response to the positions of the virtual hands; the board was always rendered in between the participants’ hands. The hands were positioned on the chair’s armrests to maintain an equal distance from the board’s center, and an experimenter confirmed their alignment with the experiment’s requirements. A white ping-pong ball (4 cm in diameter) was used as a visual cue, bouncing off the board at one of the seven locations.
3.4. Experimental Design
The experiment followed a between-subjects design, wherein participants were randomly assigned to either the experimental group or the control group. Both groups were engaged in a localization task, which consisted of two phases: one involving visual feedback trials, followed by trials without visual cues. This initial phase is referred to as the ‘baseline condition’, enabling a comparison of participants’ performance in the localization task, assessing their ability to determine the ball’s position solely relying on audio–vibrotactile cues, which constitutes the testing phase.
In the experimental group, participants received vibrotactile stimuli using the funneling technique, whereas the control group received vibrotactile stimuli without funneling. This design choice was influenced by a prior study [
23] that included a condition without funneling. In the earlier experiment, participants received what they termed ‘generic feedback’, with the same vibration amplitude consistently applied to both VR controllers throughout all trials. In our present study, the experimental group experienced specific amplitude combinations, ranging from 0% to 100%. In contrast, the control group encountered two vibration pulses, one for each hand, with randomly selected amplitudes also ranging from 0% to 100%.
3.5. Procedure
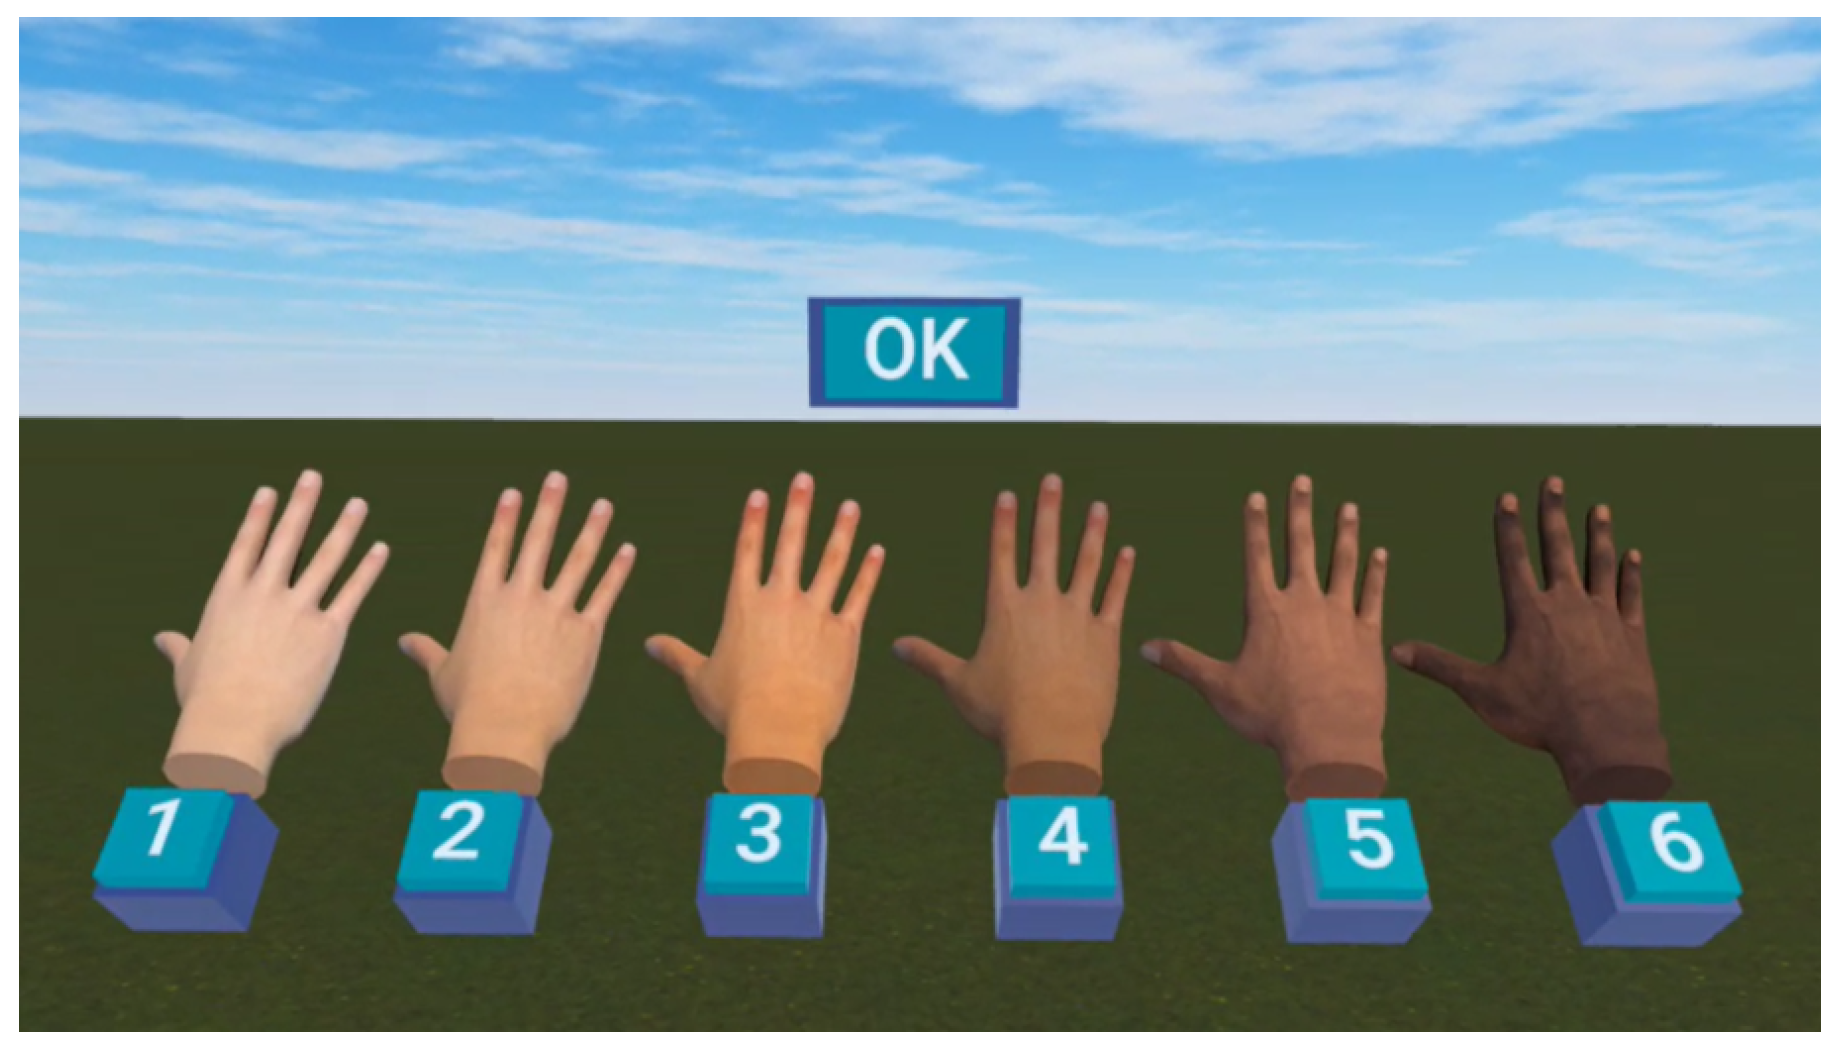
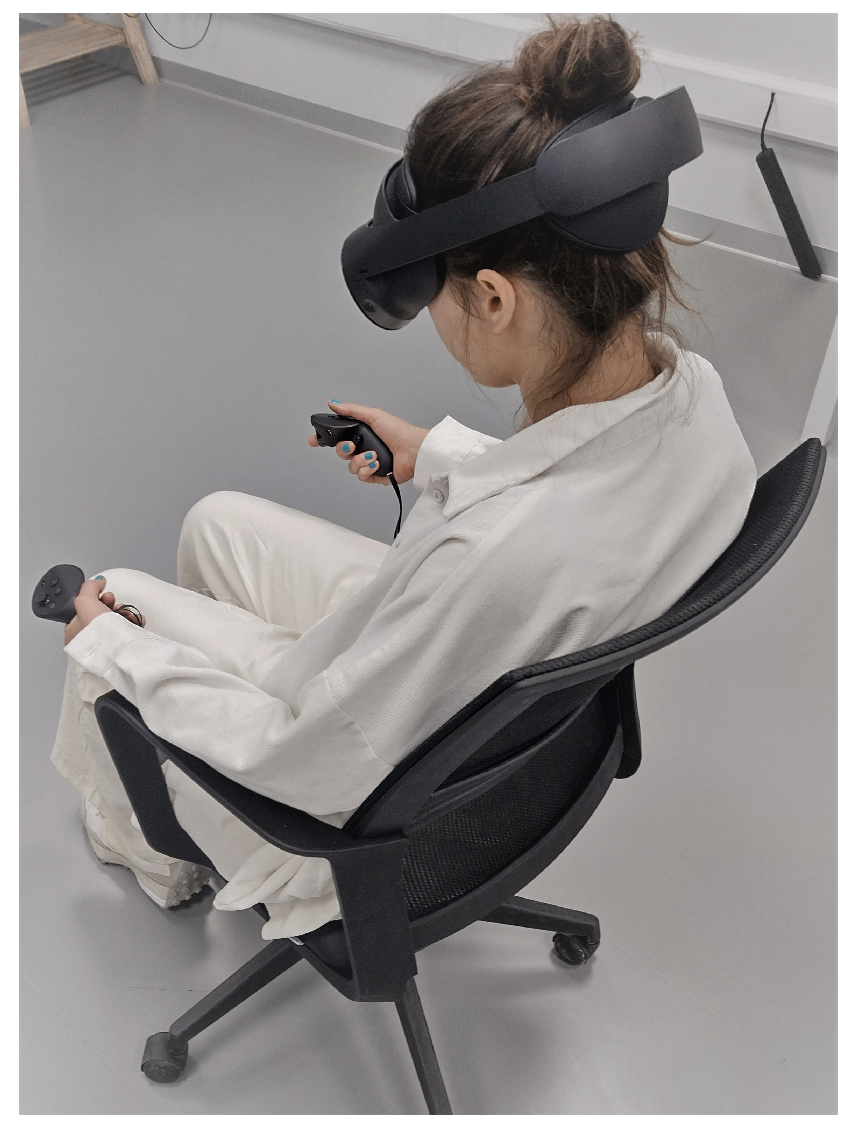
Participants provided informed consent and were assigned unique identifiers to ensure confidentiality. They were seated in a chair for the duration of the experiment (≈10 min), with their hands resting on armrests, and wore the HMD. The eye-tracking system was calibrated within the Oculus system to ensure accurate gaze data. Calibration was repeated as needed to maintain accuracy. Before commencing the experimental trials, participants were asked to select a skin type for their androgynous virtual hands from six options based on the Fitzpatrick scale (
Figure 2). This selection aimed to enhance VR embodiment [
39]. Furthermore, participants were instructed to adjust their hand orientations to mimic the natural pose of holding the board, even though they were physically holding controllers (
Figure 3). This adjustment was made to create the illusion of holding the board within the virtual environment.
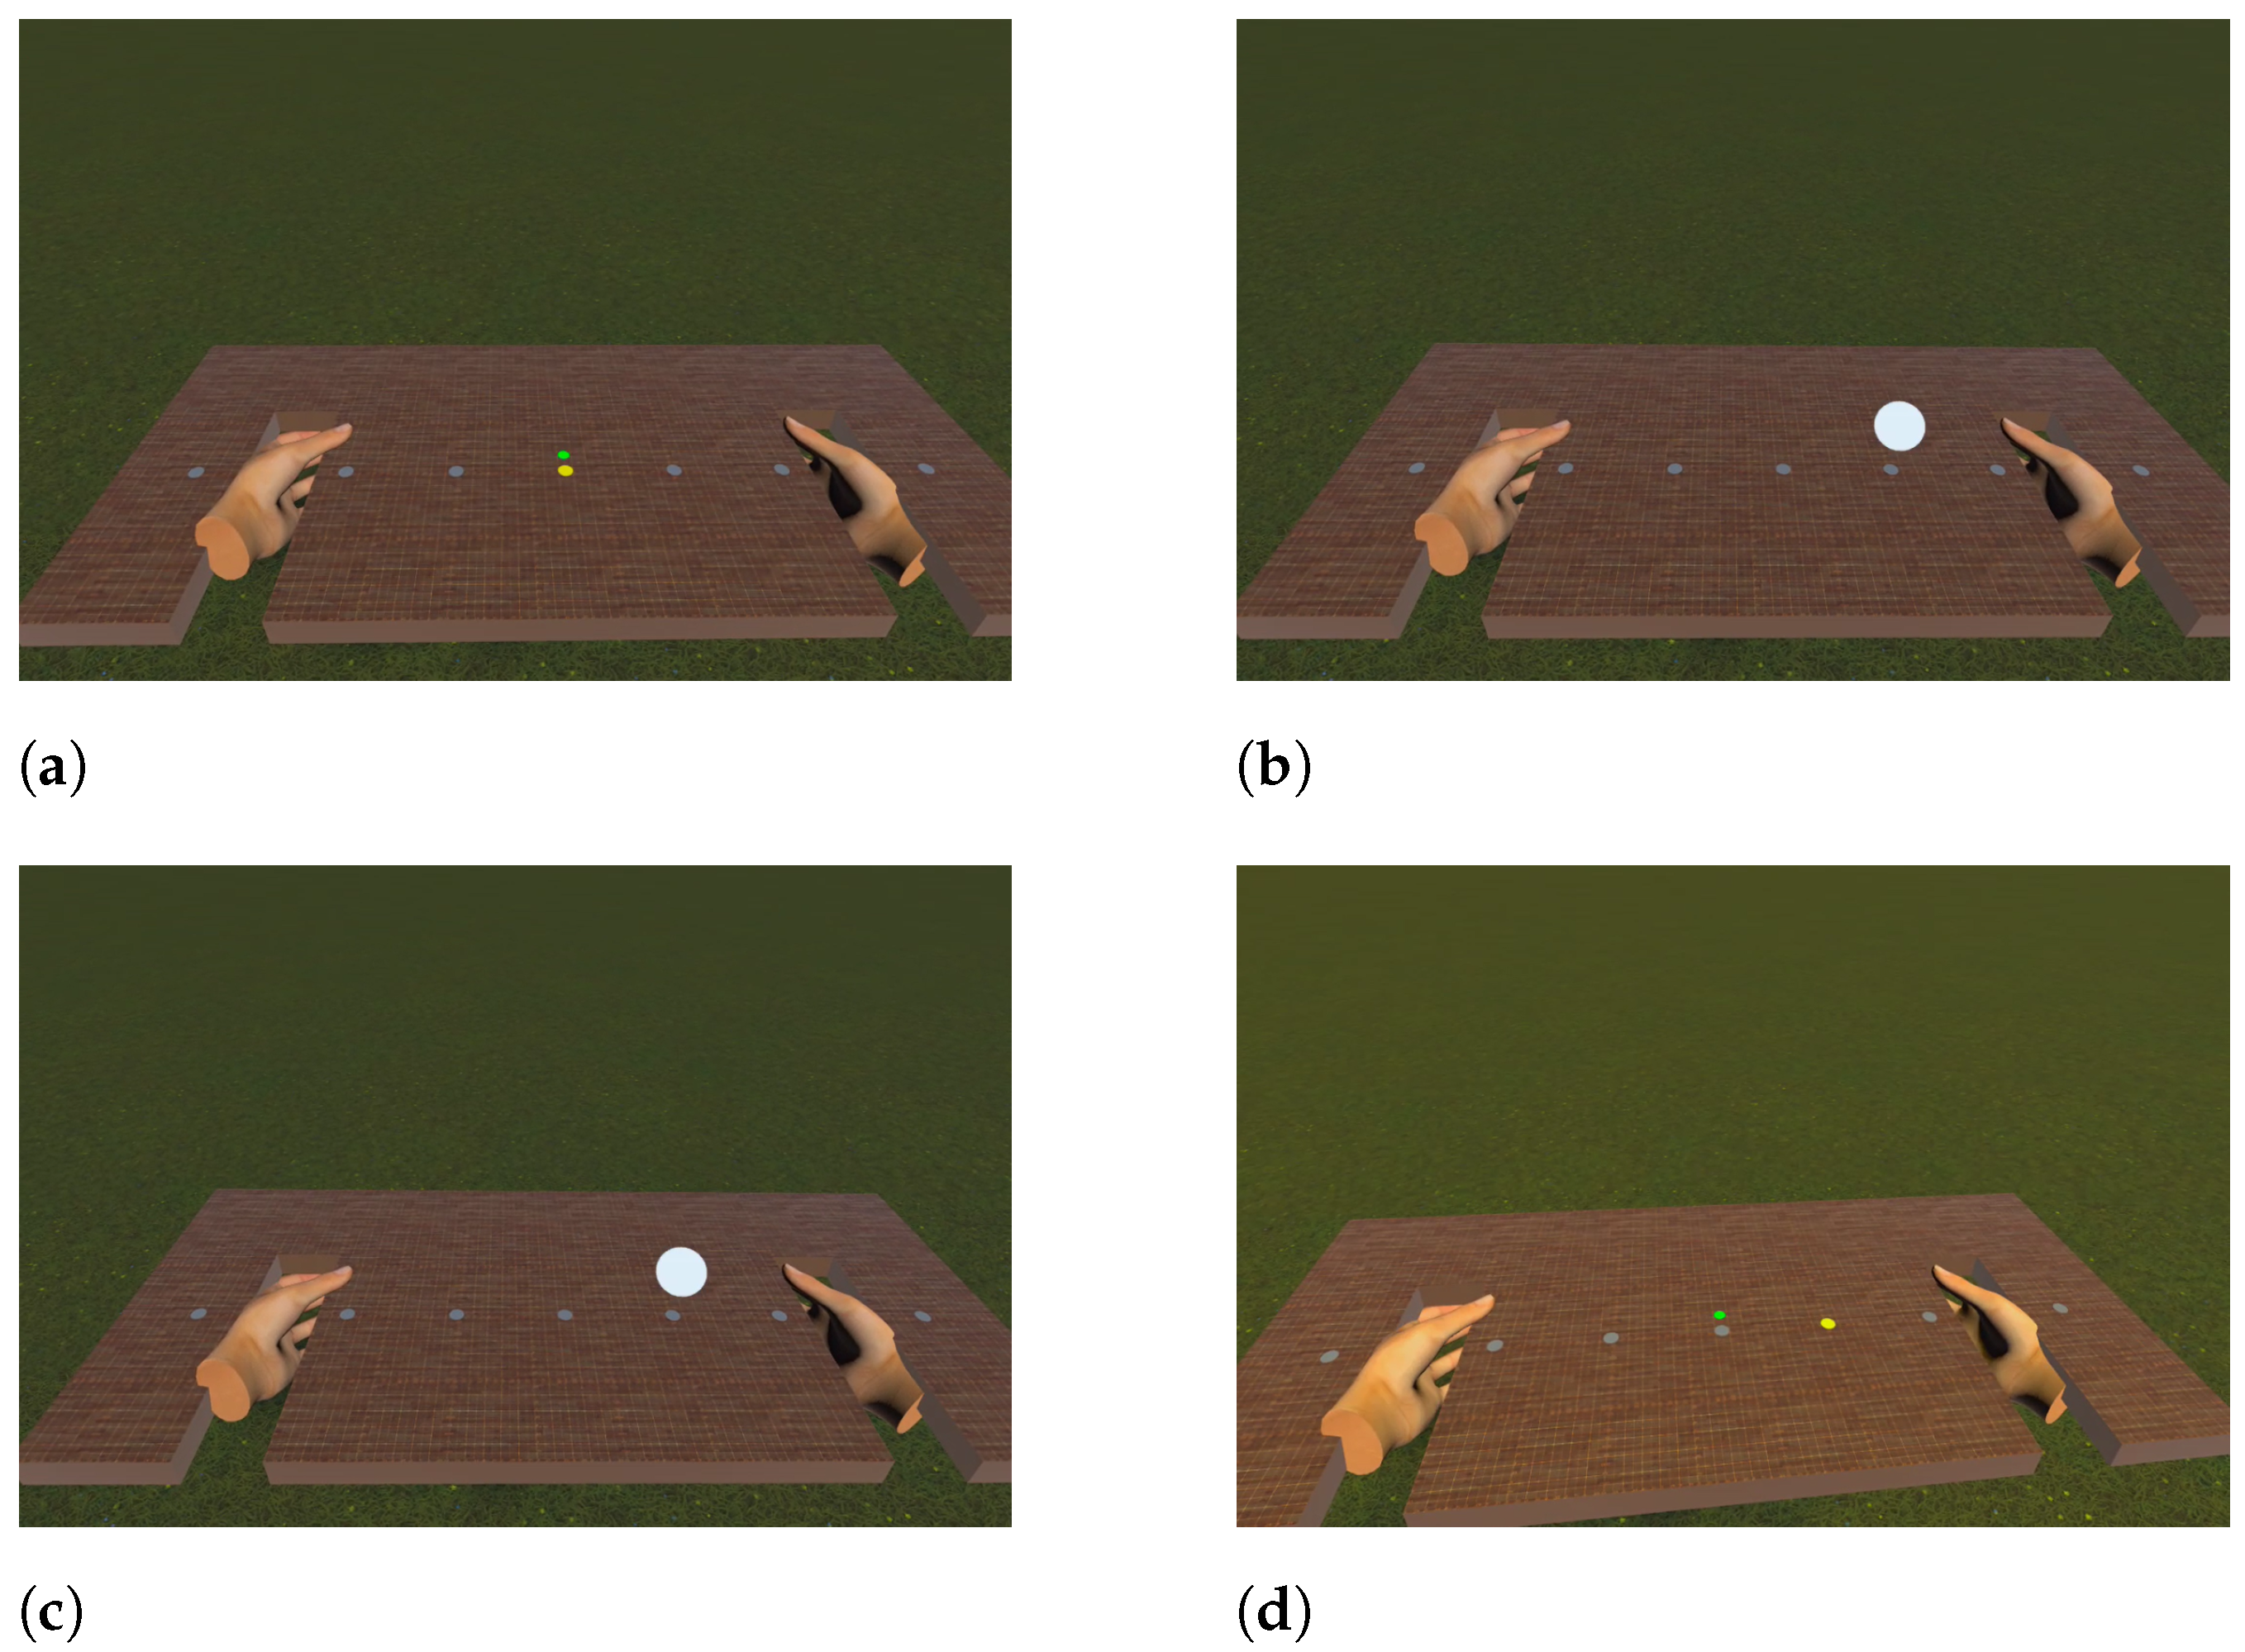
Participants underwent a pre-training session to familiarize themselves with the two phases of the experimental task, as illustrated in
Figure 4. The task encompassed a visual feedback phase and a no visual feedback phase. In the visual feedback phase, each trial commenced with a central green dot serving as a fixation point (a). Participants then received real-time visual, haptic, and auditory feedback regarding the ball’s position (b), facilitating precise ball localization. Participants maintained their gaze on the ball’s location until the next trial (c), where their responses were recorded. The end of each trial was marked by a yellow environmental light flash, signaling the start of the next one (d). During the subsequent no visual feedback phase, the same sequence of stages was followed. Participants focused on the fixation point (a), but, this time, they received solely audio–vibrotactile feedback (no visual) regarding the ball’s position (b). Their task was to estimate the ball’s location. Gaze direction was maintained until the next trial (c) to record localization responses, and a yellow environmental light flash marked the end of each trial and the beginning of the next one (d). The key distinction was that the experimental group received haptic feedback inducing the funneling effect in both phases, whereas the control group received haptic feedback without funneling in both phases.
In addition to collecting data on localization performance via the integrated eye-tracking in the VR system, participants also completed two questionnaires during the post-experimental procedures. The NASA-TLX [
40] was employed to assess the perceived workload specifically during the no visual feedback experimental task. The Avatar Embodiment Questionnaire (AEQ) [
31] measured participants’ subjective experiences and their sense of embodiment while interacting with the avatar hands throughout the experiment. Collectively, these measurements provide valuable insights for evaluating the potential impact of the funneling effect on spatial perception, task performance, and participants’ subjective experiences.
3.6. Synthesis of Sensory Cues
The HMD incorporated an audio system that provided spatial audio feedback, allowing participants to discern the location of the bouncing ball based on the direction and intensity of the sound. Regarding haptic feedback, the VR controllers were programmed to provide vibrations with varying amplitudes, a feature that was either aligned with the funneling technique (for the experimental group) or not (for the control group). These cues collectively aided participants in perceiving the ball’s position. The integration of spatial audio and vibrotactile feedback created a multisensory environment, enhancing participants’ spatial perception and immersion within the virtual environment [
8,
41]. This approach aimed to foster a sense of presence and spatial awareness by incorporating multiple sensory modalities. The group that received haptic feedback without funneling was designed to challenge participants’ ability to accurately perceive the ball’s position. This group served as a means to isolate the impact of funneling versus non-funneling haptic feedback, allowing for a focused investigation of this specific factor.
3.7. Trial and Eye-Tracking Implementation
Each trial began with a prompt for participants to fixate their gaze on the center of the board. Once their fixation was detected, a ball, initially positioned 0.45 m above the board and outside the participants’ visual field, appeared.
In each frame, a linear force simulated the ball’s free fall toward its target contact point on the board. It is important to mention that, even if participants made slight hand movements during the trial or if there were tracking issues causing the board’s movement, the ball would consistently land accurately on the target position. Upon contact with the target, the ball produced a sound mimicking a ping-pong ball bouncing off a wooden surface, synchronized with the point where it landed. Simultaneously, the controllers received a 60-millisecond vibration pulse. Participants were required to maintain their fixation on the contact point for a duration of 3.5 s (interstimulus interval) before the subsequent instruction prompted them to refocus on the center of the board. During the localization task (no visual feedback phase), the ball itself was not visually rendered, but the same implementation was followed.
Table 1 summarizes the vibration intensities used for each contact point to induce the funneling effect. In the control group trials, the vibration amplitude for each trial was randomly assigned within a range of 0 to 100% for each controller.
For each of the seven contact points, we designated a maximal non-overlapping square area. In every frame, we determined the intersection of the eye gaze vector with one of these square areas on the board. These values allowed us to calculate the area of the contact point where the participant focused the most during a trial, the timing of their initial fixation on the target, and the total duration of their fixation on the target. We opted for square-shaped zones as an approach to facilitate target selection from the seven available options. As a feedback mechanism to the user, the visual representation of the contact point (illustrated as one of the white circles in
Figure 1) would transition to yellow when an active fixation was detected.
3.8. Questionnaires
The NASA-TLX [
40] is a widely used, subjective, multidimensional assessment tool. It is designed to measure the perceived workload of a participant while they are performing a task. It evaluates workload across six dimensions: Mental Demand, Physical Demand, Temporal Demand, Performance, Effort, and Frustration. Ratings on a scale from “Very Low” to “Very High” are assigned to each dimension. The decision to employ NASA-TLX in this study was specifically influenced by the need for participants to rate workload on multiple scales, including the physical dimension. This choice was deemed fitting due to the physical activity involved, such as turning heads and recording responses.
To calculate the NASA-TLX workload score, individual ratings from the six dimensions are combined using a weighting procedure based on pairwise comparisons. The weight assigned to each dimension reflects its relevance to the perceived workload. The Weighted Workload (WWL) score is obtained by multiplying the weight assigned to each dimension by its corresponding scale score, summing up the scores for all dimensions and dividing the sum by 15, the total number of pairwise comparisons. The resulting score, ranging from 0 to 100, represents the relative contributions of each dimension to the overall workload. The NASA-TLX score can be classified into workload categories based on specific ranges. Scores from 0 to 20 indicate a very low workload, 21 to 40 indicate a low workload, 41 to 60 indicate a moderate workload, 61 to 80 indicate a high workload, and 81 to 100 indicate a very high workload. These classifications provide a framework for interpreting and comparing workload levels across different tasks.
The AEQ [
31] was utilized to assess participants’ level of embodiment while embodying avatar hands during the task. The questionnaire consisted of 16 questions divided into four subscales: Appearance, Response, Ownership, and Multi-Sensory. Each subscale demonstrated high reliability, with Cronbach’s
values ranging from 0.72 to 0.82. Participants rated their agreement with each statement on a 7-point Likert scale. To compute the avatar embodiment scores, a standardized approach was followed. The final embodiment score, ranging from 1 to 7, represented the degree of embodiment experienced, with higher scores indicating a greater sense of embodiment. The scores were calculated by averaging the questions within each subscale. The subscale scores were then averaged to derive the final embodiment score. Equal weight was assigned to the subscales based on the approximate equivalence of the percentage of variance explained by each principal component after applying oblique rotation.
3.9. Statistical Analysis
The initial data collection for this study involved 36 datasets. However, during the final analysis, 32 datasets were selected for inclusion, with the exclusion of data attributed primarily to eye-tracking issues, resulting in incomplete recordings of gaze positions and fixations. The adjusted sample size of 31, determined to achieve a desired effect size of 0.8 (Cohen’s d = 0.8), yielded a substantial effect size and provided adequate statistical power to ensure the intended robustness of the study findings.
The statistical analysis was conducted using RStudio [
42]. To assess the normality of the data distribution, the Shapiro–Wilk test was performed. If the data violated the assumption of normality, non-parametric tests were employed as appropriate. Similarly, Levene’s test was used to assess variance homogeneity, and, if this assumption was not met, alternative methods such as the Welch approximation were applied. For comparing multiple groups, the Kruskal–Wallis test was utilized. If this test indicated significant differences between the groups, pairwise comparisons were conducted to determine which groups were different from each other. To control for familywise error, a Bonferroni correction was applied to the
p-values obtained from these pairwise comparisons.
4. Results
The results of our study are presented in the following three subsections, each addressing distinct aspects of our hypotheses (see
Section 1) and providing detailed insights into the outcomes. In the first subsection,
Section 4.1, we directly test
H1, evaluating whether the extended vibrotactile funneling technique enhances participants’ spatial localization for audio–vibrotactile stimuli. Moving on to the second subsection,
Section 4.2, we focus on
H2, examining whether participants using the extended funneling technique exhibit lower overall workload scores. Lastly, in the third subsection,
Section 4.3, we investigate subjective user experiences, specifically addressing the sense of hand embodiment during the study.
4.1. Localization Task
Descriptive statistics were computed to summarize the data. During the localization task, participants’ performance was assessed in two distinct phases. The initial phase, which established baseline measures with visual feedback, revealed that the experimental group achieved an average accuracy of 96.25% (
), 95% confidence interval (CI): [92.85%, 99.65%], while the control group reached a similar accuracy of 96.43% (
,
. In the subsequent phase of the experiment, where visual feedback was removed, the experimental group maintained an average accuracy of 41.79% (
,
, while the control group exhibited a lower average accuracy of 28.21% (
,
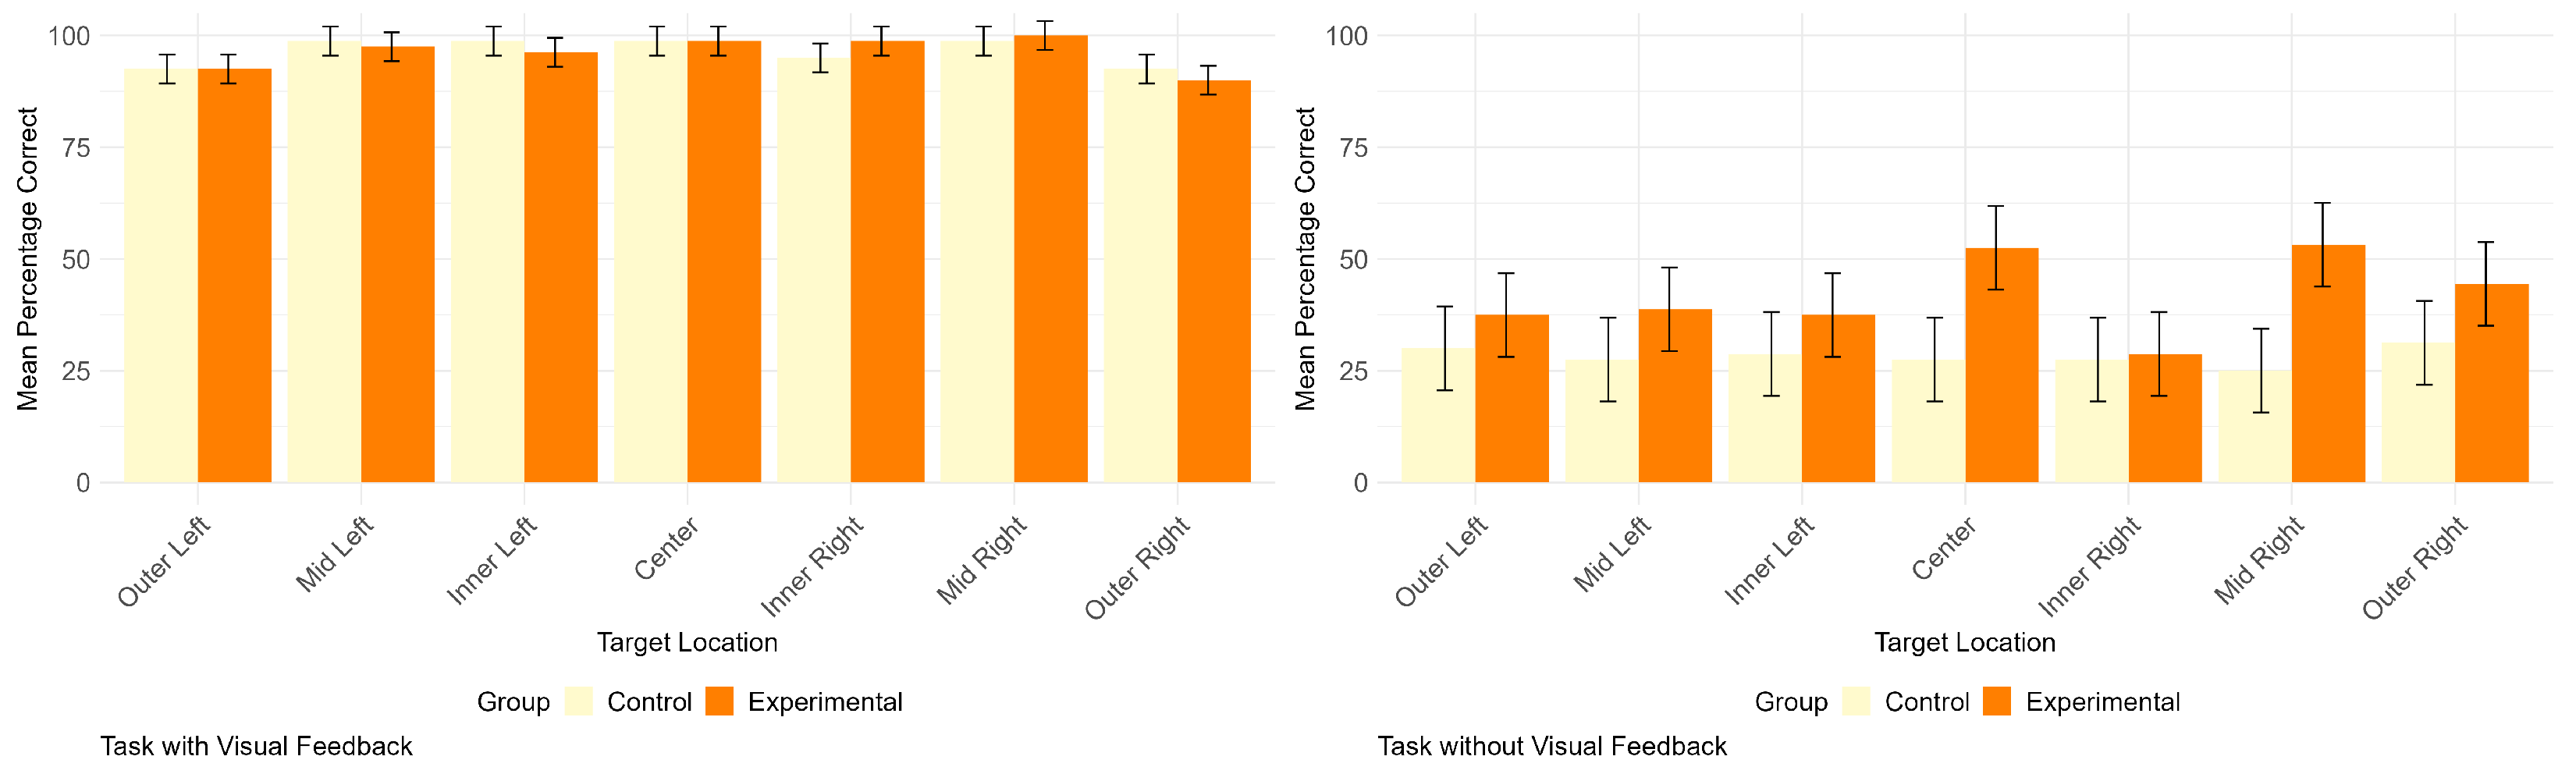
. The bar plots presented in
Figure 5 offer a visual comparison of correct response rates across seven target locations, considering participant groups (experimental vs. control) and experimental conditions (visual feedback vs. no visual feedback).
A Welch two-sample t-test was conducted to assess the difference in mean percentages of correct responses for the localization task between the control (28.21%) and experimental (41.79%) groups within the no visual feedback condition. The test yielded a statistically significant result (, ), indicating a significant difference in localization performance between the groups. The 95% CI for the difference in means ranged from −20.97% to −6.18%, further supporting the conclusion of a significant difference. These findings support the improved localization performance of the experimental group in the absence of visual feedback, aligning with our hypothesis (H1). This suggests that participants who received vibrotactile stimuli through the funneling technique, compared to generic vibrotactile feedback, demonstrated higher localization performance.
The study assessed localization performance across seven distinct target locations for both the experimental and control groups under conditions with visual and no visual feedback, as shown in
Table 2. Under the visual feedback condition, the experimental group achieved the highest success rate (
) when targeting the ‘mid right’ location. Conversely, they exhibited the lowest success rate (
) when attempting to localize the ‘outer left’ location. In the same visual feedback condition, the control group demonstrated the highest success rates (
) when targeting the ‘center’, ‘inner left’, ‘mid left’, and ‘mid right’ locations. However, they faced greater difficulty when localizing the ‘outer right’ and ‘outer left’ locations, both of which resulted in a lower success rate of (
). Under the no visual feedback condition, an examination of descriptive statistics revealed distinct trends in localization success rates across various spatial locations. Within the experimental group, the ‘mid right’ location stood out with the highest success rate (
). Conversely, the ‘inner right’ location displayed the lowest success rate (
). In contrast, within the control group, the ‘outer right’ location exhibited the highest success rate (
). Meanwhile, the ‘mid right’ location recorded the lowest success rate (
).
For the visual feedback condition in the experimental group, a Kruskal–Wallis test revealed a statistically significant difference among these locations (
,
), indicating notable variability in localization performance. Post hoc pairwise comparisons with Bonferroni correction were conducted at a significance level of
. A significant difference was observed between the ‘outer right’ and ‘mid right’ target locations (
), with ‘mid right’ being more readily localized, as indicated in
Table 3 through detailed pairwise comparisons. However, in the control group during the visual feedback phase, the analysis showed no statistically significant differences among the seven locations (
,
), suggesting that there is no strong evidence of significant variability in localization performance within this group when visual feedback is provided.
Subsequently, within the experimental group, a Kruskal–Wallis rank sum test assessed localization performance across the same target locations, but this time during no visual feedback conditions. The analysis revealed no statistically significant differences among these locations (, ). Post hoc pairwise comparisons with Bonferroni correction did not show any statistically significant distinctions. Similarly, in the control group during no visual feedback conditions, the Kruskal–Wallis test demonstrated no statistically significant differences among the groups (, ).
In summary, these results suggest that localization performance did not significantly vary across the tested target locations in the absence of visual feedback. However, it exhibited variability for the experimental group but not for the control group in the presence of visual feedback.
4.2. NASA Task Load Index
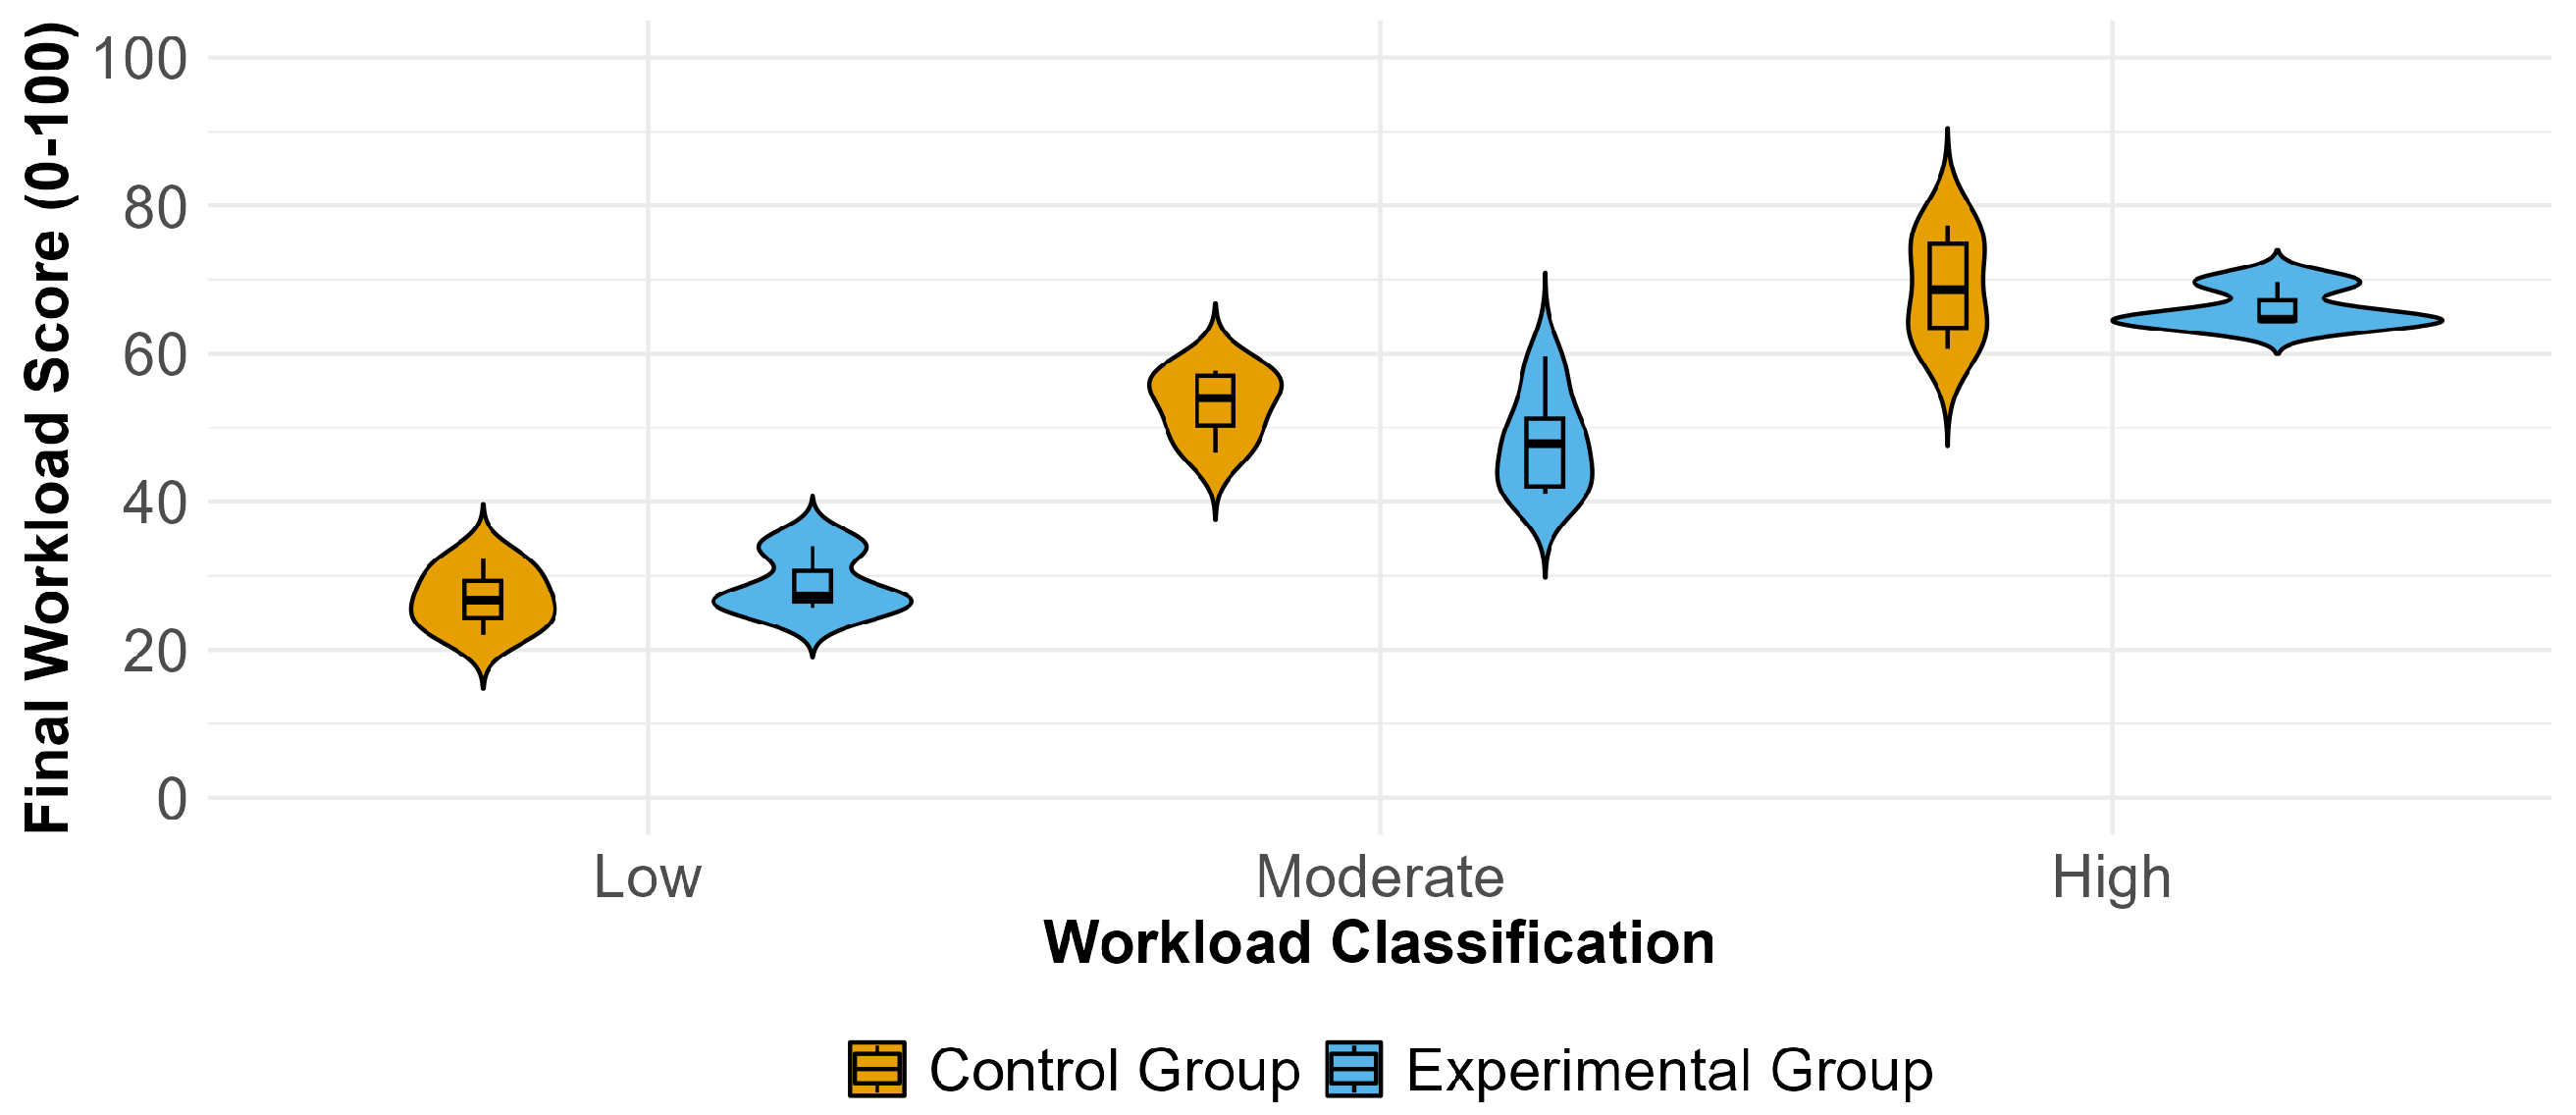
When evaluating perceived workload in the absence of visual feedback, the participants in the experimental group reported an average workload score of 47.83 (), while those in the control group reported a slightly higher mean workload of 50.90 (). However, the Mann–Whitney U test yielded non-significant results when comparing workload scores between these two groups (), providing no support for our H2.
To visually represent and compare perceived workload, we employed violin plots and boxplots (see
Figure 6). The figure illustrates NASA-TLX final scores across low, moderate, and high workload classifications for both the control and experimental groups, each consisting of 16 participants. In this visualization, the boxplot displays the median (highlighted by a bold black line), the upper and lower quartiles, and indications of potential outliers. In general, the control group tended to report higher perceived workload scores across all workload classifications compared to the experimental group, as observed in both the boxplots and violin plots. Within the experimental group, a distinctive pattern emerged in the violin plot for the moderate workload classification. This plot exhibited a notably elongated shape, indicative of a broader range of perceived workload scores during moderately demanding tasks. This suggests that participants in the experimental group experienced a wider spectrum of workload perceptions within this specific condition.
The average workload scores, as shown in
Table 4, display a consistent pattern across both groups. Participants from both the experimental and control groups rated the mental demand domain as the most workload-intensive. In the experimental group, the second-highest workload domains were temporal demand and effort, with identical ratings. Conversely, in the control group, the second-highest workload domain was performance. Interestingly, both groups consistently rated the physical demand domain as the least workload-intensive. This pattern underscores the prominence of mental workload factors in the participants’ assessments, regardless of group or task conditions (i.e., funneling vs. no funneling).
4.3. Avatar Embodiment Questionnaire
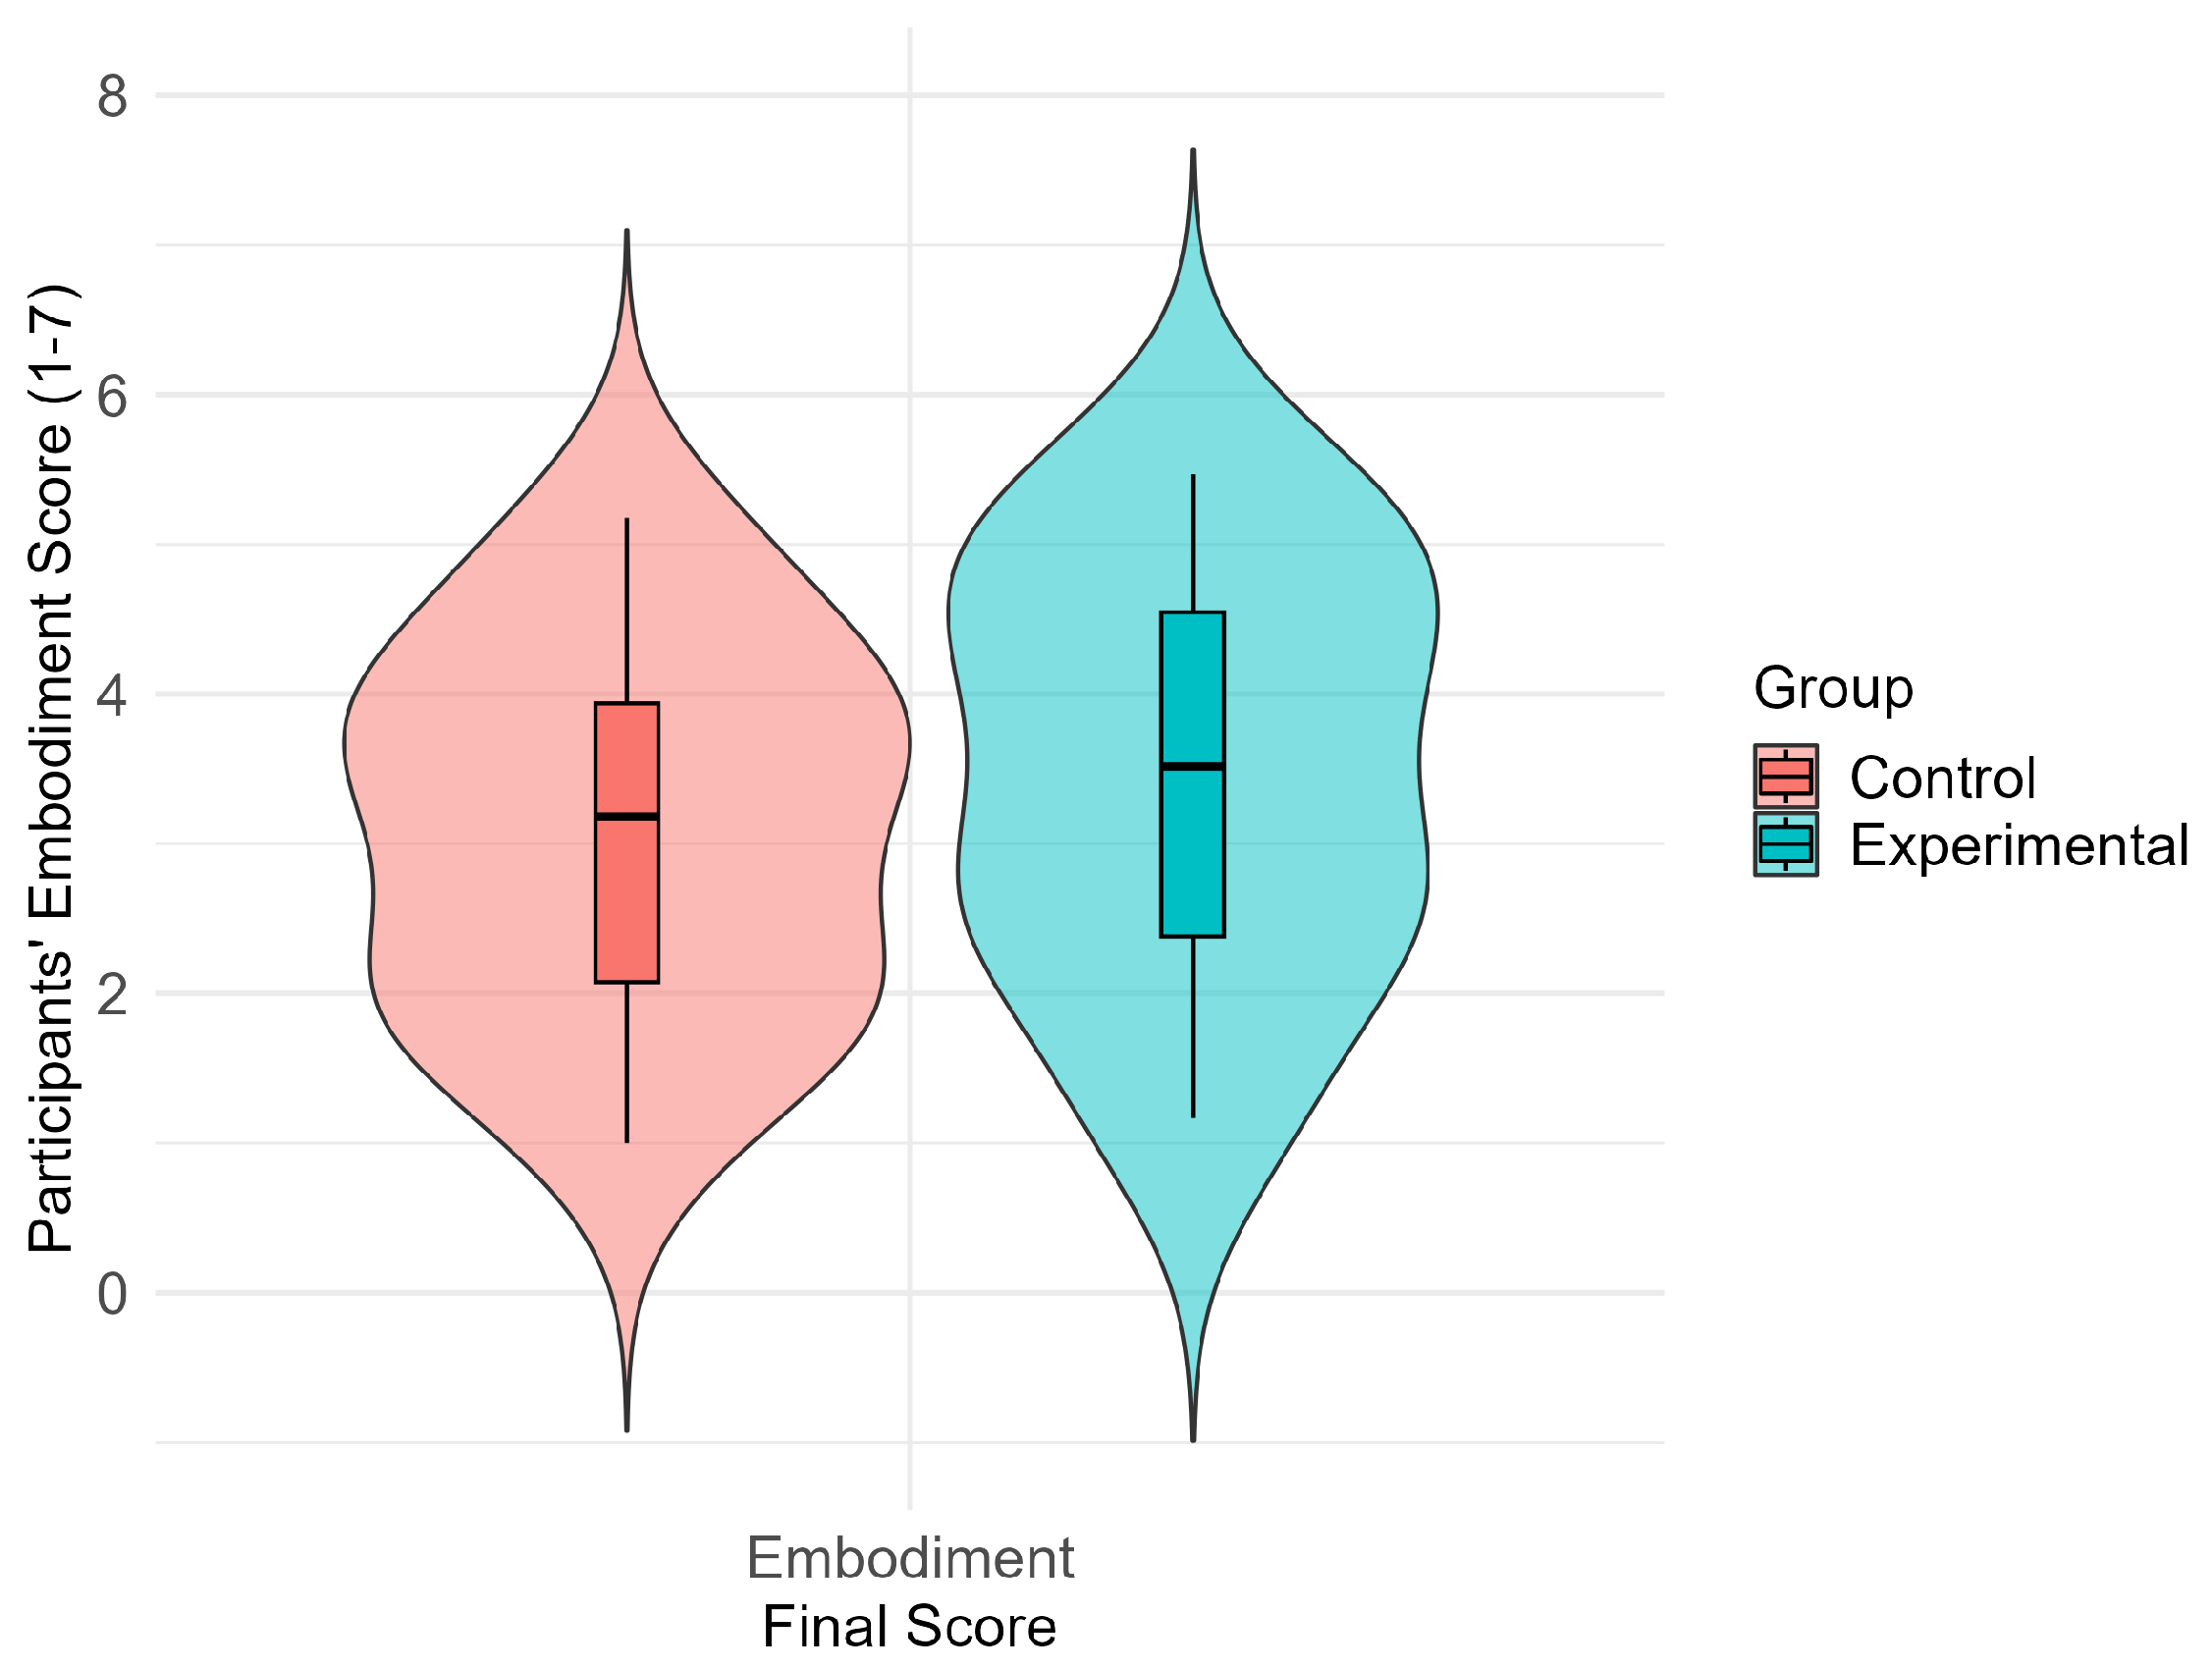
In the no visual feedback condition, mean embodiment scores on the AEQ scale were analyzed. The experimental group had a mean embodiment score of (), while the control group had a slightly lower mean score of (). These findings collectively indicate that both groups reported a moderate level of embodiment as measured by the AEQ scale.
An examination of the AEQ subscales revealed that the ownership subscale received the highest mean scores for both groups (experimental: ; control: ), suggesting a consistent emphasis on ownership in participants’ responses across both groups. Conversely, the response subscale received the lowest mean scores (experimental: ; control: ), indicating a relatively lower focus on the response aspect in both groups.
Figure 7 visually represents the distribution of final embodiment scores for both the control and experimental groups using violin plots with overlaid boxplots. The key statistics displayed in each group’s boxplot include the median (indicated by a bold black line), upper and lower quartiles, and any potential outliers. The control group exhibits a wider spread of scores and a slightly higher median compared to the experimental group. A Welch’s two-sample
t-test was conducted to assess the statistical significance of the difference in final avatar embodiment scores between the experimental and control groups. The results revealed no significant distinction in avatar embodiment scores between the two groups (
,
),
, suggesting insufficient evidence to conclude a true difference in these scores.
5. Discussion
Our study introduces the extended funneling technique, a vibrotactile feedback method designed to extend tactile sensations in VR experiences. We hypothesize that participants utilizing this technique will exhibit enhanced localization of audio–vibrotactile stimuli (
H1) and a diminished mental workload (
H2) in comparison to their counterparts who received generic vibrotactile feedback without funneling (see
Section 1).
In summarizing our key findings, our eye-tracking data strongly support
H1, revealing that the participants indeed demonstrated enhanced performance in localizing stimuli when receiving feedback through the extended funneling technique as opposed to generic feedback (see
Section 4.1). However, our quantitative analysis of the self-reported data did not provide sufficient evidence to substantiate that this improved performance was necessarily accompanied by a reduction in workload (see
Section 4.2). While our findings align with the expected improvement in localization, the relationship between enhanced performance and reduced workload necessitates further exploration. We proceed with a comprehensive analysis of our results, offering insights into the specific patterns, variations, and potential contributing factors.
The study demonstrated the significant impact of visual feedback on participants’ localization performance in the virtual environment. In the presence of visual cues, both the experimental and control groups achieved high accuracy rates, emphasizing the influential role of visual information in enhancing spatial perception (see
Figure 5). This aligns with the established understanding that visual cues are pivotal for shaping spatial awareness [
43]. However, a notable finding emerged when visual feedback was removed, highlighting the effectiveness of the extended funneling technique. In this condition, the experimental group exhibited a substantial improvement in localization performance, indicating that audio–vibrotactile feedback through funneling can compensate for the absence of visual cues (see
Figure 5). This underscores the technique’s significant contribution to enhanced spatial awareness, consistent with results from previous studies [
13,
19,
22,
23,
29,
31,
44,
45]. In summary, these findings strongly support
H1, emphasizing the effectiveness of the extended funneling technique in improving participants’ ability to localize audio–vibrotactile stimuli, particularly in the absence of visual feedback. This underscores the intricate interplay between auditory and vibrotactile cues in shaping spatial awareness [
43].
The analysis of localization success for each of the seven target locations provided valuable insights (see
Section 4.1). In the presence of visual feedback, the experimental group exhibited variability in localization performance, particularly between the ‘outer right’ and ‘mid right’ locations (see
Figure 1). Specifically, they demonstrated a greater ability to localize the ‘mid right’ position in contrast to the immediately adjacent ‘outer right’ point (see
Table 2). This discrepancy in performance can be attributed to the constraints of peripheral vision in the VR setting [
27], making it more challenging for participants to precisely identify the outer points, even when assisted by a visual representation of the virtual ball. It is important to highlight that participants were required to make slight head movements to facilitate eye-tracking specifically for the outer points during the localization task. This additional motor movement aspect could have contributed to reduced accuracy, underscoring potential issues with eye-tracking as a factor influencing the obtained results.
Further analysis revealed a trend in participants’ performance, suggesting that there may be a slight advantage in localizing stimuli placed in mid right locations on the virtual board for participants in the experimental group during visual conditions (see
Figure 5). This suggests that the funneling technique’s effectiveness may vary depending on the spatial context [
8]. In contrast, the control group exhibited consistent performance across all locations, indicating a predominant reliance on visual information (see
Figure 5). However, when visual feedback was removed, both the experimental and control groups experienced a decrease in localization accuracy (see
Table 2). Despite this decrease, the experimental group still outperformed the control group, emphasizing the advantageous impact of the funneling technique. This outcome underscores the potential of tactile feedback to mitigate the challenges posed by the absence of visual cues, which is especially relevant in VR scenarios where visual occlusion or limitations exist. Lastly, in the absence of visual feedback, no significant variability across target locations was observed within either of the participant groups (see
Figure 5).
The success of the extended funneling technique prompts a discussion on the role of vibrotactile feedback in spatial perception. The participants demonstrated their ability to accurately localize vibrotactile sensations delivered to points such as ‘outer left’ and ‘outer right,’ which were positioned beyond the physical boundaries of the VR controllers. This success highlights the capacity of the seven-point funneling technique to extend the perception of touch beyond participants’ hands within the VR environment. Further research can focus on optimizing the design of tactile feedback systems and their seamless integration into VR environments to maximize their benefits. By incorporating tactile feedback mechanisms such as the extended funneling technique, there is a substantial potential to enhance users’ ability to navigate and interact effectively within virtual spaces, particularly in situations where visual feedback is limited or unavailable. Moreover, the technique can be used to expand the sense of touch to remote locations, where there is no direct feedback from VR controllers [
23].
The second hypothesis (
H2) proposed that participants receiving vibrotactile feedback with the funneling technique, as opposed to those without funneling, would perceive a lower workload across all subscales in the absence of visual feedback. However, despite descriptive scores indicating a reduced overall workload in the experimental group compared to the control group, there was insufficient evidence to fully support (
H2) (see
Section 4.2). Both groups reported a moderate workload, suggesting that audio–vibrotactile feedback effectively assists users in object localization within VR environments, even when visual cues are absent (see
Figure 4). This finding is consistent with prior research, which has shown that, in tasks with high perceptual load in VR settings, bimodal and trimodal stimulation methods are equally effective in significantly improving performance compared to relying solely on visual input [
26]. In line with these previous findings, we propose that, in the absence of visual information, the participants in the present study had to rely on auditory cues, such as object sounds, and vibrotactile feedback, such as the sensation of ball-bouncing events. These cues effectively served as substitutes for visual input, necessitating adjustments in participants’ cognitive processes to make accurate judgments and decisions.
Drawing from this study’s findings (see
Section 4.2), we can further suggest that workload might be further reduced in multisensory environments. This expectation is based on the observation that the workload was assessed under conditions lacking visual feedback. Essentially, the study evaluated the effectiveness of audio–vibrotactile feedback in isolation, without the additional advantage of visual cues. Consequently, it is reasonable to infer that, when audio–vibrotactile feedback is combined with visual feedback or other sensory inputs, it holds the potential to further enhance localization tasks, potentially reducing the cognitive effort required by users. While we did not observe a significant reduction in workload, the study underscores the potential for audio–vibrotactile feedback to contribute to a more efficient and less cognitively demanding experience for users engaged in VR object localization tasks, especially when integrated into a multimodal sensory context. Further research in this direction may reveal additional opportunities to optimize workload perception and task performance in VR scenarios.
Concerning the workload distribution, both groups reported similar overall workload scores, with the ‘mental demand’ domain consistently ranking as the highest workload domain (see
Table 4). However, within specific domains, differences are notable. In the control group, the participants reported, on average, workload ratings in the ‘frustration’ domain that were twice as high as those in the experimental group. This discrepancy highlights significantly heightened frustration levels experienced by participants in the control group. One potential explanation for this divergence is their inability to differentiate between target locations when presented with vibrotactile feedback without the funneling technique. Moreover, without additional visual cues or information, they faced challenges in accurately perceiving the intended locations. Furthermore, the generic vibrotactile feedback provided to the participants in the control group may have contributed to their frustration. In summary, while both groups experienced a similar overall workload, these findings offer valuable insights into how workload is distributed across specific domains. These insights challenge (
H2) and underscore the complexity of designing effective feedback systems for VR environments. Furthermore, they highlight the potential for improving user experiences by integrating audio–vibrotactile feedback with visual or multisensory inputs to reduce cognitive load and enhance task performance.
Regarding the perceived sense of avatar embodiment concerning the avatar hands, no significant difference was observed in the overall sense of embodiment between the participant groups (see
Section 4.3). Both groups reported a moderate level of embodiment (see
Figure 2). This suggests that the specific techniques employed for avatar embodiment, such as synchronizing real and virtual hand movements and providing a first-person view of the virtual hands, did not result in a significantly stronger sense of embodiment, as indicated in prior research [
22,
31]. However, it is essential to note that our study did not specifically focus on measuring localization performance differences between participants with and without embodied avatar hands. To better understand the varying effects of avatar embodiment on haptic experiences, further research is needed to explore the factors that contribute to these differences.
In conclusion, this study presents a substantial contribution by demonstrating the induction of the funneling effect using seven-point locations, building upon a previous investigation [
18]. Our work extends beyond by demonstrating that the funnelling effect can be induced to points that expand outward, surpassing the limitations of the VR hardware. While the immediate applications of these findings may not be groundbreaking, they reveal avenues for innovation in haptic technology within VR, offering the potential for heightened immersion and interactivity in virtual environments. A limited body of research has delved into haptic perception using the funneling technique in multisensory VR environments. Earlier studies primarily focused on bimodal environments that combined visual and haptic cues, neglecting the integration of spatial audio. In contrast, our study advances this line of research by incorporating spatial audio alongside spatial haptics, adding a new dimension to the exploration of the funneling effect in VR.
Lastly, the study underscores the effectiveness of audio–vibrotactile feedback in facilitating VR localization tasks, indicating the promise of combining multiple sensory modalities to optimize the user experience and potentially alleviate cognitive workload in VR settings. Through the analysis of participants’ performance under bimodal and multisensory conditions, we gain valuable insights into their ability to process and integrate visual, auditory, and haptic information, as well as their efficacy in retrieving spatial details. Understanding sensory integration and its impact on decision making enhances our comprehension of how individuals perceive and process information from various senses. This knowledge proves especially relevant when investigating cognitive processes and how individuals navigate and perceive their surroundings in complex sensory environments, ultimately contributing to advancements in VR technology and human–computer interaction.
6. Limitations
It is important to acknowledge several potential limitations of the study as they could impact the generalizability of the results. These limitations encompass the absence of a full-body avatar representation, the VR setup used, inter-interval stimulus duration, and the participant sample.
First, the study employed avatar hands without a full-body avatar representation. This choice aimed to prioritize participants’ focus on the localization task due to the limited peripheral view in the VR environment. However, this approach may have limited the depth of embodiment experienced in the virtual environment. Future research should explore the integration of full-body avatars to provide a more comprehensive understanding of the impact of avatar embodiment on haptic perception [
22]. Another important limitation is the absence of a virtual mirror in the virtual environment. Prior research has highlighted the significant enhancement in the sense of embodiment in VR with the presence of a virtual mirror [
22,
23,
31]. Incorporating this element could have enriched the study’s understanding of avatar embodiment.
The study used the VR headset for delivering spatial audio stimuli during the localization task. While this choice was convenient, more advanced audio systems or alternative hardware configurations could offer a more immersive and precise spatial audio experience. Exploring optimal audio hardware configurations for audio delivery should be considered in future research. Additionally, in the first condition, participants relied on a visual representation of the ball to estimate its spatial location, potentially introducing bias due to their training. To address this, the time between stimuli, known as the interstimulus interval duration, was reduced. Moreover, target locations were placed in proximity, making it challenging to differentiate between them, even with visual feedback.
Lastly, it is worth noting that the participant sample was predominantly composed of right-handed individuals, potentially introducing bias into the localization task outcomes. While handedness may have some influence on localization abilities, it is essential to recognize that it is just one of many factors in play. The ability to localize stimuli depends on a range of sensory and cognitive factors, encompassing visual, auditory, and tactile perception, as well as spatial processing skills. Furthermore, individuals, regardless of their handedness, can excel in localizing stimuli on a particular side due to their sensory acuity or cognitive strategies [
46,
47]. Therefore, the relationship between handedness and localization is inherently complex, with individual differences being of key importance in determining performance.


