Article

Gender Preference and Difference in Behavior Modeling in Fitness Applications: A Mixed-Method Approach

Multi-User Adaptive Distributed Mobile and Ubiquitous Computing (MADMUC) Lab, Department of Computer Science, University of Saskatchewan, Saskatoon, SK S7N 5C9, Canada
*
Author to whom correspondence should be addressed.
Multimodal Technol. Interact. 2020, 4(2), 21; https://doi.org/10.3390/mti4020021
Submission received: 17 February 2020 / Revised: 14 May 2020 / Accepted: 18 May 2020 / Published: 22 May 2020
(This article belongs to the Special Issue Personal Health, Fitness Technologies, and Games)

Abstract

:
In recent years, the employment of behavior models to motivate behavior change has become a global trend in fitness application design. However, there is hardly any large-scale study of these applications to understand users’ exercise-type preferences, their drivers and barriers, and the potential of employing them for gender-based tailoring. To bridge this gap, we conducted a mixed-method study among 669 participants to investigate users’ exercise-type preferences (their drivers and barriers) and how they and gender can impact users’ social-cognitive beliefs and projected performance of bodyweight exercises. Firstly, we presented to the study participants a behavior model performing push-up or squat bodyweight exercise in a fitness application and asked them to rate their perceived self-efficacy, self-regulation, outcome expectation, and projected (exercise) performance level as observers of the behavior model. Secondly, we presented the study participants with a preselected list of commonly employed exercise types in fitness applications and requested them to identify their most/least preferred, and the reasons behind their choices. Our results showed that there were differences between both genders in their exercise-type preferences, perceived self-efficacy and projected exercise performance level. Males prefer push-up, squat, crunch, plank, and chair dip the most, with effectiveness being the most important driver, followed by ease of performance and improvement of the physique, look, and appearance. On the other hand, females prefer squat, crunch, jumping jack, step up, and plank the most, with ease of performance being the most important driver, followed by improvement of the physique, look, appearance, and effectiveness. Moreover, males prefer running in place the least, while females prefer push-up the least, with perceived difficulty being the greatest barrier for both genders. Moreover, our analysis of variance supported the female’s least preference for a push-up. Females have a lower perceived self-efficacy and projected performance level for push-up than males. We discussed the implications of our findings and provided guidelines for tailoring fitness applications on the market to users’ preferences and gender.

1. Introduction

The advances recorded in mobile technology have fueled the rise of fitness apps in the health domain in recent years. In particular, the need to perform exercises correctly to prevent injuries—especially outside the gym environment, where there are no personal trainers or professional guidance—has led to the incorporation of behavior models in fitness apps. Such behavior models are implemented in the form of instructions and visual aids, such as virtual coaches. Behavior modeling is a persuasive technique, used to motivate behavior change through observational learning [1]. In behavior modeling, “an expert shows [a] person how to correctly perform a behavior, for example, in class or on video” (p. 382) [2]. Behavior modeling has almost entirely replaced the traditional use of leaflets to provide instructions and demonstrations on how to perform a given exercise behavior correctly. Moreover, the need to be physically active to maintain optimal health and attain longevity has resulted in an evolving interest in home-based bodyweight exercises, which require no equipment or gym-access fees [3]. According to the annual global survey on trending topics in the health and fitness domain, bodyweight exercise occupied the top two positions of the fitness chart for 2015, 2016 and 2017 [4]. A systematic review also found that behavior modeling (video animations and instructions) was the most common persuasive technique employed in fitness apps on the market [5].
However, there are limited studies on user feedback, gender differences, and exercise-type preferences, which will allow for better personalization or tailoring of fitness apps to increase their effectiveness. (In this paper, “exercise-type preference” means “target exercise-type preference”, i.e., participants’ preference among a list of twelve exercise types we presented to them in our study.) To bridge the gap in the existing literature, we conducted a mixed-method study among 669 participants from North America (Canada and United States). The study was aimed to investigate users’ exercise-type preferences (their drivers and barriers) and how they and gender can influence the study participants’ social-cognitive beliefs and projected exercise performance levels when observing a behavior model demonstrating how to correctly perform a given bodyweight exercise.
Firstly, we presented to each of the study participants a behavior model performing push-up or squat bodyweight exercise in a fitness application prototype (as a case study) and asked them to rate their perceived self-efficacy, perceived self-regulation, outcome expectations, and projected performance level as observers of the behavior model. The first three constructs are among the traditional social-cognitive beliefs (factors) in the social cognitive theory (SCT) proposed by Bandura [6]. These three social-cognitive beliefs have been widely studied by previous researchers and found to be significant determinants of behavior change [7,8,9,10]. Moreover, the SCT is one of the most widely applied behavior theories for health promotion [10,11]. Secondly, we presented the participants with a finite list of twelve commonly employed exercise types in fitness apps and requested them to identify their most and least preferred exercise types and provide the reasons behind their choices. The twelve bodyweight exercises include push-up, squat, crunch, plank, side plank, chair dip, jumping jack, etc. [12]. We hoped to leverage the user feedback on exercise-type preferences (their drivers and barriers), the gender differences, and the effect on users’ social-cognitive beliefs when observing push-up and squat behavior models to tailor fitness apps to both genders to make them more effective. We discussed the implications of our findings and provided guidelines for tailoring fitness apps to both genders.

2. Background and Related Work

This section provides an overview of social cognitive determinants of behavior change and related work on behavior modeling in the persuasive technology domain.

2.1. Social Cognitive Determinants of Behavior

Social cognitive theory is a behavior theory that holds that personal factors, environmental factors, and the behavior itself reciprocally influence one another [1]. In the context of SCT, we classified our behavior model in a fitness app as a technology-based application (an environmental factor) that has the potential to influence cognitive factors, such as self-efficacy, self-regulation, and outcome expectation (personal factors) [6,13,14]. According to Bandura [1], technology-based social systems have the potential to impact human behaviors. Persuasive technologies, in particular, are regarded as social actors through which individuals can learn indirectly by observing the behaviors of others and their consequences [15,16]. In the following subsections, we discuss the three main SCT determinants of health behavior: perceived self-efficacy, self-regulation, and outcome expectation.

2.1.1. Self-Efficacy

Self-efficacy refers to the belief in one’s ability to engage in a given behavior and achieve a certain level of performance. In other words, it is a feeling of a sense of control over the events and actions that affect one’s life [17,18]. According to the SCT, self-efficacy is the strongest (proximal) determinant of behavior [6]. Research [7,19,20] has shown that perceived self-efficacy has a significant direct and/or indirect effect on the performance of physical activity of different target populations.

2.1.2. Self-Regulation

Self-regulation refers to the belief that the exercise of influence over one’s thoughts and feelings will yield the desired effect. Bandura [21] posited that human behaviors are highly regulated by self-influence. He identifies three major subfunctions through which self-regulatory mechanisms can occur. They include: (1) monitoring of one’s behavior, its causes, and effects; (2) judgment of one’s behavior relative to personal standards and environmental conditions; (3) effective self-reaction. In the context of physical activity, self-regulation refers to the ability of individuals to set goals, organize, plan, monitor, and evaluate their behaviors [7]. Research [7,19] has shown that perceived self-regulation has a significant direct effect on the performance of physical activity of different target populations.

2.1.3. Outcome Expectation

Outcome expectation refers to the belief that engaging in a target behavior will lead to certain outcomes, which could be positive or negative. In the context of SCT, research has shown that the expectations a person has regarding the outcome of a given behavior (physical, social, or self-evaluative [22]) can affect the actual performance of the behavior [6]. For example, empirical studies such as [19,20] have shown that outcome expectation has a significant direct and/or indirect effect on the performance of physical activity of different target populations.

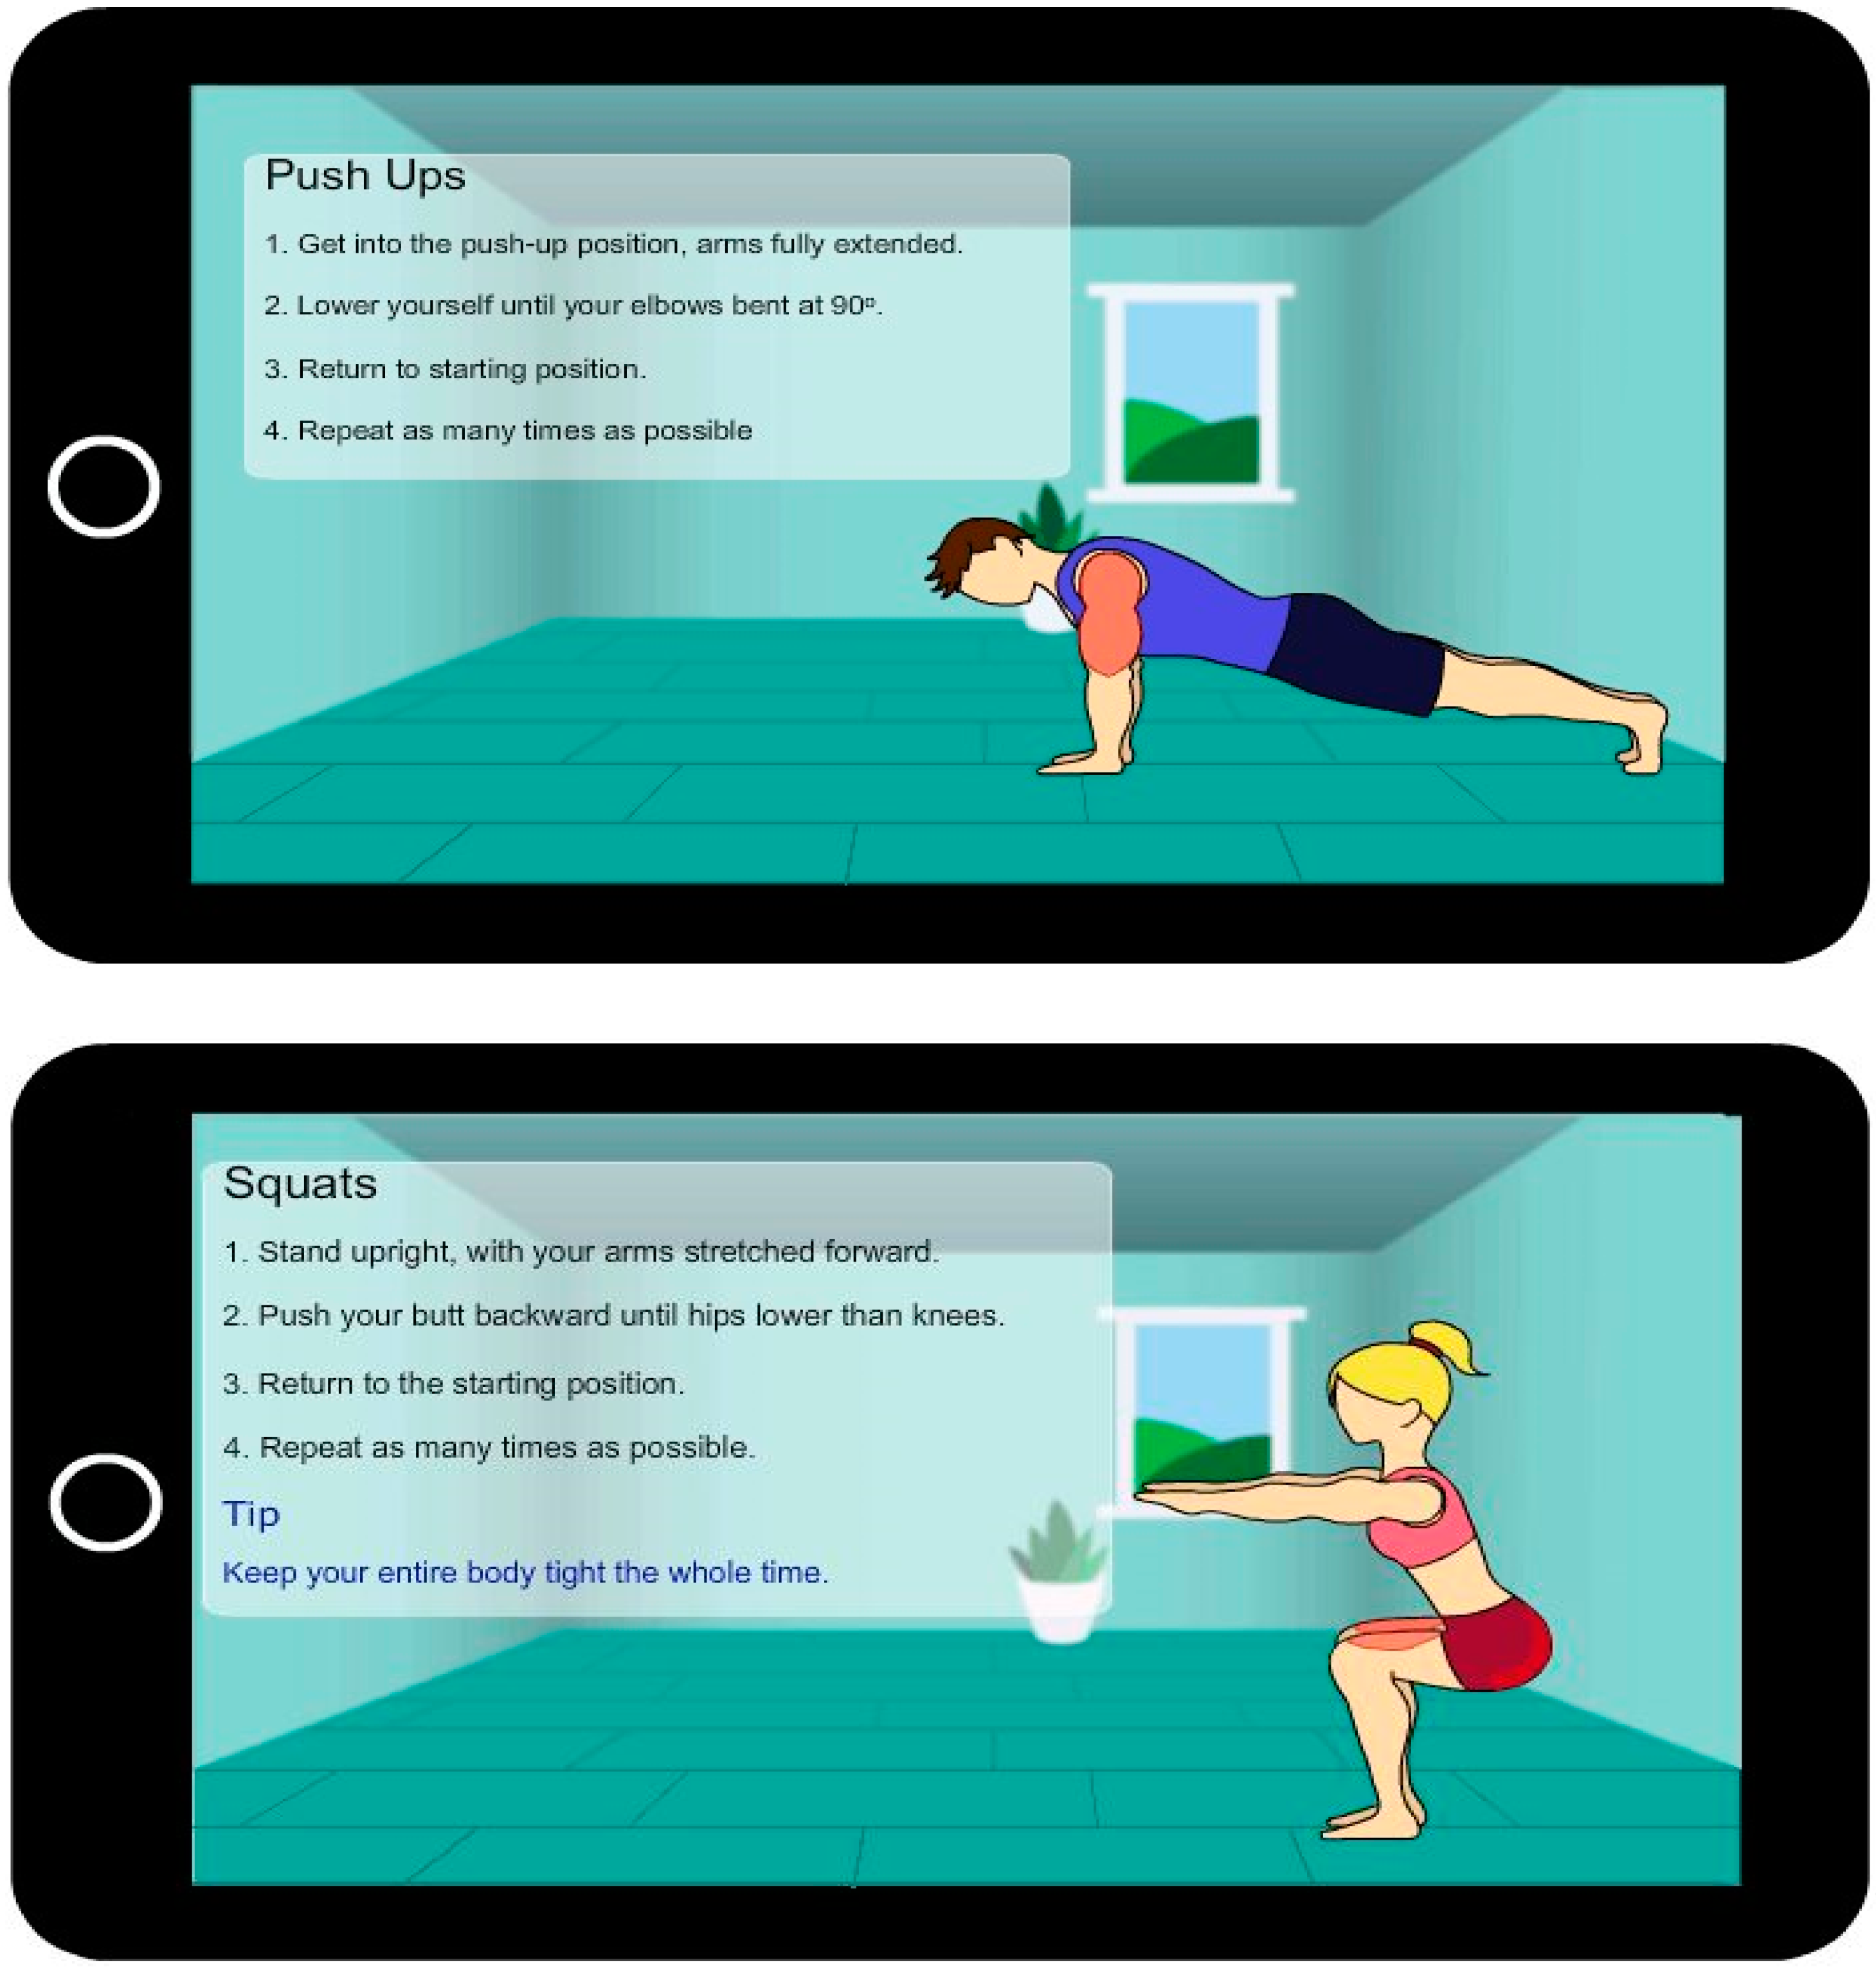
2.2. Behavior Modeling

Behavior modeling refers to the demonstration of a given behavior to an observer by an expert in order to facilitate its performance in a proper way. However, in persuasive technology research in the exercise domain, limited attention has been paid to evaluating users’ exercise-type preferences (their drivers and barriers) and gender differences using a mixed-method approach to gather useful feedback for the purpose of gender-based tailoring. Behavior models can also be regarded as virtual coaches or physical humanoid robots, which guide users in the performance of exercise behaviors.
Vollmer et al. [23] evaluated a humanoid robot designed to encourage humans to exercise longer. They found that certain features of the robot motivated users. However, the evaluation of the effectiveness of the robot was carried out with only six participants. Ellis et al. [24] evaluated the effectiveness of a virtual coach in promoting regular exercise. The authors found that the virtual coach was effective in promoting the physical activity of adults with Parkinson’s disease. Furthermore, Albaina et al. [25] investigated the persuasive effect of a virtual coach among elderly people. They found that, although the virtual coach has the potential to motivate people to exercise more, it did not increase the physical activity of the participants. Similarly, Watson et al. [26] investigated the effectiveness of an internet-based virtual coach in promoting actual physical activity adherence among overweight adults. They found in a randomized controlled trial that the virtual coach (a computer-animated exercise advisor) was effective in maintaining physical activity level but not increasing it. However, both groups of authors did not investigate the effect of gender on the participants’ physical activity level, nor did they investigate the exercise types their participants were most interested in.
Finally, Oyibo et al. [27] examined the relationship between perceived persuasiveness and three social-cognitive beliefs in the context of behavior modeling. They found that the perceived persuasiveness of behavior models had a significant effect on perceived self-regulation, outcome expectation, and perceived self-efficacy, with the effect on the first two social-cognitive constructs being stronger than on the third. Moreover, Oyibo et al. [20] investigated the relationship between social-cognitive beliefs and projected exercise performance levels in the context of behavior modeling. They found that perceived self-efficacy, perceived social support, and outcome expectation had a significant effect on projected exercise performance level and perceived self-regulation. However, the authors did not investigate users’ exercise-type preferences, their drivers, and barriers for the purpose of gender-based personalization. To fill these gaps, we conducted a large-scale study to investigate users’ exercise-type preferences (their drivers and barriers), gender differences, and their effect on three key social-cognitive determinants of behavior change in order to improve gender-based tailoring of fitness apps featuring exercise behavior models.

2.3. Gender-Based Tailoring

Prior research has shown that persuasive applications are more likely to be effective in motivating behavior change and attitude if they are tailored to user’s characteristics using a group-based approach defined by demographic variables, such as age, gender, and culture. Specifically, research has shown that using gender to segment a target population holds potential as an effective approach for group-based tailoring [28]. For example, in e-commerce research, “men and women have been shown to differ in their attitudes toward both the Internet and shopping (in conventional environments)” (p. 423) [29]. Moreover, in physical activity research, men and women have also been found to differ. For example, Azevedo [30] found that, in general, men were more active than women in leisure-time physical activity. Specifically, research shows that both men and women differ in their physical-activity related preferences. Van Uffelen et al. [3] found that men were more likely to prefer physical activities that were competitive than women. However, the authors found that women were more likely to be motivated by improving their appearance and exercising with others than men.
In the past, the definition of “gender” has been limited to include only the two traditional categories: males and females. However, in recent times, the social construct (gender) is now broadly defined to include those who identify as transgender, non-binary, or gender-fluid individuals [31]. Although globally, the progress to recognize non-binary genders within the law is slow, most Western countries, such as Canada, Denmark, Australia, Germany, United States, and Italy, are now beginning to embrace a broader definition, including providing a gender-neutral option on their passports [32]. However, most past and recent research in the physical activity literature (as we showed above) and persuasive technology literature (e.g., [33,34,35,36,37]) have been focused on the two traditional categories of genders: males and females [38]. One plausible reason for the limited focus is that “there is a lack of methodological attention to measurement in health research on transgender people” (p. 289) [39]. A second plausible reason for the limited focus (especially in survey-based research in the persuasive technology domain) is that most recruitment platforms, such as Amazon Mechanical Turk, are populated by users who identify as one of the two traditional genders. Particularly, our study focused on the two traditional gender categories because over 99% of the participants who took part in the online study on Amazon Mechanical Turk identified as traditional males and females.

2.4. Research Objective and Questions

In recent years, visual modeling of exercise behavior has become one of the most popular behavior change techniques employed in most fitness apps on the market [5]. However, there is limited understanding of users’ exercise-type preferences (their drivers and barriers) and the moderating effect of gender. Thus, in the context of bodyweight-exercise behavior modeling designed to encourage behavior change on the home front, our study sets out to answer the following research questions:
(1)
What preferences do users have with respect to bodyweight exercise types?
(2)
What are the main drivers and barriers of users’ target exercise-type preferences?
(3)
How does the gender of the observers of behavior models moderate users’ target exercise-type preferences, their drivers, and barriers?
(4)
How do the gender of the observers and their target exercise-type preference moderate their perceived self-efficacy, perceived self-regulation, outcome expectation, and projected level of performance of the target bodyweight exercise behaviors?

3. Method

This section covers our research design, measurement instruments, and participants’ demographics.

3.1. Research Design

To answer our research questions, we designed a fitness app prototype, called “Homex” (abbreviation for Home Exercise), which featured behavior models, demonstrating the correct performance of bodyweight exercises in a home setting (see Figure 1). The Homex app is aimed at motivating people to exercise with little to no equipment, cost, and time spent in going to the public gym. A prior study [3] has found that the three leading motivators of peoples’ physical activity, regardless of gender, include closeness to home, low cost, and exercise types that could be done alone. Hence, we set to uncover users’ exercise-type preferences, their drivers and barriers, and the moderating effect of gender using behavior models performing bodyweight exercises in a home setting as a case study. Thus, in designing the home-based exercise behavior models, we considered gender (male, female), race (white and non-white), and user’s target exercise-type preference (squat or push-up). This resulted in eight versions of the behavior models, one for each combination of gender, race, and exercise type. (However, the current focus of this paper is to investigate how the gender of the observer of the behavior models influences users’ exercise-type preferences, their drivers, and barriers.) Figure 1, for example, shows white male and white female behavior models performing push-up and squat, respectively. Specifically, push-up and squat were chosen since they are commonly included in home workout programs and exercise important muscle groups located in different parts of the body. While push-up mainly works out the upper body part, squat does work out the lower body part. Thus, in the design of our behavior models, we deliberately emphasized (highlighted) the muscle groups that are being impacted by each exercise type to increase their perceived effectiveness. Secondly, we chose both exercise types because we anticipated that they would elicit different reactions from males and females. For example, due to the gender-specific body ideals portrayed by the media [40] and prior findings on gender-specific preferences [41], we anticipated that push-up would resonate more with males because it works out more of the upper part of the body (e.g., chest, arms, etc.), while squat would resonate more with females because it works out more of the lower part of the body (e.g., hip, legs, etc.). Moreover, to contextualize our investigation, we provided the participants with a description of the Homex app (adapted from [42]) at the beginning of the survey. In the survey, only one of the eight behavior-model versions (e.g., white male performing push-up) was presented to each of the participants in a randomized fashion.
To answer our first three research questions, we presented the study participants a list of twelve commonly implemented exercise types (e.g., push-up, squat, crunch, plank, etc.) in fitness apps on the market (Figure 2) and asked them to identify their most preferred and least preferred types. We also asked them to provide us with the reasons behind their choices to tease out the drivers of and barriers against their most and least preferred exercise types, respectively. As opposed to ranking all of the exercise types, we asked the participants to identify their most and least preferred exercise types (based on Figure 2) to reduce the cognitive load the ranking of a long list of exercise types (12) might cause. We hoped that the participants’ feedback would inform designers of fitness apps about the most preferred set of exercise types (their drivers and barriers) each gender and both genders care about. The results could be used by designers in a gender-tailored app and in a one-size-fits-all app, respectively, to increase the effectiveness of the apps. Moreover, to answer our fourth research question, we presented one of the eight behavior models (GIF image) to each of the study participants in a randomized fashion. We then asked them, after watching the video of the behavior models, to rate questions on three social-cognitive beliefs and provide their reasons behind their ratings.

3.2. Participants

Our study was approved by the Behavioral Research Ethics Board of our university. After the approval, we recruited participants in North America via Amazon Mechanical Turk. The Amazon Mechanical Turk is a crowdsourcing platform employed in recruiting study participants from a diverse population of users from around the world. In appreciation of their time, each participant was compensated with US$ 0.60—a rate similar to that of similar tasks in Amazon Mechanical Turk. Table 1 shows the demographic of participants and the randomized distribution of the eight versions of the behavior models among them. Overall, 342 males and 327 females participated in the study.

3.3. Measurement Instruments

Table 2 shows the questions we asked the study participants and the instruments used to measure the social-cognitive constructs in the order they were presented. The social-cognitive questions for perceived self-efficacy, perceived self-regulation and outcome expectation were adapted from existing studies [7,18,22].

3.4. Thematic Analysis of Participants’ Comments on Most/Least Preferred Exercise Types

To answer our second and third research questions, we conducted a thematic analysis of the main drivers of the most preferred target exercise types and the barriers against the least preferred exercise types. The drivers were based on the thematic analysis of the study participants’ responses to the second part of the target exercise-type preference question (see Table 2), which read, “Please give the reason behind the choice of your most preferred workout.” Moreover, the barriers were based on the fourth part of the target exercise-type preference question (see Table 2), which read, “Please give the reason behind the choice of your least preferred workout.” A data-driven approach, wherein the categories emerged from the data itself, was employed in the thematic analysis rather than an existing coding scheme. The first author manually, in Excel, went through each of the participants’ comments on their most and least preferred exercise types at least five times to uncover the common recurring themes. These themes were laid out in columns in the Excel sheet containing all of the participants’ comments in rows. Then, the first author went through each of the comments and coded it as one or more of the teased-out (identified) themes by assigning the number “1” to the cell in which the participant’s comment and the theme in question intersected. The participants’ comments difficult to code as one of the teased-out common themes were coded as “other”. For example, the comment, “I don’t want my arms to bulk up and get gross and manly,” was coded “other” because, based on the coder’s assessment, it did not clearly fit into any of the thirteen teased-out barriers against the participants’ least preferred exercise types. Specifically, the coder could not, for certain, say that the participant (a female) who made this comment about push-up disliked push-up outright. Thus, he could not code it as the theme “dislike exercise”, which is the closest theme it could have fallen under among the thirteen barriers-based themes. Finally, the author divided the data into the male and female groups and calculated the percentage of the participants’ comments in each gender group that fell under each of the teased-out themes. Specifically, we used R’s “ggplot” package in creating bar charts of the teased-out drivers of users’ most preferred exercise types and barriers against users’ least preferred exercise types.

4. Result

This section covers the results of our analyses: (1) users’ exercise-type preferences, (2) bar-chart visualization of the gender-based drivers of the most preferred exercise types and barriers against the least preferred exercise types, including sample comments supporting the drivers and barriers, and (3) users’ social-cognitive profiles (which include the analysis of variance based on gender and target exercise-type preference).

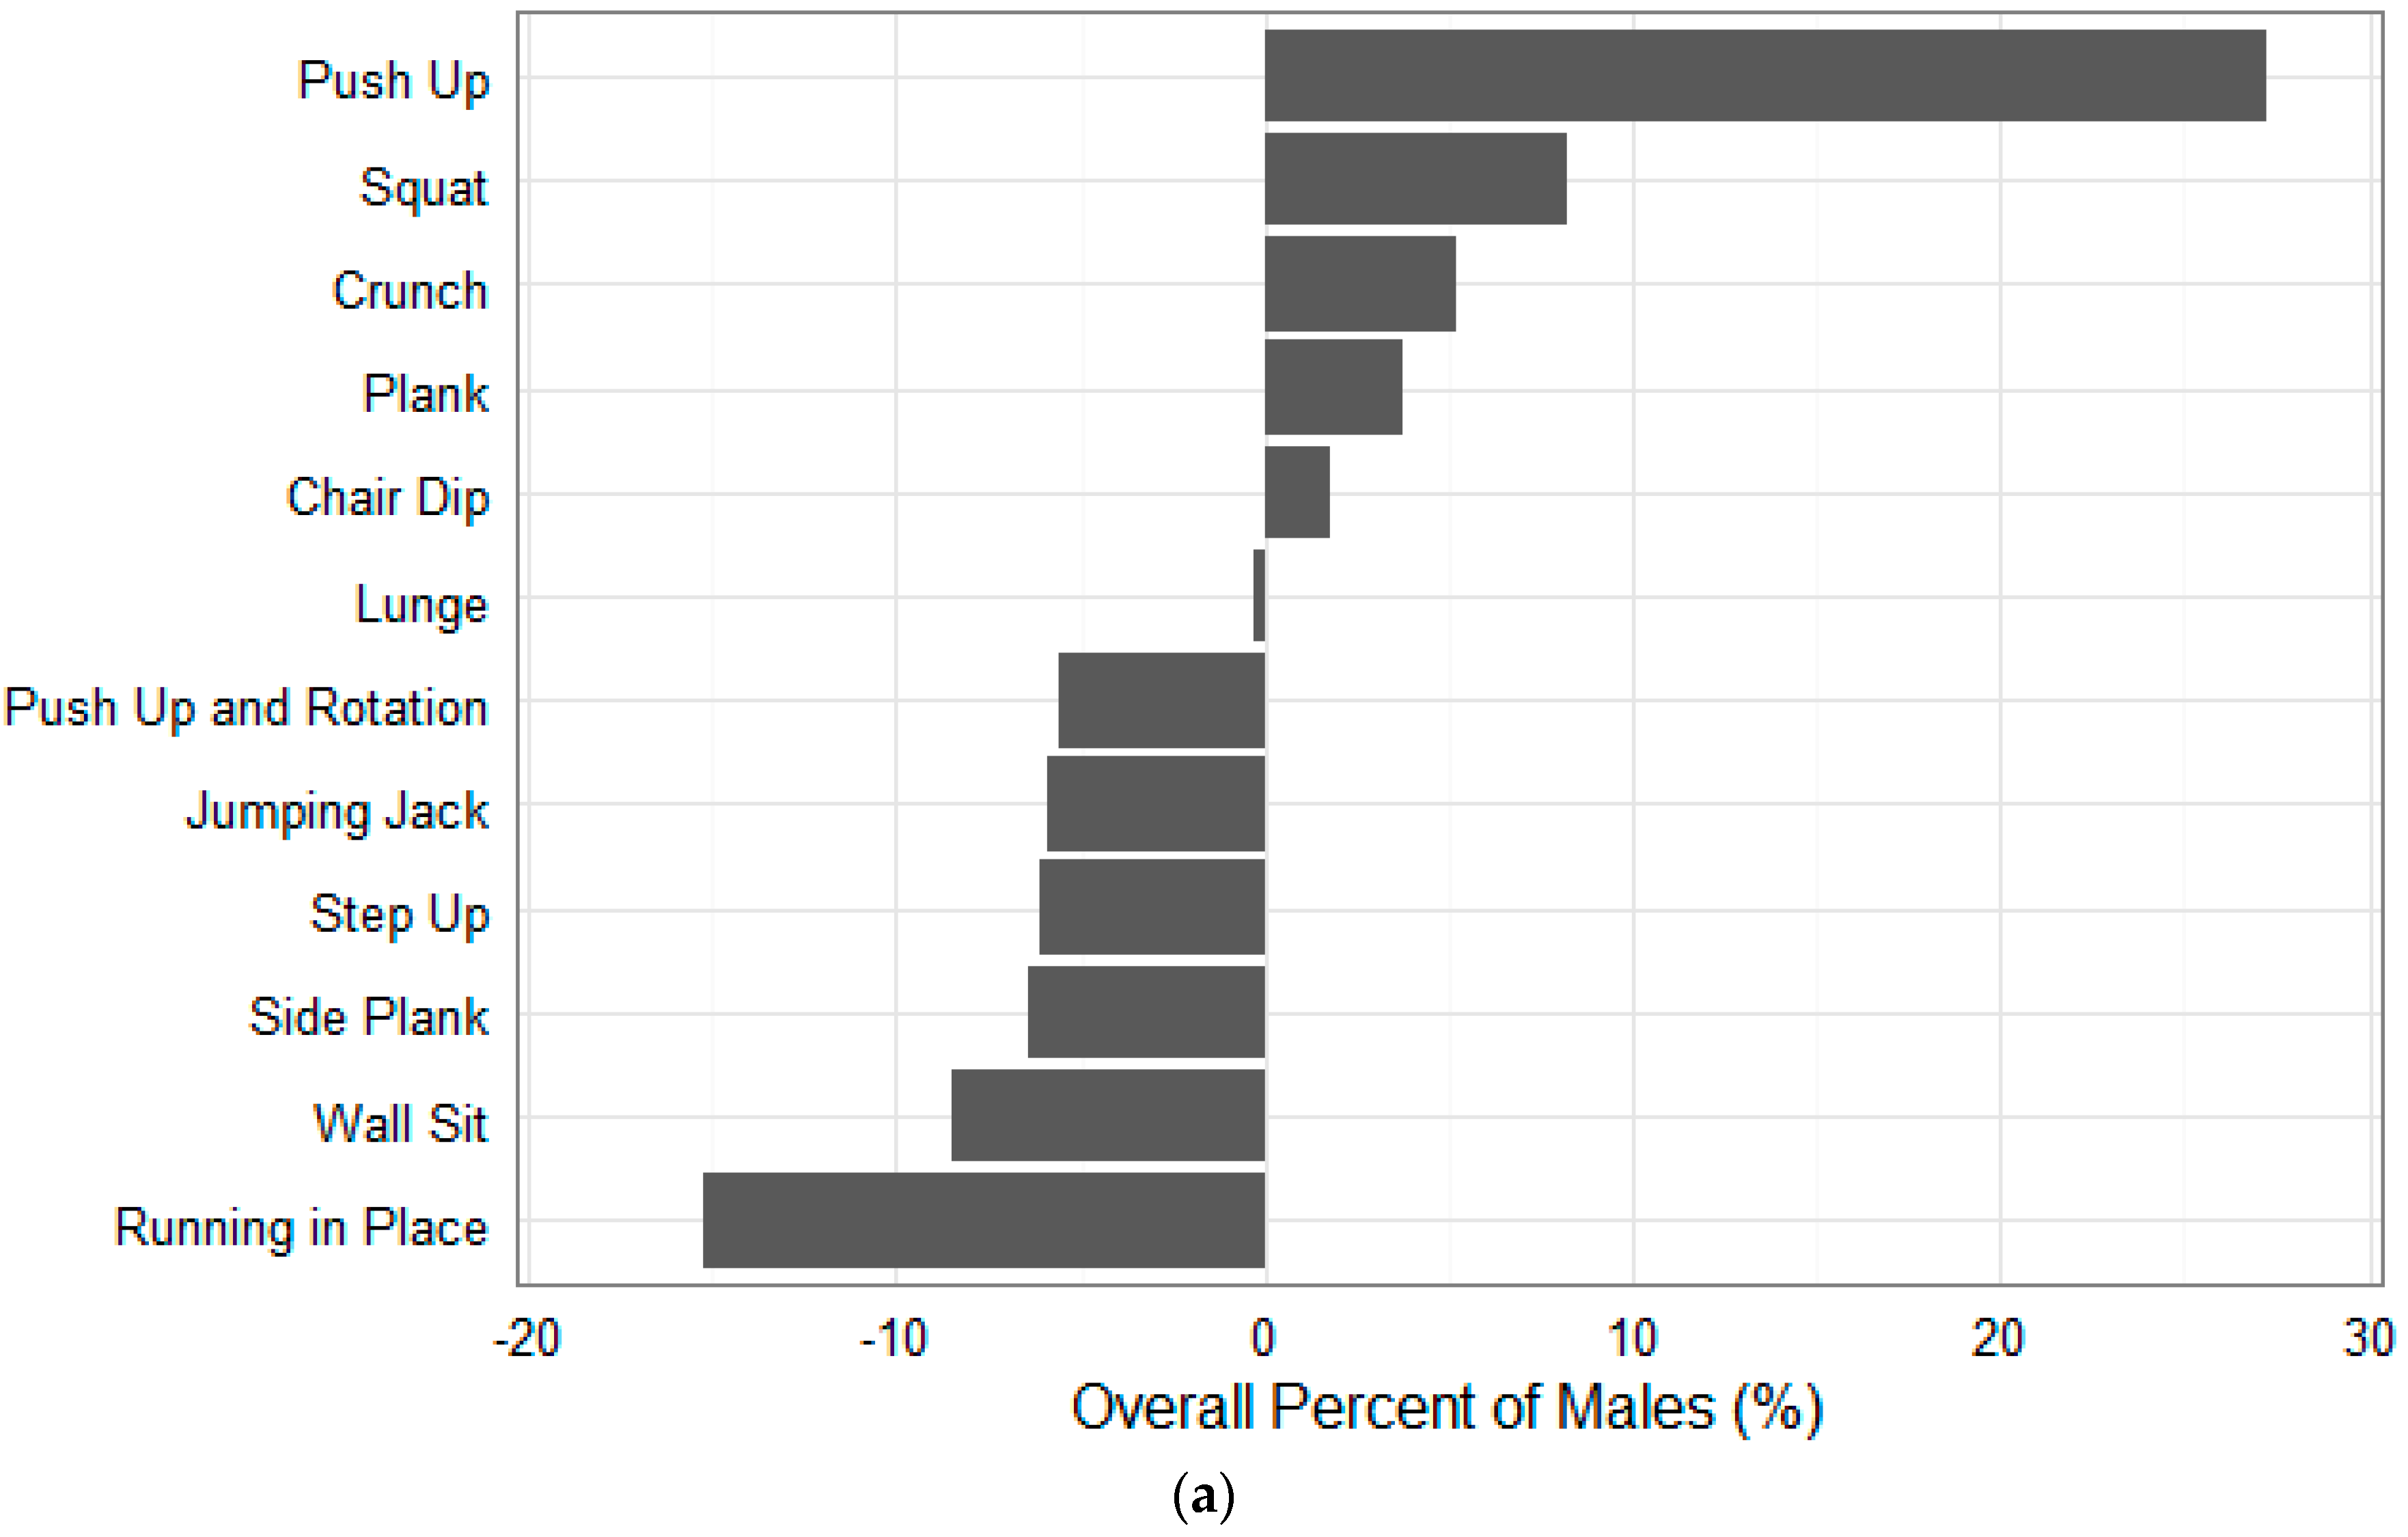
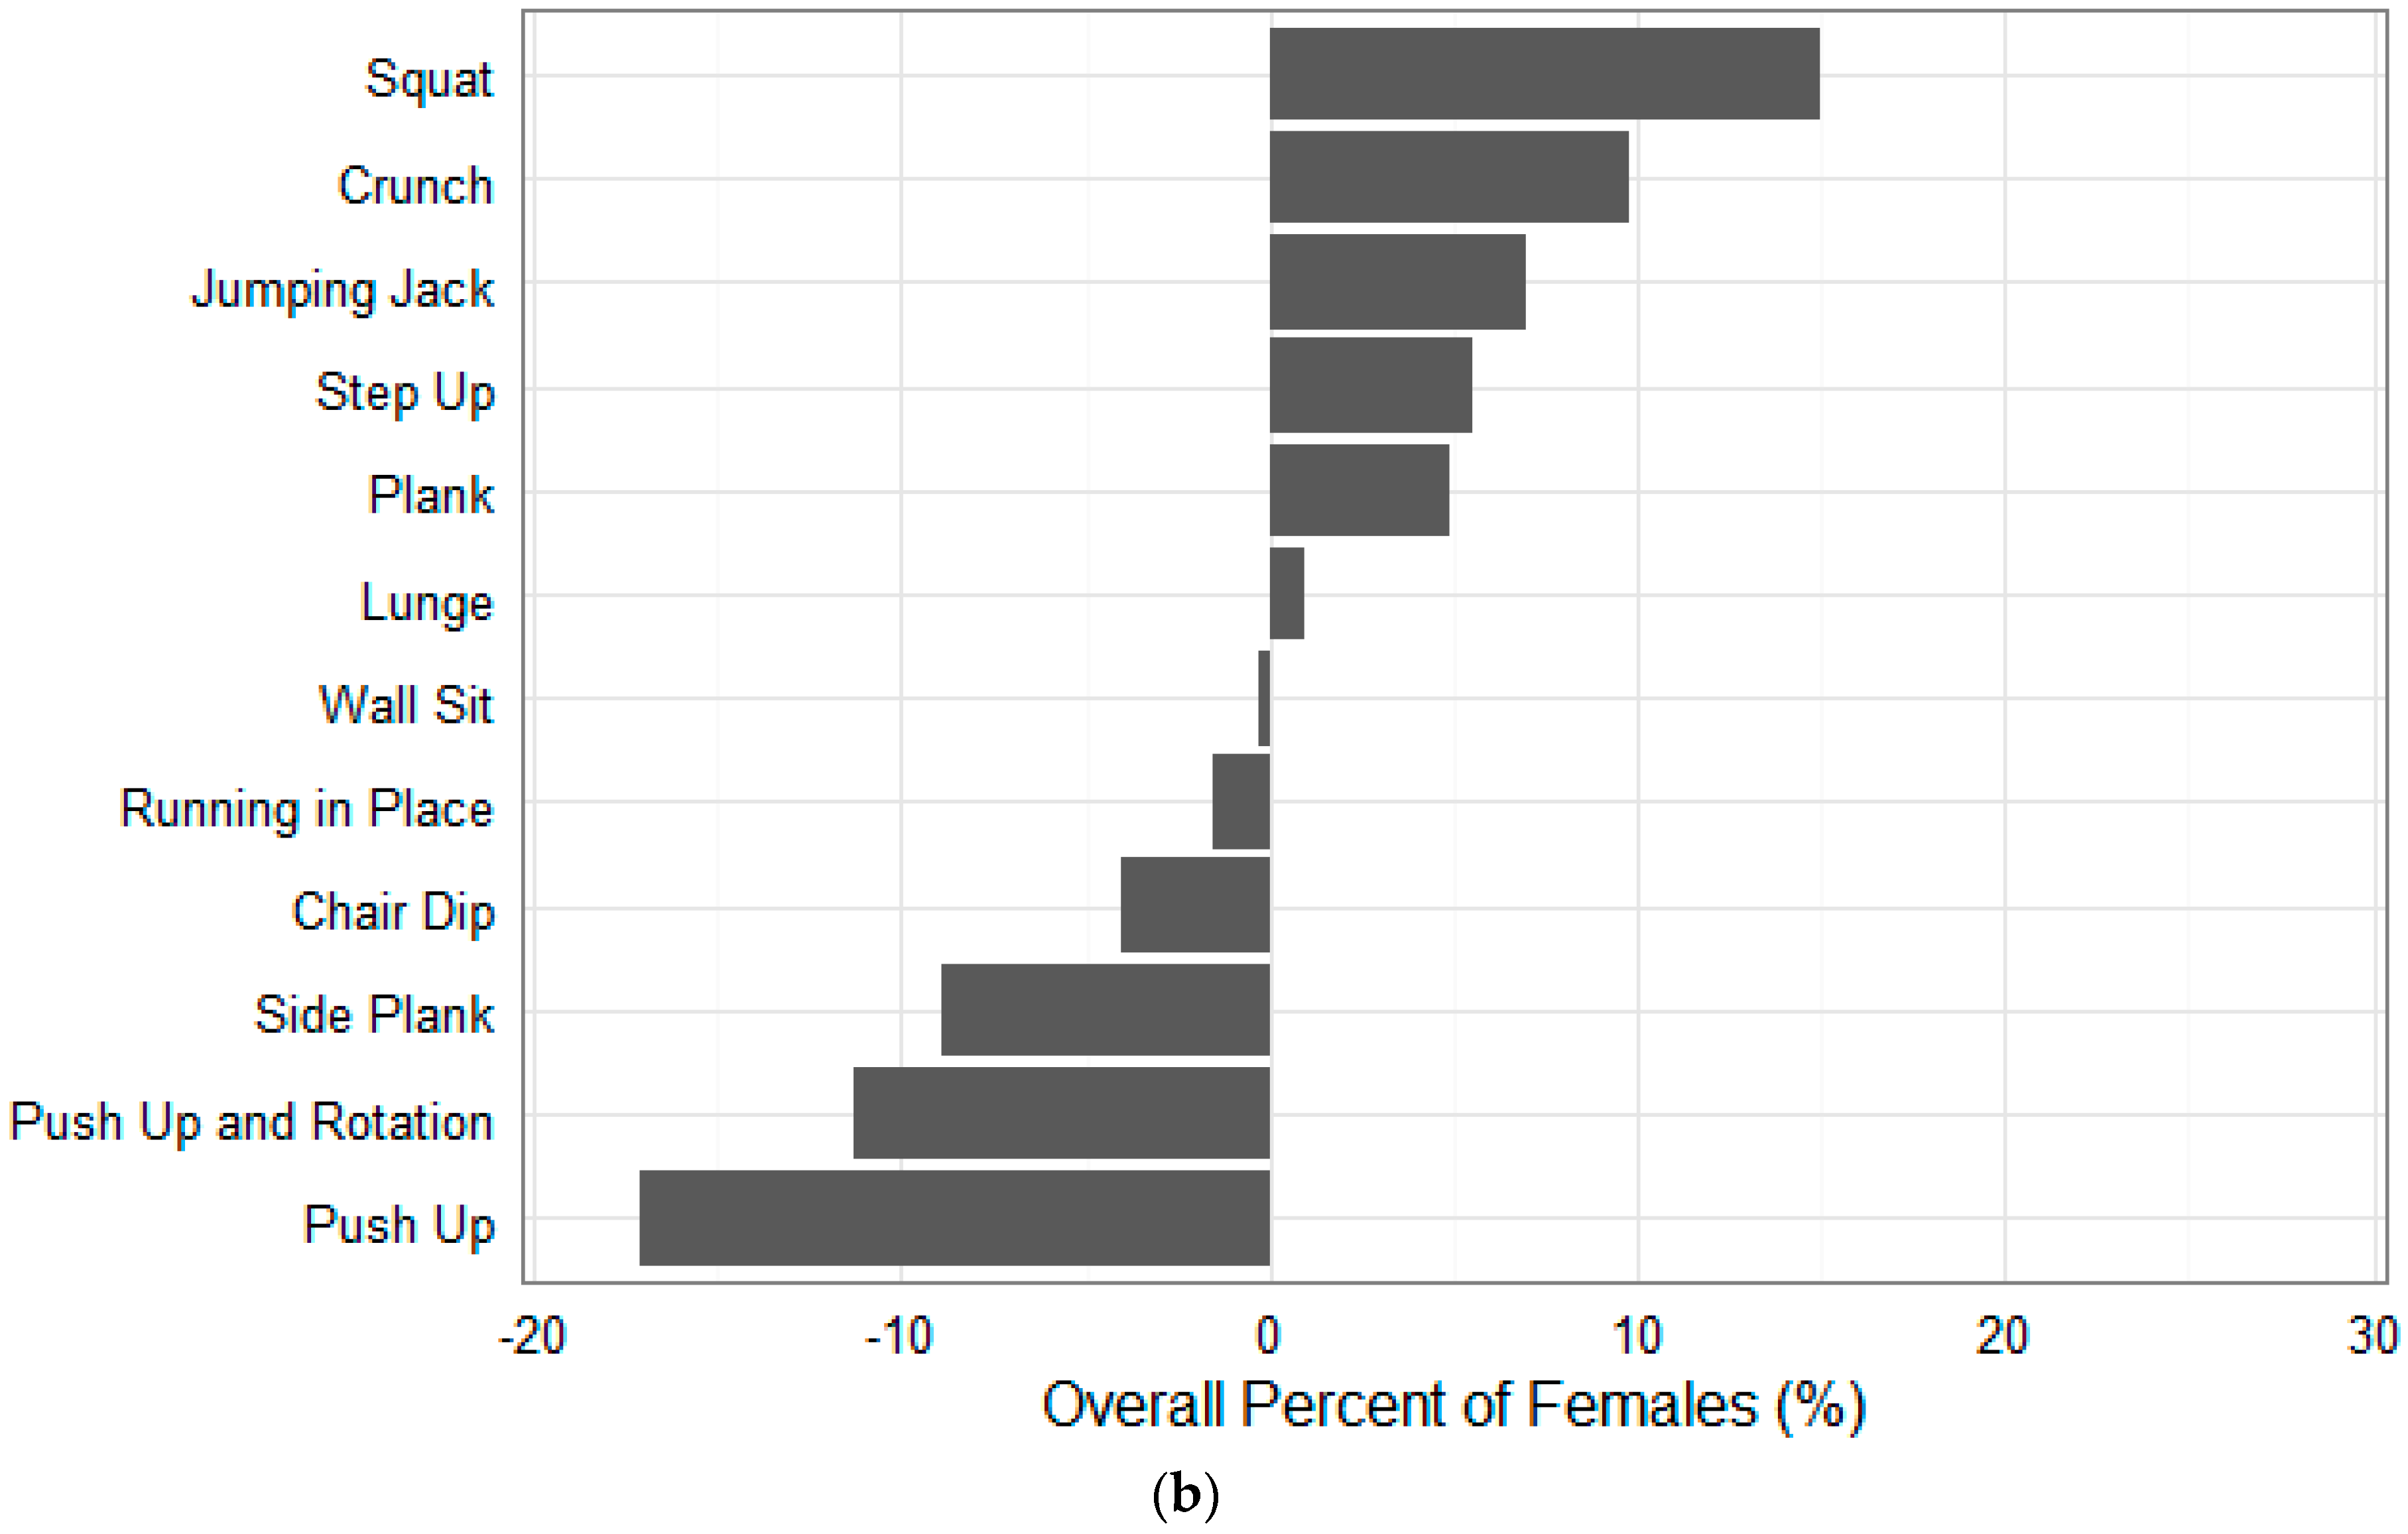
4.1. User Preferences for Bodyweight Exercise Based on Gender

To answer our first and third research questions on users’ target exercise-type preferences and the moderating effect of gender, we asked the participants in our study to tell us their most preferred and least preferred exercise types among a list of twelve bodyweight exercises commonly employed in fitness apps [12]. Table 3 shows the percent of participants in each gender group who preferred a given exercise type the most (most preferred) or the least (least preferred). Table 3 also shows the overall preference (the difference between the most preferred column and the least preferred column) for each gender. The positive overall preference percentage for a given exercise indicated that, overall, the percentage of participants that chose the exercise type in question as most preferred was higher than the percentage of participants that chose it as least preferred. Conversely, the negative “overall preference” percent for a given exercise-type indicated that, overall, the percentage of participants that chose the exercise type in question as least preferred was higher than the percentage of participants that chose it as most preferred. We used the result of the computation of participants’ overall preference to recommend a relative set of exercise-types for each gender.
Finally, to uncover the participants’ ranking profile of the twelve exercise-types based on their overall preference, we rearranged all of the twelve exercise types, starting from the most preferred overall to the least preferred overall for each gender (Figure 3). For males, five of the exercise types (push-up, squat, crunches, plank, and chair dip) got a positive overall preference, while the other seven got a negative overall preference (lunge, push-up and rotation, jumping jack, step up, side plank, wall sit, and running in place). For females, six of the exercise types (squat, crunches, jumping jack, step up, plank, and lunge) got a positive overall preference, while the other six (wall sit, running in place, chair dip, side plank, push-up and rotation, and push-up) got a negative overall preference. In sum, both genders expressed a positive overall preference for squat, crunches, and plank. On the other hand, both genders expressed a negative overall preference for push-up and rotation, running in place, and side plank.

4.2. Drivers and Barriers of the Most and Least Preferred Exercise Types

In this section, we have presented the thematic analysis results from the visualization of the drivers and barriers of the most and least preferred exercise types, respectively.

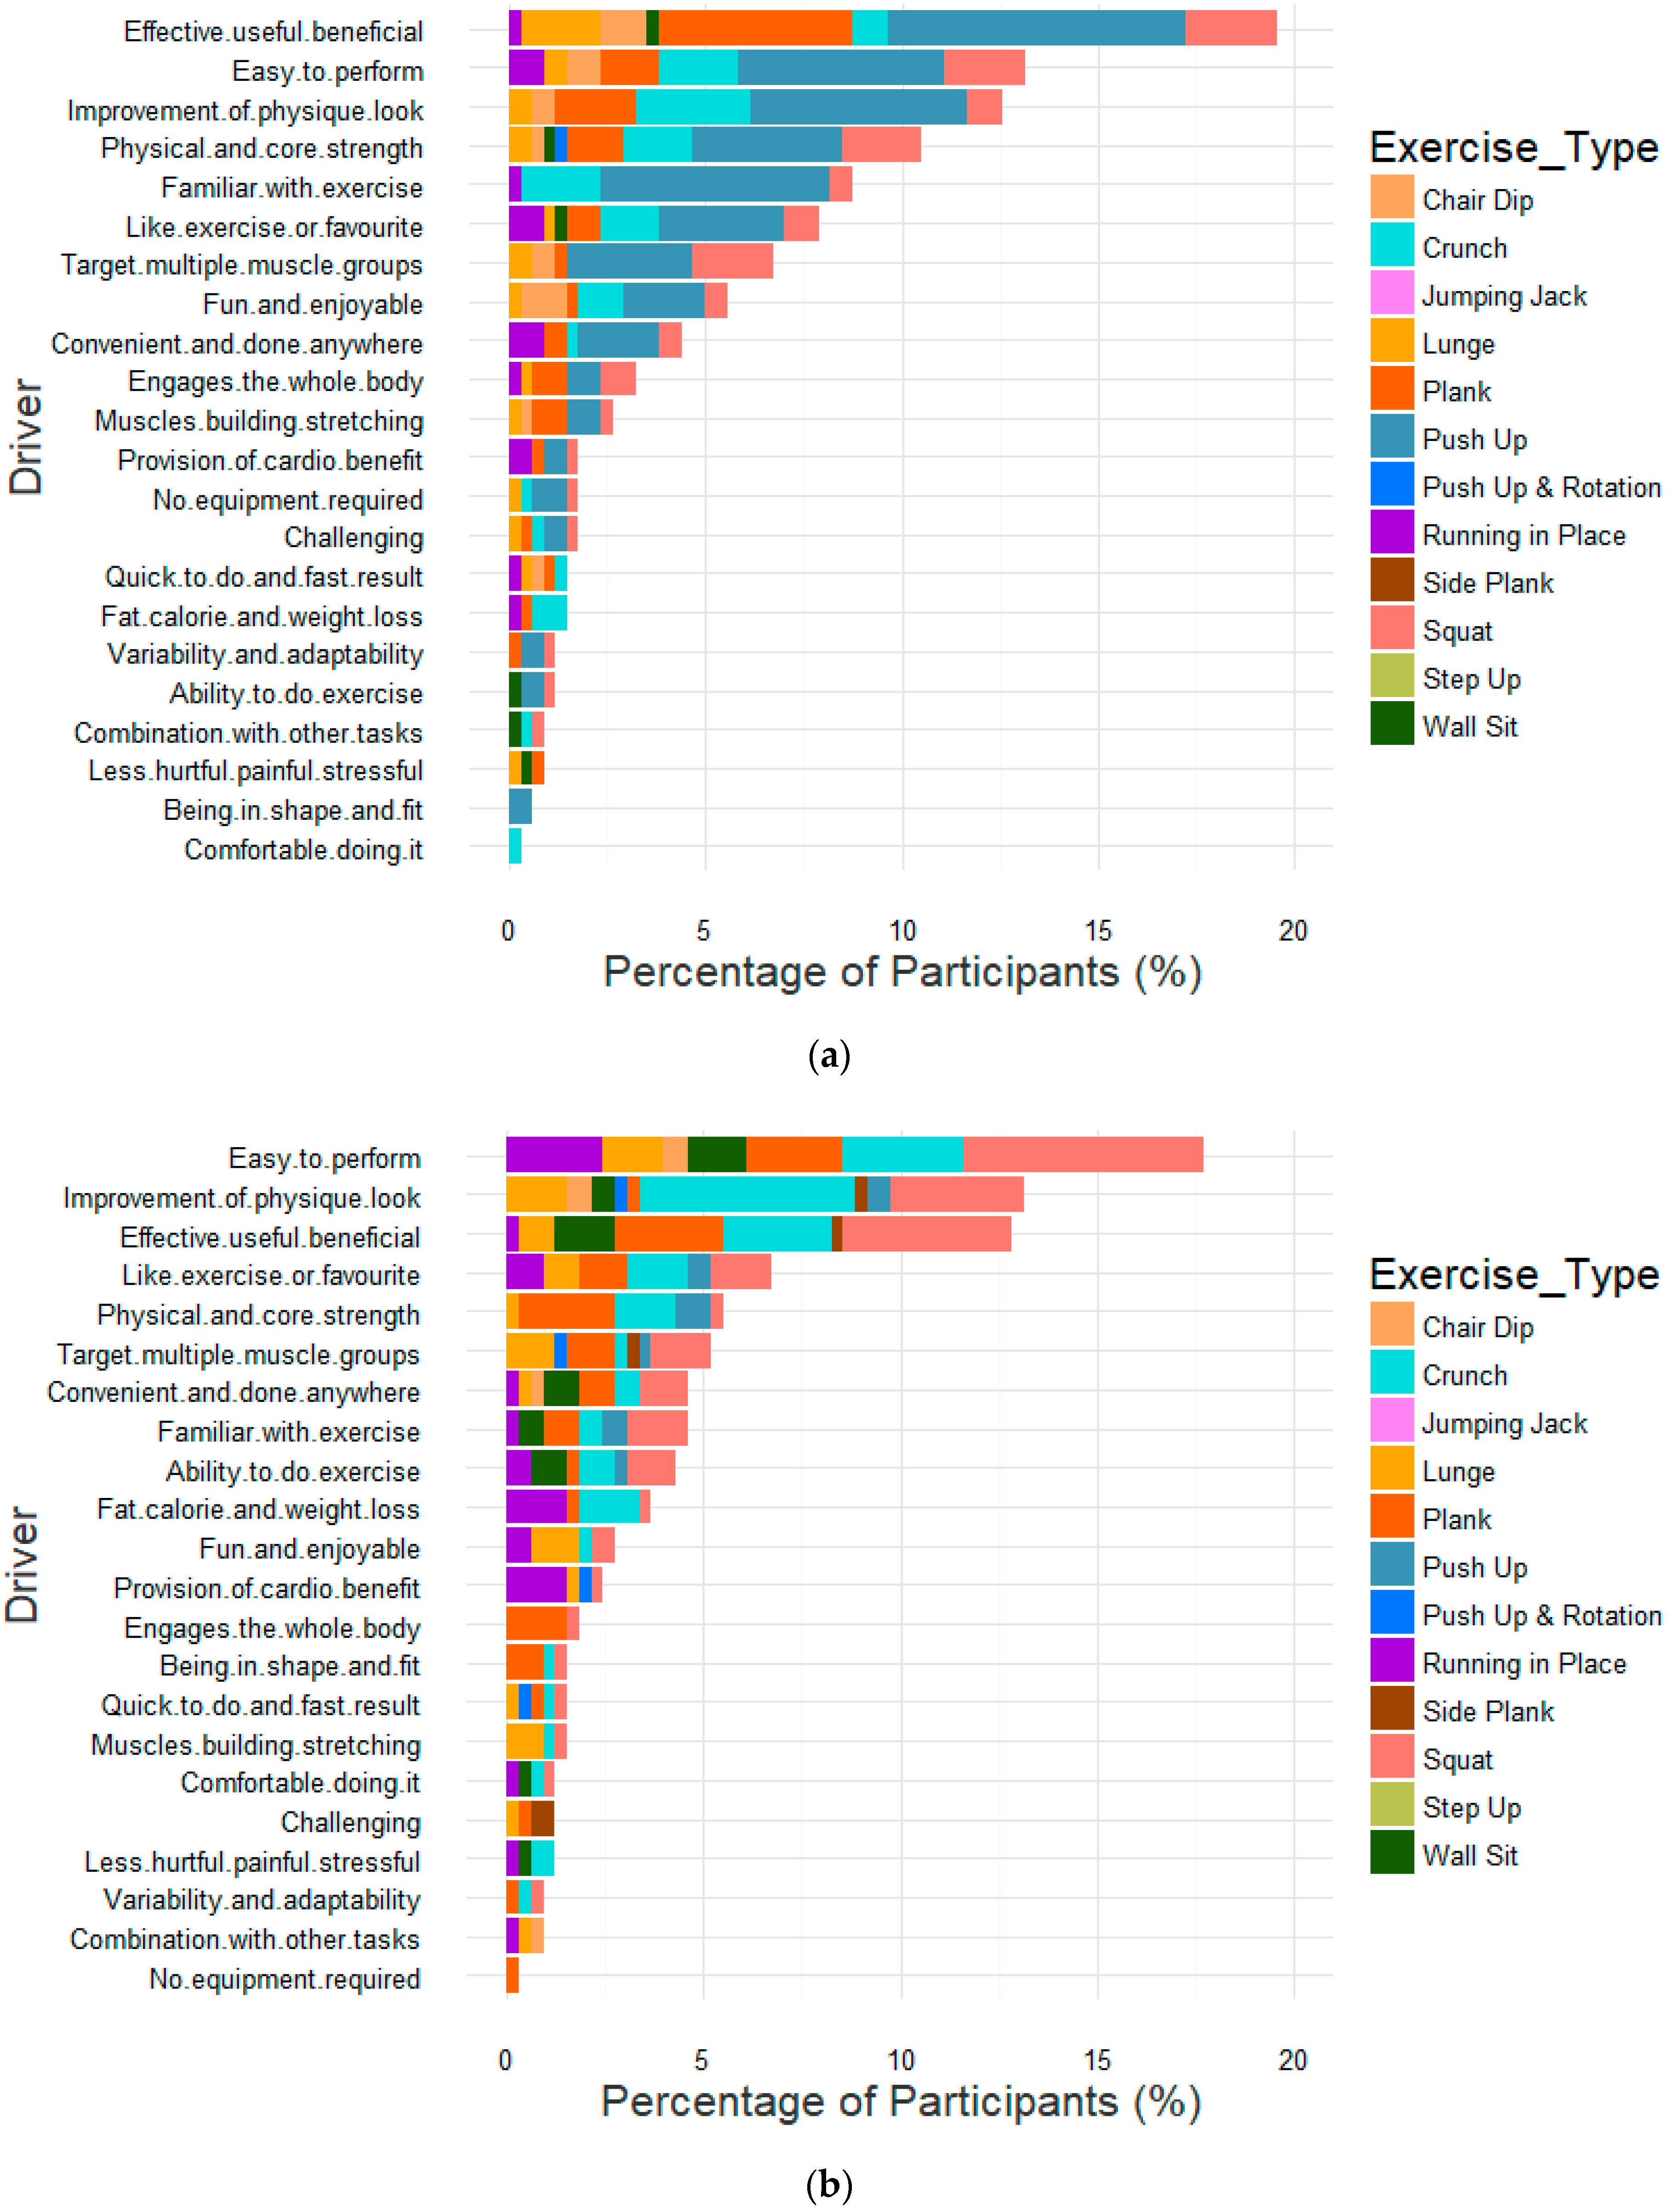
4.2.1. Visualization of the Drivers of the Most Preferred Exercise Types

Figure 4a,b shows the bar charts of the drivers of the most preferred exercise-types for males and females, respectively. All of the data points were involved in the presented themes, except 3.29% coded as “others” as a result of not falling under any of the teased-out themes. Overall, 22 themes (drivers) were teased out from the participants’ comments on their most preferred exercise types. The ten most important drivers of males’ choice of most preferred exercise types include: (1) exercise type is effective, useful, and beneficial; (2) exercise type is easy to perform; (3) physical development of body parts to improve physical appearance and looks; (4) development of physical (especially core) strength; (5) familiarity with exercise type; (6) Exercise type is users’ favorite or liked by them; (7) exercise type targets multiple muscle groups; (8) exercise type is fun and enjoyable; (9) exercise type is convenient to do, especially anywhere outside the gym; (10) exercise type engages or works out the whole body. On the other hand, the ten most important drivers of females’ choice of most preferred exercise types include: (1) exercise type is easy to perform; (2) physical development of body parts to improve physical appearance and looks; (3) exercise type is effective, useful, and beneficial; (4) exercise type is users’ favorite or liked by them; (5) development of physical (especially core) strength; (6) exercise type targets multiple muscle groups; (7) exercise type is convenient to do, especially anywhere outside the gym; (8) familiarity with exercise type; (9) ability to do exercise type; (10) exercise type facilitates fat and calorie burn and/or weight loss. Table A1 in the Appendix A shows samples and percentages of participants’ comments supporting each of the gender-specific drivers shown in Figure 4.

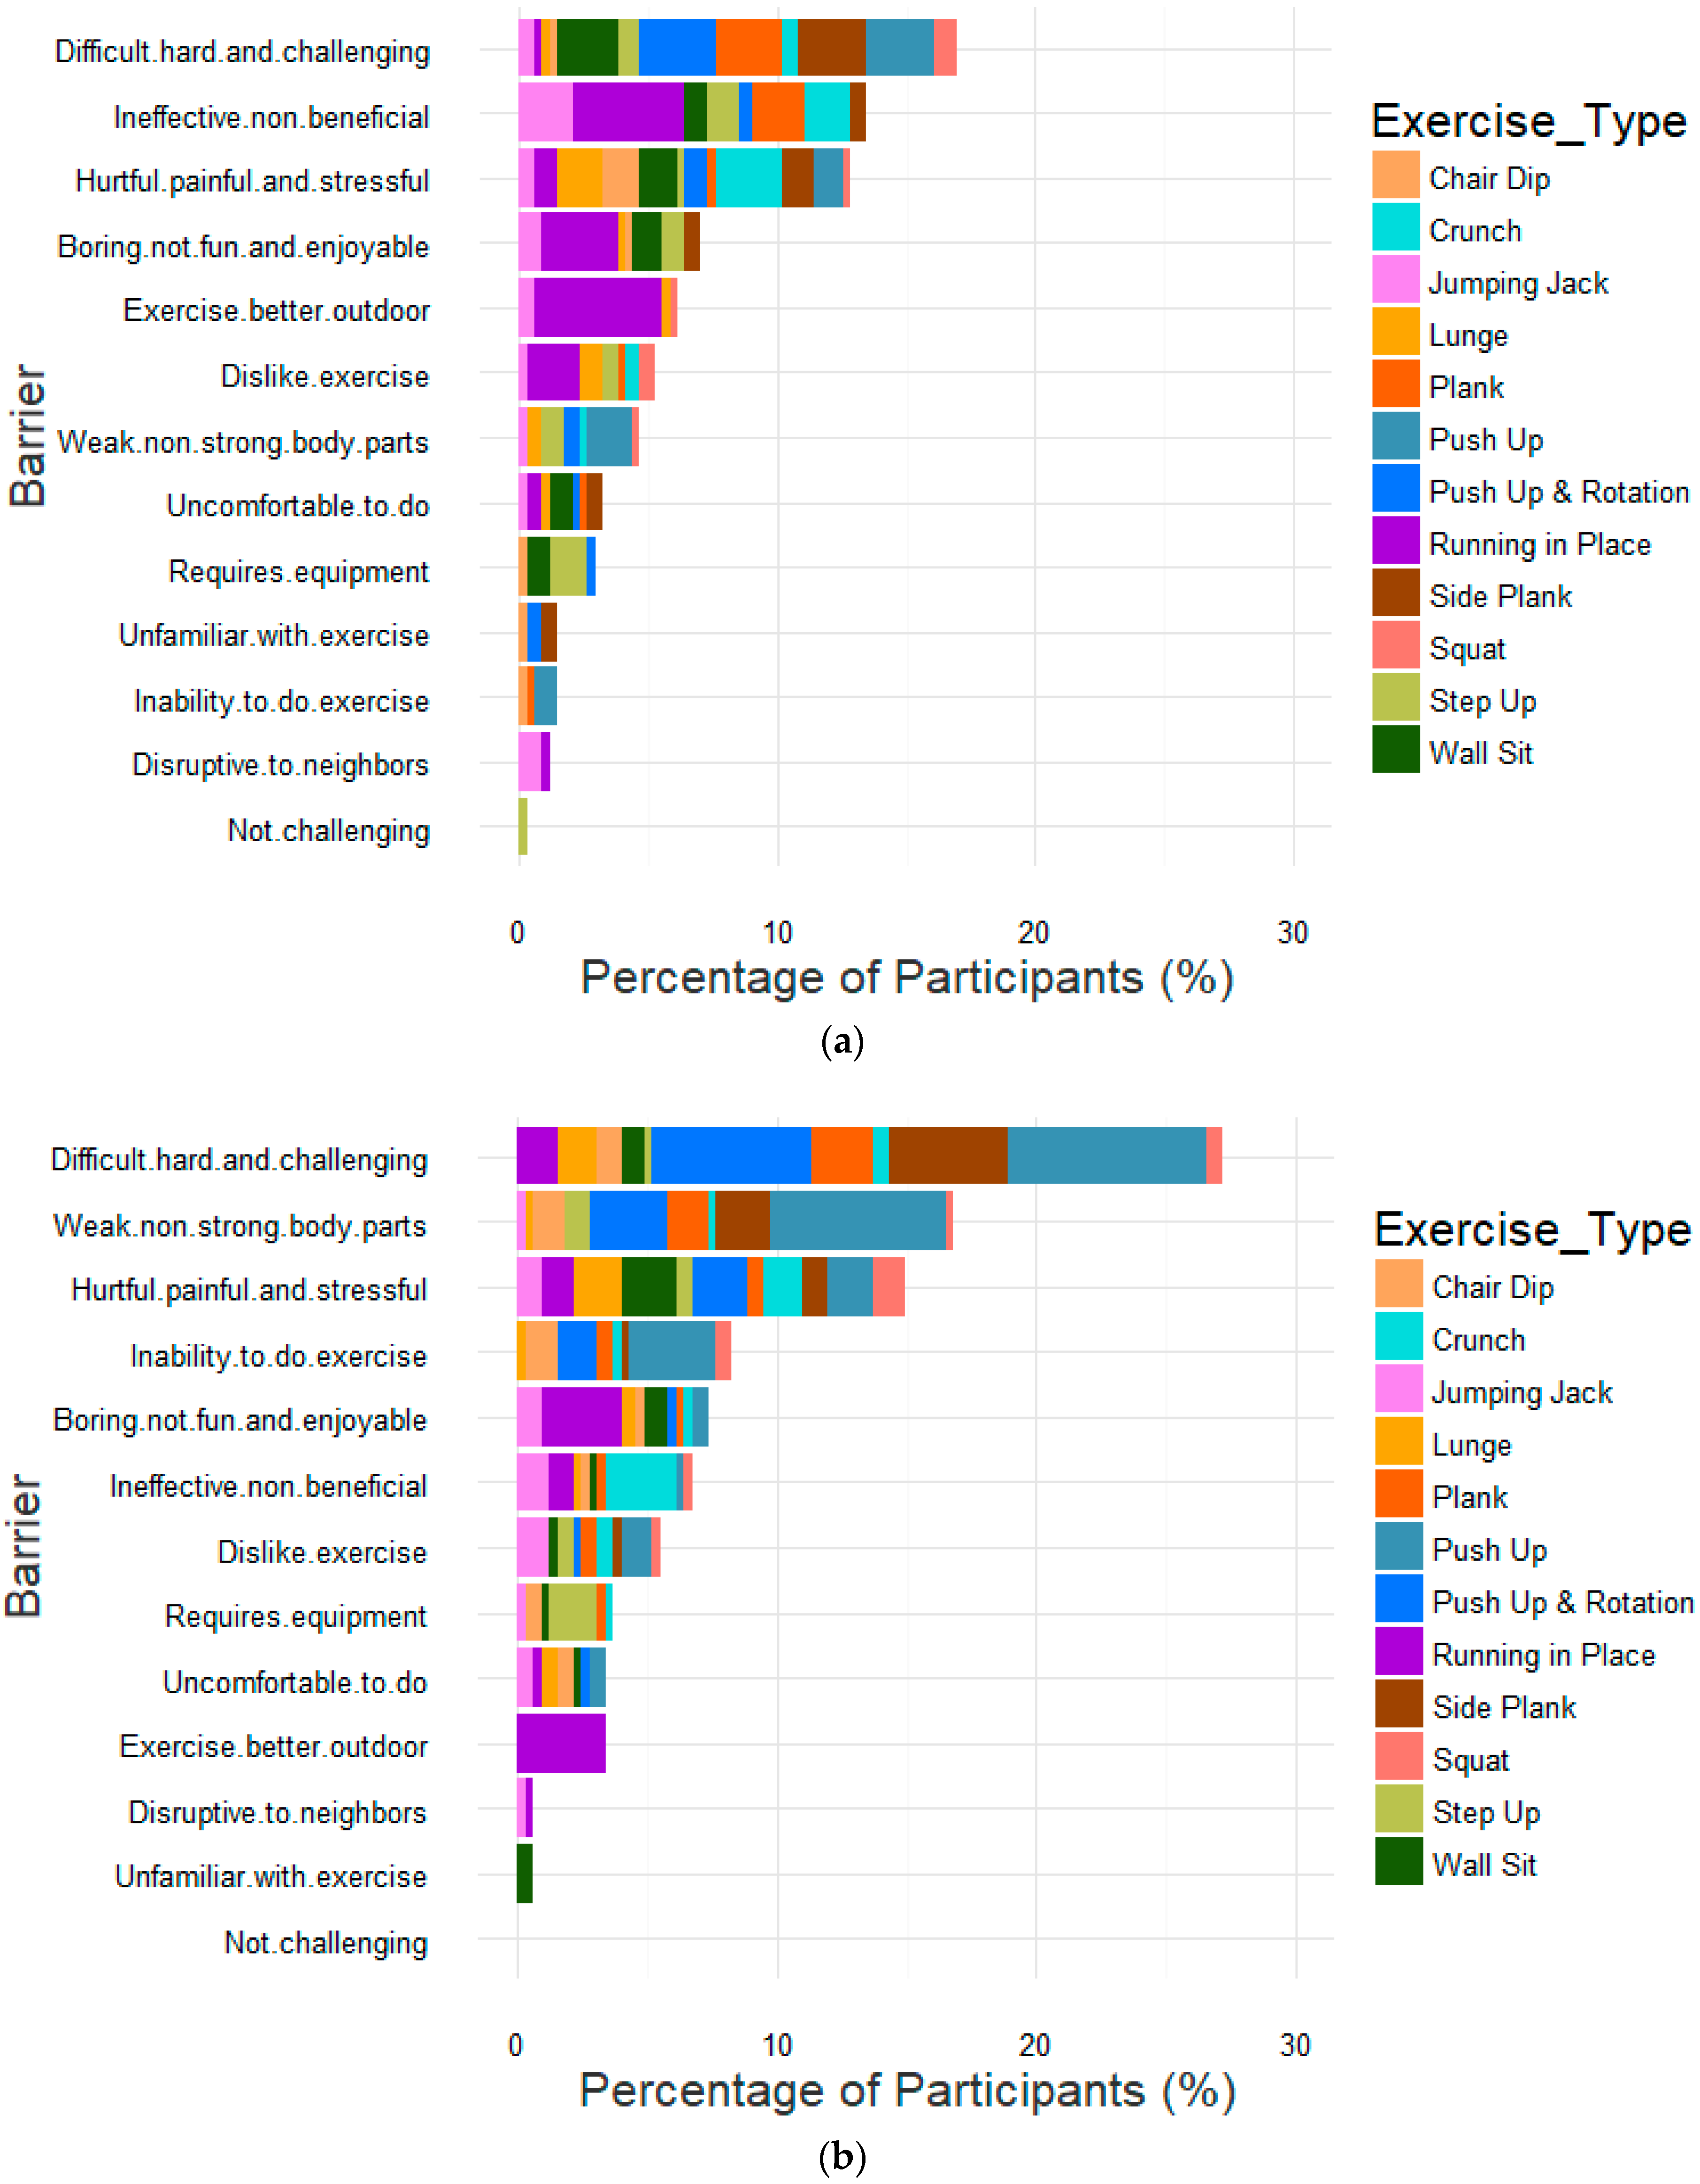
4.2.2. Visualization of the Barriers against the Least Preferred Exercise Types

Figure 5a,b shows the bar charts of the barriers against the least preferred exercise-types for both genders. All of the data points were involved in the presented themes, except 3.74% coded as “others” as a result of not falling under any of the teased-out themes. Overall, thirteen themes were teased out from the participants’ comments on their least preferred exercise types. The five most important barriers against males’ least preferred exercise types include: (1) exercise type is difficult, hard, and challenging; (2) exercise type is ineffective and non-beneficial; (3) exercise type is painful, hurtful, and stressful; (4) exercise type is boring, not fun, and enjoyable; (5) exercise type is better outdoor. On the other hand, the five most important barrier against females’ least preferred exercise types include: (1) exercise type is difficult, hard, and challenging; (2) weak and lack of strong body parts required for exercise type; (3) exercise type is painful, hurtful, and stressful; (4) inability to perform exercise type; (5) exercise type is boring, not fun, and enjoyable. Table A2 in the Appendix A shows samples and percentages of participants’ comments supporting each of the gender-specific barriers.

4.3. Users’ Social Cognitive Beliefs Profile

This subsection covers the participants’ rating of the four social-cognitive constructs considering gender and the two target exercise types (push-up and squat), the reliability analysis, and the analysis of variance based on gender and exercise-type preference.

4.3.1. Reliability Analysis

To answer our fourth research question as to how gender and target exercise-type preference moderate the participants’ social-cognitive beliefs (perceived self-efficacy, perceived self-regulation, and outcome expectation) and their projected exercise performance level for the two exercise types, we computed the average rating of the four constructs. We began by ensuring that the respective scales measuring the four SCT constructs were statistically reliable. Thus, we conducted a McDonald’s omega reliability test for the three multi-item constructs (perceived self-efficacy, perceived self-regulation, and outcome expectation) using the “userfriendlyscience” package in R [43]. We chose this non-parametric test rather than the Cronbach’s alpha reliability test because our dataset was not normally distributed as the case with most survey data [44]. Our results met the reliability requirement: the value of omega for each of the three multi-item SCT constructs was greater than 0.7 [45].

4.3.2. Average Rating of Social Cognitive Constructs and Projected Exercise Performance Level

Figure 6 shows the mean ratings for perceived self-efficacy, perceived self-regulation, and outcome expectation and the projected exercise performance level for both genders and target exercise-type preferences. They were expressed in percentages to ensure uniformity and allow for easy within-group comparison by inspection as different Likert scales were used to measure the social-cognitive constructs. Regarding each exercise type and gender, the average score for each construct was arrived at by calculating the mean score of each item measuring it. Thereafter, the overall average value of all of the construct’s items’ averages was computed. Regardless of gender and exercise-type preference, the participants rated the three social-cognitive determinants of exercise behavior above the neutral value of 50%. For example, regarding perceived self-efficacy, males’ mean ratings for push-up and squat were 64.21% and 62.07%, respectively, while females’ mean ratings were 52.25% and 55.46%, respectively. Overall, the mean rating for perceived self-regulation was the highest, followed by that of outcome expectation and that of perceived self-efficacy. Regarding projected exercise performance level for a push-up, males had more reps/week (282) than females (89), just as in perceived self-efficacy. Similarly, males had more reps/week (248) for squat than females (192). To determine the main effects of and interaction between gender and exercise-type preference, we carried out a non-parametric two-way analysis of variance for the three social-cognitive constructs and the projected exercise performance level using the ARTool in R [46].

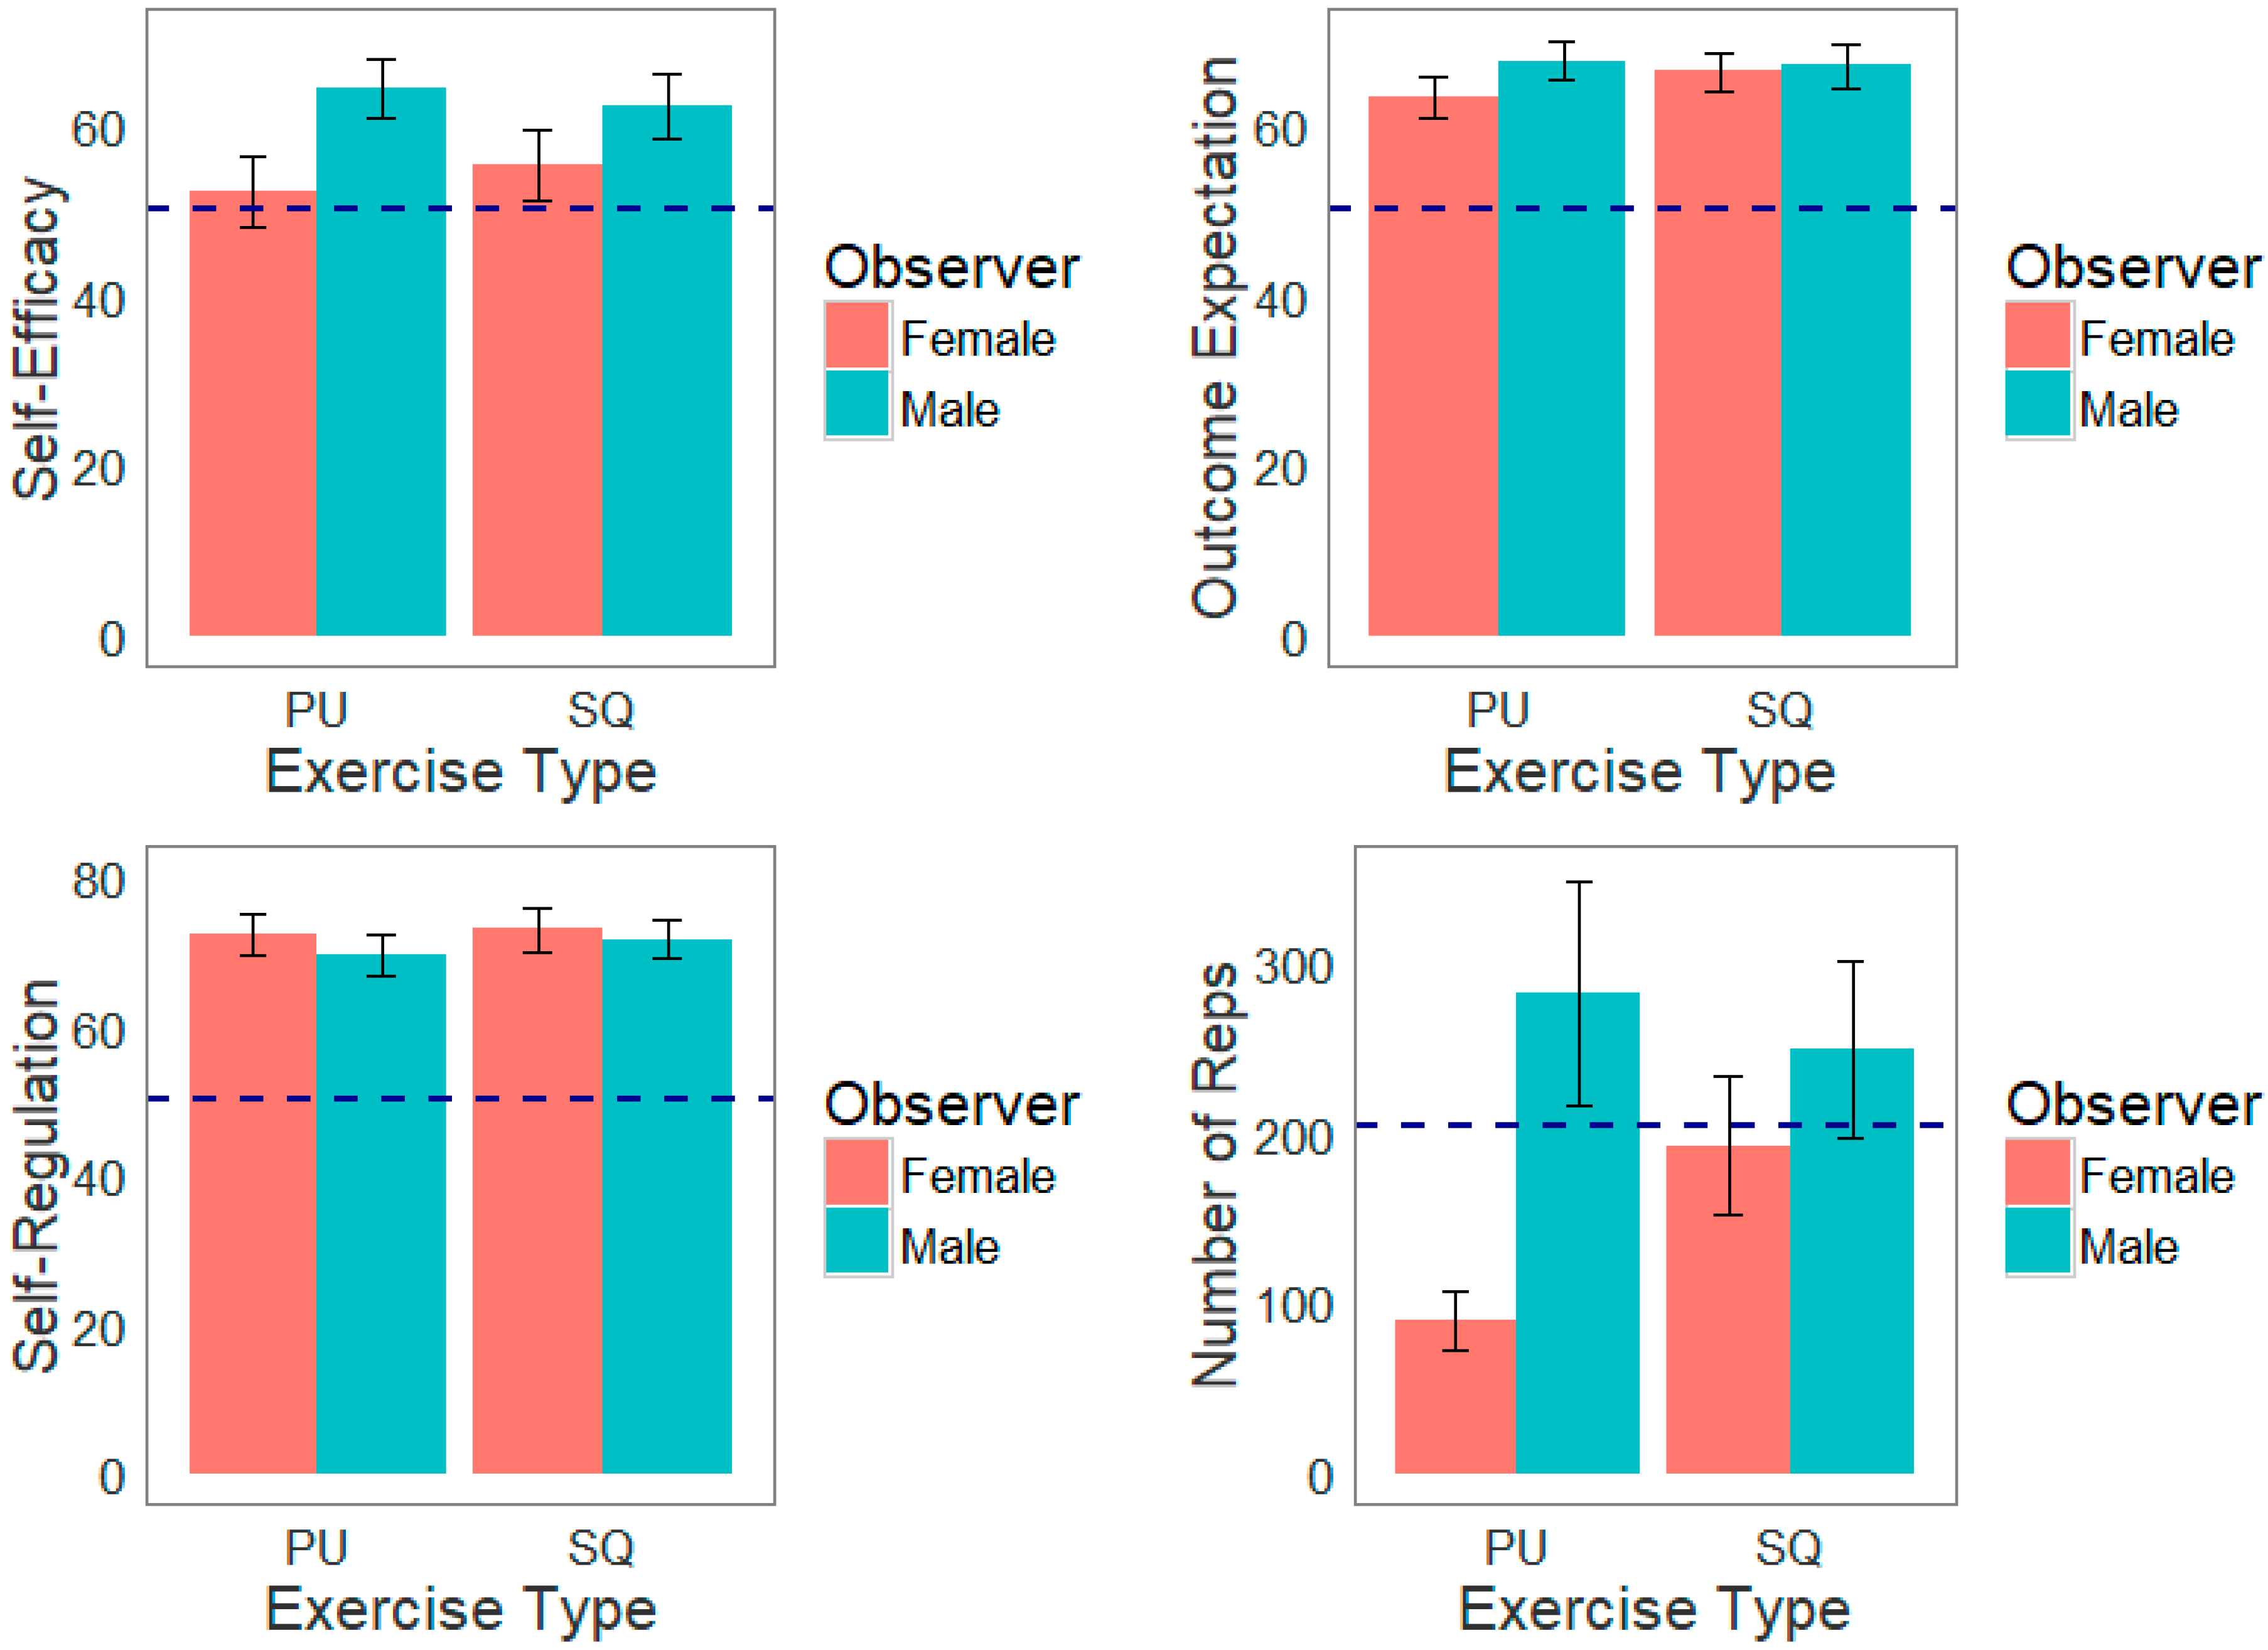
4.3.3. Main Effect and Interaction Analysis for Perceived Self-Efficacy, Perceived Self-Regulation, and Outcome Expectation

The result of the non-parametric two-way analysis of variance (Figure 6) showed that, regarding self-efficacy, there was a main effect of gender (F1,665 = 20.72, p < 0.0001), with males having higher perceived self-efficacy (64.2%) than females (52.3%). However, regarding self-regulation and outcome expectation, we did not find a main effect of or interaction between gender and exercise-type preference (The parametric ANOVA results were similar. There was a main effect of gender on self-efficacy (F1,665 = 22.33, p < 0.0001), which was similar to the non-parametric results (F1,665 = 20.72, p < 0.0001). However, there was a main effect of gender on outcome expectation (F1,665 = 4.25, p = 0.04) as well, which was slightly different from the non-parametric result (F1,665 = 3.33, p = 0.07). Based on the former result, males were more likely to have higher outcome expectation than females. Just as in the non-parametric results, we found no interaction between gender and exercise type.).

4.3.4. Main Effect and Interaction Analysis for Projected Exercise Performance Level

The result of the non-parametric two-way analysis of variance (see Figure 6) showed that, with respect to projected exercise performance level (number of reps/week), there was a main effect of gender (F1,665 = 47.21, p < 0.0001) and exercise-type preference (F1,665 = 6.52, p < 0.05). Overall, males (265 reps/week) had a significantly higher level of performance than females (138 reps/week). Similarly, the projected exercise performance level for squat (220 reps/week) was significantly higher than that for push-up (186 reps/week). Finally, the two-way analysis of variance showed that there was an interaction between gender and target exercise-type preference (F1,665 = 9.33, p < 0.01) (The parametric ANOVA results were similar. There was a main effect of gender on projected exercise performance level (F1,665 = 27.35, p < 0.0001) as in the non-parametric result (F1,665 = 47.21, p < 0.0001), but we found no main effect of exercise type (F1,665 = 1.84, p = 0.18) as we found in the non-parametric result (F1,665 = 6.52, p < 0.05). However, there was an interaction). Kruskal–Wallis main effect analysis revealed that males and females differed more significantly (p < 0.05) in their projected exercise performance level for push-up (282 and 89 reps/week, respectively) at p < 0.0001 than they did for squat (248 and 192 reps/week, respectively). Moreover, there was a significant difference (p < 0.0001) in females’ projected exercise performance level for push-up (89 reps/week) and squat (192 reps/week), but there was none in males’ level of performance for push-up (282 reps/week) and squat (248 reps/week).

5. Discussion

Having presented the results on the gender-based drivers of the participants’ most preferred exercise types and barriers against their least preferred exercise type and their gender-specific social-cognitive profiles, we now discuss the results of our analysis in the light of our research questions.

5.1. Users’ Most Preferred Exercise Types and Their Drivers

In this section, we addressed our first three research questions presented in Section 2.4. Specifically, we focused on users’ most preferred exercise types and the teased-out drivers of these exercise types for both genders.

5.1.1. Males’ Most Preferred Exercise Types and their Drivers

Among males, five exercise types (push-up, squat, crunch, plank, and chair dip) received positive overall preference (Figure 3a). As shown in Figure 4a, the five most important drivers of these exercise types include: (1) exercise type is effective, useful, and beneficial; (2) exercise type is easy to perform; (3) physical development of body parts to improve physical appearance and looks; (4) development of physical (especially core) strength; and (5) familiarity with exercise type. Regarding the first most important reason or driver (see Table A1), words, such as “help”, “effective”, “improve”, and “benefit”, were used to convey the perceived effectiveness and usefulness of males’ most preferred exercise types. For example, P438 commented that push-ups “are very effective, and I know how to do them properly. Regarding the second most important driver, words, such as “easy”, which is the fourth largest in the male word cloud, was used to convey the ease of performance of males’ most preferred exercise types. For example, P64 commented that he “like[s] to do crunches because they are easy for me.” The third most important driver of males’ most preferred exercise type was the development of the physique and look, which entails working out specific parts of the body, such as chest, legs, arms, abs, core, and triceps, to look attractive. Words, such as the aforementioned body parts, “muscles [the largest in the male word cloud]”, “build”, “develop”, etc., were used to convey the impact of males’ preferred exercise types on their physique and look. For example, P373 commented that “I love being able to do push-ups like a man. The added bonus is how great my arms look in a sleeveless top.” Similarly, P59 commented that he “like[s] crunches because I want a nicer stomach.” The fourth most important driver of males’ most preferred exercise type was physical strength, especially in the core area, as evident in their preference for a push-up, crunch, and plank (see Figure 4a). Positive male comments supporting this driver include: (1) “I find that planks require a lot of focus, are great for core strength when performed correctly” [P260, PL, F, M], and (2) “It also provides strength to my lower back and helps with my posture[P32, CR, M]. Finally, the fifth most important driver of males’ most preferred exercise type was familiarity. For example, P434 remarked that Push Up is “Something I grew up with, and most people did….” Moreover, P359 stated that “I have been doing push-ups since I was in middle school. I chose them because I know I can easily accomplish them from years of doing them.” The last statement from P359 suggested that the more familiar people are with a given exercise (as a result of previous experience), the easier they find the performance of the exercise type. Please see Table A2 for more sample comments on the discussed and other barriers against females’ least preferred exercise types.

5.1.2. Females’ Most Preferred Exercise Types and their Drivers

Among females, six exercise types (squat, crunch, jumping jack, step-up, plank, and lunge) received positive overall preference (see Figure 3b). As shown in Figure 4b, the five most important drivers of these exercise types include: (1) exercise type is easy to perform; (2) physical development of body parts to improve physical appearance and looks; (3) exercise type is effective, useful, and beneficial; (4) exercise type is users’ favorite or liked by them; and (5) development of physical (especially core) strength. Regarding the first most important driver of females’ most preferred exercise types, words, such as “easy [one of the three largest words]”, “easier”, and “easiest”, were used to convey the ease of performance of females’ most preferred exercise types. For example, P96 commented that “I don’t get much exercise, but squats have always been pretty easy for me. Similarly, P177 commented that “Crunches are easy for me to do. They don’t feel like a lot of exercise, and they’re not hard on my back.” Regarding the second most important driver (improvement of physique and look), words, such as “muscles [one of the largest in the female word cloud]”, “core”, “abs”, “stomach”, “legs”, “knees”, “butt”, “look”, “improve”, “tone”, “nice”, etc., were used to convey the impact of females’ preferred exercise types on their physique and look. For example, P81 commented that “[m]y thighs/legs are not in good shape, so I think squats are the exercise that I most need to do.” Similarly, P30 commented that crunch “[h]elps me look better compared with all other types of activities.” Regarding the third most important driver (benefit, effectiveness, and usefulness of exercise type), words, such as “helps” and “effective” (just as with the males), were used to convey the effectiveness and benefit of their most preferred exercise types. For example, P585 commented that “[s]quats are very effective since you engage your whole body and work many muscle groups.” Regarding the fourth most important driver (likeness for exercise type), P135 commented that “I like crunches and ab workouts are typically my favorites.” Moreover, P76 commented that “[I] like doing squats they work my butt but also I feel it gets my heart rate going.” Finally, regarding the fifth most important driver (physical strength), P305 commented that “[c]runches lead to the best core muscle strengthening, I think. Helps me with my posture, breathing, singing.” Moreover, P305 commented that plank “[s]trengthens the abs and works your whole body.”

5.1.3. Comparison of Users’ Most Important Drivers of Most Preferred Exercise Types to Key Determinants of Technology Acceptance Model

Overall, as shown in Table A1, the benefit/effectiveness/usefulness of exercise, ease of performance, and improvement of physique and look were the three most important drivers of users’ most preferred exercise type. As shown in Figure 4, regardless of gender, these drivers occupied the three top-most positions in the bar charts. The first two most important drivers of users’ most preferred exercise types (utility and ease of performance) could be likened to the two traditional determinants of information system adoption in the technology acceptance model (TAM) put forward by Davis [47]. They include perceived usefulness and perceived ease of use, respectively. According to Davis, when an information system is first introduced to potential, they often resist it at first. This made him investigate the most important factors that determine the acceptance of new technology, such as an information system. The author found that perceived usefulness and perceived ease of use were the most important determinants of the acceptance of a new information system. Perceived usefulness is the belief that an information system will accomplish the task it is designed for. On the other hand, perceived usability is the extent to which users believe using an information system will be free from effort. Davis [47] found, in a structural equation model, that perceived usefulness and perceived ease of use were key determinants of the acceptance of an information system. These findings have been confirmed by other researchers [48,49]. The third driver of users’ most preferred exercise types could be likened to perceived aesthetics (also known as perceived attractiveness) in the TAM. In prior studies, Oyibo and Vassileva [49], as well as van der Heijden [48], found that perceived aesthetics was a strong determinant of information technology acceptance, such as fitness app. In the same vein, in the current study, we found that, regarding users’ exercise-type preference, physical appearance and looks (which have to do with beauty and attractiveness) were among the three most important drivers of users’ engagement in certain exercise types. These exercise types include push-up for males and squat, crunch, and plank for both genders, as shown in Figure 4.

5.2. Users’ Least Preferred Exercise Types and their Barriers

In this section, we addressed our first three research questions. We focused on the least preferred exercise types and the five most important teased-out barriers against them for both genders.

5.2.1. Males’ Least Preferred Exercise Types and their Barriers

Based on the overall preference metric, our analysis (Figure 3a) showed that males prefer six exercise types the least: running in place, wall sit, side plank, step up, jumping jack, and push-up and rotation. The five most important barriers against these exercise types include: (1) exercise type is difficult, hard, and challenging; (2) exercise type is ineffective and non-beneficial; (3) exercise type is painful, hurtful, and stressful; (4) exercise type is boring, not fun, and enjoyable; and (5) exercise type is better outdoor. As shown in Figure 5a, at least 5% of the male participants gave negative comments relating to one or more of these barriers. Regarding the first barrier (difficulty of exercise type), 16.96% of the male participants gave negative comments about their least preferred exercise type. In the male word cloud we created, words, such as “hard” and “difficult”, which are among the four largest words, were used to express the perceived difficulty of males’ least preferred exercise types. Particularly, as shown in Figure 5a, the comments were mostly about a push-up, push-up and rotation, plank, side plank, and wall sit. For example (see Table A2), P43 commented that “I already have a tough time doing push-ups, so another step makes it more difficult.” Secondly, 13.45% of the male participants provided comments on the second barrier against their least preferred exercise types, which had to do with the perceived ineffectiveness and/or non-benefit of the exercise types. In the male word cloud we created, words, such as “[not] effective”, “[not] beneficial”, “[no] benefit”, and “useless”, were used to express the perceived ineffectiveness of males’ least preferred exercise types. Collectively, these negative words made up about 2.87% of the male’s word cloud. The comments on ineffectiveness were mostly about running in place, which the male participants thought is not only ineffective but boring (fourth barrier—7.02%) as well and better performed outside or on the treadmill (fifth barrier—6.14%). For example, regarding ineffectiveness and boringness, P446 commented that “[i]t’s monotonous, there is not much resistance in this exercise for muscle and bone strength increase, and because muscles there is less work done by muscles there is less cardiovascular activity as well.” Moreover, regarding ineffectiveness and running outside, P90 commented that “I always feel silly running in place and don’t feel like it accomplishes as much. I think it would be easier just to go for a short jog outside.” The third barrier against males not preferring and engaging in certain exercise types had to do with pain, hurt, and even injury, which such exercise types may cause, especially if not performed correctly. This concern was expressed by 12.87% of the male participants, especially about crunch, as shown in Figure 5a. For example, P129 commented that crunches are “[t]oo strenuous for my body. I’m afraid of pulling a muscle o[r] straining muscles.” (See Table A2 for more sample comments on the discussed and other barriers against males’ least preferred exercise types.)

5.2.2. Females’ Least Preferred Exercise Types and their Barriers

Based on the overall preference metric, our analysis (Figure 3b) showed that females prefer five exercise types the least: push-up, push-up and rotation, side plank, chair dip, and running in place. The five most important barriers against these exercise types include: (1) exercise type is difficult, hard, and challenging; (2) weak and lack of strong body parts required for exercise type; (3) exercise type is painful, hurtful, and stressful; (4) inability to perform exercise type; and (5) exercise type is boring, not fun, and enjoyable. See Figure 5b and Table A2 for sample comments supporting these and other barriers. Regarding the first barrier, 27.22% of the female participants made comments about it. In the female word cloud we created, words, such as “hard” and “difficult”, which are the two largest words, were used to express the perceived difficulty of females’ least preferred exercise types. The comments were mostly related to push-up, push-up and rotation, side plank, and plank (see Figure 5b). For example, P400 commented that “[p]ush-ups are incredibly difficult, in my personal opinion, so I would prefer not to do them if possible.” The perceived difficulty for push-up could be said to be one of the main reasons why females were less likely to have a high perceived self-efficacy and engage in a push-up, compared with males, as shown and confirmed by the analysis of variance (see Section 4). The difficulty-related barrier was closely associated with the second, third, and fourth barriers for females. In particular, some of the female participants thought their least preferred exercise types were difficult because their non-strong, weak, or injured body parts cannot support them (second barrier—16.82%), they cause pain and hurt the target body parts (third barrier—14.98%), and they (the female participants) lack the ability to perform them (fourth barrier—8.26%). For example, regarding difficulty and non-strong/weak/injured body parts, P351 commented that “I have bad wrists and have difficulty with push-ups due to injury.” Regarding difficulty and hurt, P54 commented that “[d]oing lunges is hard because my muscles burn.” Moreover, regarding difficulty and inability, P231 commented that “[push-ups] are hard to do. I would not be able to keep it up for a long time.” Finally, the fifth barrier against females not preferring and engaging in certain exercise types had to do with the perceived boring nature and lack of enjoyment and fun of their least preferred exercise types. This concern was expressed by 7.34% of the female participants, especially regarding running in place, as shown in Figure 5b. For example, P195 commented that [running in place] is boring to me, I would much rather go on a run outside or at the gym.” Other barriers against females’ least preferred exercise types include ineffectiveness of the exercise type, dislike for the exercise type, requirement of equipment to perform the exercise type, etc. For example, regarding the last-mentioned barrier, which mostly concerned step up and chair dip, P346 commented that “[I] don’t have anything I could step up on (I know this sounds stupid, but I live in a one-floor condo, with no stairs and no small items that I trust would hold my body weight).”

5.3. Gender Similarities in Exercise-Type Preferences, Drivers, and Barriers

Regarding our third research question, our analysis showed that males and females were similar with respect to their most/least preferred exercise types and their respective drivers/barriers. Specifically, both genders expressed a positive overall preference for squat, crunch, and plank. Their preference for these three exercise types was mainly driven by their perceived effectiveness, ease of performance, and improvement of physique and looks. Regardless of gender, these three drivers ranked one to three in each of the bar charts shown in Figure 4. On the other hand, both genders expressed a negative overall preference for push-up and rotation, side plank, and running in place. As shown in Figure 5, their least preference for the first two exercise types (push-up and rotation and side plank) was mainly driven by their perceived difficulty, and for the third exercise type (running in place) was driven by its perceived boringness and it being better performed outdoor. Particularly, males’ least preference for running in place and plank was driven by its perceived ineffectiveness, while females’ least preference for push-up and rotation and side plank was driven by the perceived pain and hurt they had on certain parts of the body.

5.4. Gender Differences in Exercise-Type Preferences, Drivers, and Barriers

Regarding our third research question, our analysis showed that males and females differ with respect to their most/least preferred exercise types and their respective drivers/barriers.
First, based on users’ exercise-type preference, our analysis showed that males prefer push-up the most, while females prefer squat the most (see Figure 3). This result was corroborated by the answer to our fourth research question: the analysis of variance results regarding perceived self-efficacy and projected performance level for push-up and squat (see Section 4.3.3 and Section 4.3.4). Due to the perceived difficulty, having non-strong target body parts, and inability to perform push-up (see Figure 5b), females’ perceived self-efficacy and projected performance level for push-up were significantly lower than males’. Specifically, the belief that a given exercise type is difficult can discourage users, in general, from attempting to engage in the behavior, which is a form of self-defeat. As Bandura [50] puts it, those “who doubt their capabilities shy away from difficult tasks which they view as personal threats.” (p. 2). This is as a result of the fact that such persons dwell on their personal deficiencies, the likely challenges they will face, and all kinds of negative outcomes, instead of focusing on how to successfully perform the target behavior [50]. Our study showed evidence of self-defeat among some of the participants, especially females, in their perception of a push-up. As shown in Section 4.3.3, although not statistically significant, females’ perceived self-efficacy (52.3%) for push-up was lower than males’ (64.2%). The difference between both genders’ perceived self-efficacy for push-up was less than that for squat (which females perceived less difficult than push-up, as shown in Figure 5b). In particular, the perceived difficulty, and thus the lower perceived self-efficacy expressed by females, might have affected their projected exercise performance level for push-up ultimately. This is evident in Figure 6, where females’ projected exercise performance level (89 reps/week) for push-up was significantly lower than males’ (282 reps/week) at p < 0.0001. Our previous study [20] confirmed the relationship between perceived self-efficacy and projected exercise performance level. Moreover, in the current study, 7.65% of females thought push-up (their least preferred exercise type) was difficult, compared with 2.63% of males.
Overall, i.e., for all of the exercise types, 27.22% of females thought their least preferred exercise types were difficult, compared with 16.96% of males (see Figure 5). Moreover, regarding weak and non-strong target body parts and the inability to perform the target exercise type, males and females differed substantially. For example, 16.82% of females (compared with 4.68% of males) cited weak and non-strong body parts for their least preference for the exercise types they chose. Similarly, 8.26% of females (compared with 1.16% of males) cited an inability to perform their least preferred exercise type. Finally, males and females also differed substantially with respect to perceived ineffectiveness and non-benefit of the least preferred exercise types. A total of 13.45% of males thought their least preferred exercise types were ineffective and non-beneficial, compared with 6.73% of females.
Furthermore, apart from the gender difference based on perceived difficulty, one major difference between both genders was that males were more interested than females in developing the upper part of the body (e.g., chest, triceps, arms, core, etc.), perhaps to look “physically strong”. As shown in Figure 4, males were more concerned about physical strength than females. On the other hand, females were more interested than males in developing the lower part of the body, such as the abdomen, butt, knees, etc., perhaps to look “more physically attractive” [3]. This difference in physical outcome expectations might have informed males’ and females’ highest preference for push-up and squat, respectively, as evident in their respective comments regarding physique, look, and appearance in Table A1. This gender-based physical outcome expectations, which might have influenced their most preferred exercise types, could be best summarized in P548’s comment regarding the social influence of mass media with respect to the “ideal shape” of the respective genders: “With the media, how it displays males. Every male wants to have those 6-pack abs. While every woman wants to have the large butt so they would pick Squats.”
Apart from both genders differing regarding their preference for a push-up, as shown in Figure 3, they also differed regarding their preference for jumping jack and step up. Females had a positive overall preference (+7.03% and +5.50%) for both exercise types, respectively, while males had a negative overall preference (−5.85% and −6.14%). Finally, both genders differed substantially with respect to three key drivers of their most preferred exercise types: (1) exercise type is effective, useful, and beneficial; (2) development of physical (especially core) strength; (3) exercise type is easy to perform. The first two drivers were more important to males (19.59% and 10.53%, respectively) than females (12.84% and 5.50%, respectively). However, the third driver was more important to females (17.74%) than males (13.16%). A fourth area (not as important as the three-aforementioned drivers), in which both genders differed, was with regard to perceived fun and enjoyment of their most preferred exercise types. This driver was more important to males (5.56%) than females (2.75%).

5.5. Design Guidelines for a One-Size-Fits-All Fitness App

Though tailored apps are more effective, there are times a designer may adopt the one-size-fits-all approach due to economic reasons or time constraints or, better still, the need to design for the broadest possible audience [51]. For example, a designer who wants to roll out a fitness app modeling behavior change to the market but has limited resources to implement various behavior models to enable personalization. Such a designer may resort to implementing a limited number of exercise behavior models that can serve a broad population. The same also applies to a health service provider who is trying to roll out a fitness app ahead of its competition, and a researcher who is trying to promote physical activity among a given target population. In these cases, for the app to appeal to a wider population of users, we recommended that the app starts with exercise behavior models that appeal to both gender groups most, i.e., gender-neutral exercise types. Based on our findings, to design for a broad population, designers should employ exercise behavior models based on squat, crunches, and plank. These exercise types appealed to both males and females based on the positive overall preference, which both genders expressed for them (see Figure 3). In total, the designer has the potential of reaching out to about 42% of the target population (35% males and 49% females). Moreover, in the design of the behavior models in the fitness app, the designer should emphasize the three most important drivers of users’ exercise-type preferences, which are independent of gender: ease of performance, effectiveness, and improvement of the physique, look, and appearance. The last one is focused on informing the users about the target muscle groups or body parts the exercise, in question, develops or works out.

5.6. Tailoring Based on User Gender and Exercise-Type Preference

Our qualitative analysis showed that both genders were motivated differently by different drivers with respect to some of the exercise types, which was confirmed by the quantitative analysis of the social-cognitive beliefs and projected exercise performance level. In the qualitative analysis, for example, we found that perceived ease of performance (which is related to perceived self-efficacy) was one of the most important drivers of males’ preference for a push-up, which was hardly the case for females (see Figure 4). Moreover, the results of the quantitative analysis of variance showed that the belief in one’s ability to carry out the observed target behavior (i.e., perceived self-efficacy) and the performance of the behavior (projected exercise performance level) was moderated by both gender and target exercise-type preference. For example, as shown in Figure 6 and Section 4, males were more likely to have a higher perceived self-efficacy and projected performance level for push-up than females. For this reason and gender difference, we made an exercise-type recommendation for both genders.

5.6.1. Design Guidelines for a Male-Tailored Fitness App

There are times when a designer may need to tailor the exercise-types of a fitness app based on gender (e.g., when the target population is all males or females), owing to limited resources, economic reasons, time constraint (as pointed out in the previous subsection), or due to cold start (when there is no historical information on the user for personalization) in a recommender system. In this case, we recommended that to tailor for males, exercise types, such as push-up, squat, crunches, plank, and chair dip, should be given priority at the initial stage over exercise types, such as running in place, wall sit, step up, jumping jack, and push-up and rotation. This recommendation was based on the overall ranking of the exercise types for the male participants (see Figure 3a). Moreover, Table 3 shows that the recommended five exercise-types, based on the “most preferred exercise type” metric, resonated with about 75% of the male population sample. This suggested that, in a practical setting, by giving priority to these five recommended exercise-types due to economic reasons, limited resources, and/or time constraints, a fitness app designer may be reaching out to about 75% of the target male population. To encourage males to engage in the target exercise behaviors, their effectiveness, usefulness, benefit, ease of performance, and physical development of body parts that improve physical appearance, look, and strength should be emphasized.

5.6.2. Design Guidelines for a Female-Tailored Health App

For the same reasons presented in the previous subsection, a designer may need to tailor a fitness app to a female population of users. Based on our findings, we would recommend behavior models performing a squat, crunch, jumping jack, step up, plank, and lunge exercise types should be given priority over wall sit, running in place, chair dip, side plank, push-up and rotation, and push-up as a starting point. Based on the set of twelve bodyweight exercise types we investigated, we found that the former six exercise types resonated with females the most, as shown in Figure 3b. Moreover, based on the most preferred exercise-type metric shown in Table 3, by implementing these recommended sets of exercise types in a fitness app, the designer may be catering to the preferences of about 80% of the target female population. Moreover, to encourage females to engage in the target exercise behaviors, their effectiveness, usefulness, benefit, ease of performance, and physical development of body parts to improve physical appearance, look, and strength should be emphasized as in the case for males.

5.7. Summary of Main Findings

For easy reference, we summarized the main findings of this study, which bordered on gender-based exercise-type preferences (their drivers and barriers) and differences as follows as part of our contributions to knowledge. The findings are based on the results from Figure 3 and the qualitative and quantitative analyses from Figure 4 and Figure 5.
(1)
Males prefer push-up the most and running in place the least. However, females prefer squat the most and push-up the least.
(2)
The most important drivers of both genders’ most prefer exercise types include effectiveness, ease of performance, and the improvement of the physique, look, and appearance.
(3)
The most important barriers against both genders’ least prefer exercise types include difficulty, pain, and hurt.
(4)
Males are more likely than females to perform bodyweight exercises as a result of perceived effectiveness, fun, enjoyment, and improvement of physical strength. However, females are more likely than males to perform bodyweight exercises as a result of perceived ease of performance.
(5)
Males are more likely than females to not perform bodyweight exercises as a result of perceived ineffectiveness and non-benefit. However, females are less likely than males to perform bodyweight exercises as a result of perceived difficulty, perceived inability, and having non-strong body parts targeted by the exercises.
(6)
Males are more likely than females to have higher perceived self-efficacy and higher projected performance level for bodyweight exercise, especially with regard to push-up.

5.8. The Implication of Finding and Contributions

Our findings underscore the need for designers of fitness applications to avoid the one-size-fits-all approach to persuasive systems design and leverage the more effective personalization- and customization-based approach. Specifically, our findings suggest that behavior modeling would be more effective if they are personalized based on the gender and target exercise-type preference of the user. Our main contribution to the body of knowledge is that we provided empirical evidence (quantitative and qualitative) as to how gender and target exercise-type preference can influence users’ perceived self-efficacy and projected performance level in the engagement in physical activity. Research [32,52] has shown that physical activity is declining globally due to a sedentary lifestyle, which is partly caused by modernity, urbanization, and advancement in technology and transportation systems. Research [32,53] has also shown that so many people are not exercising due to a range of several factors, which include lack of time, lack of social support, lack of access, or proximity to recreational facilities. The reporting of our findings is timely, especially given the COVID-19 coronavirus pandemic. As a result of national governments’ directives, which have confined people to their homes, it has become difficult and almost impossible for people to go the public gym for their daily, weekly, and periodical workouts. In that case, most people, who want to remain fit, will have to resort to engaging in home-based exercise supported by technology, such as fitness applications featuring behavior models [54]. In this study, we provided a set of design guidelines for tailoring fitness apps to both genders so that they are more likely to be effective. To the best of our knowledge, our study, in the context of behavior modeling, is the first of its kind to: (1) uncover how users’ exercise-type preferences and gender can impact the performance of the target behavior; and (2) provide a set of guidelines to help designers implement and tailor fitness apps to each gender based on exercise-type preferences.

5.9. Limitations of Findings and Future Work

The main limitation of our study is that the majority of the sample population we investigated is from Canada and the United States. This may threaten the generalizability of our findings to other demographics and cultures. Another limitation of our study is that our findings are based on users’ perceptions of behavior modeling as a persuasive strategy for encouraging behavior change, which may not generalize to the actual usage of behavior modeling in a real-life context. Thus, we recommend that, in future studies, the impact of behavior modeling on users with respect to the performance of the target behavior be evaluated in real-life applications. The third limitation of our study is that we only considered a limited set of variables (users’ gender and target exercise-type preference) that may moderate or affect the perception/evaluation of behavior modeling as a behavior change technique for the two genders of participants. For example, although we varied the gender and race of the behavior models shown in the interface in Figure 1, we did not present the results for the manipulation as it is beyond the scope of this paper. The fourth limitation of our study is that only one of the authors coded the participants’ comments into the different thematic categories. We acknowledge that using only one coder rather than two or more has the potential of affecting the reliability of the categorization of the participants’ comments into the respective themes. To compensate for this, the coder went through the coding process for at least five times. Moreover, we acknowledge that the relative set of bodyweight exercise types we targeted in the study, as well as those we recommended for both and either gender group, was not an exhaustive list. Finally, we acknowledge that the underlying causal factor responsible for females being more likely to have lower projected exercise performance level than males may be unclear. It could have been due to the females’ overall lower perceived self-efficacy to engage in both push-up and squat than males’. It could also have been due to the finding that females disliked push-up but liked squat, while males liked both exercise types. As a result, we encourage future research efforts to investigate these limitations, including user preferences for other exercise types, the moderating effect of demographic variables (such as gender, age, race, etc.), the direct causal factor of females’ lower projected exercise performance level, etc. This will allow for better personalization of fitness apps featuring behavior models at a more fine-grain level.

6. Conclusions

In this paper, to amplify the effectiveness of behavior modeling through tailoring, we investigated users’ exercise-type preferences (their drivers and barriers) and how they and gender can impact users’ social-cognitive beliefs and projected exercise performance level using push-up and squat as a case study. Our investigation was based on 669 participants from North America. The results of our analysis showed that both males and females like squat, crunch, and plank. However, males prefer push-up the most and running in place the least, while females prefer squat the most and push-up the least. Moreover, we found that the strongest drivers of both genders’ most preferred exercise types include perceived effectiveness, ease of performance, and improvement of physique and looks. However, we found that the key barriers against users’ least preferred exercise types, which are common to both genders, include perceived difficulty, pain, and hurt. Comparatively, we found that males are more likely than females to perform bodyweight exercises as a result of perceived effectiveness, fun, enjoyment, and improvement of physical strength. On the other hand, females are more and less likely than males to perform bodyweight exercises as a result of perceived ease of performance and perceived difficulty, respectively. For instance, regarding push-up, females are more likely than males to have a lower perceived self-efficacy and projected exercise performance level. Finally, based on our findings and users’ exercise-type preferences and their drivers and barriers, we provided a set of design guidelines to inform future implementation of exercise behavior models in fitness applications in an untailored and gender-tailored context. In future work, we will investigate how the race-based tailoring of behavior models influences users’ social-cognitive beliefs and exercise type preferences, their drivers, and barriers.

Author Contributions

Data curation, K.O.; Funding acquisition, J.V.; Investigation, K.O.; Methodology, K.O.; Supervision, J.V.; Writing—review and editing, K.O. All authors have read and agreed to the published version of the manuscript.

Funding

This research was funded by the Natural Sciences and Engineering Research Council of Canada (NSERC) Discovery Grant (RGPIN-2016- 05762) of the second author.

Conflicts of Interest

The authors declare no conflict of interest. The funders had no role in the design of the study; in the collection, analyses, or interpretation of data; in the writing of the manuscript, or in the decision to publish the results.

Appendix A

Table A1. Sample comments supporting teased-out drivers of users’ most preferred target exercise types. SQ = squat, CR = crunch, PL = plank, SP = side plank, CD = chair dip, LU = lunge, PU = push-up, PR = push-up and rotation, WS = wall sit, SU = step up, RIP = running in place, JJ = jumping jack, M = male, F = female.
Participants’ Comments based on ThemesMF
1. Exercise type is effective, useful, and beneficial
- They are very effective, and I know how to do them properly [P438, PU, M].
- Crunches are one of the exercises I still incorporate (as most core exercises) since they are still effective under body weight [P97, CR, M].
- Push up is a very simple but effective workout. There are many ways to do a pushup to either target your chest, shoulders, or triceps [P415, PU, M].
- Squats are very effective since you engage your whole body and work many muscle groups [P585, SQ, F].
- I like the simplicity and effectiveness of planks and the ease of measuring progress [P268, PL, F].
- It reduces the belly and thigh fat and easy to go this workout. [P90, CR, F].
19.59%12.84%
2. Exercise type is easy to perform
- It is easy to do [P559, SQ, M].
- I like to do crunches because they are easy for me. [P64, CR, M].
- It is the most effective and easiest [P280, F, PL, M]
- I don’t get much exercise, but squats have always been pretty easy for me [P96, SQ, F].
- Crunches are easy for me to do. They don’t feel like a lot of exercise, and they’re not hard on my back. [P177, CR, F].
- They’re easy to do, and I can withstand the pain longer [P343, PL, F]
13.16%17.74%
3. Physical development of body parts to improve physical appearance and looks
- I like crunches because I want a nicer stomach [P59, CR, M].
- I love being able to do push-ups like a man. The added bonus is how great my arms look in a sleeveless top [P373, PU, M].
- Always love a great looking butt, and if you do it right, you can work out your core as well [P504, SQ, F].
- It helps me look better compared with all other types of activities [P30, CR, F].
- It is easy to do, and it gives you a nice looking core [P85, CR, F].
12.57%13.15%
4. Development of physical (especially core) strength
- I find that planks require a lot of focus, are great for core strength when performed correctly [P260, PL, F, M].
- I have weak legs and squats help strengthen them [P538, SQ, M].
- Building core strength [P240, PL, M].
- Targets the muscles I want to work on strengthening [P594, SQ, F].
- Crunches lead to the best core muscle strengthening, I think. Helps me with my posture, breathing, singing [P30, CR, F].
- Strengthens the abs and works your whole body [P305, PL, F].
10.53%5.50%
5. Exercise type is users’ favorite or liked by them
- Planks are my favorite workout as they work your entire body and core to exhaustion [P299, PL, M].
- This is simply one of my favorite exercises [P41, SQ, M].
- I enjoy push-ups because they target my favorite muscle groups [P381, PU, M].
- I like crunches, and ab workouts are typically my favorites [P135, CR, F].
- I like doing squats, they work my butt, but also I feel it gets my heart rate going [P76, SQ, F].
7.89%6.73%
6. Familiarity with an exercise type
- A rewarding workout with which I have lots of experience [P321, PU, M].
- Something I grew up with, most people did. The others are part of workout routines [P434, PU, M].
- I like doing push-ups, and I have been doing them since childhood [P362, PU, M].
- I already do planks and like them the most [P156, PL, F].
- It is the current exercise I do almost daily. [P247, PU, F].
8.77%4.59%
7. Exercise type targets multiple muscle groups
- It works many muscles and helps body structure [P204, PU, M].
- Because it’s a compound exercise that hits most of the muscles [P37, SQ, M].
- Squats are very effective since you engage your whole body and work many muscle groups [P585, SQ, F].
- It works many different muscles at once [P324, LU, F].
6.73%5.20%
8. Exercise type is convenient to do, especially anywhere outside the gym
- It is easy, simple, and you can do it anywhere [P86, CR, M]
- It can be done anywhere and help overall movement in day to day settings [P578, SQ, M].
- Planking is something that looks rather simple and can be done really anywhere [P295, PL, M].
- It is the easiest to do no matter what you have going on in your life or where you are [P562, SQ, F].
- I can do this exercise almost anywhere [P524, SQ, F].
- The easiest and most convenient to do [P100, CR, F].
4.68%4.59%
9. Exercise type is fun and enjoyable
- I enjoy doing lower body exercises, and squats work every muscle group in the legs [P28, SQ, M].
- It is fun [P87, CR, M]
- Planks are a great core workout I really enjoy [P296, PL, M].
- It’s the most enjoyable and not as painful in comparison to others [P569, SQ, F].
- I enjoy crunches the most and think they target an area that needs work on my body [P47, CR, F].
- They feel the most satisfying and help core muscles get stronger [P311, PL, F].
5.56%2.75%
10. Ability to do exercise type
- I feel I can do a lot [P124, SQ, M].
-It is a fun activity that I used to do as a kid. Now, I can do them to help me stay in shape [P192, JJ, M].
-I am the best at this exercise, and I like core workouts the best [P242, PL, F].
- I am good at them, and they work out where I want to focus the most [P344, SQ, F].
1.46%4.28%
11. Exercise type engages or works out the whole body
- It is a full-body workout, and they just feel really good to do [P557, SQ, M].
- Planks are my favorite workout as they work your entire body and core to exhaustion [P299, PL, M].
- Those kinds of exercise influence all body, not only certain muscles [P326, PL, F]
- Strengthens the abs and works your whole body [P305, PL, F].
3.22%1.83%
12. Exercise type facilitates fat and calorie burn and/or weight loss
- I prefer doing crunches because it helps to reduce stomach fat faster [P73, CR, M].
- I need to lose the fat in my abs [P71, CR, M].
- It helps to reduce belly fat, which is the problem of many people [P277, PL, M].
- It reduces the belly and thigh fat and easy to go this workout [P89, CR, F]
- I know crunches will help me lose some of my belly fat and help tone my abdominal muscles [P55, CR, F]
- I would like to reduce my belly fat [P77, CR, F]
1.46%3.67%
13. Provision of cardio benefit
- Push-ups provide cardio and strength in an exercise [P423, PU, M].
- I have found they are effective for building strength and are decent as a cardio workout as well[P203, SQ, M].
- It strengthens all your core muscles as well as raises your heart rate for a good cardiovascular workout [P282, PL, M].
- I like doing squats, they work my butt, but also I feel it gets my heart rate going [P540, SQ, F].
- A very simple warm-up and cardio exercise [P149, Jumping, Jacks, F].
1.75%2.45%
14. Muscle building and stretching
- Increases muscle size in the chest and arm region [P389, PU, M].
- Push-ups are good for building several groups of upper core muscles [P418, PU, M].
- I need to recover that upper body mass I lost after I stopped getting much exercise and got flabby [P378, PU, M].
-I am more willing to build my core [P401, CR, F].
- I like lunges, as they work more and larger muscles. [P410, LU, F].
2.63%1.53%
15. Quick to do and fast result
- When doing them before, the seemed to work the very fastest [P19, CR, M].
- I prefer doing crunches because it helps to reduce stomach fat faster [P73, CR, M].
- It’s the most simple, and it quickly works my muscles [P290, PL, M].
- Because I can see results quicker [P21, CR, F].
- I do planks when I let my dog out to pee. They are quick and easy and can be done anywhere, including in front of the door [P256, PL, F].
1.46%1.53%
16. Exercise type is challenging
- It is the most physically demanding out of all of them [P282, PU, M].
- They are the biggest challenge for me [P545, PU, M].
- This uses a lot of muscles and teaches you to balance. It’s very challenging and beneficial. [P504, SP, F].
-Side planks are difficult for me. I like a challenge. [P166, SP, F].
1.75%1.22%
17. Exercise type makes users be in shape and fit
-Push-ups make me strong and stay in shape [P119, PU, M].
-It is a fun activity that I used to do as a kid. Now, I can do them to help me stay in shape [P192, JJ, M].
-I am out of shape, and that would be an easier start [P405, JJ, F].
- My thighs/legs are not in good shape, so I think squats are the exercise that I most need to do. [P81, SQ, F].
0.58%1.53%
18. No tool or equipment required to perform exercise type
- No extra tools, I already know how to do it [P96, CR, M].
- Push-ups are a naturally well-structured exercise, which focuses on multiple muscle areas without the use of any extra mass, [P291, PU, M].
- It can be done anywhere, doesn’t require any equipment, and you have to be stationary to perform it correctly [P241, PL, F].
- I could do this without having any special exercise gear or equipment. [P264, Step-Ups, F].
1.75%0.31%
19. Variability and adaptability of exercise type
- St[r]ong, compound movement. Works large chains of muscles, while staying scalable and having many varieties [P592, SQ, M]
- You can also mix and match many different styles for added difficulty and challenge [P282, PL, M].
- Squats are very versatile, there are different ways of doing them, and you can add weights to squats. [P586, SQ, F]
- It is the easiest, but variations like using a ball against the wall should be shown too [P563, SQ, F].
1.17%0.92%
20. Exercise type is less hurtful, painful, and stressful
- I feel it gives the most benefit in the places that I most want to be strengthened, and puts the least amount of stress on my body [P193, LU, M].
- I find this workout less stressful than the others [P644, WS, M].
- The least strain on my back [P351, Step-Ups, F].
- It hurts the least (in the muscles) [P498, RIP, F].
0.88%1.22%
21. Exercise type can be combined with other tasks and activities
- Already have strong legs, easy to do in one place while also watching/doing something else [P50, SQ, M].
- They’re effective, but I can also do other things [P313, PL, F].
0.58%0.92%
22. It is comfortable doing exercise type
- It is the most comfortable to perform [P191, Crunch, M].
- It doesn’t put any stress on my shoulder or knee [P166, CR, F].
- I’ve done all of these before, but squats are what I am most comfortable with [P252, SQ, F].
- I like crunches because they’re the most comfortable to do, and, as a result, I do most of those [P398, CR, F].
0.29%1.53%
Table A2. Sample comments supporting teased-out barriers against users’ least preferred target exercise types. SQ = squat, CR = crunch, PL = plank, SP = side plank, CD = chair dip, LU = lunge, PU = push-up, PR = push-up and rotation, WS = wall sit, SU = step up, RIP = running in place, JJ = jumping jack, M = male, F = female.
Participants’ Comments based on ThemesMF
1. Exercise type is difficult, hard, and challenging
- I already have a tough time doing push-ups, so another step makes it more difficult [P43, PR, M].
- I am 72 years old, and even though I am in good shape, the push-up with rotation exercise would be too difficult for me [P17, PR, M].
- The wall sit is a little difficult to balance [P96, WS, M].
- Push-ups are incredibly difficult, in my personal opinion, so I would prefer not to do them if possible[P400, PU, F].
- I find them exceptionally difficult [P384. PU, F].
- Doing lunges is hard because my muscles burn [P54, LU, F].
16.96%27.22%
2. Exercise type is painful, hurtful, and stressful
-I dislike them because they hurt my knees. [P4, LU, M].
-I never feel like I do these right, and they hurt my elbow and back [P16, SP, M].
- It puts a lot of stress on my arm. I don’t really need that. [P18, SP, M].
- This causes a lot of pain in my wrists because I have broken one before [P357, PU, F].
- It is kind of painful for me, and I have zero arm strength. Before push-ups, I’d need to work on my limbs [P373, PU, F].
- It hurts my arms a lot [P375, PU, F].
12.87%14.98%
3. Weak and lack of strong body parts required for exercise type
-I have weak core strength and fin that they strain my neck [P99, CR, M].
-I do not have much upper body strength making it very challenging [P188, PU, M].
- I have terrible, weak arms and have always disliked doing this exercise [P368, PU, F].
- I have zero arm strength and always struggle with push-ups. [P395, PU, F].
- I lack the arm strength to do proper, regular push-ups [P387, PU, F].
- I don’t have much upper body strength [P399, PU, F].
4.68%16.82%
4. Exercise type is ineffective and non-beneficial
- It’s not effective [P202, RIP, M].
- Boring and ineffective. I’d rather run for real [P277, RIP, M].
- It honestly seems like the most useless exercise in the world [P238, RIP, F].
- Running in place doesn’t do anything for me. It doesn’t seem like a workout. I’m not really feeling the sweat by running in place. I prefer to use the treadmill or run outside [P192, RIP, F].
13.45%6.73%
5. Exercise type is boring, not fun, and enjoyable
- Too boring! I would rather go running outside like I already do! [P195, RIP, M].
-Wall sit requires a wall, and it’s pretty boring. [P105, WS, M].
- I find such activities rather mundane, and get bored quickly when I do them [P195, RIP, M].
- It is boring to me; I would much rather go on a run outside or at the gym [P195, RIP, F].
- I don’t enjoy pushup, and that looks even more unenjoyable. [P86, PR, F].
- It is boring and would hurt my joints more [P200, RIP, F].
7.02%7.34%
6. Dislike exercise type
-I hate running in place [P20, RIP, M].
-I don’t like running. I’ve never liked it [P301, RIP, M].
-I dislike them because they hurt my knees. [P4, LU, M].
-I do not like to do Jumping Jacks. They do not appeal to me [P239, JJ, F].
- I have terrible, weak arms and have always disliked doing this exercise [P322, PU, F].
- I don’t like doing things with my arms [P486, PR, F].
4.97%5.50%
7. Inability to perform exercise type
-I’ve never been able to successfully do them [P527, PU, M].
-I can’t do them as I am not strong enough [P638, PU, M].
-I cannot do them due to my shoulder and carpal tunnel. [P85, PL, F].
- I can’t do them well [P151, PU, F].
1.46%8.26%
8. Exercise type is better outdoor or on the treadmill
- I am not a fan of running in place. I prefer using a treadmill or running outside [P188, RIP, M].
- I’m not really feeling the sweat by running in place. I prefer to use the treadmill or run outside [P195, RIP, M].
- I would rather prefer to run outside than standing at a place [272, RIP, M].
- I’d prefer to run outside and travel somewhere for that kind of exercise [P204, RIP, F].
- It just sounds boring. If I am going to run, I prefer to be outside [P186, RIP, F].
- I find it boring, basic. If I wanted to run I would rather go on a treadmill or go outside [P270, RIP, F].
6.14%3.36%
9. Exercise type requires equipment and/or space
- Where do I get such a wall in my house [P462, WS, M]?
- It requires too much equipment [P206, SU, M].
-Have limited space to perform certain exercises [P126, PR, M].
- they’re extremely boring and need too much space to complete [P148, LU, F].
-Difficult to do and find the right equipment to ensure stability [P142, CD, F].
- I would have to go find a box that would be suitable for this exercise [P67, SU, F].
2.92%3.98%
10. Exercise type is not comfortable to do
- Feels awkward and not as effective as regular running [P251, RIP, M].
-Very uncomfortable to do [P202, PL, M].
- Push-ups just make me uncomfortable, and they are very straining [P63, PU, F].
- I think it’s very awkward and uncomfortable [P177, RIP, F].
2.92%3.36%
11. Exercise type is disruptive to neighbors
- Itcan be noisy for neighbors [P88, JJ, M].
- It is noisy, plus if I run, I rather run on a treadmill, which is easier on my knee or outside where the view is nice [P218, RIP, M].
- I like in an apartment, so I can’t be jumping up and down. I also don’t find it a very beneficial exercise [P610, JJ, M].
- I live in an apartment and do not want to disturb people under me [P571, RIP, F].
- it makes too much noise at home and makes me feel like I’m in PE class [P660, JJ, F].
1.17%0.61%
12. Exercise type is unfamiliar
-I don’t know what chair dips are, so that is why I chose them for least preferred [P7, CD, M].
- This is uncommon, I’ve never done it before, I don’t want to learn a whole new thing, invest the time, etc [P606, PR, M].
- This is the first time I heard about this [P588, WS, F].
1.17%0.31%
13. Exercise type is not challenging
- It’s monotonous, there is not much resistance in this exercise for muscle and bone strength increase, and because there is less work done by muscles, there is less cardiovascular activity as well [P207, RIP, M].
- Running in place is too easy for me. I like the challenge [P261, RIP, F].
0.29%0%

References

  1. Bandura, A. Social Cognitive Theory of Mass Communication. In Media Effects: Advances in Theory and Research; Bryant, J., Zillman, D., Eds.; Lawrence Erlbaum: Hillsdale, NJ, USA, 2001. [Google Scholar] [CrossRef]
  2. Abraham, C.; Michie, S. A taxonomy of behavior change techniques used in interventions. Heal. Psychol. 2008, 27, 379–387. [Google Scholar] [CrossRef] [PubMed] [Green Version]
  3. Van Uffelen, J.; Khan, A.; Burton, N.W. Gender differences in physical activity motivators and context preferences: A population-based study in people in their sixties. BMC Public Health 2017, 17, 624. [Google Scholar] [CrossRef] [PubMed]
  4. Thompson, W.R. Worldwide survey of fitness trends for 2017. ACSM’s Health Fit. J. 2016, 20, 8–17. [Google Scholar] [CrossRef]
  5. Conroy, D.E.; Yang, C.-H.; Maher, J.P. Behavior Change Techniques in Top-Ranked Mobile Apps for Physical Activity. Am. J. Prev. Med. 2014, 46, 649–652. [Google Scholar] [CrossRef] [Green Version]
  6. Bandura, A. Social Foundations of Thought and Action: A Social Cognitive Theory; Prentice-Hall: Englewood Cliffs, NJ, USA, 1986. [Google Scholar]
  7. Rovniak, L.S.; Anderson, E.S.; Winett, R.A.; Stephens, R.S. Social cognitive determinants of physical activity in young adults: A prospective structural equation analysis. Ann. Behav. Med. 2002, 24, 149–156. [Google Scholar] [CrossRef]
  8. Oyibo, K. Designing Culture-Based Persuasive Technology to Promote Physical Activity among University Students. In Proceedings of the 24th Conference on User Modeling, Adaptation and Personalization (UMAP 2016), Halifax, NS, Canada, 13–16 July 2016; pp. 321–324. [Google Scholar] [CrossRef]
  9. Yoganathan, D.; Sangaralingam, K. Persuasive Technology for Smartphone Fitness. In Proceedings of the PACIS 2013, Jeju Island, Korea, 18–22 June 2013; pp. 1–11. Available online: http://aisel.aisnet.org/pacis2013/185 (accessed on 21 May 2020).
  10. Bandura, A. Health Promotion by Social Cognitive Means. Health Educ. Behav. 2004, 31, 143–164. [Google Scholar] [CrossRef]
  11. Yoganathan, D. Designing Fitness Apps Using Persuasive Technology: A Text Mining Approach. In Proceedings of the PACIS, Singapore, 5–9 July 2015; p. 40. [Google Scholar]
  12. Passion 4 Profession. Professional Video Tutorials. 2016. Available online: http://passion4profession.net/p4p/home (accessed on 11 November 2016).
  13. Lin, C.-Y.; Chen, Y.-S.; Tsai, J.-C. Exploring the Triple Reciprocity of Information System Psychological Attachment. In Future Information Technology; Springer: Berlin/Heidelberg, Germany, 2014; pp. 779–785. [Google Scholar]
  14. Oyibo, K.; Vassileva, J. Persuasive Features that Drive the Adoption of a Fitness Application and the Moderating Effect of Age and Gender. Multimodal Technol. Interact. 2020, 4, 1–17. [Google Scholar]
  15. Stibe, A. Socially Influencing Systems: Persuading People to Engage with Publicly Displayed Twitter-Based Systems; Acta Universitatis Ouluensis, 2014. Available online: http://urn.fi/urn:isbn:9789526205410 (accessed on 21 May 2020).
  16. Fogg, B.J. Persuasive Technology: Using Computers to Change What We Think and Do; Morgan Kaufmann: Burlington, MA, USA, 2003. [Google Scholar]
  17. Bandura, A. Self-Efficacy: The Exercise of Control. Choice Reviews Online; W. H. Freeman: New York, NY, USA, 1997; Volume 35. [Google Scholar] [CrossRef]
  18. Schwarzer, R.; Aleksandra, L. Perceived Self-Efficacy. In Health Behavior Constructs: Theory, Measurement, and Research; National Cancer Institute: Bethesda, MD, USA, 2007; pp. 1–33. [Google Scholar]
  19. Oyibo, K.; Orji, R.; Vassileva, J. Developing Culturally Relevant Design Guidelines for Encouraging Physical Activity: A Social Cognitive Theory Perspective. J. Healthc. Inform. Res. 2018, 1–34. [Google Scholar] [CrossRef]
  20. Oyibo, K.; Adaji, I.; Vassileva, J. Social cognitive determinants of exercise behavior in the context of behavior modeling: A mixed method approach. Digit. Heal. 2018, 4. [Google Scholar] [CrossRef]
  21. Bandura, A. Social cognitive theory of self-regulation. Organ. Behav. Hum. Decis. Process. 1991, 50, 248–287. [Google Scholar] [CrossRef]
  22. Wójcicki, T.; White, S.M.; McAuley, E. Assessing Outcome Expectations in Older Adults: The Multidimensional Outcome Expectations for Exercise Scale. J. Gerontol. Ser. B 2009, 64, 33–40. [Google Scholar] [CrossRef] [PubMed] [Green Version]
  23. Vollmer, J.; Patrick, S.; Manuel, G. Plank Challenge with NAO: Using a Robot to Persuade Humans to Exercise Longer. In Alexander Meschtscherjakov Boris De Ruyter Verena Fuchsberger Martin Murer; Springer: Berlin, Germany, 2016. [Google Scholar]
  24. Ellis, T.; Latham, N.K.; DeAngelis, T.R.; Thomas, C.A.; Saint-Hilaire, M.-H.; Bickmore, T.W. Feasibility of a virtual exercise coach to promote walking in community-dwelling persons with Parkinson disease. Am. J. Phys. Med. Rehabil. 2013, 92, 472–485. [Google Scholar] [CrossRef] [PubMed] [Green Version]
  25. Abdullahi, A.M.; Orji, R.; Oyibo, K. Vastenburg. Flowie: A persuasive virtual coach to motivate elderly individuals to walk. In Proceedings of the 2009 3rd International Conference on Pervasive Computing Technologies for Healthcare, London, UK, 1–3 April 2009; pp. 1–7. [Google Scholar]
  26. Watson, A.J.; Bickmore, T.; Cange, A.; Kulshreshtha, A.; Kvedar, J.; Hurling, R.; Bexelius, C.; Slinde, F. An Internet-Based Virtual Coach to Promote Physical Activity Adherence in Overweight Adults: Randomized Controlled Trial. J. Med. Internet Res. 2012, 14, e1. [Google Scholar] [CrossRef] [PubMed] [Green Version]
  27. Oyibo, K.; Adaji, I.; Orji, R.; Olabenjo, B.; Azizi, M.; Vassileva, J. Perceived Persuasive Effect of Behavior Model Design in Fitness Apps. In Proceedings of the 26th Conference on User Modeling, Adaptation and Personalization, Singapore, 8–11 July 2018; pp. 219–228. [Google Scholar]
  28. Abdullahi, A.M.; Orji, R.; Oyibo, K. Personalizing Persuasive Technologies: Do Gender and Age Affect Susceptibility to Persuasive Strategies? In Proceedings of the Adjunct Publication of the 26th Conference on User Modeling, Adaptation and Personalization, Singapore, 8–11 July 2018; pp. 329–334. [Google Scholar]
  29. Dittmar, H.; Long, K.; Meek, R. Buying on the Internet: Gender Differences in On-line and Conventional Buying Motivations. Sex Roles 2004, 50, 423–444. [Google Scholar] [CrossRef]
  30. Azevedo, M.R.; Araújo, C.L.P.; Reichert, F.F.; Siqueira, F.V.; Da Silva, M.C.; Hallal, P.C. Gender differences in leisure-time physical activity. Int. J. Public Health 2007, 52, 8–15. [Google Scholar] [CrossRef] [Green Version]
  31. Lumen. The Social Construction of Gender; Lumen: Tysons, VA, USA, 2017; Available online: https://courses.lumenlearning.com/cochise-sociology-os/chapter/the-social-construction-of-gender/ (accessed on 21 May 2020).
  32. World Health Organization. Global Recommendations on Physical Activity for Health; World Health Organzation: Geneva, Switzerland, 2010; Available online: http://www.who.int/dietphysicalactivity/factsheet_recommendations/en/ (accessed on 21 May 2020).
  33. Oyibo, K.; Vassileva, J.; De Vries, P.W.; Oinas-Kukkonen, H.; Siemons, L.; Jong, N.B.-D.; Van Gemert-Pijnen, L. Investigation of Social Predictors of Competitive Behavior in Persuasive Technology. In Proceedings of the 12th International Conference on Persuasive Technology (PT’17), Amsterdam, The Netherlands, 4–6 April 2017. [Google Scholar] [CrossRef]
  34. Oyibo, K.; Orji, R.; Vassileva, J. Investigation of the Persuasiveness of Social Influence in Persuasive Technology and the Effect of Age and Gender. In International Workshop on Persuasive Technology; CEUR: Amsterdam, The Netherlands, 2017. [Google Scholar]
  35. Cyr, D.; Bonanni, C. Gender and website design in e-business. Int. J. Electron. Bus. 2005, 3, 565. [Google Scholar] [CrossRef]
  36. Drozd, F.; Lehto, T.; Oinas-Kukkonen, H. Exploring perceived persuasiveness of a behavior change support system: A structural model. In Proceedings of the International Conference on Persuasive Technology, Linköping, Sweden, 6–8 June 2012; pp. 157–168. [Google Scholar]
  37. Vassileva, K.; Ali, Y.S.; Vassileva, J. Gender difference in the credibility perception of mobile websites: A mixed method approach. In Proceedings of the 2016 Conference on User Modeling Adaptation and Personalization, Halifax, NS, Canada, 13–16 July 2016; pp. 75–84. [Google Scholar]
  38. Rushton, A.; Gray, L.; Canty, J.; Blanchard, K. Beyond Binary: (Re)Defining “Gender” for 21st Century Disaster Risk Reduction Research, Policy, and Practice. Int. J. Environ. Res. Public Health 2019, 16, 3984. [Google Scholar] [CrossRef] [Green Version]
  39. MacCarthy, S.; Reisner, S.L.; Nunn, A.; Perez-Brumer, A.; Operario, N. The Time Is Now: Attention Increases to Transgender Health in the United States but Scientific Knowledge Gaps Remain. LGBT Health 2015, 2, 287–291. [Google Scholar] [CrossRef] [Green Version]
  40. Frederick, D.A.; Fessler, D.; Haselton, M.G. Do representations of male muscularity differ in men’s and women’s magazines? Body Image 2005, 2, 81–86. [Google Scholar] [CrossRef]
  41. Ridgeway, R.T.; Tylka, T.L. College Men’s Perceptions of Ideal Body Composition and Shape. Psychol. Men Masculinities 2005, 6, 209–220. [Google Scholar] [CrossRef] [Green Version]
  42. Meschtscherjakov, A.; Gärtner, M.; Mirnig, A.; Rödel, C.; Tscheligi, M. The Persuasive Potential Questionnaire (PPQ): Challenges, Drawbacks, and Lessons Learned. In Proceedings of the International Conference on Persuasive Technology, Salzburg, Austria, 5–7 April 2016; Springer: Berlin/Heidelberg, Germany; pp. 162–175. [Google Scholar] [CrossRef]
  43. Peters, G. Userfriendlyscience: Quantitative Analysis Made Accessible. R Package Version 0.3-0. 2015. Available online: http://userfriendlyscience.com (accessed on 21 May 2020).
  44. Oyibo, K.; Ali, Y.S.; Vassileva, J. An empirical analysis of the perception of mobile website interfaces and the influence of culture. In Proceedings of the CEUR Workshop, Salzburg, Austria, 5 April 2016; pp. 44–56. [Google Scholar]
  45. Dunn, T.J.; Baguley, T.; Brunsden, V.; Baguley, T. From alpha to omega: A practical solution to the pervasive problem of internal consistency estimation. Br. J. Psychol. 2013, 105, 399–412. [Google Scholar] [CrossRef] [PubMed] [Green Version]
  46. Wobbrock, J.O.; Leah, F.; Darren, G.; Higgins, J.J. The Aligned Rank Transform for Nonparametric Factorial Analyses Using Only ANOVA Procedures. In Proceedings of the 2011 Annual Conference on Human Factors in Computing Systems-CHI ’11, Vancouver, BC, Canada, 7–12 May 2011. [Google Scholar] [CrossRef] [Green Version]
  47. Davis, F.D. Perceived Usefulness, Perceived Ease of Use, and User Acceptance of Information Technology. MIS Q. 1989, 13, 319. [Google Scholar] [CrossRef] [Green Version]
  48. Van Der Heijden, H. Factors influencing the usage of websites: The case of a generic portal in The Netherlands. Inf. Manag. 2003, 40, 541–549. [Google Scholar] [CrossRef] [Green Version]
  49. Oyibo, K.; Vassileva, J. HOMEX: Persuasive Technology Acceptance Model and the Moderating Effect of Culture. Front. Comput. Sci. 2020, 2, 1–17. [Google Scholar] [CrossRef]
  50. Bandura, A. Self-Efficacy. In Encyclopedia of Human Behavior; Ramachaudran, V.S., Ed.; Academic Press: Cambridge, MA, USA, 1994; pp. 71–81, (Reprinted in Friedman, H., Ed.; Encyclopedia of Mental Health; Academic Press: Cambridge, MA, USA, 1998). [Google Scholar]
  51. Orji, R.; Mandryk, R.L. Developing culturally relevant design guidelines for encouraging healthy eating behavior. Int. J. Hum. Comput. Stud. 2014, 72, 207–223. [Google Scholar] [CrossRef] [Green Version]
  52. MacLellan, G.; Baillie, L.; Granat, M. The Application of a Physical Activity and Location Measurement System to Public Health Interventions to Promote Physical Activity. In Proceedings of the 2nd International Conference on PErvsive Technologies Related to Assistive Environments-PETRA ’09, Corfu, Greece, 9–13 June 2009; pp. 1–8. [Google Scholar] [CrossRef]
  53. World Health Organization. Noncommunicable Diseases and Their Risk Factors. Available online: https://www.who.int/ncds/prevention/physical-activity/inactivity-global-health-problem/en/ (accessed on 21 May 2020).
  54. Oyibo, K.; Olagunju, A.-H.; Olabenjo, B.; Adaji, I.; Vassileva, J. BEN’FIT: Design, Implementation and Evaluation of a Culture-Tailored Fitness App. In Proceedings of the Adjunct Publication of the 27th Conference on User Modeling, Adaptation and Personalization, Larnaca, Cyprus, 9–12 June 2019. [Google Scholar]
Figure 1. Two of the eight race- and gender-based push-up and squat behavior models [27].
Mti 04 00021 g001
Figure 2. Twelve exercise types presented to participants to choose from their most/least preferred.
Mti 04 00021 g002
Figure 3. (a) Males’ exercise-types ranking profile based on overall preference percentage from Table 3. (b) Females’ exercise-types ranking profile based on overall preference percentage from Table 3.
Mti 04 00021 g003aMti 04 00021 g003b
Figure 4. (a) Drivers of males’ most preferred exercise types. (b) Drivers of females’ most preferred exercise types.
Mti 04 00021 g004
Figure 5. (a) Barriers against males’ least preferred exercise types. (b) Barriers against females’ least preferred exercise types.
Mti 04 00021 g005
Figure 6. Mean rating of perceived self-efficacy, self-regulation, outcome expectation on a 0%–100% scale (bar represents neutral value), and projected exercise performance level in the number of reps per week (bar represents overall mean value).
Mti 04 00021 g006
Table 1. Participants’ demographics based on gender (n = 669). BM = black male, BF = black female, WM = white male, WF = white female; PU = push-up, SQ = squat.
NumberPercent
CriterionSubgroupMaleFemale MaleFemale
Age18–24705611.18.9
25–3415713925.122.1
35–34767912.112.6
45–5422383.56.0
54+17152.72.4
EducationTechnical/trade school39476.27.5
High school706611.110.5
B.Sc.16215425.824.5
M.Sc.54428.66.7
Ph.D.691.01.4
Others1191.71.4
Country of originCanada11010417.516.5
United States18419429.330.8
Others51268.14.1
Years on the Internet0–3220.30.3
4–613182.12.9
7–940206.43.2
10+28728745.645.6
Behavior model distributionBM-PU45507.27.9
BF-PU39436.26.8
WM-PU47397.56.2
WF-PU44397.06.2
BM-SQ42466.77.3
BF-SQ46257.34.0
WM-SQ41426.56.7
WF-SQ38436.06.8
Table 2. Instruments used for measuring social cognitive constructs.
CriterionOverall Question and Items
Projected exercise performance levelPlease kindly watch the [name of exercise] video and answer the questions below.
Assume you were to perform this exercise at home throughout the week.
(1) What average number of [name of exercise] do you think you can do per day?
(2) How many days per week do you think you can do the [name of exercise]?
Self-efficacy [0—not confident to 100—confident] [18]Please kindly watch the [name of exercise] video and answer the questions below.
(1) How confident are you that you can complete at home the proposed weekly number of [name of exercise] (entered previously) for the next 3 months
(a) Even when you have worries and problems?
(b) Even if you feel depressed? (c) Even when you feel tense?
(d) Even when you are tired? (e) Even when you are busy?
(2) Please kindly give the reason behind your overall confidence level to perform the above workout.
Expectation outcome
[1—strongly disagree to 5—strongly agree] [22]
Please kindly watch the [name of exercise] video and answer the questions below.
(1) The [name of exercise] will…
(a) Improve my ability to perform daily activities.
(b) Improve my overall body functioning.
(c) Strengthen my bones.
(d) Increase my muscle strength.
(e) Improve the functioning of my cardiovascular system.
(f) Improve my social standing.
(g) Make me more at ease with people.
(h) Increase my acceptance by others.
(2) Please kindly give the reason behind your overall rating above.
Self-regulation
[1—strongly disagree to 5—strongly agree] [7]
Please kindly watch the [name of exercise] video and answer the questions below.
(1) To achieve my proposed weekly average number of [name of exercise].
(a) I will set a goal.
(b) I will develop a series of steps to reach my weekly goal.
(c) I will keep track of my progress in meeting my goal.
(d) I will endeavor to achieve the set goal for myself.
(e) I will make the goal public by telling others about it.
(2) Please kindly give the reason behind your overall rating above.
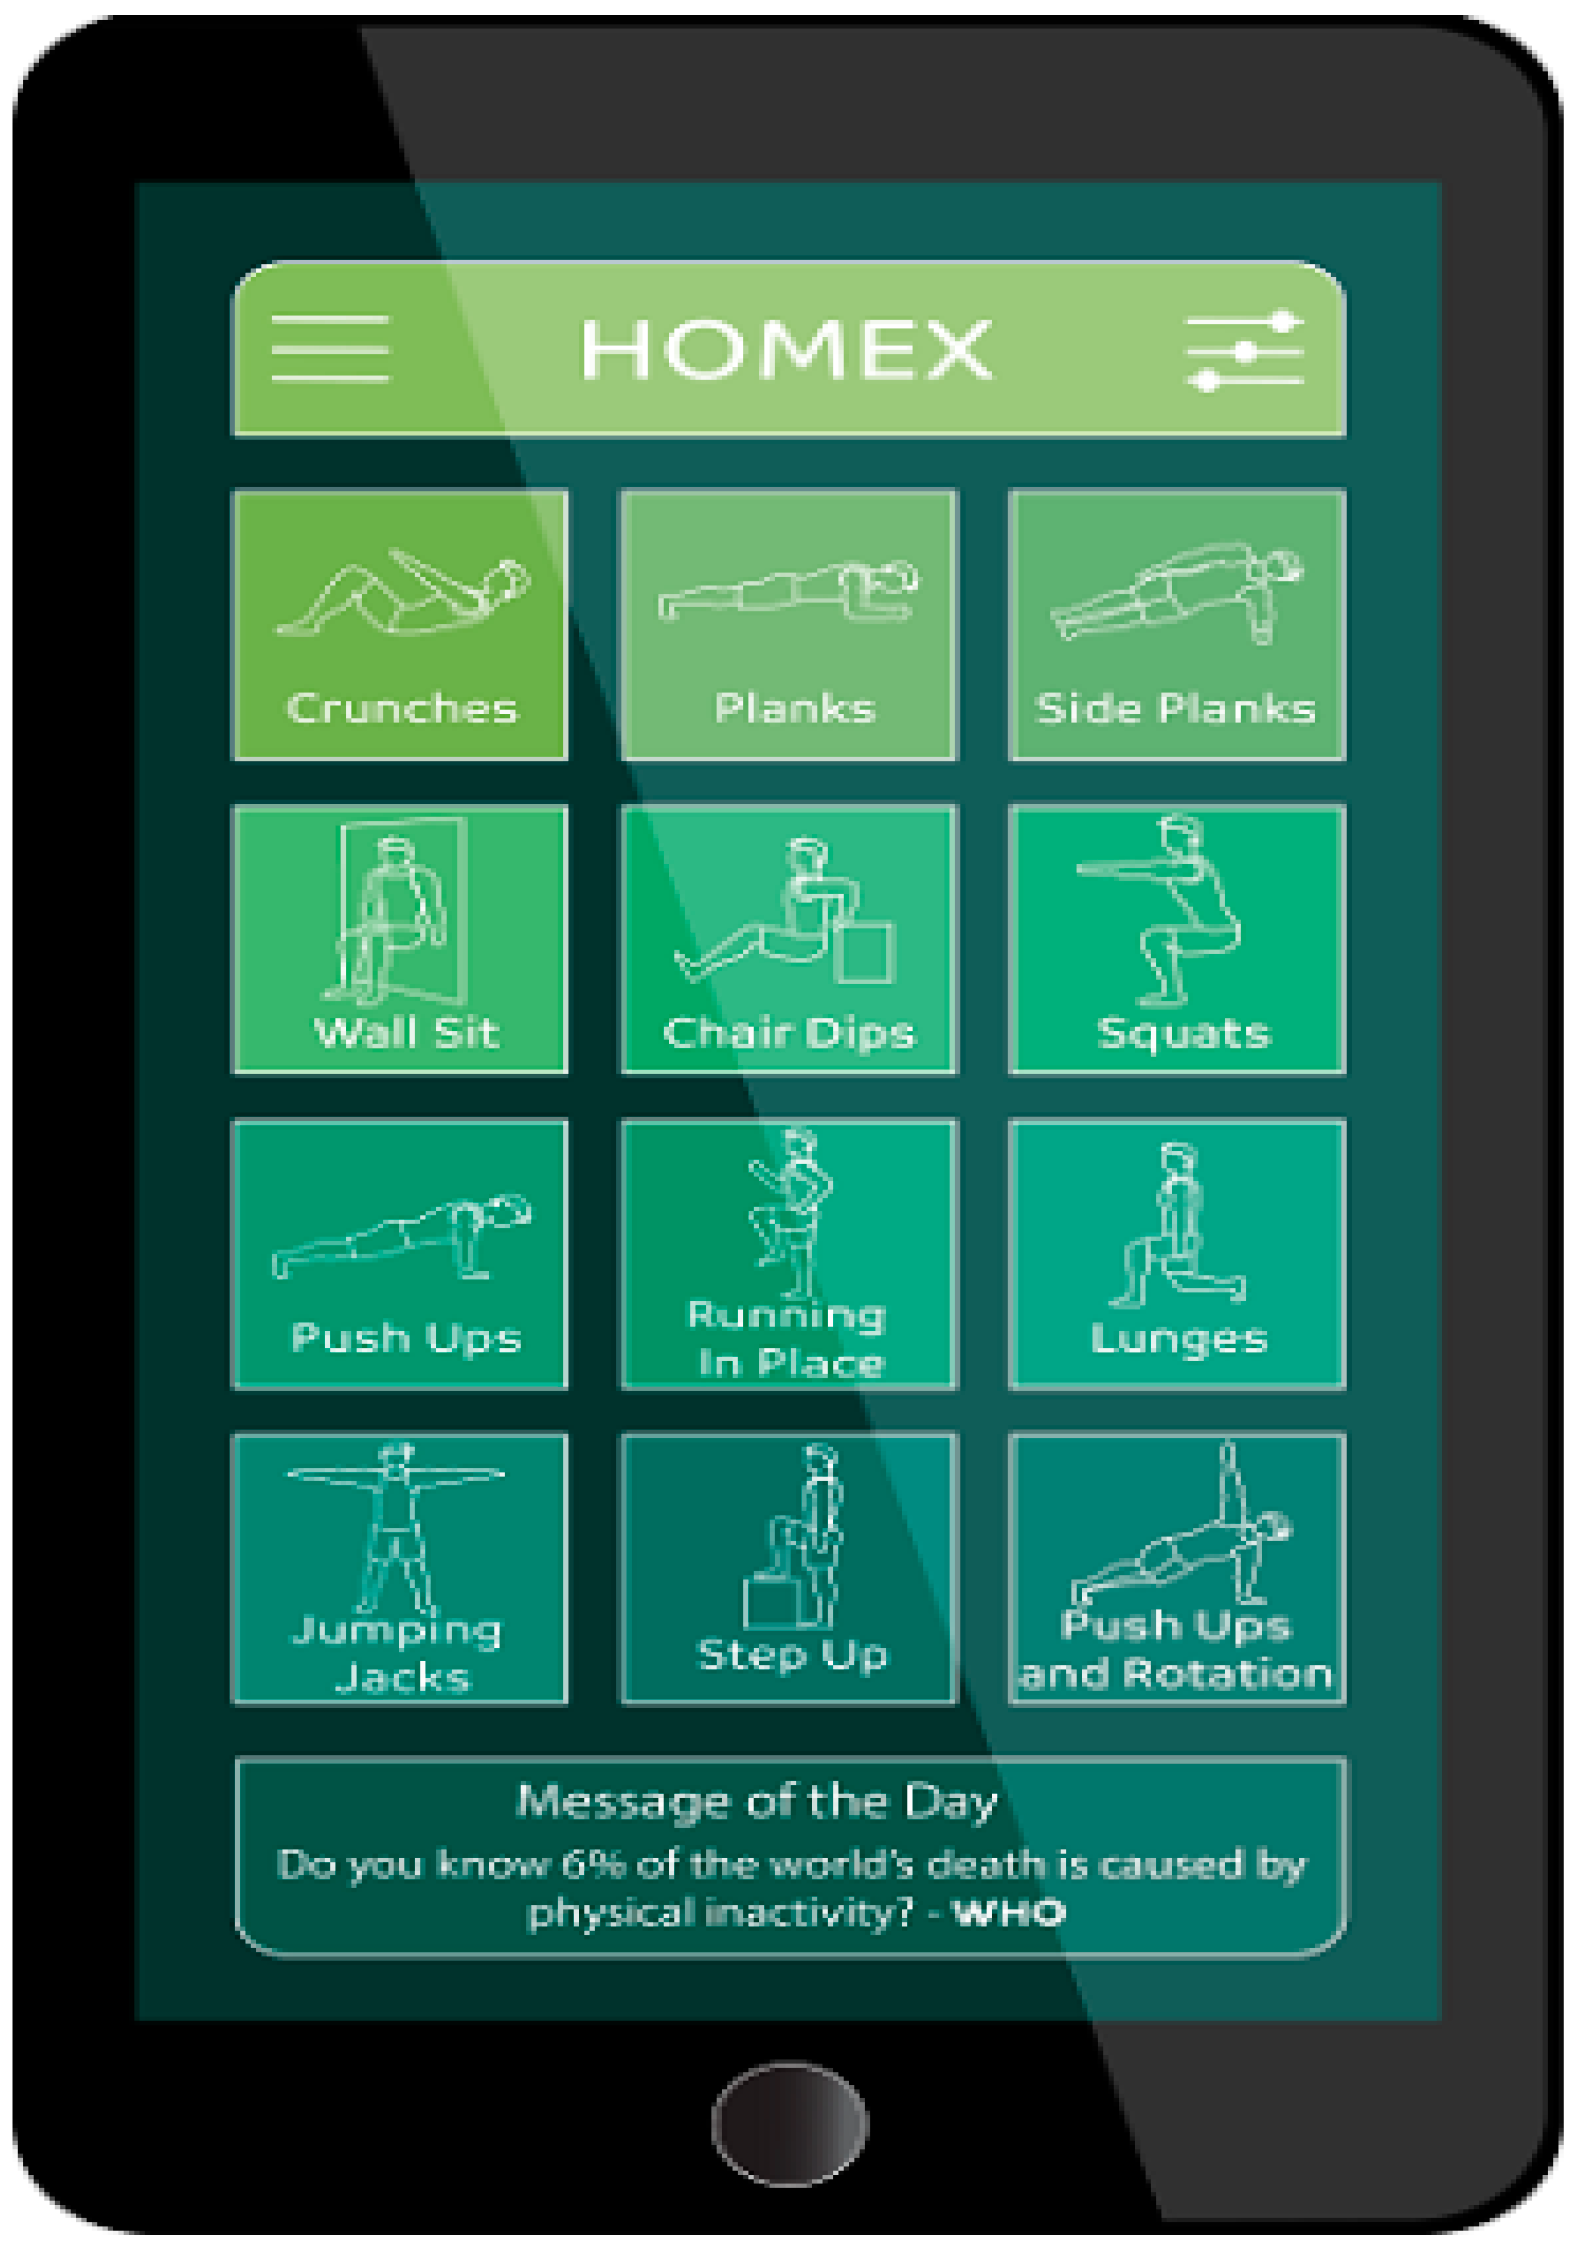
Target exercise-type Preference (1) Please tell us your most preferred work out (physical activity) among the 12 shown above [see Figure 2].
(2) Please give the reason for the choice of your most preferred workout.
(3) Please tell us your least preferred work out (physical activity) among the 12 shown above.
(4) Please give the reason behind the choice of your least preferred workout.
Table 3. Overall preference for each of the twelve exercise types. Positive overall preference indicated that the percentage of participants that chose the exercise as most preferred was higher than the percentage of participants that chose the exercise as least preferred. The reverse was the case for the negative overall preference.
Target Exercise-TypeMost Preferred (% Participants)Least Preferred (% Participants)Overall Preference (% Participants)
MaleFemaleMaleFemaleMaleFemale
Push-up34.803.367.6020.49+27.19−17.13
Squat12.2818.654.093.67+8.19+14.98
Crunch11.4015.606.145.81+5.26+9.79
Plank11.1113.767.318.87+3.80+4.89
Chair dip4.680.922.924.89+1.75−3.98
Jumping jack5.8514.6811.707.65−5.85+7.03
Push-up and rotate0.581.226.1412.54−5.56−11.31
Lunge4.976.735.265.81−0.29+0.92
Wall sit1.754.5910.234.89−8.48−0.31
Run in place4.398.2619.599.79−15.20−1.53
Side plank0.291.226.7310.09−6.43−8.87
Step up3.809.179.943.67−6.14+5.50
Others4.091.832.341.83+1.750.00
Total %100.00100.00100.00100.000.000.00

