3D Point Clouds and Eye Tracking for Investigating the Perception and Acceptance of Power Lines in Different Landscapes

 and
and 
Abstract
1. Introduction
- More attention to power lines leads to more perceived disturbance and lower acceptance.
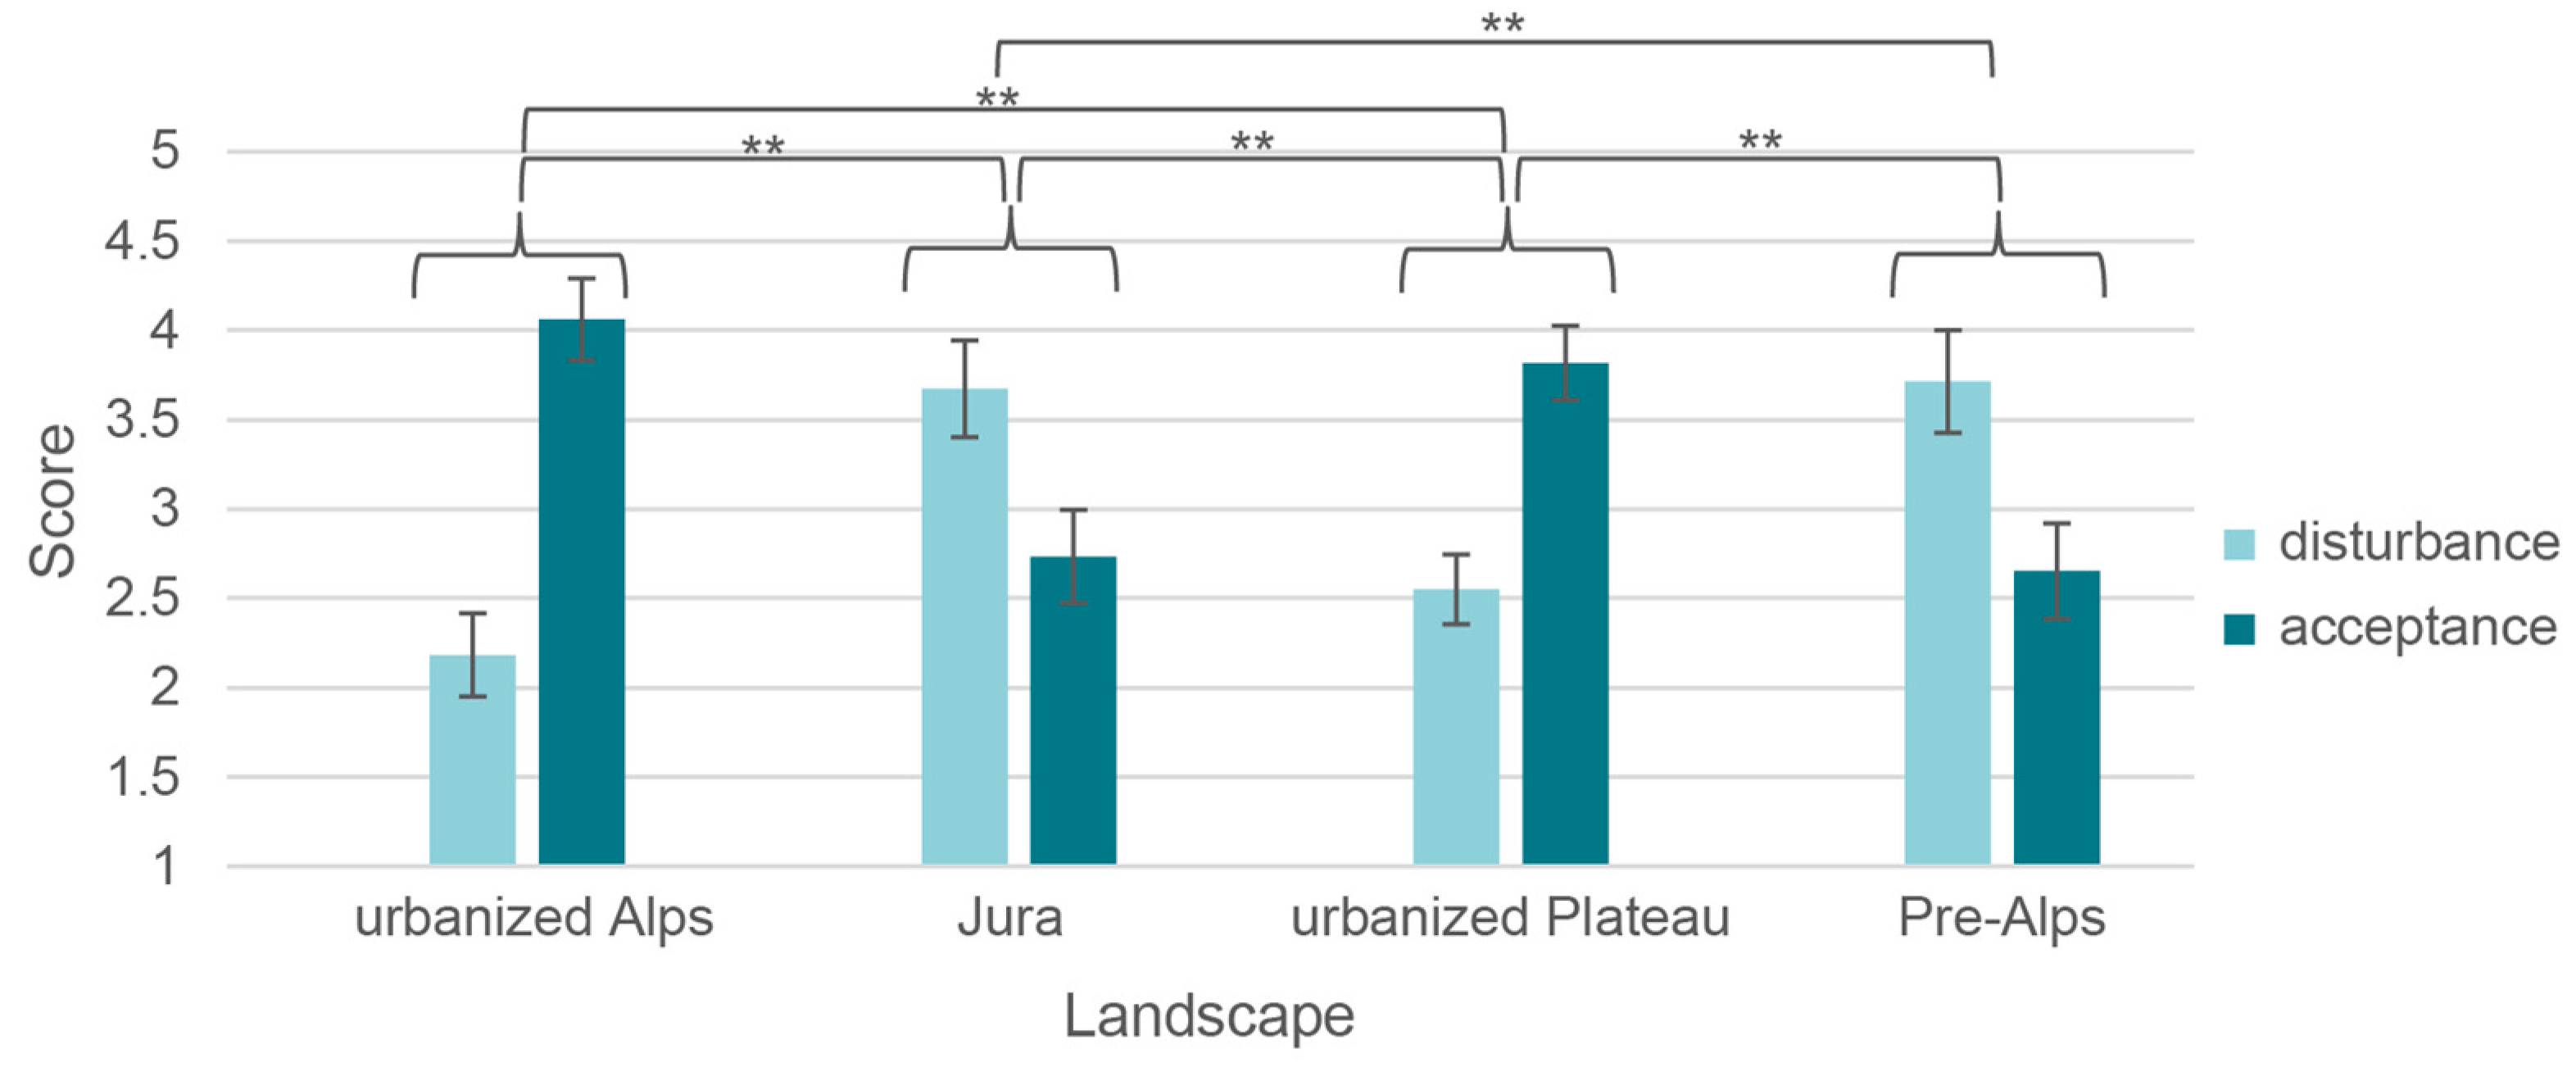
- In near-natural landscapes power lines are perceived as more disturbing and are less accepted than in human-influenced landscapes.
- Power lines in combination with many wind turbines are perceived as less disturbing and are better accepted than without or few wind turbines.
2. Materials and Methods
2.1. Participants
2.2. Visual Stimuli Generation
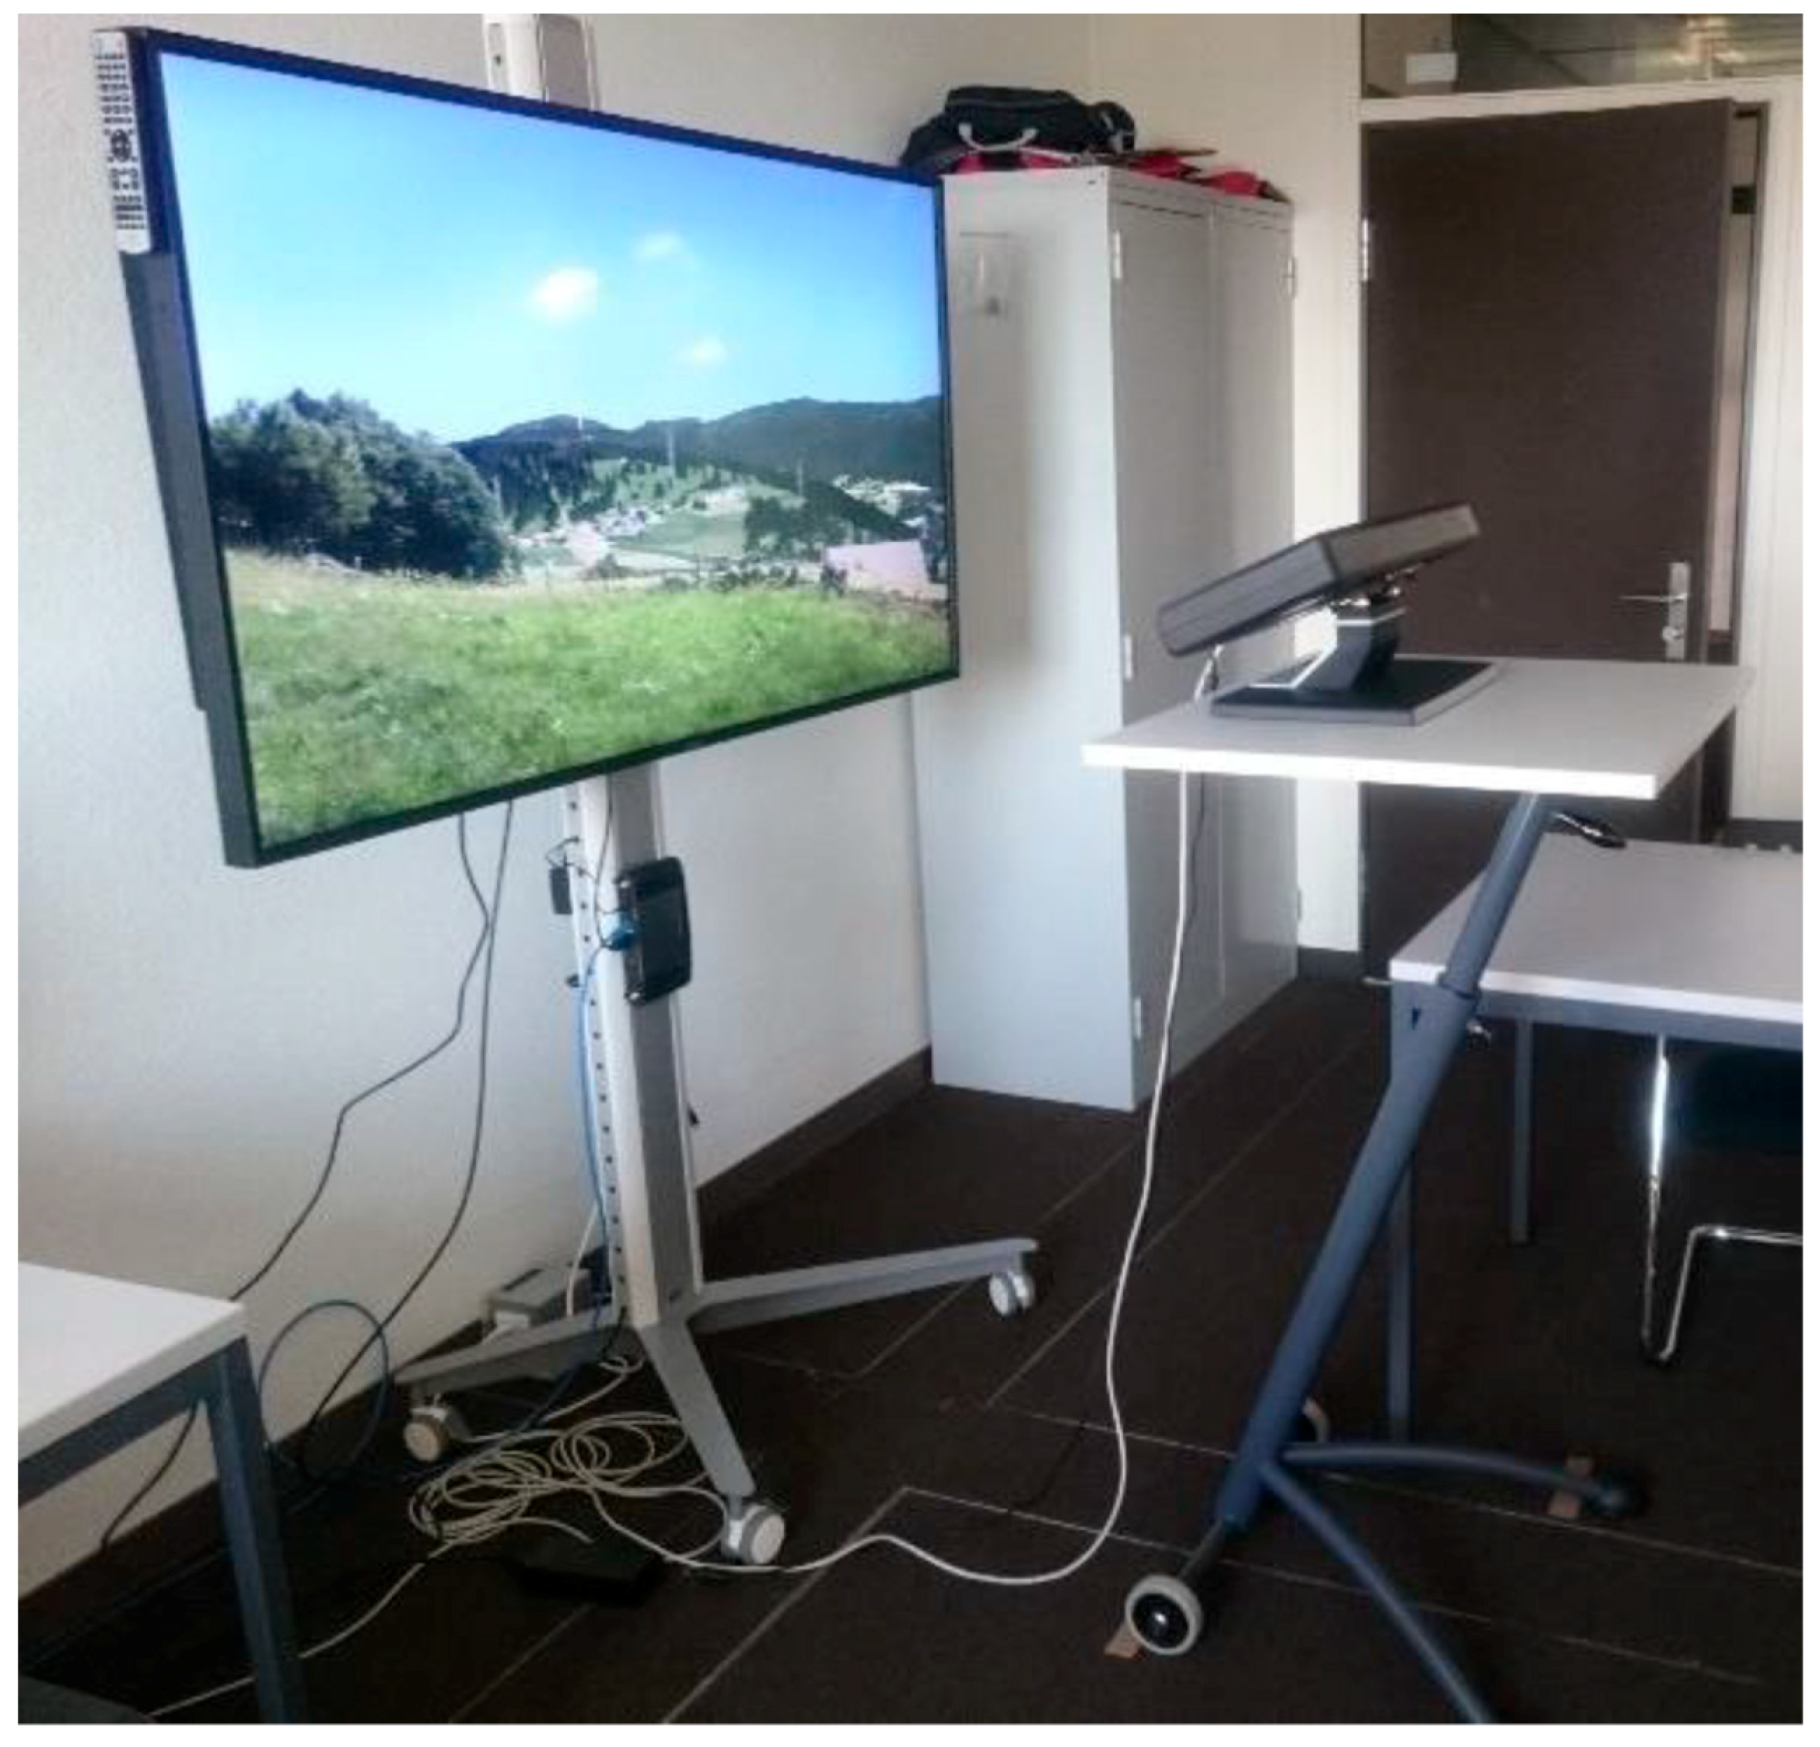
2.3. Setup of the Laboratory
2.4. Preliminary Study
2.5. Questionnaire
2.6. Procedure of the Main Study
2.7. Design and Analyses
3. Results
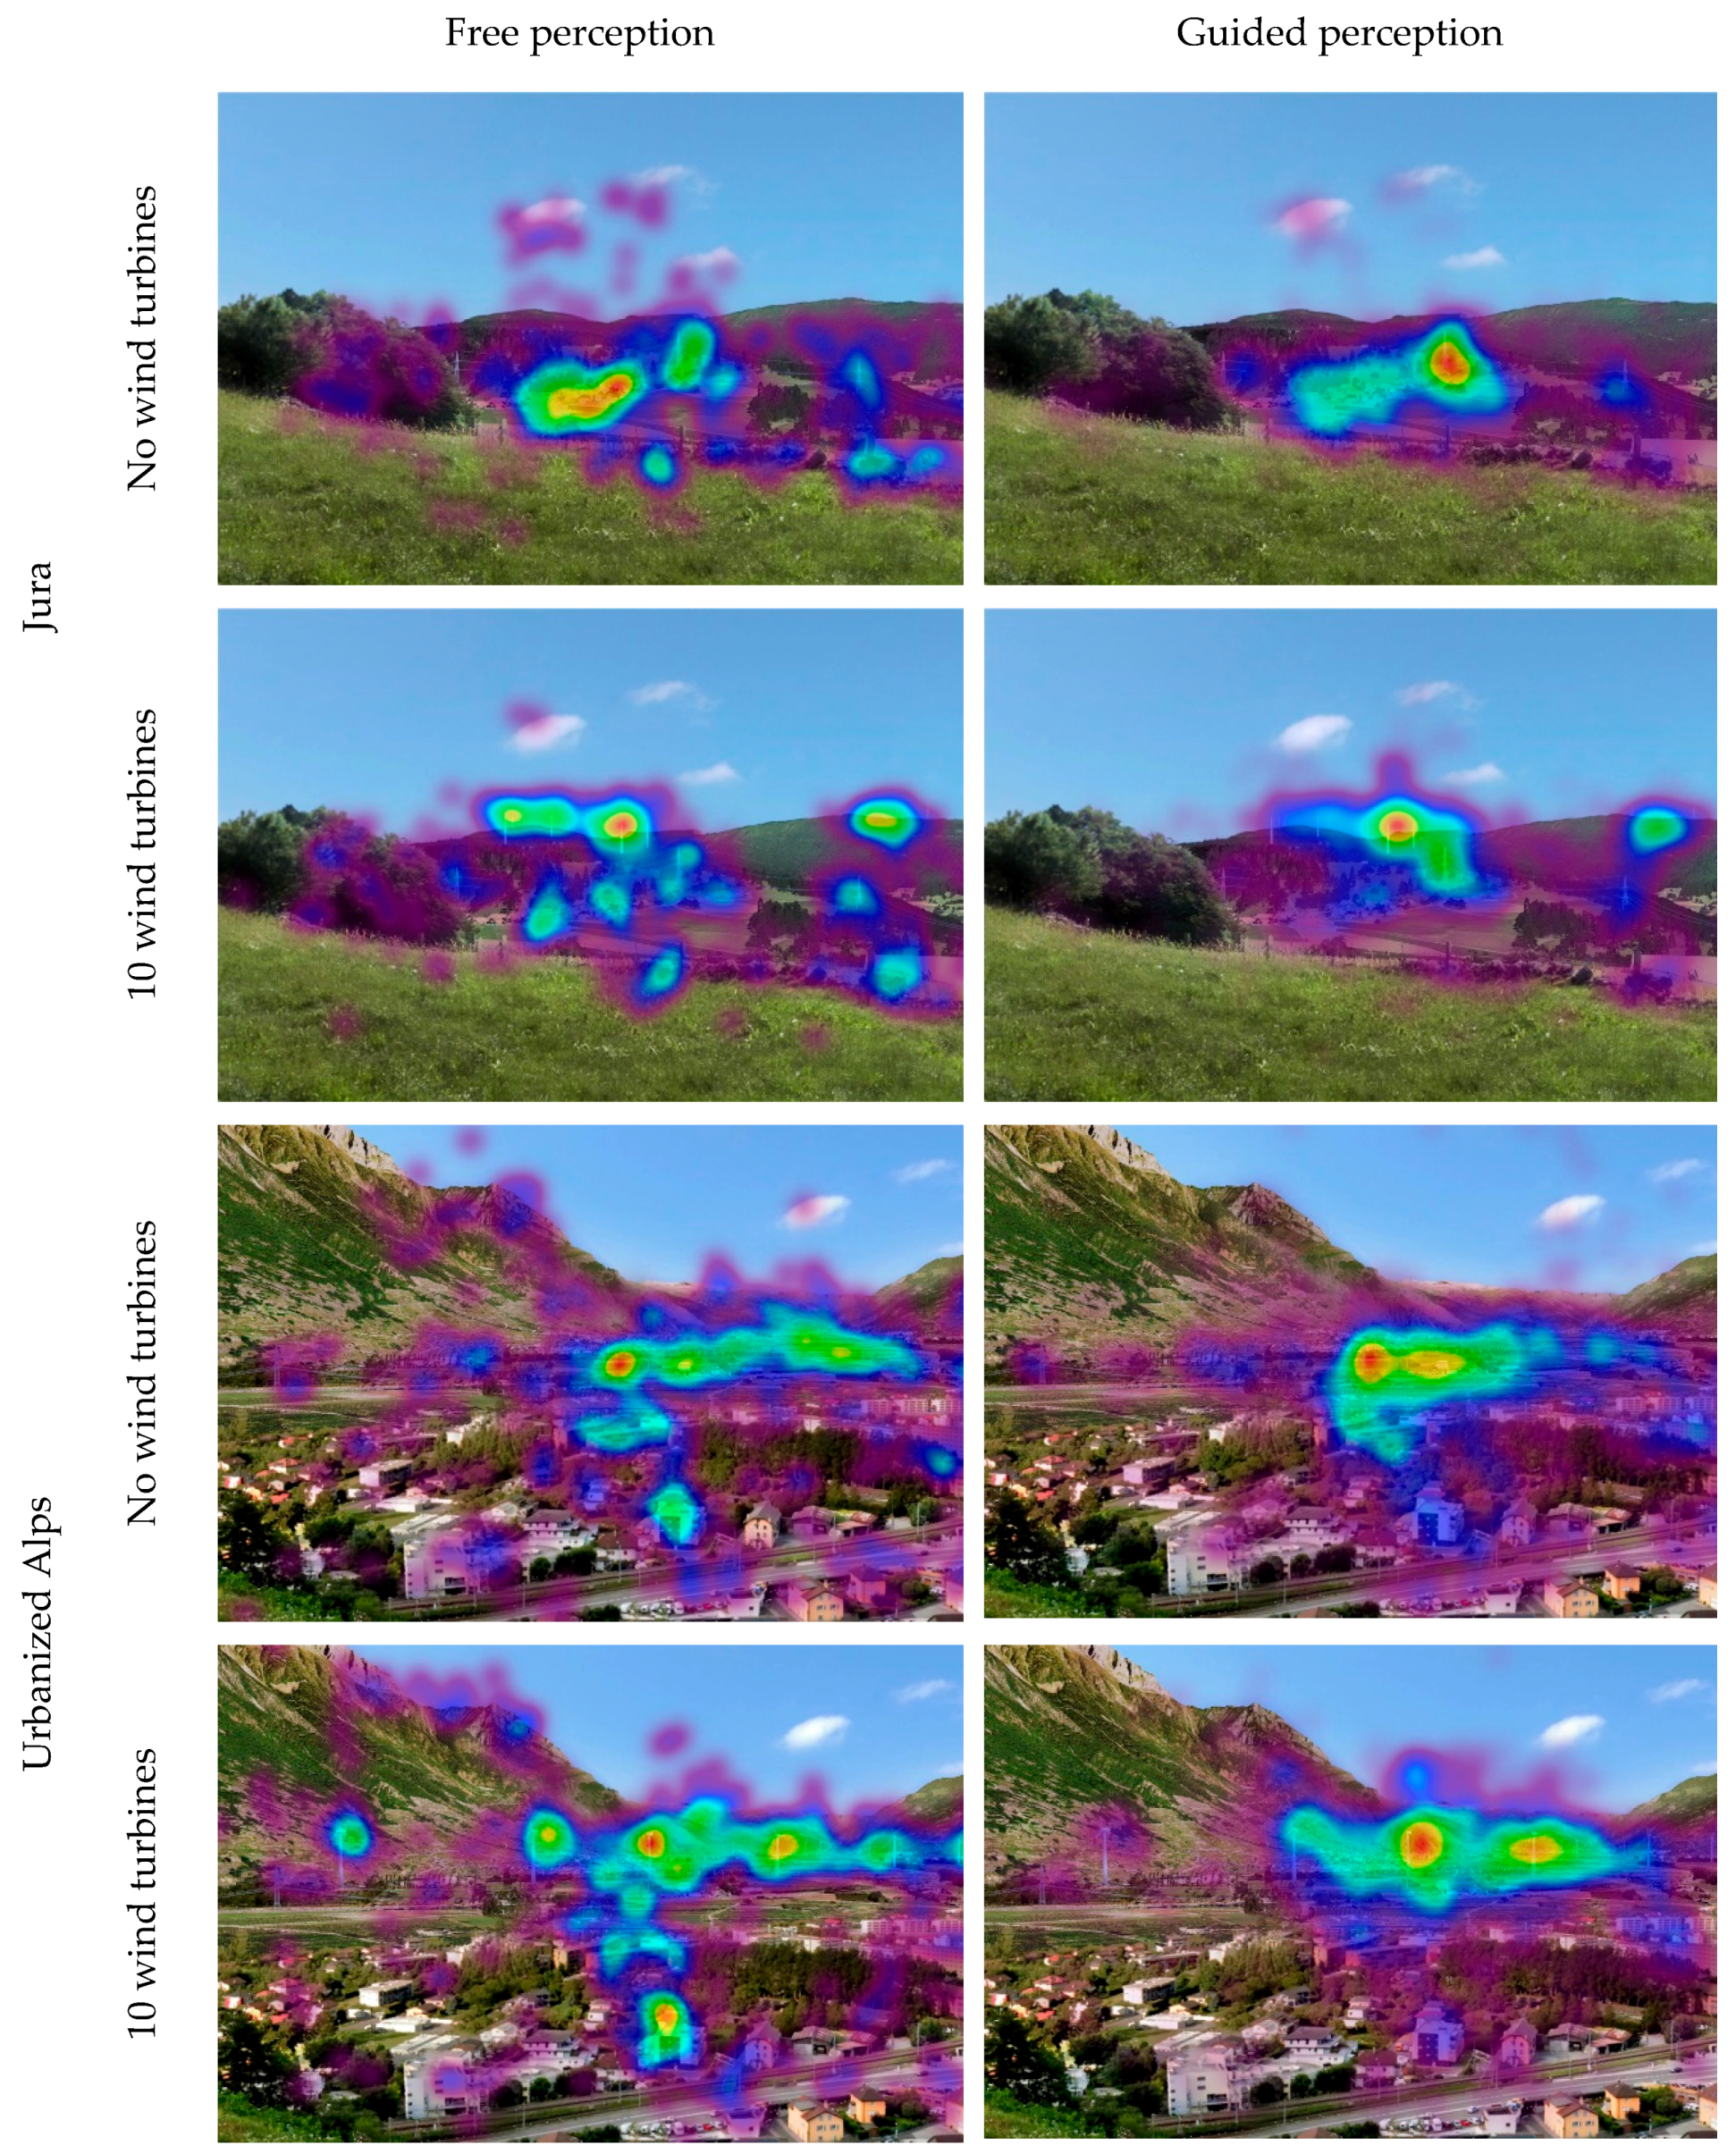
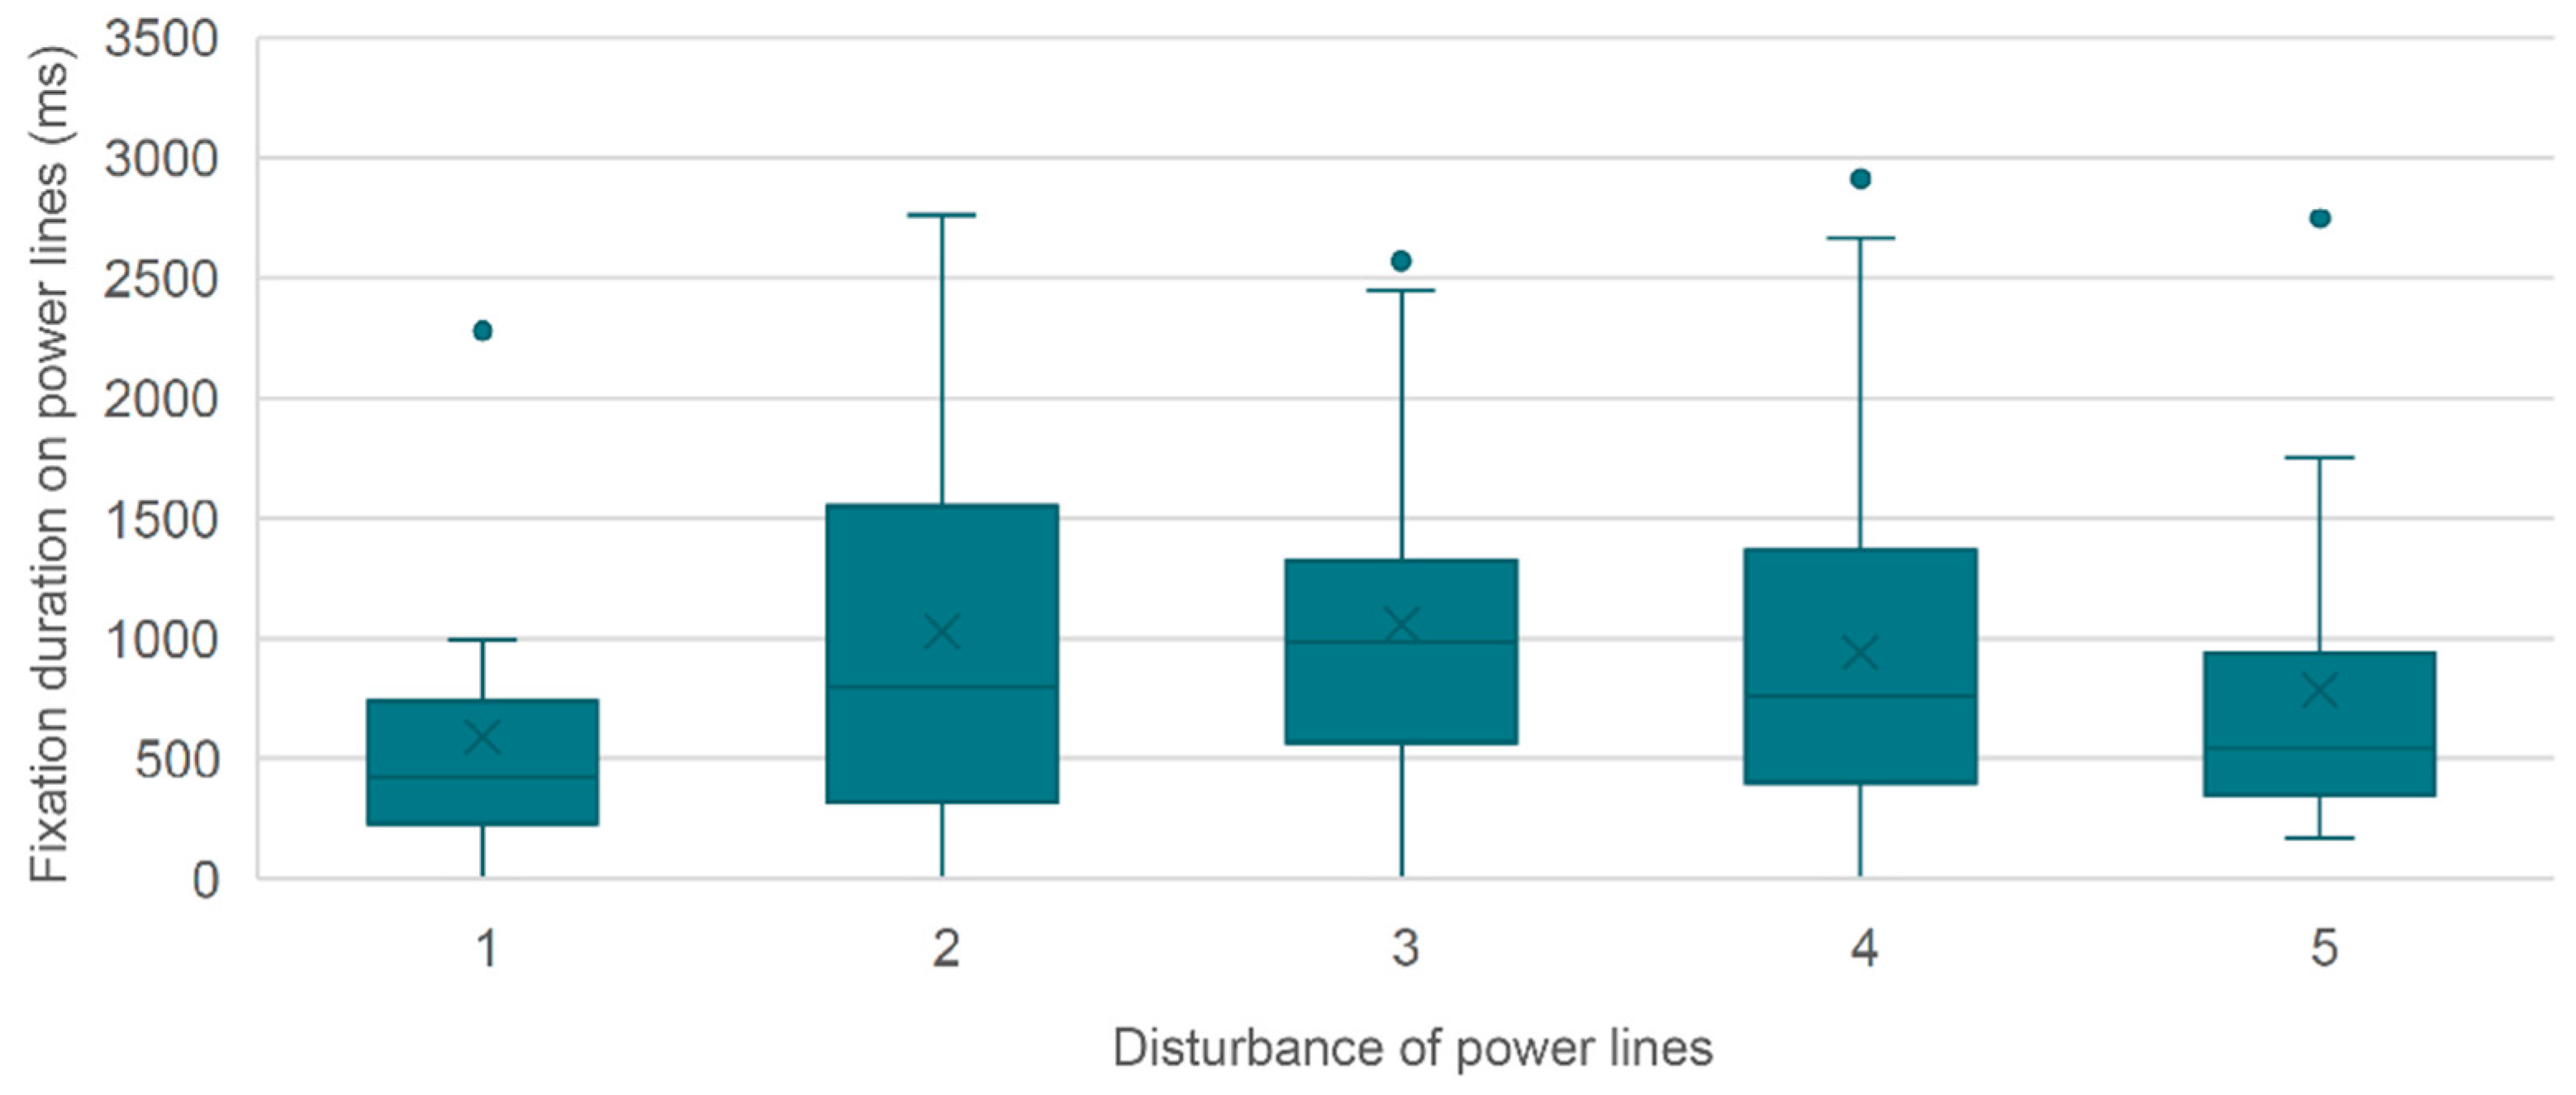
3.1. Attention to Power Lines and Their Perceived Disturbance
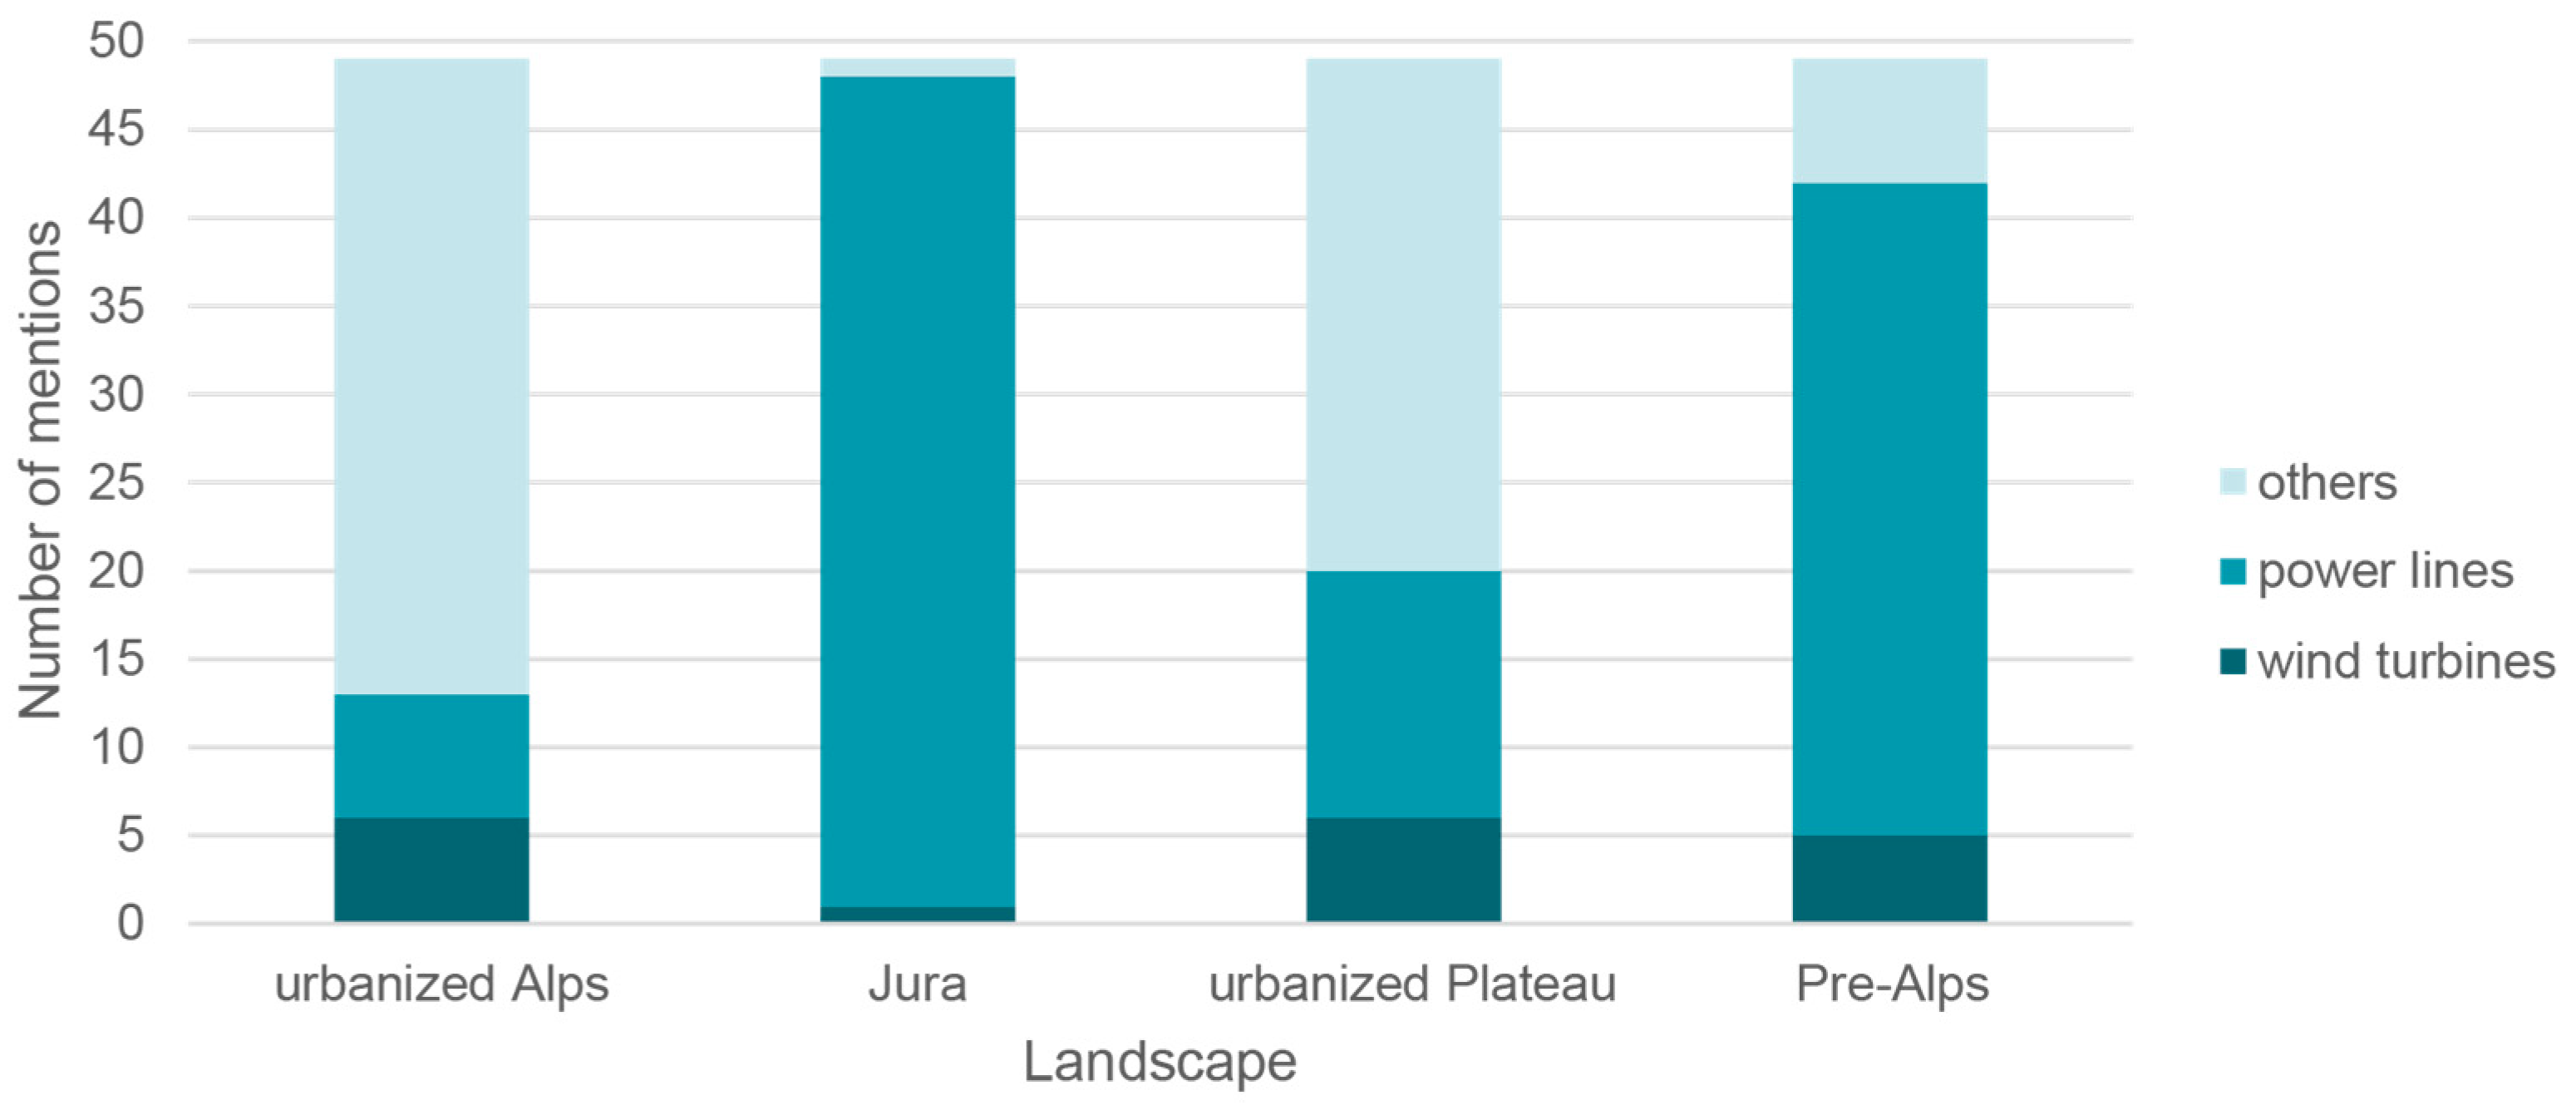
3.2. Landscape Type, Fixation Times and Perceived Disturbance of Power Lines
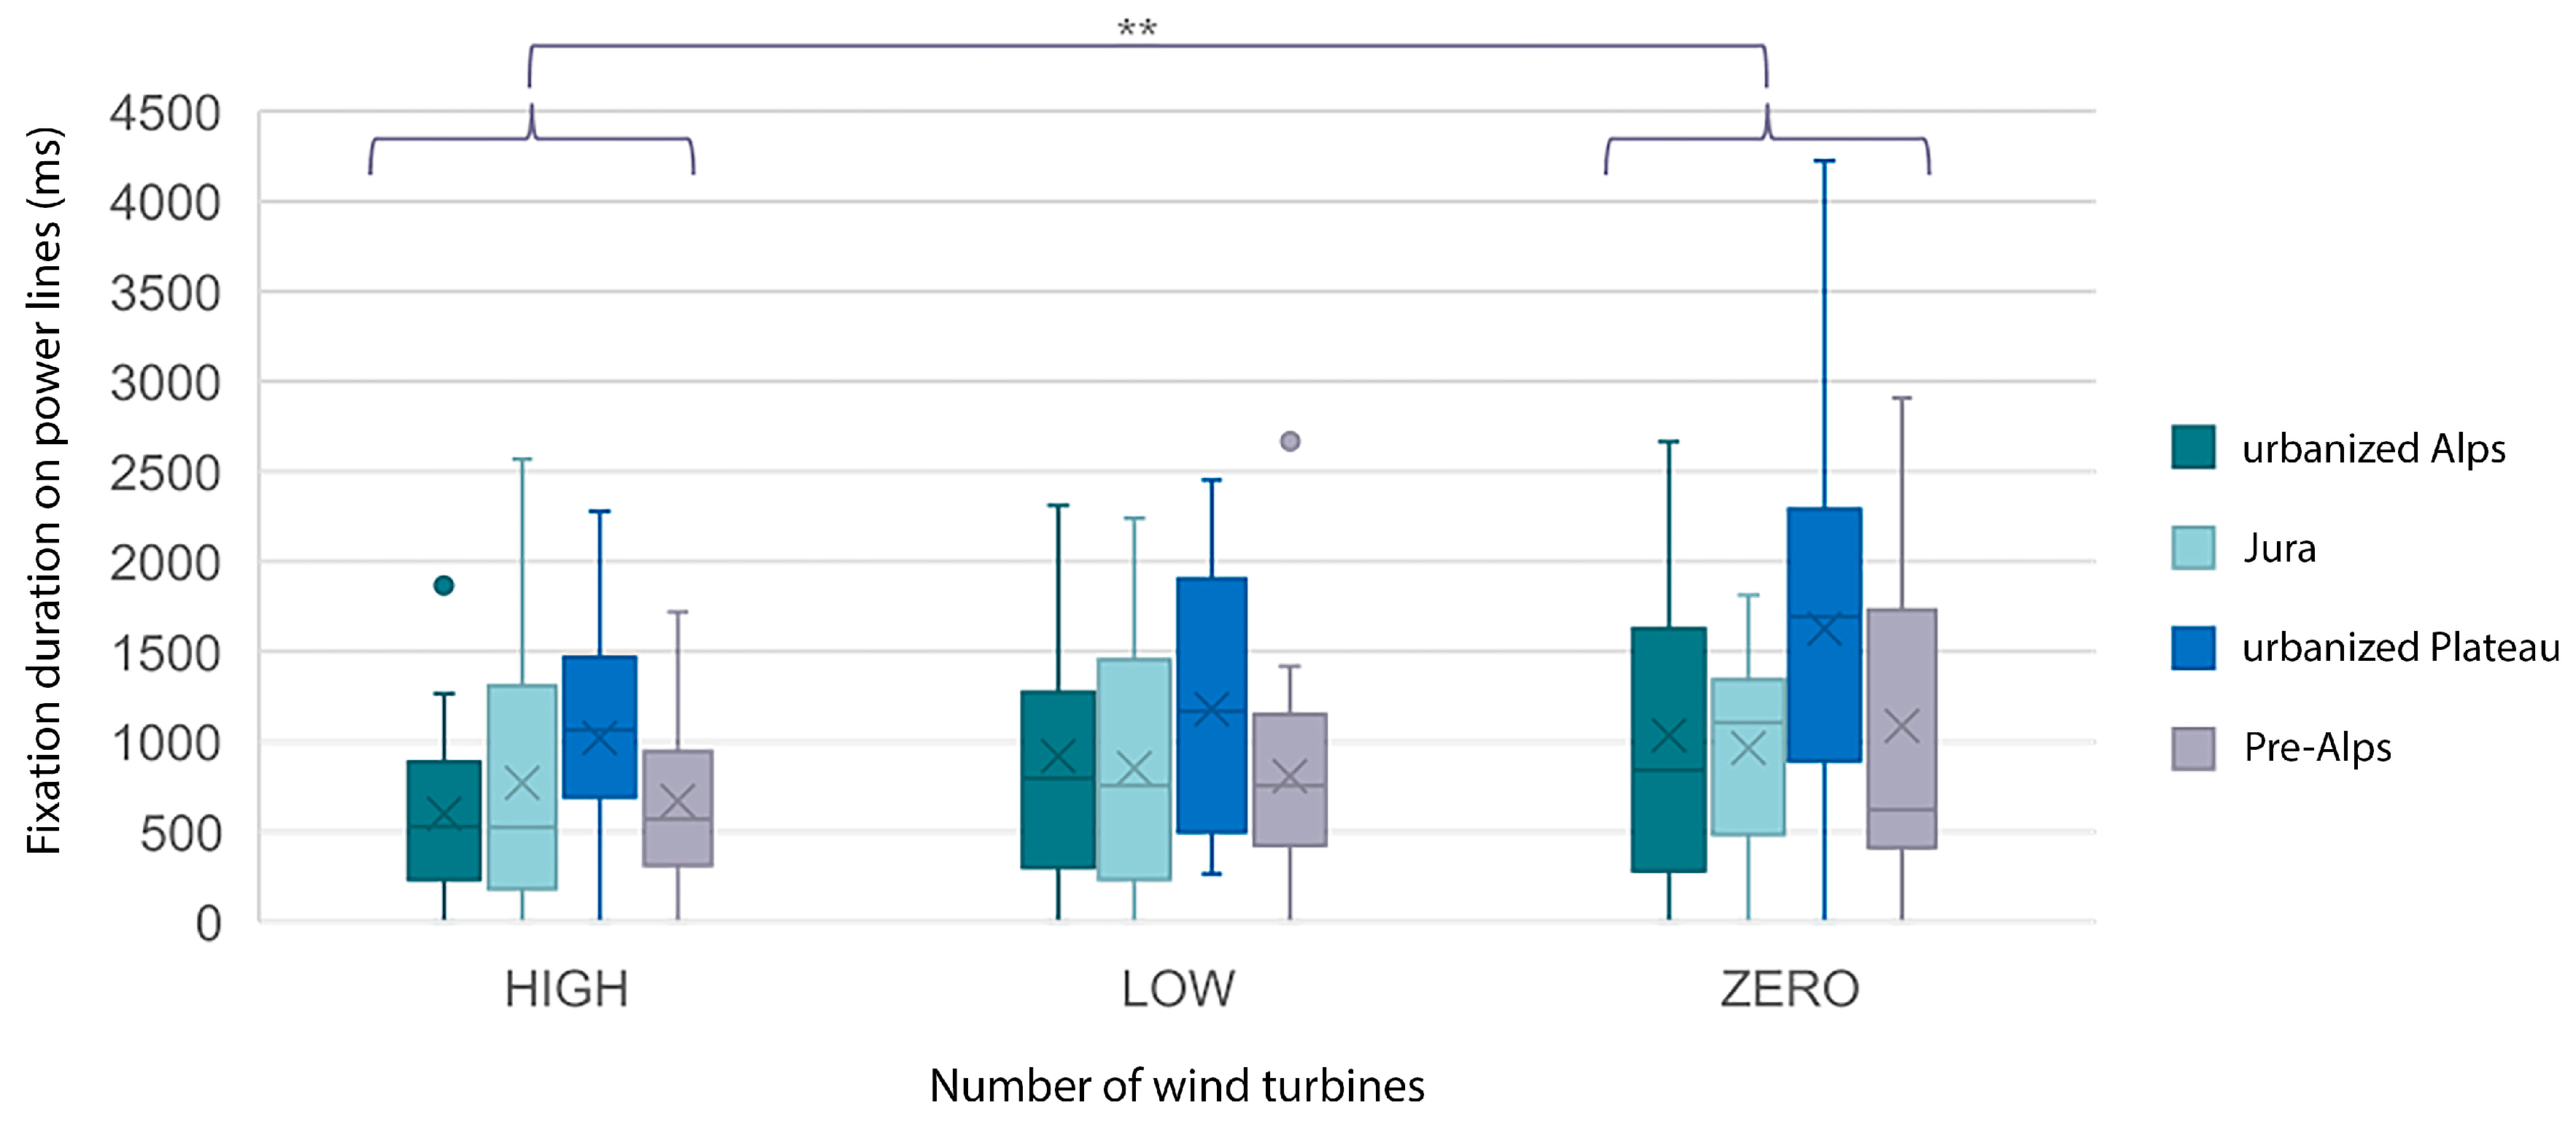
3.3. Fixation Time on Power Lines and Amount of Wind Turbines
4. Discussion and Conclusions
Author Contributions
Funding
Acknowledgments
Conflicts of Interest
Appendix A

| Number of Wind Turbines | Landscape Type | AOI Power Lines | AOI Wind Turbines | ||||||
|---|---|---|---|---|---|---|---|---|---|
| Fixations Duration (ms) | Number of Fixations | Fixations Duration (ms) | Number of Fixations | ||||||
| Average | Standard Deviation | Average | Standard Deviation | Average | Standard Deviation | Average | Standard Deviation | ||
| HIGH (10 WT) | ALPVAL | 601.24 | 495.84 | 1.88 | 1.36 | 2548.48 | 1743.52 | 7.87 | 4.06 |
| JURA | 770.41 | 746.10 | 2.25 | 1.94 | 3557.48 | 2535.41 | 7.31 | 3.96 | |
| PLATURB | 1020.32 | 653.48 | 2.88 | 2.09 | 1847.94 | 965.60 | 7.19 | 3.56 | |
| PREALP | 673.07 | 470.73 | 2.13 | 1.25 | 2242.04 | 1204.80 | 5.69 | 2.08 | |
| LOW (3 WT) | ALPVAL | 920.12 | 714.60 | 2.19 | 1.32 | 2020.29 | 1221.21 | 6.50 | 4.09 |
| JURA | 853.43 | 749.73 | 2.44 | 1.89 | 1891.61 | 860.59 | 4.63 | 2.06 | |
| PLATURB | 1183.30 | 767.45 | 3.31 | 1.99 | 1586.40 | 975.54 | 4.75 | 1.94 | |
| PREALP | 809.52 | 657.13 | 2.38 | 2.09 | 1149.30 | 847.33 | 2.88 | 2.21 | |
| ZERO (0 WT) | ALPVAL | 1037.79 | 866.05 | 2.69 | 1.99 | 1135.16 | 702.96 | 4.94 | 2.83 |
| JURA | 964.60 | 572.06 | 2.81 | 1.87 | 330.11 | 475.27 | 1.00 | 1.03 | |
| PLATURB | 1627.11 | 1094.49 | 4.38 | 2.60 | 700.08 | 607.43 | 3.19 | 2.45 | |
| PREALP | 1088.58 | 919.64 | 2.81 | 2.00 | 119.45 | 194.28 | 0.38 | 0.61 | |
References
- Smardon, R.; Pasqualetti, M.J. Social acceptance of renewable energy landscapes. In The Renewable Energy Landscape. Preserving Scenic Values in Our Sustainable Future; Apostol, D., Palmer, J., Pasqualetti, M., Smardon, R., Sullivan, R., Eds.; Routledge: London, UK; New York, NY, USA, 2017; pp. 108–142. [Google Scholar]
- Schito, J.; Wissen Hayek, U.; Raubal, M. Enhanced multi criteria decision analysis for planning power transmission lines. In Proceedings of the 10th International Conference on Geographic Information Science (GIScience 2018), Melbourne, Australia, 28–31 August 2018. [Google Scholar] [CrossRef]
- Verbong, G.; Geels, F. The ongoing energy transition: Lessons from a sociotechnical, multi-level analysis of the Dutch electricity system (1960–2004). Energy Policy 2007, 35, 1025–1037. [Google Scholar] [CrossRef]
- Jullier, J. More Acceptance for Power Lines in Switzerland: An Evaluation of the Acceptance Increasing Factors for Transmission Lines in Switzerland. Master’s Thesis, ETH Zurich, Zurich, Switzerland, May 2016. [Google Scholar] [CrossRef]
- Battaglini, A.; Komendantova, N.; Brtnik, P.; Patt, A. Perception of barriers for expansion of electricity grids in the European Union. Energy Policy 2012, 47, 254–259. [Google Scholar] [CrossRef]
- Lienert, P.; Sutterlin, B.; Siegrist, M. The influence of high-voltage power lines on the feelings evoked by different Swiss surroundings. Energy Res. Soc. Sci. 2017, 23 (Suppl. C), 46–59. [Google Scholar] [CrossRef]
- Lienert, P.; Suetterlin, B.; Siegrist, M. Public acceptance of the expansion and modification of high-voltage power lines in the context of the energy transition. Energy Policy 2015, 87, 573–583. [Google Scholar] [CrossRef]
- Ribe, R.G.; Manyoky, M.; Wissen Hayek, U.; Pieren, R.; Heutschi, K.; Grêt-Regamey, A. Dissecting Perceptions of Wind Energy Projects: A Laboratory Experiment Using High-quality Audio-visual Simulations to Analyze Experiential Versus Acceptability Ratings and Information Effects. Landsc. Urban Plan. 2017, 169, 131–147. [Google Scholar] [CrossRef]
- Spielhofer, R.; Fabrikant, S.I.; Rebsamen, J.; Vollmer, M.; Grêt-Regamey, A.; Wissen Hayek, U. 3D Point Clouds for Representing Landscape Change. J. Digit. Landsc. Archit. 2017, 2, 206–213. [Google Scholar] [CrossRef]
- Wissen Hayek, U.; Spielhofer, R.; Grêt-Regamey, A. Preparing 3D Point Clouds as Stimuli for Land-scape Preference Studies: Lessons Learned. J. Digit. Landsc. Archit. 2019, 4. in press. [Google Scholar]
- Ulrich, R.S. Human responses to vegetation and landscapes. Landsc. Urban Plan. 1986, 13, 29–44. [Google Scholar] [CrossRef]
- Maehr, A.M.; Watts, G.R.; Hanratty, J.; Talmi, D. Emotional response to images of wind turbines: A psychophysiological study of their visual impact on the landscape. Landsc. Urban Plan. 2015, 142, 71–79. [Google Scholar] [CrossRef]
- Daniel, T.C. Whither scenic beauty? Visual landscape quality assessment in the 21st century. Landsc. Urban Plan. 2001, 54, 267–281. [Google Scholar] [CrossRef]
- Yu, T.; Behm, H.; Bill, R.; Kang, J. Audio-visual perception of new wind parks. Landsc. Urban Plan. 2017, 165, 1–10. [Google Scholar] [CrossRef]
- Bradley, M.M.; Lang, P.J. The International Affective Picture System (IAPS) in the study of emotion and attention. In Handbook of Emotion Elicitation and Assessment; Coan, J.A., Allen, J.J.B., Eds.; Oxford University Press: Oxford, UK, 2007; pp. 29–46. [Google Scholar]
- Holmqvist, K.; Nyström, M.; Andersson, R.; Dewhurst, R.; Jarodzka, H.; Van de Weijer, J. Eye Tracking: A Comprehensive Guide to Methods and Measures; OUP Oxford: Oxford, UK, 2011. [Google Scholar]
- Hayhoe, M.; Ballard, D. Eye movements in natural behavior. Trends Cogn. Sci. 2005, 9, 188–194. [Google Scholar] [CrossRef] [PubMed]
- Just, M.A.; Carpenter, P.A. A theory of reading: From eye fixations to comprehension. Psychol. Rev. 1980, 87, 329. [Google Scholar] [CrossRef]
- Jacob, R.J.; Karn, K.S. Eye tracking in human-computer interaction and usability research: Ready to deliver the promises. In The Mind’s Eye: Cognitive and Applied Aspects of Eye Movement Research; Elsevier Science BV: North-Holland, Amsterdam, The Netherlands, 2003; pp. 573–605. [Google Scholar]
- Çöltekin, A.; Heil, B.; Garlandini, S.; Fabrikant, S.I. Evaluating the effectiveness of interactive map interface designs: A case study integrating usability metrics with eye-movement analysis. Cartogr. Geogr. Inf. Sci. 2009, 36, 5–17. [Google Scholar] [CrossRef]
- Ooms, K.; De Maeyer, P.; Fack, V. Study of the attentive behavior of novice and expert map users using eye tracking. Cartogr. Geogr. Inf. Sci. 2014, 41, 37–54. [Google Scholar] [CrossRef]
- Kiefer, P.; Giannopoulos, I.; Raubal, M.; Duchowski, A. Eye tracking for spatial research: Cognition, computation, challenges. Spat. Cogn. Comput. 2017, 17, 1–19. [Google Scholar] [CrossRef]
- Duchowski, A.T. Eye Tracking Methodology. Theory and Practice; Springer International Publishing: Cham, Switzerland, 2017. [Google Scholar]
- Orquin, J.L.; Loose, S.M. Attention and choice: A review on eye movements in decision making. Acta Psychol. 2013, 144, 190–206. [Google Scholar] [CrossRef] [PubMed]
- DeAngelus, M.; Pelz, J.B. Top-down control of eye movements: Yarbus revisited. Vis. Cogn. 2009, 17, 790–811. [Google Scholar] [CrossRef]
- Itti, L. Models of bottom-up attention and saliency. Neurobiol. Atten. 2005, 576–582. [Google Scholar] [CrossRef]
- Batel, S.; Devine-Wright, P.; Wold, L.; Egeland, H.; Jacobsen, G.; Aas, O. The role of (de-) essentialisation within siting conflicts: An interdisciplinary approach. J. Environ. Psychol. 2015, 44, 149–159. [Google Scholar] [CrossRef]
- Dupont, L.; Antrop, M.; Van Eetvelde, V. Eye-tracking Analysis in Landscape Perception Research: Influence of Photograph Properties and Landscape Characteristics. Landsc. Res. 2014, 39, 417–432. [Google Scholar] [CrossRef]
- Dupont, L.; Ooms, K.; Duchowski, A.T.; Antrop, M.; Van Eetvelde, V. Investigating the visual exploration of the rural-urban gradient using eye-tracking. Spat. Cogn. Comput. 2017, 17, 65–88. [Google Scholar] [CrossRef]
- LIS Pro 3D–Point Cloud Processing. Available online: https://www.laserdata.at/lis_pro_3d.html (accessed on 18 April 2019).
- RiSCAN PRO 2.0. Available online: http://www.riegl.com/products/software-packages/riscan-pro (accessed on 18 April 2019).
- Adobe Photoshop. Available online: https://www.adobe.com/de/products/photoshop.html (accessed on 18 April 2019).
- Cinema 4D. Available online: https://www.maxon.net/de/produkte/cinema-4d/cinema-4d/ (accessed on 18 April 2019).
- LAZPOINT 2. Available online: https://cinemaplugins.com/c4d-plugins/lazpoint/ (accessed on 18 April 2019).
- Manyoky, M.; Wissen Hayek, U.; Heutschi, K.; Pieren, R.; Grêt-Regamey, A. Developing a GIS-based visual-acoustic 3D simulation for wind farm assesment. ISPRS Int. J. Geo-Inf. 2014, 3, 29–48. [Google Scholar] [CrossRef]
- Voßkühler, A.; Nordmeier, V.; Kuchinke, L.; Jacobs, A.M. OGAMA (Open Gaze and Mouse Analyzer): Open-source software designed to analyze eye and mouse movements in slideshow study designs. Behav. Res. Methods 2008, 40, 1150–1162. [Google Scholar] [CrossRef] [PubMed]
- Salvucci, D.D.; Goldberg, J.H. Identifying Fixations and Saccades in Eye-Tracking Protocols. In Proceedings of the Eye Tracking Research and Applications Symposium (ETRA ’00), Palm Beach Gardens, FL, USA, 6–8 November 2000; pp. 71–78. [Google Scholar] [CrossRef]
- ClassApps. SelectSurvey.NET Documentation. Available online: http://www.classapps.com/support_documentation.aspx (accessed on 18 April 2019).
- Dupont, L.; Ooms, K.; Antrop, M.; Van Eetvelde, V. Comparing saliency maps and eye-tracking focus maps: The potential use in visual impact assessment based on landscape photographs. Landsc. Urban Plan. 2016, 148, 17–26. [Google Scholar] [CrossRef]
- Downloading IBM SPSS Statistics 25. Available online: https://www-01.ibm.com/support/docview.wss?uid=swg24043678 (accessed on 18 April 2019).
- Cottet, M.; Vaudor, L.; Tronchère, H.; Roux-Michollet, D.; Augendre, M.; Brault, V. Using gaze behavior to gain insights into the impacts of naturalness on city dwellers’ perceptions and valuation of a landscape. J Environ. Psychol. 2018, 60, 9–20. [Google Scholar] [CrossRef]
- TOBII VR. Discover New Possibilities with Eye Tracking in VR. Available online: https://vr.tobii.com/ (accessed on 18 April 2019).
- Viewpointsystem. The VPS 19 Experience. Available online: https://viewpointsystem.com/en/products/ (accessed on 18 April 2019).


| 1. Perception of the landscape scene | |
| |
| 2. Perception and acceptance of power lines and wind turbines | |
| |
| 3. Attitudes | |
| |
| 4. Sociodemographic aspects | |
| |
© 2019 by the authors. Licensee MDPI, Basel, Switzerland. This article is an open access article distributed under the terms and conditions of the Creative Commons Attribution (CC BY) license (http://creativecommons.org/licenses/by/4.0/).
Share and Cite
Wissen Hayek, U.; Müller, K.; Göbel, F.; Kiefer, P.; Spielhofer, R.; Grêt-Regamey, A. 3D Point Clouds and Eye Tracking for Investigating the Perception and Acceptance of Power Lines in Different Landscapes. Multimodal Technol. Interact. 2019, 3, 40. https://doi.org/10.3390/mti3020040
Wissen Hayek U, Müller K, Göbel F, Kiefer P, Spielhofer R, Grêt-Regamey A. 3D Point Clouds and Eye Tracking for Investigating the Perception and Acceptance of Power Lines in Different Landscapes. Multimodal Technologies and Interaction. 2019; 3(2):40. https://doi.org/10.3390/mti3020040
Chicago/Turabian StyleWissen Hayek, Ulrike, Kilian Müller, Fabian Göbel, Peter Kiefer, Reto Spielhofer, and Adrienne Grêt-Regamey. 2019. "3D Point Clouds and Eye Tracking for Investigating the Perception and Acceptance of Power Lines in Different Landscapes" Multimodal Technologies and Interaction 3, no. 2: 40. https://doi.org/10.3390/mti3020040
APA StyleWissen Hayek, U., Müller, K., Göbel, F., Kiefer, P., Spielhofer, R., & Grêt-Regamey, A. (2019). 3D Point Clouds and Eye Tracking for Investigating the Perception and Acceptance of Power Lines in Different Landscapes. Multimodal Technologies and Interaction, 3(2), 40. https://doi.org/10.3390/mti3020040