Tango vs. HoloLens: A Comparison of Collaborative Indoor AR Visualisations Using Hand-Held and Hands-Free Devices

Abstract
:1. Introduction
2. Related Work
3. User Study
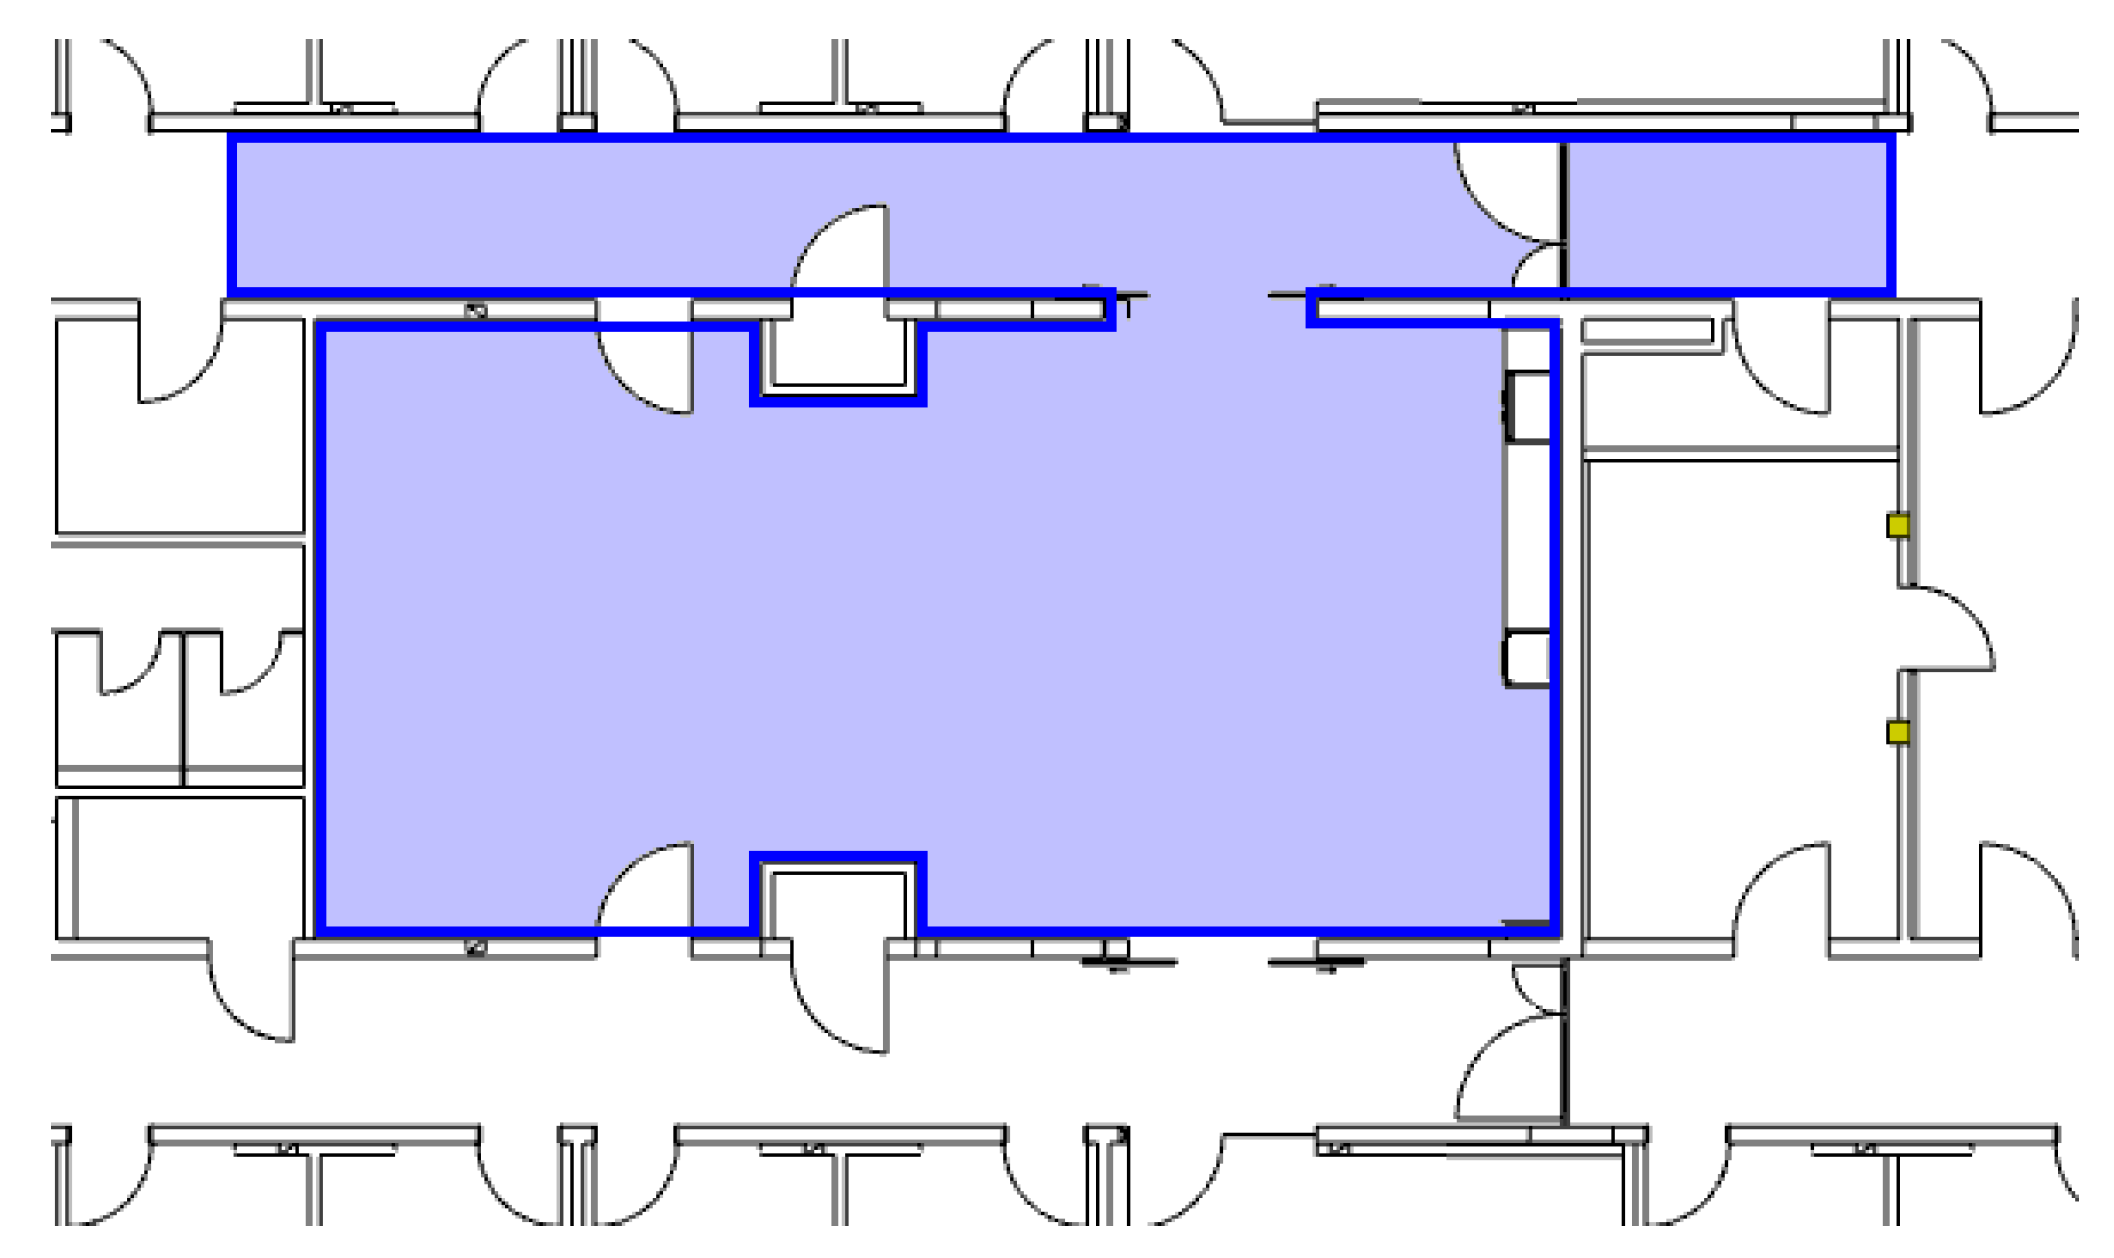
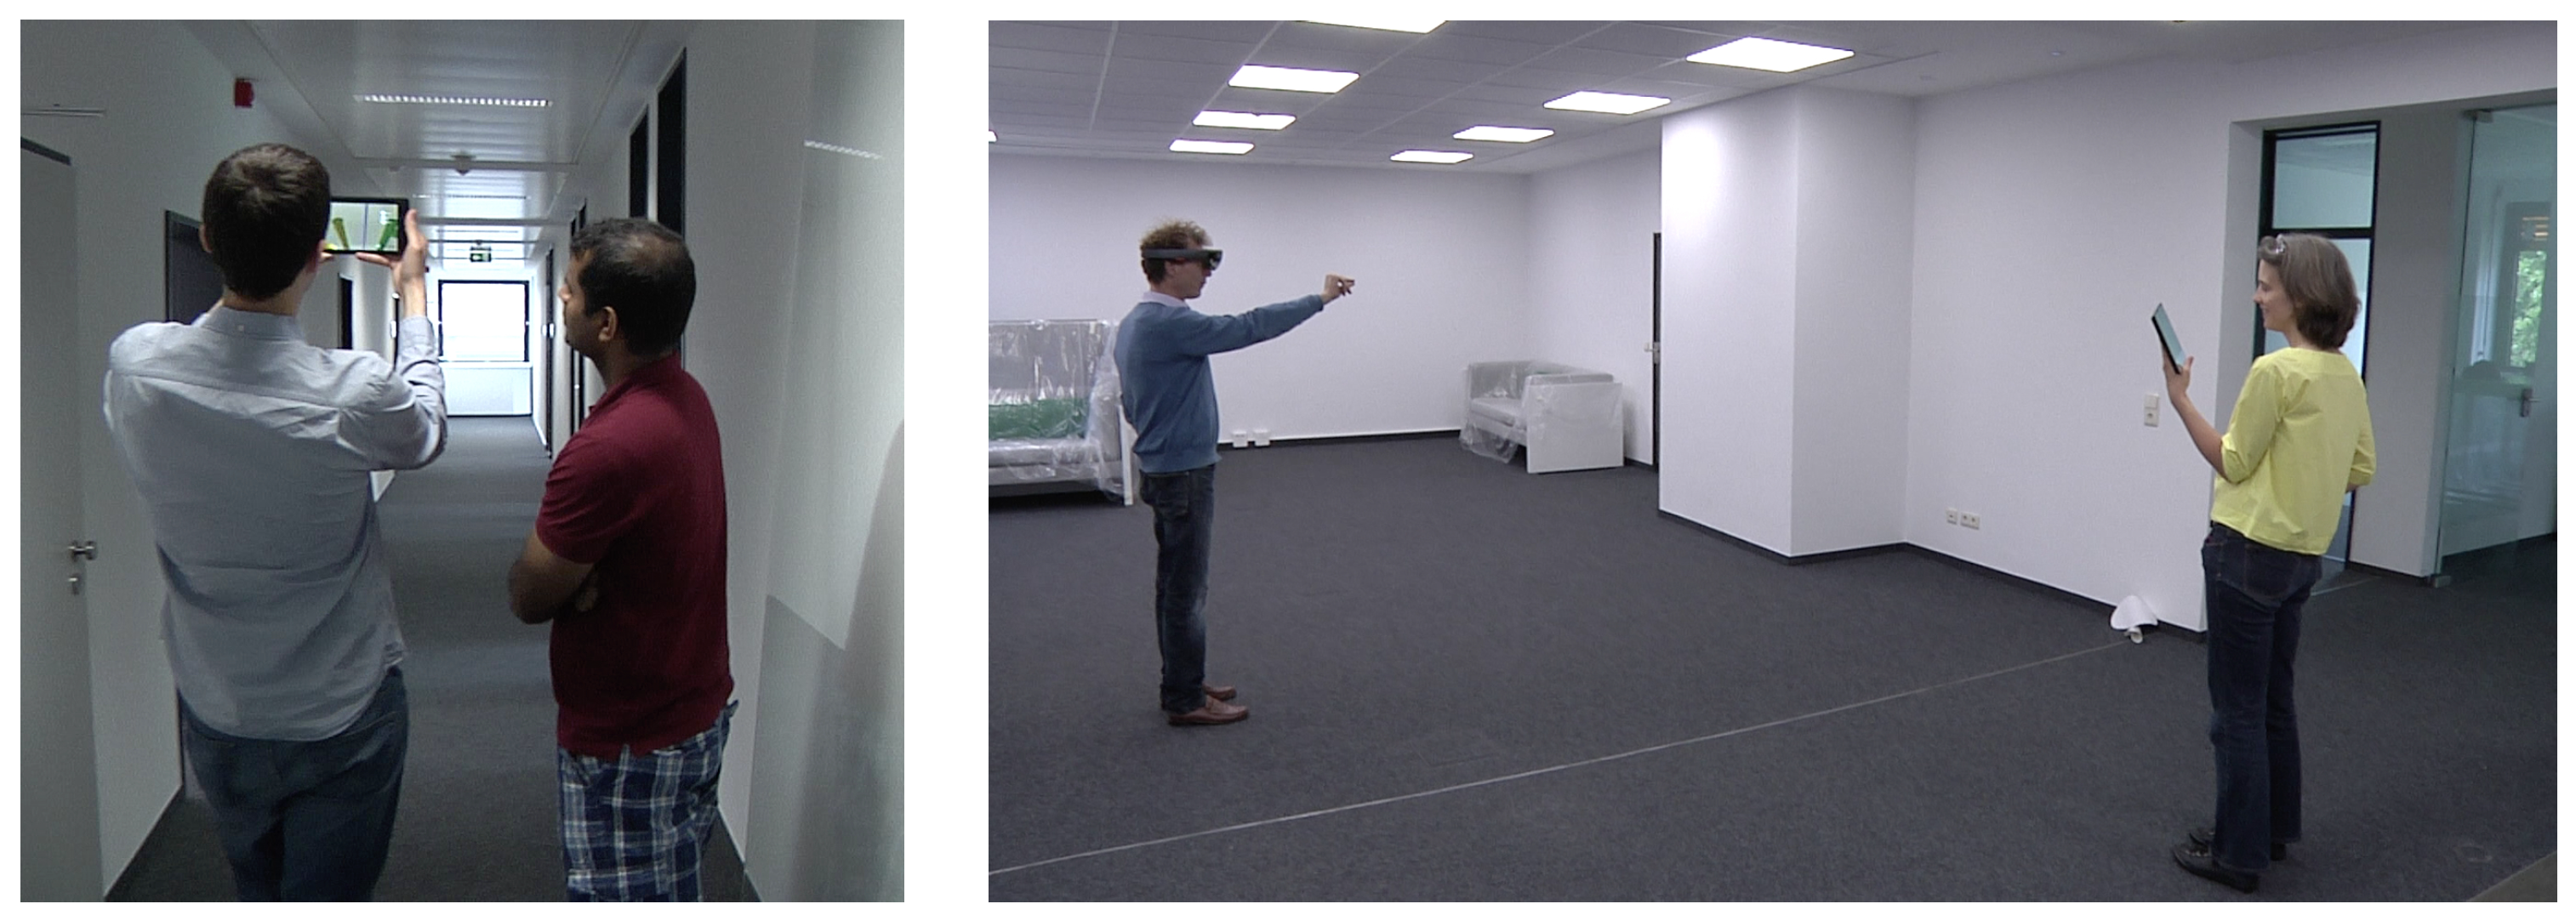
3.1. Setup
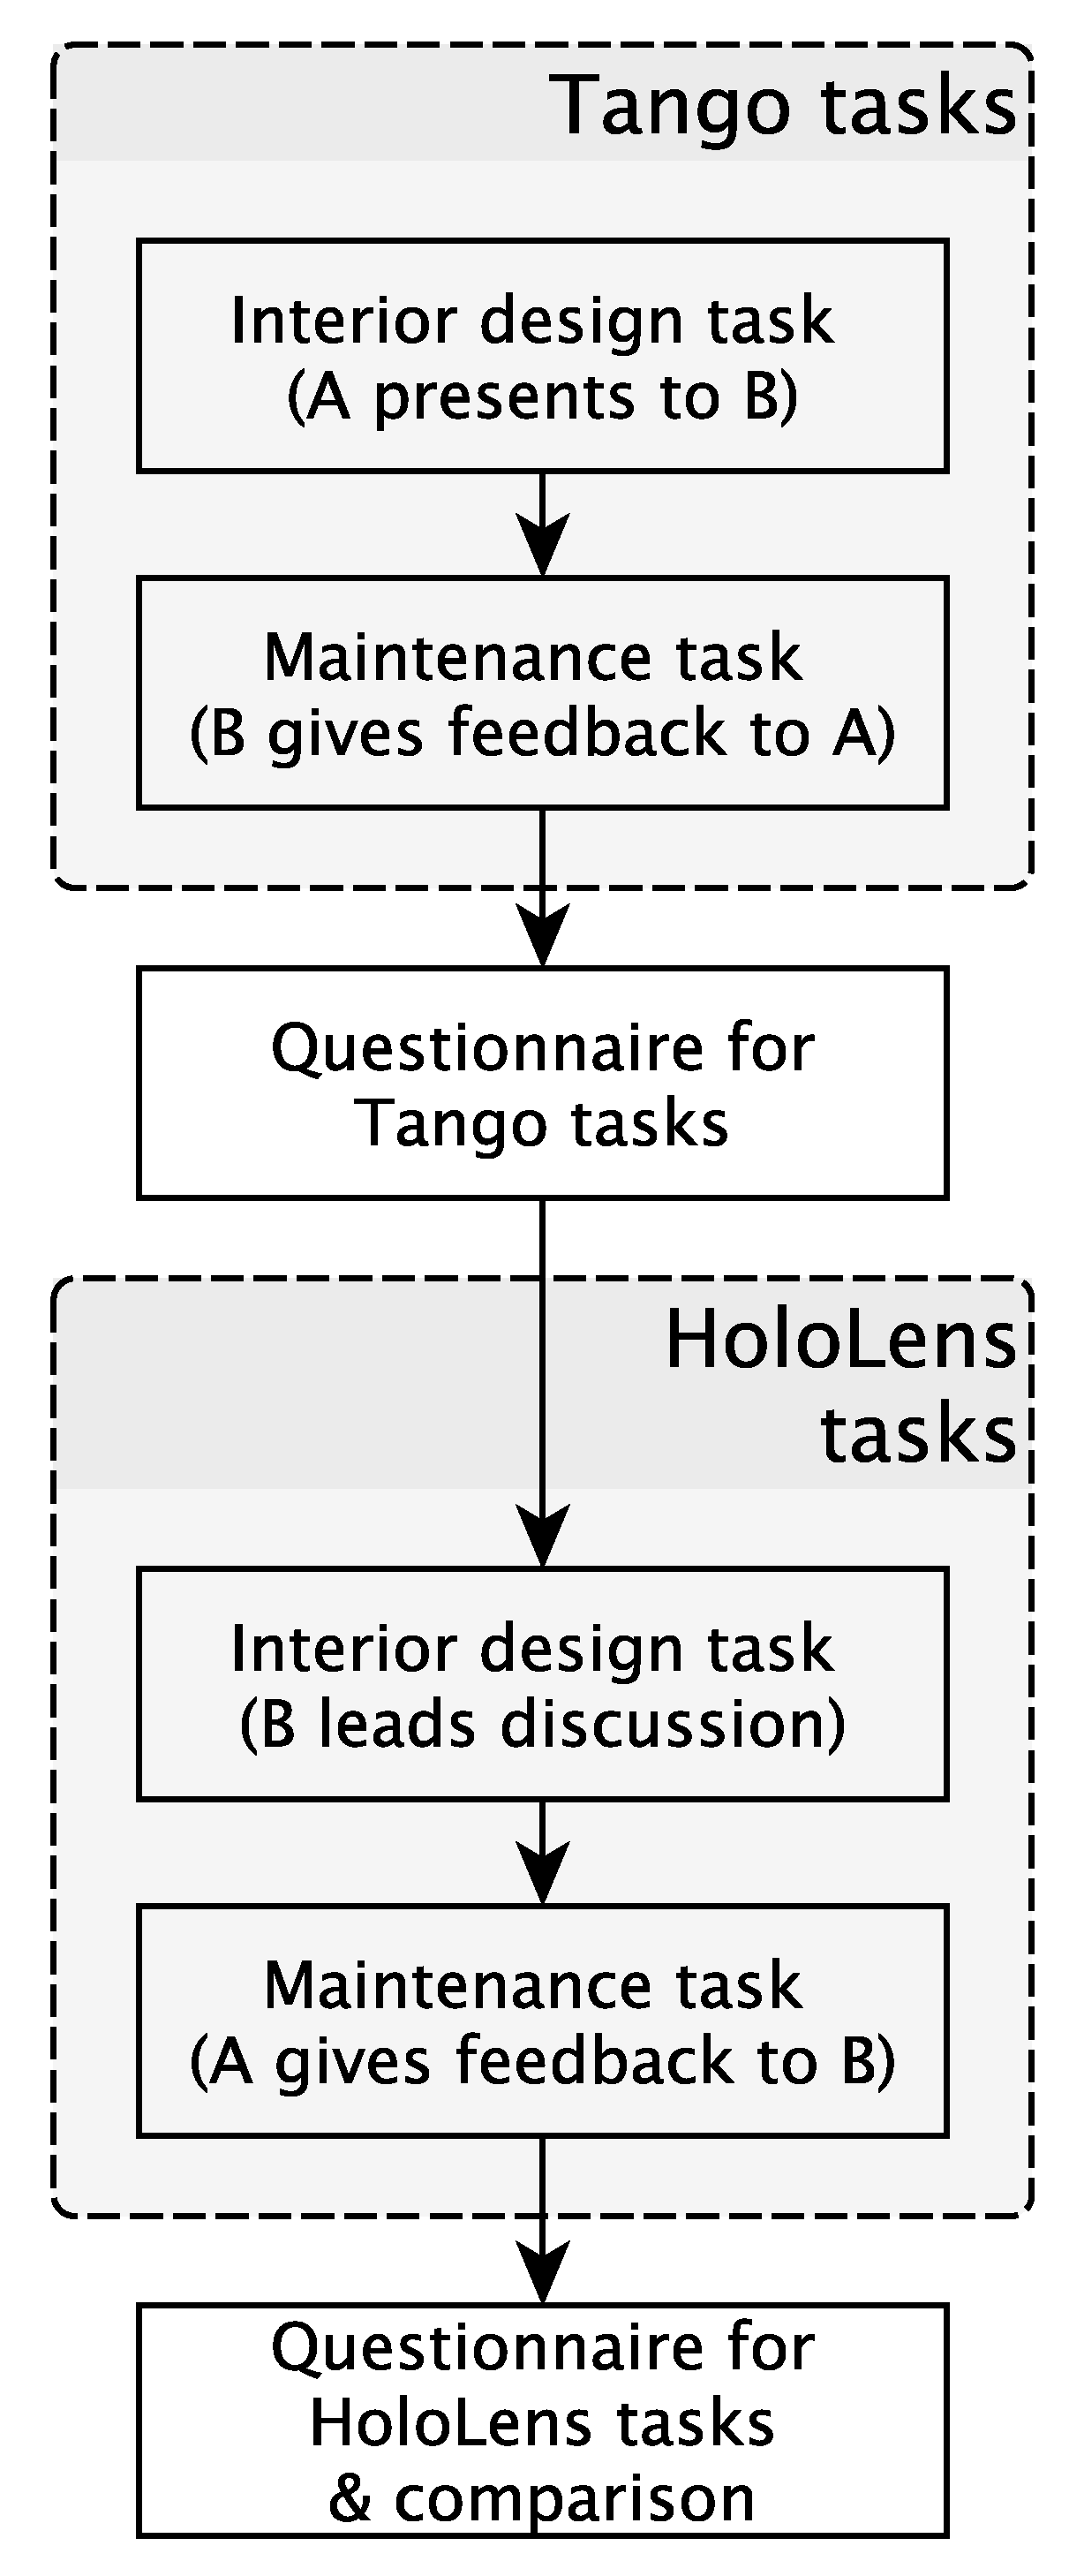
3.2. Tasks
3.3. Method
4. Results
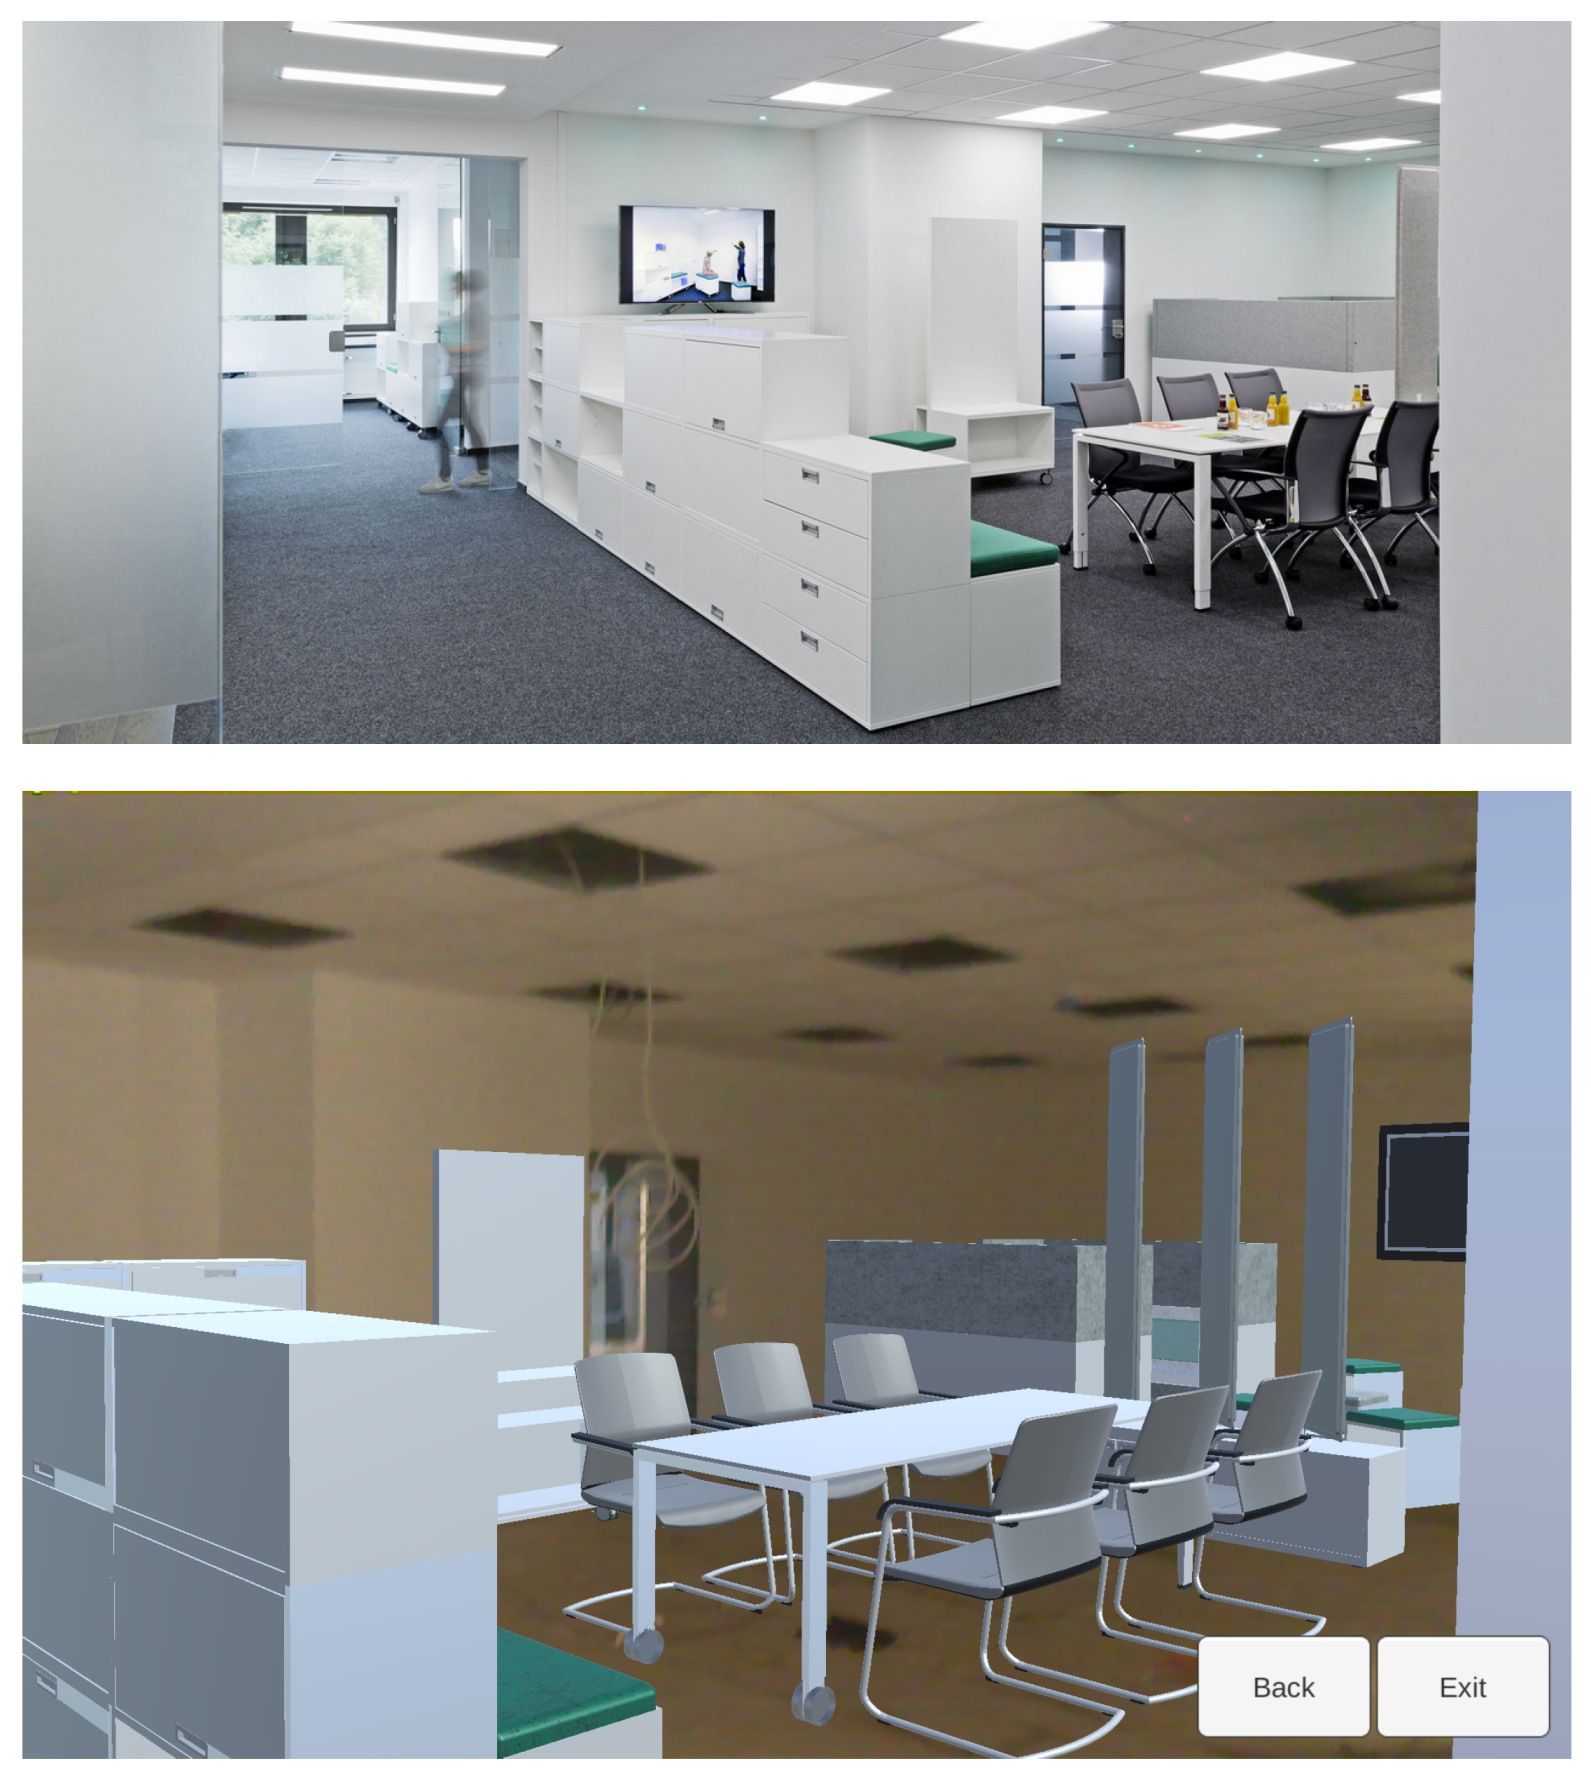
4.1. Interior Planning
- The usefulness of the wirelessly connected Surface tablet was hampered by the inherent transmission lag between the HoloLens and the Surface, which was about 4 s (for encoding, transmission, decoding, display).This severely hindered collaboration in this co-located setting and was mentioned by several participants.
- The Surface user had no control about his view-point and angle, as it was a mere mirroring of the HoloLens view. It was mentioned that “it would be great if the person with the tablet were not constrained to see what the glasses are pointing at”.
4.2. Maintenance
- coarser positioning precision (or higher requirements?) in this task
- handicapped depth perception (on Tango) and 3D-effect at the ceiling, therefore it was hard to estimate distances, sizes, and depth ordering
- offsets of the 3D models of about 30 cm are irritating, e.g., virtual shelves that appear to be placed in the wall
- overarm work is considered to be less comfortable, especially when pointing at the ceiling with a tablet device
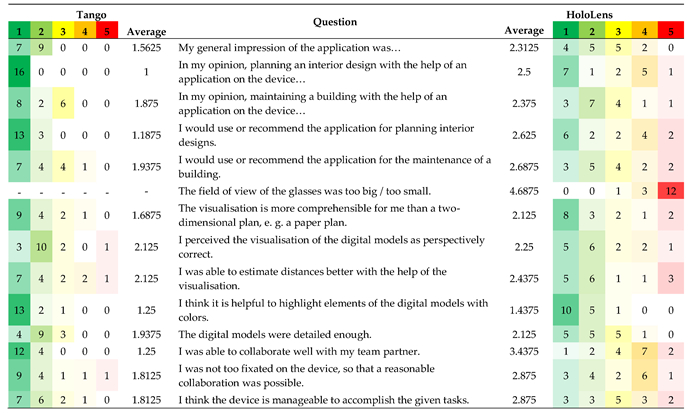
- the Field of view (FOV) of the HoloLens is much too small/to a lesser extent also the display of the Tango tablet was estimated to be too small
- measurements should rather be made in a 2D plan
- missing caption or further textual information on the 3D models
- laser-pointer (a.k.a. ray-casting) would be handy for working with pipes/hard to reach objects;
- making correspondences between objects, virtual switches (and the missing caption) clearer through consistent use of colours;
- providing more detailed information on demand, e.g., for wiring and ceiling material.
4.3. Comparing the Devices on Task Level
- (a)
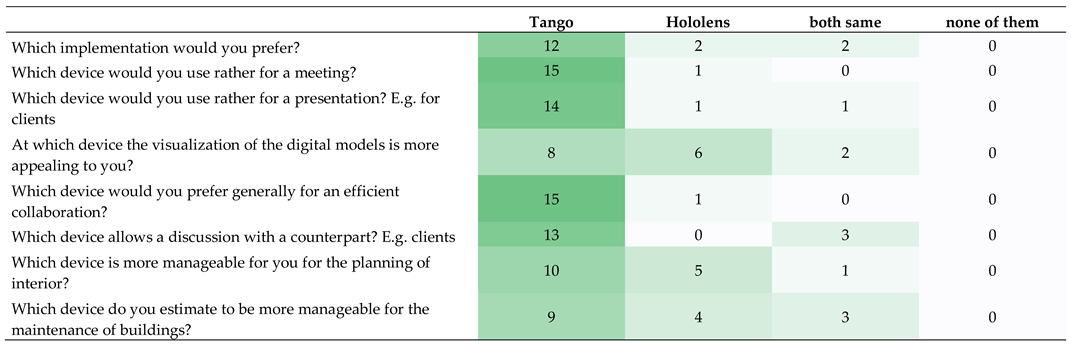
- Interior planning tasks were favoured on the Tango tablet (10 participants), with five participants preferring HoloLens glasses, and one stating that they were both equally well suited.
- (b)
- Building maintenance tasks were also favoured on the Tango tablet (nine participants), with five participants preferring HoloLens, and three stating that they were both equally well suited.
4.4. Judging the Devices
4.5. Wearing Smartglasses with Spectacles
5. Discussion
6. Conclusions and Future Work
Author Contributions
Funding
Acknowledgments
Conflicts of Interest
Abbreviations
| AR | Augmented Reality |
| BIM | Building Information Modeling |
| CAVE | Cave Automatic Virtual Environment |
| FOV | Field of View |
| GPS | Global Positioning System |
| GPU | Graphics Processing Unit |
| GUI | Graphical User Interface |
| HMD | Head Mounted Display |
| PDA | Personal Digital Assistant |
| UMPC | Ultra Mobile Personal Computer |
| VR | Virtual Reality |
References
- Google. Google Tango —Developer Overview. 2017. Available online: https://web.archive.org/web/20170210154646/developers.google.com/tango/developer-overview (accessed on 22 March 2019).
- Microsoft. Microsoft HoloLens | Mixed Reality Technology for Business. 2019. Available online: https://www.microsoft.com/en-us/hololens (accessed on 22 March 2019).
- Long, S.; Aust, D.; Abowd, G.; Atkeson, C. Cyberguide: Prototyping Context-aware Mobile Applications. In Proceedings of the Conference Companion on Human Factors in Computing Systems (CHI ’96), Vancouver, BC, Canada, 13–18 April 1996; ACM: New York, NY, USA, 1996; pp. 293–294. [Google Scholar] [CrossRef]
- Feiner, S.; MacIntyre, B.; Hollerer, T.; Webster, A. A touring machine: Prototyping 3D mobile augmented reality systems for exploring the urban environment. In Proceedings of the Digest of Papers: First International Symposium on Wearable Computers, Cambridge, MA, USA, 13–14 October 1997; pp. 74–81. [Google Scholar] [CrossRef]
- Thomas, B.; Close, B.; Donoghue, J.; Squires, J.; Bondi, P.D.; Piekarski, W. First Person Indoor/Outdoor Augmented Reality Application: ARQuake. Pers. Ubiquitous Comput. 2002, 6, 75–86. [Google Scholar] [CrossRef]
- Brooks, F.P., Jr. Walkthrough—A Dynamic Graphics System for Simulating Virtual Buildings. In Proceedings of the 1986 Workshop on Interactive 3D Graphics (I3D ’86), Chapel Hill, NC, USA, 22–24 October 1986; ACM: New York, NY, USA, 1987; pp. 9–21. [Google Scholar] [CrossRef]
- Frost, P.; Warren, P. Virtual reality used in a collaborative architectural design process. In Proceedings of the 2000 IEEE International Conference on Information Visualization, London, UK, 19–21 July 2000; pp. 568–573. [Google Scholar] [CrossRef]
- Broll, W.; Lindt, I.; Ohlenburg, J.; Wittkämper, M.; Yuan, C.; Novotny, T.; Mottram, C.; Strothmann, A. ARTHUR: A Collaborative Augmented Environment for Architectural Design and Urban Planning. JVRB J. Virtual Real. Broadcast. 2004, 1. [Google Scholar] [CrossRef]
- Lee, G.A.; Dünser, A.; Kim, S.; Billinghurst, M. CityViewAR: A mobile outdoor AR application for city visualization. In Proceedings of the 2012 IEEE International Symposium on Mixed and Augmented Reality—Arts, Media, and Humanities (ISMAR-AMH), Altanta, GA, USA, 5–8 November 2012; pp. 57–64. [Google Scholar] [CrossRef]
- Thomas, B.; Piekarski, W.; Gunther, B. Using Augmented Reality to Visualise Architecture Designs in an Outdoor Environment. In Proceedings of the (DCNet’99) Design Computing on the Net, Sydney, Australia, 30 November–3 December 1999. [Google Scholar]
- Vlahakis, V.; Karigiannis, J.; Tsotros, M.; Gounaris, M.; Almeida, L.; Stricker, D.; Gleue, T.; Christou, I.T.; Carlucci, R.; Ioannidis, N. Archeoguide: First Results of an Augmented Reality, Mobile Computing System in Cultural Heritage Sites. In Proceedings of the 2001 Conference on Virtual Reality, Archeology, and Cultural Heritage (VAST’01), Glyfada, Greece, 28–30 November 2001; ACM: New York, NY, USA; pp. 131–140. [Google Scholar] [CrossRef]
- Wille, M.; Scholl, P.M.; Wischniewski, S.; Laerhoven, K.V. Comparing Google Glass with Tablet-PC as Guidance System for Assembling Tasks. In Proceedings of the 2014 11th International Conference on Wearable and Implantable Body Sensor Networks Workshops, Zurich, Switzerland, 16–19 June 2014; pp. 38–41. [Google Scholar] [CrossRef]
- Funk, M.; Kosch, T.; Schmidt, A. Interactive Worker Assistance: Comparing the Effects of In-situ Projection, Head-mounted Displays, Tablet, and Paper Instructions. In Proceedings of the 2016 ACM International Joint Conference on Pervasive and Ubiquitous Computing (UbiComp’16), Heidelberg, Germany, 12–16 September 2016; ACM: New York, NY, USA, 2016; pp. 934–939. [Google Scholar] [CrossRef]
- Büttner, S.; Funk, M.; Sand, O.; Röcker, C. Using Head-Mounted Displays and In-Situ Projection for Assistive Systems: A Comparison. In Proceedings of the 9th ACM International Conference on PErvasive Technologies Related to Assistive Environments (PETRA’16), Corfu, Island, Greece, 29 June–1 July 2016; ACM: New York, NY, USA, 2016; pp. 44:1–44:8. [Google Scholar] [CrossRef]
- Tang, A.; Owen, C.; Biocca, F.; Mou, W. Comparative Effectiveness of Augmented Reality in Object Assembly. In Proceedings of the SIGCHI Conference on Human Factors in Computing Systems (CHI’03), Ft. Lauderdale, FL, USA, 5–10 April 2003; ACM: New York, NY, USA, 2003; pp. 73–80. [Google Scholar] [CrossRef]
- Blattgerste, J.; Strenge, B.; Renner, P.; Pfeiffer, T.; Essig, K. Comparing Conventional and Augmented Reality Instructions for Manual Assembly Tasks. In Proceedings of the 10th International Conference on PErvasive Technologies Related to Assistive Environments (PETRA’17), Island of Rhodes, Greece, 21–23 June 2017; ACM: New York, NY, USA, 2017; pp. 75–82. [Google Scholar] [CrossRef]
- Johnson, S.; Gibson, M.; Mutlu, B. Handheld or Handsfree?: Remote Collaboration via Lightweight Head-Mounted Displays and Handheld Devices. In Proceedings of the 18th ACM Conference on Computer Supported Cooperative Work & Social Computing (CSCW’15), Vancouver, BC, Canada, 14–18 March 2015; ACM: New York, NY, USA, 2015; pp. 1825–1836. [Google Scholar] [CrossRef]
- Müller, J.; Rädle, R.; Reiterer, H. Virtual Objects As Spatial Cues in Collaborative Mixed Reality Environments: How They Shape Communication Behavior and User Task Load. In Proceedings of the 2016 CHI Conference on Human Factors in Computing Systems (CHI’16), San Jose, CA, USA, 7–12 May 2016; ACM: New York, NY, USA, 2016; pp. 1245–1249. [Google Scholar] [CrossRef]
- von der Pütten, A.M.; Klatt, J.; Ten Broeke, S.; McCall, R.; Krämer, N.C.; Wetzel, R.; Blum, L.; Oppermann, L.; Klatt, J. Subjective and behavioral presence measurement and interactivity in the collaborative augmented reality game TimeWarp. Interact. Comput. 2012, 24, 317–325. [Google Scholar] [CrossRef]
- Blum, L.; Wetzel, R.; McCall, R.; Oppermann, L.; Broll, W. The Final TimeWarp: Using Form and Content to Support Player Experience and Presence when Designing Location-aware Mobile Augmented Reality Games. In Proceedings of the Designing Interactive Systems Conference (DIS’12), Newcastle Upon Tyne, UK, 11–15 June 2012; ACM: New York, NY, USA, 2012; pp. 711–720. [Google Scholar] [CrossRef]
- Chen, L.; Peng, X.; Yao, J.; Qiguan, H.; Chen, C.; Ma, Y. Research on the augmented reality system without identification markers for home exhibition. In Proceedings of the 2016 11th International Conference on Computer Science Education (ICCSE), Nagoya, Japan, 23–25 August 2016; pp. 524–528. [Google Scholar] [CrossRef]
- Hui, J. Approach to the Interior Design Using Augmented Reality Technology. In Proceedings of the 2015 Sixth International Conference on Intelligent Systems Design and Engineering Applications (ISDEA), Guiyang, China, 18–19 August 2015; pp. 163–166. [Google Scholar] [CrossRef]
- Mori, M.; Orlosky, J.; Kiyokawa, K.; Takemura, H. A Transitional AR Furniture Arrangement System with Automatic View Recommendation. In Proceedings of the 2016 IEEE International Symposium on Mixed and Augmented Reality (ISMAR-Adjunct), Merida, Mexico, 19–23 September 2016; pp. 158–159. [Google Scholar] [CrossRef]
- Phan, V.T.; Choo, S.Y. Interior Design in Augmented Reality Environment. Int. J. Comput. Appl. 2010, 5, 16–21. [Google Scholar] [CrossRef]
- IKEA. Place IKEA Furniture in Your Home with Augmented Reality. 26 July 2013. Available online: https://www.youtube.com/watch?v=vDNzTasuYEw (accessed on 22 March 2019).
- Schattel, D.; Tönnis, M.; Klinker, G.; Schubert, G.; Petzold, F. [Demo] On-site augmented collaborative architecture visualization. In Proceedings of the 2014 IEEE International Symposium on Mixed and Augmented Reality (ISMAR), Munich, Germany, 10–12 September 2014; pp. 369–370. [Google Scholar] [CrossRef]
- Lee, J.Y.; Kwon, O.S.; Choi, J.S.; Park, C.S. A Study on Construction Defect Management Using Augmented Reality Technology. In Proceedings of the 2012 International Conference on Information Science and Applications, Suwon, Korea, 23–25 May 2012; pp. 1–6. [Google Scholar] [CrossRef]
- Vassigh, S.; Elias, A.; Ortega, F.R.; Davis, D.; Gallardo, G.; Alhaffar, H.; Borges, L.; Bernal, J.; Rishe, N.D. Integrating Building Information Modeling with Augmented Reality for Interdisciplinary Learning. In Proceedings of the 2016 IEEE International Symposium on Mixed and Augmented Reality (ISMAR-Adjunct), Merida, Mexico, 19–23 September 2016; pp. 260–261. [Google Scholar] [CrossRef]
- Messadi, T.; Newman, W.E.; Braham, A.; Nutter, D. Immersive Learning for Sustainable Building Design and Construction Practices. J. Civ. Eng. Archit. 2017, 11. [Google Scholar] [CrossRef]
- Janusz, J. Toward The New Mixed Reality Environment for Interior Design. IOP Conf. Ser. Mater. Sci. Eng. 2019, 471, 102065. [Google Scholar] [CrossRef]
- van Nederveen, G.A.; Tolman, F.P. Modelling multiple views on buildings. Autom. Constr. 1992, 1, 215–224. [Google Scholar] [CrossRef]
- Autodesk. Autodesk White Paper—Building Information Modeling. 2002. Available online: http://www.laiserin.com/features/bim/autodesk_bim.pdf (accessed on 6 February 2017).
- HM Government. Building Information Modelling. 2012. Available online: https://www.gov.uk/government/uploads/system/uploads/attachment_data/file/34710/12-1327-building-information-modelling.pdf (accessed on 6 February 2017).
- Federal Ministry of Transport and Digital Infrastructure. Road Map for Digital Design and Construction. 2015. Available online: http://www.bmvi.de/SharedDocs/DE/Publikationen/DG/roadmap-stufenplan-in-engl-digitales-bauen.pdf?_blob=publicationFile (accessed on 6 February 2017).
- Sampaio, A.Z. Maintenance Activity of Buildings Supported on VR Technology. In Proceedings of the 2015 Virtual Reality International Conference (VRIC’15), Laval, France, 8–10 April 2015; ACM: New York, NY, USA, 2015; p. 13. [Google Scholar] [CrossRef]
- Ploennigs, J.; Clement, J.; Pietropaoli, B. Demo Abstract: The Immersive Reality of Building Data. In Proceedings of the 2nd ACM International Conference on Embedded Systems for Energy-Efficient Built Environments (BuildSys’15), Seoul, Korea, 4–5 November 2015; ACM: New York, NY, USA, 2015; pp. 99–100. [Google Scholar] [CrossRef]
- Graf, H.; Soubra, S.; Picinbono, G.; Keough, I.; Tessier, A.; Khan, A. Lifecycle Building Card: Toward Paperless and Visual Lifecycle Management Tools. In Proceedings of the 2011 Symposium on Simulation for Architecture and Urban Design (SimAUD’11), Boston, MA, USA, 3–7 April 2011; Society for Computer Simulation International: San Diego, CA, USA, 2011; pp. 5–12. [Google Scholar]
- Hinrichs, E.; Bassanino, M.; Piddington, C.; Gautier, G.; Khosrowshahi, F.; Fernando, T.; Skjaerbaek, J. Mobile maintenance workspaces: Solving unforeseen events on construction sites more efficiently. In Proceedings of the 7th European Conference on Product and Process Modelling (ECPPM’08), Nice, France, 10–12 September 2008; pp. 625–636. [Google Scholar]
- Behmel, A.; Höhl, W.; Kienzl, T. [DEMO] MRI design review system: A mixed reality interactive design review system for architecture, serious games and engineering using game engines, standard software, a tablet computer and natural interfaces. In Proceedings of the 2014 IEEE International Symposium on Mixed and Augmented Reality (ISMAR), Munich, Germany, 10–12 September 2014; pp. 327–328. [Google Scholar] [CrossRef]
- Bille, R.; Smith, S.P.; Maund, K.; Brewer, G. Extending Building Information Models into Game Engines. In Proceedings of the 2014 Conference on Interactive Entertainment (IE2014), Newcastle, NSW, Australia, 2–3 December 2014; ACM: New York, NY, USA, 2014; pp. 22:1–22:8. [Google Scholar] [CrossRef]
- Hilfert, T.; König, M. Low-cost virtual reality environment for engineering and construction. Vis. Eng. 2016, 4, 2. [Google Scholar] [CrossRef]
- Melax, S. A simple, fast, and effective polygon reduction algorithm. Game Dev. 1998, 11, 44–49. [Google Scholar]
- Oppermann, L.; Shekow, M.; Bicer, D. Mobile Cross-media Visualisations Made from Building Information Modelling Data. In Proceedings of the 18th International Conference on Human-Computer Interaction with Mobile Devices and Services Adjunct (MobileHCI ’16), Florence, Italy, 6–9 September 2016; ACM: New York, NY, USA, 2016; pp. 823–830. [Google Scholar] [CrossRef]
- Xu, Y.; Fan, Z.; Hong, G.; Mao, C. Utilising AR HoloLens to Enhance User Experience in House Selling: An Experiment Study. In Proceedings of the 17th International Conference on Computing in Civil and Building Engineering (ICCCBE 2018), Tampere, Finland, 5–7 June 2018. [Google Scholar]
- Chalhoub, J.; Ayer, S.K. Using Mixed Reality for electrical construction design communication. Autom. Constr. 2018, 86, 1–10. [Google Scholar] [CrossRef]
- Pour Rahimian, F.; Chavdarova, V.; Oliver, S.; Chamo, F. OpenBIM-Tango integrated virtual showroom for offsite manufactured production of self-build housing. Autom. Constr. 2019, 102, 1–16. [Google Scholar] [CrossRef]
- Wang, X.; Love, P.E.D.; Kim, M.J.; Park, C.S.; Sing, C.P.; Hou, L. A conceptual framework for integrating building information modeling with augmented reality. Autom. Constr. 2013, 34, 37–44. [Google Scholar] [CrossRef]
- Stangroom, J. Wilcoxon Signed-Rank Test Calculator. 2018. Available online: https://www.socscistatistics.com/tests/signedranks/default2.aspx (accessed on 13 May 2018).
- Benford, S.; Fahlén, L. A Spatial Model of Interaction in Large Virtual Environments. In Proceedings of the Third European Conference on Computer-Supported Cooperative Work (ECSCW ’93), Milan, Italy, 13–17 September 1993; de Michelis, G., Simone, C., Schmidt, K., Eds.; Springer: Dordrecht, The Netherlands, 1993; pp. 109–124. [Google Scholar] [CrossRef]


© 2019 by the authors. Licensee MDPI, Basel, Switzerland. This article is an open access article distributed under the terms and conditions of the Creative Commons Attribution (CC BY) license (http://creativecommons.org/licenses/by/4.0/).
Share and Cite
Riedlinger, U.; Oppermann, L.; Prinz, W. Tango vs. HoloLens: A Comparison of Collaborative Indoor AR Visualisations Using Hand-Held and Hands-Free Devices. Multimodal Technol. Interact. 2019, 3, 23. https://doi.org/10.3390/mti3020023
Riedlinger U, Oppermann L, Prinz W. Tango vs. HoloLens: A Comparison of Collaborative Indoor AR Visualisations Using Hand-Held and Hands-Free Devices. Multimodal Technologies and Interaction. 2019; 3(2):23. https://doi.org/10.3390/mti3020023
Chicago/Turabian StyleRiedlinger, Urs, Leif Oppermann, and Wolfgang Prinz. 2019. "Tango vs. HoloLens: A Comparison of Collaborative Indoor AR Visualisations Using Hand-Held and Hands-Free Devices" Multimodal Technologies and Interaction 3, no. 2: 23. https://doi.org/10.3390/mti3020023
APA StyleRiedlinger, U., Oppermann, L., & Prinz, W. (2019). Tango vs. HoloLens: A Comparison of Collaborative Indoor AR Visualisations Using Hand-Held and Hands-Free Devices. Multimodal Technologies and Interaction, 3(2), 23. https://doi.org/10.3390/mti3020023