Article

Transforming Vulnerable Urban Areas: An IMM-Driven Resilience Strategy for Heat and Flood Challenges in Rio de Janeiro’s Cidade Nova

by
Massimo Tadi
,
Hadi Mohammad Zadeh
* and
Hoda Esmaeilian Toussi
Department of Architecture, Built Environment and Construction Engineering, Politecnico di Milano, I-20133 Milan, Italy
*
Author to whom correspondence should be addressed.
Urban Sci. 2025, 9(9), 339; https://doi.org/10.3390/urbansci9090339
Submission received: 30 May 2025 / Revised: 31 July 2025 / Accepted: 3 August 2025 / Published: 28 August 2025
(This article belongs to the Special Issue Sustainable Urbanization, Regional Planning and Development)

Abstract

This study applies the Integrated Modification Methodology (IMM) to assess how morphology-driven, nature-based solutions reduce urban heat island (UHI) effects and flooding in Rio de Janeiro’s Cidade Nova. Multi-scale GIS diagnostics identify green continuity and vertical permeability as critical weaknesses. Simulations (Ladybug/Dragonfly) and hydrological modelling (rational method) quantify the intervention’s impact, including greening, material retrofits, and drainage upgrades. Results show a 38% increase in albedo, a 13% reduction in volumetric heat capacity, and a 30% drop in thermal conductivity. These changes reduce the peak UHI by 0.2 °C hourly, narrowing the urban–rural temperature gap to 3.5 °C (summer) and 4.3 °C (winter). Hydrologically, impervious cover decreases from 22% to 15%, permeable surfaces rise from 9% to 29%, and peak runoff volume drops by 27% (16,062 to 11,753 m3/h), mitigating flood risks. Green space expands from 7.8% to 21%, improving connectivity by 50% and improving park access. These findings demonstrate that IMM-guided interventions effectively enhance thermal and hydrological resilience in dense tropical cities, aligning with climate adaptation and the Sustainable Development Goals.

1. Introduction

Urban heat island (UHI) intensity and pluvial flooding increasingly threaten Rio de Janeiro’s livability. The city’s rapid urbanization, land reclamation, and limited green–blue infrastructure exacerbate climate exposure [1,2,3,4]. Long-term disaster records show that, between 1991 and 2012, droughts affected 51% of inhabitants and flash floods affected 21% [5], while extreme rainfall events such as the 2019 downpour continue to paralyze central districts. Remote-sensing analyses reveal a multinucleated heat island pattern, with temperature anomalies reaching 7 °C, where dense built fabric, impervious surfaces, and sparse vegetation converge [6]. Empirical studies consistently link both hazards to urban form variables—impermeable cover, fragmented open space, disrupted drainage, and canyon-like street grids—indicating that spatial morphology is a primary determinant of hydro-climatic risk [7,8,9,10,11,12].
Resilience research now emphasizes complex adaptive system (CAS) perspectives, focusing on transformation and multi-scalar interactions [13,14,15,16,17]. However, municipal strategies often rely on single-hazard, grey-infrastructure solutions, creating gaps between theory and practice [18,19,20]. In Rio, large drainage tunnels address flooding while neglecting thermal regulation, and greening programmes rarely incorporate hydraulic performance criteria. The green–blue–grey literature demonstrates that vegetated and water elements can simultaneously lower land-surface temperatures through shading, evapotranspiration and evaporative cooling and reduce runoff by increasing infiltration and storage [21,22,23,24]. Nature-based solutions extend these benefits with social and ecological co-outcomes [25,26,27], but real-world applications remain fragmented; few studies evaluate how hybrid configurations can co-optimize heat and flood resilience in dense tropical neighbourhoods or how local interventions interact with broader spatial hierarchies [28,29,30,31,32,33].
This study aims to investigate how urban morphology-based interventions can be leveraged to simultaneously address the interconnected challenges of urban heat and pluvial flooding in dense, tropical cityscapes. Focusing on Cidade Nova—one of the most climatically vulnerable districts in Rio de Janeiro—this research applies the Integrated Modification Methodology (IMM) to assess and diagnose spatial vulnerabilities related to green continuity and vertical permeability. The study is structured around three core objectives: (1) to demonstrate how GIS-based diagnostics and multi-scalar spatial analysis can reveal morphological drivers of climate exposure, such as fragmented green infrastructure and inadequate water infiltration capacity; (2) to test and quantify the effectiveness of hybrid green–blue–grey strategies in mitigating heat island effects, reducing surface runoff, and improving access to ecosystem services; and (3) to evaluate how localized interventions interact with broader spatial and policy system. This study extends previous IMM applications by integrating climate performance modelling (e.g., UHI, runoff) into the diagnostic phase, addressing a gap in quantifying environmental vulnerabilities within urban resilience planning.

2. Materials and Methods

2.1. Study Area

Cidade Nova, a central neighbourhood in Rio de Janeiro, was historically shaped by land reclamation and river canalization [34]. It now combines institutional, residential, and commercial uses but suffers from high impervious surfaces, sparse vegetation, and a fragmented urban fabric. The area, located in central Rio de Janeiro, has a tropical savanna climate (Köppen Aw) [35]. Average annual temperatures remain above 23 °C, with minimal fluctuation throughout the year. It is characterized by high temperatures year-round and a distinct wet season from December to March. Intense rainfall during this period frequently overwhelms the city’s drainage infrastructure, leading to flooding. In contrast, the dry season (June–August) brings less rain but maintains high humidity. The area is also strongly affected by the urban heat island effect due to dense construction, limited vegetation, and low permeability. Despite hosting major infrastructure such as metro lines and public buildings, Cidade Nova faces significant environmental challenges, notably recurrent flooding and pronounced urban heat island effects.
Historically, the neighbourhood evolved from a working-class district shaped by early urbanization and landfills in the late 19th century, later undergoing significant transformations including verticalization and infrastructure development, which have contributed to its current morphological and socio-environmental profile. This complex history, combined with its contemporary vulnerabilities and infrastructural assets, underscores Cidade Nova’s importance as a focal point for innovative resilience interventions in Rio de Janeiro.
Cidade Nova has been selected as the pilot site for the REMIRIO project due to a combination of environmental, spatial, and socio-political factors that make it highly representative of the city’s broader climate and urban challenges. Located within the Canal do Mangue watershed, the neighbourhood is prone to recurrent flooding, primarily driven by rapid urbanization that has drastically reduced surface permeability. The conversion of natural drainage networks into engineered canals, coupled with extensive impervious surfaces, has significantly impaired the area’s capacity to manage stormwater effectively. This vulnerability is further intensified by climate change, which has increased the frequency and intensity of extreme rainfall events, rendering Cidade Nova especially susceptible to pluvial flooding [36].
In addition to hydrological risks, Cidade Nova experiences pronounced thermal vulnerability. Satellite thermal imaging and GIS analyses consistently identify the area as a significant UHI zone. Its dense building morphology, sparse vegetation cover, and predominance of heat-retaining materials contribute to elevated surface temperatures, disproportionately impacting socially and economically vulnerable populations. This thermal stress exacerbates public health risks and diminishes overall urban liveability in the central city. Morphologically, Cidade Nova presents substantial potential for transformation. Unlike heritage-protected areas, where physical interventions are limited, this neighbourhood contains numerous underutilized plots, extensive surface parking lots, and fragmented green spaces. These spatial conditions provide a viable foundation for implementing adaptive and restorative strategies, such as reintroducing green–blue infrastructure, enhancing urban ventilation corridors, and improving vertical permeability. Consequently, Cidade Nova serves as an ideal context for testing IMM as a tool to bolster urban climate resilience. From a governance perspective, Cidade Nova’s inclusion in several municipal planning initiatives, such as the Reviver Centro programme and the Masterplan for the Central Region, have reinforced its strategic importance. These frameworks prioritize urban revitalization and resilience, facilitating alignment with REMIRIO’s proposed interventions and promoting institutional integration. Furthermore, as a transitional zone between the historic downtown and northern residential districts, Cidade Nova holds a pivotal role within the urban system. Interventions here are expected to generate spatial and functional co-benefits beyond the local scale, supporting systemic resilience and contributing to Rio de Janeiro’s broader sustainability goals.
The multi-scale spatial study boundaries clarify the research scope, which is to investigate the weak urban elements leading to climate-related vulnerabilities and consequently propose adaptive and mitigative measures. In this regard, three boundaries have been studied (Table 1, Figure 1), including: (1) global scale (encapsulates the municipality of Rio de Janeiro), (2) the intermediate boundary (comprises some parts of 21 distinct central neighbourhood), and (3) local scale, covering the defined area of the REMIRIO project. The Integrated and Sustainable Urban Regeneration Milan–Rio (REMIRIO) project is a City-to-City Cooperation initiative between Milan (Italy) and Rio de Janeiro (Brazil), funded by the European Union through the International Urban and Regional Cooperation (IURC) programme, under the framework of the 2021 Partnership for Sustainable Cities call. The project aims to implement pilot nature-based solutions (NbS) to address critical local environmental challenges such as urban flooding and overheating, promoting integrated, inclusive, and sustainable urban development. The intervention area is located within a section of the Cidade Nova neighbourhood in central Rio de Janeiro, strategically defined by the presence of the major urban corridor Avenida Presidente Vargas and bordered to the north by the central railway infrastructure. This specific location was selected due to its high exposure to climate-related risks and its potential as a hydrological and thermal node within the city’s broader environmental and infrastructural systems.

2.2. Data Collection and Processing

The diagnostic phase of the REMIRIO project relied on extensive geospatial data integration and analysis, primarily using datasets sourced from DATA.RIO [38], the official open-data platform managed by the Instituto Municipal de Urbanismo Pereira Passos (IPP) of Rio de Janeiro. This platform provides structured, publicly accessible data across urban infrastructure, land use, transportation, environmental conditions, and demographic characteristics. These datasets were processed and analyzed within a Geographic Information System (GIS) environment using QGIS 3.28.6 for spatial mapping and analysis, while a Depth map was employed for space syntax modelling. Climatic and hydrological simulations were conducted using Grasshopper with the Ladybug and Dragonfly plugins [39]. The performance improvements related to thermal conditions—such as increased albedo, reduced thermal conductivity, and volumetric heat capacity—were derived from parametric simulations comparing pre- and post-intervention surface configurations. Material properties were assigned based on values from validated simulation libraries (e.g., ASHRAE, EnergyPlus, Ladybug default libraries) and supported by benchmarks from the peer-reviewed literature. For instance, reflective pavements and vegetated surfaces were assigned lower thermal conductivity (e.g., 0.35–0.45 W/m·K) compared to conventional asphalt (0.75–0.90 W/m·K), and their combined effect was assessed spatially using Grasshopper’s environmental analysis tools.
To ensure compatibility with the Integrated Modification Methodology (IMM), a dedicated phase of data harmonization—referred to as the Data Mapping phase—was carried out collaboratively by Politecnico di Milano and IPP. This phase addressed key discrepancies in data typologies and structures, translating local standards into formats suitable for IMM’s multi-scalar analysis. For example, the city’s standard for building geometry, based on horizontal projections, was reinterpreted into vertical volumetric units consistent with European norms. Custom GIS algorithms were developed and applied with attribute-based filters to exclude non-structural volumes and minor elements, followed by manual corrections where necessary to refine data accuracy.
The mapping of Points of Interest (PoIs), a critical component in assessing the Key Category of Diversity, integrated cadastral data from IPTU [40] with land cover data (Cobertura Vegetal e Uso da Terra) [41]. Due to gaps in the municipal databases, features such as playgrounds, sports fields, and cultural amenities were retrieved from OpenStreetMap (OSM). OSM was used to supplement missing municipal data, particularly for playgrounds, sports facilities, and cultural amenities. Validation was conducted through manual cross-checks against satellite imagery and site photographs provided by local stakeholders and project partners. Features with questionable accuracy were excluded or corrected to ensure consistency across spatial datasets. Furthermore, when possible, OSM data were corroborated with data from the IPTU (property tax cadaster) and Cobertura Vegetal e Uso da Terra layers from DATA.RIO [38]. Census boundaries were revised to match the updated bairro divisions, ensuring coherence across spatial layers.
In terms of climatic vulnerability analysis, the urban heat island (UHI) assessment integrated multiple datasets into a coherent simulation framework. Building geometry—including height, footprint, and window–wall ratio—was combined with surface and terrain characteristics such as albedo, vegetative cover, thermal conductivity, and volumetric heat capacity. Climatic inputs were derived from ASHRAE Zone 1 parameters and EnergyPlus Weather (EPW) files [42]. Anthropogenic heat fluxes were modelled using a traffic-derived value of 20 W/m2, representing a typical downtown heat contribution. These inputs were processed through parametric simulation in Grasshopper using the Ladybug and Dragonfly toolsets, allowing for spatialized microclimate analysis and identification of local hotspots. To analyze the UHI effect at the local scale, Cidade Nova, the Grasshopper programme, along with the Ladybug and Dragonfly plugins, was utilized. The inputs for the analysis were categorized into four main groups: (1) weather data (ASHRAE Zone 1, local weather data (EPW file)), (2) terrain geometry (albedo of material related to roads, pavements, green areas, and water bodies, volumetric thermal capacity (J/m3k), thermal conductivity (w/mk)), (3) building properties (footprint and height, building programme, window–wall ratio (WWR)), and (4) traffic (the maximum sensible anthropogenic heat flux of the urban area, measured in watts per square metre). For the existing situation, the traffic parameter was considered to be 20 W/m2, a typical value for downtown areas. The share of tree cover and green cover was 0.01 and 0.06, respectively.
The hydrological vulnerability assessment was performed by evaluating vertical permeability conditions using a 30 m resolution Digital Elevation Model (DEM) from USGS Earth Explorer [43]. While suitable for intermediate-scale modelling, the 30 m DEM presents limitations in accurately capturing microtopographic features such as small depressions, curbs, or localized slope changes. This affects the granularity of runoff flow paths and water accumulation zones at the neighbourhood scale, potentially underestimating localized flooding risks. However, at the systemic level of IMM’s diagnostic scope, the resolution was considered appropriate for identifying macro-level hydrological bottlenecks and informing hybrid design strategies.
The 30 m resolution DEM from USGS Earth Explorer was selected due to its availability, compatibility with project-scale analysis, and adequate balance between resolution and computational performance across the multi-scale study area. Although it may not capture fine-grained microtopography, it reliably reflects macro-level slope, elevation, and drainage patterns sufficient for the systemic diagnosis applied within the IMM framework. This resolution was deemed appropriate for intermediate-scale interventions and for informing hybrid green–blue–grey infrastructure planning. Variables such as slope (SPCT), floodwater depth (FWD), drainage density (DD), and distance from streams (DFS) were extracted and analyzed to understand runoff patterns. Rainfall-runoff behaviour was modelled using the rational method (Q = C · I · A), with runoff coefficients calibrated to specific land covers: highly impervious surfaces (0.96), brownfields (0.08), grass and meadow areas (0.05), and water bodies (0.01). These analyses allowed for a high-resolution identification of flood-prone areas and informed the proposed hybrid mitigation strategies.
The combination of spatial and environmental modelling techniques established a robust methodological foundation for diagnosing systemic vulnerabilities across local and intermediate urban scales. This multi-source, cross-platform data integration proved fundamental in advancing the goals of the IMM framework, guiding both the identification of critical intervention points and the formulation of data-informed resilience strategies. Simultaneously, the study mapped green infrastructure distribution using spatial and landscape connectivity indicators, such as the Green View Index (GVI), biodiversity intactness index, and green space buffers, to assess continuity and ecological performance. GIS-based analysis classified green spaces by size and ecological influence, revealing fragmentation and accessibility deficits across the intermediate scale. Table 2 demonstrates data inputs and tools applied in the study, clarifying their roles in addressing UHI, flooding, and green infrastructure gaps.

2.3. Methodology

The REMIRIO project applied the Integrated Modification Methodology (IMM) to diagnose and address the interconnected urban climate vulnerabilities of flooding and the urban heat island (UHI) effect in Rio de Janeiro’s city centre, with a focus on the Cidade Nova neighbourhoods. IMM offers a systemic, multi-scalar, and data-based framework that reads cities as Complex Adaptive Systems (CASs), enabling the detection of structural weaknesses through layered investigation across spatial scales (global, intermediate, and local) and morphological subsystems (built environment, open spaces, land use, and mobility, illustrated in Figure 2).
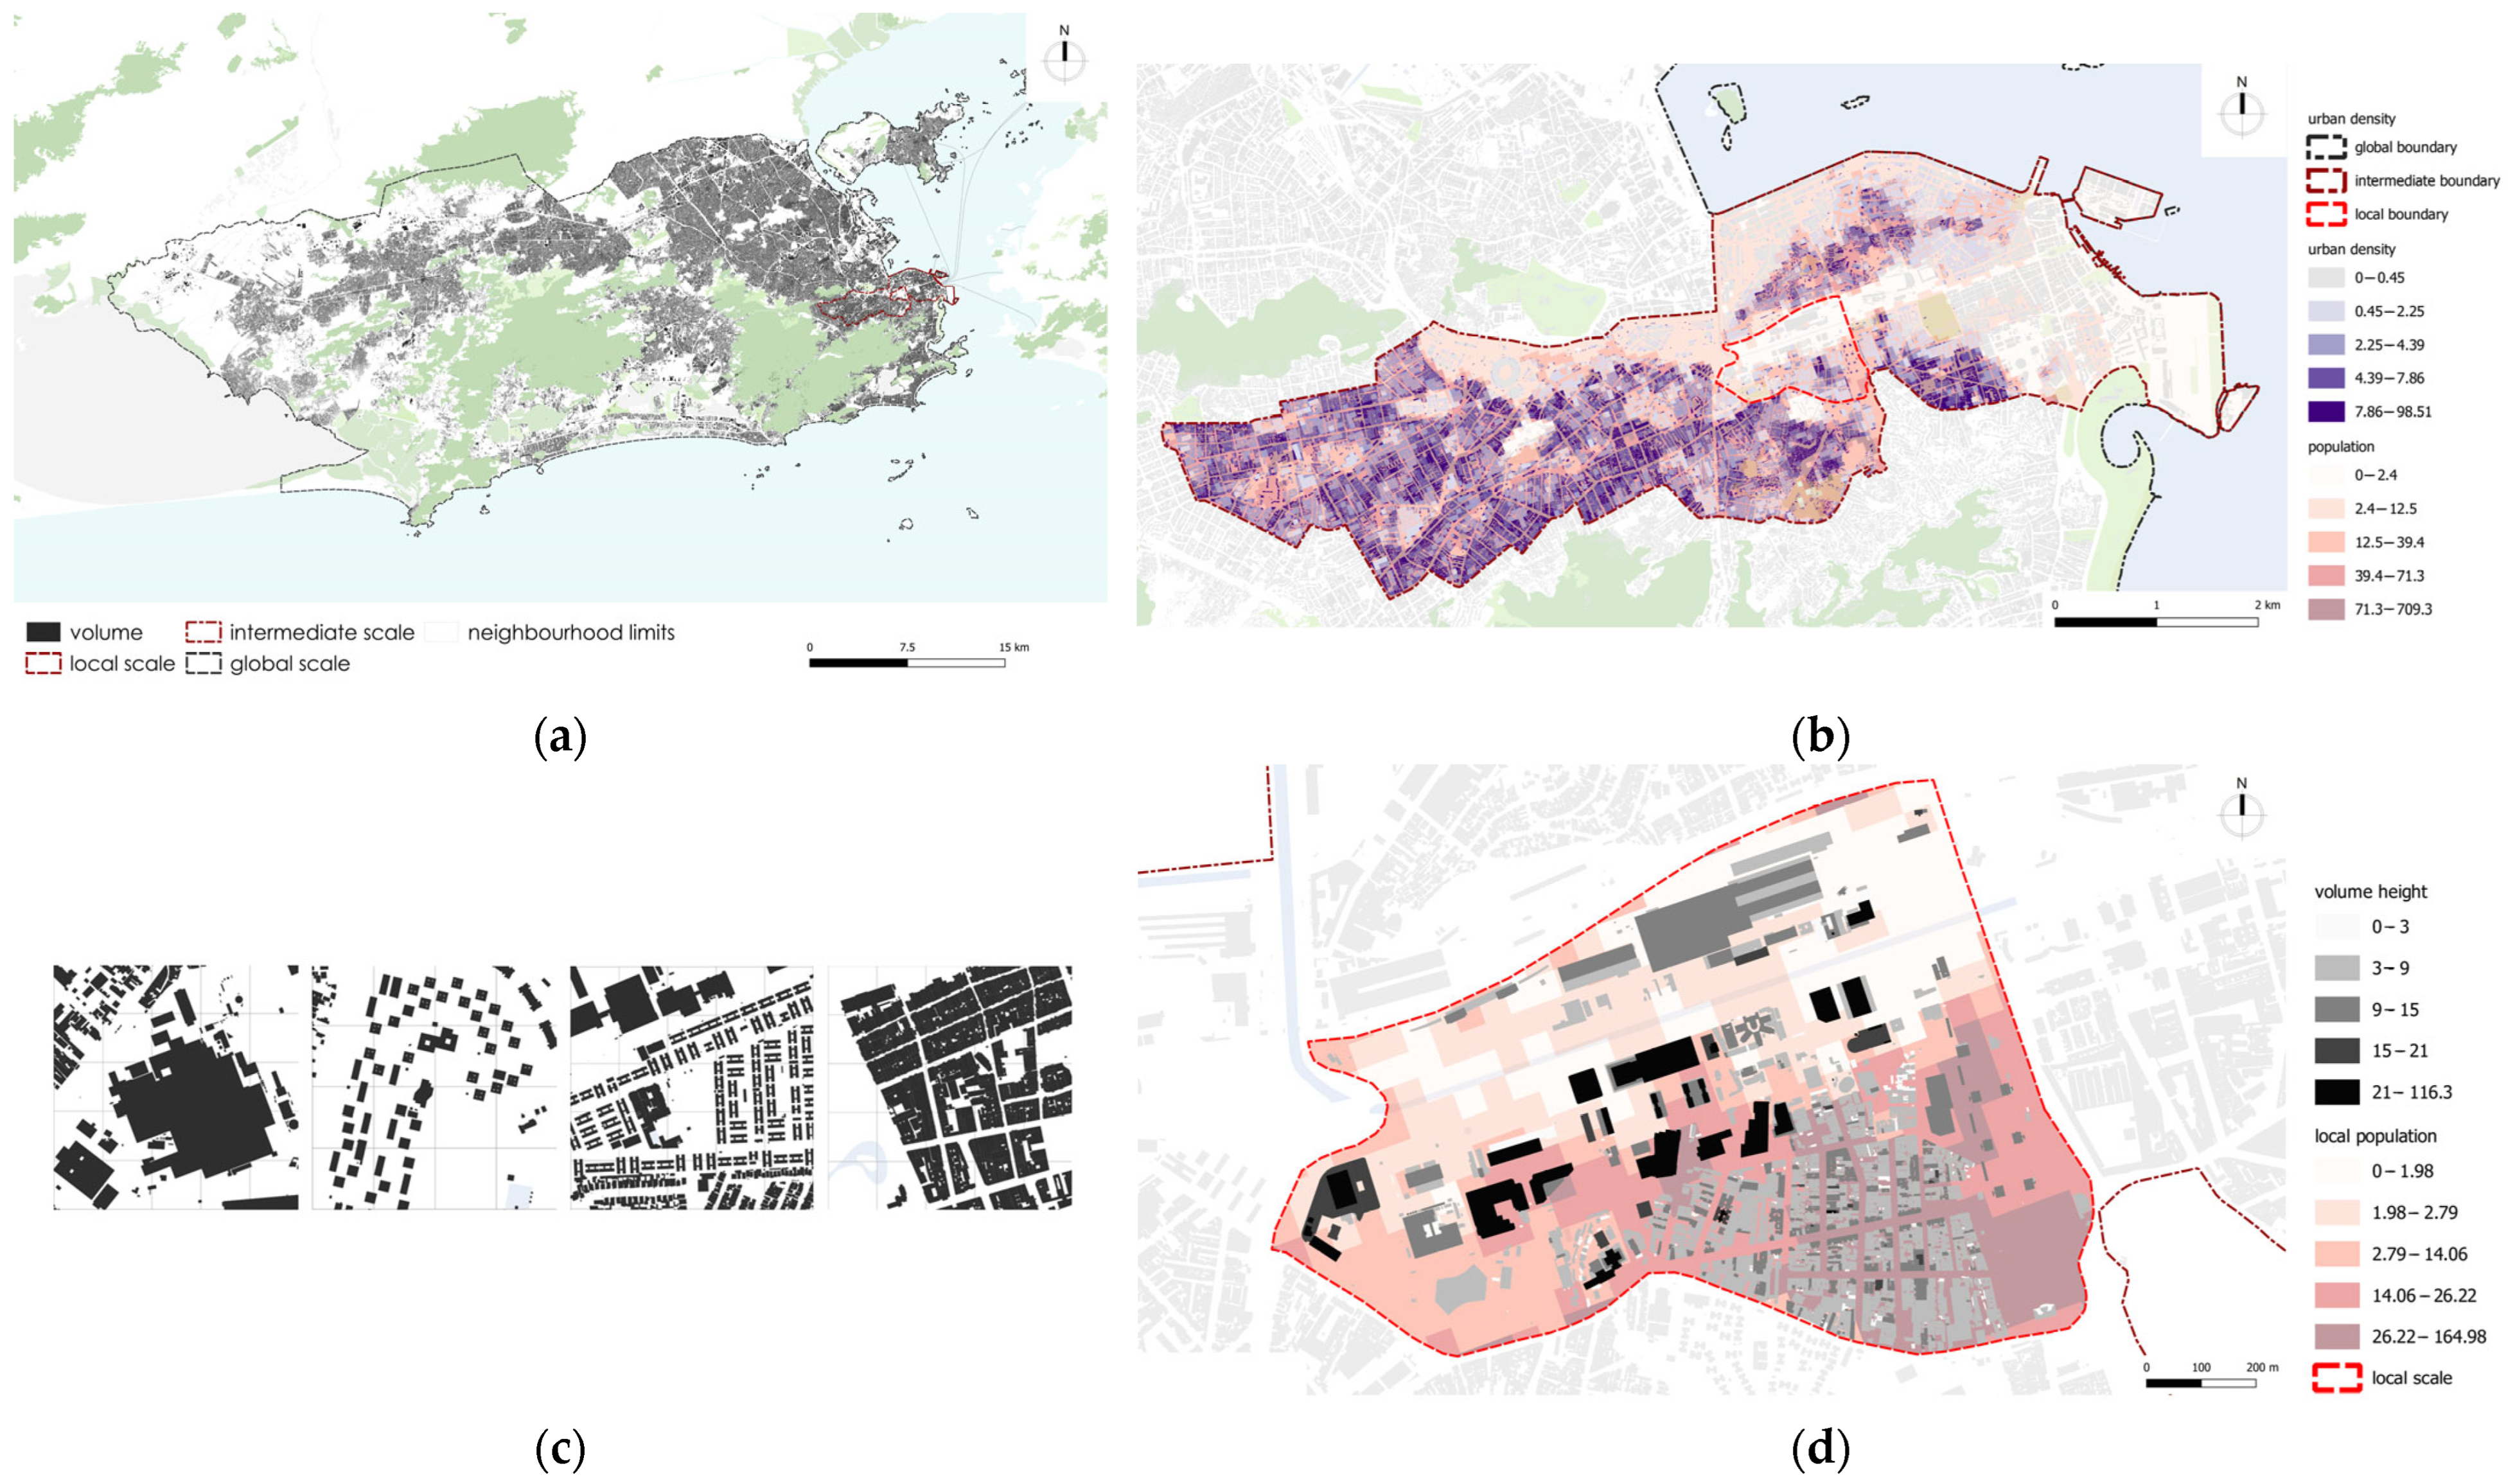
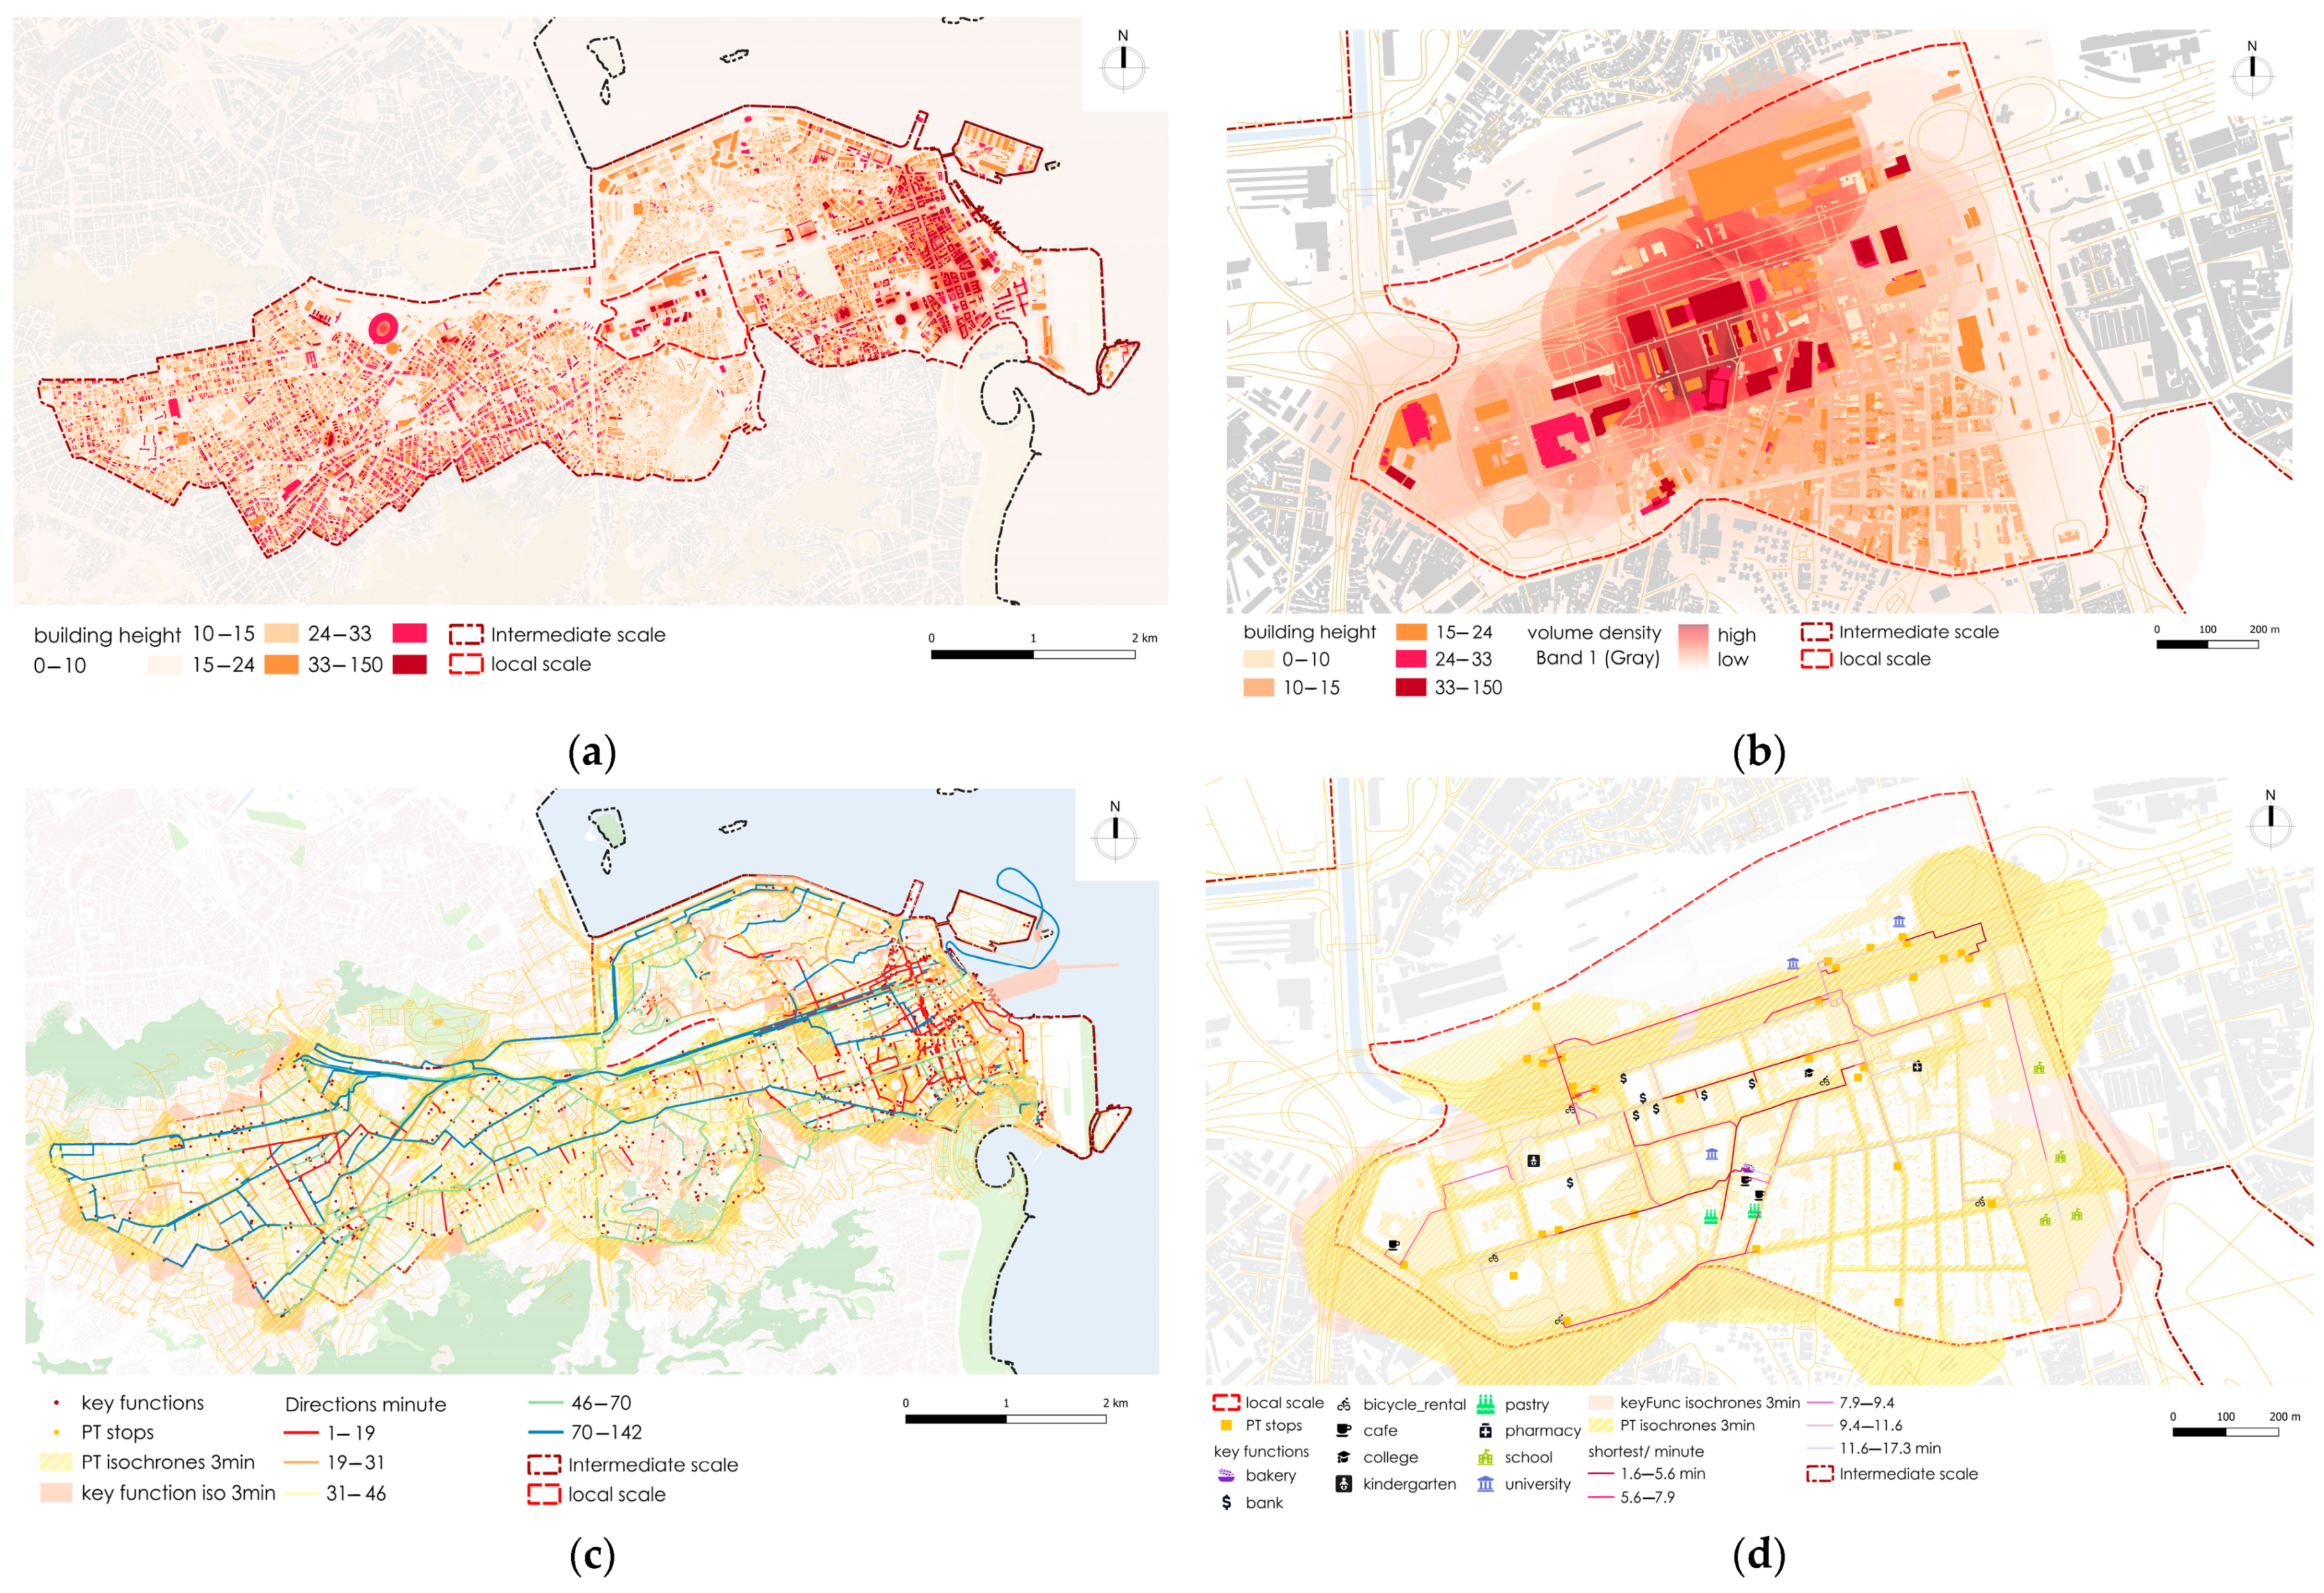
The diagnostic phase comprised a multi-layered mapping and metric-based assessment of IMM Key Categories (KCs)—such as porosity, permeability, proximity, accessibility, and continuity—quantified through spatial indicators and performance simulations [44]. The selected diagnostic maps illustrating the Key Categories are shown in Figure 3. The subsystem analysis of Rio reveals that morphological differences—such as the contrast between formal, high-density areas (AP-1, AP-3, port zone) with regular grids and informal favelas characterized by fragmented, organic layouts—result in distinct diagnostic outcomes (Figure 2c). These variations are further influenced by topographic constraints and uneven green space distribution. At the local scale, in Cidade Nova, the presence of Av. Pres. Vargas as a major barrier divides the area into morphologically distinct parts: compact grids with mid-rise buildings in the south and irregular voids in the north. These differences significantly affect microclimatic conditions and increase exposure to flooding risks.
Within the IMM diagnostic phase, green continuity emerged as the pivotal Key Category for detecting systemic weaknesses and guiding strategic interventions. Recognizing the fundamental role of urban green infrastructure in climate adaptation, urban heat island (UHI) mitigation and ecological resilience, the analysis evaluated the spatial distribution, functional connectivity, and environmental performance of green elements across multiple scales [45].
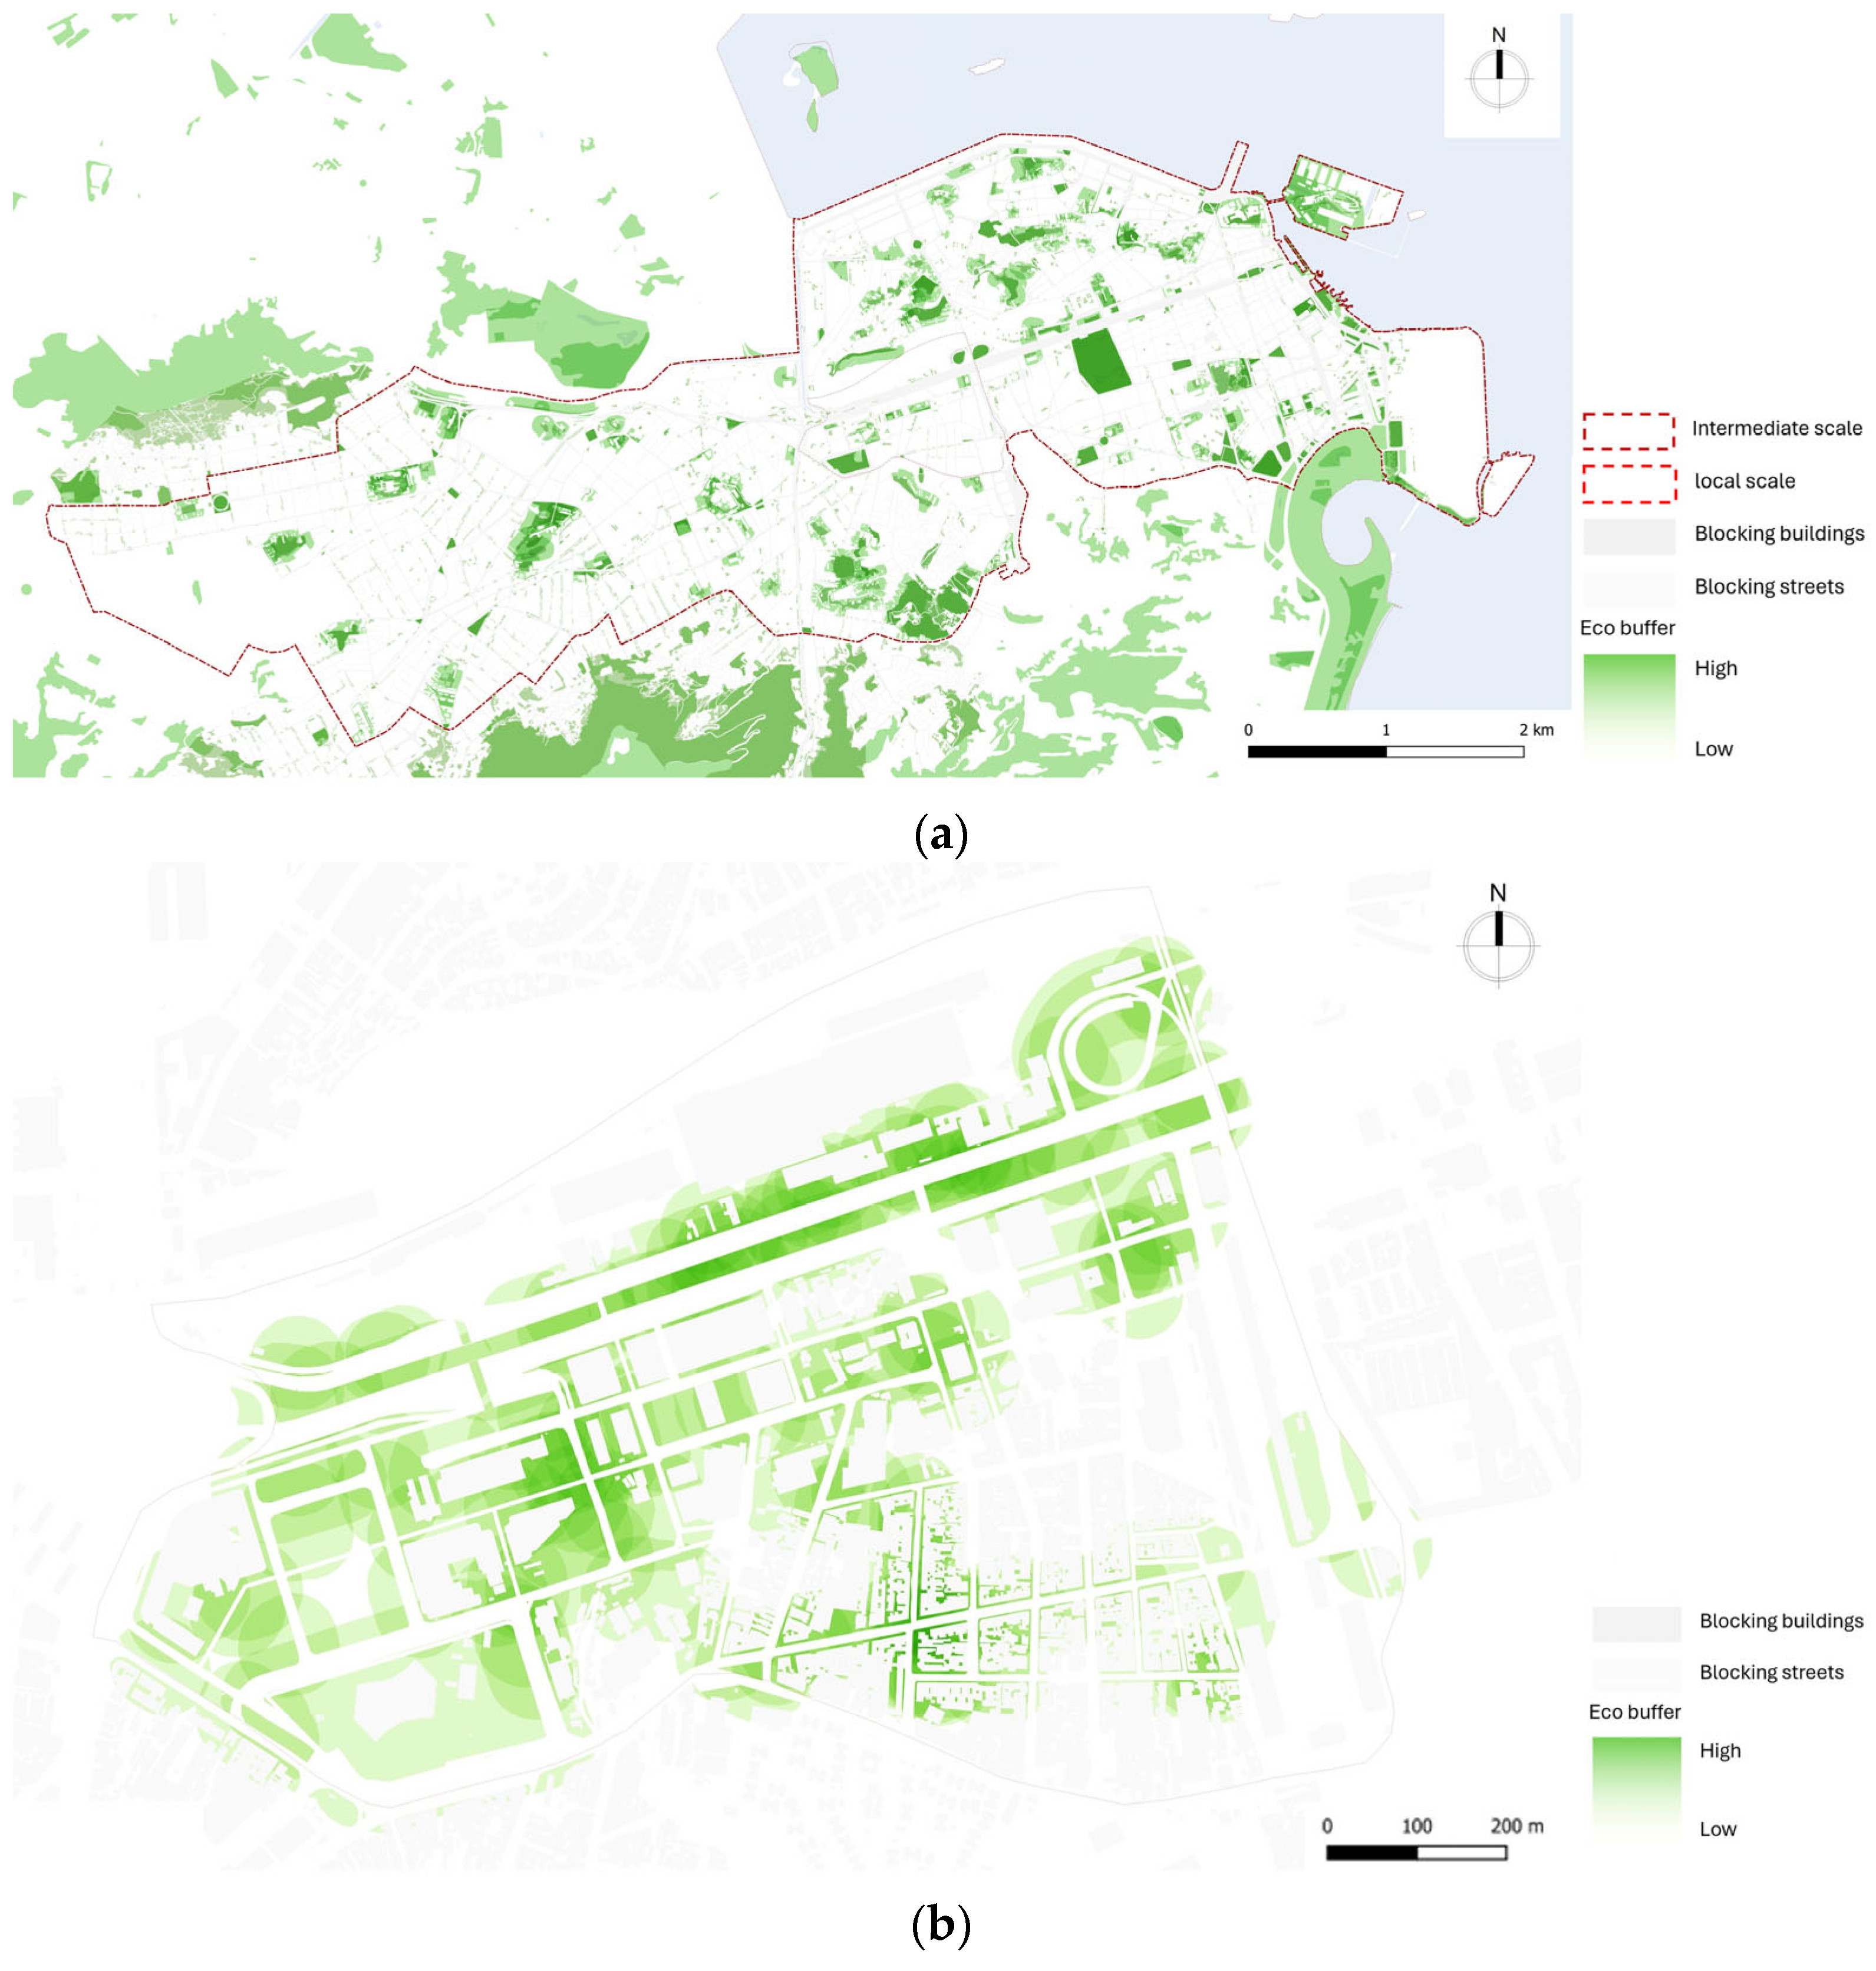
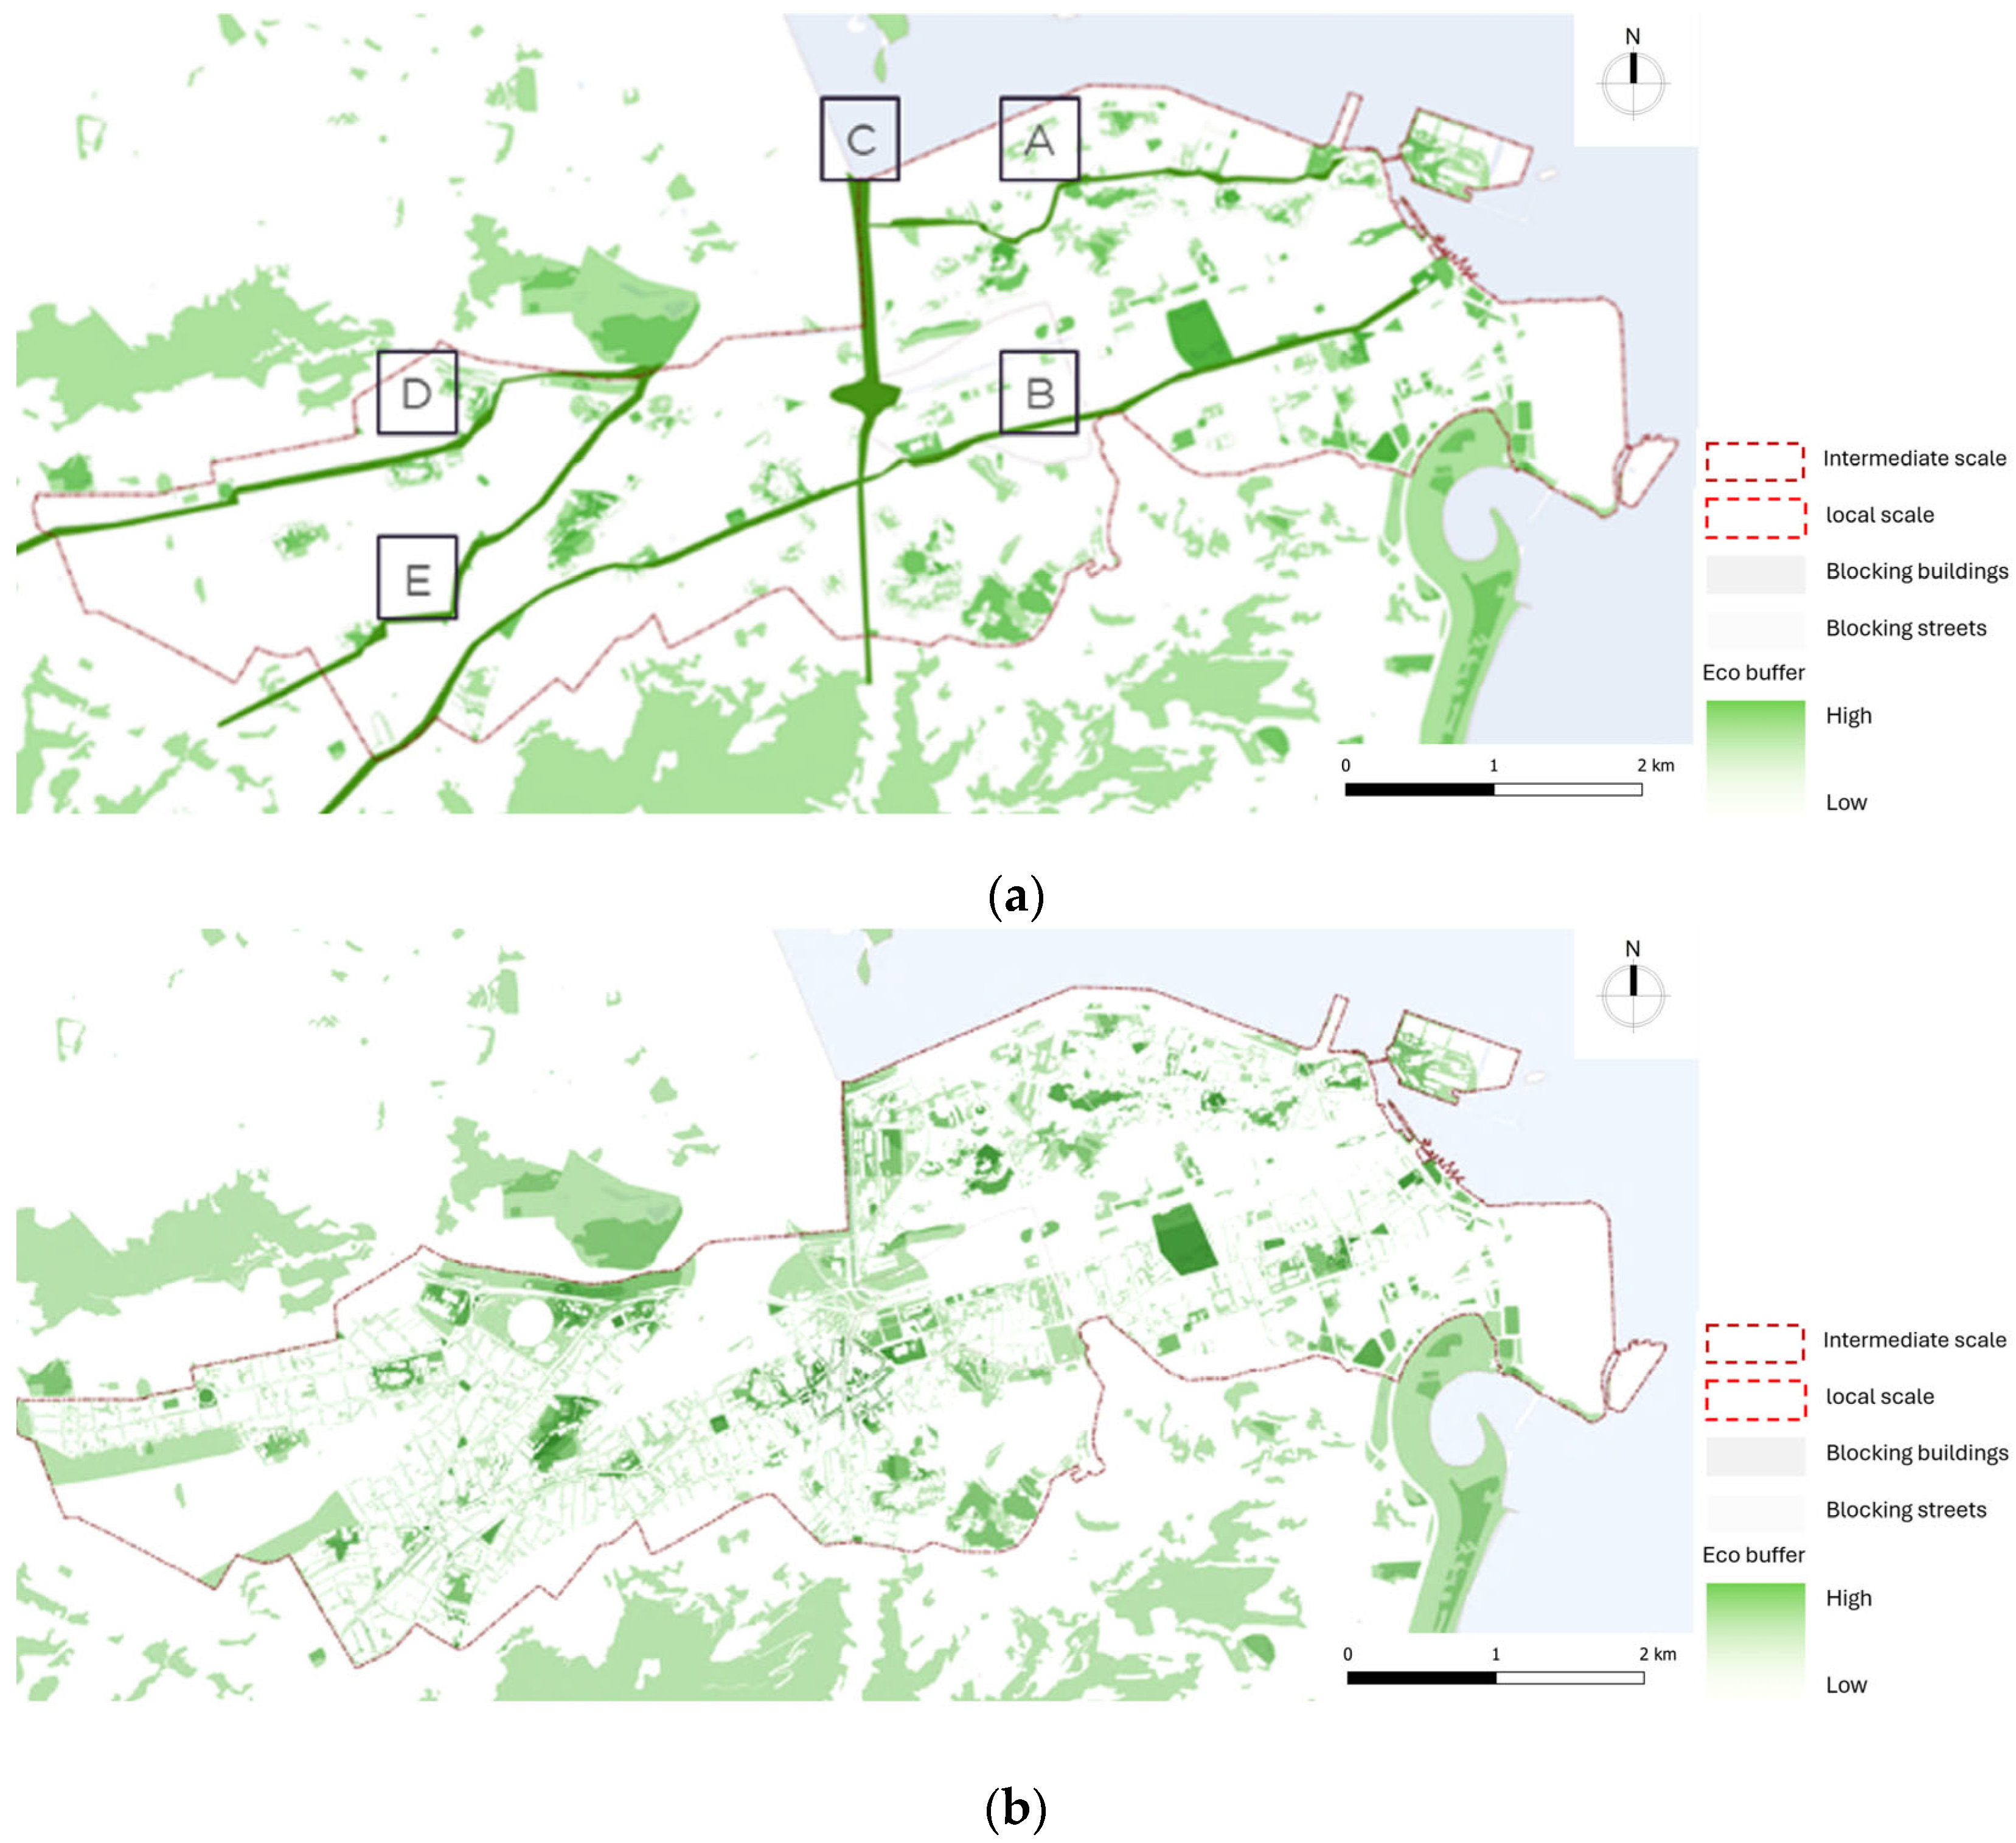
High-resolution satellite imagery was processed in QGIS [46] to map and classify urban green spaces (UGS). Each patch was categorized by size—small, medium, large—and assigned an ecological value using a biodiversity-intactness index that estimated the average abundance of originally present species relative to an intact ecosystem [47]. Size–value classes informed influence buffers of 60 m, 300 m, and 500 m [48], enabling the detection of spatial overlaps and potential corridors (Figure 4) to support ecosystem resilience and biodiversity conservation in the urban environment [49]. Then, barriers to continuity—impervious surfaces, built volumes, and major infrastructure—were delineated and subtracted from influence zones to reveal fragmentation hotspots [50].
Beyond spatial mapping, the study employed quantitative indicators: the Green View Index (GVI) [51] for visual exposure to vegetation, landscape-connectivity metrics [52] for structural coherence, and a completeness assessment of the UGS network to gauge equity and accessibility. These metrics showed that, on the intermediate scale—and especially within Cidade Nova, Estácio, Maracanã and Santo Cristo—green continuity is the weakest IMM element: only 31% of residents live within 300 m of a park, and per capita green space is just 3 m2. Coupled with UHI findings, this underscores how limited green–blue infrastructure amplifies heat-related risks.
In IMM terms, green continuity denotes the extent to which a city’s green structure forms a connected, multifunctional network capable of delivering ecosystem services and supporting biodiversity. An ecosystem is “a set of interacting species and their local, non-biological environment functioning together to sustain life” [53]. Diagnostic evidence confirmed that small, isolated patches, discontinuous corridors, and scarce multifunctional surfaces undermine this network. These insights informed the subsequent IMM Optimization and Retrofitting phases, which propose hybrid nature-based solutions to enhance vertical permeability, reduce UHI intensity, and improve stormwater management.
Overall, the integrated green continuity and microclimate assessment offers a scientifically rigorous, replicable methodology that embeds ecological and climatic metrics within urban form analysis, thereby integrating green infrastructure planning into broader climate adaptation and regeneration strategies. The findings emphasize connected green networks’ role in resilient urban ecosystems and progress toward the Sustainable Development Goals in tropical cities.
Within the IMM diagnostic framework, vertical permeability was quantified as a core water system KPI to expose hydrological vulnerabilities and inform subsequent optimization measures. Elevation (E), slope percentage (SPCT), rainfall-runoff potential, drainage density (DD), floodwater depth (FWD), and distance from stream (DFS) were computed from 30 m resolution DEMs obtained via USGS Earth Explorer [43]. Elevation was re-classified into four bands (low, medium, high, very high) to support slope and drainage analyses. Slope mapping identified the flattest zones—principally Centro, Cidade Nova and Maracanã—as the area’s most susceptible to surface runoff, especially where they abut steeper terrain that accelerates flow and pollutant transport.
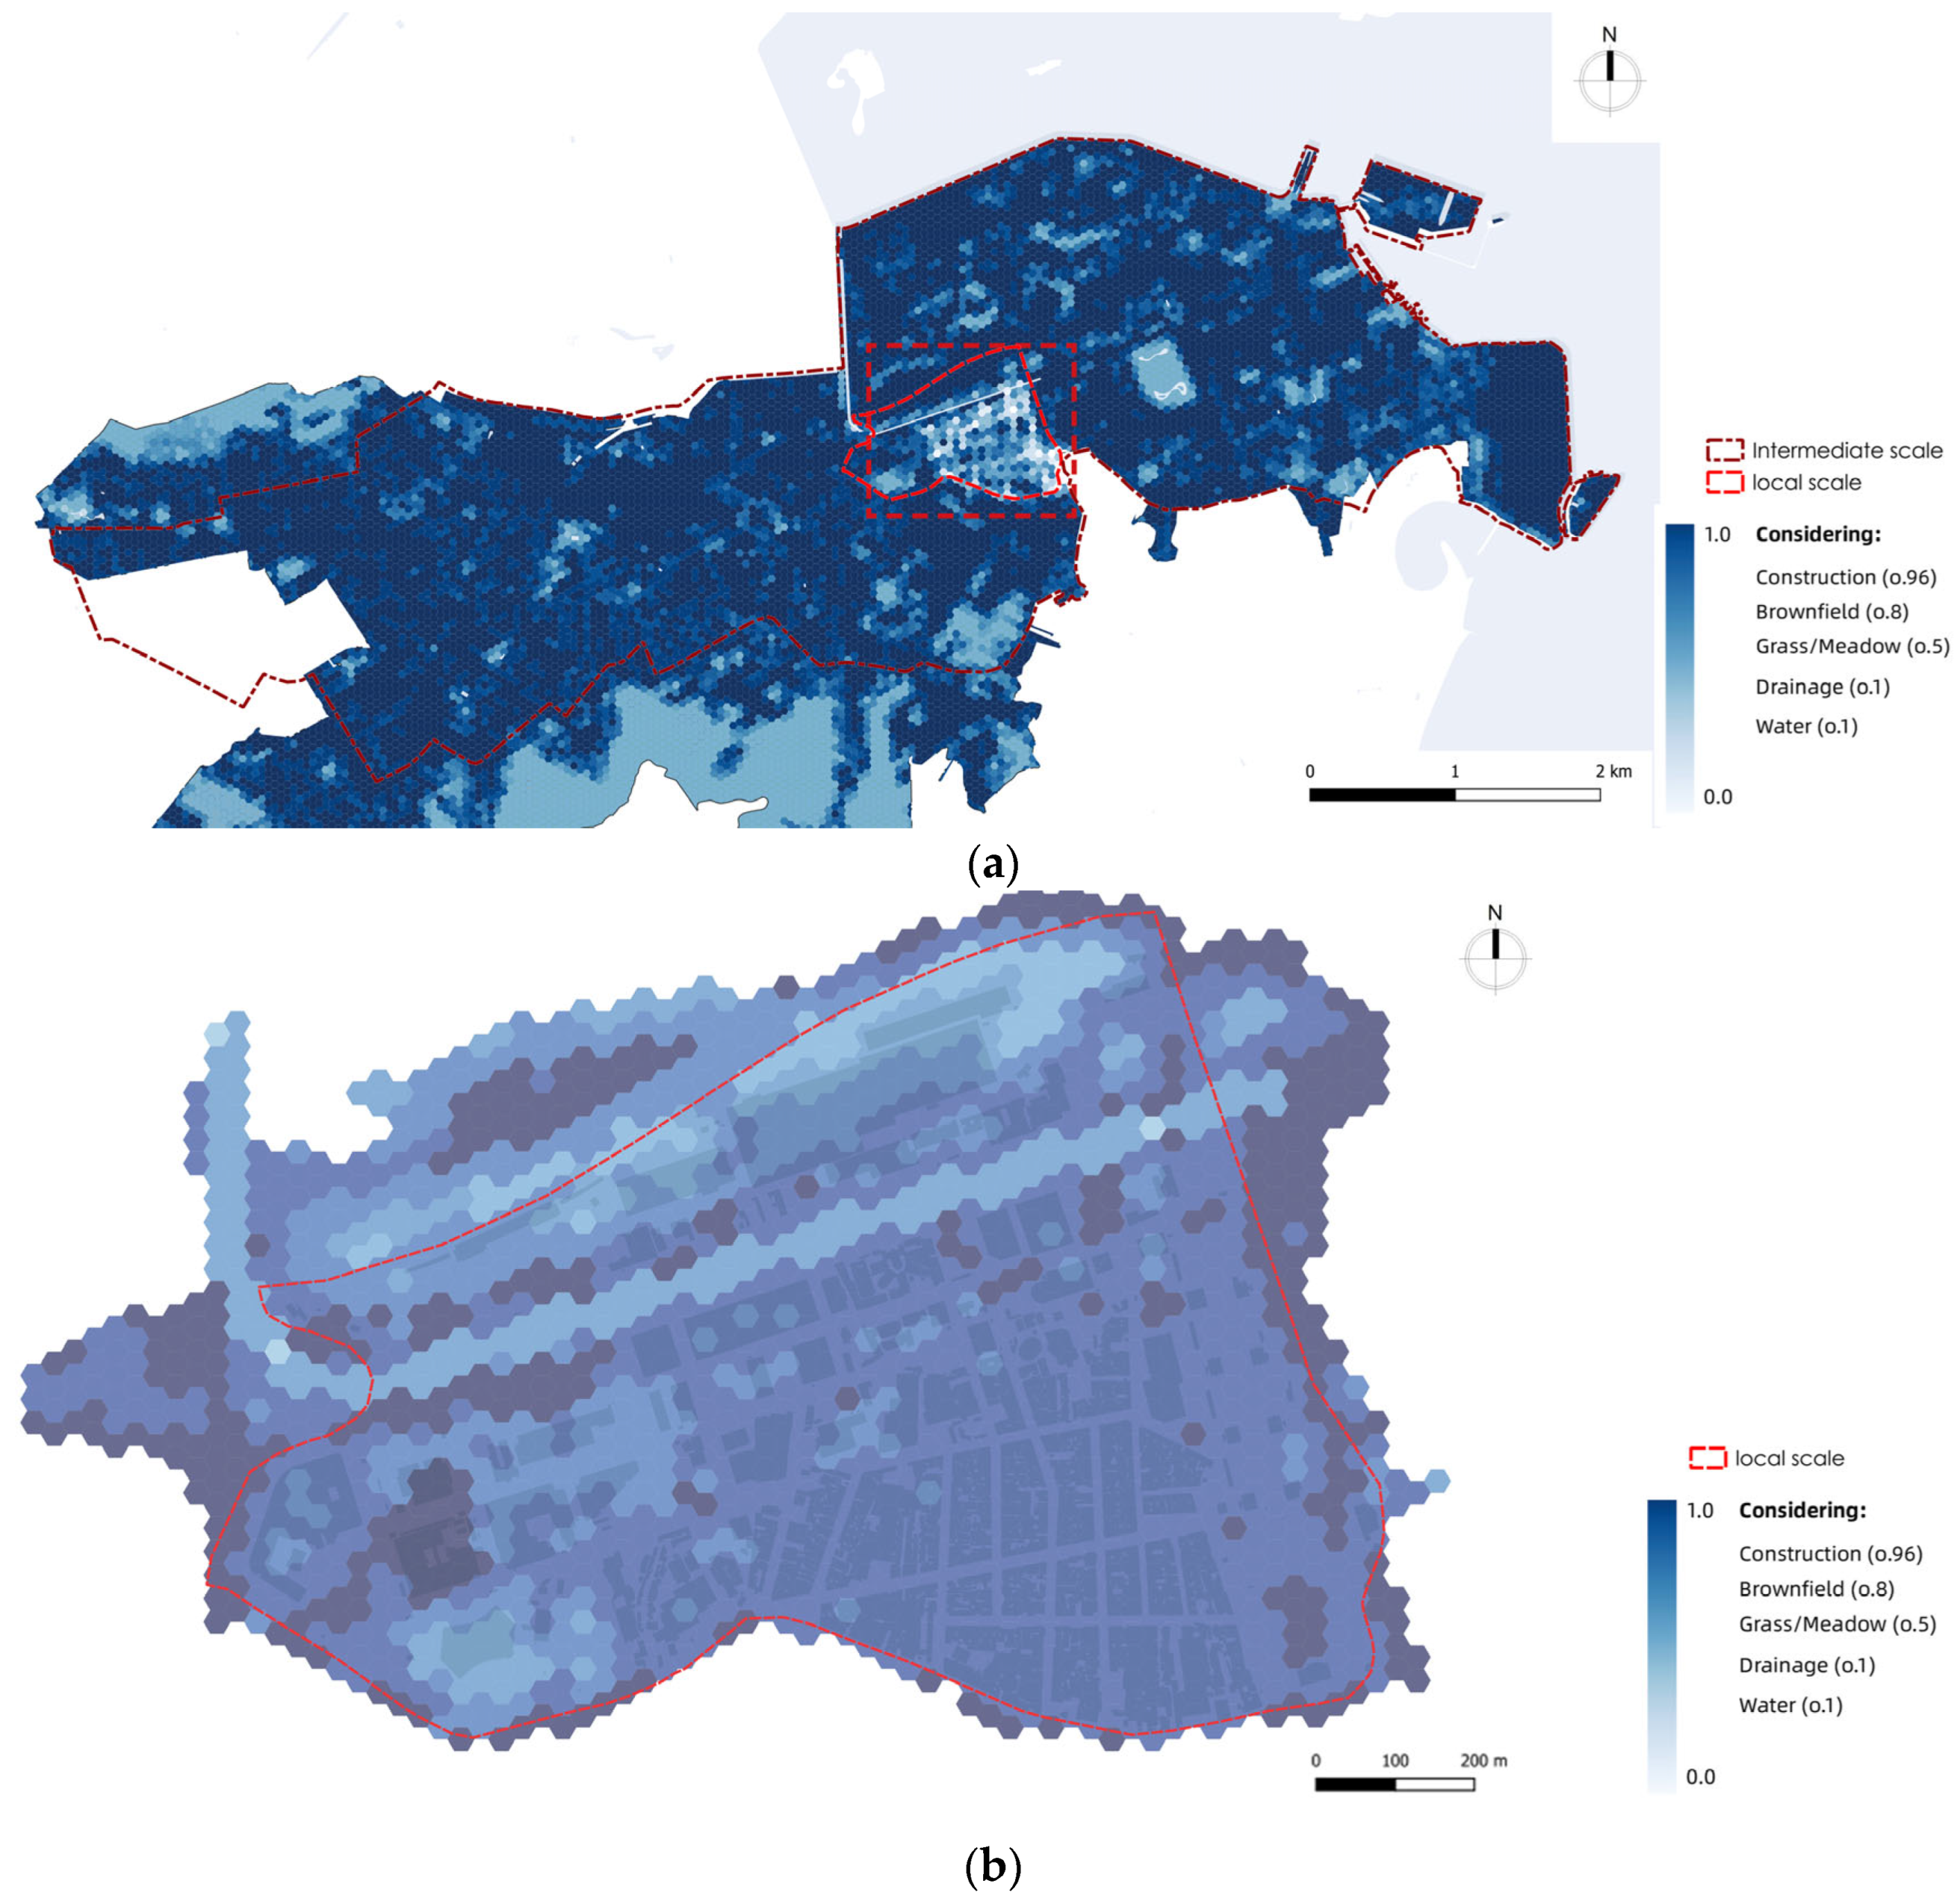
Drainage adequacy was evaluated by buffering existing engineered channels by 60 m and natural watercourses by 100 m; gaps between buffers exposed coverage deficits, while channel-length density indicated systemic under-capacity along Av. Pres. Vargas and adjacent low-lying plots. The rational method (Q = C · I · A) was applied to model peak runoff, using a 10-year return period rainfall intensity (I) and land cover-specific runoff coefficients (C): impervious urban construction = 0.96 (e.g., asphalt, concrete), 0.60 for semi-permeable areas, and 0.20 for vegetated or natural surfaces. These values are consistent with established hydrological references, including US EPA (2009) [54] and Chow et al. [55]. While not locally calibrated due to limited observed flow data, the coefficients fall within validated ranges for dense urban environments and were selected to reflect the predominant surface conditions in each scenario. Land cover analysis (Figure 5) showed a pronounced permeability gradient on the intermediate scale: impervious surfaces, 22%; semi-permeable surfaces, 35%; and truly permeable surfaces, just 3%. These values confirm a Vertical Permeability Deficiency—low infiltration capacity, inadequate drainage coverage, and high runoff potential—particularly in the flat, highly impervious sectors of Cidade Nova and along Av. Pres. Vargas.
To relate hydrological performance to thermal stress, a UHI model incorporated four datasets: (i) building geometry (height, footprint, window-to-wall ratio), (ii) terrain and surface materials (albedo, thermal conductivity, vegetation cover), (iii) boundary condition weather files for ASHRAE Zone 1, and (iv) anthropogenic heat fluxes derived from traffic counts. Simulations indicated urban–rural temperature differences up to 4.3 °C, peaking in dense blocks with scarce vegetation, precisely where low permeability and drainage deficits were detected. Hourly summer modelling showed a persistent 3.5 °C differential, corroborating the link between impervious morphology, reduced evapotranspiration, and elevated heat exposure (Figure 6).
These findings prioritize Design Ordering Principles (DOPs) [56,57], which are core operational guidelines within the IMM framework that translate diagnostic insights into spatial formulation and strategic planning. Concerning the investigation results, DOP 5 (create connected open space system, activate urban metabolism) and DOP 12 (implement integrated urban water management) were selected to address the identified weaknesses in green continuity and hydrological performance. Aligned with SDG Targets 11.7 and 2.4, these principles served as catalysts for systemic transformation. The IMM diagnostics provided a replicable and scalable methodology to support evidence-based planning for urban resilience in tropical cities.
The diagnostic indicators used in this study are directly aligned with IMM’s Key Categories. Specifically, the Green View Index (GVI) and accessibility to green areas contribute to assessing green continuity, runoff volume simulations and permeability ratios inform vertical permeability, and thermal conductivity, albedo, and UHI intensity support the evaluation of climatic porosity. Each indicator was selected to quantify spatial vulnerabilities and system inefficiencies, guiding the design of context-specific resilience strategies within the IMM framework.
The Optimization and Retrofitting phases of the IMM are designed to enhance the robustness of urban systems through strategically calculated interventions. These phases build directly on the findings of the diagnostic investigation, ensuring that proposed modifications are evidence-based and tailored to address the most critical structural weaknesses.The proposed hybrid green–blue–grey strategies resulted in an increase in urban green space (UGS) coverage, rising from 7.8% to 21%, a 13% improvement. Currently, parks cover 4% of the local area; however, through these initiatives, this has been expanded to 7%. Consequently, the challenges regarding vertical permeability decreased. As an example, surface runoff decreased to 0.6 after the intervention, which translates to a decrease in runoff volume from 16,062 m2/h. to 11,753 m2/h. for a rainfall intensity of 13 mm/h. The percentage of areas covered by permeable surfaces increased from 9% to 29%, and the area covered by semi-permeable surfaces increased from 6% to 19%. Given the average water consumption per person of approximately 150 L per day and based on the population of Cidade Nova, the water harvesting measures were found to cover 10% of the demand. As part of the Grey Solution, an intermediate-scale integrated stormwater drainage network was planned. Initially, the plan accounted for the existing drainage layout, acknowledging the limited data available on the current distribution. A buffer zone of 50 m was designated around the existing drainage system. The water flow was then analyzed in relation to the site’s topography. Elevation analysis identified low-lying areas as a priority for drainage system planning. The objective is not only to address these low-lying areas but also to integrate the drainage system into the designed green and blue infrastructure. In terms of UHI, the interventions reduced urban temperatures in Cidade Nova by 0.2 °C hourly, with key material changes including a 38% increase in albedo and a 13% reduction in volumetric heat capacity, lowering the ability of urban materials to store and retain heat and leading to quicker cooling at night and reduced daytime heat accumulation. In Cidade Nova, this contributed to a measurable 0.2 °C drop in local air temperature, easing heat stress, improving comfort, and decreasing energy demand—an important gain in dense tropical areas where small temperature reductions have significant public health and resilience benefits. In dense tropical environments like Cidade Nova, even modest thermal reductions have meaningful implications for public health, energy demand, and thermal comfort, especially for vulnerable populations. The literature shows that each 1 °C increase in urban temperature correlates with measurable increases in heat-related morbidity and mortality, making a 0.2 °C reduction a non-negligible gain when viewed on the population scale. Road coverage decreased, with reclaimed space allocated to green areas and permeable pavements, while water bodies expanded. Anthropogenic heat flux dropped from 20 W/m2 to 8 W/m2 due to reduced car dependency and increased pedestrian and cycling infrastructure. Seasonal analysis showed a 0.1 °C summer and 0.2 °C winter temperature reduction, with grid-based terrain adjustments further lowering heat retention.

3. Results

The diagnostic phase of the REMIRIO project revealed critical interdependencies among climate-related vulnerabilities in Rio’s city centre. Analysis of intermediate and local scales, particularly Cidade Nova, showed green continuity as the most compromised Key Category, spatially and functionally. Green infrastructure networks are fragmented, ecologically degraded, and spatially isolated. Railways, wide roads like Avenida Presidente Vargas, and built-up impermeable surfaces interrupt potential corridors, resulting in the absence of cohesive green infrastructure. Accessibility analysis showed only 31% of residents live within 300 m of green areas, and the average green space available per person is 3 m2—well below recommended benchmarks by the World Health Organization (WHO) [58]. In parallel, ecological intactness scores revealed poor biodiversity conditions, especially in disconnected patches on the eastern side of Cidade Nova (Figure 4b).
Hydrological modelling confirmed that Cidade Nova and adjacent neighbourhoods suffer from a lack of vertical permeability. Impervious surfaces cover over one fifth of the area, while truly permeable areas represent just 3%. Existing stormwater channels are insufficiently distributed and under-dimensioned, failing to cope with frequent, high-intensity rainfall events. Surface runoff simulations based on the rational method demonstrated that current drainage conditions contribute significantly to localized flooding (Figure 5). Key locations, especially low-lying areas adjacent to Presidente Vargas, were identified as hydrological bottlenecks where water accumulation and insufficient infiltration pose recurrent risks.
Urban heat island modelling further underscored the neighbourhood’s vulnerability. Simulations indicated a temperature differential of up to 4.3 °C between urbanized and rural areas in winter and 3.5 °C in summer (Figure 6). Thermal hotspots strongly corresponded with high-density blocks and low vegetation cover. Anthropogenic heat contributions, especially from traffic, exacerbate thermal loading during peak hours, with localized urban design intensifying heat retention due to unfavourable albedo and material conductivity properties. The results derived from the Grasshopper programme show that the contributing factors affecting the urban heat island (UHI) in the Cidade Nova neighbourhood are as follows: 75% from buildings, 18.8% from traffic, and 6.3% from terrain (Figure 6b).
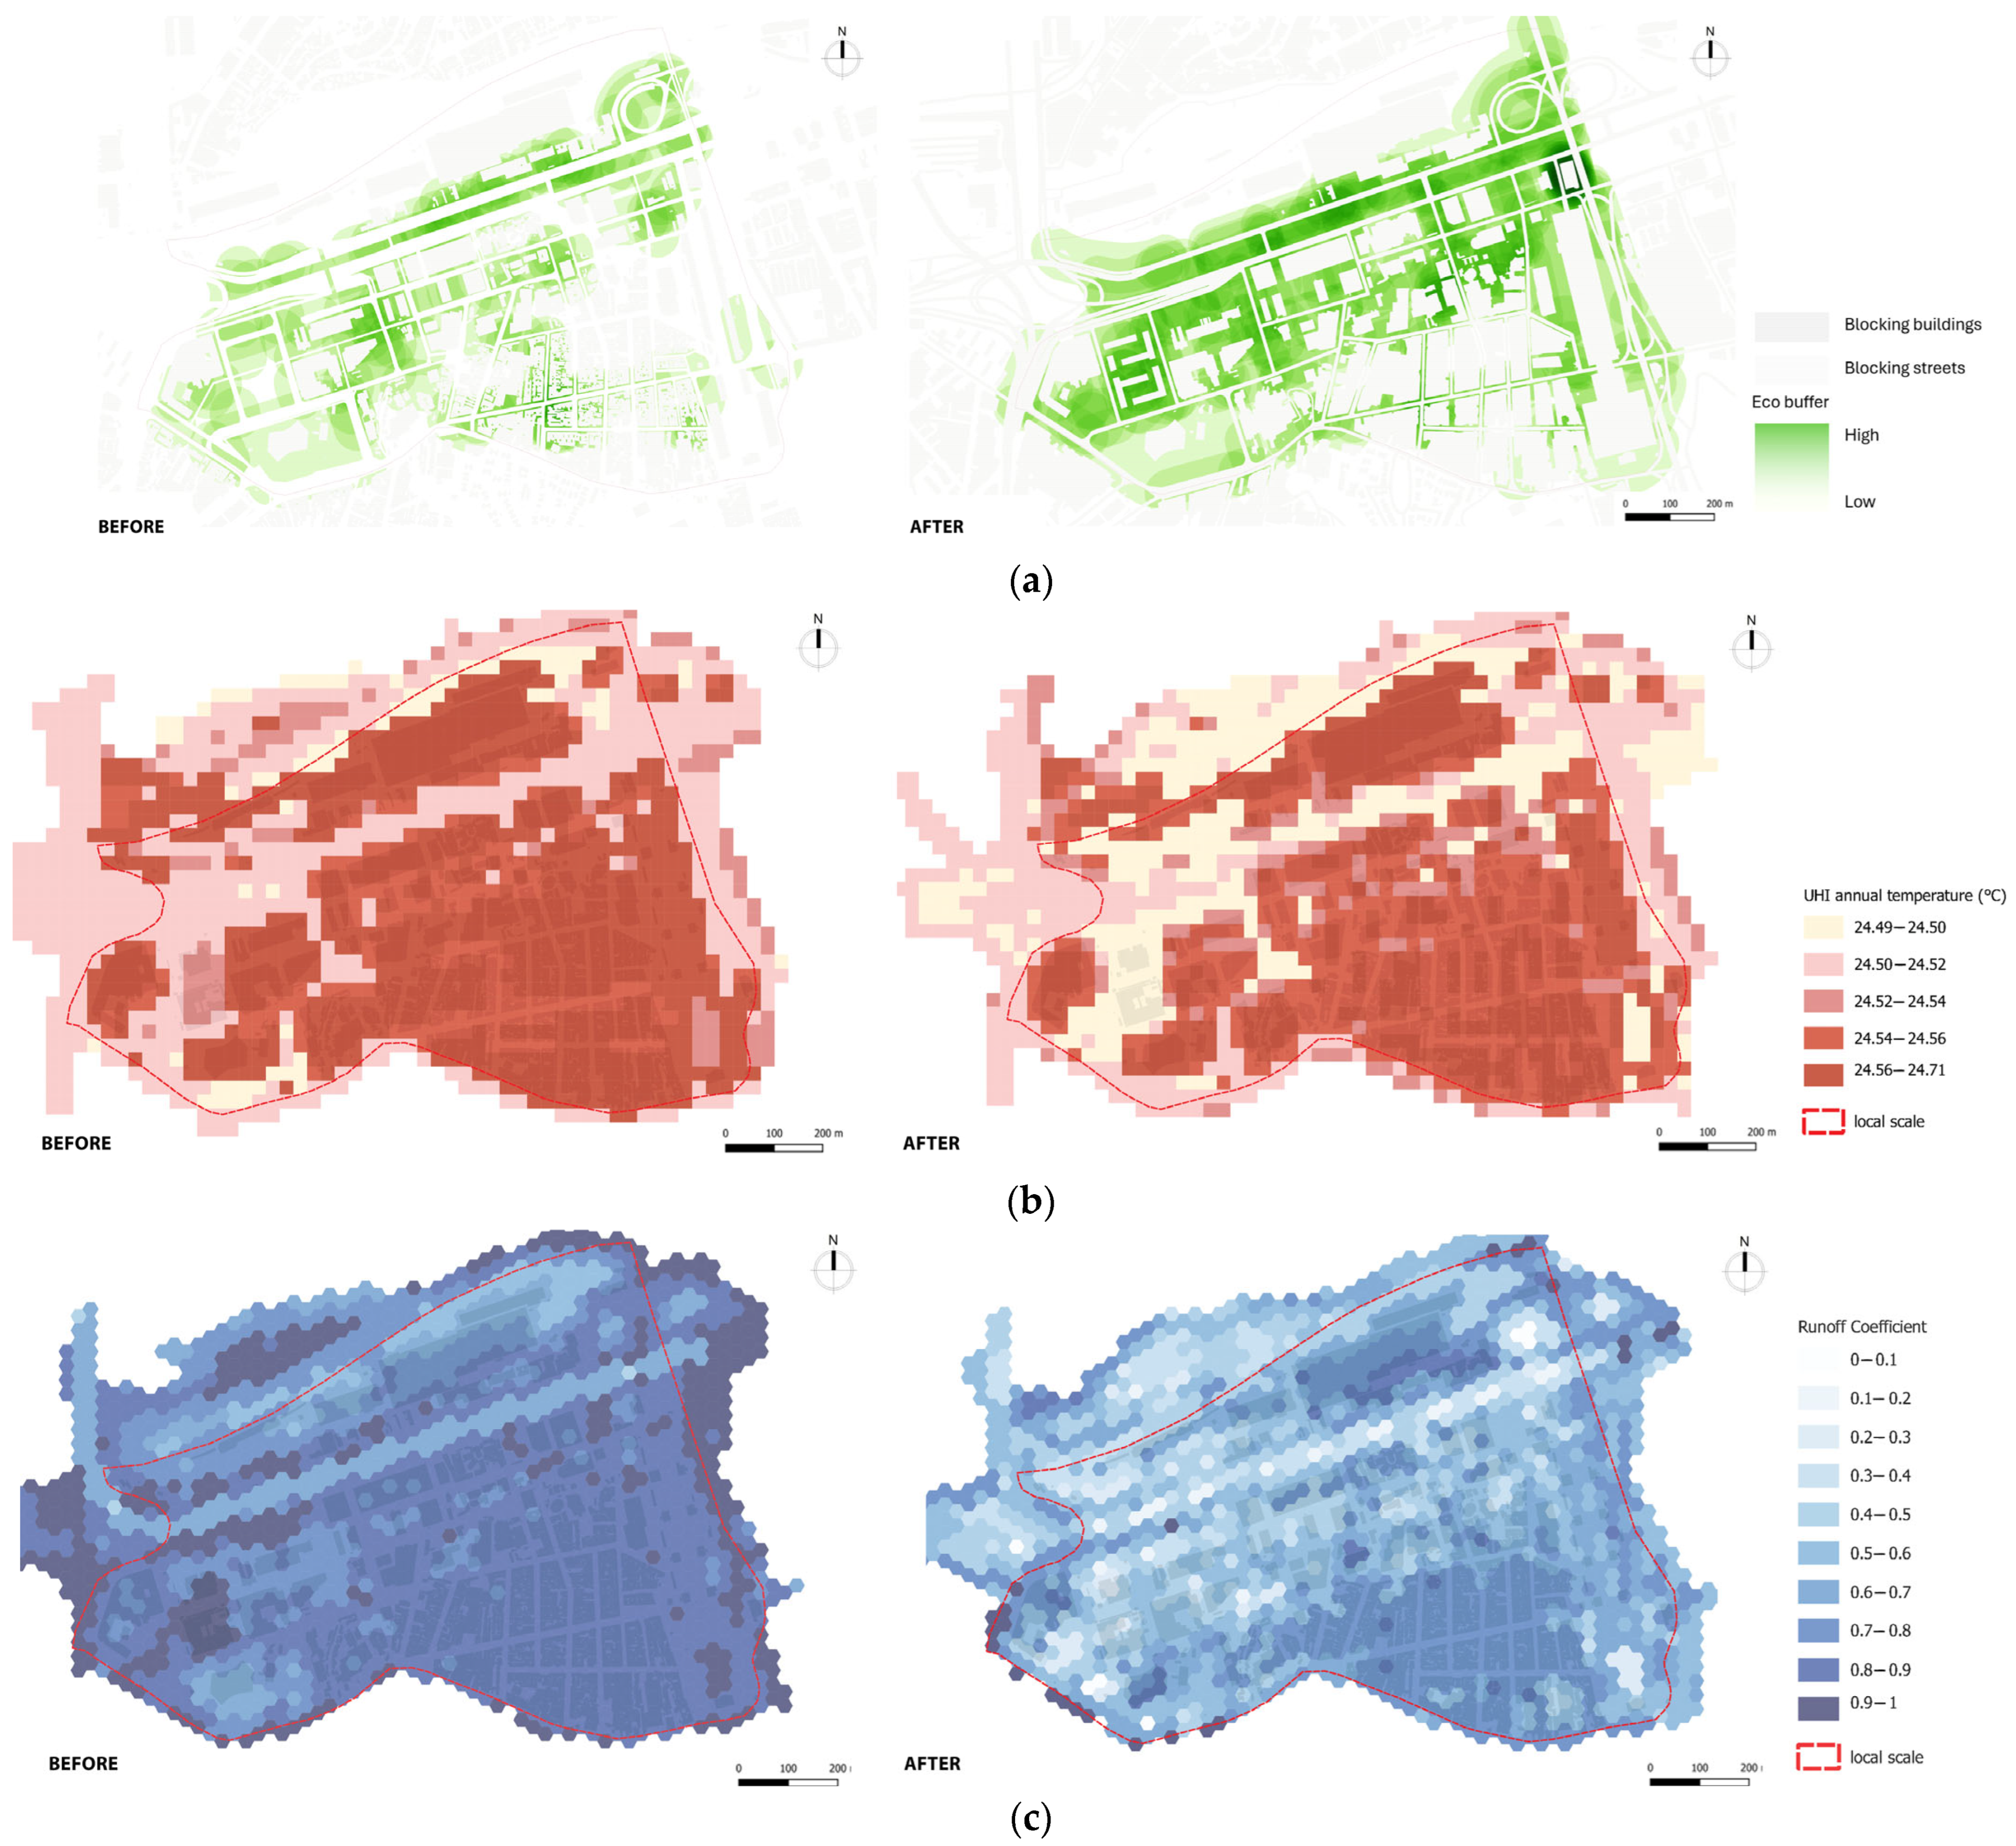
As a response, the project simulated the implementation of Design Ordering Principles. Through the application of DOP 5 and DOP 12, local green space coverage increased from 7.8% to 21%, with total park land rising from 4% to 7%. Permeable surface areas were nearly tripled, from 9% to 29%, resulting in a reduction in runoff volume from 16,062 m3/h to 11,753 m3/h as a 26.8% decrease under typical storm scenarios. In addition, grey infrastructure such as improved drainage networks was planned with an integrated layout informed by elevation and hydrological flow paths. Decentralized water harvesting solutions were shown to cover approximately 10% of local domestic water demand. Regarding thermal performance, material substitutions and shading interventions led to a 0.2 °C average temperature reduction during peak hours as a 4.7% decrease relative to the local summer maximum (~4.3 °C urban–rural delta). Changes in albedo (+38%) and reductions in volumetric heat capacity and thermal conductivity contributed to this effect, along with reduced traffic-based heat fluxes, which fell from 20 to 8 W/m2 due to pedestrianization and cycling enhancements. These climate gains, although modest in numerical terms, are significant when viewed in relation to the spatial structure and climatic vulnerabilities of Cidade Nova. In dense tropical environments like Cidade Nova, even a 0.2 °C reduction in urban temperature can have measurable public health implications. Studies have shown that each 1 °C increase in temperature can lead to a 2.1% to 3.8% increase in heat-related mortality, particularly affecting children, the elderly, and low-income populations [59,60]. Figure 7 illustrates the impact of local-scale interventions on green continuity, UHI, and flooding. Although modest, the reduction observed here is therefore not negligible when scaled to population-level exposure. The reduction in thermal conductivity resulted in an estimated 30% decrease, calculated as a weighted average based on the spatial distribution of modified surfaces within the intervention zone.
In conclusion, the results confirm that IMM enables the translation of complex urban data into targeted, multi-scale interventions. By diagnosing and addressing systemic weaknesses in green connectivity, vertical permeability, and thermal exposure, the methodology not only improves urban performance under climate stress but also offers a framework for replication in similar tropical, high-density contexts. These key findings provide an evidence-based platform to guide the formulation of integrated, adaptive, and policy-aligned resilience strategies within Rio’s broader planning system. Rio’s government, as a project partner, could operationalize these findings by integrating green continuity and vertical permeability targets into zoning regulations, land use plans, and public infrastructure investments. Using IMM’s evidence-based diagnostics, policies can prioritize the regeneration of areas like Cidade Nova through nature-based solutions and multifunctional public spaces. Design Ordering Principles (DOPs) offer a framework to align municipal projects with SDG targets, while participatory monitoring ensures that interventions remain adaptive, inclusive, and measurable over time.
Figure 7. Effects of local-scale interventions on green space connectivity, urban heat island, and surface runoff, (a) evaluating the effects of applied urban green space (UGS) scenario through ecological buffer modelling (left) before intervention (right) after intervention. (b) UHI annual temperature °C grid analysis: (left) annual temperature before intervention, (right) annual temperature after intervention. (c) Surface runoff grid analysis (left) before intervention and (right) after intervention.
Urbansci 09 00339 g007

4. Discussion

The diagnostic phase identified green continuity and vertical permeability as key weaknesses on both the intermediate and local scales of Cidade Nova and Vila Operária Salvador de Sá. These elements were defined as catalysts—spatial features whose transformation could trigger systemic improvements [61]—and guided the selection of two Design Ordering Principles (DOPs): DOP 5, “create connected open space system, activate urban metabolism,” aligned with SDG 11.7 and 11.a, and DOP 12, “implement integrated urban water management,” aligned with SDG targets related to sustainable water and food systems. These DOP-structured actions on the local scale aligned with citywide strategies such as the Plano Diretor, RIOResiliente, and Reviver Centro. By aligning IMM interventions with municipal policies, the project ensures that localized regeneration efforts contribute to broader urban resilience and sustainability goals.
The defined actions within DOP5 and DOP12 correspond to nature-based solutions (NbS) to mitigate climate change impacts while providing ecological and societal benefits. These strategies are classified into green, blue, and grey solutions, which function to delay, filter, protect, store, and release stormwater. Addressing the challenges identified in the investigation phase, green–blue corridors were proposed to incorporate various influential aspects such as urban green space (UGS) size and shape, ecological value, and proximity. The proposed corridors were initially defined at a global scale to account for natural system behaviours comprehensively. Then, to determine the influential green patches within the intermediate scale, a boundary of 1 km was established. This boundary consideration allowed for a detailed understanding of the ecological connectivity and the potential impact of each green patch on the overall urban green infrastructure.
The proposed green corridors aim to conserve biodiversity by providing habitats and migration pathways for wildlife, particularly in forested areas. They also mitigate edge effects between natural and urban zones, creating transitional buffers to protect the ecological balance. Additionally, these corridors support essential ecological functions like pollination and seed dispersal while connecting key green and blue spaces, such as connecting the Tijuca forest to urban waterways, to reduce fragmentation and enhance urban biodiversity. To propose an effective green scenario, a retrofitting process was implemented for four different scenarios following the same procedure as the green continuity investigation phase by measuring ecological influence. Figure 8 illustrates one of the proposed urban green space (UGS) scenarios, featuring five designated corridors (A to E) and their potential to form an ecological buffer within the study area. For comparative purposes, all green corridors were defined using a standardized 300 m buffer—an ecologically grounded threshold shown to mitigate edge effects, support species movement, and enhance functional connectivity in urban landscapes [62]. The rationale for proposing each corridor was based on three main objectives: connecting green areas to blue infrastructures (water bodies), addressing fragmentation of urban green space (UGS), and activating opportunities for wetland habitat restoration within the urban environment.

4.1. Replication and Transferability of the IMM Framework

The Integrated Modification Methodology is inherently adaptable because its diagnostic phase relies on scalable, locally sensitive tools—namely, multi-resolution GIS mapping, space-syntax metrics, and performance-based KPIs (e.g., green continuity, vertical permeability). These instruments do not prescribe uniform targets; rather, they calibrate benchmark values to each city’s morphological, climatic, and socio-economic context. Consequently, the workflow applied in Rio de Janeiro can be replicated in other tropical cities by (i) reparameterising environmental inputs (e.g., EPW files, land cover coefficients) and (ii) re-weighting KPI thresholds to reflect local risk profiles (e.g., cyclone exposure in Manila or water-scarcity stress in Chennai). Because the IMM diagnostic outputs—graded maps, network indices, vulnerability surfaces—are spatially explicit, they provide municipal planners with decision layers that integrate seamlessly into existing comprehensive plans or climate action frameworks. Pilot studies could therefore adopt the same sequential logic (diagnosis → optimization → retrofitting) while adjusting intervention menus—green–blue corridors, porous-pavement retrofits, cool-roof programmes—to fit local governance capacities and budgetary constraints.

4.2. Implementation Challenges

Scaling IMM, nevertheless, entails substantive challenges. First, stakeholder engagement can be complex in densely populated tropical settings where informal settlements, competing land use claims, and limited institutional trust prevail. The Rio case showed that co-creation workshops and participatory mapping were essential in legitimizing spatial data and negotiating trade-offs between pedestrianization, transit access, and informal-sector livelihoods; similar processes would be indispensable elsewhere. Second, governance fragmentation—multiple agencies managing drainage, street space, and green infrastructure—can impede integrated action. The success of IMM hinges on cross-departmental coordination; without a lead entity empowered to align budgets and timelines, the optimization and retrofitting phases risk remaining aspirational. Third, a lack of data availability and quality cab pose practical limits. While open-source satellite imagery and global DEMs suffice for baseline diagnostics, higher-resolution LiDAR, traffic counts, and micro-meteorological data markedly improve model accuracy but are often scarce or costly in low- and middle-income tropical cities. Addressing these gaps may require phased data acquisition, capacity-building partnerships, and the use of proxy indicators to maintain methodological rigour without compromising feasibility.

4.3. Research Limitations

This research acknowledges some limitations that could influence the precision and generalizability of the presented findings. First, the spatial resolution of the Digital Elevation Model (DEM) used for hydrological modelling was 30 m, which may not fully capture microtopographical variations critical in detailed urban runoff analysis. Additionally, assumptions inherent in the rational method for surface runoff modelling—such as uniform rainfall intensity and static land cover conditions—may not account for temporal variability or extreme weather events. Then, in the UHI simulations, while human heat fluxes were estimated using standard urban values, real-time local traffic data were not available, potentially limiting the accuracy of heat emission modelling. Furthermore, some datasets, such as those related to informal settlements and unregistered green areas, were incomplete or outdated, requiring the integration of auxiliary sources like OpenStreetMap, which may vary in reliability. Finally, while the IMM facilitates cross-scalar systemic diagnosis, the analysis is bound by the availability and consistency of geospatial data, which may differ significantly across municipalities and limit replicability without substantial data harmonization efforts.
The proposal includes hybrid green–blue–grey pilot projects to mitigate UHI and flooding, targeting specific corridor locations with the following objectives:
(1)
The corridor located along the coastal area can protect coastal habitats, filter contaminants, and alleviate the risk of sea levels rising;
(2)
The central corridors along the east–west side of the Cidade Nova district reaching Guanabara Bay can enhance water quality and flood management, erosion control, and hydrological connectivity;
(3)
The main east–west artery along Av. Presidente Vargas is providing a vegetation buffer zone to mitigate the negative effects of traffic;
(4)
The western part of the boundary connecting Tijuca to Maracanã can restore water canals, provide wetland habitats, enhance hydrological connectivity, and manage floods.
The Probability of Connectivity (PC), a key metric for habitat linkage, is estimated to have improved by roughly 50–75%, supporting wildlife movement and ecosystem resilience. While this approach incorporates habitat area and spatial configuration, it provides only an approximate estimate of connectivity improvement due to the assumption of uniform species dispersal capacity, a limitation that may oversimplify ecological dynamics. For precise quantification, spatially explicit modelling incorporating species-specific movement thresholds is required.

5. Conclusions

This study confirms the effectiveness of the IMM as a multi-scale, system-based approach to addressing urban climate vulnerabilities. In Cidade Nova and Vila Operária Salvador de Sá, IMM identified critical weaknesses in green continuity and vertical permeability—key drivers of heat stress and flooding risk. These structural weaknesses were framed as catalysts for transformation and addressed through targeted Design Ordering Principles (DOPs), strategically aligned with Rio’s urban planning instruments and the SDGs. The implementation of hybrid green–blue infrastructure strategies led to measurable reductions in urban heat island intensity and improved stormwater management, demonstrating the value of morphology-driven interventions for climate resilience. IMM results can serve as a decision support tool for local government and planners. The diagnostic outputs—such as green connectivity gaps, low permeability zones, and UHI hotspots—can inform updates to zoning plans, investment priorities, and climate adaptation strategies. These insights could be integrated into the Plano Diretor, as well as sectoral initiatives for green infrastructure financing and water-sensitive planning, aligning design decisions with Rio’s broader resilience and sustainability agenda.
IMM’s capacity to connect the theoretical model of Complex Adaptive Systems (CASs) with practical tools offers a replicable approach for dense, tropical cities facing similar challenges.
By positioning urban form as a dynamic interface among ecological, social, and infrastructural systems, this research moves beyond siloed planning and supports integrated, adaptive strategies.
To maximize impacts, future applications should integrate long-term monitoring into participatory processes, confirming that urban transformations are not only technically effective but also socially inclusive and locally grounded. For researchers and practitioners seeking to replicate this methodology in other urban contexts, it is recommended to calibrate diagnostic thresholds and indicators according to local environmental baselines; establish early engagement with institutional stakeholders to align IMM actions with existing policy frameworks; and prioritize cross-sectoral integration to ensure that climate adaptation strategies yield co-benefits across mobility, housing, and public health.

Author Contributions

Conceptualization, M.T. and H.M.Z.; methodology, M.T.; software, H.E.T.; validation, M.T., H.M.Z. and H.E.T.; formal analysis, H.E.T.; investigation, H.E.T.; resources, M.T.; data curation, H.E.T.; writing—original draft preparation, M.T.; writing—review and editing, H.M.Z.; visualization, H.E.T.; supervision, M.T.; project administration, H.M.Z.; funding acquisition, M.T. All authors have read and agreed to the published version of the manuscript.

Funding

The research described in this article is part of the project Integrated and Sustainable Urban Regeneration Milan–Rio (REMIRIO), which has been funded by the European Commission (call EuropeAid/171273/DH/ACT/Multi-3—Local Authorities: Partnerships for Sustainable Cities 2021).

Data Availability Statement

The raw data supporting the conclusions of this article will be made available by the authors on request.

Acknowledgments

The authors would like to express their gratitude to MOTAHAREH GHASEMNEJAD NAMAGHI and CLINTON PUNNAKKAL RAPHAEL, who graduated from the master’s programme in architectural engineering at Politecnico di Milano, for their invaluable participation in urban diagnostics and this project.

Conflicts of Interest

The authors declare no conflicts of interest.

References

  1. Prefeitura do Rio de Janeiro. Plano de Adaptação Climática da Cidade do Rio de Janeiro. 2021. Available online: https://www.google.com/search?q=Rio+Municipal+Climate+Change+Adaptation+Plan (accessed on 1 May 2025).
  2. Sotto, D.; Philippi, A.; Yigitcanlar, T.; Kamruzzaman, M. Aligning Urban Policy with Climate Action in the Global South: Are Brazilian Cities Considering Climate Emergency in Local Planning Practice? Energies 2019, 12, 3418. [Google Scholar] [CrossRef]
  3. Nobre, C.A.; Marengo, J.A.; Soares, W.R. Climate Change Risks in Brazil; Springer: Berlin/Heidelberg, Germany, 2018; pp. 1–226. [Google Scholar]
  4. Field, C. Managing the Risks of Extreme Events and Disasters to Advance Climate Change Adaptation: Special Report of the Intergovernmental Panel on Climate Change. 2012. Available online: https://www.ipcc.ch/report/managing-the-risks-of-extreme-events-and-disasters-to-advance-climate-change-adaptation/ (accessed on 1 May 2025).
  5. Soler, L.S.; Gregorio, L.T.; Leal, P.; Gonçalves, D.; Londe, L.; Soriano, É.; Cardoso, J.; Coutinho, M.; Santos, L.B.; Saito, S. Challenges and Perspectives of Innovative Digital Ecosystems Designed to Monitor and Warn Natural Disasters in Brazil. In Proceedings of the 5th International Conference on Management of Emergent Digital EcoSystems, MEDES, Luxembourg, 29–31 October 2013; pp. 254–261. [Google Scholar]
  6. Peres, L.F.; Lucena, A.J.; Rotunno Filho, O.C.; França, J.R. The Urban Heat Island in Rio de Janeiro, Brazil, in the Last 30 Years Using Remote Sensing Data. Int. J. Appl. Earth Obs. Geoinf. 2018, 64, 104–116. [Google Scholar] [CrossRef]
  7. Marcus, L.; Colding, J. Toward an Integrated Theory of Spatial Morphology and Resilient Urban Systems. Ecol. Soc. 2014, 19, 4. [Google Scholar] [CrossRef]
  8. Feliciotti, A.; Romice, O.; Porta, S. Design for Change: Five Proxies for Resilience in the Urban Form. Open House Int. 2016, 41, 23–30. [Google Scholar] [CrossRef]
  9. Sharifi, A.; Yamagata, Y. Resilient Urban Form: A Conceptual Framework. Lect. Notes Energy 2018, 65, 167–179. [Google Scholar]
  10. Pan, Y.; Jiao, S.; Hu, J.; Guo, Q.; Yang, Y. An Ecological Resilience Assessment of a Resource-Based City Based on Morphological Spatial Pattern Analysis. Sustainability 2024, 16, 6476. [Google Scholar] [CrossRef]
  11. Liu, B.; Guo, X.; Jiang, J. How Urban Morphology Relates to the Urban Heat Island Effect: A Multi-Indicator Study. Sustainability 2023, 15, 10787. [Google Scholar] [CrossRef]
  12. Oke, T.R. Street Design and Urban Canopy Layer Climate. Energy Build. 1988, 11, 103–113. [Google Scholar] [CrossRef]
  13. Meerow, S.; Newell, J.P.; Stults, M. Defining Urban Resilience: A Review. Landsc. Urban Plan. 2016, 147, 38–49. [Google Scholar] [CrossRef]
  14. Olazabal, M. Resilience, Sustainability and Transformability of Cities as Complex Adaptive Systems. In Urban Regions Now & Tomorrow; Springer: Berlin/Heidelberg, Germany, 2017; pp. 73–97. [Google Scholar]
  15. Baoxing, Q. Resilient Urban Design Methods and Principles Based on the Complex Adaptive System Theory. Landsc. Archit. Front. 2018, 6, 42–47. Available online: https://link.gale.com/apps/doc/A568370893/AONE?u=anon~219f3012&sid=googleScholar&xid=4fd9307e (accessed on 13 May 2025). [CrossRef]
  16. Shi, Y.; Zhai, G.; Xu, L.; Zhou, S.; Lu, Y.; Liu, H.; Huang, W. Assessment Methods of Urban System Resilience: From the Perspective of Complex Adaptive System Theory. Cities 2021, 112, 103141. [Google Scholar] [CrossRef]
  17. Muñoz-Erickson, T.A.; Meerow, S.; Hobbins, R.; Cook, E.; Iwaniec, D.M.; Berbés-Blázquez, M.; Grimm, N.B.; Barnett, A.; Cordero, J.; Gim, C.; et al. Beyond Bouncing Back? Comparing and Contesting Urban Resilience Frames in US and Latin American Contexts. Landsc. Urban Plan. 2021, 214, 104173. [Google Scholar] [CrossRef]
  18. Spaans, M.; Waterhout, B. Building Up Resilience in Cities Worldwide—Rotterdam as Participant in the 100 Resilient Cities Programme. Cities 2017, 61, 109–116. [Google Scholar] [CrossRef]
  19. Rio de Janeiro. Rio Resiliente Resilience Strategy of the City of Rio de Janeiro. 2015. Available online: https://www.santiagoresiliente.cl/wp-content/uploads/2017/05/5.2.2.-estra_res_rio_ingles_2-1.pdf (accessed on 13 May 2025).
  20. Chelleri, L.; Waters, J.J.; Olazabal, M.; Minucci, G. Resilience Trade-offs: Addressing Multiple Scales and Temporal Aspects of Urban Resilience. Environ. Urban. 2015, 27, 181–198. [Google Scholar] [CrossRef]
  21. Aram, F.; García, E.H.; Solgi, E.; Mansournia, S. Urban Green Space Cooling Effect in Cities. Heliyon 2019, 5, e01339. [Google Scholar] [CrossRef]
  22. Rahman, M.A.; Stratopoulos, L.M.; Moser-Reischl, A.; Zölch, T.; Häberle, K.H.; Rötzer, T.; Pretzsch, H.; Pauleit, S. Traits of Trees for Cooling Urban Heat Islands: A Meta-Analysis. Build. Environ. 2020, 170, 106606. [Google Scholar] [CrossRef]
  23. Yu, Z.; Yang, G.; Zuo, S.; Jørgensen, G.; Koga, M.; Vejre, H. Critical Review on the Cooling Effect of Urban Blue-Green Space: A Threshold-Size Perspective. Urban For. Urban Green. 2020, 49, 126630. [Google Scholar] [CrossRef]
  24. Ampatzidis, P.; Kershaw, T. A Review of the Impact of Blue Space on the Urban Microclimate. Sci. Total Environ. 2020, 730, 139068. [Google Scholar] [CrossRef] [PubMed]
  25. Sahani, J.; Kumar, P.; Debele, S.; Spyrou, C.; Loupis, M.; Aragão, L.; Porcù, F.; Shah, M.A.R.; Di Sabatino, S. Hydro-Meteorological Risk Assessment Methods and Management by Nature-Based Solutions. Sci. Total Environ. 2019, 696, 133936. [Google Scholar] [CrossRef]
  26. Debele, S.E.; Kumar, P.; Sahani, J.; Marti-Cardona, B.; Mickovski, S.B.; Leo, L.S.; Porcù, F.; Bertini, F.; Montesi, D.; Vojinovic, Z.; et al. Nature-Based Solutions for Hydro-Meteorological Hazards: Revised Concepts, Classification Schemes and Databases. Environ. Res. 2019, 179, 108799. [Google Scholar] [CrossRef]
  27. Davies, C.; Chen, W.Y.; Sanesi, G.; Lafortezza, R. The European Union Roadmap for Implementing Nature-Based Solutions: A Review. Environ. Sci. Policy 2021, 121, 49–67. [Google Scholar] [CrossRef]
  28. Henud, I.R.; Póvoa, A.A.; Tavares, M.G.; Soares-Gomes, A. Coastal Resilience and Adaptation Strategies: Natural Habitats for Coastal Protection and Atlantic Forest Restoration on the Coast of the Rio de Janeiro State. Int. J. Disaster Risk Reduct. 2024, 113, 104861. [Google Scholar] [CrossRef]
  29. Santos, L.B. Nature-Based Solutions in Urban Periphery Communities in Brazil. Soc. Impacts 2024, 3, 100050. [Google Scholar] [CrossRef]
  30. Nature-Based Solutions in the Favelas’ Presented in Parallel to the G20. Available online: https://rioonwatch.org/?p=80117 (accessed on 13 May 2025).
  31. Snep, R.P.; Voeten, J.G.; Mol, G.; Van Hattum, T. Nature Based Solutions for Urban Resilience: A Distinction Between No-Tech, Low-Tech and High-Tech Solutions. Front. Environ. Sci. 2020, 8, 599060. [Google Scholar] [CrossRef]
  32. Bush, J.; Doyon, A. Building Urban Resilience with Nature-Based Solutions: How Can Urban Planning Contribute? Cities 2019, 95, 102483. [Google Scholar] [CrossRef]
  33. Young, A.F.; Marengo, J.A.; Coelho, J.O.M.; Scofield, G.B.; de Oliveira Silva, C.C.; Prieto, C.C. The Role of Nature-Based Solutions in Disaster Risk Reduction: The Decision Maker’s Perspectives on Urban Resilience in São Paulo State. Int. J. Disaster Risk Reduct. 2019, 39, 101219. [Google Scholar] [CrossRef]
  34. Plano de Renovação da Cidade Nova. Available online: https://storymaps.arcgis.com/collections/3fb748eebc534a4bb98a657d83a2cb7d (accessed on 29 May 2025).
  35. Almeida Neto, D.J.; Heller, L. Which is Riskier: Life on the Floodplain or in Housing Imposed from Above? The Case of Flood-Prone Areas in Rio Branco, Acre, Brazil. Environ. Urban. 2016, 28, 169–182. [Google Scholar] [CrossRef]
  36. Beck, H.E.; McVicar, T.R.; Vergopolan, N.; Berg, A.; Lutsko, N.J.; Dufour, A.; Zeng, Z.; Jiang, X.; van Dijk, A.I.J.M.; Miralles, D.G. High-Resolution (1 Km) Köppen-Geiger Maps for 1901–2099 Based on Constrained CMIP6 Projections. Sci. Data 2023, 10, 724. [Google Scholar] [CrossRef]
  37. POP.INFO: Censo 2022|DATA RIO. Available online: https://www.data.rio/apps/PCRJ::pop-info-censo-2022/about?path= (accessed on 18 May 2025).
  38. DATA RIO. Available online: https://datariov2-pcrj.hub.arcgis.com/ (accessed on 20 July 2025).
  39. Ladybug Tools|Food4Rhino. Available online: https://www.food4rhino.com/en/app/ladybug-tools (accessed on 20 July 2025).
  40. IPTU—Regularization of Registration Data—Carioca Digital Portal. Available online: https://carioca.rio/servicos/iptu-regularizacao-de-dados-cadastrais/ (accessed on 22 July 2025).
  41. Cobertura Vegetal e Uso da Terra 2018|DATA RIO. Available online: https://www.data.rio/datasets/c32974e0db954842b7af9a4816d7a821_0/about (accessed on 20 July 2025).
  42. Weather Data Center. Available online: https://www.ashrae.org/technical-resources/bookstore/weather-data-center (accessed on 20 July 2025).
  43. EarthExplorer. Available online: https://earthexplorer.usgs.gov/ (accessed on 20 July 2025).
  44. Tadi, M.; Vahabzadeh Manesh, S.; Mohammad Zadeh, M.H. Urban Morphology, Environmental Performances, and Energy Use: Neighborhood Transformation in Rio de Janeiro via IMM. J. Archit. Eng. Technol. 2017, 5, 180. [Google Scholar]
  45. Breuste, J.; Qureshi, S.; Li, J. Scaling Down the Ecosystem Services at Local Level for Urban Parks of Three Megacities. Hercynia 2013, 46, 1–20. Available online: https://www.academia.edu/download/53183342/Scaling_down_the_ecosystem_services_at_l20170518-21584-qe1i4e.pdf (accessed on 29 May 2025).
  46. Grunwald, L.; Heusinger, J.; Weber, S. A GIS-Based Mapping Methodology of Urban Green Roof Ecosystem Services Applied to a Central European City. Urban For. Urban Green. 2017, 22, 54–63. [Google Scholar] [CrossRef]
  47. Dormidontova, V.; Belkin, A. The Continuity of Open Greened Spaces—Basic Principle of Urboecology. IOP Conf. Ser. Mater. Sci. Eng. 2020, 753, 022048. [Google Scholar] [CrossRef]
  48. Bennett, G.; Wit, P.D. The Development and Application of Ecological Networks: A Review of Proposals, Plans and Programmes; International Union for Conservation of Nature (IUCN): Gland, Switzerland, 2001. [Google Scholar]
  49. Hilty, J.; Worboys, G.; Keeley, A.; Woodley, S.; Lausche, B. Guidelines for Conserving Connectivity Through Ecological Networks and Corridors. 2020. Available online: https://www.researchgate.net/profile/Jamie-Pittock/publication/342749223_Guidelines_for_conserving_connectivity_through_ecological_networks_and_corridors/links/5f057da74585155050947d43/Guidelines-for-conserving-connectivity-through-ecological-networks-and-corridors.pdf (accessed on 3 July 2025).
  50. Hagishima, A. Green Infrastructure and Urban Sustainability. AIP Conf. Proc. 2018, 1931, 020002. [Google Scholar] [CrossRef]
  51. Kumakoshi, Y.; Chan, S.Y.; Koizumi, H.; Li, X.; Yoshimura, Y. Standardized Green View Index and Quantification of Different Metrics of Urban Green Vegetation. Sustainability 2020, 12, 7434. [Google Scholar] [CrossRef]
  52. Simpkins, C.E.; Dennis, T.E.; Etherington, T.R.; Perry, G.L.W. Assessing the Performance of Common Landscape Connectivity Metrics Using a Virtual Ecologist Approach. Ecol. Modell. 2018, 367, 13–23. [Google Scholar] [CrossRef]
  53. Bolund, P.; Hunhammar, S. Ecosystem Services in Urban Areas. Ecol. Econ. 1999, 29, 293–301. [Google Scholar] [CrossRef]
  54. National Research Council. Division on Earth and Life Studies, Water Science and Technology Board, Committee on Reducing Stormwater Discharge Contributions to Water Pollution. Urban Stormwater Management in the United States; National Academies Press: Washington, DC, USA, 2009. [Google Scholar]
  55. Chow, V.T.; Maidment, D.R.; Mays, L.W. Applied Hydrology; McGraw-Hill: New York, NY, USA, 1988. [Google Scholar]
  56. Tadi, M.; Manesh, S.V. Transformation of an Urban Complex System into a More Sustainable Form Via Integrated Modification Methodology (IMM). Int. J. Sustain. Dev. Plan. 2014, 9, 514–537. [Google Scholar] [CrossRef]
  57. Tadi, M.; Manesh, V.; Mohammad, M.H.; Zaniol, F. Transforming Urban Morphology and Environmental Performances via IMM® The Case of PortoMaravilha in Rio de Janeiro. GSTF J. Eng. Technol. 2014, 3, 13. [Google Scholar] [CrossRef]
  58. World Health Organisation. Urban Green Spaces: A Brief for Action; World Health Organisation: Geneva, Switzerland, 2017. [Google Scholar]
  59. Huang, Y.; Yang, J.; Chen, J.; Shi, H.; Lu, X. Association between ambient temperature and age-specific mortality from the elderly: Epidemiological evidence from the Chinese prefecture with most serious aging. Environ. Res. 2022, 211, 113103. [Google Scholar] [CrossRef]
  60. Braga, A.L.; Zanobetti, A.; Schwartz, J. The effect of weather on respiratory and cardiovascular deaths in 12 US cities. Environ. Health Perspect. 2002, 110, 859–863. [Google Scholar] [CrossRef]
  61. Tadi, M.; Zadeh, M.H.; Biraghi, C.A. The Integrated Modification Methodology. In Environmental Performance and Social Inclusion in Informal Settlements: A Favela Project Based on the IMM Integrated Modification Methodology; Springer: Berlin/Heidelberg, Germany, 2020; pp. 15–37. [Google Scholar]
  62. Bennett, G.; Mulongoy, K.J. Review of Experience with Ecological Networks, Corridors and Buffer Zones; Technical Series No. 23; Secretariat of the Convention on Biological Diversity: Montreal, QC, Canada, 2006; 100p. [Google Scholar]
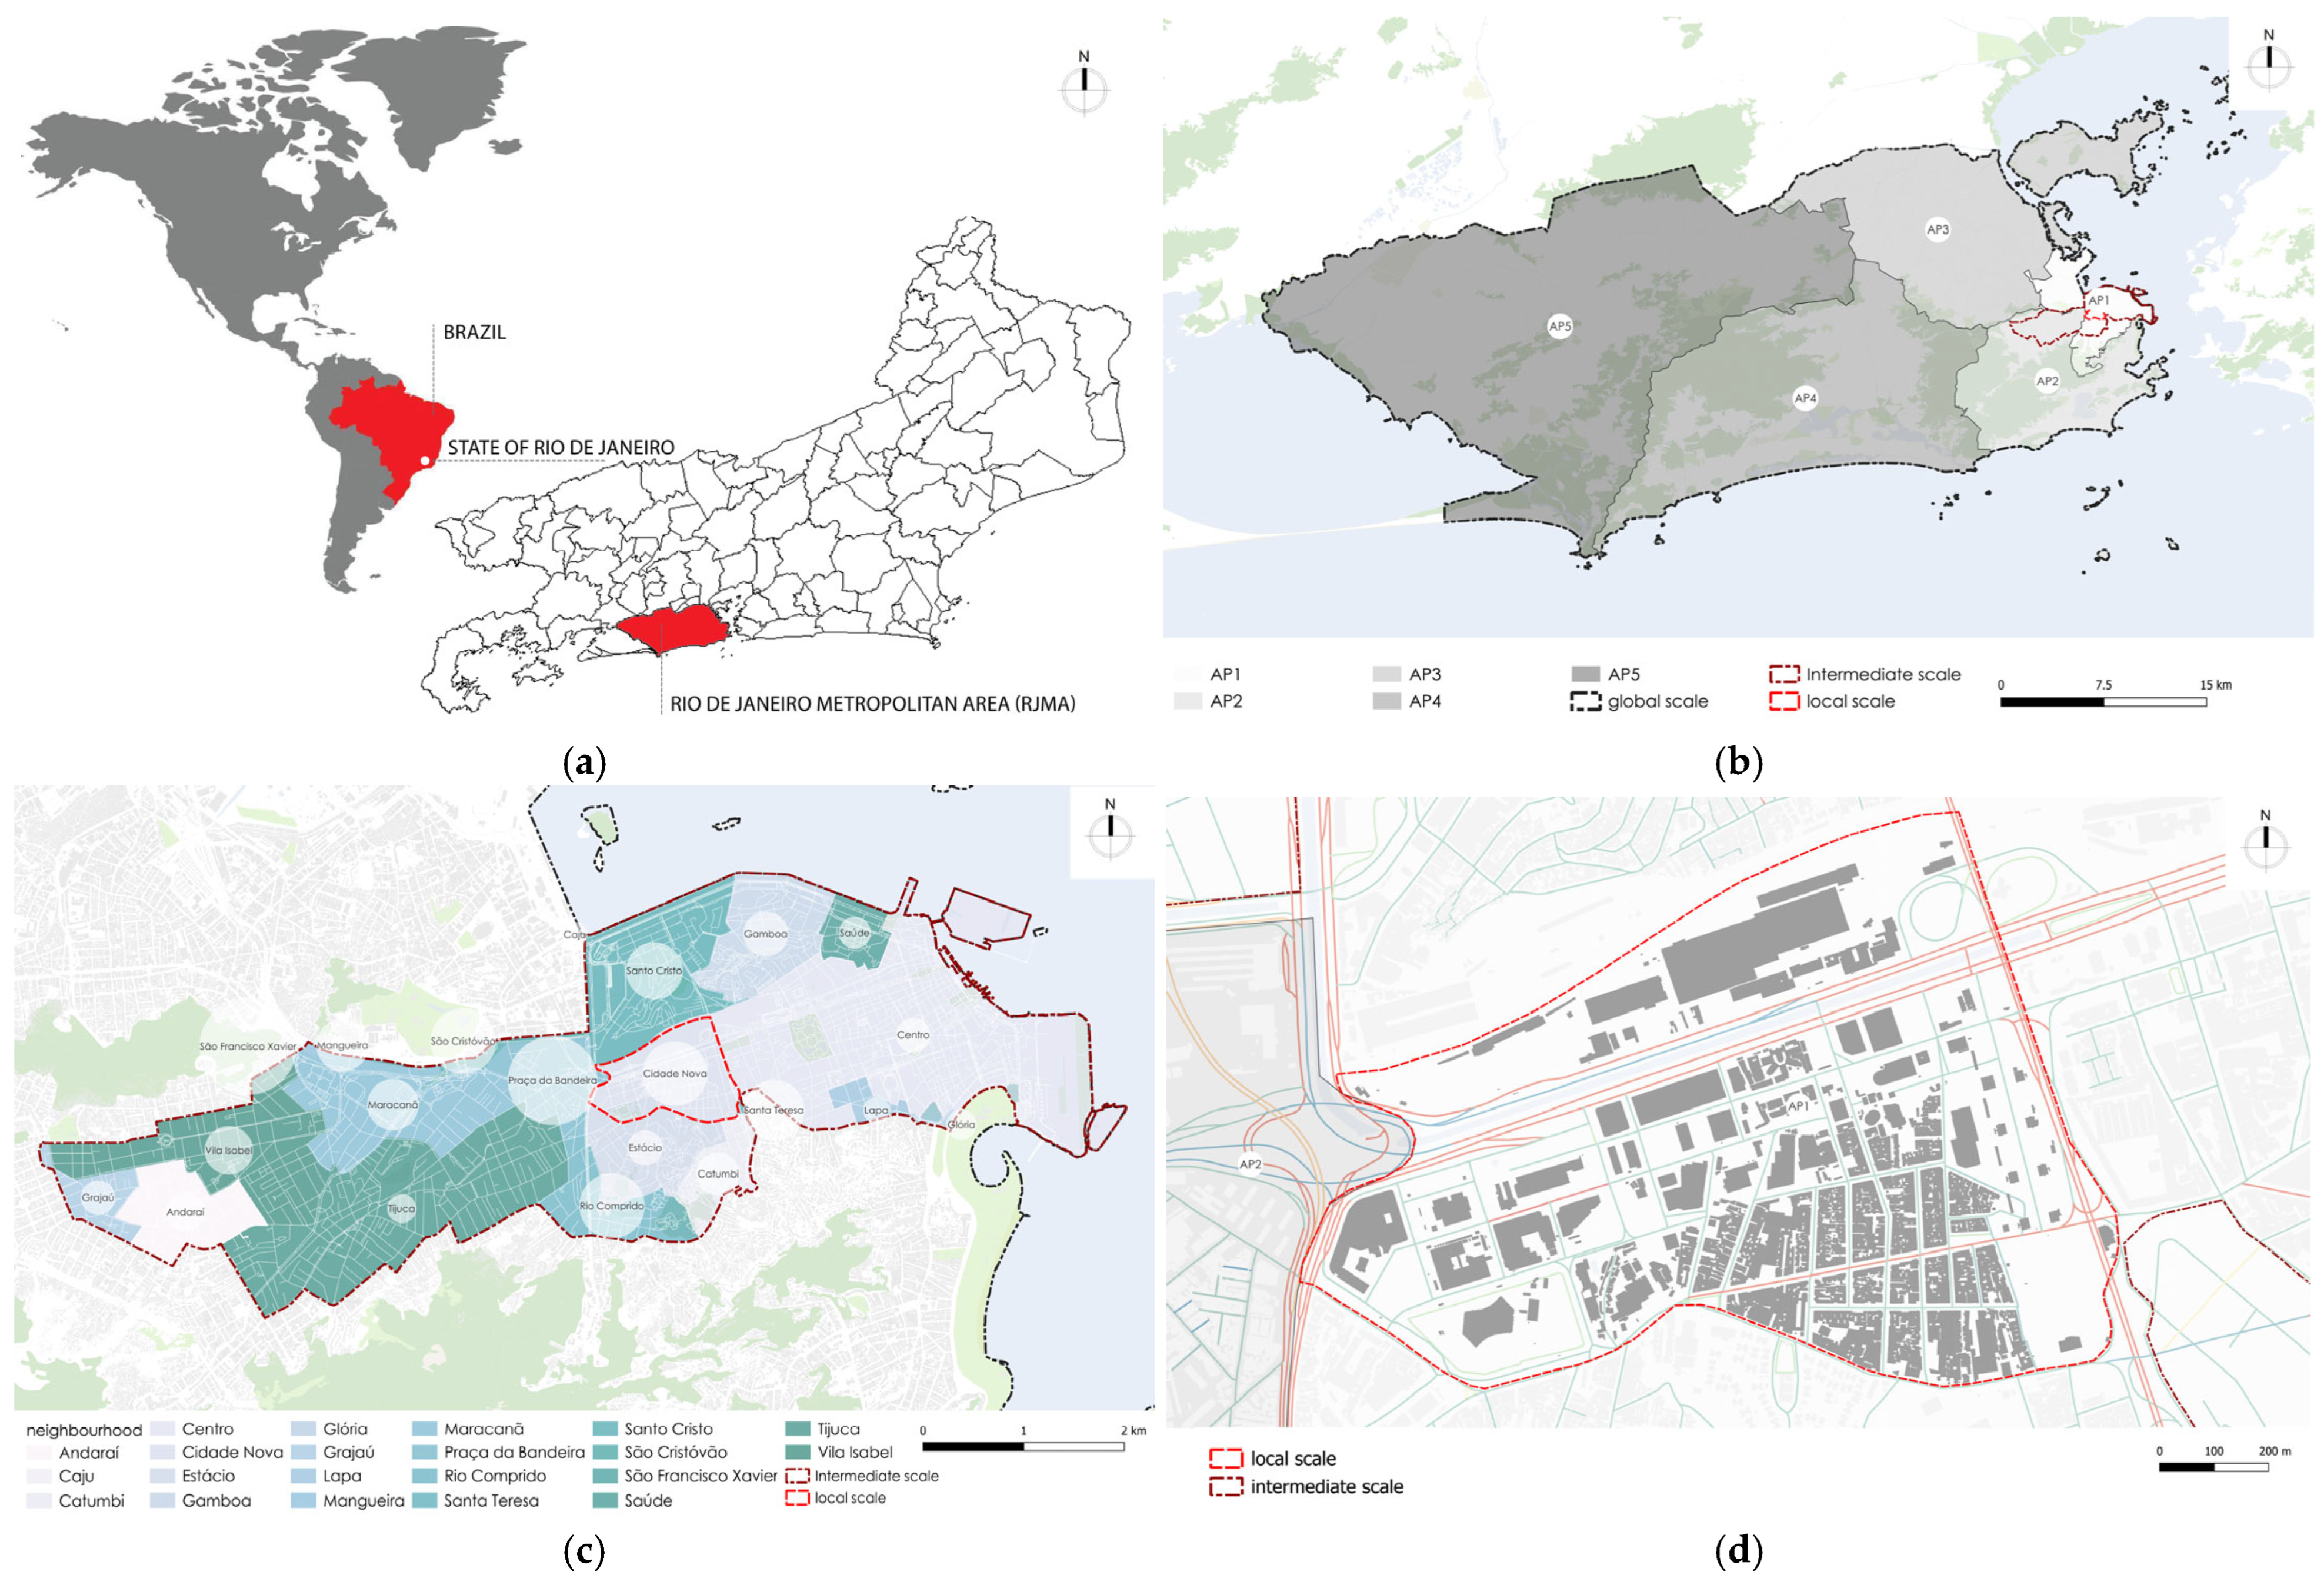
Figure 1. Multi-scale boundaries: (a) the state of Rio de Janeiro, demonstrating the strategic location of the study area; (b) global-scale boundary illustrating five Planning Areas (APs); (c) intermediate scale highlighting the neighbourhoods; (d) local-scale boundary.
Urbansci 09 00339 g001
Figure 2. Morphological subsystems: (a) volumetric distribution at the global scale, (b) population-density gradient; urban density contrast between the central port area and south-west part of the boundary revealing zoning policies, (c) dominant building typologies, and (d) height–density correlations in Cidade Nova; a low population and high-rise distribution are shown along Av. Pres. Vargas as one of the main throughways in the city.
Urbansci 09 00339 g002
Figure 3. (a) Porosity analysis intermediate-scale modelling heat map of building height distribution. (b) Porosity analysis on the local scale. (c) Time-based proximity analysis on the intermediate scale. (d) Proximity analysis on the local scale.
Urbansci 09 00339 g003
Figure 4. Urban green (UG) patches were categorized by size (small, medium, large) and ecological value (based on a biodiversity-intactness index), with influence buffers (60, 300, 500 m) assigned to detect spatial overlaps and potential corridors. (a) Ecological buffer zones on the intermediate scale. (b) Ecological buffer zones on the local scale.
Urbansci 09 00339 g004
Figure 5. Surface runoff modelling identifies high-risk areas (construction, brownfield, and impermeable zones) where urban drainage and land use contribute to potential flooding. (a) Surface runoff on the intermediate scale. (b) Surface runoff on the local scale.
Urbansci 09 00339 g005
Figure 6. (a) Statistical analysis of urban heat island (UHI) contributing factors in Cidade Nova based on Grasshopper simulation. (a) Rural vs. urban temperature comparison under existing conditions, showing monthly variations. (b) Key drivers of UHI intensity, with buildings contributing 75% of the observed heat island effect. (c) Temperature difference between rural and urban areas in July (winter day). (d) Temperature difference between rural and urban areas in February (summer day).
Urbansci 09 00339 g006
Figure 8. Scenario 1: proposed green–blue corridors and ecological impact assessment. (a) One of four proposed green–blue corridor designs (entitled A–E) aimed at enhancing connectivity between high-value urban green spaces (UGSs). The corridors (green polygons) integrate existing water canals to strengthen ecological networks. (b) Ecological buffer zones generated by the corridors, illustrating their potential to expand habitat connectivity and support biodiversity through buffer modelling.
Urbansci 09 00339 g008
Table 1. Multi-scale boundaries of urban element investigation.
Scale Area (km2)Population Description
Global scale12006,211,223 [37]The capital of the state of Rio de Janeiro.
Intermediate scale21350,735 121 neighbourhoods, mainly the historic development of the city by the port and Centro, expanded to the west by Andarai, and Grajau.
Local scale17708Cidade Nova, the northeast region of Belo Horizonte, including the boundary defined by the REMIRIO project.
1 Population estimates for designated boundaries in Rio de Janeiro were derived using official 2022 Census data from data.rio supplemented with GPW (Gridded Population of the World) v4.11 at 30 arc-second (~1 km) resolution for spatial refinement in QGIS.
Table 2. Data sources and their applications in UHI, flooding, and green continuity analysis.
Data CategoryData SourceApplicationAnalysis Tool
Urban Geometry and Land UseDATA.RIO [38] (Instituto Municipal de Urbanismo Pereira Passos, IPP)Building footprints, heights, land cover classification for morphology analysis and UHI/flood surface runoff.QGIS 3.34 “Prizren”, DepthmapX 0.8.0, Urbano (Grasshopper 1.0.0007)
Green InfrastructureCobertura Vegetal e Uso da Terra (2018) [41], OpenStreetMap (OSM)Mapping green spaces, ecological value assessment, and fragmentation analysis for green continuity.QGIS 3.34 “Prizren”
Climatic DataASHRAE Zone 1, EnergyPlus Weather (EPW) files [42]Microclimate simulations (UHI), temperature differentials, and thermal performance of materials.Ladybug 1.6.0/Dragonfly1.6.0 (Grasshopper 1.0.0007) [39]
Hydrological DataUSGS EarthExplorer [43] (30 m DEM), rational method (Q = C· I · A)Slope, drainage density, floodwater depth, and runoff modelling for flood risk assessment.QGIS 3.34 “Prizren”, Grasshopper 1.0.0007
Anthropogenic HeatTraffic-derived estimates (20 W/m2 baseline)Modelling heat contributions from traffic and built environment for UHI analysis.Ladybug 1.6.0/Dragonfly 1.6.0 (Grasshopper 1.0.0007) [39]
Population DataDATA.RIO (Census 2022) [37], GPW (Gridded Population of the World) v4.11Spatial distribution of population for accessibility metrics (e.g., park proximity).QGIS 3.34 “Prizren”
Ecological MetricsBiodiversity-intactness index, Green View Index (GVI = (Gp/A) × 100) 1, landscape connectivityAssessing green space functionality, connectivity, and ecosystem services.QGIS 3.34 “Prizren”, custom scripts
1 Gp = number of green pixels (vegetation) in an image, A = total number of pixels in the image. The result is expressed as a percentage (0–100%). This index measures the proportion of greenery visible from the pedestrian viewpoint or, in this study, estimated via surface visibility proxies within GIS-based analysis.
Disclaimer/Publisher’s Note: The statements, opinions and data contained in all publications are solely those of the individual author(s) and contributor(s) and not of MDPI and/or the editor(s). MDPI and/or the editor(s) disclaim responsibility for any injury to people or property resulting from any ideas, methods, instructions or products referred to in the content.