Article

Grid-Connected Photovoltaic Systems as an Alternative for Sustainable Urbanization in Southeastern Mexico

by
Adán Acosta-Banda
1,*,
Verónica Aguilar-Esteva
2,
Liliana Hechavarría Difur
3,
Eduardo Campos-Mercado
4,
Benito Cortés-Martínez
3 and
Miguel Patiño-Ortiz
5
1
Instituto de Estudios de la Energía, SECIHTI-Universidad del Istmo, Ciudad Universitaria S/N Barrio Santa Cruz 4a. Sección, Sto. Domingo Tehuantepec, Oaxaca C.P. 70760, Mexico
2
Departamento de Ingeniería en Diseño, Universidad del Istmo, Ciudad Universitaria S/N Barrio Santa Cruz 4a. Sección, Sto. Domingo Tehuantepec, Oaxaca C.P. 70760, Mexico
3
División de Estudios de Posgrado, Universidad del Istmo, Ciudad Universitaria S/N Barrio Santa Cruz 4a. Sección, Sto. Domingo Tehuantepec, Oaxaca C.P. 70760, Mexico
4
Investigador por México, SECIHTI-Universidad del Istmo, Ciudad Universitaria S/N Barrio Santa Cruz 4a. Sección, Sto. Domingo Tehuantepec, Oaxaca C.P. 70760, Mexico
5
Sección de Estudio de Posgrado e Investigación de la ESIME Zacatenco, Instituto Politécnico Nacional, Unidad Profesional Adolfo López Mateos, Mexico City C.P. 07738, Mexico
*
Author to whom correspondence should be addressed.
Urban Sci. 2025, 9(8), 329; https://doi.org/10.3390/urbansci9080329
Submission received: 26 June 2025 / Revised: 13 August 2025 / Accepted: 13 August 2025 / Published: 20 August 2025
(This article belongs to the Special Issue Sustainable Urbanization, Regional Planning and Development)

Abstract

Rapid urban growth poses distinct energy and environmental challenges in various regions of the world. This study evaluated the technical and economic feasibility of a grid-connected photovoltaic system in Santo Domingo Tehuantepec, Oaxaca, Mexico, using Homer Pro software, version 3.14.2, to simulate realistic scenarios. The analysis incorporated local climate data, residential load profiles, and updated economic parameters for 2024. System optimization resulted in an installed capacity of 173 kW of solar panels and 113 kW of inverters, yielding a levelized cost of energy (LCOE) of MXN 1.43/kWh, a return on investment (ROI) of 5.3%, an internal rate of return (IRR) of 8%, and a simple payback period of 10 years. The projected annual energy output was 281,175 kWh, covering 36% of the local energy demand. These results highlight the potential for integrating renewable energy into urban contexts, offering significant economic and environmental benefits. The integration of public policy with urban planning can enhance energy resilience and sustainability in intermediate cities. This study also supports the application of tools such as Homer Pro in designing energy solutions tailored to local conditions and contributes to a fair and decentralized energy transition.

1. Introduction

The need to mitigate the global effects of climate change calls for a transition toward energy systems based on renewable sources [1,2,3,4]. This transformation entails replacing fossil energy sources with alternatives that significantly reduce greenhouse gas emissions. In this context, the United Nations Sustainable Development Goals (SDGs) aim to ensure access to affordable and clean energy for all and to increase the share of renewable energy by the year 2030 [5,6,7]. This energy transition is supported globally by governmental regulatory frameworks, private sector initiatives, and growing public awareness of sustainability issues [8,9,10].
Despite international efforts to curb pollutant emissions and limit global warming to 1.5 °C, the energy sector reached a new record in 2024, with a 0.8% increase in energy-related CO2 emissions, totaling a historic high of 37.8 Gt of CO2 [11,12]. This rise contributed to unprecedented atmospheric concentrations of 422.5 ppm, approximately 3 ppm higher than those in 2023 and 50% above pre-industrial levels. Figure 1 presents two complementary visualizations: Figure 1a shows the evolution of global CO2 emissions from energy combustion and industrial processes between 1900 and 2023; Figure 1b illustrates the annual variation in those emissions up to 2024 [11]. These data underscore the urgency of accelerating the adoption of clean energy sources as part of a broader strategy for sustainable development and urbanization [13,14,15].
Climate change poses a serious threat to humanity and is largely driven by the intensive use of fossil fuels, particularly in urban settings characterized by unsustainable patterns of expansion and densification [16,17]. This situation has prompted an energy transition focused on decarbonization [18,19,20,21,22], with benefits that include reduced environmental impact, improved energy efficiency, greater supply stability, and long-term economic viability. Within this framework, solar photovoltaic energy stands out as a strategic solution due to its scalability, availability, and ease of integration into densely populated urban areas, especially in regions with high solar irradiance [23,24,25,26,27,28,29].
In response to global challenges, efforts to transform the energy model have begun to yield tangible results. In 2024, more than 80% of the global increase in electricity generation was attributed to clean energy sources, with solar photovoltaic energy contributing the most—approximately 480 TWh worldwide [11,30,31,32,33]. This progress reflects a technological evolution aligned with the goals of sustainable urbanization and energy resilience. Figure 2 illustrates these developments through four visual components: (a) share of global electricity generation growth (2003–2024); (b) annual variation by energy source; (c) generation mix by region in 2024; and (d) additions in renewable capacity by technology between 2019 and 2024 [11].
This study is framed within the United Nations 2030 Agenda and contributes directly to the achievement of the SDGs, particularly SDGs 7, 11, and 13 (Table 1) [34,35,36]. These include the following: SDG 7, which seeks to ensure access to affordable, reliable, sustainable, and modern energy [37,38]; SDG 11, aimed at making cities and human settlements inclusive, safe, resilient, and sustainable [39,40,41]; and SDG 13, focused on taking urgent action to combat climate change and its impacts [42,43,44]. In line with these objectives, the implementation of grid-connected solar photovoltaic systems in strategic regions such as the Isthmus of Tehuantepec, Oaxaca, Mexico, represents a viable strategy to strengthen energy sovereignty, reduce energy poverty, and promote resilient urbanization in the face of climate change [45]. In this context, urban resilience refers to the capacity of cities and their inhabitants to anticipate, absorb, adapt to, and recover effectively from adverse events—such as extreme weather, energy crises, or environmental disasters—while ensuring the continuity of essential urban services and preserving quality of life [46,47]. Thomas et al. [48] note that access to solar energy in marginalized communities significantly improves quality of life. Similarly, Ebhota and Jen [49] provide evidence that integrating photovoltaic technologies in urban settings reduces fossil fuel dependence and improves air quality. Moreover, solar systems installed in urban areas have a direct impact on reducing greenhouse gas emissions, thereby reinforcing their role in local and regional climate action [50,51,52,53].
Achieving the renewable energy transition envisioned by the SDGs requires optimal system design that ensures both technical reliability and economic viability [36,54,55,56]. International studies have demonstrated the effectiveness of Homer Pro software as a tool for assessing the feasibility of grid-connected photovoltaic systems. Homer Pro has established itself as a robust platform for evaluating hybrid power generation systems. It enables the simulation of technical and economic configurations through hourly analyses over a one-year period, taking into account variables such as investment, operation and maintenance costs, interest rates, system lifespan, energy efficiency, and the seasonal behavior of renewable resources. This capability makes Homer Pro particularly suitable for this study, as it allows us to model site-specific conditions in the Isthmus of Tehuantepec, including high solar irradiance, elevated temperatures, persistent winds, and variable atmospheric dust levels. By incorporating real local climate data, demand profiles, and economic parameters, the software can evaluate multiple configurations and identify the most cost-effective and technically feasible solutions. This approach directly addresses the research gap identified in the Introduction, as no previous studies have systematically assessed the techno-economic feasibility of grid-connected PV systems under these specific regional conditions. Numerous studies involving both renewable and conventional energy sources have used this software to estimate the performance and profitability of photovoltaic systems, whether stand-alone or grid-connected [57,58,59,60,61,62,63].
For example, Ali et al. [64] conducted a simulation in Bangladesh evaluating a grid-connected photovoltaic system and concluded that the levelized cost of energy (LCOE) was lower than the market price, promoting energy savings and urban sustainability. In Nigeria, Idris, Ibrahim, and Alibani [65] evaluated various hybrid configurations using Homer Pro in semi-urban areas, highlighting the economic advantages of photovoltaic systems over conventional diesel use [66,67,68].
Mojumder, Hasanuzzaman, and Cuce [69] conducted a techno-economic analysis of a grid-connected photovoltaic system for a residential building, reporting a positive return on investment and significant reductions in CO2 emissions. In the Latin American context, the integration of solar systems into urban grids based on actual consumption data has shown improved viability when supported by tax incentives and seasonal pricing schemes [70,71,72,73].
In climates similar to the Isthmus of Tehuantepec, such as semi-arid regions of India and North Africa [74,75], studies have identified optimal configurations using Homer Pro that take into account factors such as high temperatures, low relative humidity, and dust accumulation. These findings reinforce the importance of evaluating photovoltaic systems under specific local climate conditions to ensure long-term efficiency and feasibility.
In Ecuador, Gavidia-Merino [76] evaluated a stand-alone photovoltaic system in a residential setting with a daily energy demand of 3 kWh and demonstrated its profitability, with a six-year payback period. Gualotuña-Gualotuña [77] compared solar and wind systems on Baltra Island (Ecuador), concluding that the solar system had lower operating costs. Similarly, Ruíz-Altamirano [78] analyzed three generation scenarios in a high-consumption commercial facility in Honduras, finding that a grid-connected photovoltaic system with battery and diesel backup provided the best economic and technical outcomes.
The objective of this study is to assess the techno-economic feasibility of a grid-connected photovoltaic system in the Isthmus of Tehuantepec, Oaxaca, Mexico, using Homer Pro software. The study area is characterized by high solar irradiance and distinctive environmental conditions, including elevated temperatures, persistent winds, and variable atmospheric dust concentrations—factors that make it a strategic location for solar energy generation. However, there is a lack of systematic studies documenting the technical and economic performance of grid-connected photovoltaic systems under such specific conditions. This gap limits the development of tailored energy strategies adapted to regional characteristics. The present research aims to generate empirical evidence to support regional energy planning under particular climatic scenarios and to provide tools for decision-making aligned with sustainable development goals. This focus on a mid-sized Latin American city directly addresses a gap in the existing literature, where most studies concentrate on large metropolitan areas, and contributes to a more comprehensive understanding of the challenges and opportunities for PV integration in similar urban contexts across the region.
To guide the scope and focus of this research, the following questions were addressed:
(1)
What is the techno-economic feasibility of implementing a grid-connected photovoltaic system in a mid-sized Mexican city under current market and policy conditions?
(2)
How does system optimization influence environmental and economic performance compared to a base scenario designed to fully meet the energy demand?
These questions frame the methodological approach and provide a structured path to evaluate the technical, economic, and environmental dimensions of the proposed system.
The proposed approach is framed within the broader context of urban energy policy and sustainable territorial development. Grid-connected PV systems in mid-sized cities can serve as key infrastructure for achieving climate mitigation targets, reducing dependence on fossil fuels, and enhancing local energy resilience. In urban planning terms, the deployment of distributed PV contributes to more compact and efficient urban forms by promoting localized generation and reducing transmission requirements. From a territorial development perspective, integrating renewable energy into municipal plans supports balanced regional growth, improves the sustainability of public services, and aligns with international frameworks such as the United Nations Sustainable Development Goals (SDGs 7, 11, and 13). By situating the Santo Domingo Tehuantepec case study within these policy and planning considerations, the present research demonstrates how localized techno-economic assessments can inform decision-making for sustainable urban transformation.

2. Materials and Methods

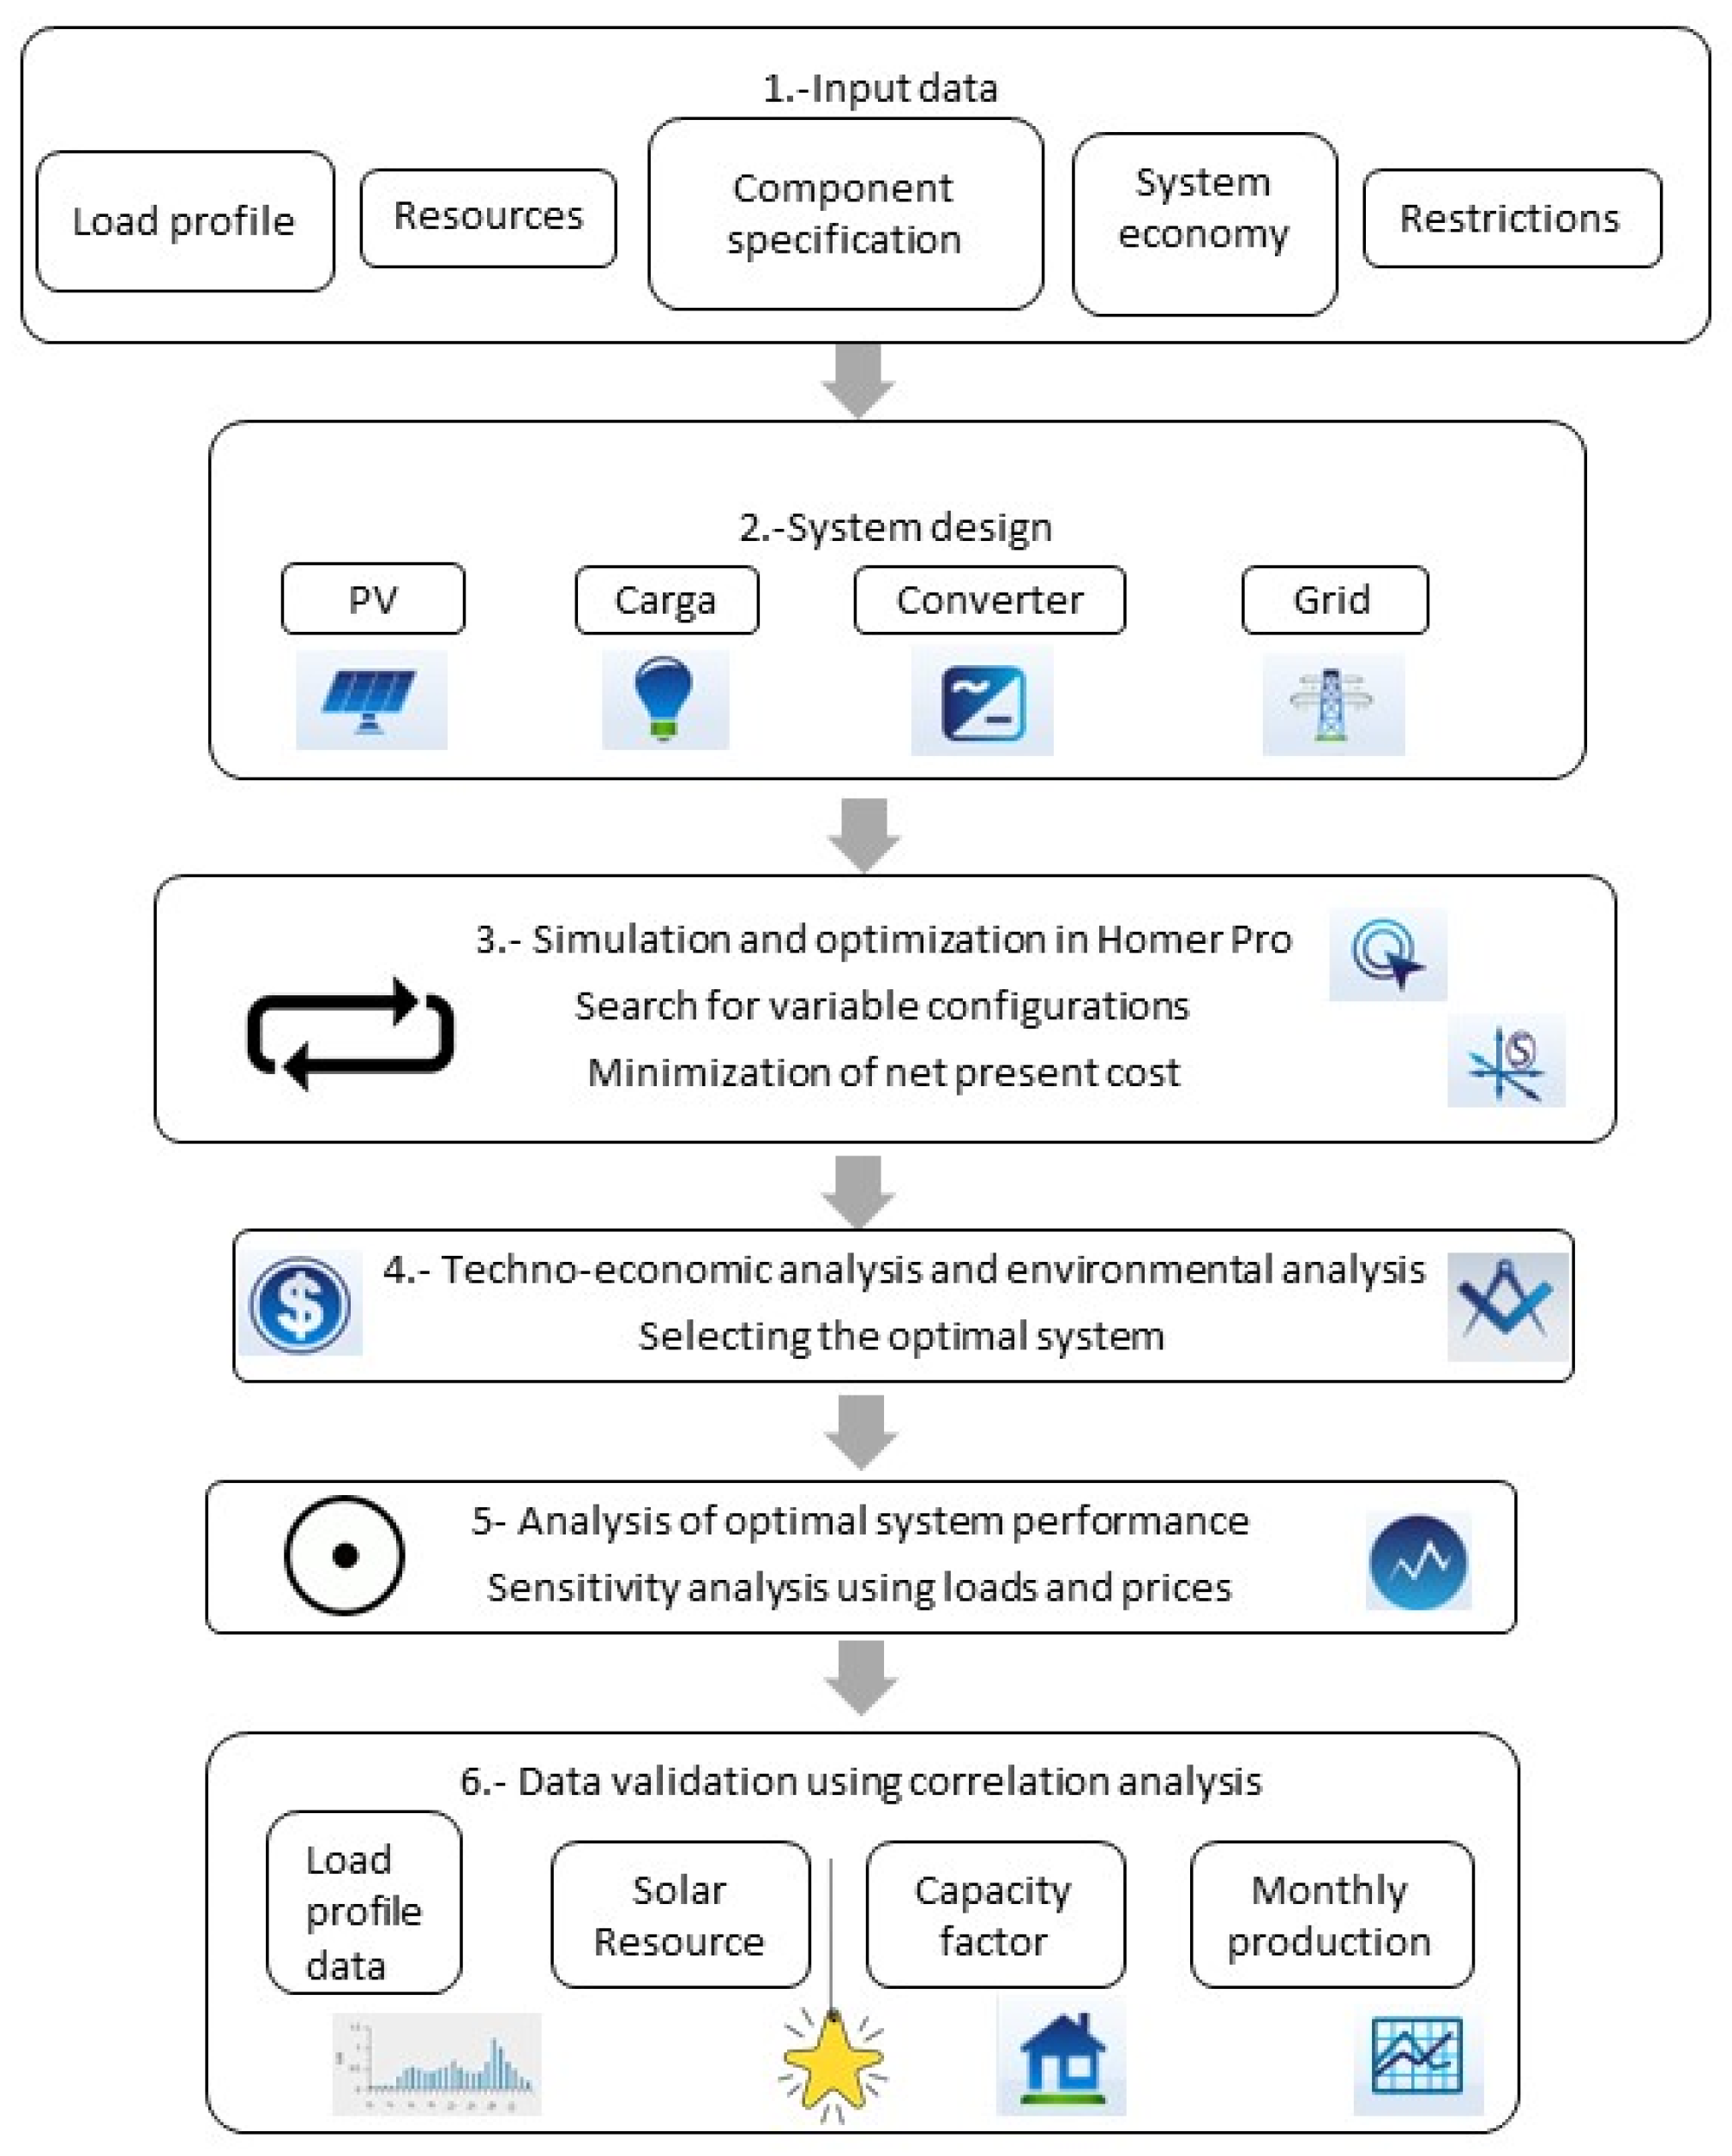
Figure 3 presents the flowchart summarizing the methodology used to evaluate the techno-economic feasibility of a grid-connected solar photovoltaic system through the use of Homer Pro software [79,80]. The study began with the collection of input data, including the load profile, local solar resource, technical specifications of the system components, economic parameters, and operational constraints. The system was then designed by incorporating the main elements: solar panels, inverters, load, and grid connection. Homer Pro, version 3.14.2, carried out simulations under multiple scenarios to identify the optimal configuration by minimizing the net present cost. Homer Pro is a widely used optimization and simulation tool for hybrid energy systems, developed by Homer Energy. In this study, it was employed to model grid-connected photovoltaic systems, automatically considering electrical losses from factors such as inverter efficiency, wiring, and operational conditions. The software performs hourly energy balance calculations over a typical meteorological year, determining the most suitable inverter capacity and system configuration by simulating multiple technical and economic scenarios. Its optimization algorithm ranks configurations according to technical feasibility and cost-effectiveness, integrating component costs, resource data, and operational constraints to support decision-making in renewable energy planning. Subsequently, a combined analysis was performed to assess the technical performance, economic viability, and environmental potential of the alternatives, followed by a sensitivity analysis to evaluate variations in load and energy prices. Finally, the results were validated through a correlation analysis between simulated data and key system parameters, such as solar resource, capacity factor, and estimated monthly production.

2.1. Homer Pro Software Analysis

The analysis using Homer Pro included both a preliminary stage and a post-simulation evaluation. In the initial phase, key input parameters are defined, including the load profile, resource data (solar, wind, temperature, etc.), cost structures, technical specifications of system components, and project constraints. During the simulation phase, Homer Pro assesses technical feasibility by modeling various system configurations. The system’s energy balance is calculated on an hourly basis over a full year and compared with the corresponding demand. Economic indicators are also computed when the configuration meets the minimum feasibility criteria [79].
During the optimization process, decision variables, such as photovoltaic (PV) and converter capacities, are adjusted to minimize the objective function, defined as the net present cost, while system constraints, such as maximum allowable annual shortage, minimum renewable energy fraction, and required operating reserve, are satisfied. This iterative process continues until convergence is achieved in both system design and cost optimization, based on predefined accuracy thresholds. Once the feasible and optimized configurations are identified, they are ranked in ascending order of net present cost, allowing for the selection of the most cost-effective system.
In the final evaluation phase, Homer Pro analyzes the operational performance of the selected configuration and conducts a sensitivity analysis to evaluate the impact of uncertain variables, such as load fluctuations and energy price variations. Additionally, the input data used for the load profile and solar resource are validated through correlation analysis.

2.2. Site Suitability Analysis

Site suitability analysis is an important component of renewable energy project planning. In this particular case study, the suitability of the site for implementing a grid-connected solar photovoltaic system was evaluated. This involved assessing potential areas based on climatic, geographic, environmental, and socioeconomic factors that affect the productivity and performance of power generation systems. For this purpose, the influencing factors were compared and prioritized. The most relevant included solar irradiance, wind speed, temperature, global radiation, peak sun hours, and proximity to existing infrastructure. From a geographic perspective, elevation, slope, and terrain orientation were considered. From an environmental and territorial standpoint, constraints such as protected areas, bodies of water, regions of high biodiversity, and population density were identified. Socioeconomic factors included proximity to existing electrical infrastructure, transportation routes, and urban centers, as well as the opportunity cost of land use. This analytical approach supports evidence-based decision-making and contributes to optimizing site selection for new power generation facilities.
In this study, the identified factors were qualitatively prioritized based on their direct influence on technical performance, economic feasibility, and implementation viability. Solar irradiance was assigned the highest priority due to its critical impact on energy yield. Roof orientation, tilt, and shading conditions were also classified as high-priority technical factors, as they determine the actual capture of solar radiation. Medium-priority factors included accessibility for installation and maintenance, as well as proximity to transportation routes and urban centers, given their influence on construction logistics and operational costs. Grid stability and proximity to electrical infrastructure were considered medium-high priority due to their role in enabling reliable energy export and integration into the distribution network. Environmental and territorial restrictions, such as protected areas and high biodiversity zones, were evaluated as exclusionary criteria, meaning that sites affected by these constraints were automatically discarded from consideration. This prioritization framework ensured that the selected location met both performance-oriented and regulatory requirements.

2.2.1. Geographical Context of the Study

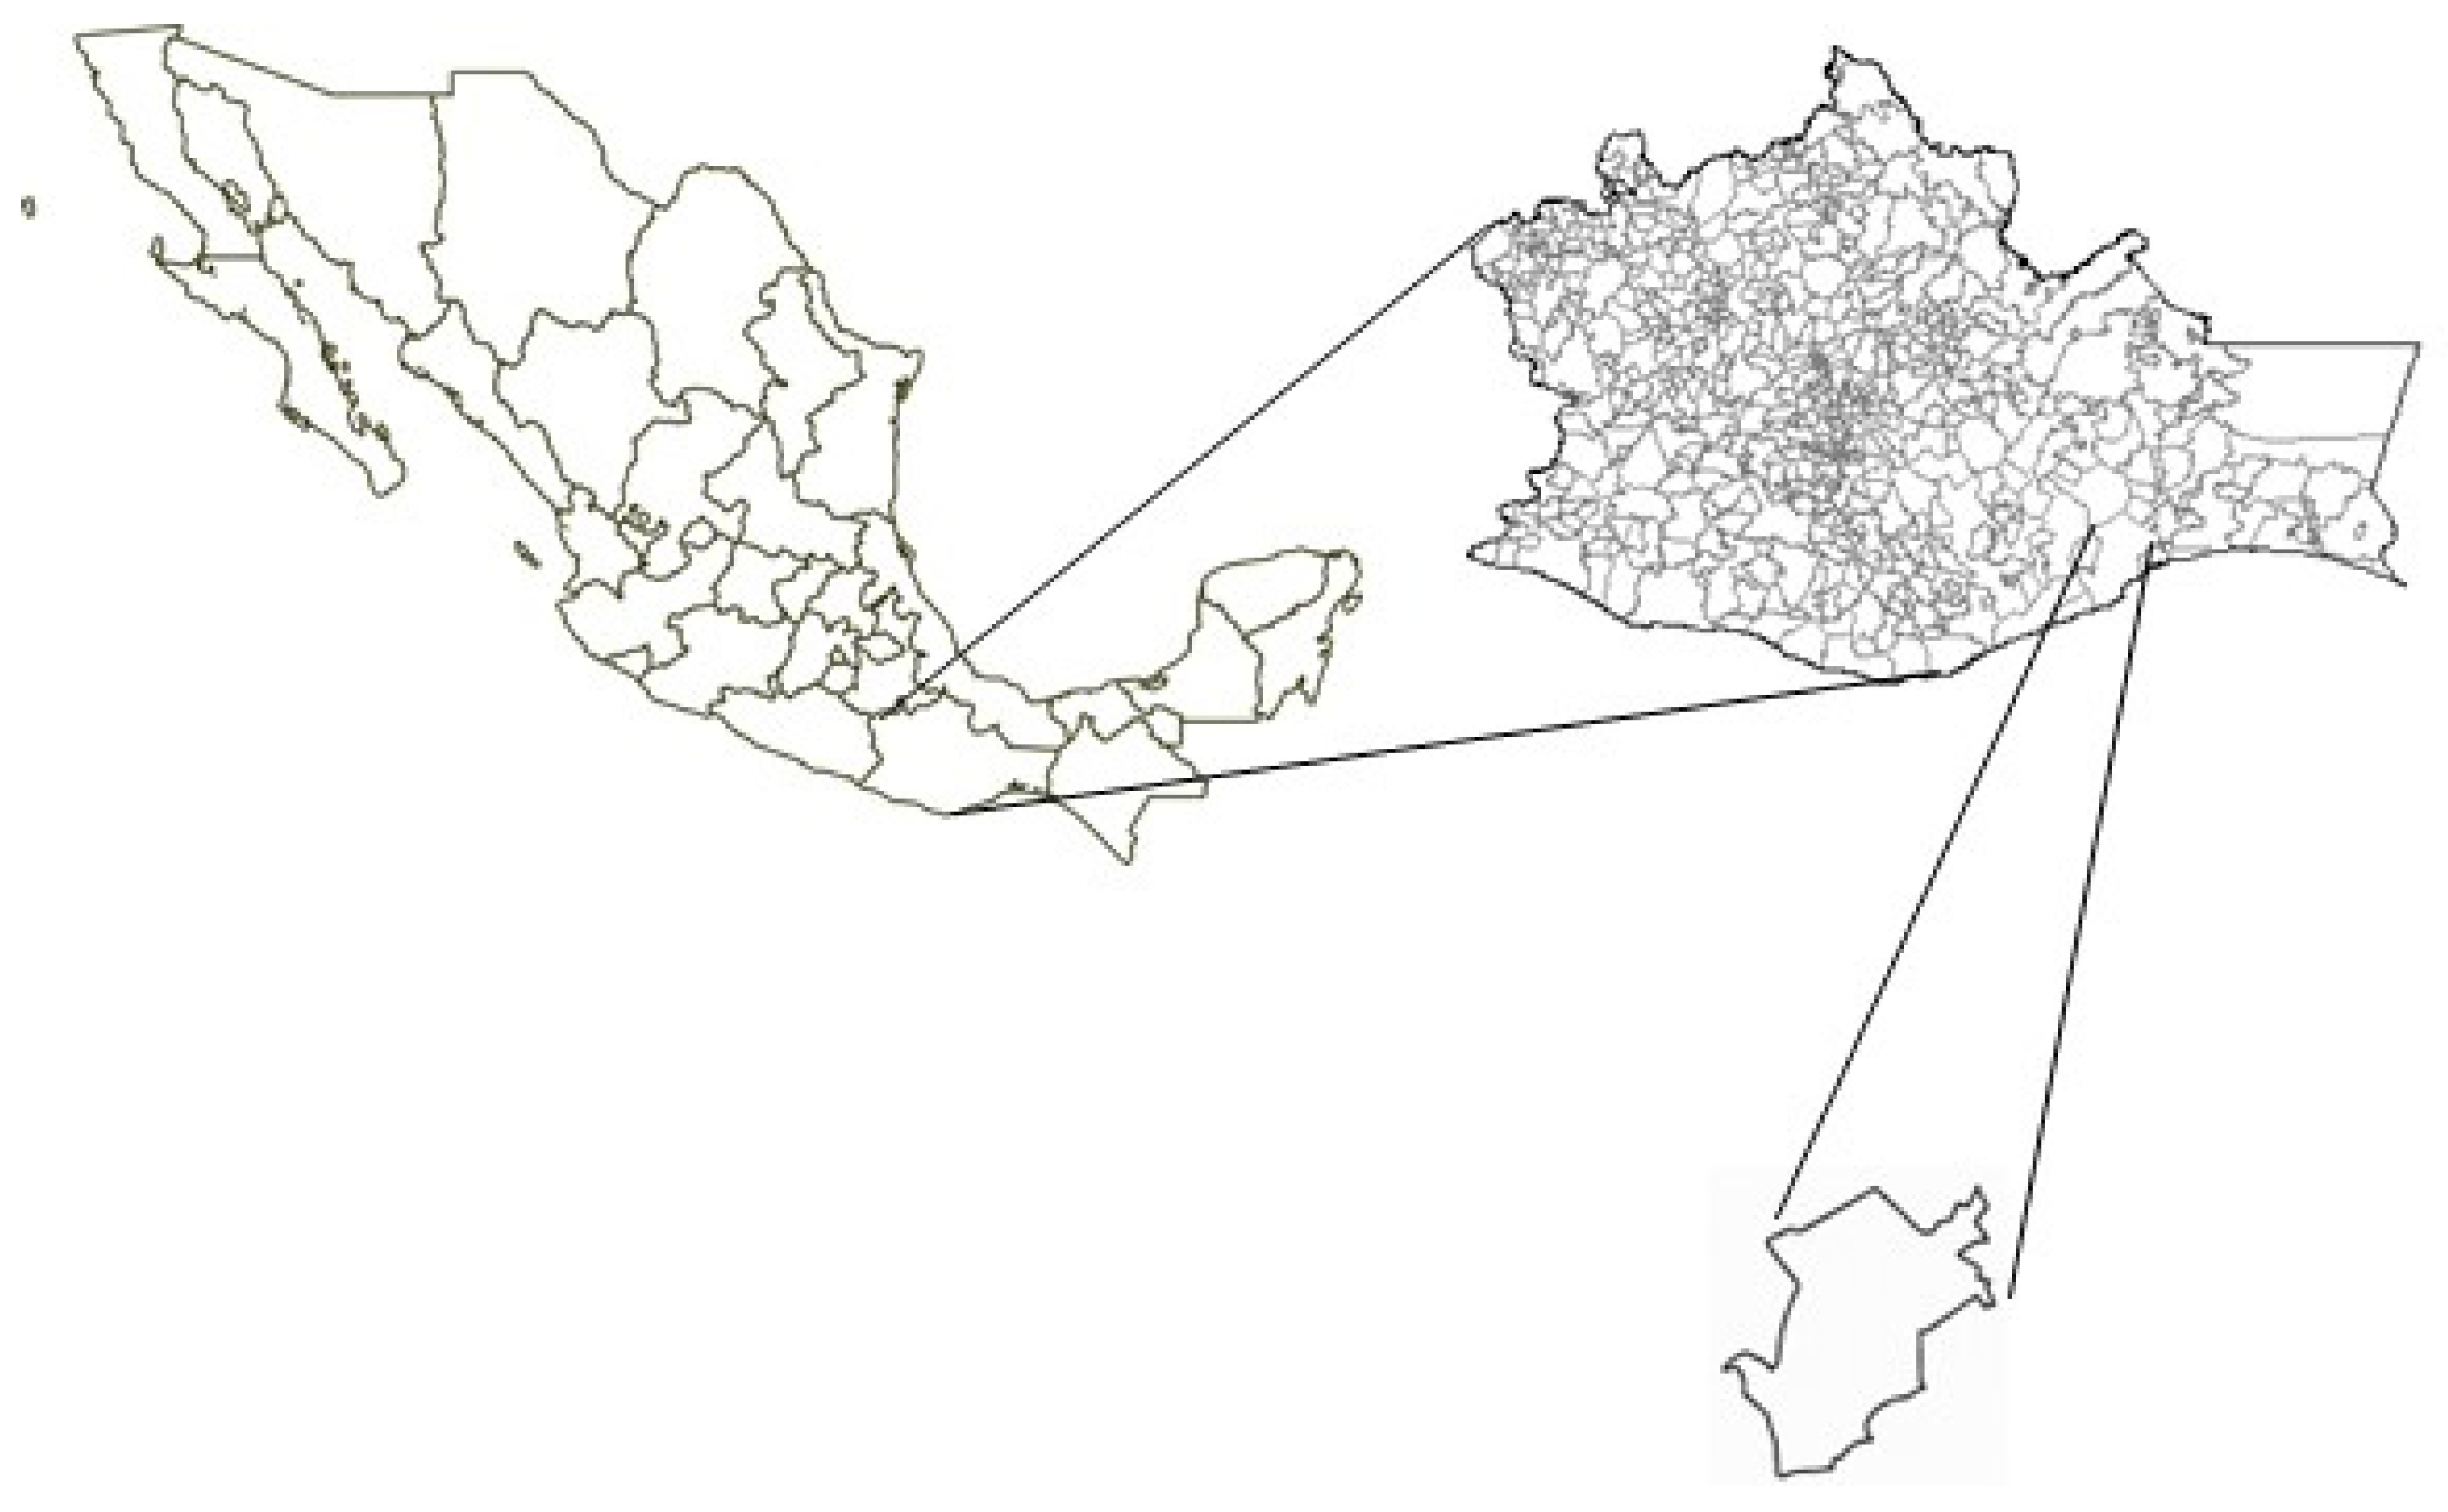
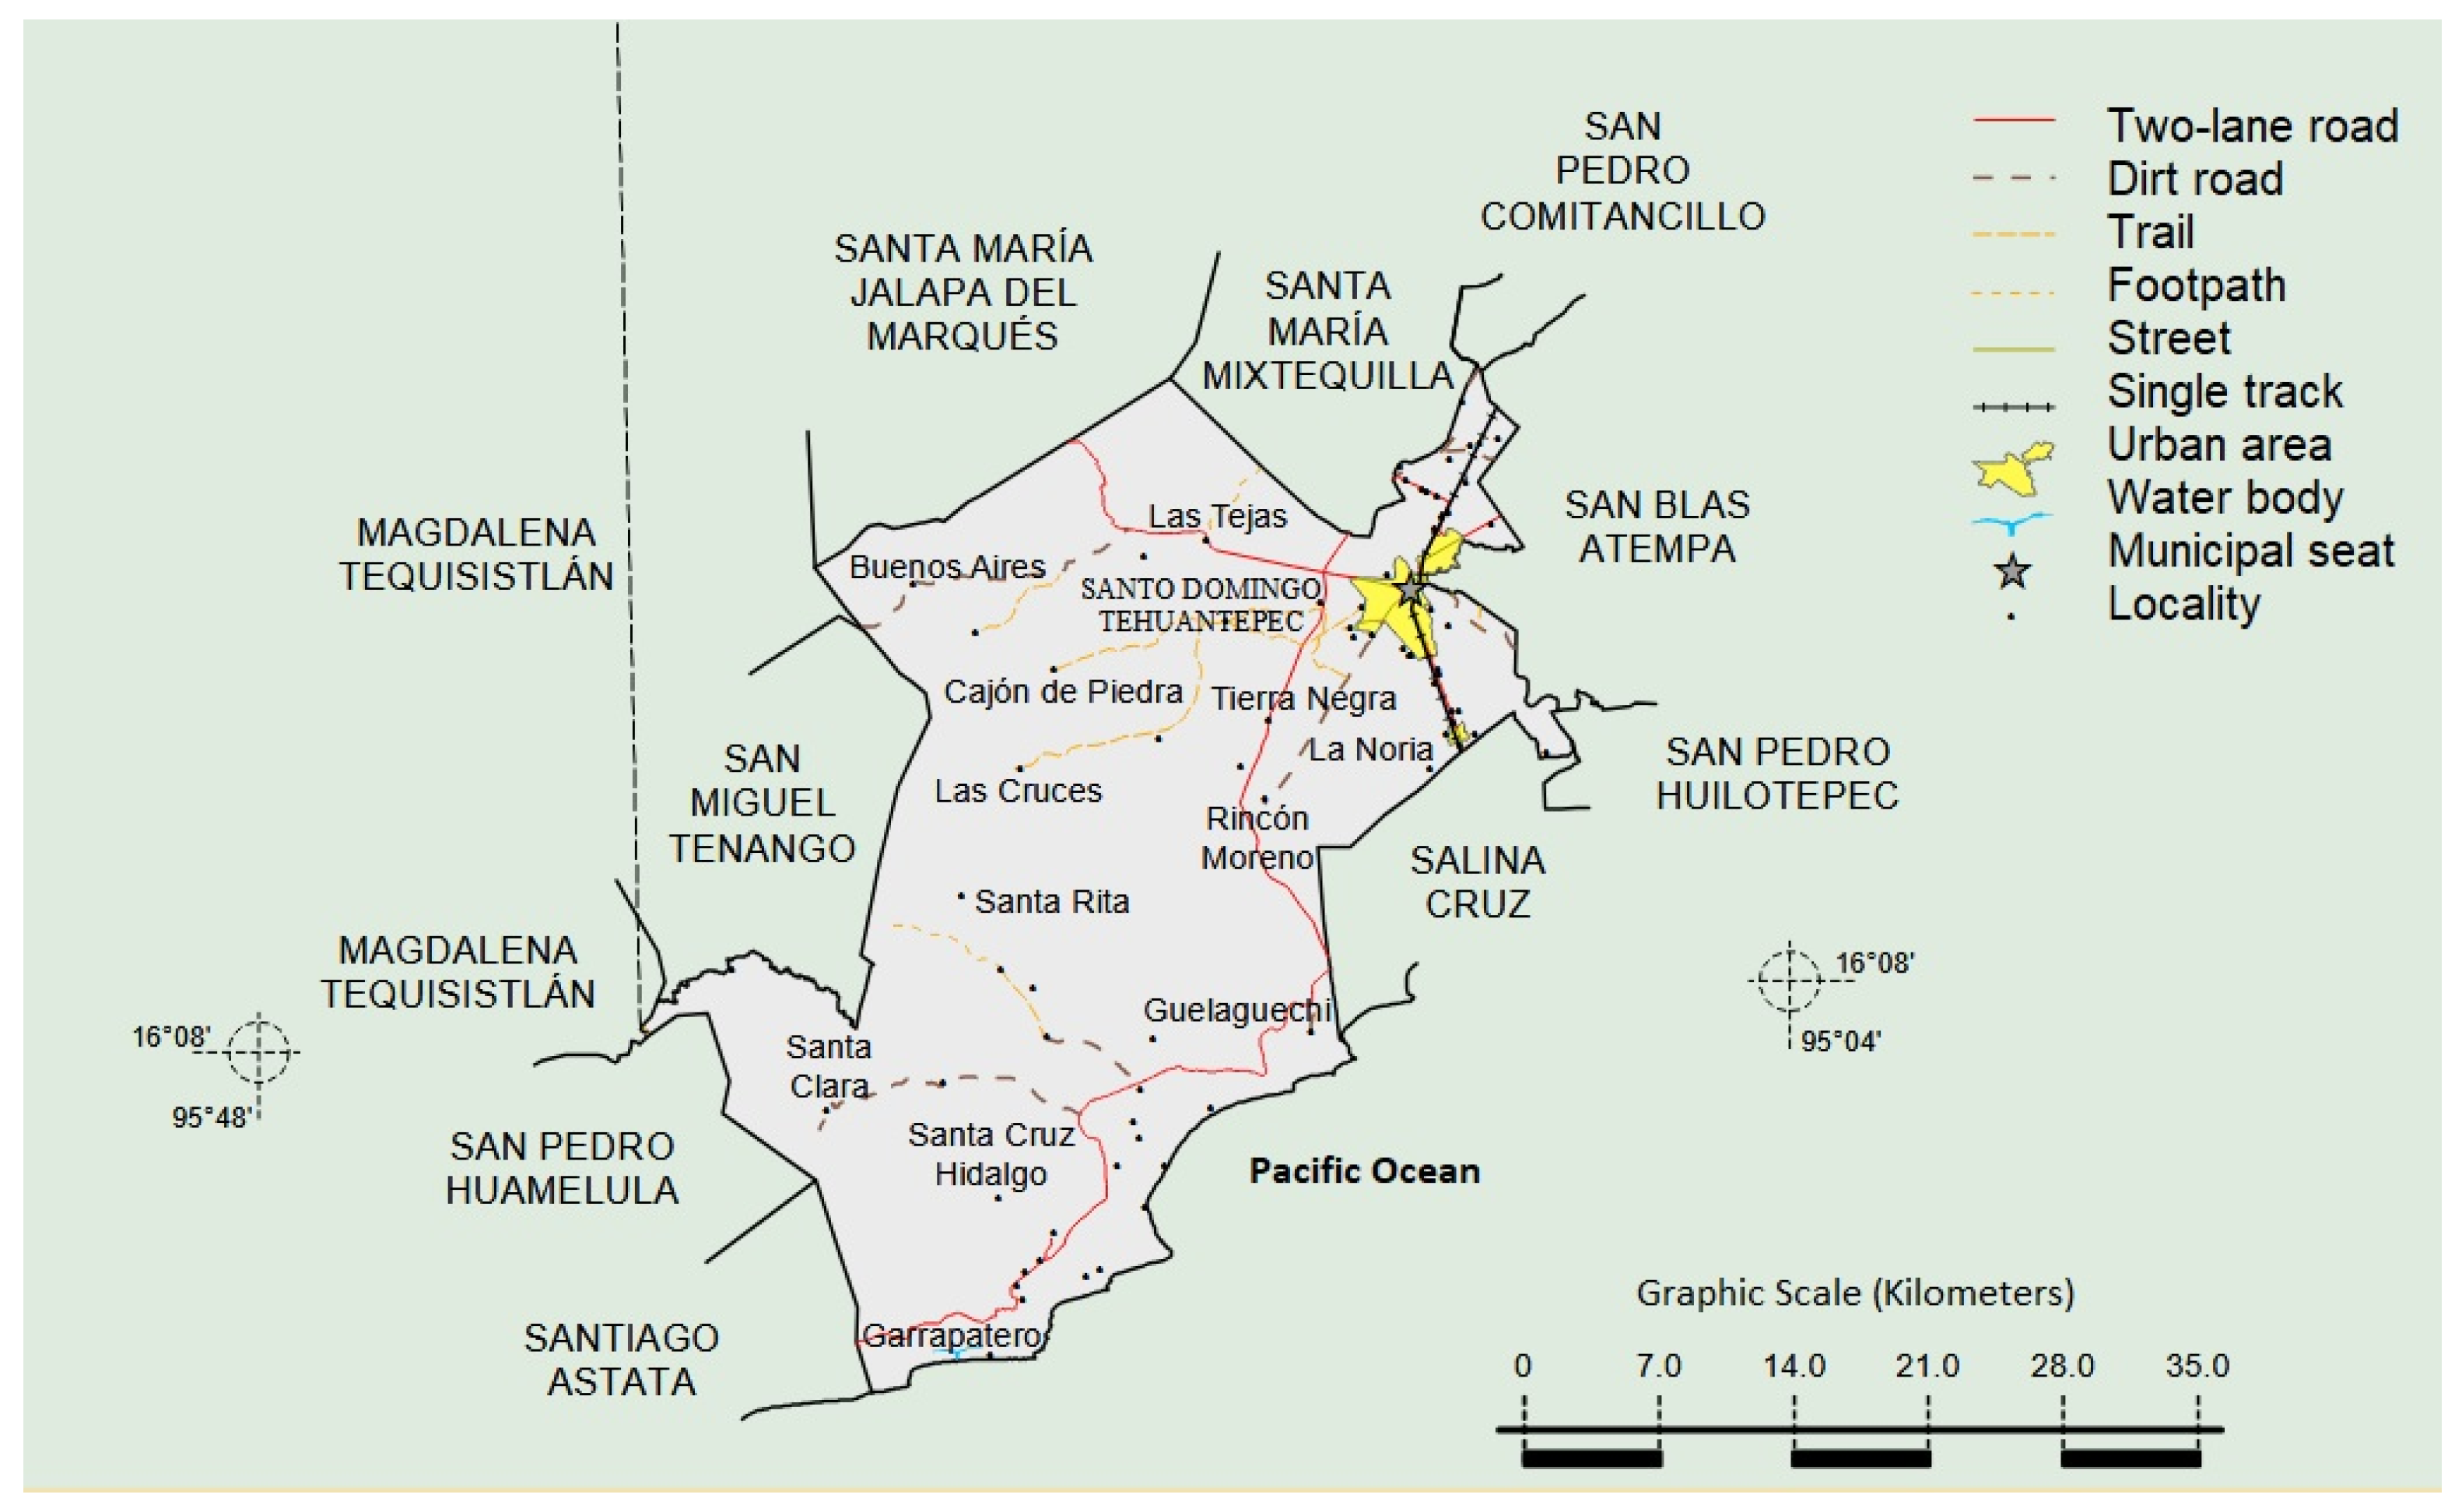
The city of Santo Domingo Tehuantepec, located in the state of Oaxaca, Mexico, is geographically divided into two areas. The main section borders, to the north, the municipalities of Santa María Jalapa del Marqués, Santa María Mixtequilla, San Pedro Comitancillo, and San Blas Atempa, as well as Santiago Ixcuintepec and Santiago Lachiguiri; to the east, the municipalities of San Blas Atempa, San Pedro Huilotepec, and Salina Cruz and the Pacific Ocean; to the south, the Pacific Ocean and the municipality of Santiago Astata; and to the west, Santiago Astata, San Miguel Tenango, and Magdalena Tequisistlán. The geographical context is illustrated in Figure 4 [81].
The Isthmus of Tehuantepec region offers a favorable environment for the development of renewable energy projects, particularly solar photovoltaic energy. According to data from the NASA POWER database, the city of Santo Domingo Tehuantepec recorded an average annual solar irradiance of 5.64 kWh/m2 per day in 2023. In the same year, the maximum irradiance was 6.54 kWh/m2 per day in April, while the minimum was 4.8 kWh/m2 per day in November [82]. Although the proposed system is purely photovoltaic, local wind speed data were included in the input dataset for completeness and to account for its indirect influence on PV performance. In Homer Pro, wind speed can affect the operating temperature of PV modules by enhancing convective cooling, thereby slightly improving energy conversion efficiency under high irradiance conditions. The wind resource data for Santo Domingo Tehuantepec, obtained from the NASA POWER database, were incorporated into the simulation to ensure realistic module temperature modeling. While no wind turbines were included in the present configuration, the wind speed dataset also provides a reference for potential future hybridization with wind generation.

2.2.2. Infrastructure of the Study Area

Regarding infrastructure in the Isthmus of Tehuantepec, the region has 66 electrical substations, 45 in the state of Veracruz and 21 in Oaxaca, collectively providing 3730.3 MVA of power and 9705 kV of voltage. Additionally, the area includes 1429.4 km, 615.2 km, and 834.1 km of transmission lines operating at 115 kV, 230 kV, and 400 kV, respectively [83]. The existing infrastructure, such as the proximity to transmission lines and highways, further enhances the feasibility of developing photovoltaic energy projects in this area.
Moreover, the promotion of renewable energy in the region is a strategic priority aimed at strengthening the productive energy infrastructure, with the objective of ensuring comprehensive regional development and fostering the well-being of the population. This effort is coordinated by the Interoceanic Corridor of the Isthmus of Tehuantepec (CIIT), the Ministry of Energy (SENER), and the Federal Electricity Commission (CFE) [83].

2.3. Sensitivity Factors

In this study, the following sensitivity factors were selected to determine the optimal system configuration capable of withstanding variations in external and uncontrollable project conditions. These factors included ambient temperature variations ranging from 22.77 °C to 30.22 °C, global horizontal solar irradiance between 4 and 7 kWh/m2/day, wind speeds ranging from 5.64 m/s to 8.33 m/s, a 20% increase in electrical load, a discount rate from 8% to 10%, and an inflation rate from 3.5% to 4.2% [82].
A discount rate of 7 % was selected considering the financial return expectations typically applied in renewable energy project evaluations for emerging economies, as discussed in regional energy outlooks [11]. This rate reflects market conditions where investment risk and cost of capital are higher than are those in developed countries, making it a realistic assumption for private sector participation in Mexico’s energy sector.
An incremental 20% load increase was modeled to capture potential medium-term demand growth in mid-sized cities. According to the “Prospectiva del Sector Eléctrico” 2023–2037 by Mexico’s Energy Secretariat [84], electricity demand in the national grid is expected to continue its upward trend, with cumulative increases of around 20% being plausible in regions experiencing sustained urban and industrial expansion, such as the Isthmus of Tehuantepec.
The modeling also assumed a performance degradation rate of 0.7% per year, consistent with values reported for monocrystalline silicon modules in analytical reviews and long-term field studies (~0.6–0.7%/year) under high-irradiance tropical conditions [85,86] Total system losses were estimated at 12%, composed of approximately 4% thermal losses, 3% wiring losses, and 5% inverter conversion losses, which align with typical design practices and simulation defaults for PV systems in similar climates [87,88,89]. Shading losses were assumed to be negligible due to the unobstructed rooftop exposure and high solar altitude in the study area.
Homer Pro incorporates these loss factors into its hourly energy balance calculations, accounting for their cumulative impact on net generation and inverter loading. As a result, the software automatically adjusts the inverter’s rated capacity to match realistic operating conditions, ensuring that the final system design reflects expected performance under the estimated technical losses.

2.4. Project Economics

Several economic factors are required to define the economic condition of the project in Homer Pro. The project lifetime, a key economic parameter, was considered to be 25 years, and it serves as the basis for evaluating the system’s net present cost (NPC). A real discount rate of 7% was applied [81], which was used to calculate the discount factor and the total annualized cost of the project. The inflation rate was set to 4.2%, based on Mexico’s first-quarter rate for 2025 [81]. Additionally, the U.S. dollar was used as the currency for the economic evaluation in this study. It should be noted that Homer Pro automatically calculates financial indicators such as ROI, IRR, and payback period only for configurations that achieve payback within the defined project lifetime.
The avoided carbon dioxide (CO2) emissions were estimated by multiplying the system’s annual energy production by the official grid emission factor for Mexico. The national grid emission factor was taken from the Mexican Ministry of Energy [84] and the Federal Electricity Commission (CFE), reported as 0.433 tCO2/MWh (0.000433 tCO2/kWh) for the most recent year available. This factor represents the average greenhouse gas emissions per unit of electricity generated from the national energy mix. The equation used (Equation (1)) was as follows:
C O 2 t Y E A R = A n n u a l   P V   e n e r g y   p r o d u c t i o n   K W h Y E A R   ×   0.000433   t C O 2 K W h
This approach allowed for a straightforward estimation of the emissions avoided by displacing grid electricity with photovoltaic generation.

2.5. Policy and Regulatory Context

In Mexico, grid-connected distributed generation is regulated under net-metering and self-supply schemes, without a traditional feed-in tariff (FiT). Net metering has been available since 2007 for small- and medium-scale PV systems (up to 500 kW), allowing consumers to feed surplus electricity into the grid and receive bill credits during a 12-month settlement period; unused credits are forfeited at the end of that period [90].
While no direct FiT exists, net-metering and self-supply frameworks foster project profitability by reducing net electricity costs. Investors may also benefit from accelerated depreciation tax provisions, such as 100% first-year write-off for renewable energy equipment per Article 34 of Mexico’s Income Tax Law [87].
Subsidy levels vary across tariff categories: residential and low-income consumers receive significant tariff subsidies, while industrial and commercial users pay closer to the real cost of generation [91]. These pricing dynamics can affect the perceived economic attractiveness of PV installations depending on the tariff classification of the site.

3. Results

3.1. Selection and Weighting of Criteria

The first step involved identifying relevant criteria that affect the viability of solar PV energy systems. These were categorized into four main groups:
(a)
Climatic factors: solar power output (PVOUT), average solar irradiance, average temperature, and precipitation.
(b)
Topographic factors: aspect, elevation, and slope.
(c)
Economic factors: proximity to transmission lines and proximity to roads.
(d)
Environmental factors: proximity to protected areas.
Geospatial data for all criterion layers were processed using ArcGIS. Topographic and relief information was sourced from the municipal geographic information compendium for Santo Domingo Tehuantepec, provided by the National Institute of Statistics and Geography [81], complemented with regional elevation data. The city lies at an average elevation of 44–50 m above sea level on a coastal plain near the Pacific Ocean. Within a 3 km radius, elevation variations reach up to 150 m, while in the wider region (up to 16 km), elevations can exceed 1000 m in surrounding mountain ranges. Notable elevations include Cerro de Lieza (100 m), El Pozorillo (300 m), and the Sierra de Mixtequilla (500 m). Although the surrounding region is predominantly mountainous, the urban and populated areas are situated on low hills with gentle slopes (20–100 m) and include some water bodies.
A summary of these topographic and relief characteristics is presented in Table 2, providing a concise overview of the most relevant features for site suitability analysis.
Regarding infrastructure and transportation, Figure 5 shows that the municipality has a two-lane highway, dirt roads, unpaved trails, and a single-track railway. This network enables the population to connect across the various localities that make up the municipality.
Figure 6a shows the predominant climate in the municipality of Santo Domingo Tehuantepec, which is mainly classified as warm sub-humid with summer rainfall. However, areas with semi-warm, sub-humid, and semi-arid climates, as well as very warm and warm zones, are also identified. Likewise, Figure 6b presents the soil types that characterize the region, most of which are located on superficial soil layers corresponding to the uppermost part of the Earth’s crust. Toward the southern part of the municipality, metamorphic soils are predominant, followed by intrusive igneous and extrusive igneous formations.

3.2. Technical Analysis

3.2.1. Location and Load Profile

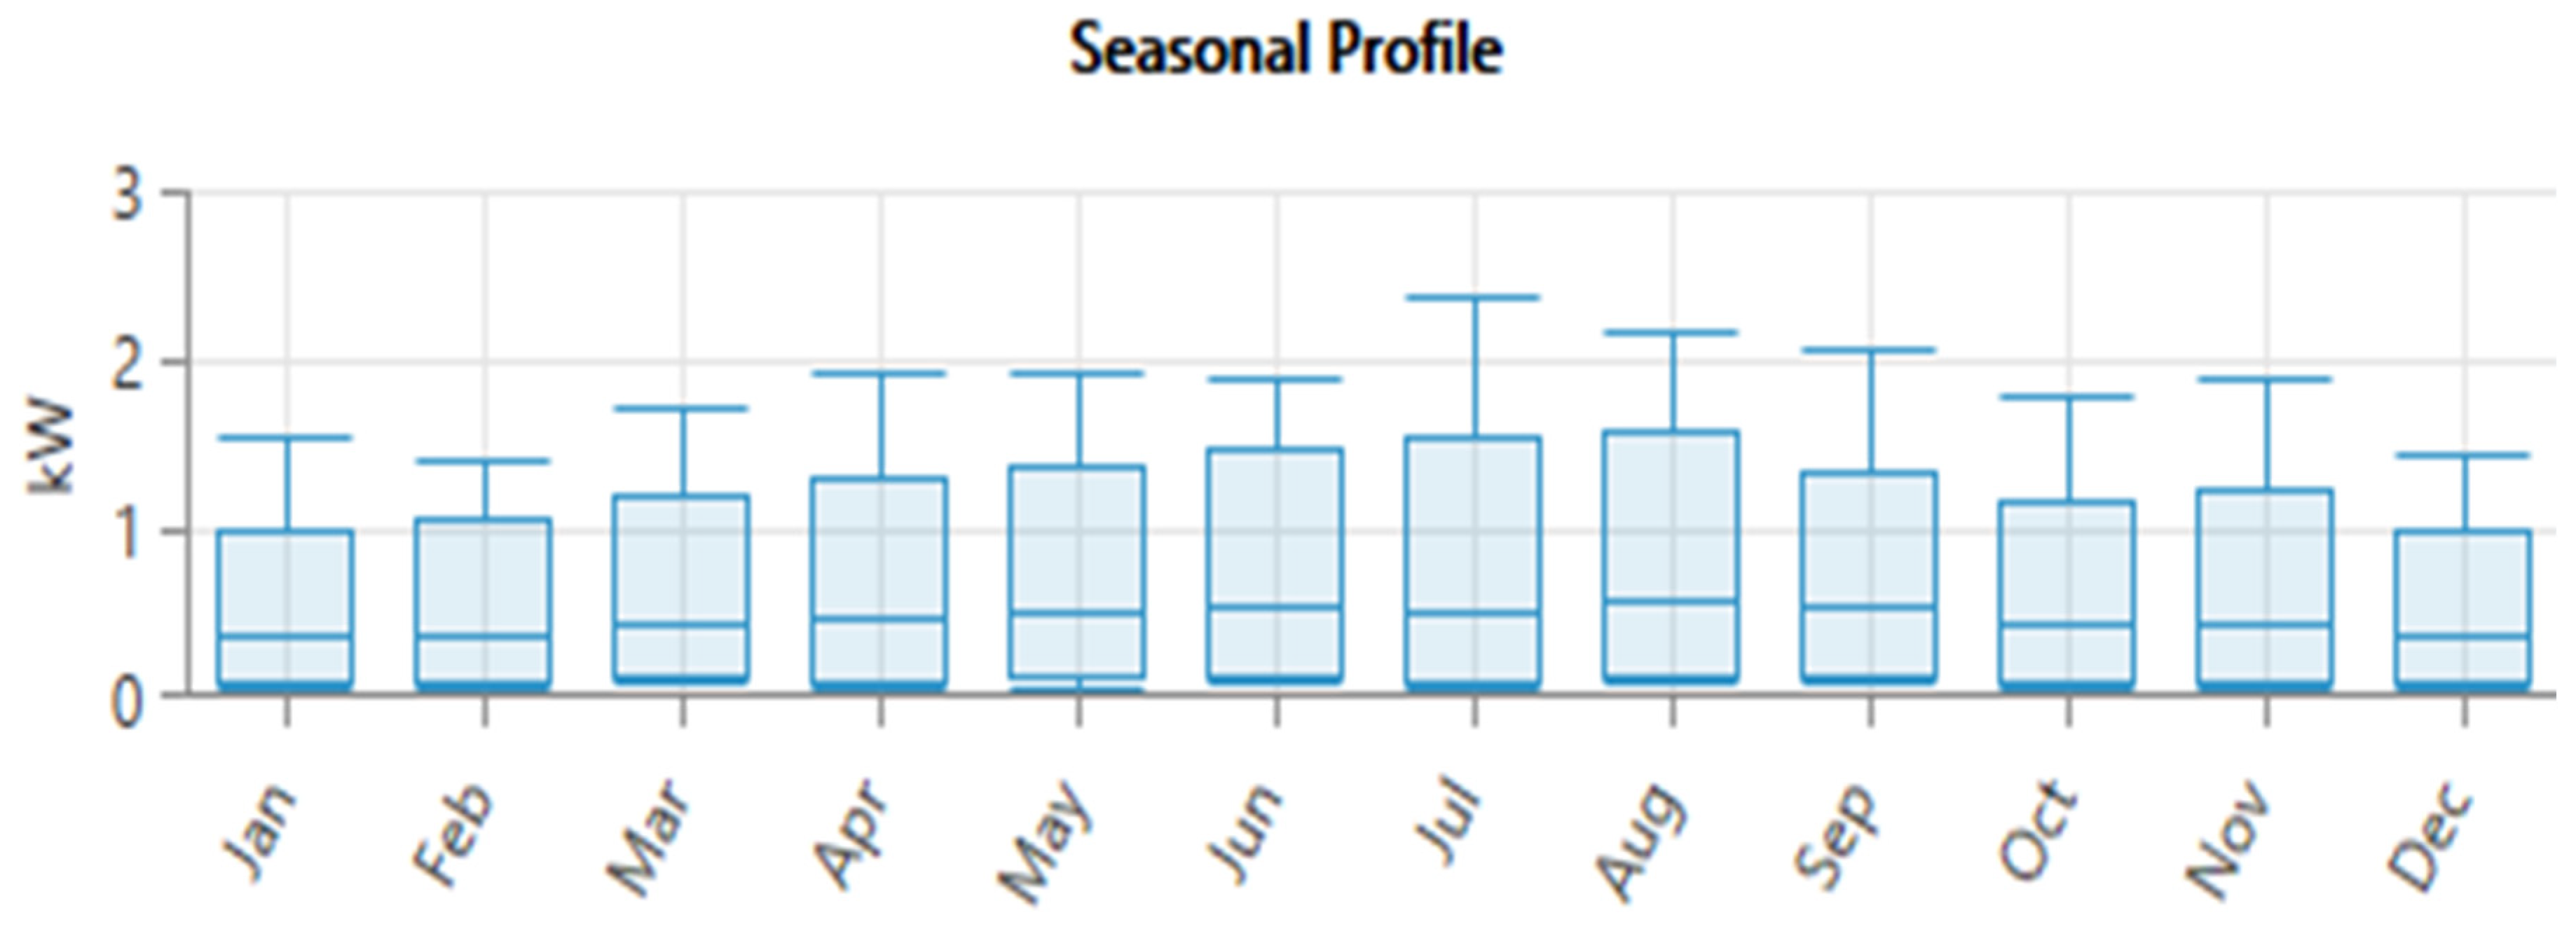
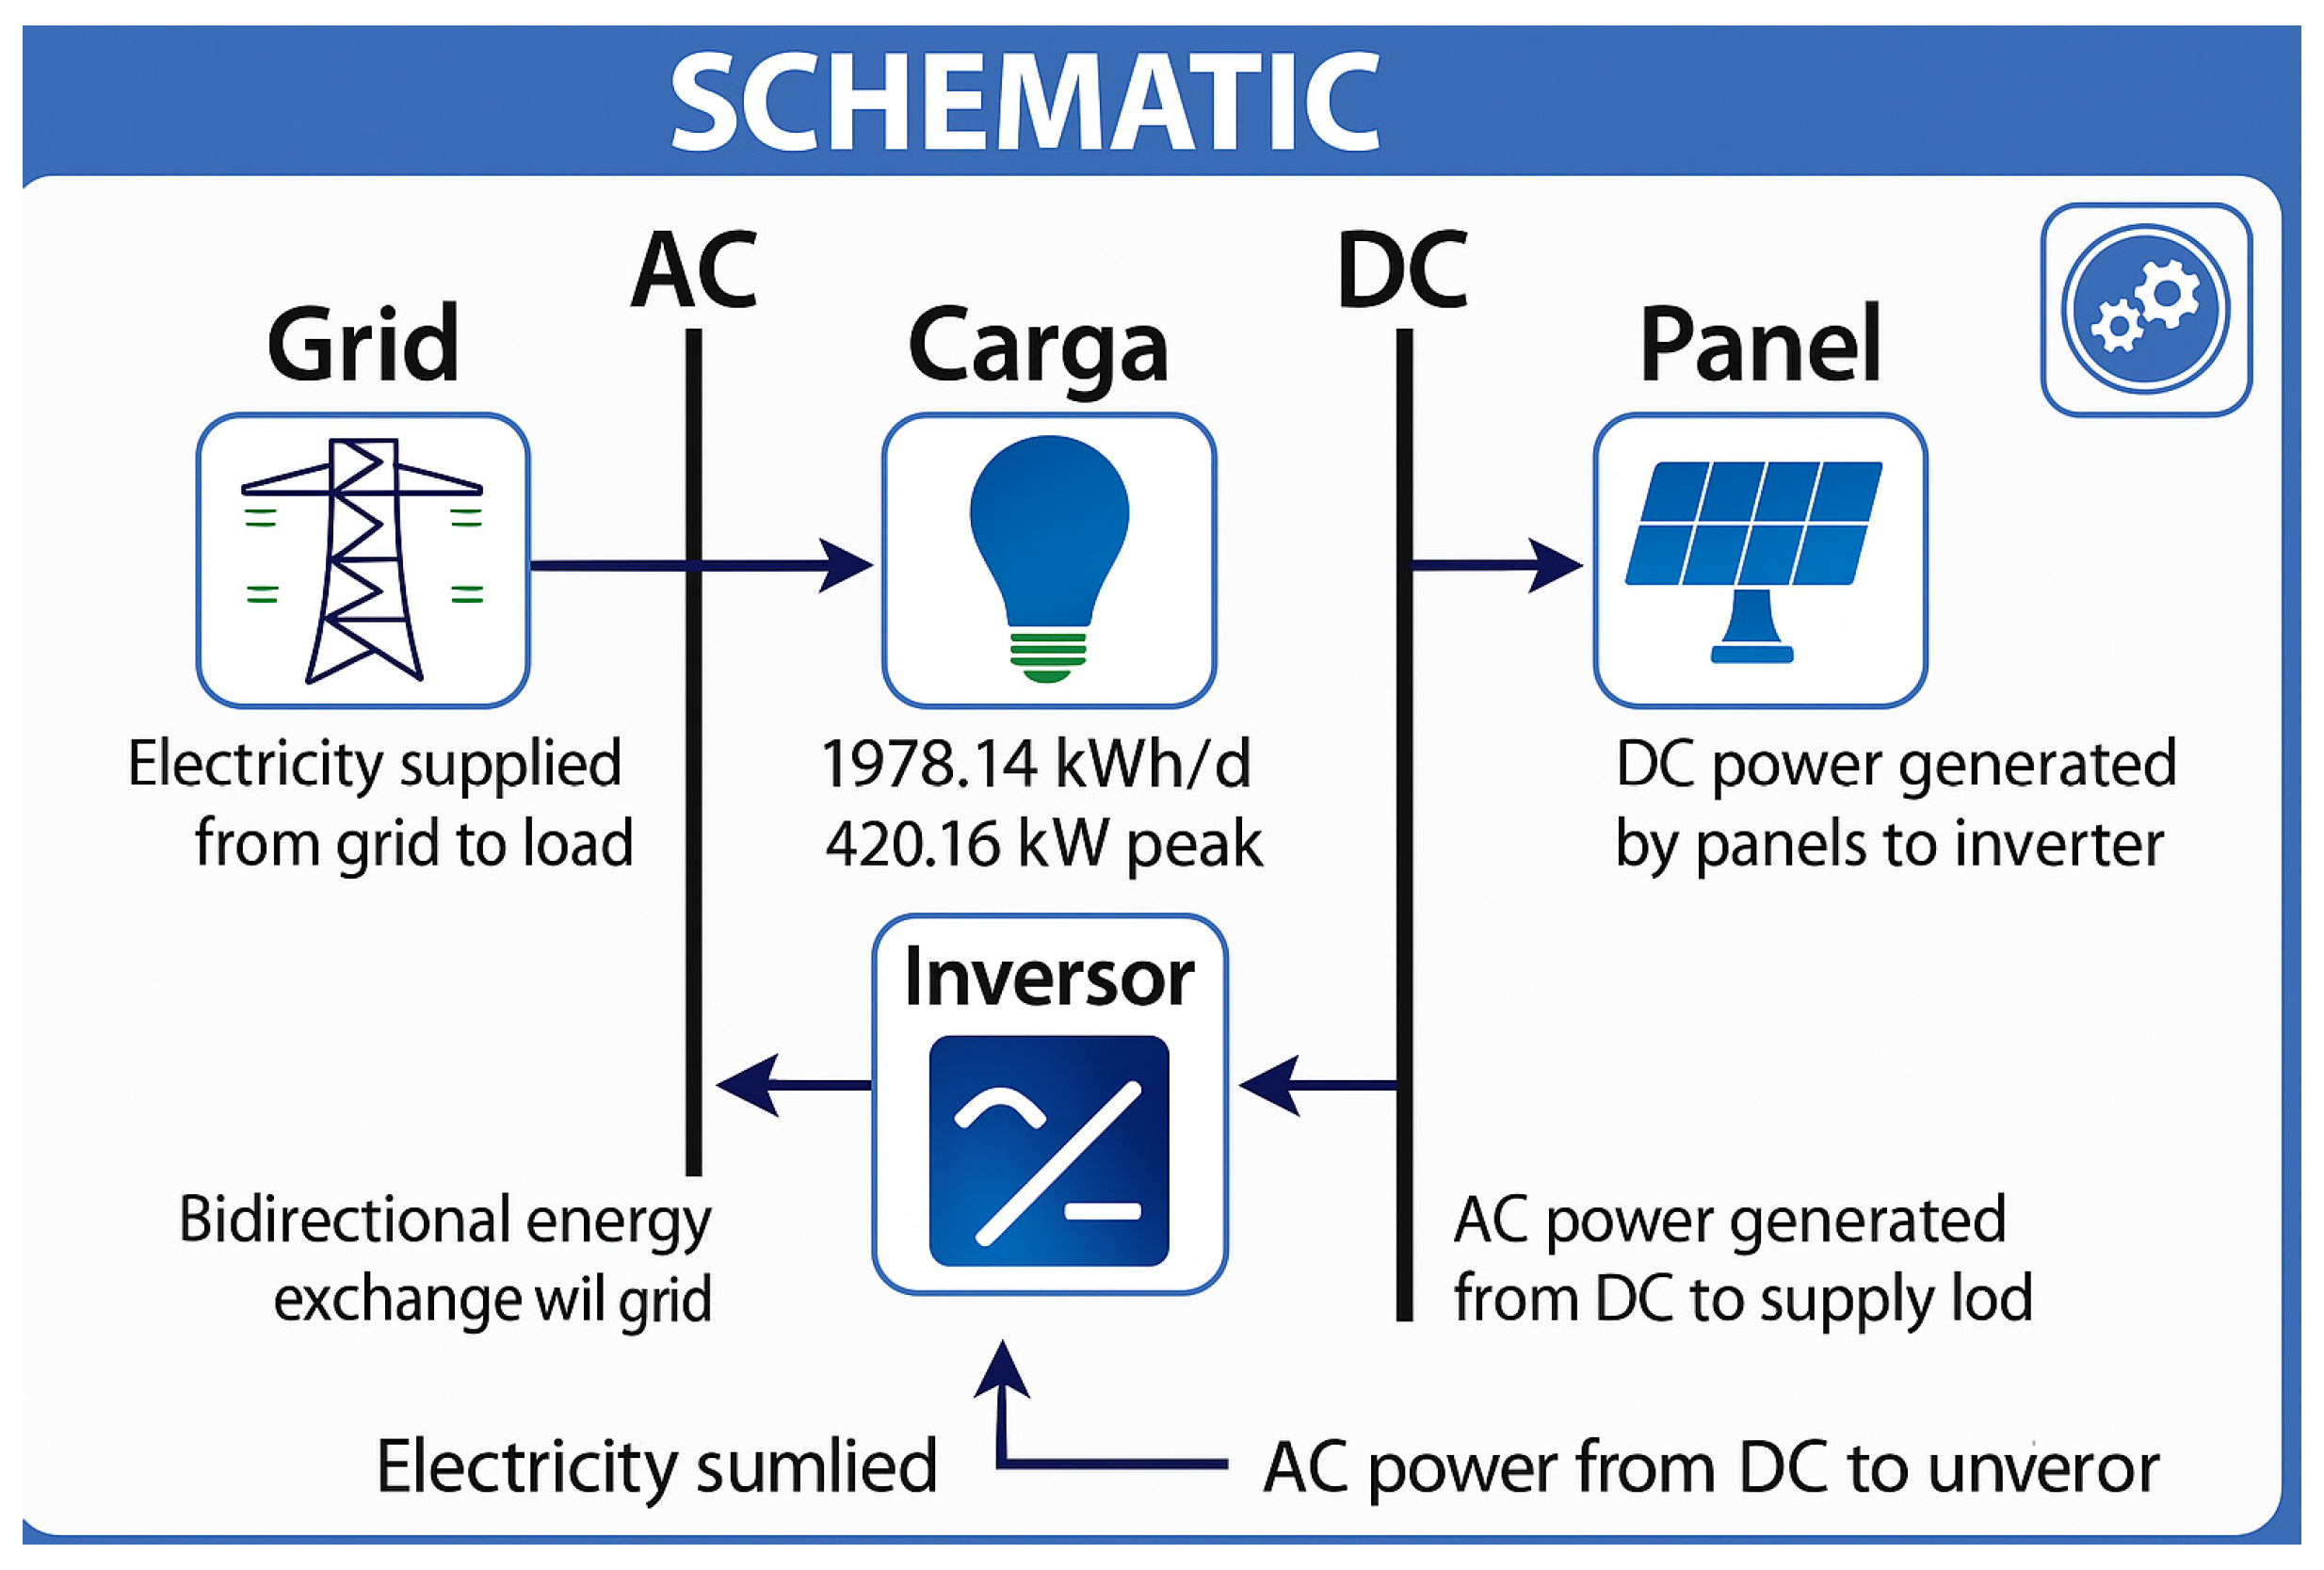
Based on the seasonal load profile behavior at the site in Santo Domingo Tehuantepec, specific criteria were considered to model the load profile, including a daily variability of 10% and a 20% variability for the time steps. A residential load profile was used, characterized by a peak during the month of July. Figure 7 presents the site’s seasonal load profile, where the average annual consumption is 1978.1 kWh/day, with an average load of 82.42 kW and a peak load of 420.16 kW. Minimum consumption occurred during the months of December and January, while the highest load values were recorded in July and August.

3.2.2. Solar and Temperature Resources

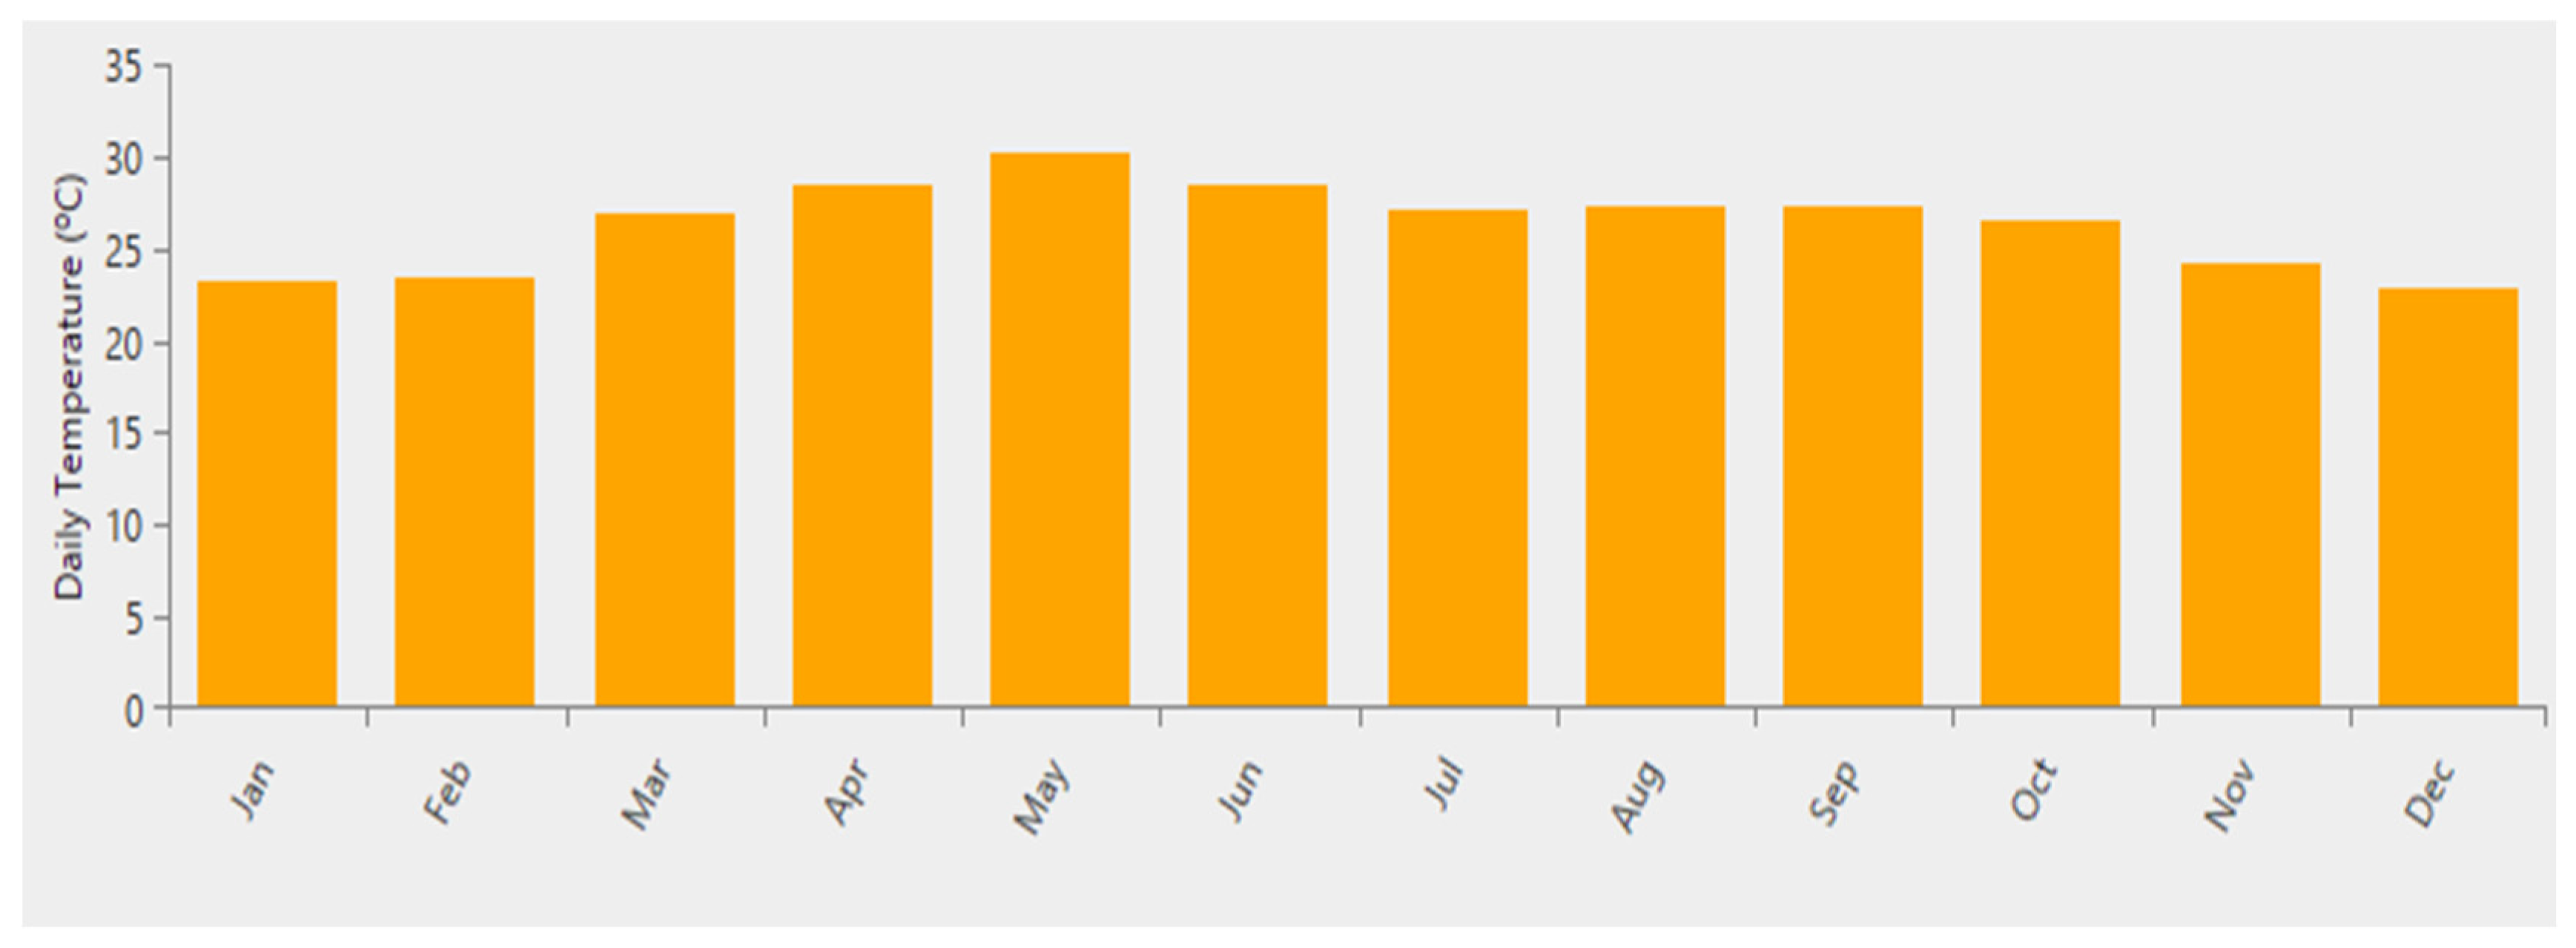
The NASA POWER (Prediction of Worldwide Energy Resource) database [82] was used to obtain ambient temperature and global horizontal irradiance values for the study site. These data were integrated into the Homer Pro software, which determined that the average annual ambient temperature is 26.30 °C. The maximum recorded temperature was 30.22 °C in May, while the minimum, 22.77 °C, was observed in December (Figure 8).
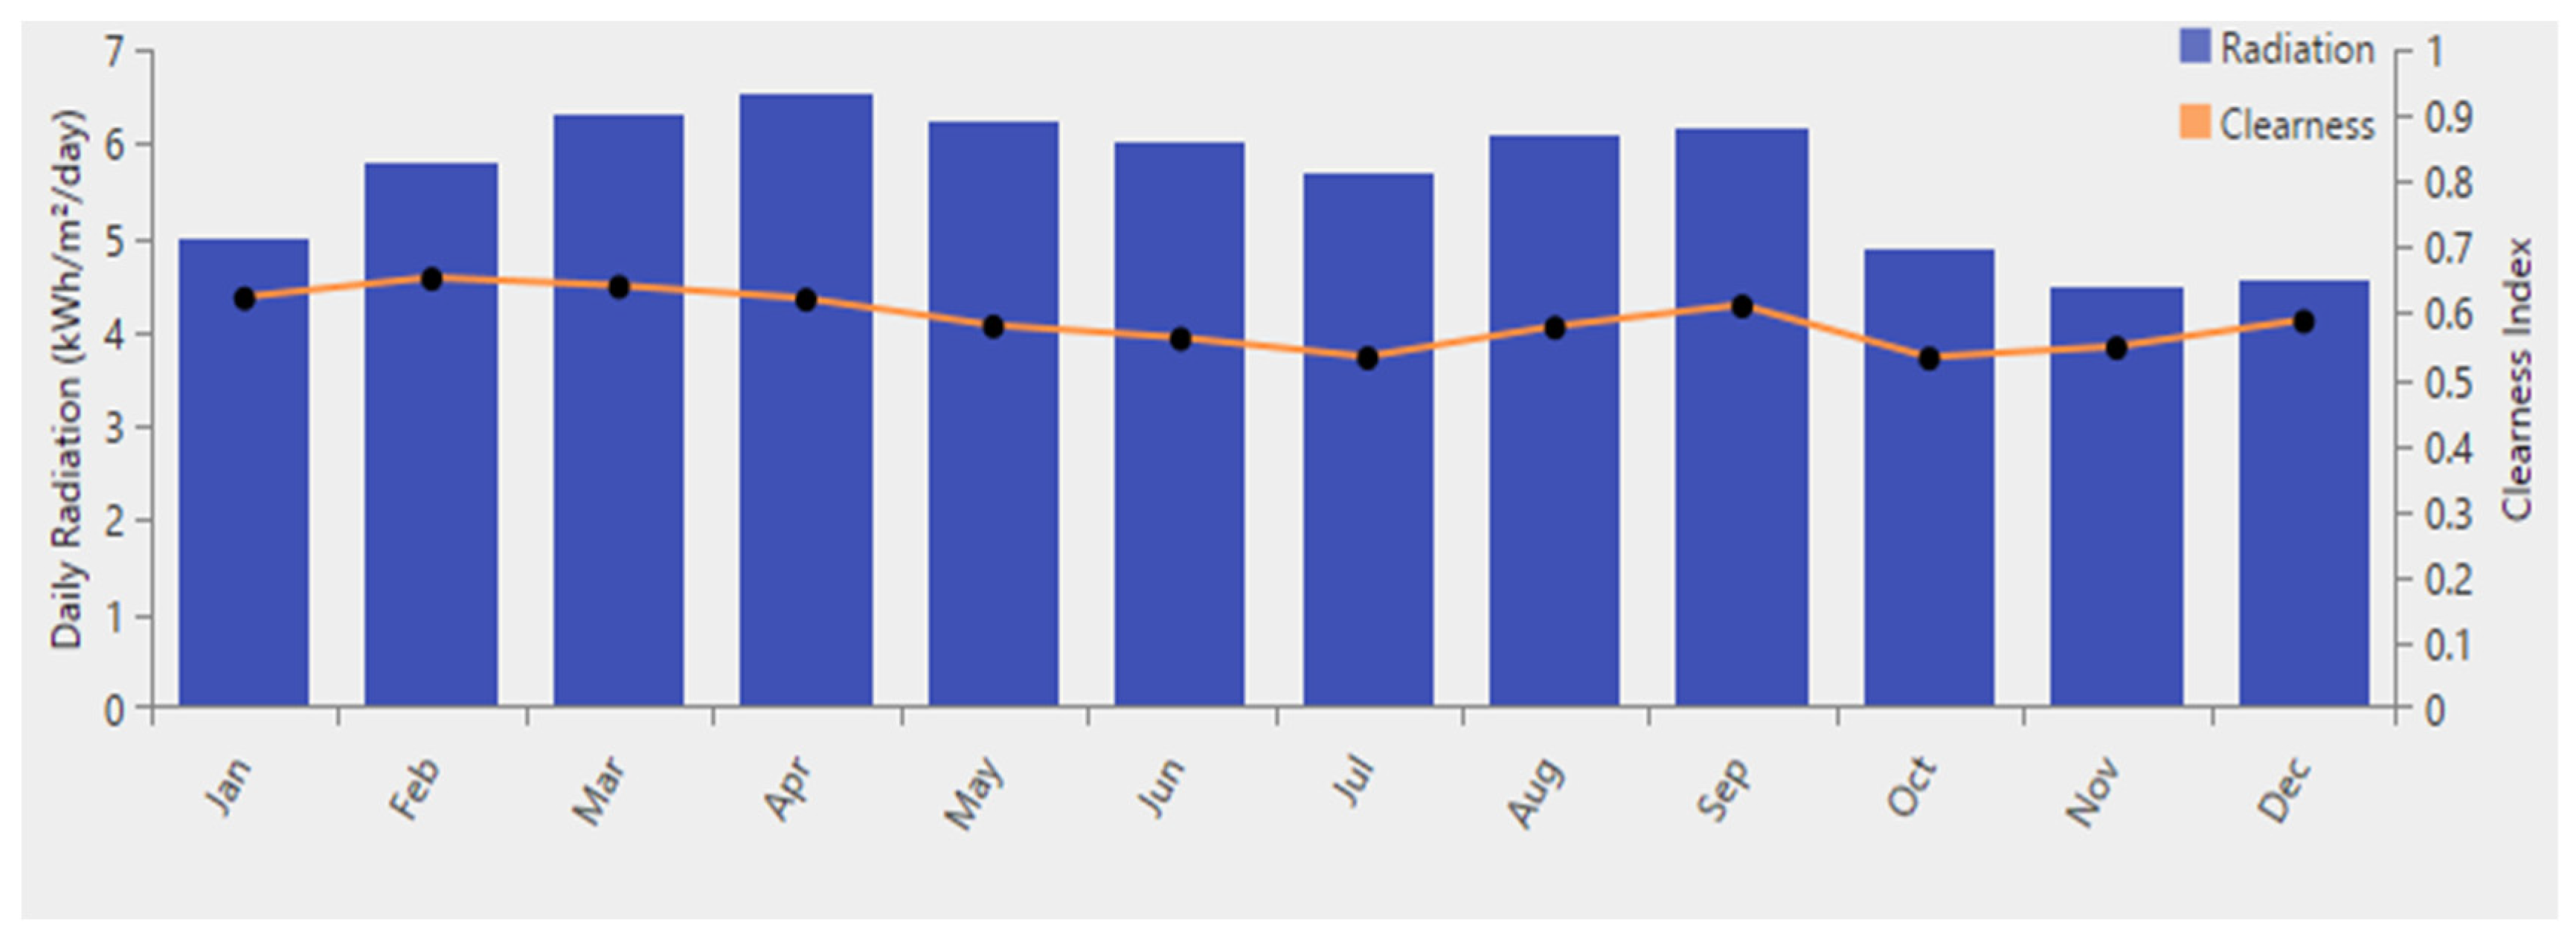
Figure 9 presents the average annual solar radiation data for the installation site in Santo Domingo Tehuantepec, with a mean value of 5.64 kWh/m2/day. The highest solar radiation was recorded in April at 6.54 kWh/m2/day, while the lowest occurred in November, at 4.48 kWh/m2/day. These data confirm that Tehuantepec has significant potential for investment and development in solar energy through the implementation of photovoltaic systems.

3.2.3. Peak Sun Hour

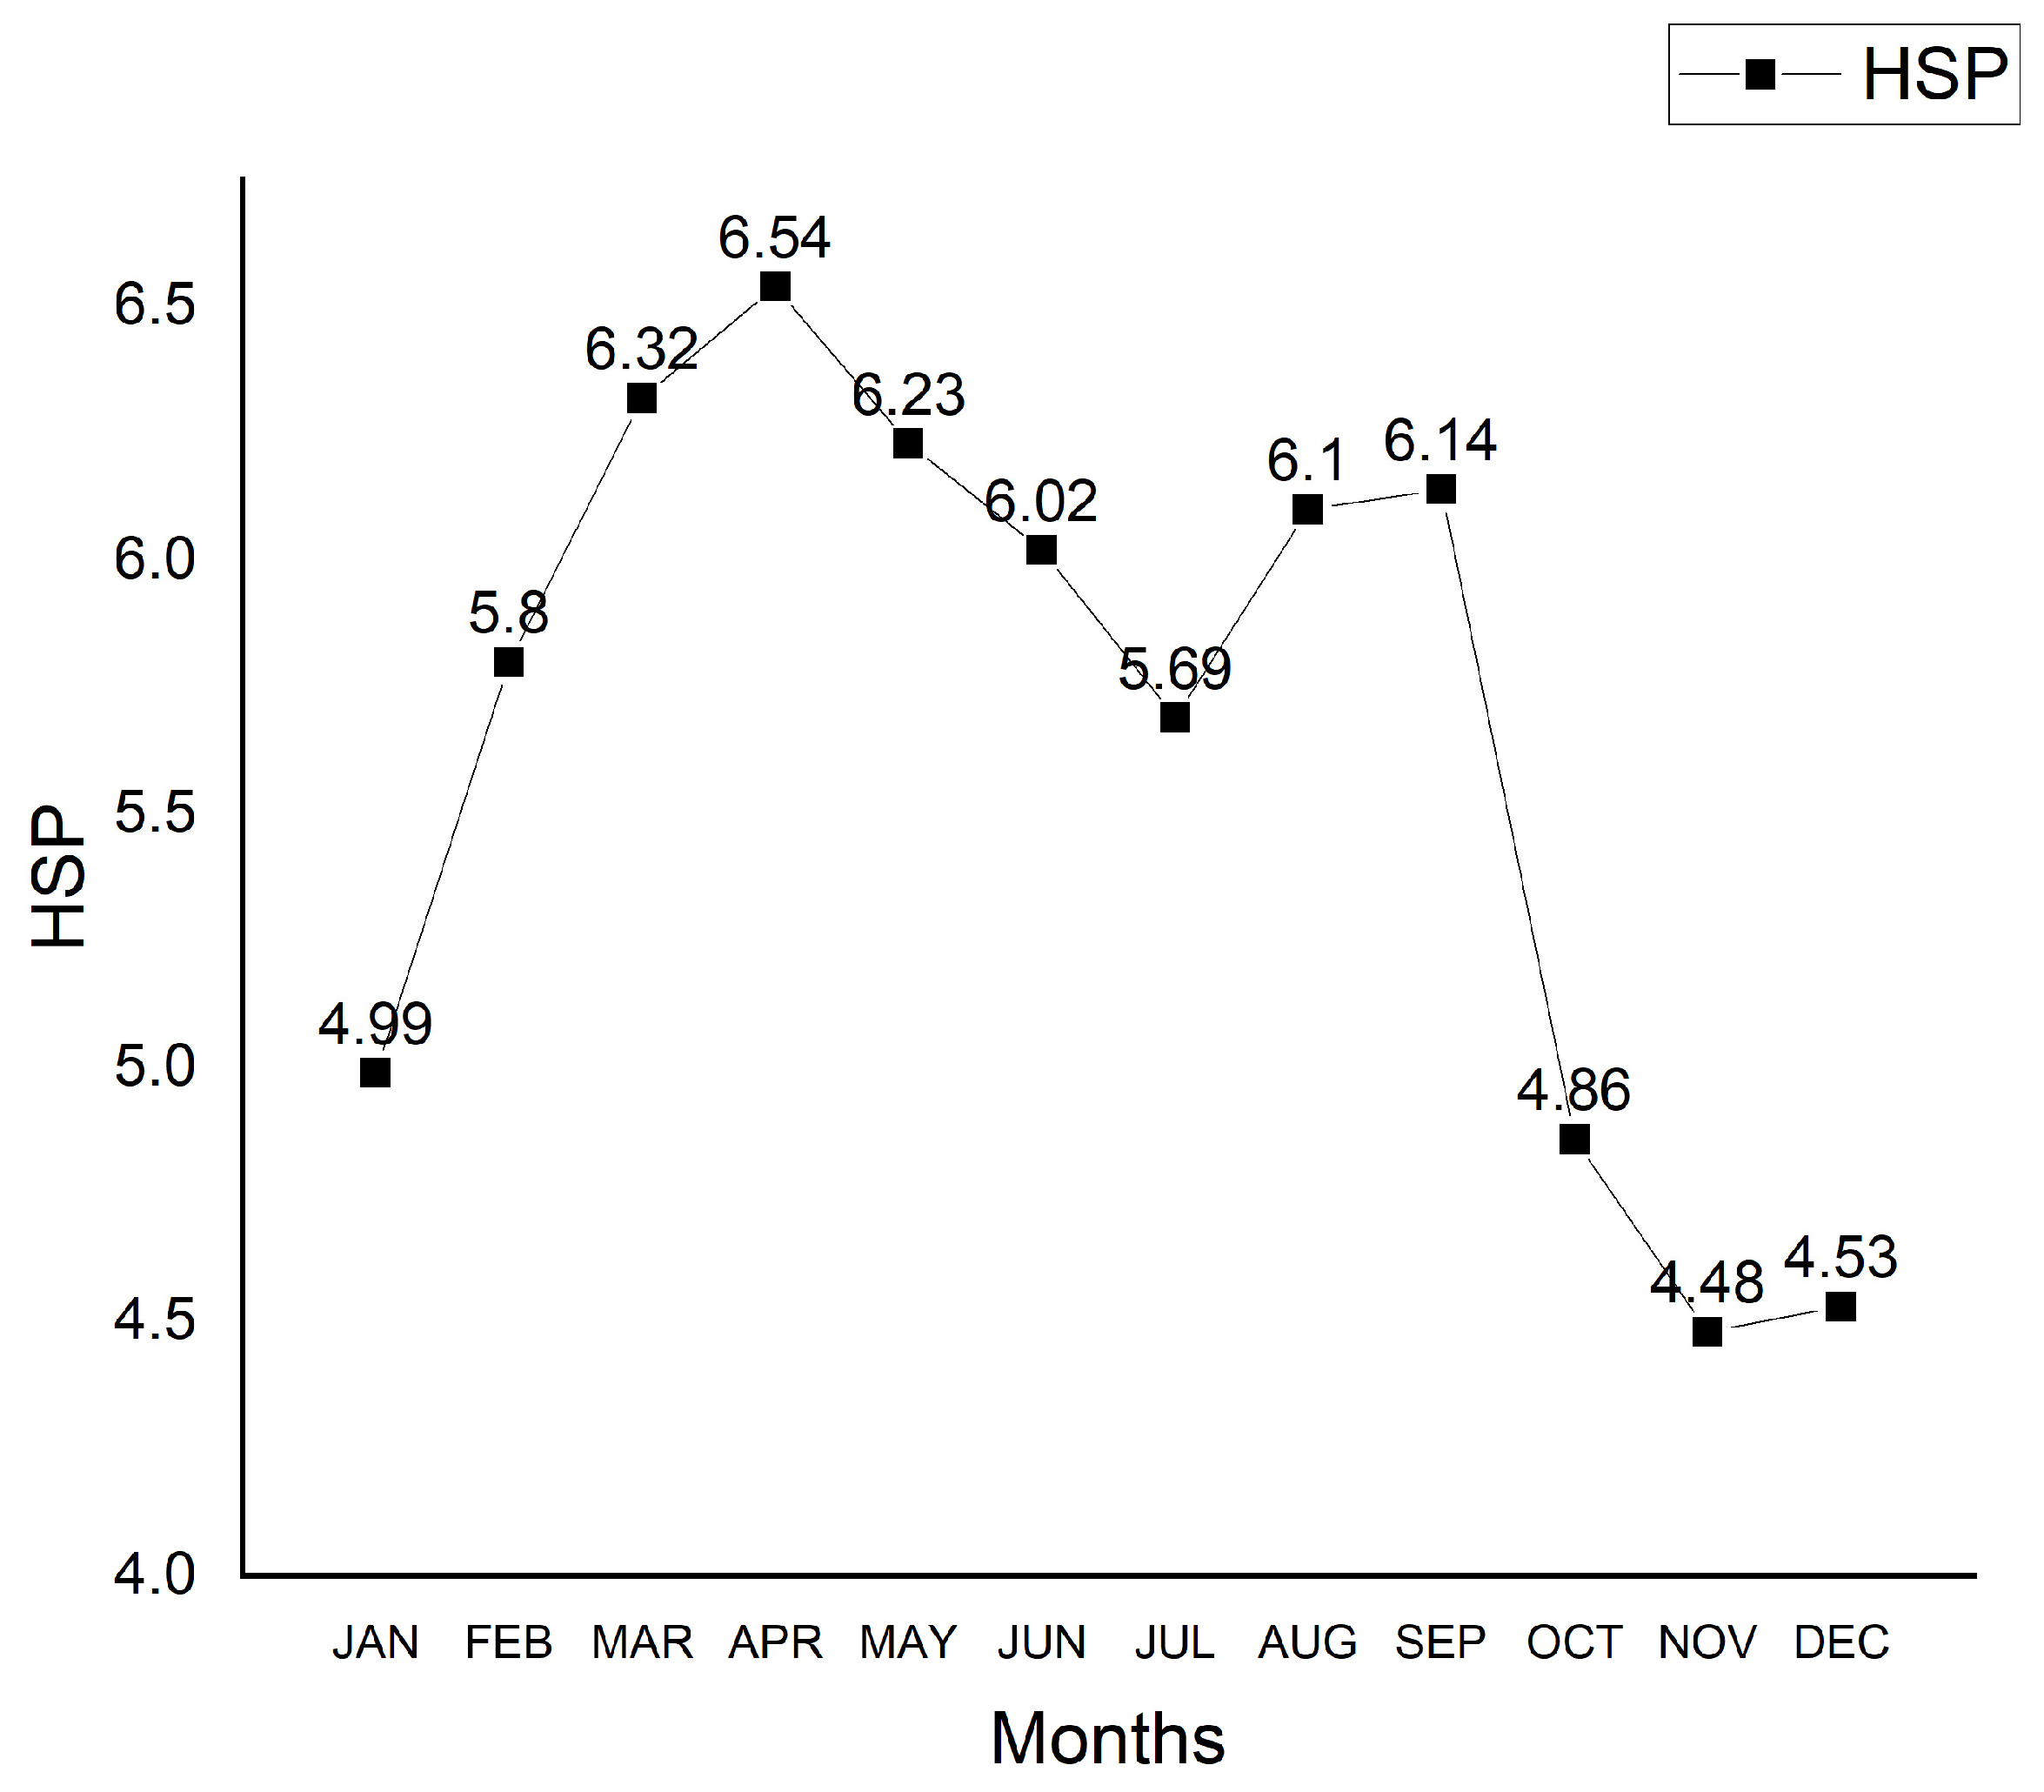
The peak sun hour (PSH) is a unit used to express daily solar irradiation as the number of hours during which solar irradiance is equivalent to 1000 W/m2, which corresponds to the standard test conditions for photovoltaic solar panels. Therefore, the PSH value is numerically equal to daily irradiation, as it is calculated by dividing the total irradiation by 1 kW/m2. Figure 10 illustrates the monthly behavior of PSH in Santo Domingo Tehuantepec during the year 2023. The minimum recorded value was 4.48 h in November, while the maximum reached 6.54 h in April. These results indicate favorable solar availability for the development and implementation of photovoltaic systems in the region.

3.2.4. Clearness Index

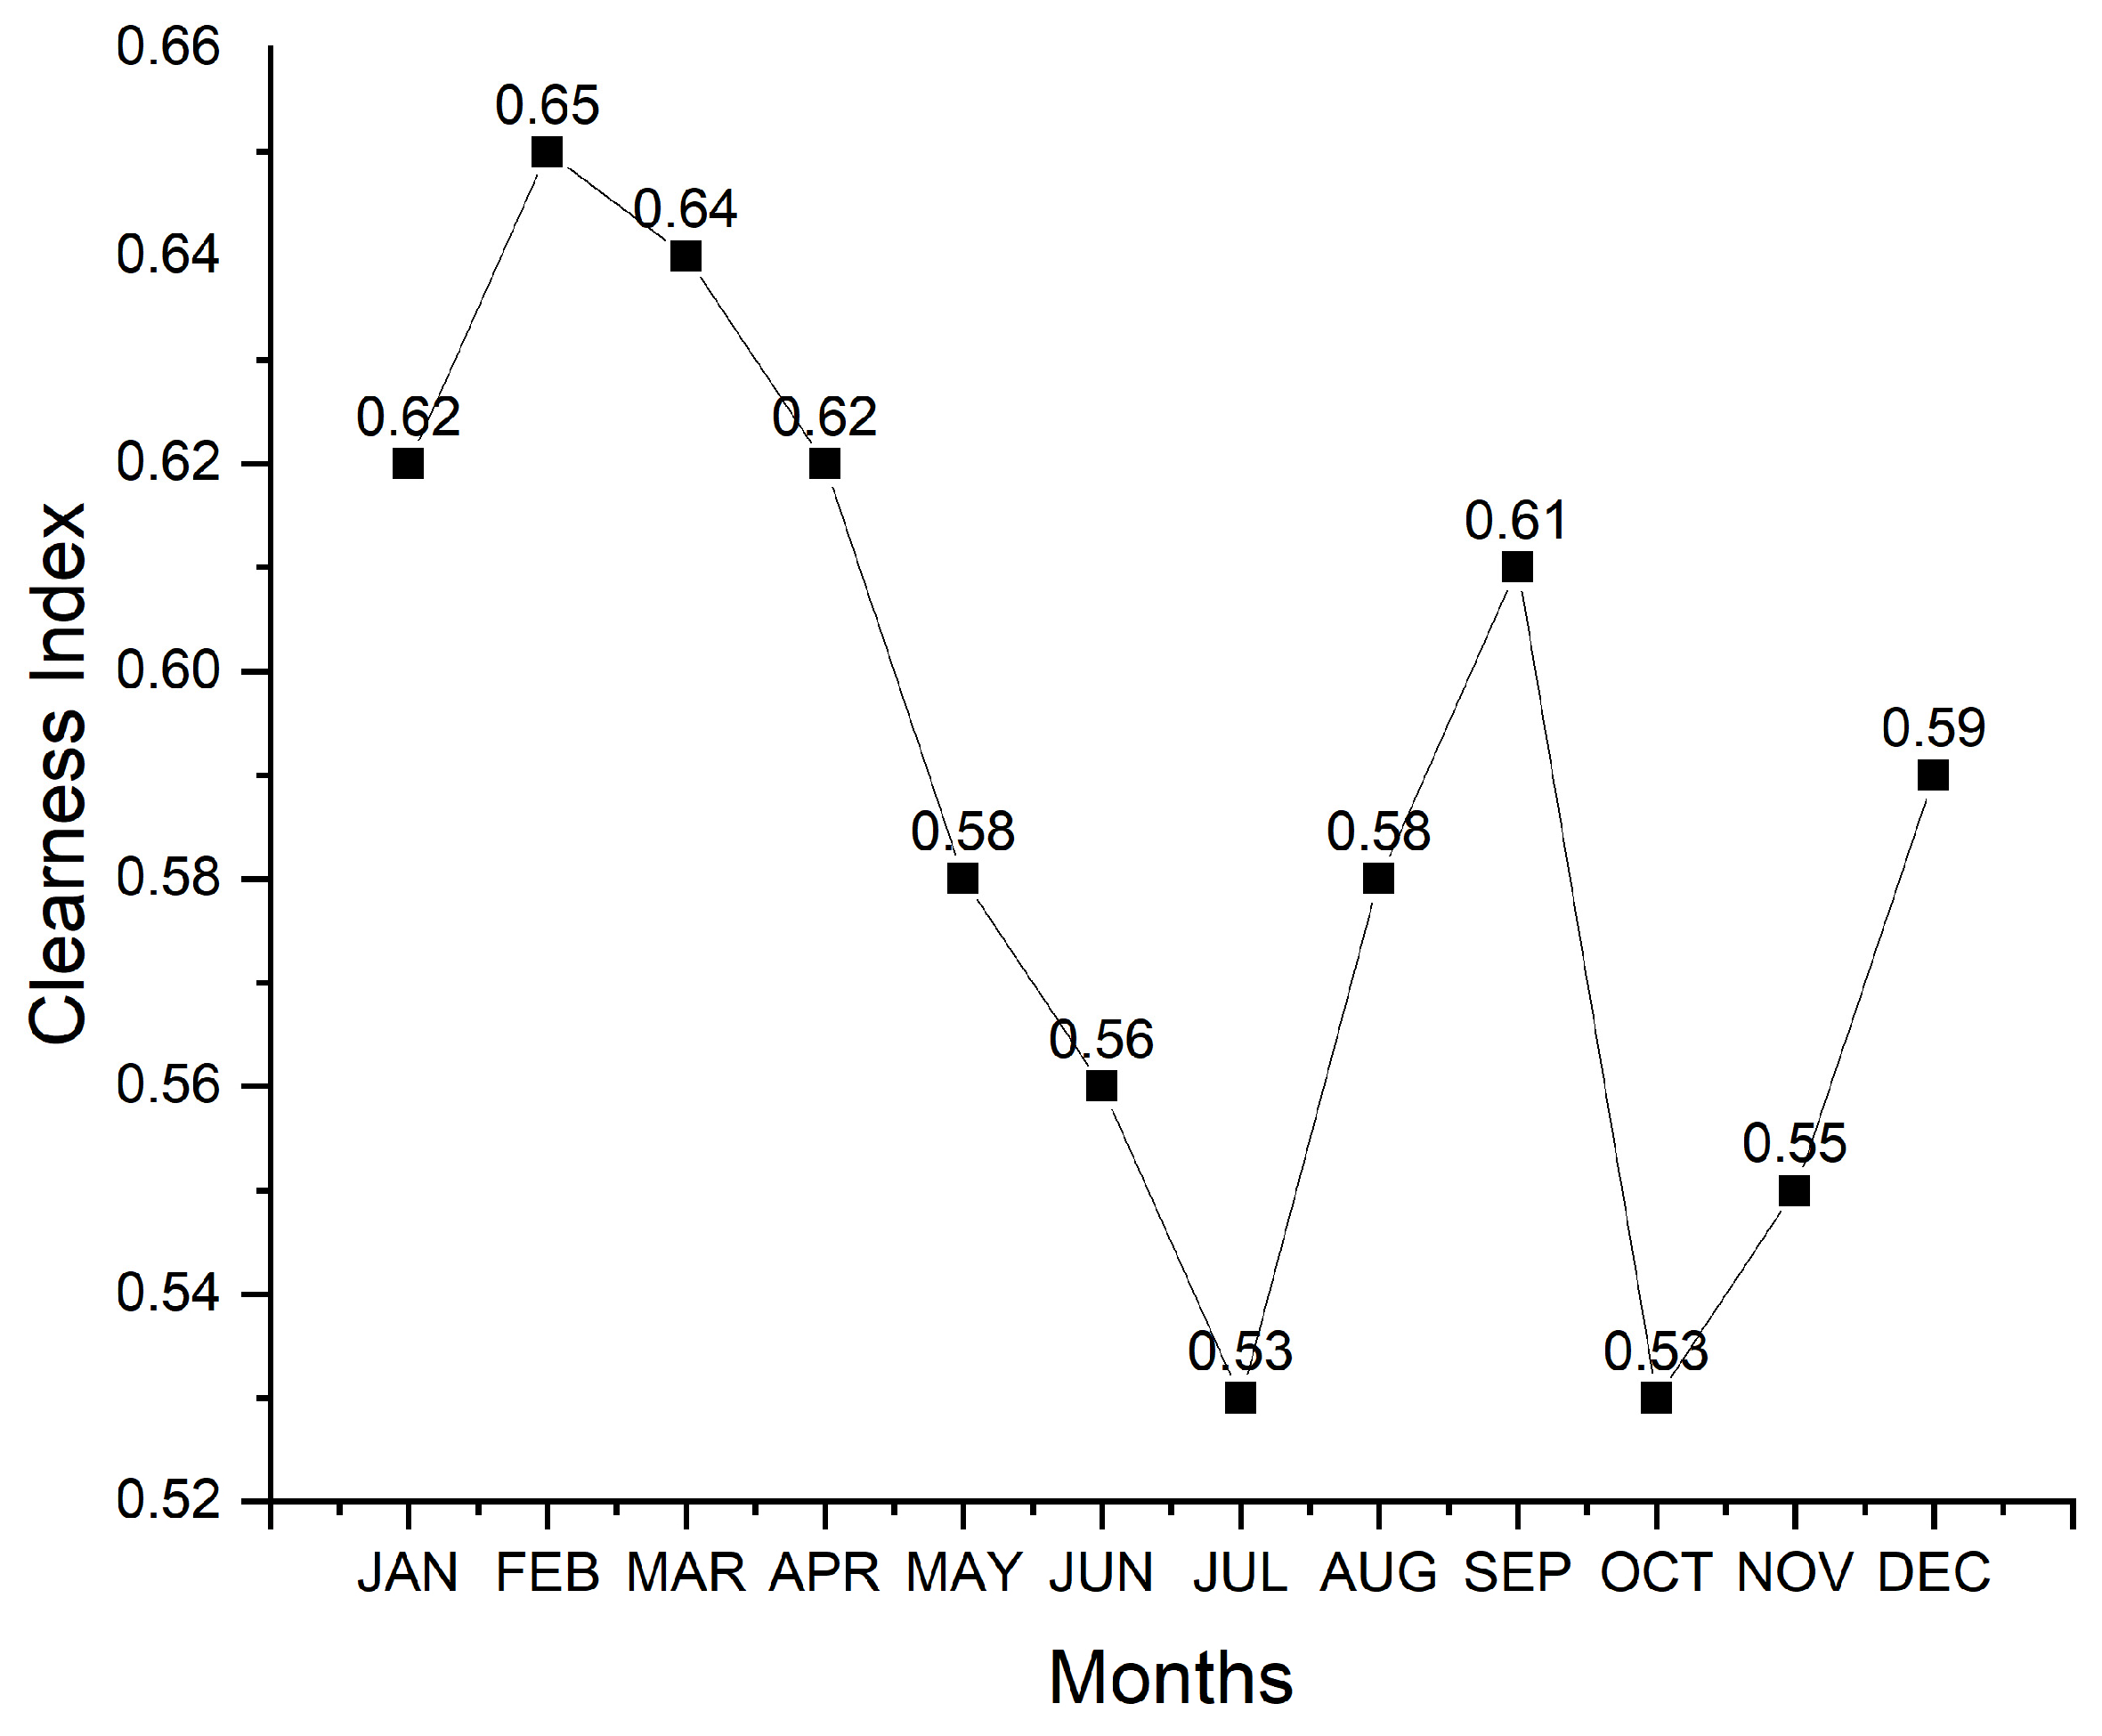
Figure 11 shows the behavior of the clearness index (Kt) in the study area. During the months from January to May, as well as in August and September, Kt values exceeded 0.55, indicating a mostly clear atmosphere with minimal losses due to atmospheric absorption and scattering. In contrast, the lowest Kt values were recorded in July and October, likely due to increased cloud cover or higher levels of pollution. A clearness index close to 1 represents optimal conditions for the implementation of photovoltaic solar power generation systems.

3.2.5. Precipitation

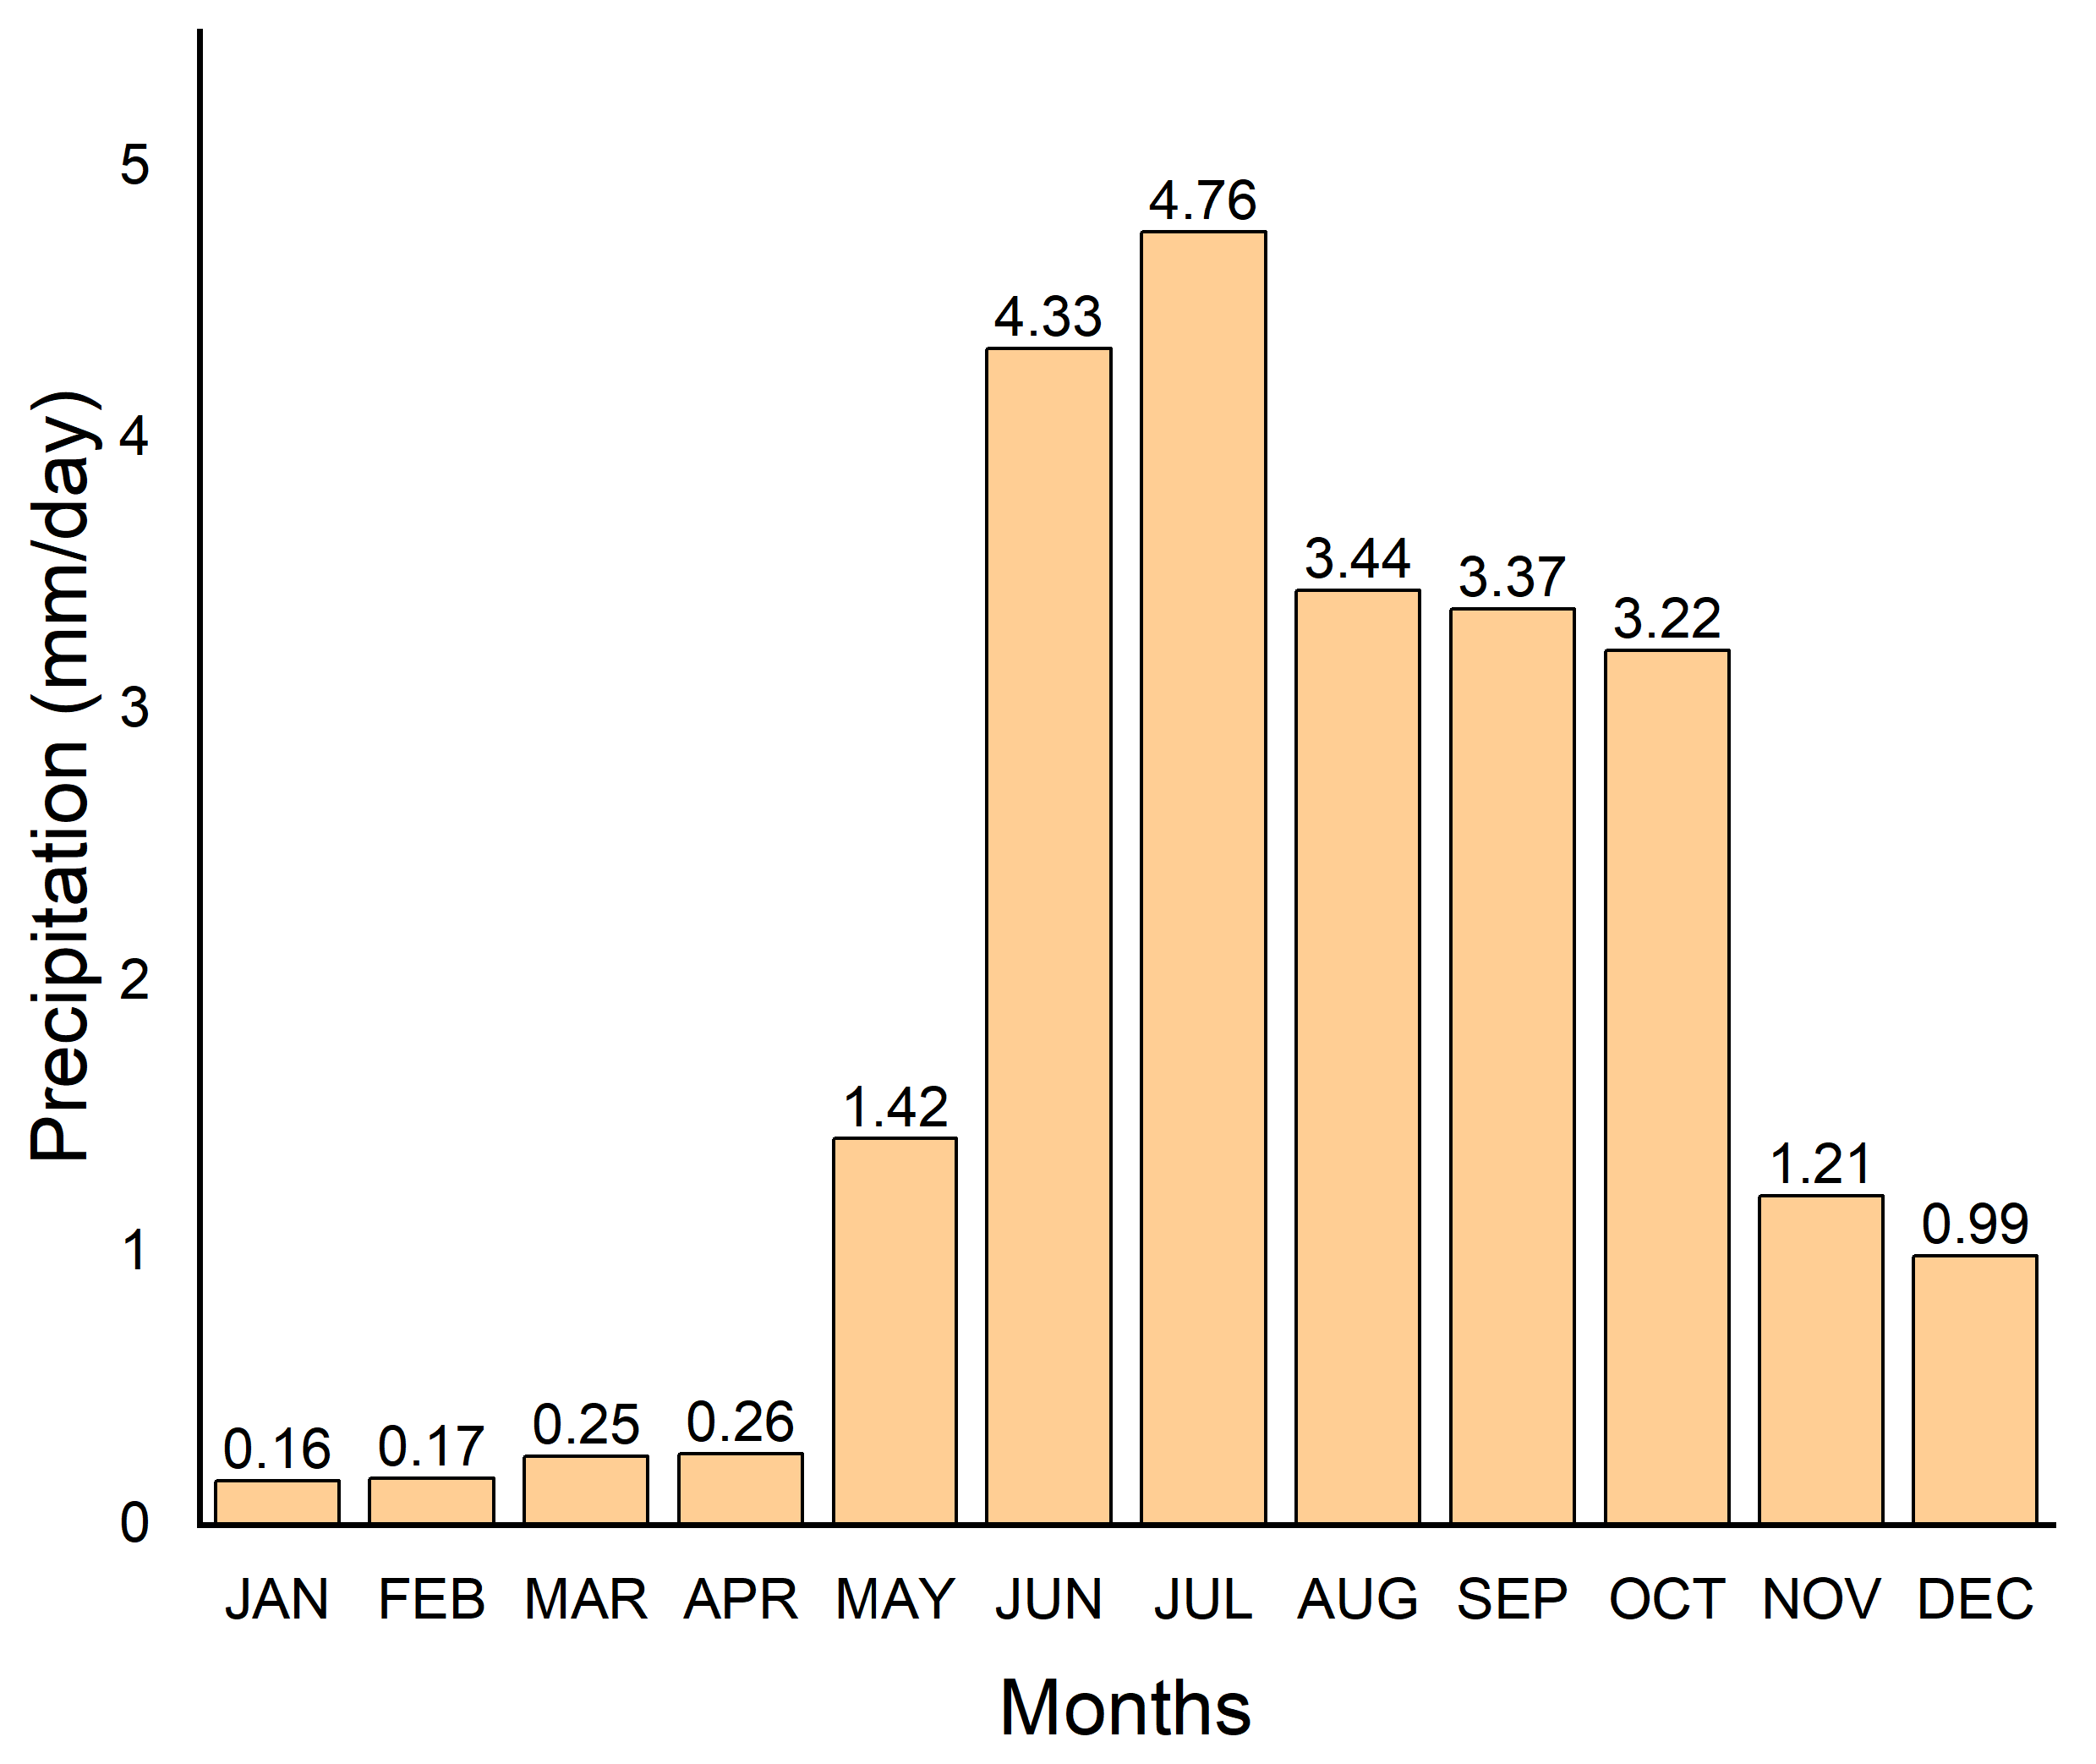
Precipitation is a factor that directly affects the performance of solar power generation systems, as it includes both rainfall and potential hail events. In the case of Santo Domingo Tehuantepec, local climatic conditions do not include hail precipitation, being limited solely to rainfall events. Figure 12 shows that the months with the lowest precipitation extended from November to May, with values below 1.5 mm/day, while the months with the highest precipitation occurred from June to October, with ranges between 3 and 4 mm/day. This condition can be beneficial, as light rain helps clean photovoltaic modules by removing dust and surface dirt without causing structural damage.

3.2.6. Wind Resource

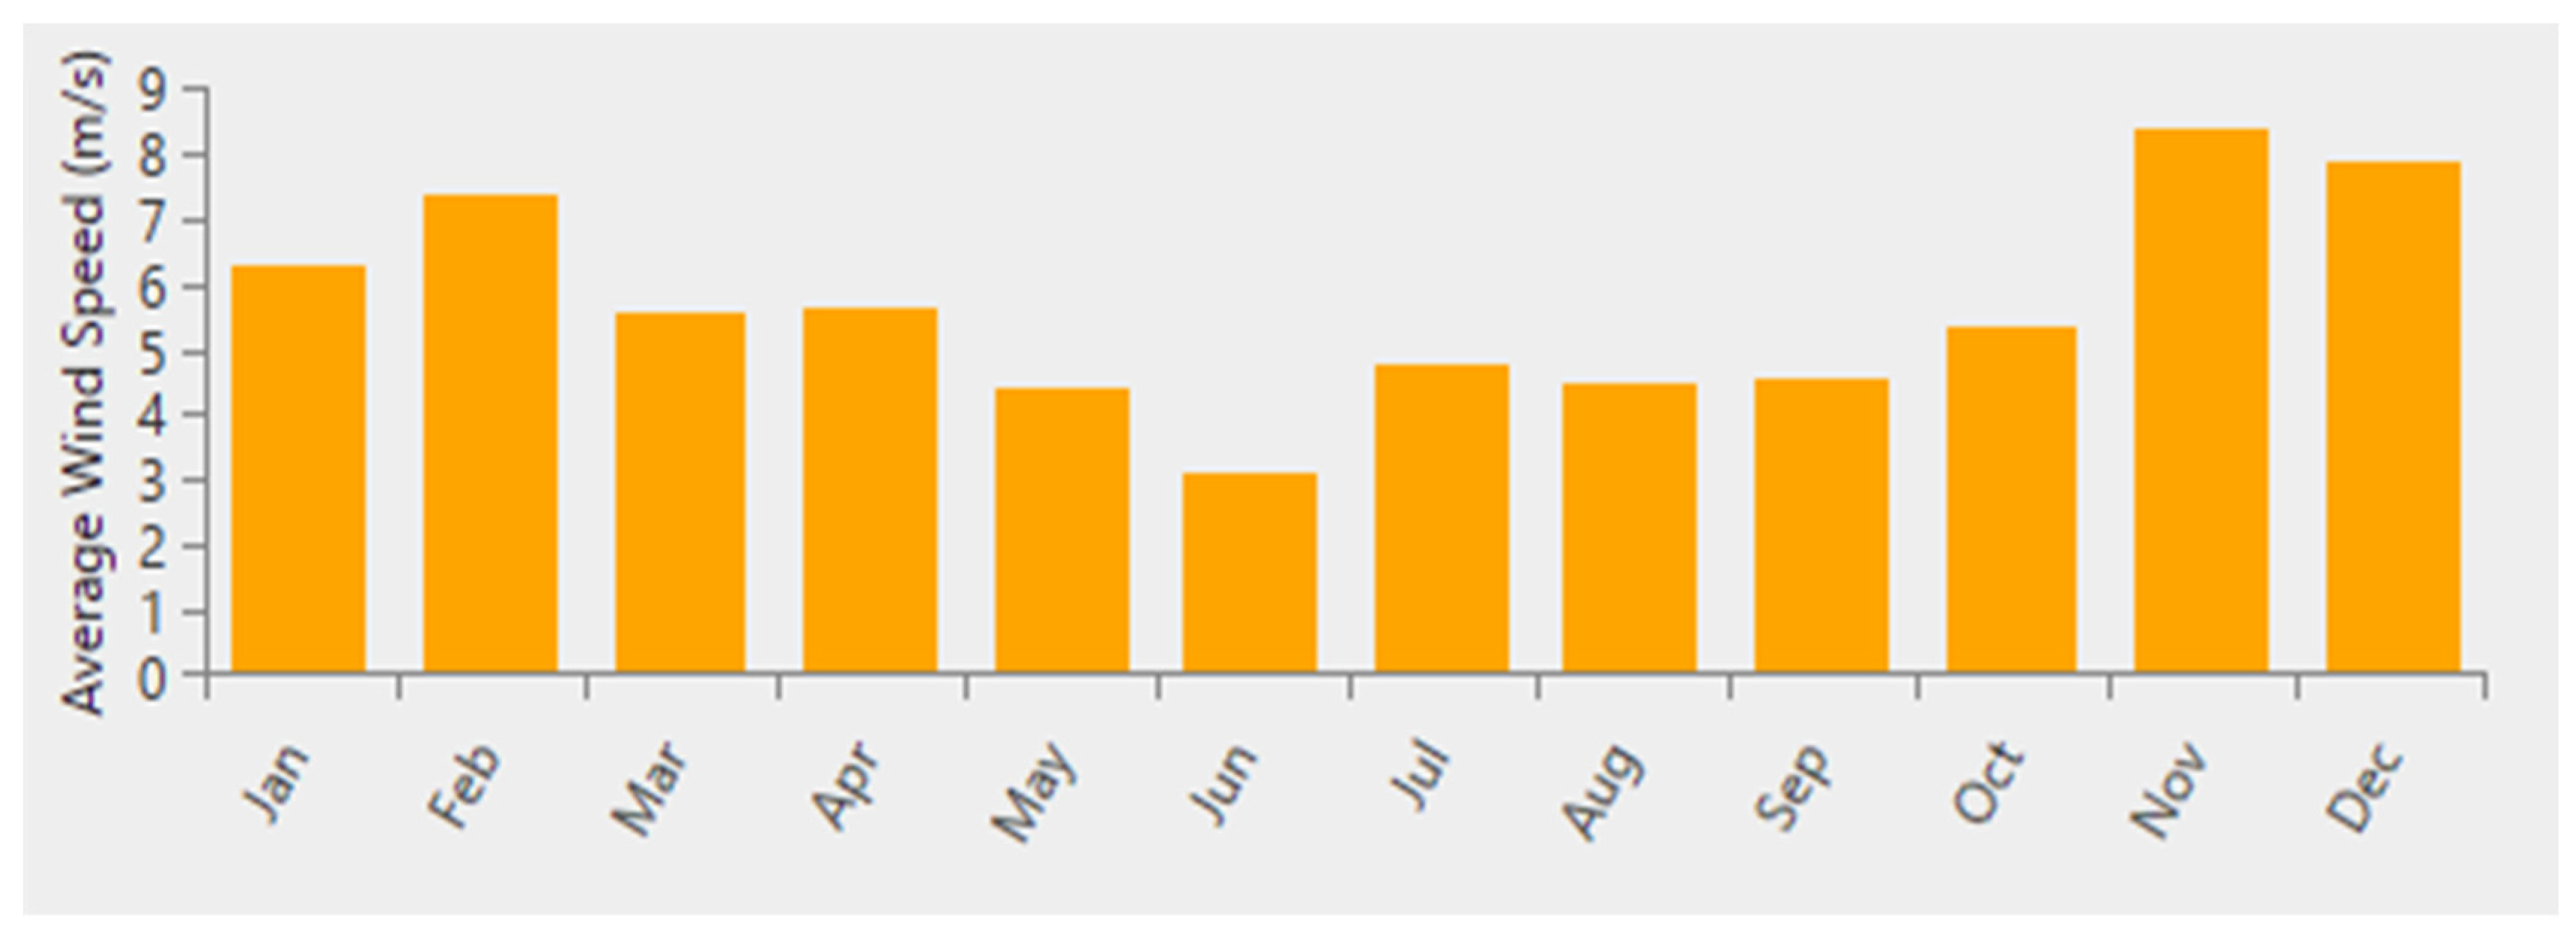
Wind speed data for Santo Domingo Tehuantepec were processed using the Homer Pro software, in response to the need for updated information compared to previous records. The average annual wind speed was determined to be 5.64 m/s. The highest wind speed was recorded in November, reaching 8.33 m/s, while the lowest was observed in June, with 3.11 m/s (Figure 13).

3.2.7. Typical Daily Residential Load Profile

A residential load was modeled for the site located in Santo Domingo Tehuantepec. Figure 14 presents the daily load profile in a 24h format, where energy consumption peaks between 18:00 and 20:00 h, while the lowest demand levels occur between 00:00 and 03:00 h.

3.2.8. System Design

The system design analyzed in this study consisted of photovoltaic modules, an inverter, the load, and the public electrical grid, forming a grid-connected photovoltaic system. According to the National Electric System Development Program (PRODESEN 2024–2038), in 2023, distributed photovoltaic generation in the National Electric System (SEN) surpassed 400,000 contracts, reaching a cumulative installed capacity of 3341 MW and an annual cumulative electricity production of 5191 GWh [92]. While national statistics indicate that distributed photovoltaic generation in the National Electric System (SEN) has surpassed 400,000 contracts, with an installed capacity of 3341 MW and an annual production of 5191 GWh, these aggregated figures do not capture the regional variations that critically influence system performance and economic feasibility. Most of the existing capacity is concentrated in specific urban areas with distinct climatic, economic, and infrastructural conditions, which differ substantially from those in the Isthmus of Tehuantepec. The present study addresses this gap by providing a location-specific techno-economic assessment that accounts for the high solar irradiance, elevated ambient temperatures, persistent wind patterns, and local tariff structures of Santo Domingo Tehuantepec. This localized approach generates evidence tailored to regional conditions, supporting targeted policy design, incentive allocation, and integration strategies for PV systems in similar contexts. Furthermore, by linking technical and economic feasibility with urban planning and climate resilience objectives, this analysis extends beyond the scope of national statistics to inform sustainable energy transitions at the municipal level. This generation modality significantly contributes to reducing Joule effect (I2R) losses by avoiding the transmission of energy from large power plants while also mitigating CO2 emissions by utilizing renewable energy sources. Figure 15 illustrates a general schematic of the evaluated system configuration, which does not include energy storage batteries.

3.3. Economic Analysis

3.3.1. System Components and Their Parameters

The proposed photovoltaic system requires only solar panels and inverters, for which generic components were selected within the Homer Pro software. Additionally, the costs per installed kilowatt and the operation and maintenance (O&M) expenses for the system elements were determined. Table 3 presents the technical and economic parameters used in this study, with updated 2024 prices for each component being considered.
The analyzed system includes a generic photovoltaic array with a nominal capacity of 459 kW, an estimated lifespan of 25 years, and a derating factor of 80%, with capital and replacement costs of MXN 15,000/kW, and an annual O&M cost of MXN 5000. The inverter, also of generic type, has an efficiency of 95%, a relative capacity of 100%, and a lifespan of 13 years; its capital and replacement costs are estimated at MXN 4000/kW, with an annual O&M cost of MXN 200.

3.3.2. Grid Connection

The grid parameters used in this study correspond to the current tariff established by the Federal Electricity Commission in Mexico [93], with a purchase price of MXN 0.80/kWh and a selling price of MXN 1.60/kWh (Table 4). These values were incorporated into the simulation model to accurately assess the feasibility of the grid-connected photovoltaic system.

3.3.3. Economic Parameters

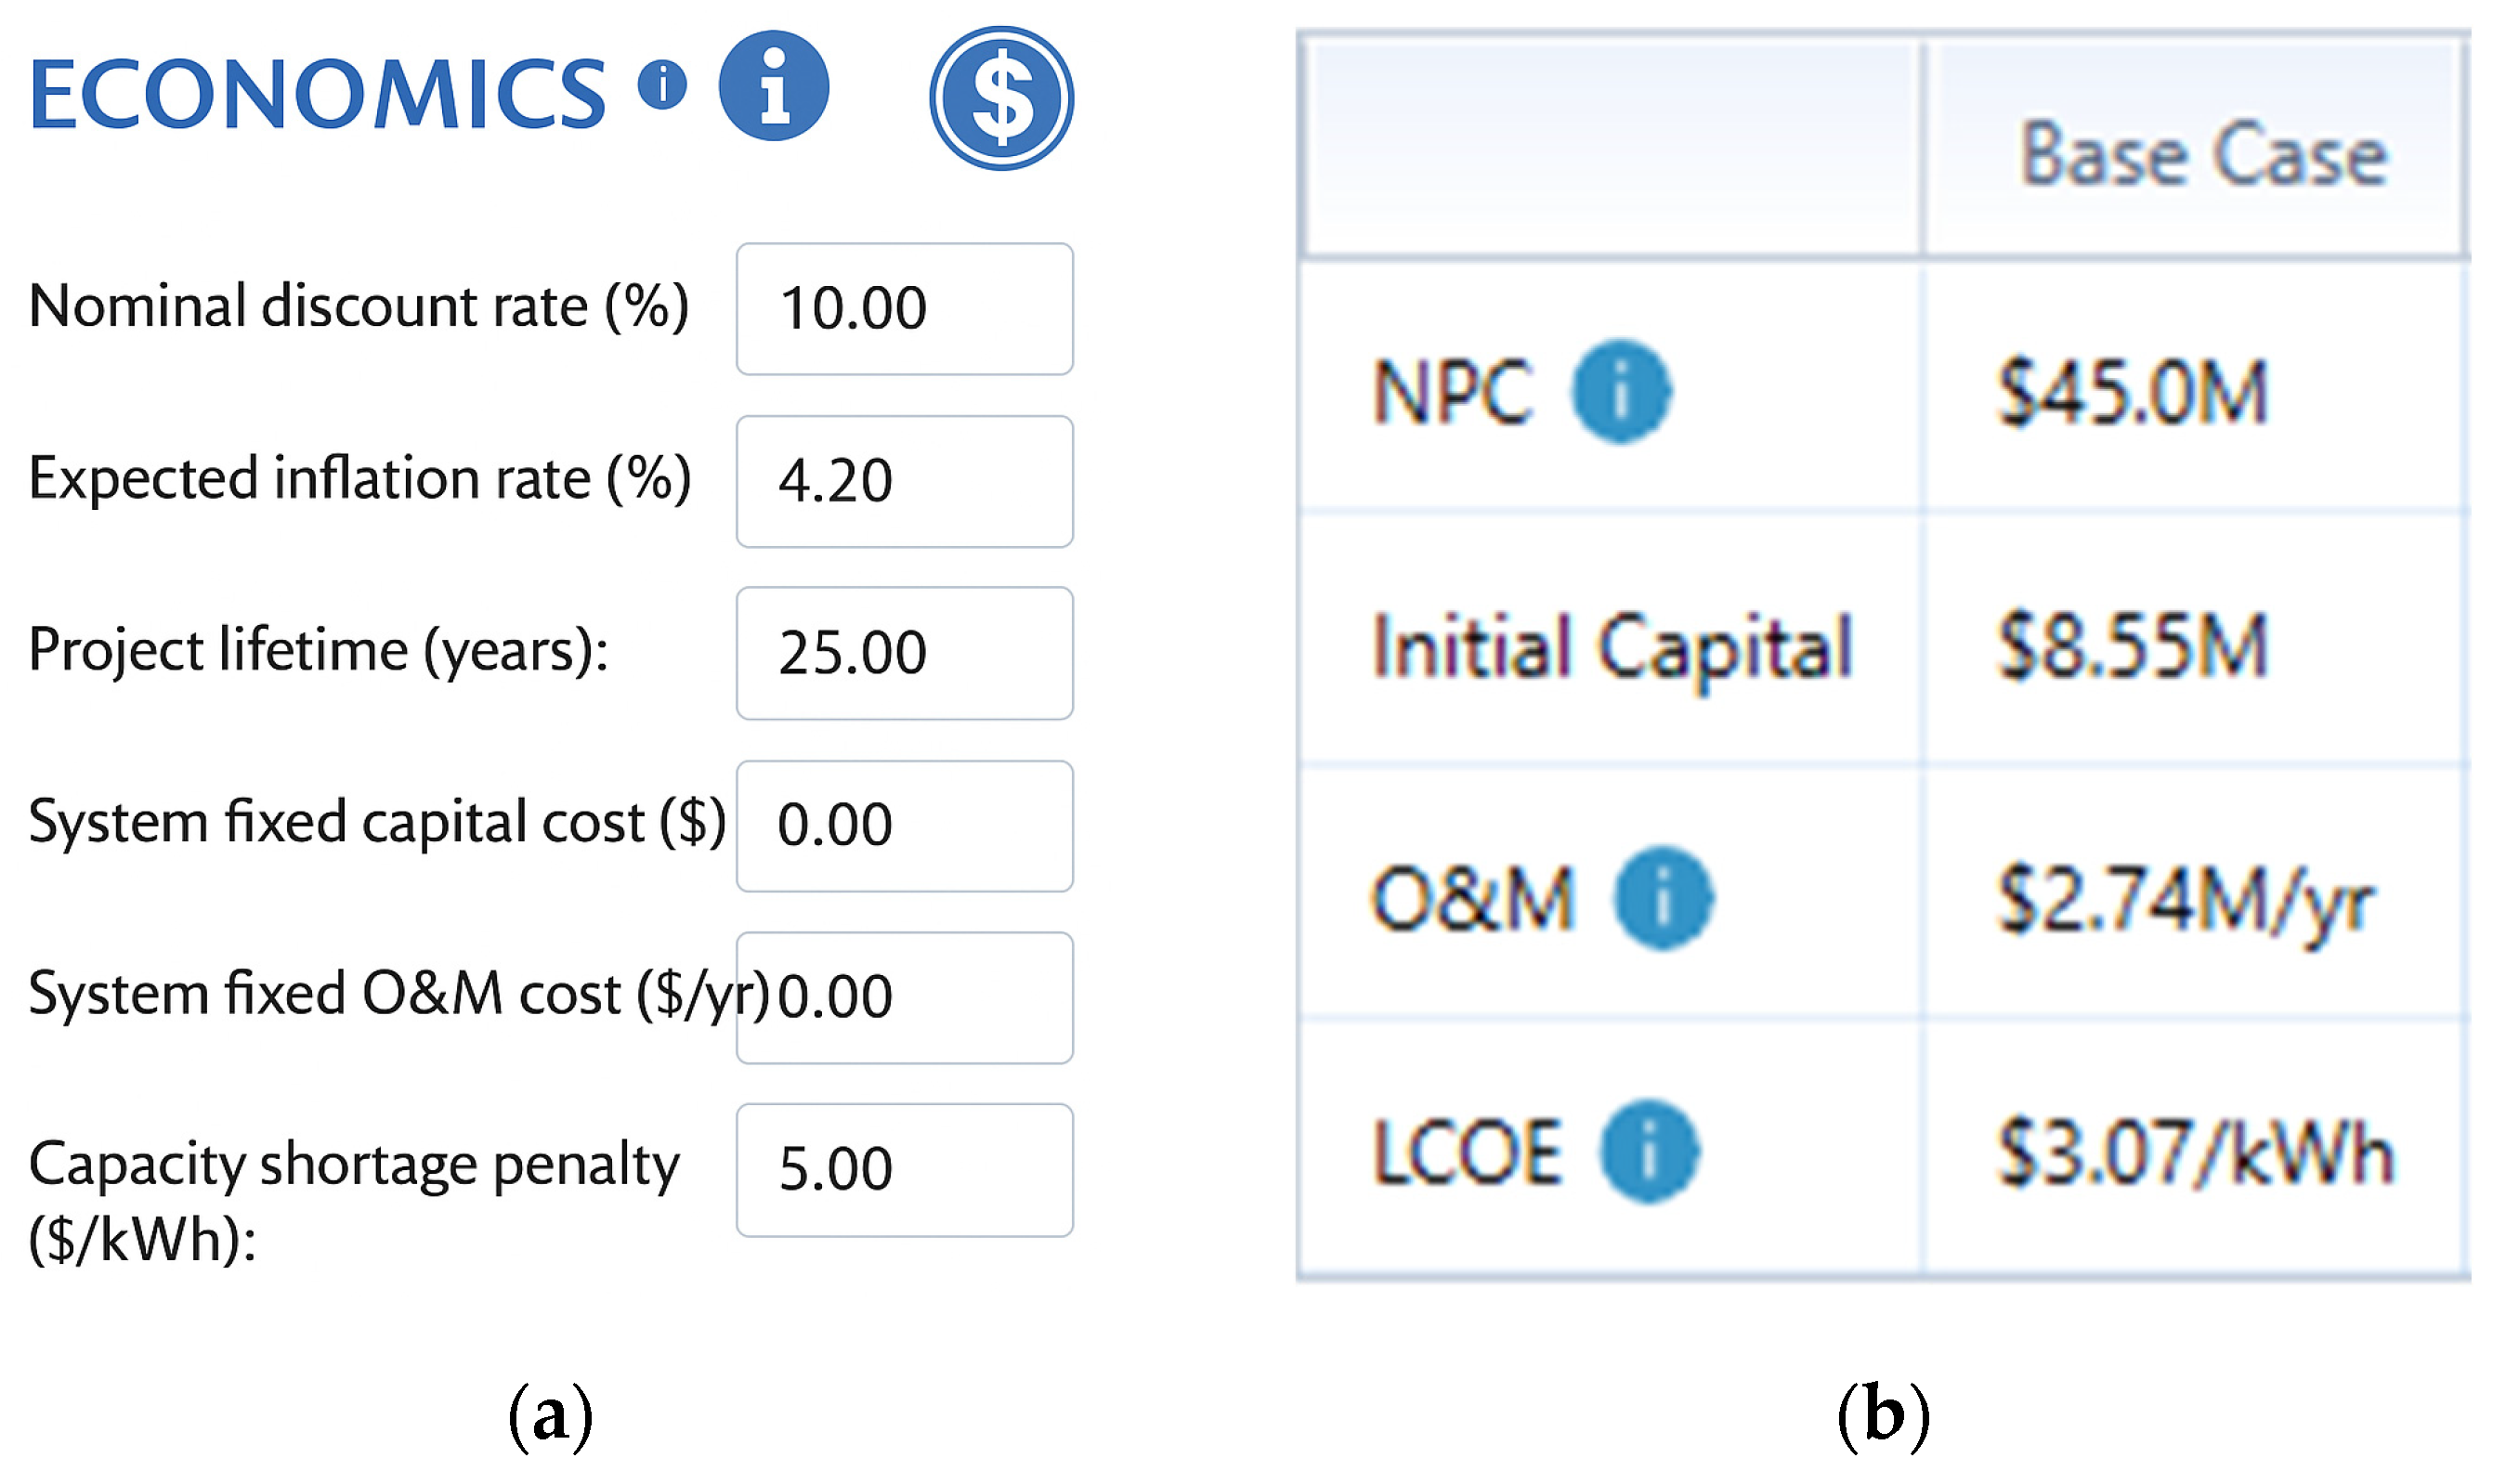
The simulation also incorporated key economic parameters such as the discount rate, inflation, and the system’s useful life horizon. Figure 16a presents these parameters according to the configured model. Meanwhile, Figure 16b displays the simulation results, which indicate an estimated initial investment of MXN 8.55 million for the photovoltaic system. However, the total project cost rises to MXN 45 million, primarily due to accumulated operation and maintenance costs, estimated at MXN 2.74 million annually throughout the system’s operational lifespan.

3.3.4. Cash Flow

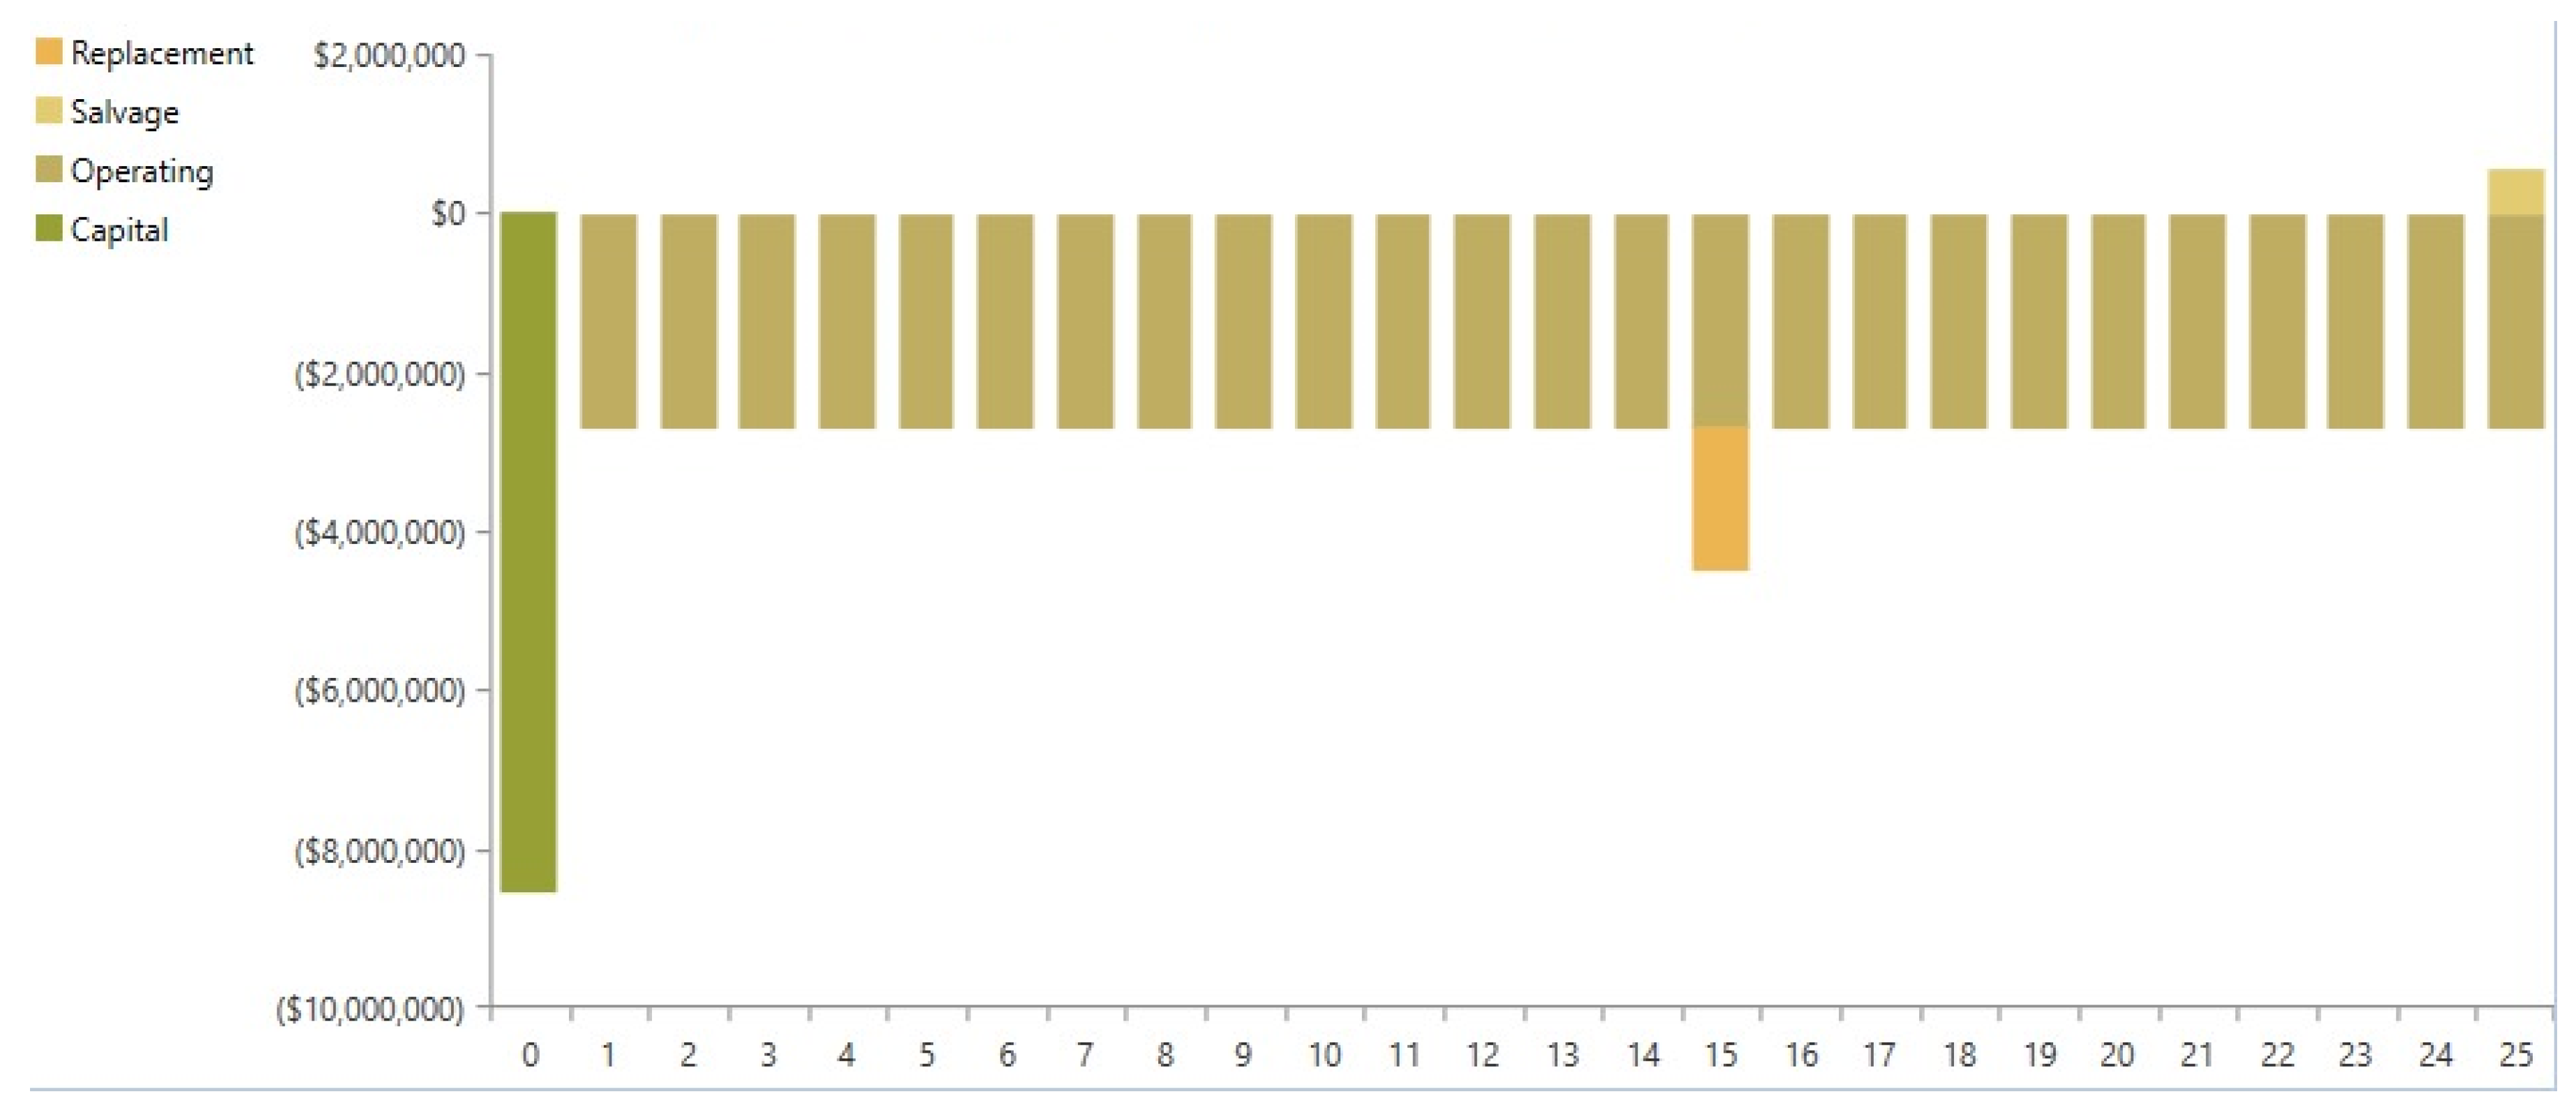
Figure 17 illustrates the project’s cash flow. A significant initial investment is identified in year 0, as well as a reinvestment in year 15, allocated for the replacement of inverters, whose estimated lifespan ranges from 13 to 15 years, with an approximate cost of MXN 1.8 million. This reinvestment is necessary to ensure the system’s operational continuity, as inverters are key components responsible for converting the direct current generated by solar panels into usable alternating current. Although annual revenues of approximately MXN 0.6 million are projected from year 25 onward, these are insufficient to offset the financial loss resulting from the end of the panels’ useful life, which is also expected in that same period. The lack of power generation after year 25, without a second investment to renew the photovoltaic modules, limits the full recovery of the accumulated investment throughout the system’s lifecycle. This structural limitation, associated with the need to replace key components and the absence of solar generation beyond 25 years, prevents the complete recovery of the initial investment over the projected horizon.
Therefore, although the system exhibits positive financial indicators and allows for partial recovery of the invested capital, it does not achieve full profitability by the end of the project’s useful life. The base scenario simulation, configured to meet the original site demand with a total installed PV capacity of 450 kW, never achieved payback within the 25-year project lifetime. Although Homer Pro automatically calculates financial indicators such as the return on investment (ROI), internal rate of return (IRR), and payback period, these are not displayed when the configuration is economically unfeasible [94]. This explains their absence from the base scenario results. In contrast, in the optimized scenario, Homer Pro identified a reduced installed capacity (in kW) that, while not fully covering the total demand, achieved economic viability within the project lifetime, allowing these indicators to be reported and enabling a meaningful comparison between configurations.

3.3.5. Homer Pro Optimizer

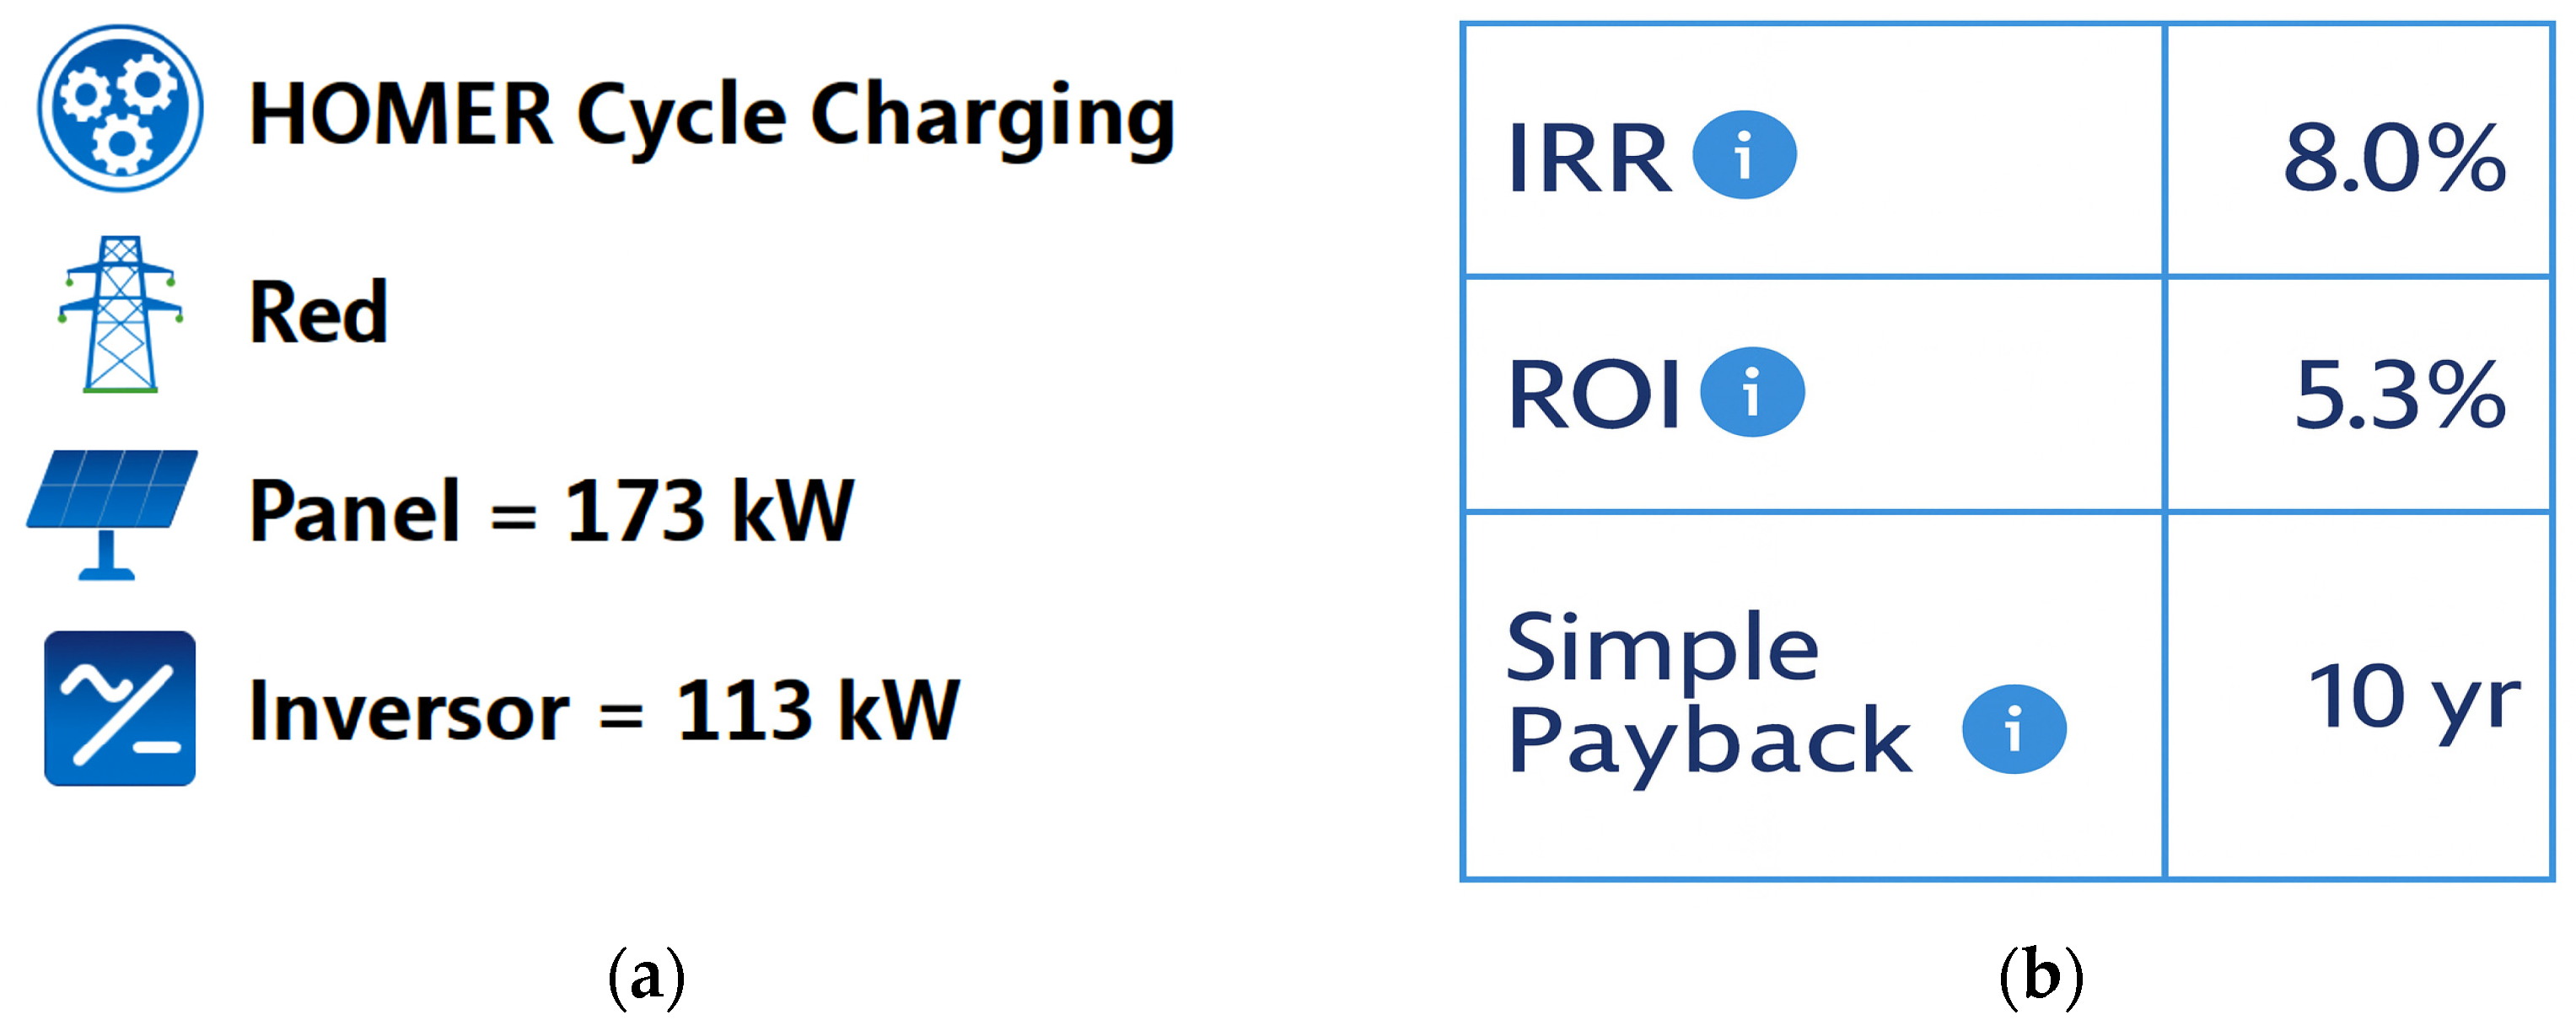
To determine the most efficient system configuration, the Homer Optimizer tool integrated into the Homer Pro software [79] was used. This functionality allows for the exploration of multiple component combinations by evaluating their technical and economic feasibility. Based on the analysis, Homer Pro proposed an optimized system with an installed PV capacity of 173 kW and an inverter capacity of 113 kW, as shown in Figure 18a. This inverter rating, being lower than the total installed PV capacity, is a direct outcome of Homer Pro’s optimization process. The software accounts for system losses, local irradiance profiles, and economic constraints, often resulting in DC/AC ratios above 1 to maximize annual yield and cost-effectiveness. The economic parameters remained consistent with the base scenario.
As a result of this optimization, an initial investment of MXN 4 million was determined for year 0. This investment increases to MXN 14.4 million over the system’s lifetime due to costs associated with inverter replacement, operation and maintenance (O&M), and electricity purchases. The economic results indicate a levelized cost of energy (LCOE) of MXN 1.43/kWh, an IRR of 8%, an ROI of 5.3%, and a simple payback period of 10 years, as illustrated in Figure 18b.
In operational terms, the optimized system achieves a capacity factor of 18.5%, enabling an estimated annual production of 281,175 kWh from the solar panels. Based on this production and with the application of a national grid emission factor of 0.000433 tCO2/kWh, the system is estimated to avoid approximately 121.6 tCO2 per year. This value represents the greenhouse gas emissions that would otherwise be released if the same amount of electricity were generated from the current national energy mix. This generation accounts for 36% of the system’s total demand, while the remaining 64% (equivalent to 493,327 kWh annually) is supplied through energy purchases from the electric grid. Figure 19 illustrates the monthly behavior of solar generation, allowing for an analysis of the seasonal variation in annual energy performance.
To validate the plausibility of simulation outputs, we compared the optimized scenario with empirical data from [95,96]. Table 5 presents the aligned key performance indicators: despite scale differences, capacity factors (~18–20 %) and energy yields are consistent across contexts, strengthening the credibility of our simulation.

4. Discussion

The results obtained through optimization with Homer Pro indicate an improvement in the technical and economic feasibility of the grid-connected photovoltaic system for the case of Santo Domingo Tehuantepec, Oaxaca. Compared to an unfeasible base configuration, which involved an initial investment of MXN 8.55 million and a total cost of MXN 45, the optimized system significantly reduces the initial in-vestment to MXN 4 and the total cost to MXB 14.4. These improvements result from lower operating costs, planned replacements, and the absence of storage components in the system. Storage was excluded from the optimized configuration primarily due to its high capital cost in the Mexican market, which would substantially increase the levelized cost of energy (LCOE) and extend the payback period beyond the project’s useful life. Lithium-ion batteries—currently the most widely adopted technology for PV storage—present investment costs of approximately USD 400–600/kWh of capacity, which is significantly higher than the marginal cost of using the national grid as backup supply [11]. In the case of Santo Domingo Tehuantepec, the grid connection offers a more cost-effective means of balancing generation and demand, given the current net metering policy framework.
Including storage could increase local energy autonomy, improve reliability during grid outages, and enable higher PV penetration. However, under present cost structures, it would also reduce the project’s ROI and IRR and shift the optimal design toward smaller storage capacities primarily aimed at peak shaving or critical load backup, rather than full off-grid operation. The economic feasibility of integrating storage would improve if battery prices decline further or if targeted incentives for distributed energy storage become available in Mexico.
In the base scenario, the photovoltaic (PV) system was sized according to standard design assumptions without iterative refinement. While technically feasible, this configuration resulted in higher capital expenditure, a lower capacity factor, and suboptimal integration with the existing grid infrastructure. Economically, the payback period was longer, and the net present value (NPV) was marginal, indicating limited financial attractiveness under current market conditions.
In contrast, the optimized scenario applied a systematic adjustment of key design parameters—such as installed capacity, inverter sizing, and load matching—to maximize both energy yield and economic return. Technically, this led to higher system efficiency, reduced mismatch losses, and improved alignment with local solar resource availability. Economically, optimization reduced initial investment costs, shortened the payback period, and significantly increased the NPV, enhancing overall project viability.
The clear divergence between these scenarios highlights the added value of optimization: while the base case demonstrates that a grid-connected PV system is possible, the optimized case proves that such a system can be not only feasible but also highly competitive, offering superior technical performance and stronger economic returns.
The optimized system exhibited a competitive LCOE of MXN 1.43/kWh, which is lower than the average generation cost provided by the Federal Electricity Commission. In addition, it yielded an ROI of 5.3%, an IRR of 8%, and a simple payback period of 10 years. These financial indicators are consistent with previous studies based on ROI for distributed photovoltaic projects [86], which report similar returns in residential areas. Moreover, such studies identify construction costs, sunlight duration, retail electricity tariffs, and subsidies as the most influential factors on economic performance.
While the optimized configuration demonstrated improved economic feasibility, with an IRR of 8% and an ROI of 5.3%, these figures can be considered marginal for private sector investment when compared to other financial opportunities in Mexico. The project’s profitability is highly sensitive to external factors such as retail electricity tariffs, net metering benefits, and the availability of subsidies. A reduction in the feed-in tariff or the elimination of incentive programs could significantly extend the payback period and reduce the IRR to levels below investor expectations. Conversely, targeted subsidies or favorable regulatory adjustments could enhance the project’s attractiveness by improving returns and reducing financial risk. These considerations underscore the importance of policy and regulatory frameworks in determining the real-world viability of renewable energy projects in mid-sized urban contexts.
In the base scenario, the lack of economic viability within the 25-year lifetime of the photovoltaic system prevented Homer Pro from reporting financial indicators such as ROI, IRR, and payback period. This limitation is due to the software’s calculation logic, which only provides these metrics when the investment achieves payback within the defined project lifetime. Consequently, the absence of these values in the base scenario contrasts with the optimized configuration, where reduced installed capacity enabled economic feasibility and the reporting of these key indicators. Technically, the base scenario exhibited lower system efficiency and higher mismatch losses due to the absence of parameter optimization, while the optimized configuration achieved better alignment with local solar resource availability and improved capacity factor. Economically, optimization reduced the initial investment, shortened the payback period, and increased the net present value (NPV), further reinforcing the superior viability of the optimized system. This comparison highlights the trade-offs between energy coverage and financial return in techno-economic evaluations.
In grid-connected photovoltaic systems, it is common practice to size the PV array with a nominal DC capacity greater than the inverter’s AC rating, yielding a DC/AC ratio above 1. This design approach optimizes annual energy yield and economic performance by compensating for real-world conditions where PV modules seldom operate at their nameplate capacity. Hazim et al. [97] highlight that appropriate PV/inverter ratios can mitigate energy clipping while improving the inverter’s average load factor, with optimal values depending on climatic and economic factors. For example, Micheli [98] quantified that with a DC/AC ratio of 1.34, soiling losses reduced AC output by only 2.3%, while the total clipped DC energy accounted for 6.9% of the annual production—an acceptable trade-off for increased overall yield. Similarly, Díaz-Bello et al. [99], in a case study for Valencia (Spain), found optimal DC/AC ratios between 1.63 and 1.98, confirming that oversizing the PV array relative to the inverter capacity can enhance energy harvest despite moderate clipping losses. In the present study, this principle is reflected in the system configuration, where the inverter rating is intentionally lower than the total installed PV capacity, consistent with the optimization strategies reported in the literature.
The system’s annual energy production reached 281,175 kWh, covering 36% of the total energy demand, while the remainder was supplied by the electric grid. This hybrid configuration enhances energy reliability and reduces transmission losses [100,101], as also argued by [76,77,78] in the context of Latin American urban environments. Additionally, the differential between energy purchase and sale prices in the grid (MXN 0.80 and MXN 1.60/kWh, respectively) contributes to improving the system’s profitability.
From an environmental perspective, solar energy use reduces dependency on fossil fuels and helps mitigate greenhouse gas (GHG) emissions [102,103,104,105,106], with several authors highlighting the role of photovoltaic systems in reducing the urban environmental footprint. In the optimized scenario, the system’s contribution can be quantified: approximately 121.6 tCO2/year are avoided by substituting grid electricity with photovoltaic generation. This result aligns with Sustainable Development Goal (SDG) 13, reinforcing the role of distributed solar systems in climate change mitigation strategies (SDGs 7, 11, and 13) [36,107,108,109].
When contextualizing these results within the broader framework of unplanned urban growth, as warned by the European Environment Agency [110], it becomes evident that intermediate cities such as Santo Domingo Tehuantepec face critical challenges related to unregulated expansion, loss of ecosystem services, and increased vulnerability to climate risks. In this regard, the study contributes to the debate on sustainable urbanization by demonstrating that the implementation of clean energy systems can generate economic, environmental, and social benefits by improving decentralized access to energy.
Therefore, the adoption of photovoltaic systems should be part of a broader regional planning strategy. Land-use policies must promote distributed generation, particularly in areas of urban expansion, to reduce automobile dependency, mitigate the effects of territorial fragmentation, and strengthen urban energy resilience. Integrating energy planning with urban planning increases energy equity and reduces the vulnerability of settlements [111,112].
To advance urban resilience in Santo Domingo Tehuantepec and similar mid-sized cities, the integration of photovoltaic systems must be embedded within comprehensive urban planning frameworks. This includes incorporating PV adoption targets into municipal development plans, revising building codes to require or incentivize rooftop solar installations, and aligning distributed generation initiatives with climate adaptation strategies.
From a policy perspective, land-use regulations should prioritize mixed-use developments and compact urban growth patterns that reduce energy demand and enable efficient PV deployment. Urban resilience can be further strengthened by coupling photovoltaic infrastructure with complementary measures such as energy-efficient public lighting, electric vehicle charging corridors, and green infrastructure that mitigates heat island effects.
Beyond its role as an energy supply measure, the integration of PV systems can form part of a broader urban sustainability strategy. Coupling distributed PV generation with electric vehicle charging infrastructure, energy-efficient public lighting, and the expansion of green areas can yield synergistic benefits, including reduced greenhouse gas emissions, improved air quality, and enhanced urban livability. In the context of Santo Domingo Tehuantepec, such an integrated approach would align with climate adaptation objectives while supporting compact, mixed-use development patterns that lower transportation energy demand.
For implementation, local governments could establish pilot projects in public buildings to demonstrate technical and financial viability, while creating financing mechanisms in collaboration with the private sector to facilitate household and small business adoption. These combined actions not only increase the penetration of clean energy but also enhance the capacity of urban systems to withstand and recover from disruptions, aligning with the principles of sustainable urban development and the objectives of SDG 11.
The effectiveness of PV integration in mid-sized cities such as Santo Domingo Tehuantepec ultimately depends on the alignment between energy policy and comprehensive urban development strategies. Regulatory frameworks—such as Mexico’s net metering scheme, distributed generation rules, and incentives under the PRODESEN program—directly influence investment decisions, system sizing, and adoption rates. When these policies are coordinated with urban planning measures, such as zoning regulations favoring mixed-use development, requirements for rooftop PV in new construction, and integration with public transportation electrification plans, they create mutually reinforcing benefits. Conversely, the absence of such coordination can limit the impact of PV projects, leading to fragmented infrastructure and missed opportunities for enhancing urban resilience, social equity, and climate mitigation.
The consistency between our modeled results and data from [95,96], particularly in capacity factor and annual yield, supports the technical realism of the optimized scenario. Although the systems differ in size, the relative performance alignment implies robust modeling validity under regional conditions.
This study demonstrates that the integration of tools such as Homer Pro with urban and regional planning criteria enables the design of energy solutions that are technically feasible, financially profitable, and environmentally sustainable. These findings can support the formulation of public policies aimed at the development of resilient and sustainable cities, aligning with the challenges posed by climate change and unplanned urbanization.

5. Conclusions

The integration of grid-connected photovoltaic systems in urban environments such as Santo Domingo Tehuantepec constitutes a technically, economically, and environmentally viable strategy to advance toward more sustainable urbanization models. The results obtained through the Homer Pro simulation software demonstrated that it is possible to design efficient energy configurations that significantly reduce both the initial investment and the LCOE while maintaining positive financial indicators such as an acceptable return on investment, a suitable internal rate of return, and a reasonable payback period. These conditions help shift the perception of solar energy from being a costly or marginal alternative to becoming a realistic option in urban contexts with favorable climatic conditions.
In the specific case of Tehuantepec, the optimized system covers 36% of the energy demand through photovoltaic generation, representing a significant reduction in dependence on the conventional electrical grid. While a 36% coverage does not achieve full self-sufficiency, it represents a substantial improvement in local energy autonomy compared to the current full dependence on the grid. In mid-sized urban contexts, partial coverage of this magnitude can still yield significant benefits, including reduced exposure to grid price fluctuations, enhanced resilience during supply disruptions, and meaningful GHG emission reductions. However, its sufficiency depends on the specific policy and economic objectives: for climate mitigation targets, such coverage can contribute notably, whereas for full energy independence, further integration of PV capacity or complementary technologies, such as storage or demand-side management, would be required. This level of penetration also aligns with practical implementation constraints, balancing investment costs with measurable environmental and economic gains. This hybrid configuration improves supply reliability, reduces transmission losses, and contributes to the diversification of the local energy matrix. Currently, Mexico’s energy matrix is predominantly composed of fossil fuels such as natural gas, diesel, and fuel oil, supplemented by hydroelectric, nuclear, and, to a lesser extent, renewable sources such as solar and wind. In this context, the annual generation of 281,175 kWh from clean energy sources directly reduces fossil fuel consumption, favoring urban climate change mitigation and enhancing regional environmental health.
From an environmental standpoint, this generation is estimated to avoid approximately 121.6 tCO2 per year, based on the national grid emission factor for Mexico (0.000433 tCO2/kWh). This reduction is equivalent to removing more than 26 passenger vehicles from circulation annually, reinforcing the project’s alignment with Mexico’s climate commitments and Sustainable Development Goal 13 (Climate Action). These results confirm that even partial PV integration can deliver substantial greenhouse gas reductions, contributing meaningfully to both local and global mitigation efforts.
From an urban planning perspective, this study demonstrates that photovoltaic systems are both technically and economically feasible. This feasibility is closely linked to sustainable urbanization processes, contributing to their consolidation. Energy decentralization, supported by technologies such as distributed photovoltaics, which refers to small-scale electricity generation located near the point of consumption and connected to the public grid, can foster the development of more compact, efficient, and resilient cities. In this context, energy becomes an enabling factor for promoting social equity and environmental justice. Moreover, by reducing pressure on centralized energy infrastructure, local adaptive capacities are enhanced, and a culture of energy sustainability is encouraged.
Although this study did not quantify energy vulnerability indicators for low-income households, the findings have relevant implications for these segments. In Santo Domingo Tehuantepec, where income disparities and uneven energy infrastructure persist, the adoption of distributed PV systems could help stabilize household electricity expenses, reduce exposure to tariff fluctuations, and improve reliability in areas with frequent grid interruptions. However, without targeted subsidies, micro-financing schemes, or community-based ownership models, the upfront costs of PV adoption may limit access for economically disadvantaged households. Addressing this gap would be essential to ensuring that the benefits of PV integration contribute to reducing—not exacerbating—energy vulnerability in the region.
Pilot implementation of the proposed PV system design in selected urban sectors would allow for real-world testing of technical performance, community acceptance, and integration with local infrastructure, generating empirical evidence to refine large-scale deployment strategies. Policy engagement—through collaboration with municipal and regional authorities—can facilitate the incorporation of distributed generation into urban development plans, ensuring alignment with zoning regulations, climate adaptation measures, and social inclusion policies. In this context, decentralization of energy generation not only reduces strain on centralized infrastructure but also improves energy access equity by enabling localized control over production and consumption.
This work confirms the usefulness of simulation tools such as Homer Pro for the design, analysis, and optimization of urban energy systems, particularly in developing regions with high solar potential. The evidence generated here may be of value to researchers, decision-makers, regional planners, and stakeholders in the energy sector interested in implementing feasible and effective solutions that align energy transition efforts with territorial planning and sustainable urban development.
This study is subject to certain limitations, including the reliance on simulated data and the exclusion of dynamic policy or market changes that may influence future system feasibility. Further research should explore pilot-scale implementation in comparable mid-sized cities, sensitivity analyses under varying tariff and incentive schemes, and integration with complementary technologies such as energy storage or electric mobility. These directions would enhance the robustness of the techno-economic assessment and strengthen the link between renewable energy adoption and sustainable urban transformation.

Author Contributions

Conceptualization, A.A.-B., V.A.-E., L.H.D., E.C.-M. and M.P.-O.; methodology, A.A.-B., V.A.-E. and L.H.D.; software, A.A.-B. and V.A.-E.; validation, A.A.-B., V.A.-E., E.C.-M. and M.P.-O.; formal analysis, A.A.-B., V.A.-E., L.H.D., E.C.-M., B.C.-M. and M.P.-O.; investigation, A.A.-B., V.A.-E., L.H.D., E.C.-M., B.C.-M. and M.P.-O.; resources, A.A.-B., V.A.-E., L.H.D., E.C.-M., B.C.-M. and M.P.-O.; data curation, A.A.-B. and V.A.-E.; writing—original draft preparation, A.A.-B., V.A.-E., L.H.D., E.C.-M., B.C.-M. and M.P.-O.; writing—review and editing, A.A.-B., V.A.-E., L.H.D., E.C.-M., B.C.-M. and M.P.-O.; visualization, A.A.-B., V.A.-E., L.H.D., E.C.-M., B.C.-M. and M.P.-O.; supervision, A.A.-B.; project administration, A.A.-B.; funding acquisition, A.A.-B., V.A.-E., L.H.D., E.C.-M., B.C.-M. and M.P.-O. All authors have read and agreed to the published version of the manuscript.

Funding

This research received no external funding.

Data Availability Statement

No new data were created or analyzed in this study. Data sharing is not applicable to this article.

Conflicts of Interest

The authors declare no conflicts of interest.

References

  1. Gan, K.E.; Taikan, O.; Gan, T.Y.; Weis, T.; Yamazaki, D.; Schüttrumpf, H. Enhancing renewable energy systems, contributing to Sustainable Development Goals of United Nation and building resilience against climate change impacts. Energy Technol. 2023, 11, 2300275. [Google Scholar] [CrossRef]
  2. Kabeyi, M.J.B.; Olanrewaju, O.A. Sustainable energy transition for renewable and low carbon grid electricity generation and supply. Front. Energy Res. 2022, 9, 743114. [Google Scholar] [CrossRef]
  3. Shang, Y.; Sang, S.; Tiwari, A.K.; Khan, S.; Zhao, X. Impacts of renewable energy on climate risk: A global perspective for energy transition in a climate adaptation framework. Appl. Energy 2024, 362, 122994. [Google Scholar] [CrossRef]
  4. Owusu, P.A.; Asumadu-Sarkodie, S. A review of renewable energy sources, sustainability issues and climate change mitigation. Cogent Eng. 2016, 3, 1167990. [Google Scholar] [CrossRef]
  5. Büyüközkan, G.; Karabulut, Y.; Mukul, E. A novel renewable energy selection model for United Nations’ sustainable development goals. Energy 2018, 165, 290–302. [Google Scholar] [CrossRef]
  6. Leal Filho, W.; Trevisan, L.V.; Rampasso, I.S.; Anholon, R.; Dinis, M.A.P.; Brandli, L.L.; Mazutti, J. When the alarm bells ring: Why the UN sustainable development goals may not be achieved by 2030. J. Clean. Prod. 2023, 407, 137108. [Google Scholar] [CrossRef]
  7. Simsek, Y.; Santika, W.G.; Anisuzzaman, M.; Urmee, T.; Bahri, P.A.; Escobar, R. An analysis of additional energy requirement to meet the sustainable development goals. J. Clean. Prod. 2020, 272, 122646. [Google Scholar] [CrossRef]
  8. Cantarero, M.M.V. Of renewable energy, energy democracy, and sustainable development: A roadmap to accelerate the energy transition in developing countries. Energy Res. Soc. Sci. 2020, 70, 101716. [Google Scholar] [CrossRef]
  9. Rashed, A.H.; Shah, A. The role of private sector in the implementation of sustainable development goals. Environ. Dev. Sustain. 2020, 23, 2931–2948. [Google Scholar] [CrossRef]
  10. Aleluia, J.; Tharakan, P.; Chikkatur, A.P.; Shrimali, G.; Chen, X. Accelerating a clean energy transition in Southeast Asia: Role of governments and public policy. Renew. Sustain. Energy Rev. 2022, 159, 112226. [Google Scholar] [CrossRef]
  11. IEA. Global Energy Review 2025; IEA: Paris, France, 2025; Available online: https://www.iea.org/reports/global-energy-review-2025 (accessed on 1 August 2025).
  12. Kat, B.; Şahin, Ü.; Teimourzadeh, S.; Tör, O.B.; Voyvoda, E.; Yeldan, A.E. A new energy-economy-environment modeling framework: Insights from decarbonization of the Turkish power Sector towards net-zero Emission targets. Energy 2024, 302, 131760. [Google Scholar] [CrossRef]
  13. Luan, Y.; Tang, D.; Aderemi, T.; Osabohien, R. Clean energy adoption, industrialization and sustainable development: A system GMM approach. Energy Strategy Rev. 2025, 59, 101740. [Google Scholar] [CrossRef]
  14. Aggarwal, S.; Mahalik, M.K. The nexus of urbanization and renewable energy productivity: Implications for sustainable development in developing Asia nations. Int. J. Energy Sect. Manag. 2025. [Google Scholar] [CrossRef]
  15. Cui, L.; Weng, S.; Nadeem, A.M.; Rafique, M.Z.; Shahzad, U. Exploring the role of renewable energy, urbanization and structural change for environmental sustainability: Comparative analysis for practical implications. Renew. Energy 2022, 184, 215–224. [Google Scholar] [CrossRef]
  16. Feng, Q.; Gauthier, P. Untangling urban sprawl and climate change: A review of the literature on physical planning and transportation drivers. Atmosphere 2021, 12, 547. [Google Scholar] [CrossRef]
  17. Humbal, A.; Chaudhary, N.; Pathak, B. Urbanization Trends, Climate Change, and Environmental Sustainability; Pathak, B., Dubey, R.S., Eds.; Springer: Singapore, 2023; pp. 151–166. [Google Scholar] [CrossRef]
  18. Romero, J.C.; Linares, P.; Rodriguez-Matas, A.F.; Perez-Bravo, M. Illustrating the conflicts between energy poverty and decarbonization in the energy transition. A case example in Spain. Energy 2025, 314, 134204. [Google Scholar] [CrossRef]
  19. Vatalis, K.I.; Avlogiaris, G.; Tsalis, T.A. Just transition pathways of energy decarbonization under the global environmental changes. J. Environ. Manag. 2022, 309, 114713. [Google Scholar] [CrossRef] [PubMed]
  20. Kartal, M.T.; Shahbaz, M.; Taşkın, D.; Depren, S.K.; Ayhan, F. How are energy transition and energy-related R&D investments effective in enabling decarbonization? Evidence from Nordic Countries by novel WLMC model. J. Environ. Manag. 2024, 365, 121664. [Google Scholar] [CrossRef]
  21. Hamid, I.; Alam, M.S.; Kanwal, A.; Jena, P.K.; Murshed, M.; Alam, R. Decarbonization pathways: The roles of foreign direct investments, governance, democracy, economic growth, and renewable energy transition. Environ. Sci. Pollut. Res. 2022, 29, 49816–49831. [Google Scholar] [CrossRef]
  22. Urban, F.; Nurdiawati, A.; Harahap, F. Sector coupling for decarbonization and sustainable energy transitions in maritime shipping in Sweden. Energy Res. Soc. Sci. 2024, 107, 103366. [Google Scholar] [CrossRef]
  23. Ahmed, S.; Ali, A.; Ansari, J.A.; Qadir, S.A.; Kumar, L. A Comprehensive Review of Solar Photovoltaic Systems: Scope, Technologies, Applications, Progress, Challenges and Recommendations. IEEE Access 2025, 13, 69723–69750. [Google Scholar] [CrossRef]
  24. Ebhota, W.S.; Jen, T.C. Fossil fuels environmental challenges and the role of solar photovoltaic technology advances in fast tracking hybrid renewable energy system. Int. J. Precis. Eng. Manuf.-Green Technol. 2020, 7, 97–117. [Google Scholar] [CrossRef]
  25. Soto, E.A.; Hernandez-Guzman, A.; Vizcarrondo-Ortega, A.; McNealey, A.; Bosman, L.B. Solar energy implementation for health-care facilities in developing and underdeveloped countries: Overview, opportunities, and challenges. Energies 2022, 15, 8602. [Google Scholar] [CrossRef]
  26. Shaban, W.M.; Kabeel, A.E.; Attia, M.E.H.; Talaat, F.M. Optimizing photovoltaic thermal solar systems efficiency through advanced artificial intelligence driven thermal management techniques. Appl. Therm. Eng. 2024, 247, 123029. [Google Scholar] [CrossRef]
  27. Onuoha, H.; Denwigwe, I.; Babatunde, O.; Abdulsalam, K.A.; Adebisi, J.; Emezirinwune, M.; Hamam, Y. Integrating GIS and AHP for Photovoltaic Farm Site Selection: A Case Study of Ikorodu, Nigeria. Processes 2024, 13, 164. [Google Scholar] [CrossRef]
  28. Zhou, X.; Ding, C.; Abed, A.M.; Abdullaev, S.; Ahmad, S.F.; Fouad, Y.; Mahariq, I. Techno-economic assessment and transient modeling of a solar-based multi-generation system for sustainable/clean coastal urban development. Renew. Energy 2024, 233, 121119. [Google Scholar] [CrossRef]
  29. Reddy, V.J.; Hariram, N.P.; Ghazali, M.F.; Kumarasamy, S. Pathway to sustainability: An overview of renewable energy integration in building systems. Sustainability 2024, 16, 638. [Google Scholar] [CrossRef]
  30. Gayen, D.; Chatterjee, R.; Roy, S. A review on environmental impacts of renewable energy for sustainable development. Int. J. Environ. Sci. Technol. 2024, 21, 5285–5310. [Google Scholar] [CrossRef]
  31. Sahu, B.K. A study on global solar PV energy developments and policies with special focus on the top ten solar PV power producing countries. Renew. Sustain. Energy Rev. 2015, 43, 621–634. [Google Scholar] [CrossRef]
  32. Breyer, C.; Bogdanov, D.; Aghahosseini, A.; Gulagi, A.; Child, M.; Oyewo, A.S.; Vainikka, P. Solar photovoltaics demand for the global energy transition in the power sector. Prog. Photovolt. Res. Appl. 2018, 26, 505–523. [Google Scholar] [CrossRef]
  33. Raza, M.A.; Aman, M.M.; Rajpar, A.H.; Bashir, M.B.A.; Jumani, T.A. Towards achieving 100% renewable energy supply for sustainable climate change in Pakistan. Sustainability 2022, 14, 16547. [Google Scholar] [CrossRef]
  34. United Nations. Transforming Our World: The 2030 Agenda for Sustainable Development; United Nations: New York, NY, USA, 2015; Available online: https://www.refworld.org/legal/resolution/unga/2015/en/111816 (accessed on 1 August 2025).
  35. United Nations Development Programme. Sustainable Development Goals; United Nations Development Programme: New York, NY, USA, 2023; Available online: https://www.undp.org/sustainable-development-goals (accessed on 1 August 2025).
  36. Kazancoglu, Y.; Berberoglu, Y.; Lafci, C.; Generalov, O.; Solohub, D.; Koval, V. Environmental sustainability implications and economic prosperity of integrated renewable solutions in urban development. Energies 2023, 16, 8120. [Google Scholar] [CrossRef]
  37. Gebara, C.H.; Laurent, A. National SDG-7 performance assessment to support achieving sustainable energy for all within planetary limits. Renew. Sustain. Energy Rev. 2023, 173, 112934. [Google Scholar] [CrossRef]
  38. Parra, C.; Kirschke, J.; Ali, S.H. Ensure Access to Affordable, Reliable, Sustainable and Modern Energy for All. In Mining, Materials, and the Sustainable Development Goals (SDGs), 1st ed.; CRC Press: Boca Raton, FL, USA, 2020; pp. 61–68. [Google Scholar] [CrossRef]
  39. Abubakar, I.R.; Aina, Y.A. The prospects and challenges of developing more inclusive, safe, resilient and sustainable cities in Nigeria. Land Use Policy 2019, 87, 104105. [Google Scholar] [CrossRef]
  40. del Hoyo, R.P.; Visvizi, A.; Mora, H. Chapter 2, Inclusiveness, Safety, Resilience, and Sustainability in the Smart City Context. In Smart Cities and the UN SDGs; Elsevier: Amsterdam, The Netherlands, 2021; pp. 15–28. [Google Scholar] [CrossRef]
  41. Vaidya, H.; Chatterji, T. SDG 11 sustainable cities and communities: SDG 11 and the new urban agenda: Global sustainability frameworks for local action. In Actioning the Global Goals for Local Impact: Towards Sustainability Science, Policy, Education and Practice; Springer: Singapore, 2019; pp. 173–185. [Google Scholar] [CrossRef]
  42. He, X.; Khan, S.; Ozturk, I.; Murshed, M. The role of renewable energy investment in tackling climate change concerns: Environmental policies for achieving SDG-13. Sustain. Dev. 2023, 31, 1888–1901. [Google Scholar] [CrossRef]
  43. Lofts, K.; Shamin, S.; Zaman, S.T.; Kibugi, R. Brief on Sustainable Development Goal 13 on taking action on climate change and its impacts: Contributions of international law, policy and governance. McGill J. Sust. Dev. L. 2017, 13, 183. [Google Scholar]
  44. Filho, W.L.; Minhas, A.; Schmook, B.; Mardero, S.; Sharifi, A.; Paz, S.; Skouloudis, A. Sustainable development goal 13 and switching priorities: Addressing climate change in the context of pandemic recovery efforts. Environ. Sci. Eur. 2023, 35, 6. [Google Scholar] [CrossRef]
  45. Makvandi, M.; Li, W.; Li, Y.; Wu, H.; Khodabakhshi, Z.; Xu, X.; Yuan, P.F. Advancing Urban Resilience Amid Rapid Urbanization: An Integrated Interdisciplinary Approach for Tomorrow’s Climate-Adaptive Smart Cities—A Case Study of Wuhan, China. Smart Cities 2024, 7, 2110–2130. [Google Scholar] [CrossRef]
  46. Mehmood, A. Of resilient places: Planning for urban resilience. Eur. Plan. Stud. 2016, 24, 407–419. [Google Scholar] [CrossRef]
  47. McGill, R. Urban resilience—An urban management perspective. J. Urban Manag. 2020, 9, 372–381. [Google Scholar] [CrossRef]
  48. Thomas, P.J.; Sandwell, P.; Williamson, S.J.; Harper, P.W. A PESTLE analysis of solar home systems in refugee camps in Rwanda. Renew. Sustain. Energy Rev. 2021, 143, 110872. [Google Scholar] [CrossRef]
  49. Liu, H.-Y.; Skandalos, N.; Braslina, L.; Kapsalis, V.; Karamanis, D. Integrating Solar Energy and Nature-Based Solutions for Climate-Neutral Urban Environments. Solar 2023, 3, 382–415. [Google Scholar] [CrossRef]
  50. Masson, V.; Bonhomme, M.; Salagnac, J.L.; Briottet, X.; Lemonsu, A. Solar panels reduce both global warming and urban heat island. Front. Environ. Sci. 2014, 2, 14. [Google Scholar] [CrossRef]
  51. Khodakarami, J.; Ghobadi, P. Urban pollution and solar radiation impacts. Renew. Sustain. Energy Rev. 2016, 57, 965–976. [Google Scholar] [CrossRef]
  52. Kommalapati, R.; Kadiyala, A.; Shahriar, M.T.; Huque, Z. Review of the life cycle greenhouse gas emissions from different photovoltaic and concentrating solar power electricity generation systems. Energies 2017, 10, 350. [Google Scholar] [CrossRef]
  53. Tawalbeh, M.; Al-Othman, A.; Kafiah, F.; Abdelsalam, E.; Almomani, F.; Alkasrawi, M. Environmental impacts of solar photovoltaic systems: A critical review of recent progress and future outlook. Sci. Total Environ. 2021, 759, 143528. [Google Scholar] [CrossRef] [PubMed]
  54. Jayachandran, M.; Gatla, R.K.; Rao, K.P.; Rao, G.S.; Mohammed, S.; Milyani, A.H.; Geetha, S. Challenges in achieving sustainable development goal 7: Affordable and clean energy in light of nascent technologies. Sustain. Energy Technol. Assess 2022, 53, 102692. [Google Scholar] [CrossRef]
  55. Ramasubramanian, B.; Ramakrishna, S. What’s next for the Sustainable Development Goals? Synergy and trade-offs in affordable and clean energy (SDG 7). Sustain. Earth Rev. 2023, 6, 17. [Google Scholar] [CrossRef]
  56. Agbaitoro, G.A.; Oyibo, K.I. Realizing the United Nations Sustainable Development Goals 7 and 13 in sub-Saharan Africa by 2030: Synergizing energy and climate justice perspectives. J. World Energy Law Bus. 2022, 15, 223–235. [Google Scholar] [CrossRef]
  57. Khan, A.A.; Minai, A.F.; Siddiqui, M.A. Feasibility and Techno-Economic Assessment of a 128kWp Grid-Tied SPV System using HOMER Pro. J. Phys. Conf. Ser. 2024, 2777, 012008. [Google Scholar] [CrossRef]
  58. Ur Rashid, M.; Ullah, I.; Mehran, M.; Baharom, M.N.R.; Khan, F. Techno-economic analysis of grid-connected hybrid renewable energy system for remote areas electrification using homer pro. J. Electr. Eng. Technol. 2022, 17, 981–997. [Google Scholar] [CrossRef]
  59. Halmous, A.; Oubbati, Y.; Lahdeb, M. Techno-economic study of grid-connected hybrid renewable energy systems optimized by homer pro. In Proceedings of the 2024 2nd International Conference on Electrical Engineering and Automatic Control (ICEEAC), Setif, Algeria, 12–14 May 2024; pp. 1–6. [Google Scholar] [CrossRef]
  60. Al Garni, H.Z.; Awasthi, A.; Ramli, M.A. Optimal design and analysis of grid-connected photovoltaic under different tracking systems using HOMER. Energy Convers. Manag. 2018, 155, 42–57. [Google Scholar] [CrossRef]
  61. Bouseba, L.; Chaker, A. Implementing of a grid-connected PV energy system in building with medium consumption: A techno-economic case study. Energy Build. 2024, 324, 114929. [Google Scholar] [CrossRef]
  62. Kamal, M.M.; Asharaf, I. Modeling and assessment of economic viability of grid-connected photovoltaic system for rural electrification. Energy Sources Part A Recovery Util. Environ. Eff. 2025, 47, 6178–6194. [Google Scholar] [CrossRef]
  63. Kumar, K.K.; Singh, S.; Kundu, S. Modeling and Simulation of Grid-Connected Hybrid Renewable Energy Systems Using HOMER Pro Software. Indian J. Renew. Energy 2025, 2, 1–19. [Google Scholar] [CrossRef]
  64. Ali, M.F.; Hossain, M.A.; Julhash, M.M.; Ashikuzzaman, M.; Alam, M.S.; Sheikh, M.R.I. A Techno-Economic Analysis of a Hybrid Microgrid System in a Residential Area of Bangladesh: Optimizing Renewable Energy. Sustainability 2024, 16, 8051. [Google Scholar] [CrossRef]
  65. Idris, W.O.; Ibrahim, M.Z.; Alibani, A. Prospects of solar energy exploration in Nigeria: Assessments, economic viability and hybrid system. Int. J. Energy Econ. Policy 2024, 14, 676–686. [Google Scholar] [CrossRef]
  66. Ibrahim, Z.M.; Idris, W.O.; Alibani, A. The Trend of Solar Energy Utilization and Its Offshore Assessment in Nigeria. Preprints 2023. [Google Scholar] [CrossRef]
  67. Akinyele, D.; Amole, A.; Olabode, E.; Olusesi, A.; Ajewole, T. Simulation and analysis approaches to microgrid systems design: Emerging trends and sustainability framework application. Sustainability 2021, 13, 11299. [Google Scholar] [CrossRef]
  68. Aikhuele, D.O.; Ighravwe, D.E.; Akinyele, D.O. Hybrid fuzzy dynamic model for the evaluation of energy aggregation strategy. Process Integr. Optim. Sustain. 2022, 6, 931–941. [Google Scholar] [CrossRef]
  69. Mojumder, M.R.H.; Hasanuzzaman, M.; Cuce, E. Prospects and challenges of renewable energy-based microgrid system in Bangladesh: A comprehensive review. Clean Technol. Environ. Policy 2022, 24, 1987–2009. [Google Scholar] [CrossRef]
  70. Gomez, V.; Salgado, C.; Hernandez, C. Optimization of Energy Consumption in cognitive Radio Networks based on Renewable Energies. Int. J. Eng. Res. Technol. 2020, 13, 8. [Google Scholar] [CrossRef]
  71. Cacciuttolo, C.; Guzmán, V.; Catriñir, P. Renewable Solar Energy Facilities in South America—The Road to a Low-Carbon Sustainable Energy Matrix: A Systematic Review. Energies 2024, 17, 5532. [Google Scholar] [CrossRef]
  72. Oliveros-Cano, L.; Salgado-Meza, J.; Robles-Algarín, C. Technical-economic-environmental analysis for the implementation of hybrid energy systems. Int. J. Energy Econ. Policy 2020, 10, 57–64. [Google Scholar] [CrossRef]
  73. Cuji, C.; Tipán, L.; Dazzini, M.; Guaman-Pozo, J. Integrated Analysis of Urban Planning, Energy, and Decarbonization Through a Systematic and Multivariate Approach, Identifying Research Trends in Sustainability in Latin America. Sustainability 2025, 17, 5215. [Google Scholar] [CrossRef]
  74. Agajie, T.F.; Fopah-Lele, A.; Amoussou, I.; Khan, B.; Bajaj, M.; Zaitsev, I.; Tanyi, E. Enhancing Ethiopian power distribution with novel hybrid renewable energy systems for sustainable reliability and cost efficiency. Sci. Rep. 2024, 14, 10711. [Google Scholar] [CrossRef] [PubMed]
  75. Ergun, S.; Dik, A.; Boukhanouf, R.; Omer, S. Large-Scale Renewable Energy Integration: Tackling Technical Obstacles and Exploring Energy Storage Innovations. Sustainability 2025, 17, 311. [Google Scholar] [CrossRef]
  76. Gavidia Merino, A.J. Dimensionamiento Óptimo de un Sistema Fotovoltaico, en la Residencia Colina de la Cruz de Una Manera Autosustentable Mediante la Regulación NRO. ARCERNNR-001/2021. Bachelor’s Thesis, Universidad Politécnica Salesiana, Quito, Ecuador, 2023. Available online: http://dspace.ups.edu.ec/handle/123456789/26551 (accessed on 1 August 2025).
  77. Gualotuña Gualotuña, A.L. Análisis Comparativo Técnico-Económico de un Sistema Eólico y Solar Fotovoltaico a Través del Software Homer. Caso de Estudio: Vivienda de 5KWh en la Isla Baltra-Galápagos. Master’s Thesis, Instituto Superior Tecnológico Universitario Rumiñahui, Sangolquí, Ecuador, 2024. Available online: https://repositorio.ister.edu.ec//handle/68000/423 (accessed on 1 August 2025).
  78. Ruíz, A.E.A. Caso de Estudio: Costo Beneficio de Instalaciones Solares Fotovoltaicas Conectadas a la Red Eléctrica Para un Comercio de Alto Consumo en Quimistán, Santa Bárbara, Honduras. 2023. Available online: https://shorturl.at/wQ9tr (accessed on 1 August 2025).
  79. HOMER Energy. HOMER Pro®, version 3.14; HOMER Energy: Boulder, CO, USA, 2020. Available online: https://www.homerenergy.com/ (accessed on 1 August 2025).
  80. Yasmin, R.; Nabi, M.N.; Rashid, F.; Hossain, M.A. Solar, Wind, Hydrogen, and Bioenergy-Based Hybrid System for Off-Grid Remote Locations: Techno-Economic and Environmental Analysis. Clean Technol. 2025, 7, 36. [Google Scholar] [CrossRef]
  81. Instituto Nacional de Estadística y Geografía. Información Geográfica Municipal de Santo Domingo Tehuantepec, Oaxaca (Clave Geoestadística 20515). 2025. Available online: https://www.inegi.org.mx/app/areasgeograficas/?ag=20515#collapse-Mapas (accessed on 1 August 2025).
  82. Nasa Power, Data Access Viewer (DAV). Parámetros en Santo Domingo Tehuantepec 2025. Available online: https://shorturl.at/z3jnz (accessed on 1 August 2025).
  83. Gobierno de México. Programa para el Desarrollo del Istmo de Tehuantepec 2020–2024. Corredor Interoceánico. 2020. Available online: https://shorturl.at/t6hb6 (accessed on 1 August 2025).
  84. SENER Secretaria de Energía. Prospectiva del Sector Eléctrico 2023–2037. 2023. Available online: https://shorturl.at/Fkw6r (accessed on 1 August 2025).
  85. Rahman, T.; Mansur, A.A.; Hossain Lipu, M.S.; Rahman, M.S.; Ashique, R.H.; Houran, M.A.; Elavarasan, R.M.; Hossain, E. Investigation of Degradation of Solar Photovoltaics: A Review of Aging Factors, Impacts, and Future Directions toward Sustainable Energy Management. Energies 2023, 16, 3706. [Google Scholar] [CrossRef]
  86. Jordan, D.C.; Kurtz, S.R. Photovoltaic degradation rates—An analytical review. Prog. Photovolt. Res. Appl. 2013, 21, 12–29. [Google Scholar] [CrossRef]
  87. National Renewable Energy Laboratory. Best Practices for PV System Design. 2024. Available online: https://docs.nrel.gov/docs/fy24osti/90029.pdf (accessed on 1 August 2025).
  88. PV Magazine. Guide to Understanding Solar Production Losses. 2023. Available online: https://shorturl.at/vmEIO (accessed on 1 August 2025).
  89. Rated Power. Understanding Utility-Scale PV Losses. 2023. Available online: https://shorturl.at/BzW0F (accessed on 1 August 2025).
  90. Apricum–The Cleantech Advisory. Mexico—Building a Renewable Energy Market Without Conventional Feed-in Tariffs. (16 February 2017). Available online: https://shorturl.at/rt2UA (accessed on 1 August 2025).
  91. Comisión Reguladora de Energía Reporte de Tarifas Eléctricas Aplicables por la, C.F.E. Gobierno de México, 2023. Available online: https://www.gob.mx/cne/articulos/memorias-de-calculo-de-las-tarifas-electricas (accessed on 1 August 2025).
  92. Gobierno de México. Programa de Desarrollo del Sistema Eléctrico Nacional (PRODESEN) 2024–2038. Secretaría de Energía, 2025. Available online: https://shorturl.at/1V0TW (accessed on 1 August 2025).
  93. Comisión Federal de Electricidad. Tarifas: Servicio Doméstico. 2025. Available online: https://app.cfe.mx/Aplicaciones/CCFE/Tarifas/TarifasCRECasa/Tarifas/Tarifa1.aspx (accessed on 1 August 2025).
  94. Dong, R.; Xu, J.; Lin, B. ROI-based study on impact factors of distributed PV projects by LSSVM-PSO. Energy 2017, 124, 336–349. [Google Scholar] [CrossRef]
  95. Messina, S.; Rosales, I.P.H.; Durán, C.E.S.; Quiñones, J.J.; Nair, P.K. Comparative study of system performance of two 2.4 kW grid-connected PV installations in Tepic-Nayarit and Temixco-Morelos in México. Energy Procedia 2014, 57, 161–167. [Google Scholar] [CrossRef]
  96. Santana-Rodriguez, G.; Vigil-Galan, O.; Jimenez-Olarte, D.; Contreras-Puente, G.; Monroy, B.M.; Escamilla-Esquivel, A. Evaluation of a grid-connected photovoltaic system and in-situ characterization of photovoltaic modules under the environmental conditions of Mexico City. Rev. Mex. Fís. 2013, 59, 88–94. Available online: https://www.scielo.org.mx/scielo.php?pid=S0035-001X2013000200012&script=sci_arttext&tlng=en (accessed on 1 August 2025).
  97. Hazim, H.I.; Baharin, K.A.; Gan, C.K.; Sabry, A.H.; Humaidi, A.J. Review on optimization techniques of PV/Inverter ratio for grid-tie PV systems. Appl. Sci. 2023, 13, 3155. [Google Scholar] [CrossRef]
  98. Micheli, L. Quantifying the impact of inverter clipping on photovoltaic systems. Renew. Energy 2024, 226, 1201–1213. [Google Scholar] [CrossRef]
  99. Díaz-Bello, D.; Vargas-Salgado, C.; Águila-León, J.; Lara-Vargas, F. Methodology to Estimate the Impact of the DC to AC Power Ratio, Azimuth, and Slope on Clipping Losses of Solar Photovoltaic Inverters: Application to a PV System Located in Valencia Spain. Sustainability 2023, 15, 2797. [Google Scholar] [CrossRef]
  100. Nowdeh, S.A.; Davoudkhani, I.F.; Moghaddam, M.H.; Najmi, E.S.; Abdelaziz, A.Y.; Ahmadi, A.; Gandoman, F.H. Fuzzy multi-objective placement of renewable energy sources in distribution system with objective of loss reduction and reliability improvement using a novel hybrid method. Appl. Soft Comput. 2019, 77, 761–779. [Google Scholar] [CrossRef]
  101. Ghaffari, A.; Askarzadeh, A. Design optimization of a hybrid system subject to reliability level and renewable energy penetration. Energy 2020, 193, 116754. [Google Scholar] [CrossRef]
  102. Amponsah, N.Y.; Troldborg, M.; Kington, B.; Aalders, I.; Hough, R.L. Greenhouse gas emissions from renewable energy sources: A review of lifecycle considerations. Renew. Sustain. Energy Rev. 2014, 39, 461–475. [Google Scholar] [CrossRef]
  103. Lima, M.A.; Mendes, L.F.R.; Mothé, G.A.; Linhares, F.G.; De Castro, M.P.P.; Da Silva, M.G.; Sthel, M.S. Renewable energy in reducing greenhouse gas emissions: Reaching the goals of the Paris agreement in Brazil. Environ. Dev. 2020, 33, 100504. [Google Scholar] [CrossRef]
  104. Sims, R.E. Renewable energy: A response to climate change. Sol. Energy 2004, 76, 9–17. [Google Scholar] [CrossRef]
  105. Rahman, A.; Murad, S.W.; Mohsin, A.K.M.; Wang, X. Does renewable energy proactively contribute to mitigating carbon emissions in major fossil fuels consuming countries? J. Clean. Prod. 2024, 452, 142113. [Google Scholar] [CrossRef]
  106. Yu, J.; Tang, Y.M.; Chau, K.Y.; Nazar, R.; Ali, S.; Iqbal, W. Role of solar-based renewable energy in mitigating CO2 emissions: Evidence from quantile-on-quantile estimation. Renew. Energy 2022, 182, 216–226. [Google Scholar] [CrossRef]
  107. Obaideen, K.; Olabi, A.G.; Al Swailmeen, Y.; Shehata, N.; Abdelkareem, M.A.; Alami, A.H.; Sayed, E.T. Solar energy: Applications, trends analysis, bibliometric analysis and research contribution to sustainable development goals (SDGs). Sustainability 2023, 15, 1418. [Google Scholar] [CrossRef]
  108. Yan, Y.; Khan, K.A.; Adebayo, T.S.; Olanrewaju, V.O. Unveiling energy efficiency and renewable electricity’s role in achieving sustainable development goals 7 and 13 policies. Int. J. Sustain. Dev. World Ecol. 2024, 31, 497–522. [Google Scholar] [CrossRef]
  109. Olanrewaju, V.O.; Gyamfi, B.A.; Ozsahin, I.; Adebayo, T.S. Achieving SDGs 7, 8, and 13: Balancing policy uncertainty with renewable energy demand. Environ. Sci. Eur. 2025, 37, 1–19. [Google Scholar] [CrossRef]
  110. EEA (European Environment Agency). Urban Sprawl in Europe: The Ignored Challenge; EEA Report No. 10/2006; Office for Official Publications of the European Communities: Luxembourg, 2006; Available online: https://shorturl.at/pr26v (accessed on 1 August 2025).
  111. Khiali-Miab, A.; Patt, A.; Krütli, P. Empowering a sustainable urban future: The key role of coordinated settlement development for optimising energy efficiency and socio-economic welfare. Sustain. Cities Soc. 2024, 107, 105418. [Google Scholar] [CrossRef]
  112. Meerow, S.; Pajouhesh, P.; Miller, T.R. Social equity in urban resilience planning. Local Environ. 2019, 24, 793–808. [Google Scholar] [CrossRef]
Figure 1. (a) Global CO2 emissions from energy combustion and industrial processes and their annual change, 1900–2024. (b) Annual change in energy-related CO2 emissions, 1900–2024. The orange marker in panel (a) and the orange bar in panel (b) represent the preliminary estimate for the year 2024, based on the most recent available data.
Urbansci 09 00329 g001
Figure 2. (a) Share of increase in global electricity generation, 2003–2024. (b) Annual change in global electricity generation by source. (c) Electricity generation mix for regions, 2024. (d) Total renewable capacity additions by technology, 2019–2024.
Urbansci 09 00329 g002
Figure 3. Flowchart for the technical-economic evaluation of a grid-connected photovoltaic solar system using Homer Pro, software, version 3.14.2.
Urbansci 09 00329 g003
Figure 4. Geographic location of Santo Domingo Tehuantepec, Oaxaca, Mexico.
Urbansci 09 00329 g004
Figure 5. Infrastructure in Santo Domingo Tehuantepec, Oaxaca, Mexico.
Urbansci 09 00329 g005
Figure 6. (a) Predominant climate and (b) dominant soil types in Santo Domingo Tehuantepec, Oaxaca, Mexico.
Urbansci 09 00329 g006
Figure 7. Seasonal electrical load profile for the site in Santo Domingo Tehuantepec, Oaxaca.
Urbansci 09 00329 g007
Figure 8. Monthly average ambient temperature in Santo Domingo Tehuantepec, Oaxaca, Mexico, based on NASA POWER data.
Urbansci 09 00329 g008
Figure 9. Monthly behavior of average, minimum, and maximum solar radiation in Santo Domingo Tehuantepec, Oaxaca, Mexico, according to NASA POWER data.
Urbansci 09 00329 g009
Figure 10. Monthly behavior of peak sun hour (PSH) in Santo Domingo Tehuantepec, Oaxaca, Mexico during 2023.
Urbansci 09 00329 g010
Figure 11. Clearness index (Kt) in Santo Domingo Tehuantepec, Oaxaca, Mexico during 2023.
Urbansci 09 00329 g011
Figure 12. Monthly distribution of average daily precipitation (mm/day) in Santo Domingo Tehuantepec, Oaxaca, Mexico during 2023.
Urbansci 09 00329 g012
Figure 13. Monthly average wind speed in Santo Domingo Tehuantepec, Oaxaca, Mexico, based on NASA POWER database.
Urbansci 09 00329 g013
Figure 14. Hourly daily residential load profile for the Site in Santo Domingo Tehuantepec, Oaxaca, Mexico.
Urbansci 09 00329 g014
Figure 15. General system configuration.
Urbansci 09 00329 g015
Figure 16. (a) Economic parameters and (b) project cost results.
Urbansci 09 00329 g016
Figure 17. Project cash flow over a 25-year horizon.
Urbansci 09 00329 g017
Figure 18. (a) Optimized system by Homer Pro and (b) Optimized results: IRR, ROI, and simple Payback.
Urbansci 09 00329 g018
Figure 19. Monthly performance of the optimized system.
Urbansci 09 00329 g019
Table 1. Seventeen Sustainable Development Goals (SDGs).
No.Sustainable Development Goals (SDGs) 1
1No Poverty
2Zero Hunger
3Good Health and Well-Being
4Quality Education
5Gender Equality
6Clean Water and Sanitation
7Affordable and Clean Energy
8Decent Work and Economic Growth
9Industry, Innovation, and Infrastructure
10Reduce Inequalities
11Sustainable Cities and Communities
12Responsible Consumption and Production
13Climate Action
14Life Below Water
15Life on Land
16Peace, Justice, and Strong Institutions
17Partnerships for the Goals
1 Representation of the 17 Sustainable Development Goals (SDGs) from the 2030 Agenda, highlighting SDG 7 (Affordable and Clean Energy), SDG 11 (Sustainable Cities and Communities), and SDG 13 (Climate Action).
Table 2. Summary of topographic and relief characteristics of Santo Domingo Tehuantepec, Oaxaca, Mexico.
FeatureElevation (m)Location/Notes
Average city elevation44–50General elevation of Santo Domingo Tehuantepec; coastal plain near the Pacific Ocean
Local elevation variation (3 km radius)Up to 150Slight variations within close range; mostly low hills
Regional elevation range (16 km radius)Up to 1050Includes higher surrounding mountains such as Cerro Marimba and El Zacatal
Cerro de Lieza100Located near Santo Domingo Tehuantepec
El Pozorillo300Prominent elevation within the region
Sierra de Mixtequilla500Mountain range in the surrounding area
Urban and populated areas20–100Low hills with gentle slopes; includes some water bodies
General reliefPredominantly mountainous in surrounding areas, but urban core on coastal plain
Table 3. System component and its parameters.
ComponentParameterValue/Unit
Photovoltaic panelModel nameGeneric
TypeFlat panel
Nominal capacity459 kW
Lifetime25 years
Deterioration factor80%
CapitalMXN 15,000/kW
ReplacementMXN 15,000/kW
O&MMXN 5000/year
ConverterModel nameGeneric
Inverter input efficiency95%
Relative capacity100%
Lifetime13 years
CapitalMXN 4000/kW
ReplacementMXN 4000/kW
O&MMXN 200/year
GridSale priceMXN 1.6/kWh
Purchase priceMXN 0.8/kW
Average annual consumption1978.14 kWh/day
Table 4. Tariff established by the Federal Electricity Commission in Mexico.
ParameterValue/Unit
Energy (grid)Sale priceMXN 1.60/KWh
Purchase priceMXN 0.80/KWh
Table 5. Comparative summary of key performance indicators for grid-connected PV systems in the present study and previous research in Mexico.
ParameterPresent Study (Optimized Scenario)Messina et al. 2014 (México) [95]Santana Rodríguez et al. 2013 (CDMX, México) [96]
LocationSanto Domingo Tehuantepec, OaxacaTepic Nayarit & Temixco Morelos, MéxicoCiudad de México, México
Installed capacity (kWp)1732.4 kWp (each residential system)6.15 kWp
Capacity factor (%)18.5~18% (both sites)~20%
Annual energy production (kWh)281,1753888–4118~10,800
CO2 avoided (t/year)~121.6~2.1
IRR (%)8%
ROI (%)5.3%
Payback period (years)~10
LCOE (USD/kWh)~0.084~0.11~0.12
Disclaimer/Publisher’s Note: The statements, opinions and data contained in all publications are solely those of the individual author(s) and contributor(s) and not of MDPI and/or the editor(s). MDPI and/or the editor(s) disclaim responsibility for any injury to people or property resulting from any ideas, methods, instructions or products referred to in the content.