Article

Investigating Users’ Acceptance of Autonomous Buses by Examining Their Willingness to Use and Willingness to Pay: The Case of the City of Trikala, Greece

by
Spyros Niavis
1,
Nikolaos Gavanas
1,
Konstantina Anastasiadou
2,* and
Paschalis Arvanitidis
3
1
Department of Planning and Regional Development, School of Engineering, University of Thessaly, 38334 Volos, Greece
2
School of Civil Engineering, Faculty of Engineering, Aristotle University of Thessaloniki, 54124 Thessaloniki, Greece
3
Department of Economics, School of Economics and Business, University of Thessaly, 38333 Volos, Italy
*
Author to whom correspondence should be addressed.
Urban Sci. 2025, 9(8), 298; https://doi.org/10.3390/urbansci9080298 (registering DOI)
Submission received: 4 June 2025 / Revised: 27 July 2025 / Accepted: 28 July 2025 / Published: 1 August 2025

Abstract

Autonomous vehicles (AVs) have emerged as a promising sustainable urban mobility solution, expected to lead to enhanced road safety, smoother traffic flows, less traffic congestion, improved accessibility, better energy utilization and environmental performance, as well as more efficient passenger and freight transportation, in terms of time and cost, due to better fleet management and platooning. However, challenges also arise, mostly related to data privacy, security and cyber-security, high acquisition and infrastructure costs, accident liability, even possible increased traffic congestion and air pollution due to induced travel demand. This paper presents the results of a survey conducted among 654 residents who experienced an autonomous bus (AB) service in the city of Trikala, Greece, in order to assess their willingness to use (WTU) and willingness to pay (WTP) for ABs, through testing a range of factors based on a literature review. Results useful to policy-makers were extracted, such as that the intention to use ABs was mostly shaped by psychological factors (e.g., users’ perceptions of usefulness and safety, and trust in the service provider), while WTU seemed to be positively affected by previous experience in using ABs. In contrast, sociodemographic factors were found to have very little effect on the intention to use ABs, while apart from personal utility, users’ perceptions of how autonomous driving will improve the overall life standards in the study area also mattered.

1. Introduction

The 17 Sustainable Development Goals (SDGs) and 169 targets of the UN 2030 Agenda for Sustainable Development aim at balancing the environmental, social and economic dimensions of sustainable development in an integrated way [1]. In particular, SDG11: “Make cities and human settlements inclusive, safe, resilient and sustainable” [2] and SDG13: “Take urgent action to combat climate change and its impacts” [3] are especially linked with urban transport. The transport sector, especially in cities where the majority of the population lives, is responsible for a high percentage of global CO2 emissions, as well as local air pollutants and energy consumption [4], while it definitely has a key role in the creation of inclusive, safe, resilient and sustainable cities, as access to safe, affordable, accessible and sustainable transport systems for all is a fundamental target of SDG11 [5]. Autonomous vehicles (AVs) have emerged as a promising solution within the framework of sustainable urban mobility, holding a preponderant place in the EU sustainable mobility agenda [6], while they are expected to gradually replace conventional road vehicles within the next few decades.
AVs can become a game changer in urban transport by leading to enhanced road safety, smoother traffic flows, less traffic congestion, improved accessibility, better energy utilization and environmental performance, as well as more efficient passenger and freight transport, in terms of time and cost due to better fleet management and platooning [7,8,9,10,11,12,13,14,15,16,17,18,19,20,21,22,23]. However, research also highlights potential issues, mostly related to data privacy, security and cyber-security, high acquisition and infrastructure costs, accident liability, even possible increased traffic congestion and air pollution due to induced travel demand [7,17,23,24]. In general, the impact on traffic flow depends on the automation and connectivity level of the vehicles, as well as on the relevant market penetration rate [17]. Moreover, the shift towards automated autonomous driving is expected to result in structural changes in the overall concept of citizens’ mobility, which in turn will also affect decisions on household location and the overall spatial organization of activities at the urban and regional level [8,10,25,26,27,28].
In this framework, the accuracy of predictions regarding the future of autonomous urban mobility depends on the maturity level of vehicle automation technologies, the range and diversity of the potential impacts from its implementation and the lack of adequate empirical data from the operation of AVs in real-life conditions [9,29,30]. Regarding the technological maturity level, the analysis of these predictions should consider that vehicle automation is a complex process, as there are different levels of automation which should be achieved before reaching the state of full AVs. According to SAE International [31], there are six levels of driving automation, from Level 0, corresponding to no driving automation, to Level 5, corresponding to full driving automation. Road vehicles of Levels 4 and 5 are widely considered as AVs.
Nowadays, the transport industry offers passenger vehicles that encompass elements up to Level 4 of driving automation; i.e., fully autonomous operation under certain conditions [9]. World leading companies and forerunner countries aim for the deployment of fully autonomous road vehicles within the next decade [9,32,33]. The development and adoption of autonomous driving technologies are expected to create revenue between USD 300 billion and USD 400 billion in the passenger car market by 2035 [34]. According to recent research literature, AVs are expected to represent a significant share of the vehicle fleet in the period 2040–2060 [9,35].
Three main categories of AVs can be identified: private autonomous road vehicles; shared autonomous road vehicles/taxis; and autonomous buses [36]. As public transport is inextricably linked to sustainable development [37], autonomous buses may play a key role in the improvement of the effectiveness, efficiency and attractiveness of the public transport system by reducing congestion, emissions, energy consumption and operational costs of the bus fleet, while safeguarding accessible and affordable mobility solutions for all citizens. On the other hand, the implementation of autonomous buses may raise cyber-security issues, unemployment risks for public transport drivers and personnel, higher costs for the purchase of vehicles and new requirements for the appropriate digital and physical infrastructure [17,36,38,39]. As regards safety issues, the circulation of AVs in separate lanes, instead of a mixed flow with conventional or lower automation level vehicles, can mitigate relevant concerns to a significant extent [17]. For this reason, autonomous buses seem to be the most prominent category of AVs for the first phase of integration in the road network. Thus, autonomous buses and shuttles have already been or are currently being tested in many residential areas, such as in Tokyo (Japan), Oslo (Norway), Berlin (Germany), Aalborg (Denmark), Gothenburg (Sweden) and Newcastle NSW (Australia) [28,36,40,41].
Regardless of the category of AV, the future of autonomous mobility greatly depends on consumers’ overall acceptance, willingness to use (WTU) and willingness to pay (WTP) for AV services, since this directly affects the returns of investments in the new technology [42,43]. Studies investigating the factors that influence the willingness of customers to use and pay for AVs are based on the traditional concept of the “technology acceptance model” [44,45], the “unified theory of acceptance” and “use of technology” (UTAUT) [46], as well as on other broader concepts of customers’ utility and attitudes towards novel technological products [47,48]. Most of these studies identify the following as main driving factors: The trust towards the developers of AVs; the perception of users regarding the safety, ease of use, and knowledge of AVs; and the perceived usefulness of AVs. These studies also highlight the importance of the users’ socioeconomic and demographic characteristics, such as age, gender, level of education, income, number of household members, driver license, private car ownership, commuting frequency, etc. [36,49,50,51,52,53,54,55].
According to research literature, people appear more willing to accept autonomous public transport systems compared to autonomous private cars [36,56,57]. However, and despite the increasing number of studies on users’ acceptance of AVs, these are mainly focused on private cars, shared vehicles and taxis, while the acceptance and the intention to use autonomous buses (ABs) is investigated in fewer studies, such as in [36,51,52,54,58,59,60,61].
Taking the above into account, the present paper focuses on the city of Trikala, Greece, where a pilot operation of an AB service took place within the framework of the CityMobil2 project [62]. During the pilot, a survey was conducted on 654 adult residents of the city in order to assess their WTU and WTP for ABs. The main contribution of this research in increasing the understanding of the potential use and future penetration of ABs derives from the fact that, by the time of the survey, all respondents had already experienced the AB services during the abovementioned project’s pilot demonstration. Thus, the paper analyzes AB users’ acceptance by extracting the factors that affect their WTU and WTP on an empirical basis, considering not only the users’ personal perceptions regarding the usefulness and the safety of the new service, but also the actual effect of the users’ experience with ABs. The remainder of the paper is as follows. Section 2 provides a brief literature review of main studies focusing on the acceptance of ABs in the last decade. Section 3 describes the overall rationale and method of the present survey and forthcoming analysis. In Section 4, the main results regarding the WTU and WTP for ABs are presented and discussed, while the final section of the paper refers to the main conclusions and policy recommendations for effective and sustainable promotion of autonomous public bus systems.

2. Literature Review on Studies of Automated Bus Users’ Perceptions and Acceptance

The current section reviews the main studies on ABs’ acceptance, which have been conducted in the past decade, and discusses their methodological approaches. It considers the key features of each study; namely, the scope, the employed methods, the target variables and affecting factors, the location of implementation and the sample size of participants.
According to Table 1, different researcher approaches and methodologies have been used to analyze the acceptance of ABs. Dong et al. (2017) [60] and Alessandrini et al. (2016) [63] provide a priori evaluations of citizens regarding their WTU, as well as WTP for the latter survey, using stated preferences surveys. Both surveys employ methods encapsulated under the general rubric of logit models and build different scenarios composed of various options to extract any statistically significant difference in citizens’ preferences between ABs and conventional (non-autonomous) buses. In addition, Madigan et al. (2016) [46], Eden et al. (2017) [64], Portouli et al. (2017) [65] and Salonen (2018) [61] focus on citizens who had already experienced an AB service to extract their perceptions regarding various characteristics of the ABs. To do so, Madigan et al. (2016) [46] used the UTAUT framework and a hierarchical multiple regression method to model WTU, based on users’ perceptions regarding various aspects of the technology encompassed by ABs. Eden et al. (2017) [64] used personal interviews with a relatively small sample of users to collect opinions on the safety, comfort and convenience of AB services. Portouli et al. (2017) [65] recorded the perceptions of users regarding the satisfaction, safety and security of ABs and compared the views of regular users and non-regular users on general issues of AV technology. Salonen (2018) [61] used an independent sample t-test and one-way ANOVA to highlight different perceptions of AB safety, security and emergency management among user groups with different socioeconomic and demographic characteristics. Mouratidis and Serrano (2021) [36] carried out two independent studies, based on survey and interview methods, in order to investigate the intention of residents in an urban area to use ABs, before and after the implementation of ABs in the specific area, as well as to monitor passengers’ perceptions of ABs. Yan et al. (2022) [51] adopted a technology acceptance model in order to investigate the continuance of passengers’ intention to use ABs, based on riding experience. Li et al. (2024) [53] investigated users’ preferences and attitudes towards autonomous demand-responsive transit (ADRT), and mode choice behavior between ADRT buses and conventional buses, through a survey with Likert scale statements and an integrated choice and latent variable (ICLV) model. Cai et al. (2023) [52] combined UTAUT, task technology fit (TTF) theory and trust theory to explore the public’s intention to use ABs. Ariza-Álvarez et al. (2023) [59] explored passengers’ WTU ABs and on-board satisfaction through discrete choice analysis, including the perception of environmental benefits as a criterion. Finally, Cheng and Lai (2024) [54] adopted a hybrid discrete choice model, aiming at “capturing” the positive and negative effects of the intention to use ABs.
It should be noted that all the above studies used sociodemographic variables such as age, income, occupation, etc., in order to analyze the variability of responses among different groups of respondents. The focus of most studies is on the aspects of safety, convenience, usefulness and security of the ABs. In [51], the perceived road safety and the “in-vehicle” safety are analyzed, with the second factor found to be directly affecting the reuse intention of an AB, contrary to the first one. This is confirmed by the study of Salonen (2018) [61], according to which most respondents rated the safety of ABs as being better than that of conventional buses. Portouli et al. (2017) [65], Yan et al. (2022) [51] and Mouratidis and Serrano (2021) [36] found that the presence of a supervisor on board had a positive effect on the users’ perception of “in-vehicle” safety. Portouli et al. (2017) [65] found that the users’ satisfaction with their experience of the AB service was quite high in terms of usefulness, comfort, information provision and driving behavior, and most users stated that they would use a similar service in the future. The study of Dong et al. (2017) [60] denotes that the overall perception of safety and acceptance is increasing, along with the knowledge and familiarity of respondents regarding automated driving issues. Eden et al. (2017) [64] found that users no longer doubted the safety of ABs after using an AB service, while their greatest concerns involved comfort and convenience. Criteria related to comfort and convenience were also analyzed in the cross-national surveys of Alessandrini et al. (2016) [63], in terms of operational features (such as waiting time, riding time), in terms of personal costs and ticket pricing, and in terms of different service coverage, showing that AB services were preferred within universities campuses and enterprises’ premises rather than in the mixed-traffic conditions of city centers. In the more recent study of Cheng and Lai (2024) [54], compatibility and relative advantage seemed to have a positive effect on the use of ABs, while safety and security risks along with the functional risk seemed to have a negative effect. Respondents appeared willing to use ABs, if available in their residential area, especially in case of low frequency of public transport, while low vehicle speed and abrupt braking were highlighted as the two negative aspects concerning AB riding in [36]. In the same study, the participants had no safety concerns related to ABs. The study of Madigan et al. (2016) [46] portrays that the most influential factors on user acceptance and WTU comprise the expectations of users regarding its performance, followed by the social influence and effort expectancy. Effort expectancy, perceived risk, performance expectancy and social influence, play a key role in “trusting” ABs, according to the results of Cai et al. (2023) [52]. By codifying the main findings of the studies under consideration, it can be concluded that the overall stance of citizens towards ABs is quite positive, although there are still some doubts regarding their usefulness in covering all daily mobility needs.
Finally, regarding the sociodemographic characteristics of respondents, significant differences regarding the acceptance of ABs were found between men and women, as the first tended to have greater acceptance of ABs, both in terms of WTU [60] and the overall rating of the various attributes of the provided service [61]. As far as the age factor is concerned, this was found to be negatively correlated to respondents’ AB acceptance in [36,60,65], while in the study of Salonen (2018) [61], no differences were found in the overall rating of AB service among age groups. In [53], women, the elderly, members of large households, users with longer commuting times, as well as those having a driving license seemed to raise more safety concerns related to ABs, compared to other users. In the same study, it seemed more likely for younger respondents, respondents with a high income or high level of education, as well as those having a better knowledge of AVs and owning a private car, to use an AB. On the other hand, income and educational background were found not to significantly affect respondents’ general acceptance of ABs in most studies that considered such variables [60,61,65].

3. Materials and Methods

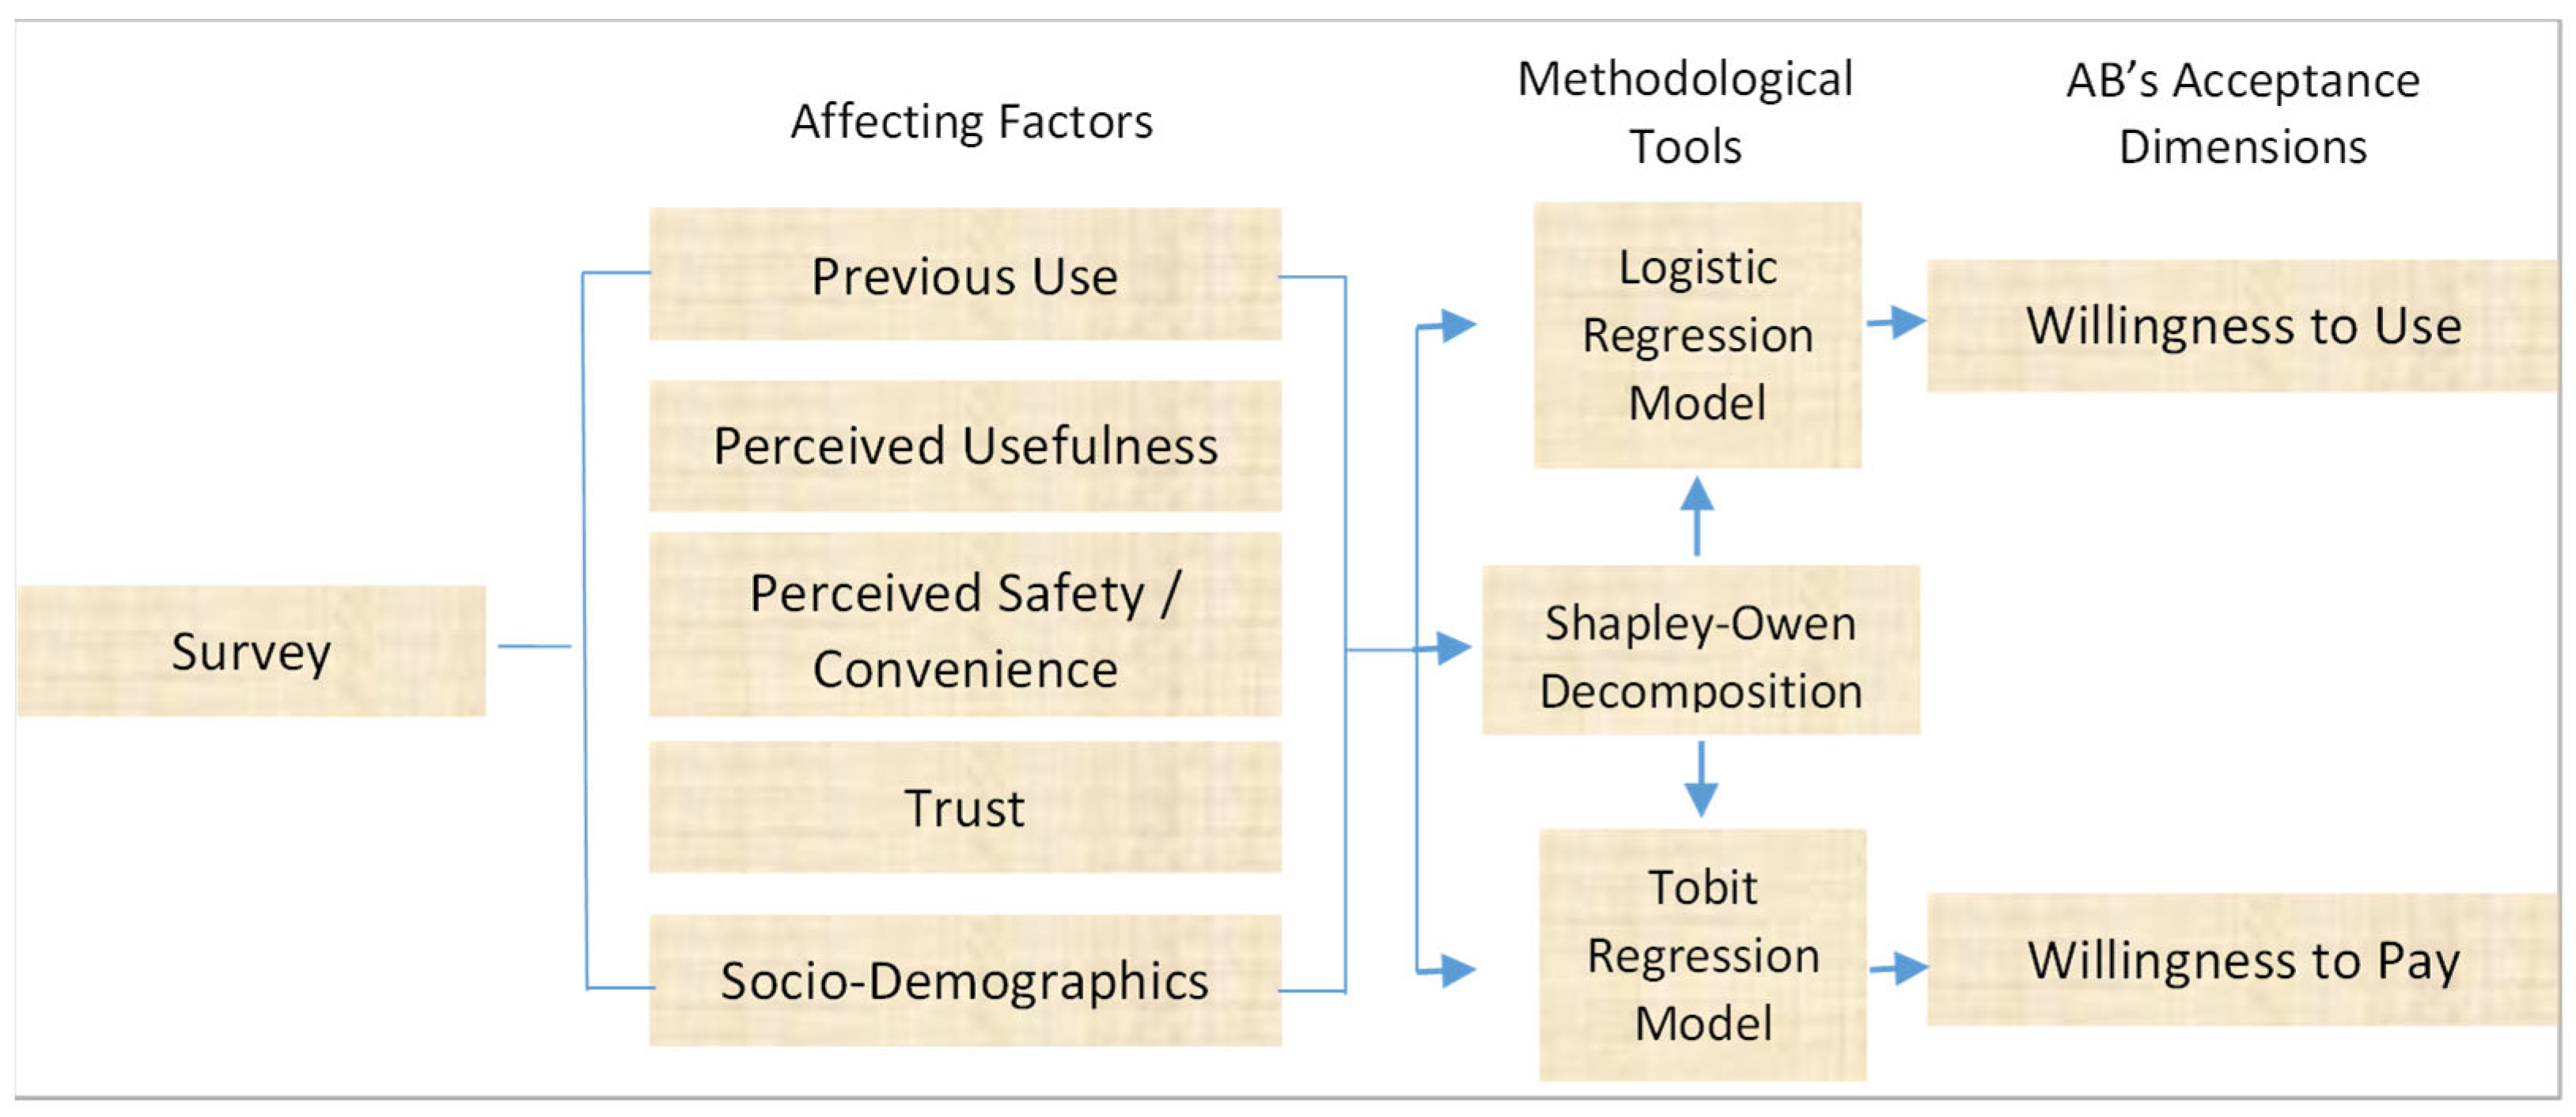
3.1. Relevant Research and Proposed Methodological Framework

By reviewing the literature on users’ acceptance and perceptions of ABs, some critical remarks could be extracted regarding the positioning of the AB surveys within the overall framework of the AV research agenda. Initially, despite the different characteristics of ABs and other AVs, the fact that AB services are already running in some cities provides the opportunity to enrich the AV literature with studies that extract actual users’ satisfaction from the use of automation. This is precisely the case in the studies of Madigan et al. (2016) [46], Eden et al. (2017) [64], Portouli et al. (2017) [65] and Salonen (2018) [61]. Nevertheless, in the three latter studies, satisfaction levels and perceptions regarding ABs were not further used as a means of modeling users’ willingness to use or pay for ABs. Future WTU was only extracted in the study of Madigan et al. (2016) [46]. In addition, in the studies of Alessandrini et al. (2016) [63] and Dong et al. (2017) [60], where willingness to use was extracted in an a priori context, influential factors considered important by the literature on AV acceptance are not taken into account. More precisely, the respondents’ trust in manufacturers and suppliers of the service was not incorporated in either of the two studies, while the safety factor was only considered in the study of Dong et al. (2017) [60]. The same remarks also stand for the study of Madigan et al. (2016) [46] which, although successful in modeling users’ perceptions of WTU, still does not take into account the trust and safety factors of ABs. Finally, WTP is only approached by the paper of Alessandrini et al. (2016) [63] and only as a function of three operational dimensions of ABs, namely waiting time, driving time and cost which, in fact, does not allow the revelation of the effect that respondents’ intrinsic motivations and perceptions have on their WTP for an automated mobility service.
Based on the remarks above, the present paper capitalizes on the knowledge gained from the previous studies on ABs and provides a framework for modeling the acceptance of ABs as a future public transport alternative on a series of affecting factors that have to do with their experience on an AB as well as with their general perceptions regarding bus automation. By modeling the influence of the actual use of an AB and the overall stance of users regarding the technology encompassed in it, the present framework seeks to enrich our knowledge regarding the acceptance of ABs and AVs in general. Therefore, the study, although focusing on ABs, could provide useful findings able to inform the global debate around driving automation.
The survey of the present paper was conducted in the Greek city of Trikala. Trikala, a medium-sized city in the Region of Thessaly (Central Greece), has a total population of about 80,000 and GDP per capita of about EUR 11,500. The city is highly involved in smart city projects, and thus, the people are quite familiar with technologically advanced services [66]. In this context, the city participated in the Easymobil2 project, through which the potential of European cities with various characteristics in developing automated road transport systems (ARTSs) was tested. ARTSs rely on fully automated road vehicles that operate under a centralized fleet management scheme. In addition, they operate by using either dedicated or shared infrastructures. In the case of Trikala, a pilot ARTS was developed and tested from October 2015 to February 2016. The ARTS consisted of six fully automated minibuses with a capacity of 11 passengers. They operated on a 2.4 km long loop route using a dedicated bus line with 9 stops. The buses were tested in real traffic conditions as the route crossed urban road intersections and, in many cases, was used illegally by other types of vehicles. The whole operation was supervised by operators in a control room while an additional operator was also onboard in order to intervene in any potential emergency situation. During the pilot operation, the ABs covered 4230 km, transferring more than 12,000 passengers [62,65].
Taking into account the information above regarding the pilot demonstration in Trikala, it is evident that this provides the opportunity to extract useful implications regarding the future acceptance of ABs. This is because the Trikala pilot was conducted in real traffic conditions, while the involvement of locals could be considered satisfactory. It should be mentioned that among the seven pilot actions of the project, the Trikala ARTS had the longest length, the largest number of stops and the largest operating fleet of ABs, together with La Rochelle. Moreover, the buses covered the second-largest total distance after Lausanne and carried the third-largest number of passengers after La Rochelle and Vantaa [62].
In order to model users’ overall acceptance of ABs, a dedicated survey was designed and conducted in the city of Trikala. The survey took place in 2018, a year when the first pilot bus service was concluded, and the second phase was to put in operation. The survey was conducted via personal questionnaires distributed among citizens of Trikala who had used the bus service at least once. Taking into account that the bus service was a pilot and as such many of its technical characteristics such as air-conditioning, comfort of the seats and information provision to passengers would not be perfect, the survey did not examine these elements of the route because it could lead the respondents to biased judgements regarding the main question of the survey, which was to evaluate their general stance on automated transport means as real alternatives to the existing traditional ones. The questions of the survey were divided to facilitate the conceptual model of ABs’ acceptance, which is depicted in Figure 1.
In general, the present paper approaches ABs’ acceptance by modeling people’s intention to favor the new technology. The intentions of users towards the new technology were modeled using the widely accepted concepts of willingness to use and willingness to pay. A set of affecting factors was composed in order to predict the WTU and WTP and two respective models were developed and implemented. In the following sections the description of the factors affecting WTU and WTP and the respective questions of the survey that were used to construct the variables are presented.

3.2. Affecting Factors

3.2.1. Previous Use (PU)

A technology’s prior usage could be considered a significant precursor affecting its overall acceptance among users [67] and is taken into account in relevant studies [36,51,59]. This has been established by previous studies modeling acceptance either in a general technological context [68,69] or specifically in the transport industry [60,70]. Therefore, this variable was inserted into the modeling process of the paper in order to capture any relationships between the past experience with the ABs and their acceptance by the users. Moreover, it should be noted that the incorporation of the factor of previous usage in the models adds to the validity of the results, since users evaluated the ABs after having some experience with them [45]. PU variable was formulated by asking the respondents how often they used the AB service and letting them select from a Likert scale ranging from 1 to 10.

3.2.2. Perceived Usefulness (PeU) and Perceived Safety–Convenience (PeSC)

The travel behavior of people is affected by their attitude towards the different means of transport. Furthermore, their attitude is reflected in their perceptions regarding the characteristics of the means of transport [71]. Therefore, by examining their perceptions regarding particular means of transport, the likelihood of using the specific transport option could be estimated. As was shown in Section 1, prior studies on the acceptance of AVs mainly adopted the TAM model, which is based on two fundamental concepts, the perceived ease of use and perceived usefulness [36,54,65]. Focusing on the relevant literature of the ABs, perceived safety is also regarded as a dominant factor in acceptance of buses with new automated technology and thus is also incorporated into the present estimations [51,52,54,61,64]. Taking into account that ease of use could not be evaluated comprehensively by the passengers, due to the limitations of a pilot service that were reported above, the present paper focuses on the perceived usefulness and perceived safety of the service users, providing crucial insights for transport professionals.
In order to compose the respective variables, the perceptions of users were measured by asking them to evaluate ten attributes of ABs regarding their safety and usefulness. To do so, respondents were given Likert scale options ranging from zero to ten, with zero denoting a negative evaluation and ten a totally positive evaluation of the attribute at stake. The general statement of the evaluation was “I believe that ABs…” while the attributes in question are presented in Table 2.
Although the ten statements provided us with a quite detailed picture of people’s stance against ABs, including all statement responses as variables in the models of the present paper was not advisable due to the high correlation among the variables [72]. Alternatively, factor analysis could have been used to reduce the number of variables by classifying them into a limited number of unobserved factors while maintaining the maximum of the information included in the original data [73]. The methodology that was adopted in order to extract these factors was principal component analysis (PCA) with varimax rotation.
Before the application of the factor analysis, the consistency of the replies was checked through Cronbach’s reliability test. The reliability test returned a Chronbach’s a value of 0.894 for the whole set of items and values of more than 0.76 for the items of the two factors. Taking into account that the critical value of the Chronbach’s coefficient is 0.7, the data was considered as reliable and suitable for the application of factor analysis [73]. The results of principal components analysis are presented in Table 3. Analysis returned the expected factors, PeU and PeSC, which explain the 61% of the total variance. The PeU factor accounted for the highest proportion of the total variance and was composed by questions 5–10. PeSC was formed by questions 1–4.
The factor scores based on the regression analysis method were then used in order to incorporate the two variables into the WTU and WTP models [74].

3.2.3. Trust (TR)

Trust is a fundamental psychological factor in users’ acceptance of emerging automotive technology. In a white paper by Intel [75] regarding automated vehicle adoption, it is clearly stated that in order for the AV industry to win customers, it should first earn their trust. Trust as a factor of acceptance has been used in prior relevant studies on AVs and has been found to have a positive effect on users’ intention to shift from conventional vehicles to more automated ones [47,76,77]. Nevertheless, trust as a factor affecting automation acceptance has never been used in previous studies regarding ABs. Therefore, the inclusion of such a variable in the present models would shed light on the role of trust in shifting users to automated public means of transport. A critical aspect should be taken into account when including the trust factor in the models: trust in the AV domain mainly refers to that shown by users to car manufacturers, while trust in ABs is far more complex because it is not directly related to the manufacturer of the AB but mainly to the bus service provider. Therefore, the question that measures trust in the context of this study was formulated as follows: “Do you trust the AB service provider?”. Respondents were asked to answer the question by using a Likert scale ranging from “definitely not” (0) to “definitely yes” (10).

3.2.4. Sociodemographic Factors

Three sociodemographic variables were included in the present analysis. The first was the gender of the respondents. As was shown in the literature review for ABs, men show a greater willingness to use ABs, as was testified by the relevant studies of Dong et al. (2017) [60], Salonen (2018) [61], Mouratidis and Serrano (2021) [36] and Li et al. (2024) [53]. This is also the case for the AVs in general [78]. However, in [52] there was no significant correlation between gender and AB acceptance. The gender variable (GE) is dichotomous, taking the value 0 for males and 1 for females. The second sociodemographic variable is age. According to the review paper of Becker and Axhausen (2017) [79], age is a questionable factor in AV acceptance since there are studies that have managed to find a significant correlation between age and acceptance, while others have not. This is also the case for ABs; as it has been shown in the previous sections, age was found to be negatively correlated with the acceptance of automated technology in the studies of Dong et al. (2017) [60], Portouli et al. (2017) [65], Mouratidis and Serrano (2021) [36] and Li et al. (2024) [53]. In contrast, in the studies of Salonen (2018) [61] and Cai et al. (2023) [52], no significant result regarding the relationship between age and users’ perceptions of ABs was found. These remarks signify that additional research is needed to understand the effect of age on the acceptance of the new technology. For the present study, the age variable (AGE) has a quantitative discrete form. Finally, income was also included in the analysis using a quantitative variable (INC) with an ordinal scale. More precisely, there are nine scales foreseen, ranging from a monthly income under EUR 300 to more than EUR 10,000 (the categories are: 1. <EUR 300, 2. EUR 301–500, 3. EUR 501–1000, 4. EUR 1001–1500, 5. EUR 1501–2000, 6. EUR 2001–3000, 7. EUR 3001–5000, 8. EUR 5001–10,000, 9. >EUR 10,000). As has been shown in the literature review section, up to now, studies (such as that by Cai et al. 2023 [52]) have not found any significant effect of income on users’ perceptions towards ABs. However, in Li et al. (2024) [53], users with higher income were reported as more willing to use an AB.

3.3. Dependent Variables and Respective Models

3.3.1. Willingness to Use

The discussion in the introduction section shows that users’ acceptance of automated vehicle technology will result in a higher willingness to use AVs. Taking this as a starting point, acceptance in the present paper is modeled through users’ willingness to use ABs. To capture their WTU, respondents were asked to answer with a “yes” or “no” to the following question:
“If the AB Service Becomes Permanent, Will You Use It?”
Given the dichotomous nature of the answer, a corresponding variable was constructed, assigning a value of 0 for those who answered no and 1 for those with a positive reply. In terms of the model of WTU, the binary nature of the dependent variable renders the general form of ordinary least squares (OLS) regression inapplicable, as it violates the normality assumption of the residuals and it can predict values outside [0, 1]. Hence, binomial logistic regression is the preferred method when the dependent variable is dichotomous. The key assumption of logistic regression is that the relationship between the independent variables and the logit (log-odds) of the probability of an event occurring is linear. To facilitate the model’s construction, the logit function, which represents the log-odds of the probability, was used in the regression equation. The model was solved using the method of maximum likelihood estimation [73].
The specification of the WTU model can be expressed as:
ln P W T U i = 1 1 P W T U i = 1 = β 0 + β 1 P U i + β 2 P e U i + β 3 P e S i + β 4 T R i + β 5 G E i + β 6 A G E i + β 7 I N C i
where
W T U =The dependent variable
P U , P e U , P e S , T R , G E , A G E , I N C =The independent variables included into the model
β 0 =The constant term
β i =The regression coefficients under estimation i = 1 , , 7

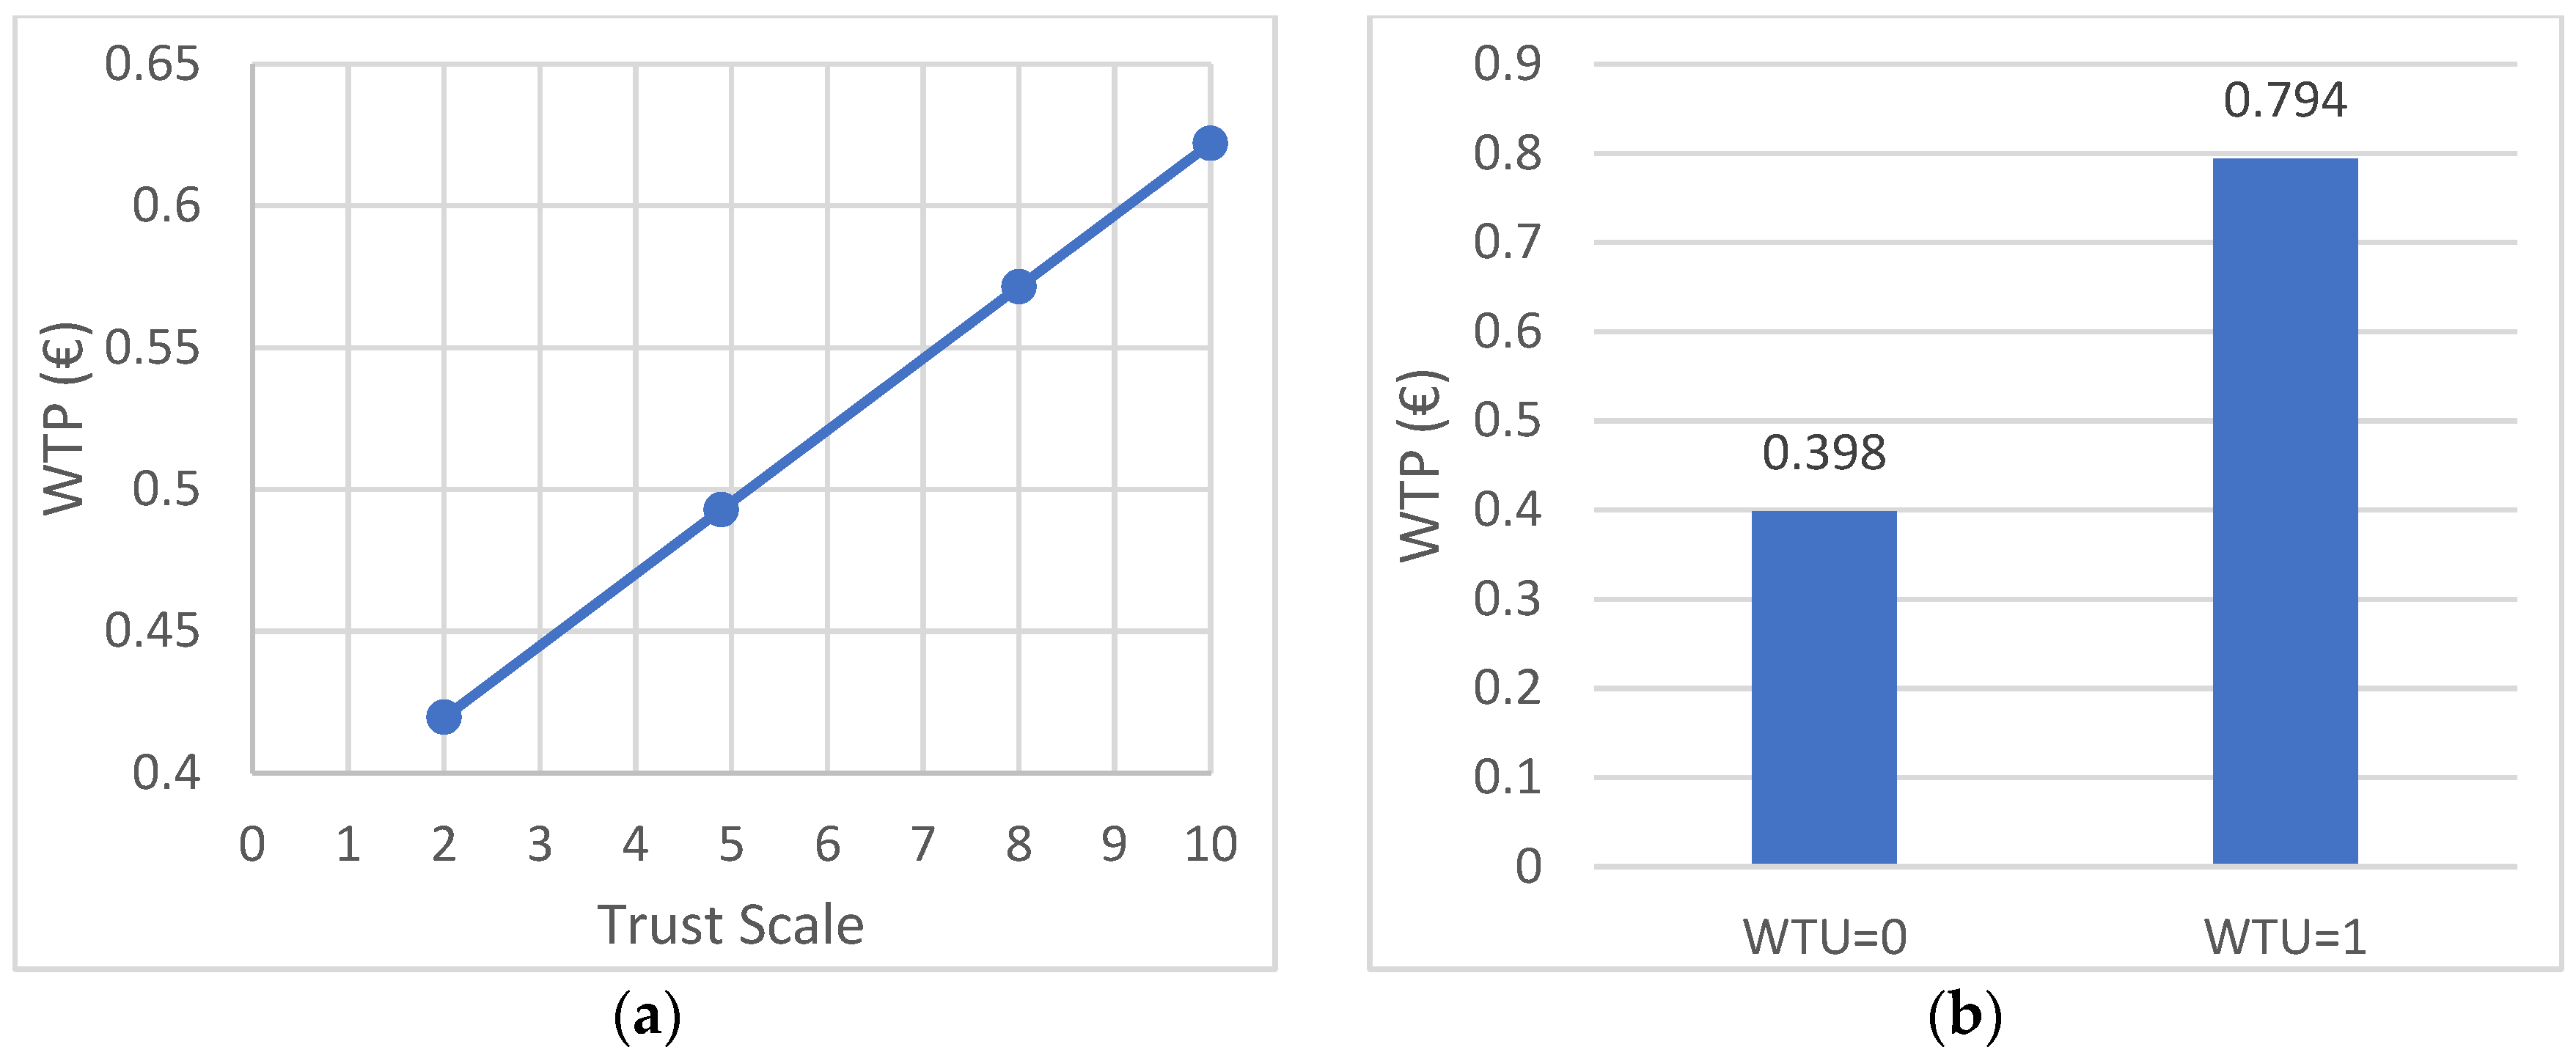
3.3.2. Willingness to Pay

In addition to WTU, higher acceptance is expected to result in higher WTP for automated vehicles [29]. To model WTP, respondents were asked to freely indicate a ticket price that they would accept in order to use the new AB service. For setting a starting point for the replies and extracting a direct comparison regarding the ticket prices that people would accept in order to shift from conventional buses to the services established on ABs, the question was formulated as follows:
“Given that the price of a conventional bus service is set to EUR 1, how much would you pay for the same service if this was conducted with the deployment of an automated bus?”.
The effect of the factors on WTP was modeled through regression analysis. As WTP is a continuous variable, the logit model could not be used in this case because it is applied only in cases where the dependent variable is dichotomous. Moreover, since the variable for willingness to pay (WTP) cannot take negative values and contains many zero bids, using ordinary least squares (OLS) may have led to biased estimates. Therefore, the tobit model, which accounts for censoring in the dependent variable, was preferred [80]. The tobit model represents the potential (expected) value of the dependent variable WTP as a latent variable, W T P , which can only be partially observed within the feasible prices of WTP (>0), as follows [81]:
W T P i = 0 , i f   W T P i = 0 W T P j ^ ,   i f   W T P i > 0
Therefore, the model for estimating the effect of the selected factors on the WTP of users was the following:
W T P i = β 0 + β 1 P U i + β 2 P e U i + β 3 P e S i + β 4 T R i + β 5 G E i + β 6 A G E i + β 7 I N C i ( i = 1 , 2 , . . . , N )

3.3.3. Estimating the Significance of the Affecting Factors

The estimations provided by both models could depict the existence of a relationship between WTU and WTP with the selected factors, as well as its direction. Nevertheless, the raw results could not provide an answer to the question regarding which of the chosen factors was affecting the two dependent variables the most. The answer to this question is critical, especially for policy actions, since providing a classification of factors according to the strength of their effect on WTU and WTP could assist service managers in ranking their operational and marketing targets toward a more effective user attraction policy. To do so, the Shapley–Owen R-square decomposition method was employed by the present paper. For a linear model y = f(x1, x2,…, xp), and for a response variable y, with a given set of p predictor variables V = {x1, x2,…, xpEN}, the Shapley-Owen method measures the contribution of the x i { 1,2 , . . . , p } -th predictor variable to the formation of the model’s y = f(x1, x2,…, xp) coefficient of determination (R2). The contribution of the xi predictor is computed on every possible subset T V { x i } that can be produced from the set V, according to the formula:
R i 2 = T V { x i } i = 1 , , p N R 2 ( T { x i } ) R 2 ( T { x i } ) p C ( p 1 , T )
where C(p−1, |T|) is the number of the combinations produced for the |T| in number predictor variables drafted from the set V−{xi} and p−1 is the number of the predictor variables included in the set V−{xi} [82,83]. In order to adjust the formula on both models, the Stata Shapley2 post-estimation command was used [84].
In the last step of the analysis, we further examined aspects of price formation. Specifically, we investigated the effect of trust on willingness to pay (WTP) by estimating how the ticket price individuals were willing to pay varied across levels of the trust scale. It is important to note that, since tobit coefficients refer to a latent (unobserved) variable, their interpretation differs from that of coefficients in an ordinary least squares (OLS) model. Thus, in order to extract the marginal effects of the variables on the actual dependent variable (and see how trust levels shape price), Formula 5 was estimated including the term Φ x β σ as the probability for an observation to be uncensored and the effect of TR was estimated using the average values of all variables [85].
Ε y | x x = β Φ x β σ
Finally, we examined the relationship between willingness to use and willingness to pay. To assess this relationship, we estimated the average WTP among respondents who indicated a positive intention to use autonomous buses (ABs) in the future and compared it with the average WTP of those who stated they would not use such a service.

4. Results

In Table 4, the basic descriptive statistics of the quantitative variables are given. As can be seen from the figures, the mean WTP was estimated at 0.5 euros with a maximum price of 5. The mean value estimation signifies that users generally accepted lower prices for using the ABs, most probably because they were already aware of the cost savings associated with them. The mean value of the variable PU just exceeded 2.5, denoting that the use of the AB could be regarded as low. The mean value of the variable TR (4.893) revealed a medium trust in the service providers. The mean value of the AGE variable was 34 years, while the older respondent was 68 years old. As for the INC variable, the mean value was estimated at 3.718. This value corresponds to a point of the interval of monthly income between EUR 500 and EUR 1000. Finally, regarding the dichotomous variables, the WTU response analysis revealed that 36.18% were positive about using the AB service in the future, while 63.82% said that they would not use the service. Finally, the analysis of the GE variable revealed that the representation of men and women in the survey was almost equal, as the proportion of men was 50.68% and of women 49.32%.
The results of the WTU model estimation are presented in Table 5. In the last rows of Table 5, the results of the model’s goodness of fit tests are presented. The statistical value of chi square (84.87) at a significance level of (<0.01) led to the rejection of the null hypothesis that the coefficients of the model had no effect on the dependent variable. On the other hand, the value chi square (7.32) of the Hosmer and Lemeshow test and the lack of statistical significance of the estimation showed that there were not large deviations between the observed and expected number of observations in the two categories of the dependent variable. Therefore, the results of both tests confirm the model is a relatively good fit for the survey data. We also report the deviance and Akaike information criterion (AIC) to facilitate comparisons with future studies in the field.
As far as the estimations of the coefficients are concerned, those presented variations in both the direction and the significance of the relationship between the affecting factors and the users’ WTU. More precisely, the estimated coefficients of PU, PeU, PeSC and TR were all positive and statistically significant at the 0.01 level except for the PU coefficient, which was significant at the 0.05 level. As for the sociodemographic variables, the only statistically significant estimation (<0.1) was of income, which was found to have a negative effect on WTU. Interpreting the results, in general, these were in line with the initial expectations. Higher levels of previous use of the ABs, as well as stronger trust in the service providers, seemed to increase the likelihood of citizens riding on an AB. The same held for the perceived usefulness and safety of passengers. In addition, the negative estimation of the gender coefficient signified that although there were some hints that men were more willing to ride on an AB (since the male sex was coded with zero), the current sample still could not provide clear indications of that due to the absence of statistical significance in the respective estimation. In addition, the positive and statistically insignificant estimation of the age coefficient denoted that previous findings that spotted a more positive stance of younger people against ABs could not be validated by the current sample. Finally, a negative sign was found for the income coefficient, which means that as their income increased, people were more reluctant to ride an AB.
In addition, the results of the WTP model under the tobit specification are presented in Table 6. The value of the likelihood ratio test (82.99) exceeded the critical value of the chi square distribution. Thus, the null hypothesis that the model’s variables had no effect on the dependent variable was rejected at a significance level of (<0.01). We also report the value of the AIC criterion for future comparisons. The estimated coefficient presented statistical significance at various levels for all estimations except for the AGE variable. More precisely, PeU and TR coefficients were both positive and statistically significant at the (0.01) level. Therefore, we can be quite sure that perceived usefulness and trust in the service provider positively affected the intention of users to pay for the AB service. The estimated coefficient of PeSC was found positive and statistically significant at the (0.05) level, denoting that users were keen to pay more for using the AB service when they felt safer and found it more convenient.
The PU coefficient was positive but significant only at the (0.10) level. This finding implies that although higher experience with ABs made people more positive in accepting higher ticket prices, this relationship still needs to be checked by future studies in order to draw more accurate conclusions. Further research is also essential for the coefficients of INC and AGE variables, which were also found to be statistically significant at the (0.10) level. Since female respondents were coded with 1, the positive sign of the coefficient implies that for the present sample, women were willing to accept a higher ticket price for using the AB service. In addition, people of higher income categories were less keen on paying for AB services, a finding that could probably be explained by considering the negative relationship between income and WTU that was found in the previous model. Finally, although younger people presented a higher WTP, as the negative sign of the age coefficient implies, this finding has yet to be checked by future studies due to the lack of statistical significance in the estimation.
Finally, Table 7 presents the relative contribution of the variables to the variability of R-squared, as well as the respective ranking resulting from the relative contribution of each variable after the application of the Shapley–Owen decomposition method on both models.
As can be seen, the highest contribution to the variability of the WTU model was attributed to the PeU variable. The respective percentage of 62.69% outweighed, to a great extent, those observed regarding the other variables. Almost the same contribution was found for the variables PeSC and PU (13.65% and 12.55%, respectively), followed by the TR variable, which accounted for 7.63% of the WTU variability. Additionally, the contribution of the sociodemographic variables was too low since the cumulative percentage of explained variability of all three variables did not exceed 3.5%. The above findings denote that incentives for enhancing people’s acceptance and use of AB should mostly be directed towards improving passengers’ perceptions regarding AB characteristics such as safety and usefulness. In addition, engaging people in AB usage may increase their willingness to use them more regularly. Demonstrative and promotional actions could help service providers to realize this target.
Moreover, enhancing trust may also prove to be beneficial towards wider AB acceptance, as trust has been found to be a critical factor in people’s WTU. This could be achieved through information campaigns for citizens and local stakeholders. Finally, the results regarding the sociodemographic variables reveal that campaigns and demonstrative actions, at least for the case of Trikala, would not need to be targeted at specific segments of the population since no sub-group of age, sex, or income stood out from others as far as WTU ABs is regarded.
The results of the Shapley–Owen decomposition of the WTP model showed some differences from those of the former model. More precisely, although PeU remained the most influential factor of WTP, nevertheless, its explanatory power was reduced as it now accounted for 51.18% of the total R2 variability. Furthermore, trust was the second most affecting factor of WTP, explaining 16.79% of the model’s variability. PU retained the same ranking, while PeSC ranked fourth by explaining less than 8% of the variability. The sociodemographic variables acquired greater importance in shaping users’ WTP as they now accounted for more than 9% of the WTP model variability. For instance, the relative contribution of income was now estimated at 5.39%, making it the most critical sociodemographic factor.
These results signify that strategies aiming at the enhancement of users’ WTU or WTP should be based on various priorities. This is because the variables are ranked differently according to their contribution under the two models. For instance, a strategy for improving perceived safety and convenience would be highly beneficial for strengthening peoples’ willingness to use AVs, as PeSC was the second most important factor affecting WTU but may be less effective when the target is the increase of the price ticket, as WTP was influenced more by variables other than PeSC. In this case, making people understand the usefulness of ABs would be the most influential strategy for setting a price that could support further investment in ABs. The opposite stands for the variable of trust. Despite its moderate significance in shaping people’s WTU, the variable had a key role in shaping WTP. In Figure 2a the variations of the average price under various scales of the TR variable, as extracted by using Equation (5), are presented. As can be seen, using the average price of the TR variable (4.89/10), the WTP was estimated at EUR 0.49. If trust could be enhanced so that all people would select a 10/10 on the respective Likert scale, then the price ticket that they would accept would be EUR 0.62, an increase of 26% with respect to the price corresponding to the average trust rate. In contrast, a reduction of trust at a scale of 2 could shift the WTP below EUR 0.42. In addition, despite the different ranking of factors according to their effect on WTU and WTP, these two aspects remain convoluted, as potential strategies for enhancing one aspect may also have a significant result on the other dimension of acceptance. This is exemplified by Figure 2b, where the average WTP of the two groups of respondents formed by their reply to the WTU question is presented. As can be seen, people who provided a positive reply regarding the future use of the AB service indicated that they would be willing to pay a price ticket of almost EUR 0.8. This price was twice as high as that indicated by respondents with a negative WTU reply. Therefore, by enhancing people’s WTU the AB service, service providers could set higher prices and thus increase the likelihood of achieving financial sustainability of their operations.

5. Conclusions

The integration of autonomous buses into our cities’ public transport networks is undoubtedly expected to lead to new opportunities and challenges for public transport providers and users. Understanding the main drivers of users’ acceptance in relation to their different sociodemographic characteristics and mobility needs plays a key role in developing cost-effective and sustainable policies for ABs. In this framework, the present paper examined users’ acceptance of ABs as an alternative to conventional public bus services. Acceptance was approached through two concepts: willingness to use and willingness to pay. Focusing on residents who had actually experienced an AB service by the time of the survey in Trikala, Greece, the study provided the opportunity to test how a range of factors, deriving from literature review, are shaping the potential of people to accept and use ABs in an empirical context. Through the analysis, significant insights came to light regarding the future penetration and use of autonomous mobility solutions in everyday life. More specifically, the study found that the intention of people to use ABs was mostly shaped by psychological factors such as users’ perceptions of usefulness and safety/convenience, and trust in the service provider. Moreover, having established a positive perception of aspects like safety and usefulness, WTU was positively affected by previous experience in using ABs. In contrast, sociodemographic factors were found to have very little effect on people’s intention to use ABs. The way that the variables of PeU and PeSC were composed in the present paper, considering the implications of ABs for both the personal and community’s welfare, shows that not only personal utility mattered for users, but also their perceptions of how autonomous driving will improve the overall life standards in the study area. Therefore, it is important for policy-makers to invest in raising awareness and sharing information about the overall benefits and potential of ABs and to promote the pilot implementation of ABs locally, with wide public participation and consideration of the needs of the local communities.
In addition, the WTP model of the study has also revealed useful indications for the overall economic viability of ABs. Specifically, sociodemographic factors are more important when pricing is under consideration. In this context, it is important for policy-makers to make sure that an AB service is affordable for all sociodemographic groups that may use the specific service. Moreover, the analysis shows that people generally accepted lower ticket prices for the use of ABs than for the use of conventional buses. This finding, on the one side, signifies that people are aware of the economic benefits associated with autonomous driving, but also question the economic viability of new AB services, which must be carefully designed in order to account for the different costs and demand curves between the ABs and the conventional buses. As autonomous driving technologies evolve, testing different AB services and business models in real-life conditions are considered important in this direction.
These findings are consistent with the international literature, as suggested by the most recent research (published in the past 5 years) in Table 1. More specifically, the current study highlights the significance of perceived safety and usefulness, in accordance with Yan et al. [51]. Cai at al. [52] confirm that users consider both their own personal benefits, e.g., service cost and availability, and the wider advantages for society, e.g., accessibility and quality of the environment, as regards AB adoption. Moreover, environmental consciousness is found to be a critical personal attribute that affects the willingness to use ABs [59]. However, the current study leads to somewhat different results from the work of Mouratidis and Serrano [36], which assessed the intention to use ABs before and after their implementation in Oslo, Norway. Specifically, Mouratidis and Serrano suggest a higher effect of age on the intention to use ABs, with younger users being more willing to adopt such services, while previous experience in using an autonomous bus service did not significantly affect users’ intention to use them. These differences may be attributed to both the different nature of the case studies, with the AB in Oslo replacing an existing conventional bus route and, possibly, to the more positive attitude of the local community towards public transport and mobility innovation, in comparison to Trikala. In this respect, it should be highlighted that Norway has already hosted many similar projects over the years. Nonetheless, both studies find the issues of affordability and service upgrade very important.
The policy recommendations of the current study are aligned with those of Li et al. [53], who argue that awareness campaigns should be conducted targeting specific groups of potential users and focusing on the contribution of ABs to sustainable urban development. In addition, Cheng and Lai [54] suggest that the enhancement of user experience through AB trials may have a positive impact on their adoption by the local community, as proposed by the current study.
The added value of testing different AB services and business models in real-life conditions initiatives is twofold, as they enable users to experience and explore the future technological developments in their local environment and provide researchers, policy-makers and practitioners with information and data to increase their understanding regarding the users’ attitudes and needs and to design more effective and viable AB services. In this vein, the present study capitalizes on a demonstrative action in order to model users’ willingness to use and pay for AB services and the underlying factors affecting their intentions. Despite successfully extracting various robust results, considering the statistical significance of the respective estimations, more effort is still needed to adequately model users’ acceptance of the autonomous bus. In this direction, additional factors having to do with the on-bus features, the ease of use and users’ reason for taking an AB would enhance the understanding of users’ intentions and behavior. However, this goes beyond the capabilities of the specific research, which is based on a short-term demonstration of an AB service, while the assessment of such factors requires a more permanent implementation of the AB service and the time for users to adapt to it. Therefore, it is greatly desired that the methodology be updated and applied in the future, when more permanent services are established.
Moreover, the expansion of such services to other locations presents a valuable opportunity to model revealed preferences, rather than relying solely on stated preferences. This shift could help mitigate biases commonly associated with survey-based studies, such as social desirability bias, hypothetical bias and related response distortions. Finally, the findings of this study are context-specific to the city of Trikala, where residents demonstrate a high level of engagement with “smart city” initiatives. As such, the generalizability of the results may be limited to contexts where autonomous bus (AB) services are already in place. Further research is therefore essential in areas where AB services have not yet been introduced.

Author Contributions

Conceptualization, S.N.; methodology, S.N. and P.A.; formal analysis, S.N.; investigation, S.N., N.G. and K.A.; resources, S.N., N.G. and K.A.; data curation, S.N. and P.A.; writing—original draft preparation, S.N., N.G. and K.A.; writing—review and editing, S.N., N.G., K.A. and P.A.; visualization, S.N., N.G., K.A. and P.A.; supervision, S.N. All authors have read and agreed to the published version of the manuscript.

Funding

This research received no external funding.

Institutional Review Board Statement

Ethical approval was not required for this study in accordance with the directions provided by the Committee on Ethics of the Department of Planning and Regional Development, University of Thessaly, which operates in accordance with the provisions of the Committee on Ethics and Ethics of the Research (E.H.D.E.) of the University of Thessaly, as the research involved anonymous questionnaires with voluntary adult participants. No identifiable or sensitive data were collected, and the study adhered to national ethical standards requiring participant consent rather than formal institutional review.

Informed Consent Statement

Verbal informed consent was obtained from all adult participants prior to their involvement. The survey included a preamble stating: ‘Thank you for consenting to participate in this survey. Questionnaires are filled in anonymously, and no personally identifiable information will be captured. Your identity will remain anonymous.’ Participants were fully informed of the research purpose and their right to withdraw. Since no personal data were collected, written consent was not required, in compliance with the directions provided by the Committee on Ethics of the Department of Planning and Regional Development, University of Thessaly which operates in accordance with the provisions of the Committee on Ethics and Ethics of the Research (E.H.D.E.) of the University of Thessaly.

Data Availability Statement

Data are contained within the article.

Conflicts of Interest

The authors declare no conflicts of interest.

Abbreviations

The following abbreviations are used in this manuscript:
AVAutonomous vehicle
ABAutonomous Bus
WTUWillingness to Use
WTPWillingness to Pay
SDGSustainable Development Goal
EUEuropean Union
UTAUTUnified Theory of Acceptance and Use of Technology
TTFTask Technology Fit
ADRTAutonomous Demand-Responsive Transit
ICLVIntegrated Choice and Latent Variable
ARTSAutomated Road Transport Systems
PeUPerceived Usefulness
PeSCPerceived Safety-Convenience
PCAPrincipal Components Analysis
OLSOrdinary Least Squares

References

  1. UN. Transforming Our World: The 2030 Agenda for Sustainable Development. Department of Economic and Social Affairs, Sustainable Development. 2025. Available online: https://sdgs.un.org/2030agenda (accessed on 23 May 2025).
  2. UN. Goal 11: Make Cities and Human Settlements Inclusive, Safe, Resilient and Sustainable; Department of Economic and Social Affairs, Sustainable Development: New York, NY, USA, 2025; Available online: https://sdgs.un.org/goals/goal11 (accessed on 23 May 2025).
  3. UN. Goal 13: Take Urgent Action to Combat Climate Change and Its Impacts; Department of Economic and Social Affairs, Sustainable Development: New York, NY, USA, 2025; Available online: https://sdgs.un.org/goals/goal13 (accessed on 23 May 2025).
  4. Anthony Jnr, B. Developing green urban mobility policies for sustainable public transportation in local communities: A Norwegian perspective. J. Place Manag. Dev. 2024, 17, 136–155. [Google Scholar] [CrossRef]
  5. The Global Goals. 11: Sustainable Cities and Communities. 2025. Available online: https://www.globalgoals.org/goals/11-sustainable-cities-and-communities/ (accessed on 23 May 2025).
  6. European Commission. The New EU Urban Mobility Framework. 2021. Available online: https://eur-lex.europa.eu/legal-content/EN/TXT/?uri=celex:52021DC0811 (accessed on 2 April 2025).
  7. Fagnant, D.J.; Kockelman, K. Preparing a nation for autonomous vehicles: Opportunities, barriers and policy recommendations. Transp. Res. Part A Policy Pract. 2015, 77, 167–181. [Google Scholar] [CrossRef]
  8. Yigitcanlar, T.; Wilson, M.; Kamruzzaman, M. Disruptive Impacts of Automated Driving Systems on the Built Environment and Land Use: An Urban Planner’s Perspective. J. Open Innov. Technol. Mark. Complex. 2019, 5, 24. [Google Scholar] [CrossRef]
  9. Litman, T. Autonomous Vehicle Implementation Predictions Implications for Transport Planning 23 October 2024 Victoria Transport Policy Institute. 2024. Available online: https://www.vtpi.org/avip.pdf (accessed on 10 January 2025).
  10. Shapiro, R.; Yoder, I. Innovation Highway: Unlocking the Social and Economic Benefits of Autonomous Vehicles; U.S. Chamber of Commerce Technology Engagement Center: Washington, DC, USA, 2023; Available online: https://www.sonecon.com/wp-content/uploads/2023/07/Report-on-the-Economic-and-Social-Benefits-of-Autonomous-Vehicles-Shapiro-Yoder-July-20-2023.pdf (accessed on 2 April 2025).
  11. Milakis, D.; Van Arem, B.; Van Wee, B. Policy and society related implications of automated driving: A review of literature and directions for future research. J. Intell. Transp. Syst. 2017, 21, 324–348. [Google Scholar] [CrossRef]
  12. Dai, Z.; Liu, X.C.; Chen, X.; Ma, X. Joint optimization of scheduling and capacity for mixed traffic with autonomous and human-driven buses: A dynamic programming approach. Transp. Res. Part C Emerg. Technol. 2020, 114, 598–619. [Google Scholar] [CrossRef]
  13. Metz, D. Developing Policy for Urban Autonomous Vehicles: Impact on Congestion. Urban Sci. 2018, 2, 33. [Google Scholar] [CrossRef]
  14. Dai, J.; Li, R.; Liu, Z.; Lin, S. Impacts of the introduction of autonomous taxi on travel behaviors of the experienced user: Evidence from a one-year paid taxi service in Guangzhou, China. Transp. Res. Part C Emerg. Technol. 2021, 130, 103311. [Google Scholar] [CrossRef]
  15. Nikitas, A.; Kougias, I.; Alyavina, E.; Njoya Tchouamou, E. How Can Autonomous and Connected Vehicles, Electromobility, BRT, Hyperloop, Shared Use Mobility and Mobility-As-A-Service Shape Transport Futures for the Context of Smart Cities? Urban Sci. 2017, 1, 36. [Google Scholar] [CrossRef]
  16. Rajashekara, K.; Koppera, S. Data and Energy Impacts of Intelligent Transportation—A Review. World Electr. Veh. J. 2024, 15, 262. [Google Scholar] [CrossRef]
  17. Anastasiadou, K. Sustainable Mobility Driven Prioritization of New Vehicle Technologies, Based on a New Decision-Aiding Methodology. Sustainability 2021, 13, 4760. [Google Scholar] [CrossRef]
  18. Li, K.; Li, D. How Autonomous Vehicles Shape Urban Traffic Sustainability: An Empirical Study Based on Structural Equation Modeling. Sustainability 2025, 17, 2589. [Google Scholar] [CrossRef]
  19. Foley, B.; Degirmenci, K.; Yigitcanlar, T. Factors Affecting Electric Vehicle Uptake: Insights from a Descriptive Analysis in Australia. Urban Sci. 2020, 4, 57. [Google Scholar] [CrossRef]
  20. Freemark, Y.; Hudson, A.; Zhao, J. Policies for Autonomy: How American Cities Envision Regulating Automated Vehicles. Urban Sci. 2020, 4, 55. [Google Scholar] [CrossRef]
  21. Li, M.; Tang, Y.; Wu, K.; Cheng, H. Autonomous vehicle pollution monitoring: An innovative solution for policy and environmental management. Transp. Res. Part D Transp. Environ. 2025, 139, 104542. [Google Scholar] [CrossRef]
  22. Shammut, M.; Imran, M.; Hasan, F. Conceptualising the adoption of safer autonomous mobilities. Transp. Plan. Technol. 2022, 45, 403–426. [Google Scholar] [CrossRef]
  23. Dias Lousã, M.; Teixeira, H.; Pereira de Morais, J.C. The evolution of cybersecurity in self-driving cars: Insights from bibliometric research. Int. J. Innov. Sci. 2025. ahead-of-print. [Google Scholar] [CrossRef]
  24. Gavanas, N. Autonomous road vehicles: Challenges for urban planning in European cities. Urban Sci. 2019, 3, 61. [Google Scholar] [CrossRef]
  25. Gelauff, G.; Ossokina, I.; Teulings, C. Spatial and welfare effects of automated driving: Will cities grow, decline or both? Transp. Res. Part A Policy Pract. 2019, 121, 277–294. [Google Scholar] [CrossRef]
  26. Booth, L.; Karl, C.; Farrar, V.; Pettigrew, S. Assessing the Impacts of Autonomous Vehicles on Urban Sprawl. Sustainability 2024, 16, 5551. [Google Scholar] [CrossRef]
  27. Hiramatsu, T. Impact of autonomous vehicles on the choice of residential locality. Transp. Plan. Technol. 2022, 45, 268–288. [Google Scholar] [CrossRef]
  28. Gavanas, N.; Anastasiadou, K.; Nathanail, E.; Basbas, S. Transport Policy Pathways for Autonomous Road Vehicles to Promote Sustainable Urban Development in the European Union: A Multicriteria Analysis. Land 2024, 13, 1807. [Google Scholar] [CrossRef]
  29. Bansal, P.; Kockelman, K.M. Forecasting Americans’ long-term adoption of connected and autonomous vehicle technologies. Transp. Res. Part A Policy Pract. 2017, 95, 49–63. [Google Scholar] [CrossRef]
  30. Gavanas, N. Integrated urban transport planning in the era of autonomous vehicles. In Sustainable Automated and Connected Transport. Transport and Sustainability; Thomopoulos, N., Attard, M., Shiftan, Y., Eds.; Emerald Publishing Limited: Bingley, UK, 2024; Volume 19, pp. 119–137. [Google Scholar] [CrossRef]
  31. SAE International. SAE Levels of Driving Automation™ Refined for Clarity and International Audience, 3 May 2021. Available online: https://www.sae.org/blog/sae-j3016-update (accessed on 10 January 2025).
  32. ERTRAC Working Group Connectivity and Automated Driving. Connected and Automated Driving Roadmap; ERTRAC: Brussels, Belgium, 2019; Available online: https://www.ertrac.org/wp-content/uploads/2022/07/ERTRAC-CAD-Roadmap-2019.pdf (accessed on 2 April 2025).
  33. KPMG International. Autonomous Vehicles Readiness Index. Assessing Countries’ Openness and Preparedness for Autonomous Vehicles; KPMG International: Amstelveen, The Netherlands, 2018; Available online: https://kpmg.com/th/en/home/insights/2018/01/2018-autonomous-vehicles-readiness-index.html (accessed on 15 August 2019).
  34. McKinsey and Company. Autonomous Driving’s Future: Convenient and Connected, 6 January 2023|Report. 2023. Available online: https://www.mckinsey.com/industries/automotive-and-assembly/our-insights/autonomous-drivings-future-convenient-and-connected#/ (accessed on 10 January 2025).
  35. Rahman, M.M.; Thill, J.-C. Impacts of connected and autonomous vehicles on urban transportation and environment: A comprehensive review. Sustain. Cities Soc. 2023, 96, 104649. [Google Scholar] [CrossRef]
  36. Mouratidis, K.; Serrano, V.C. Autonomous buses: Intentions to use, passenger experiences, and suggestions for improvement. Transp. Res. Part F Traffic Psychol. Behav. 2021, 76, 321–335. [Google Scholar] [CrossRef]
  37. United Nations. Transforming Our World: The 2030 Agenda for Sustainable Development; A/RES/70/1; United Nations: New York, NY, USA, 2015; Available online: https://www.refworld.org/legal/resolution/unga/2015/en/111816 (accessed on 5 August 2019).
  38. López-Lambas, E.M.; Alonso, A. The driverless bus: An analysis of public perceptions and acceptability. Sustainability 2019, 11, 4986. [Google Scholar] [CrossRef]
  39. Karolemeas, C.; Tsigdinos, S.; Bakogiannis, E.; Nikitas, A. Evaluating the suitability of urban road networks to facilitate autonomous buses. Transp. Res. Procedia 2022, 62, 599–606. [Google Scholar] [CrossRef]
  40. Mo, L.; Cui, Z.; Jia, R.; Dong, K.; Zhao, C. How does autonomous vehicles affect taxi industry? A two-stage Van Damme based tripartite evolutionary game perspective. Res. Transp. Econ. 2024, 103, 101387. [Google Scholar] [CrossRef]
  41. Tsigdinos, S.; Karolemeas, C.; Bakogiannis, E.; Nikitas, A. Introducing autonomous buses into street functional classification systems: An exploratory spatial approach. Case Stud. Transp. Policy 2021, 9, 813–822. [Google Scholar] [CrossRef]
  42. Bansal, P.; Kockelman, K.M.; Singh, A. Assessing public opinions of and interest in new vehicle technologies: An Austin perspective. Transp. Res. Part C Emerg. Technol. 2016, 67, 1–14. [Google Scholar] [CrossRef]
  43. Cartenì, A. The acceptability value of autonomous vehicles: A quantitative analysis of the willingness to pay for shared autonomous vehicles (SAVs) mobility services. Transp. Res. Interdiscip. Perspect. 2020, 8, 100224. [Google Scholar] [CrossRef]
  44. Davis, F.D.; Bagozzi, R.P.; Warshaw, P.R. User acceptance of computer technology: A comparison of two theoretical models. Manag. Sci. 1989, 35, 982–1003. Available online: https://www.jstor.org/stable/2632151 (accessed on 23 May 2025). [CrossRef]
  45. Payre, W.; Cestac, J.; Delhomme, P. Intention to use a fully automated car: Attitudes and a priori acceptability. Transp. Res. Part F Traffic Psychol. Behav. 2014, 27, 252–263. [Google Scholar] [CrossRef]
  46. Madigan, R.; Louw, T.; Dziennus, M.; Graindorge, T.; Ortega, E.; Graindorge, M.; Merat, N. Acceptance of automated road transport systems (ARTS): An adaptation of the UTAUT model. Transp. Res. Procedia 2016, 14, 2217–2226. [Google Scholar] [CrossRef]
  47. Ghazizadeh, M.; Peng, Y.; Lee, J.D.; Boyle, L.N. Augmenting the technology acceptance model with trust: Commercial drivers’ attitudes towards monitoring and feedback. In Proceedings of the Human Factors and Ergonomics Society Annual Meeting, Boston, MA, USA, 22–26 October 2012; Sage Publications: Los Angeles, CA, USA, 2012; Volume 56, pp. 2286–2290. [Google Scholar] [CrossRef]
  48. Nielsen, T.A.S.; Haustein, S. On sceptics and enthusiasts: What are the expectations towards self-driving cars? Transp. Policy 2018, 66, 49–55. [Google Scholar] [CrossRef]
  49. Hulse, L.M.; Xie, H.; Galea, E.R. Perceptions of autonomous vehicles: Relationships with road users, risk, gender and age. Saf. Sci. 2018, 102, 1–13. [Google Scholar] [CrossRef]
  50. Herrenkind, B.; Nastjuk, I.; Brendel, A.B.; Trang, S.; Kolbe, L.M. Young people’s travel behavior–Using the life-oriented approach to understand the acceptance of autonomous driving. Transp. Res. Part D Transp. Environ. 2019, 74, 214–233. [Google Scholar] [CrossRef]
  51. Yan, Y.; Zhong, S.; Tian, J.; Li, T. Continuance intention of autonomous buses: An empirical analysis based on passenger experience. Transp. Policy 2022, 126, 85–95. [Google Scholar] [CrossRef]
  52. Cai, L.; Yuen, K.F.; Wang, X. Explore public acceptance of autonomous buses: An integrated model of UTAUT, TTF and trust. Travel Behav. Soc. 2023, 31, 120–130. [Google Scholar] [CrossRef]
  53. Li, H.; Jin, Z.; Cui, H.; Tu, H. An exploration of the preferences and mode choice behavior between autonomous demand-responsive transit and traditional buses. Int. J. Transp. Sci. Technol. 2024, 15, 81–101. [Google Scholar] [CrossRef]
  54. Cheng, Y.-H.; Lai, Y.-C. Exploring autonomous bus users’ intention: Evidence from positive and negative effects. Transport Policy 2024, 146, 91–101. [Google Scholar] [CrossRef]
  55. Chee, P.N.; Susilo, Y.O.; Wong, Y.D.; Pernestål, A. Which factors affect willingness-to-pay for automated vehicle services? Evidence from public road deployment in Stockholm, Sweden. Eur. Transp. Res. Rev. 2020, 12, 20. [Google Scholar] [CrossRef]
  56. Kyriakidis, M.; Happee, R.; de Winter, J.C. Public opinion on automated driving: Results of an international questionnaire among 5000 respondents. Transp. Res. Part F Traffic Psychol. Behav. 2015, 32, 127–140. [Google Scholar] [CrossRef]
  57. Nordhoff, S.; de Winter, J.; Madigan, R.; Merat, N.; van Arem, B.; Happee, R. User acceptance of automated shuttles in Berlin-Schöneberg: A questionnaire study. Transp. Res. Part F Traffic Psychol. Behav. 2018, 58, 843–854. [Google Scholar] [CrossRef]
  58. Molinillo, S.; Caballero-Galeote, L.; Liébana-Cabanillas, F.; Ruiz-Montañez, M. Understanding users’ willingness to travel on autonomous buses: The moderating effect of experience. J. Retail. Consum. Serv. 2024, 81, 103931. [Google Scholar] [CrossRef]
  59. Ariza-Álvarez, A.; López-Lambas, M.E.; Soria-Lara, J.A. Analysing the acceptance of autonomous buses in real-life traffic environments: Pilot project with tourists in Malaga, Spain. Transp. Plan. Technol. 2023, 46, 71–92. [Google Scholar] [CrossRef]
  60. Dong, X.; DiScenna, M.; Guerra, E. Transit user perceptions of driverless buses. Transportation 2017, 46, 35–50. [Google Scholar] [CrossRef]
  61. Salonen, A.O. Passenger’s subjective traffic safety, in-vehicle security and emergency management in the driverless shuttle bus in Finland. Transp. Policy 2018, 61, 106–110. [Google Scholar] [CrossRef]
  62. CityMobil2. Experiences and Documentation. 2017. Available online: http://www.citymobil2.eu/en/upload/Deliverables/PU/CityMobil2%20booklet%20web%20final_17%2011%202016.pdf (accessed on 2 June 2018).
  63. Alessandrini, A.; Delle Site, P.; Zhang, Q.; Marcucci, E.; Gatta, V. Investigating users’ attitudes towards conventional and automated buses in twelve European cities. International. J. Transp. Econ. 2016, 43, 413–436. Available online: https://www.jstor.org/stable/26504031 (accessed on 23 May 2025).
  64. Eden, G.; Nanchen, B.; Ramseyer, R.; Evéquoz, F. Expectation and experience: Passenger acceptance of autonomous public transportation vehicles. In Proceedings of the IFIP Conference on Human-Computer Interaction, Mumbai, India, 25–29 September 2017; Springer: Cham, Switzerland, 2017; pp. 360–363. [Google Scholar] [CrossRef]
  65. Portouli, E.; Karaseitanidis, G.; Lytrivis, P.; Amditis, A.; Raptis, O.; Karaberi, C. Public attitudes towards autonomous mini buses operating in real conditions in a Hellenic city. In Proceedings of the Intelligent Vehicles Symposium (IV), IEEE, Los Angeles, CA, USA, 11–14 June 2017; pp. 571–576. [Google Scholar] [CrossRef]
  66. Coccossis, H.; Delladetsimas, P.M.; Niavis, S. The challenge of incorporating smart city activities in medium-size cities: The case of Greece. Int. J. Serv. Technol. Manag. 2017, 23, 381–402. [Google Scholar] [CrossRef]
  67. King, W.R.; He, J. A meta-analysis of the technology acceptance model. Inf. Manag. 2006, 43, 740–755. [Google Scholar] [CrossRef]
  68. Venkatesh, V.; Morris, M.G.; Ackerman, P.L. A longitudinal field investigation of gender differences in individual technology adoption decision-making processes. Organ. Behav. Hum. Decis. Process. 2000, 83, 33–60. [Google Scholar] [CrossRef] [PubMed]
  69. Oh, S.; Ahn, J.; Kim, B. Adoption of broadband Internet in Korea: The role of experience in building attitudes. J. Inf. Technol. 2003, 18, 267–280. [Google Scholar] [CrossRef]
  70. Rodel, C.; Stadler, S.; Meschtscherjakov, A.; Tscheligi, M. Towards autonomous cars: The effect of autonomy levels on acceptance and user experience. In Proceedings of the 6th International Conference on Automotive User Interfaces and Interactive Vehicular Applications, Seattle, WA, USA, 17–19 September 2014; ACM: New York, NY, USA, 2014; pp. 1–8. [Google Scholar] [CrossRef]
  71. Hu, X.; Zhao, L.; Wang, W. Impact of perceptions of bus service performance on mode choice preference. Adv. Mech. Eng. 2015, 7, 1687814015573826. [Google Scholar] [CrossRef]
  72. Popuri, Y.; Proussaloglou, K.; Ayvalik, C.; Koppelman, F.; Lee, A. Importance of traveler attitudes in the choice of public transportation to work: Findings from the Regional Transportation Authority Attitudinal Survey. Transportation 2011, 38, 643–661. [Google Scholar] [CrossRef]
  73. Norusis, J.M. SPSS 13.0 Statistical Procedures Companion; Prentice Hall: Upper Saddle River, NJ, USA, 2005; ISBN 0131865390/9780131865396. [Google Scholar]
  74. DiStefano, C.; Zhu, M.; Mindrila, D. Understanding and using factor scores: Considerations for the applied researcher. Pract. Assess. Res. Eval. 2009, 14, 20. Available online: https://openpublishing.library.umass.edu/pare/article/1523/galley/1474/view/ (accessed on 23 May 2025).
  75. Weast, J.; Yurdana, M.; Jordan, A. A Matter of Trust: How Smart Design Can Accelerate Automated Vehicle Adoption; Intel Corporation: Santa Clara, CA, USA, 2016. [Google Scholar]
  76. Choi, J.K.; Ji, Y.G. Investigating the importance of trust on adopting an autonomous vehicle. Int. J. Hum.-Comput. Interact. 2015, 31, 692–702. [Google Scholar] [CrossRef]
  77. Yap, M.D.; Correia, G.; Van Arem, B. Preferences of travellers for using automated vehicles as last mile public transport of multimodal train trips. Transp. Res. Part A Policy Pract. 2016, 94, 1–16. [Google Scholar] [CrossRef]
  78. Hohenberger, C.; Spörrle, M.; Welpe, I.M. How and why do men and women differ in their willingness to use automated cars? The influence of emotions across different age groups. Transp. Res. Part A Policy Pract. 2016, 94, 374–385. [Google Scholar] [CrossRef]
  79. Becker, F.; Axhausen, K.W. Literature review on surveys investigating the acceptance of automated vehicles. Transportation 2017, 44, 1293–1306. [Google Scholar] [CrossRef]
  80. Carlsson, F.; Johansson-Stenman, O. Willingness to pay for improved air quality in Sweden. Appl. Econ. 2000, 32, 661–669. [Google Scholar] [CrossRef]
  81. Tobin, J. Estimation of relationships for limited dependent variables. Econometrica 1958, 26, 24–36. Available online: https://www.jstor.org/stable/1907382 (accessed on 23 May 2025). [CrossRef]
  82. Huettner, F.; Sunder, M. Axiomatic arguments for decomposing goodness of fit according to Shapley and Owen values. Electron. J. Stat. 2012, 6, 1239–1250. [Google Scholar] [CrossRef]
  83. Abrate, G.; Viglia, G. Strategic and tactical price decisions in hotel revenue management. Tour. Manag. 2016, 55, 123–132. [Google Scholar] [CrossRef]
  84. Wendelspiess Chávez Juárez, F. SHAPLEY2: Stata Module to Compute Additive Decomposition of Estimation Statistics by Regressors or Groups of Regressors; Statistical Software Components S457543; Boston College Department of Economics: Chestnut Hill, MA, USA, 2015; Available online: https://ideas.repec.org/c/boc/bocode/s457543.html (accessed on 23 May 2025).
  85. Golder, M. Explaining variation in the success of extreme right parties in Western Europe. Comp. Political Stud. 2003, 36, 432–466. [Google Scholar] [CrossRef]
Figure 1. The methodological framework of the paper.
Urbansci 09 00298 g001
Figure 2. The variations of WTP on different trust scales (a) and the mean WTP of the two WTU replies (b).
Urbansci 09 00298 g002
Table 1. The key characteristics of previous studies on the acceptance of automated buses.
AuthorsObjectiveMethodsTarget VariablesAffecting FactorsLocationSample Size
Alessandrini et al. (2016) [63]To evaluate WTU and WTP for an automated bus in the presence of an alternative conventional bus under four different scenariosStated preference survey/logit models Preference for automated or conventional BusGender, age, income, education, occupation, waiting time, riding time, car availability, fare, public transport monthly ticket ownership12 European Cities 167 to 742 responses, depending on the city
Madigan et al. (2016) [46]To estimate WTU for ABsUnified theory of acceptance and use of technology survey/hierarchical multiple regressionWTU an ABPerformance expectancy, effort expectancy, social influence, behavioral intentionLa Rochelle (France),
Lausanne (Switzerland)
349 valid responses
Dong et al. (2017) [60]To estimate WTU for an AB under three scenarios of various automation levels Stated preference survey/mixed logit modelWillingness to ride an AB based on five Likert-scale questions and three discrete alternatives: willing, uncertain and unwillingGender, income,
age, bus usage,
presence of employee, knowledge about AVs, concerns about safety, services to impaired persons and access to information
Pennsylvania (USA)891 valid responses
Eden et al. (2017) [64]To present users’ beliefs for the ABsVideo-recorded interviewsSafety, comfort, and convenience of ABsExperience with ABs or other types of driverless transportSion (Switzerland)17 passengers
Portouli et al. (2017) [65]To assess users’ perception on various characteristics of ABsFace-to-face and mailed questionnairesPerceptions on satisfaction, safety, securityAge, occupation, education, car automation preference, automation experienceTrikala (Greece)200 AB users
and 497 citizens
Salonen (2018) [61]To assess users’ perceptions regarding safety, online security and emergency management on ABs compared to conventional busesSubjective perceptions survey/independent samples t-test and one-way ANOVASafety, security,
emergency management
Gender, education
age, income, employment status
City of Vantaa (Finland)197 ADB users
Mouratidis and Serrano 2021 [36]To examine the intention to use ABs, before and after use, as well as the perception after having traveled by ABsSurvey and interview dataPerceptions of main transport challenges along the routeAge, gender, residential location, car useOslo (Norway)117 and 25 respondents in each phase
Yan et al. 2022 [51]To understand passengers’ continuance, use intention of ABs, based on their riding experienceTechnology acceptance modelPerceived in-vehicle safety, service quality and general attitudes toward busesAge, gender, income, educationChina576 participants
Li et al. 2024 [53]To investigate
users’ preferences and attitudes towards autonomous demand-responsive transit (ADRT) and mode choice behavior between ADRT buses and traditional buses
Survey with Likert scale statements and integrated choice and latent variable (ICLV) modelSafety risks of AVs, social concerns, service flexibility concerns when using AVs, interest in new things, shuttle mode choiceAge, gender, income, education, number of family membersShanghai (China)627 valid responses
Cai et al. 2023 [52]To explain public intention to use ABsOnline survey and unified theory of acceptance and usage of technology (UTAUT), task technology fit (TTF) theory and trust theoryPerformance expectancy, effort expectancy, social influence,
and perceived risk
Age, gender, income, use frequency of public transportChina277 participants
Ariza-Álvarez et al. 2023 [59]To explore passengers’ willingness to use ABs, as well as their satisfaction on boardDiscrete choice analysis/face-to-face questionnaire surveyWTU ABs and perceived safety, comfort and environmental benefits while on boardAge, gender, education level, employment status, usual mode of transport, knowledge of AV technology, AV experience Malaga (Spain)300 and 105 participants in each phase
Cheng and Lai 2024 [54]To investigate positive and negative effects of the intention to use ABsMental accounting theory/hybrid discrete choice modelCompatibility, relative advantage, safety/security risks, perceived risks, in/out-of-vehicle time and travel costAge, gender, education level, occupation, last mile mode choice, frequently-used modes of transport, travel frequency, residential areaTaiwan479 participants
Table 2. The questions regarding perceived usefulness and perceived safety.
No 012345678910
Q1Are too slow Are very fast
Q2Are not safe at all Are very safe
Q3Cause traffic problems Do not have any negative effect on traffic
Q4Impose high risk of accidents Do not cause accidents
Q5They only have a touristic value They come up with great value for all aspects of life
Q6Do not make public transport more efficient Contribute to more efficient public transport
Q7The cost/benefit ratio is too large The cost/benefit ratio is very small
Q8They have minor social approval They have high social approval
Q9Do not improve city’s quality of life Bring substantial improvements to the quality of life
Q10Do not contribute to urban development Contribute to urban development
Table 3. Factor analysis results.
QuestionFactor Loadings
PeUPeSC
Q1 0.454
Q2 0.846
Q3 0.554
Q4 0.854
Q50.623
Q60.788
Q70.644
Q80.767
Q90.852
Q100.746
Initial eigenvalues5.1661.019
Rotation sums of squared loadings3.7862.399
Total variance61.851
Cronbach’s α0.7620.877
Table 4. The descriptive statistics of the quantitative variables.
WTPPUTRAGEINC
Mean0.5382.5414.893343.718
St. dev0.4672.6912.885131.726
Min01018.000
Max5101068.009
Table 5. The results of the WTU binomial logistic regression model.
BS.E.WaldSig.Exp(B)
PU0.12890.05006.63830.0111.138
PeU1.59450.179478.99270.0004.926
PeSC0.73730.147824.88150.0002.090
TR0.13660.04708.45450.0041.146
GE−0.26550.25481.08580.2970.767
AGE0.01090.01001.20060.2731.011
INC−0.13640.07623.21060.0730.872
Constant−1.35150.65074.31330.0380.259
TestsX2dfSig.
Chi square test217.80870.000
Hosmer and Lemeshov6.29780.614
Deviance390.16AIC408.16
Table 6. The results of the WTP tobit regression model.
BS.E.tP > |t|
PU0.0180.0101.8700.062
PeU0.1500.0265.7450.000
PeSC0.0600.0262.3290.020
TR0.0300.0093.4870.001
GE0.0780.0471.6530.099
AGE−0.0020.002−1.1550.249
INC−0.0260.014−1.8740.062
Constant0.3710.1193.1200.002
X2Prob > X2
Log-likelihood R2 test82.990.000
AIC674.38
Table 7. The results of the Shapley–Owen decomposition analysis on the WTU and WTP models.
VariablesModel
Willingness to UseWillingness to Pay
Relative ContributionRankRelative ContributionRank
PeU62.69%151.18%1
PeSC13.65%27.93%4
PU12.55%314.77%3
TR7.63%416.79%2
AGE1.48%50.26%7
INC1.43%65.39%5
GE0.57%73.67%6
Total100% 100%
Disclaimer/Publisher’s Note: The statements, opinions and data contained in all publications are solely those of the individual author(s) and contributor(s) and not of MDPI and/or the editor(s). MDPI and/or the editor(s) disclaim responsibility for any injury to people or property resulting from any ideas, methods, instructions or products referred to in the content.

