
Analysis of Residents’ Understanding of Encroachment Risk to Water Infrastructure in Makause Informal Settlement in the City of Ekurhuleni


Abstract
1. Introduction
2. The Aim of the Study
3. Objectives
- To design and train an Artificial Neural Network (ANN) model that predicts levels of the resident understanding of encroachment risks to water infrastructure.
- To evaluate the predictive accuracy and performance of the Artificial Neural Network model in classifying the resident understanding of encroachment risks.
- To interpret the relative importance of input variables in shaping resident awareness and risk perception using Artificial Neural Network techniques.
- To provide data-driven insights to policymakers and urban planners for targeted awareness campaigns and infrastructure protection in informal settlements.
4. Research Question
- To what extent can an Artificial Neural Network (ANN) accurately model and predict residents’ understanding of encroachment risks?
- How can insights from the Artificial Neural Network analysis inform risk communication and urban planning strategies for informal settlements?
5. Research Methodology
6. Equations and Models Used
- (i)
- Sample determination:The sample size was calculated using standard formulae for unknown populations based on the methods of [24,25]. To ensure statistical reliability, a confidence level of 95 and an acceptable margin of error were applied (see Appendix A for formulae).
- (ii)
- Correlation and Model Accuracy:Correlation coefficients, determination coefficients (R2), and the root mean square error (RMSE) were calculated to assess relationships between variables and the accuracy of predictive models. The detailed equations used in these calculations are provided in Appendix A.
- (iii)
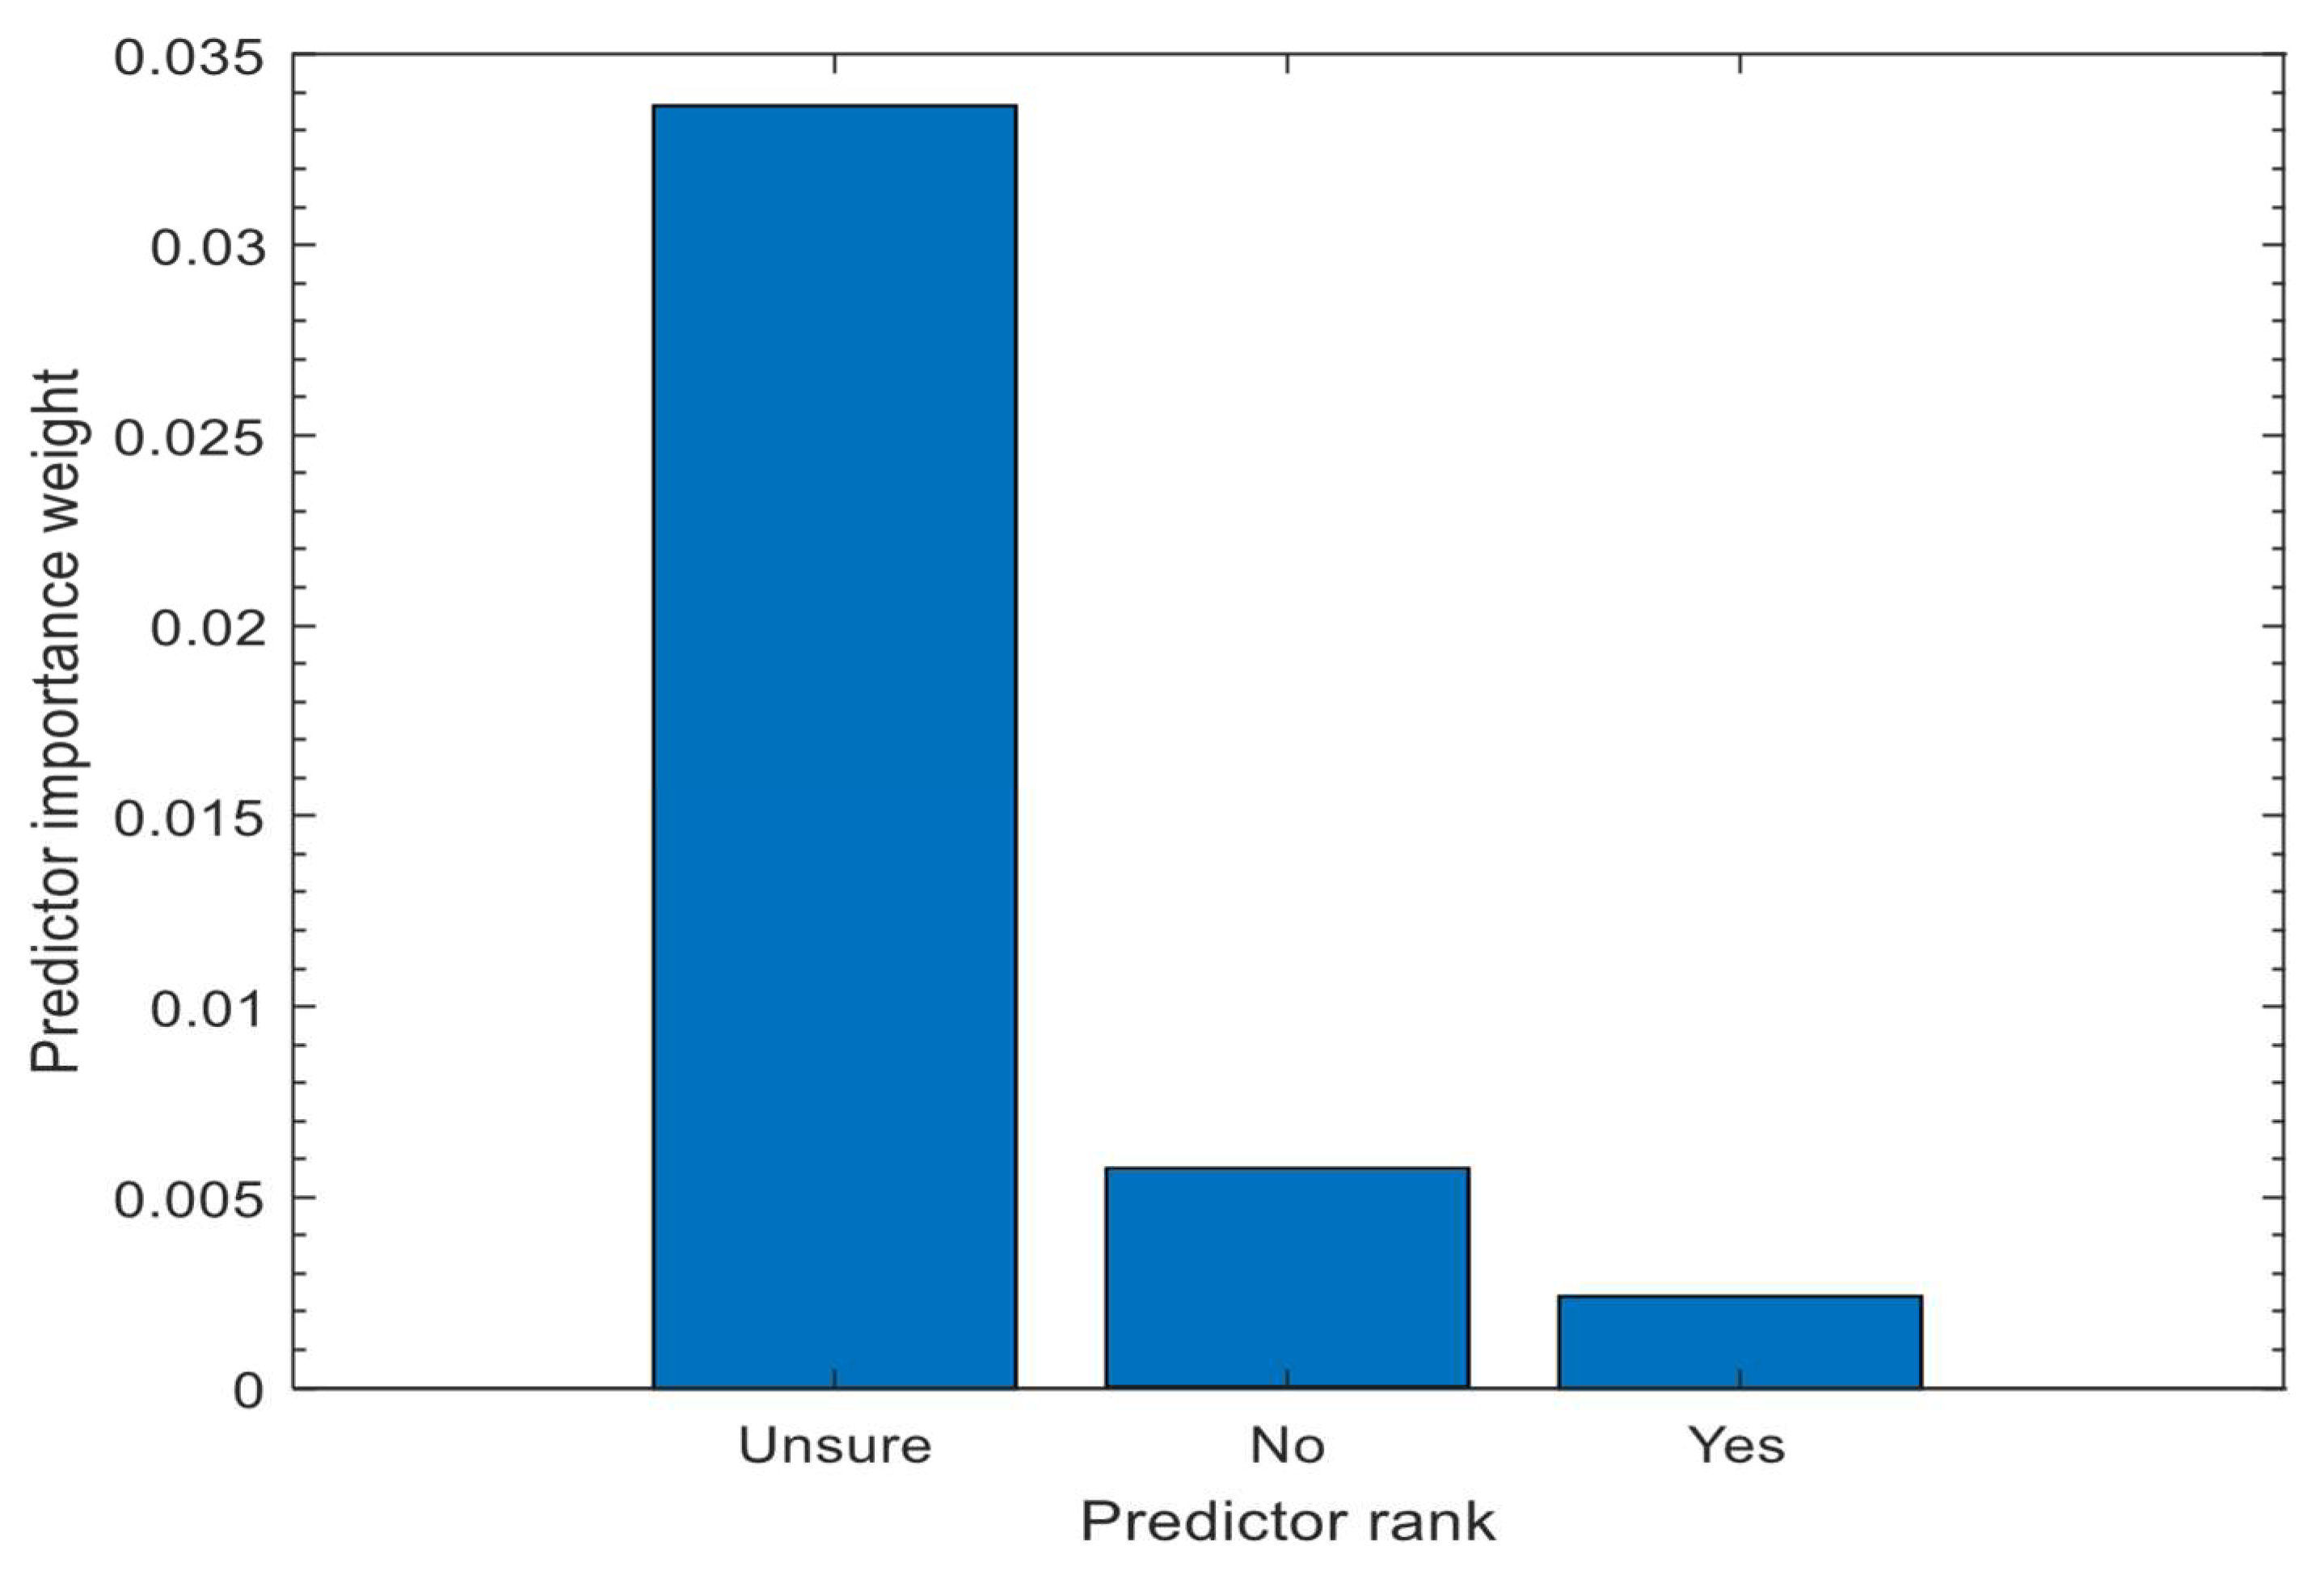
- ReliefF Algorithm:The ReliefF algorithm was used to identify the most important predictors of encroachment risk. In simple terms, ReliefF updates the importance of each factor based on how well it distinguishes between different response categories. The core logic is as follows:
- -
- If two observations belong to the same group, the importance score of factors decreases with the similarity.
- -
- If they belong to different groups, the importance score increases with the difference.Detailed update and distance equations are presented in Appendix A.
- (iv)
- Neural Network Transfer Function:A logistic sigmoid transfer function was used in the neural network model to predict the risk of encroachment. The Levenberg–Marquardt algorithm was used for training. The complete mathematical expressions can be found in Appendix A.
- (v)
- Statistical Significance: To determine significance, the p-values were calculated based on the t-statistics derived from the correlation coefficients. Details on the calculation of the t-values and the degrees of freedom can be found in Appendix A.
7. Workplace Site Exposure Sample Determination
7.1. Data Collection Methods
7.2. Ethics and Community Positioning
7.3. Sampling Procedure and Possible Biases
7.4. Pilot Testing and the Validation of the Scale
8. Validity and Reliability
9. Data Analysis
10. Findings and Discussion
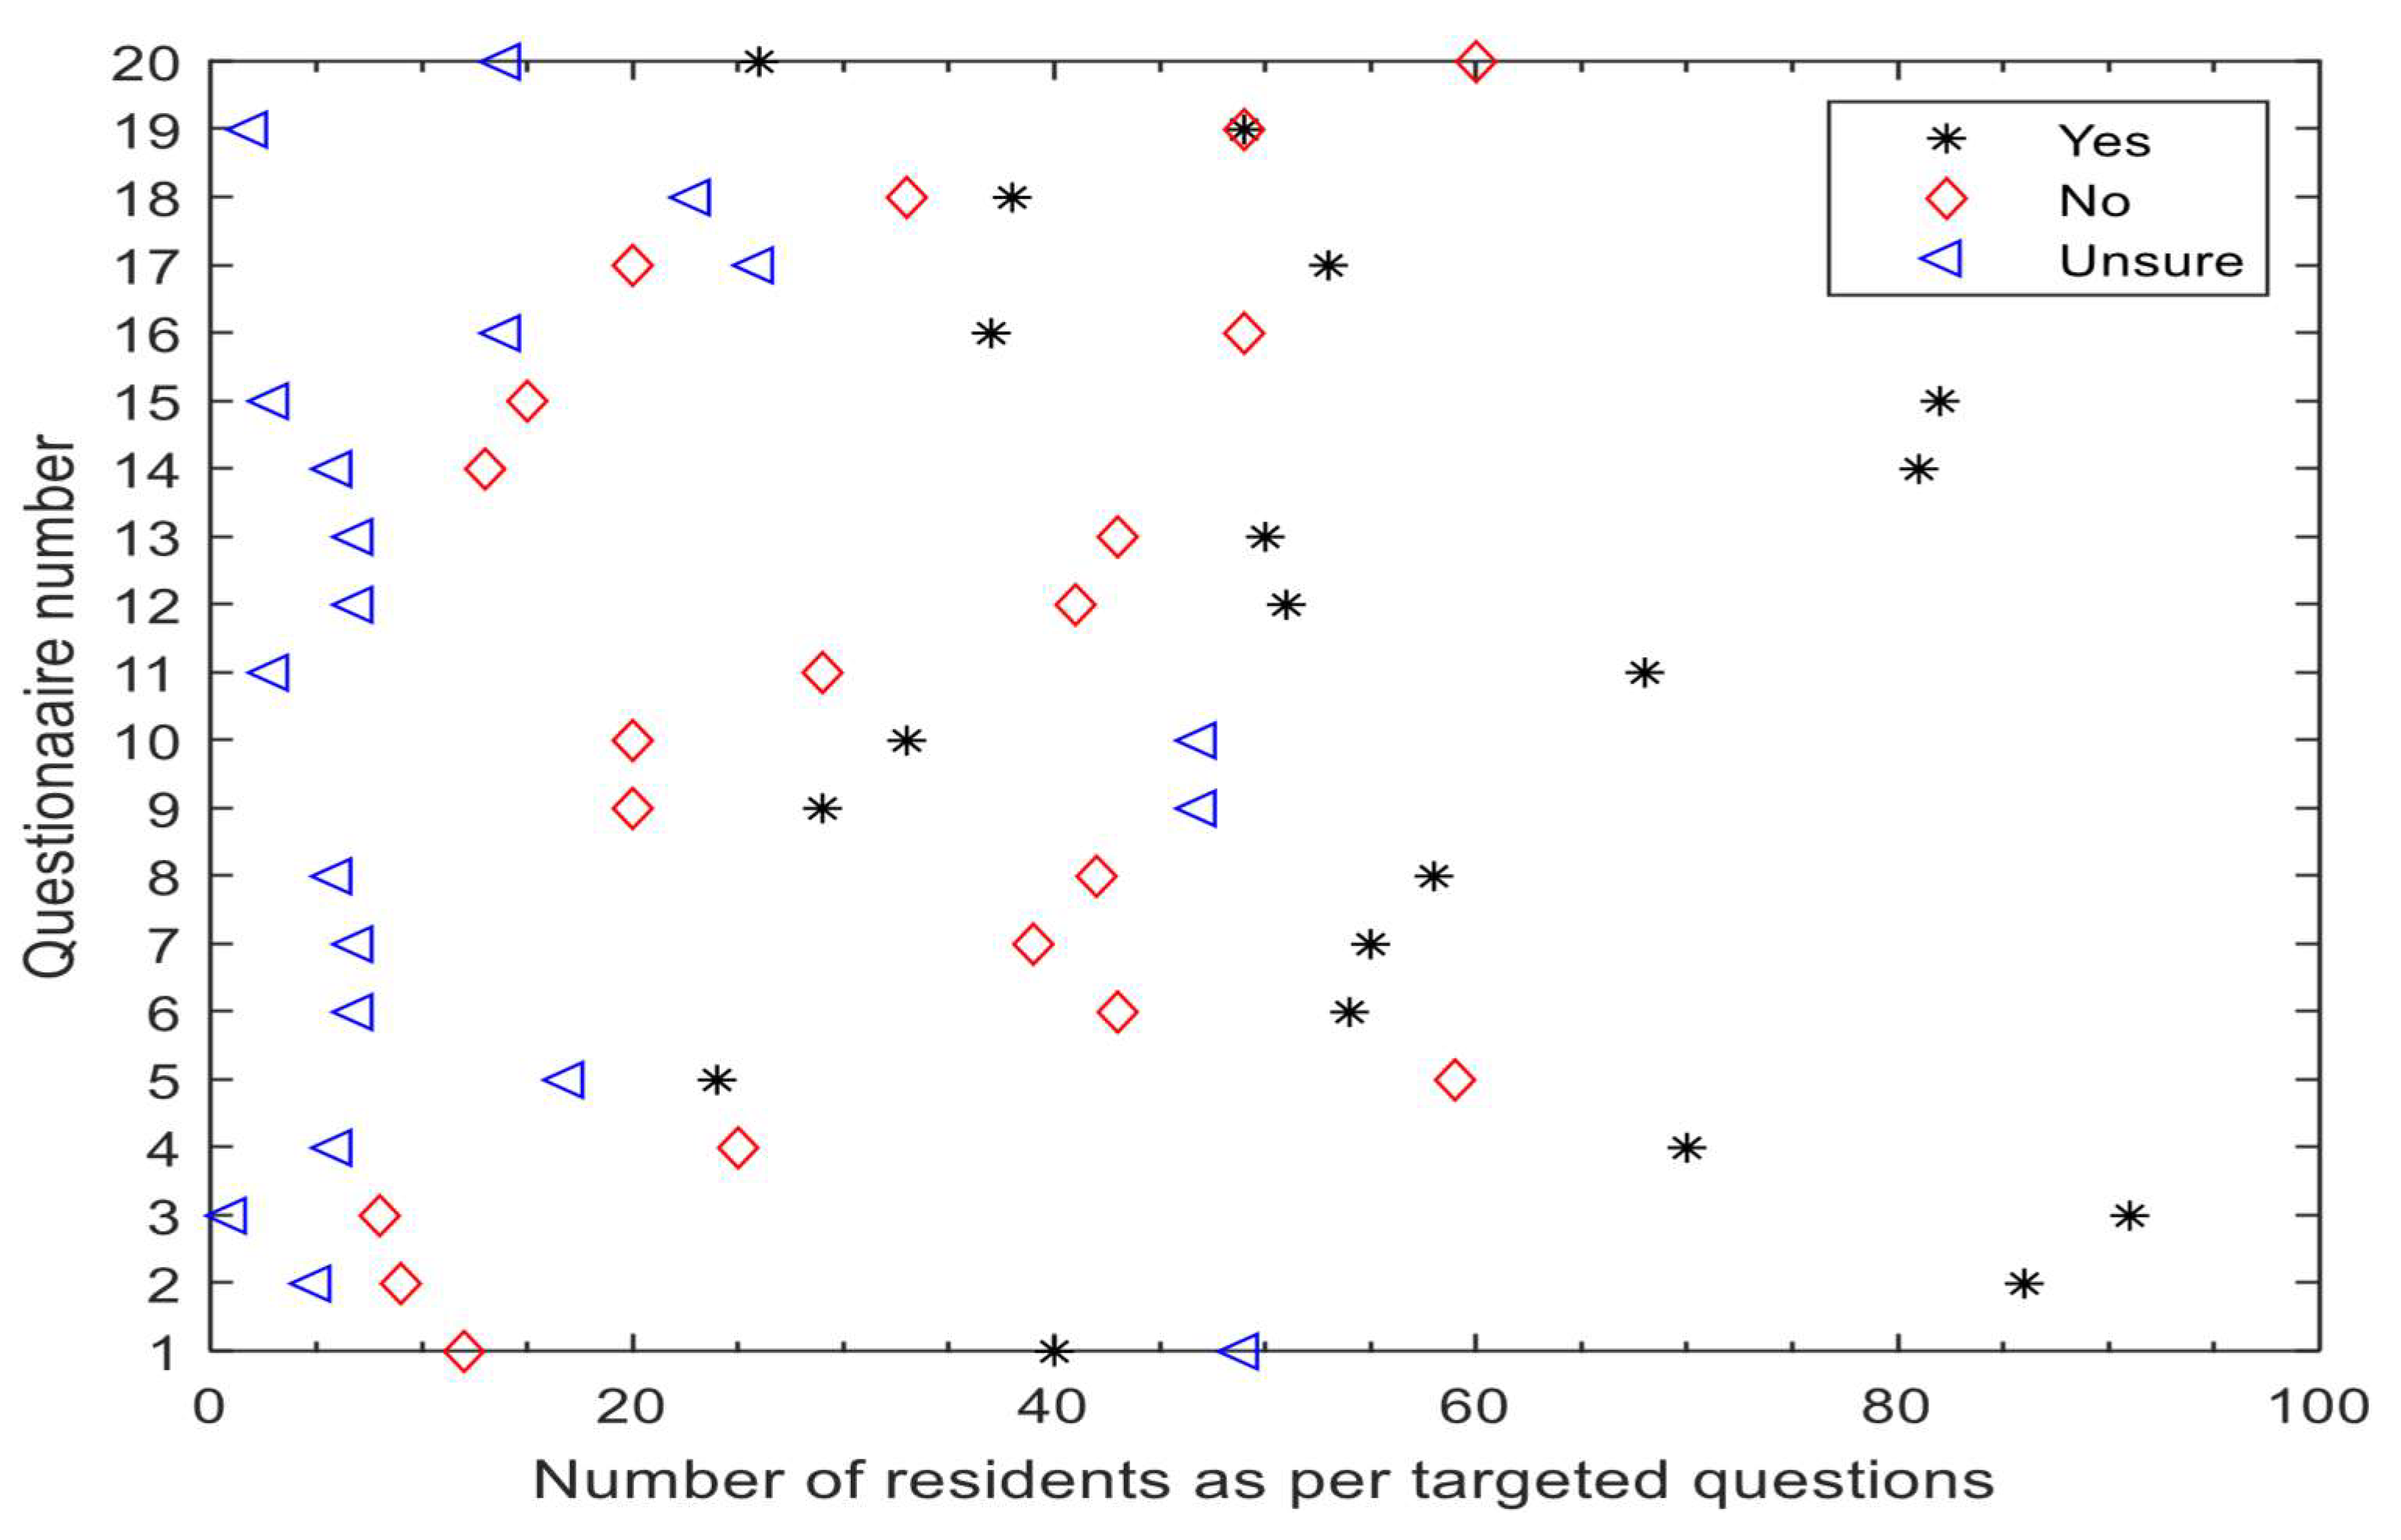
10.1. The Analysis of the Questionnaires on the Encroachment Risk for Residents
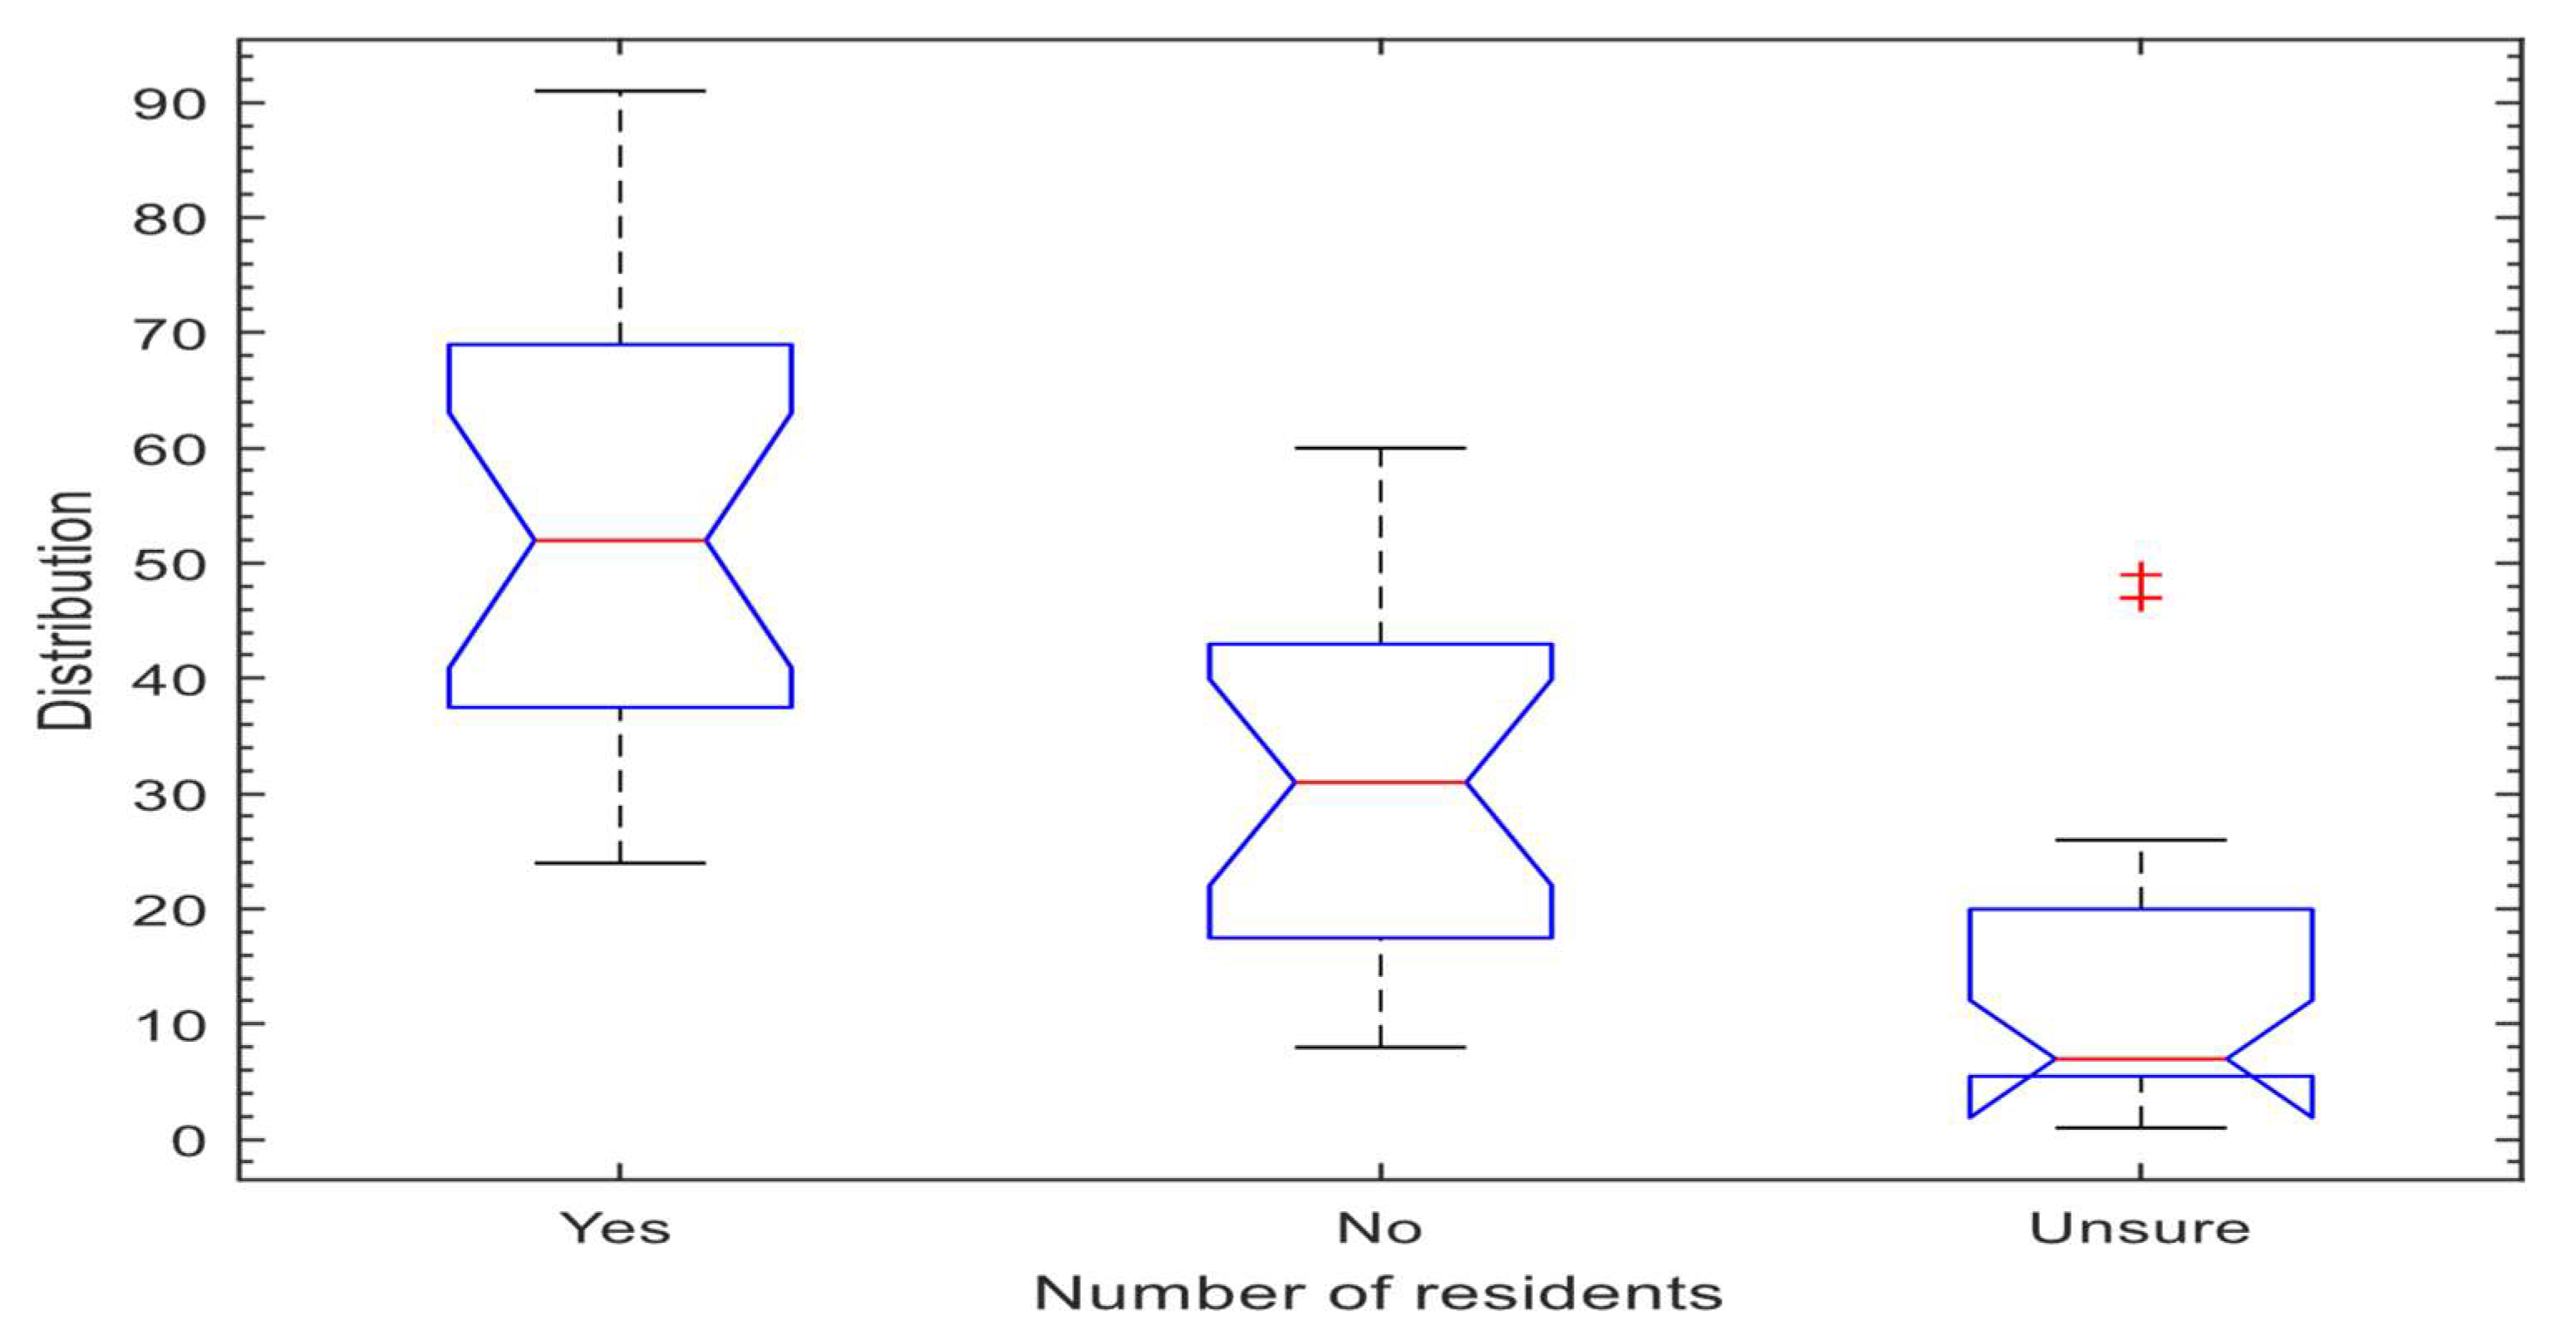
10.2. Encroachment Risk
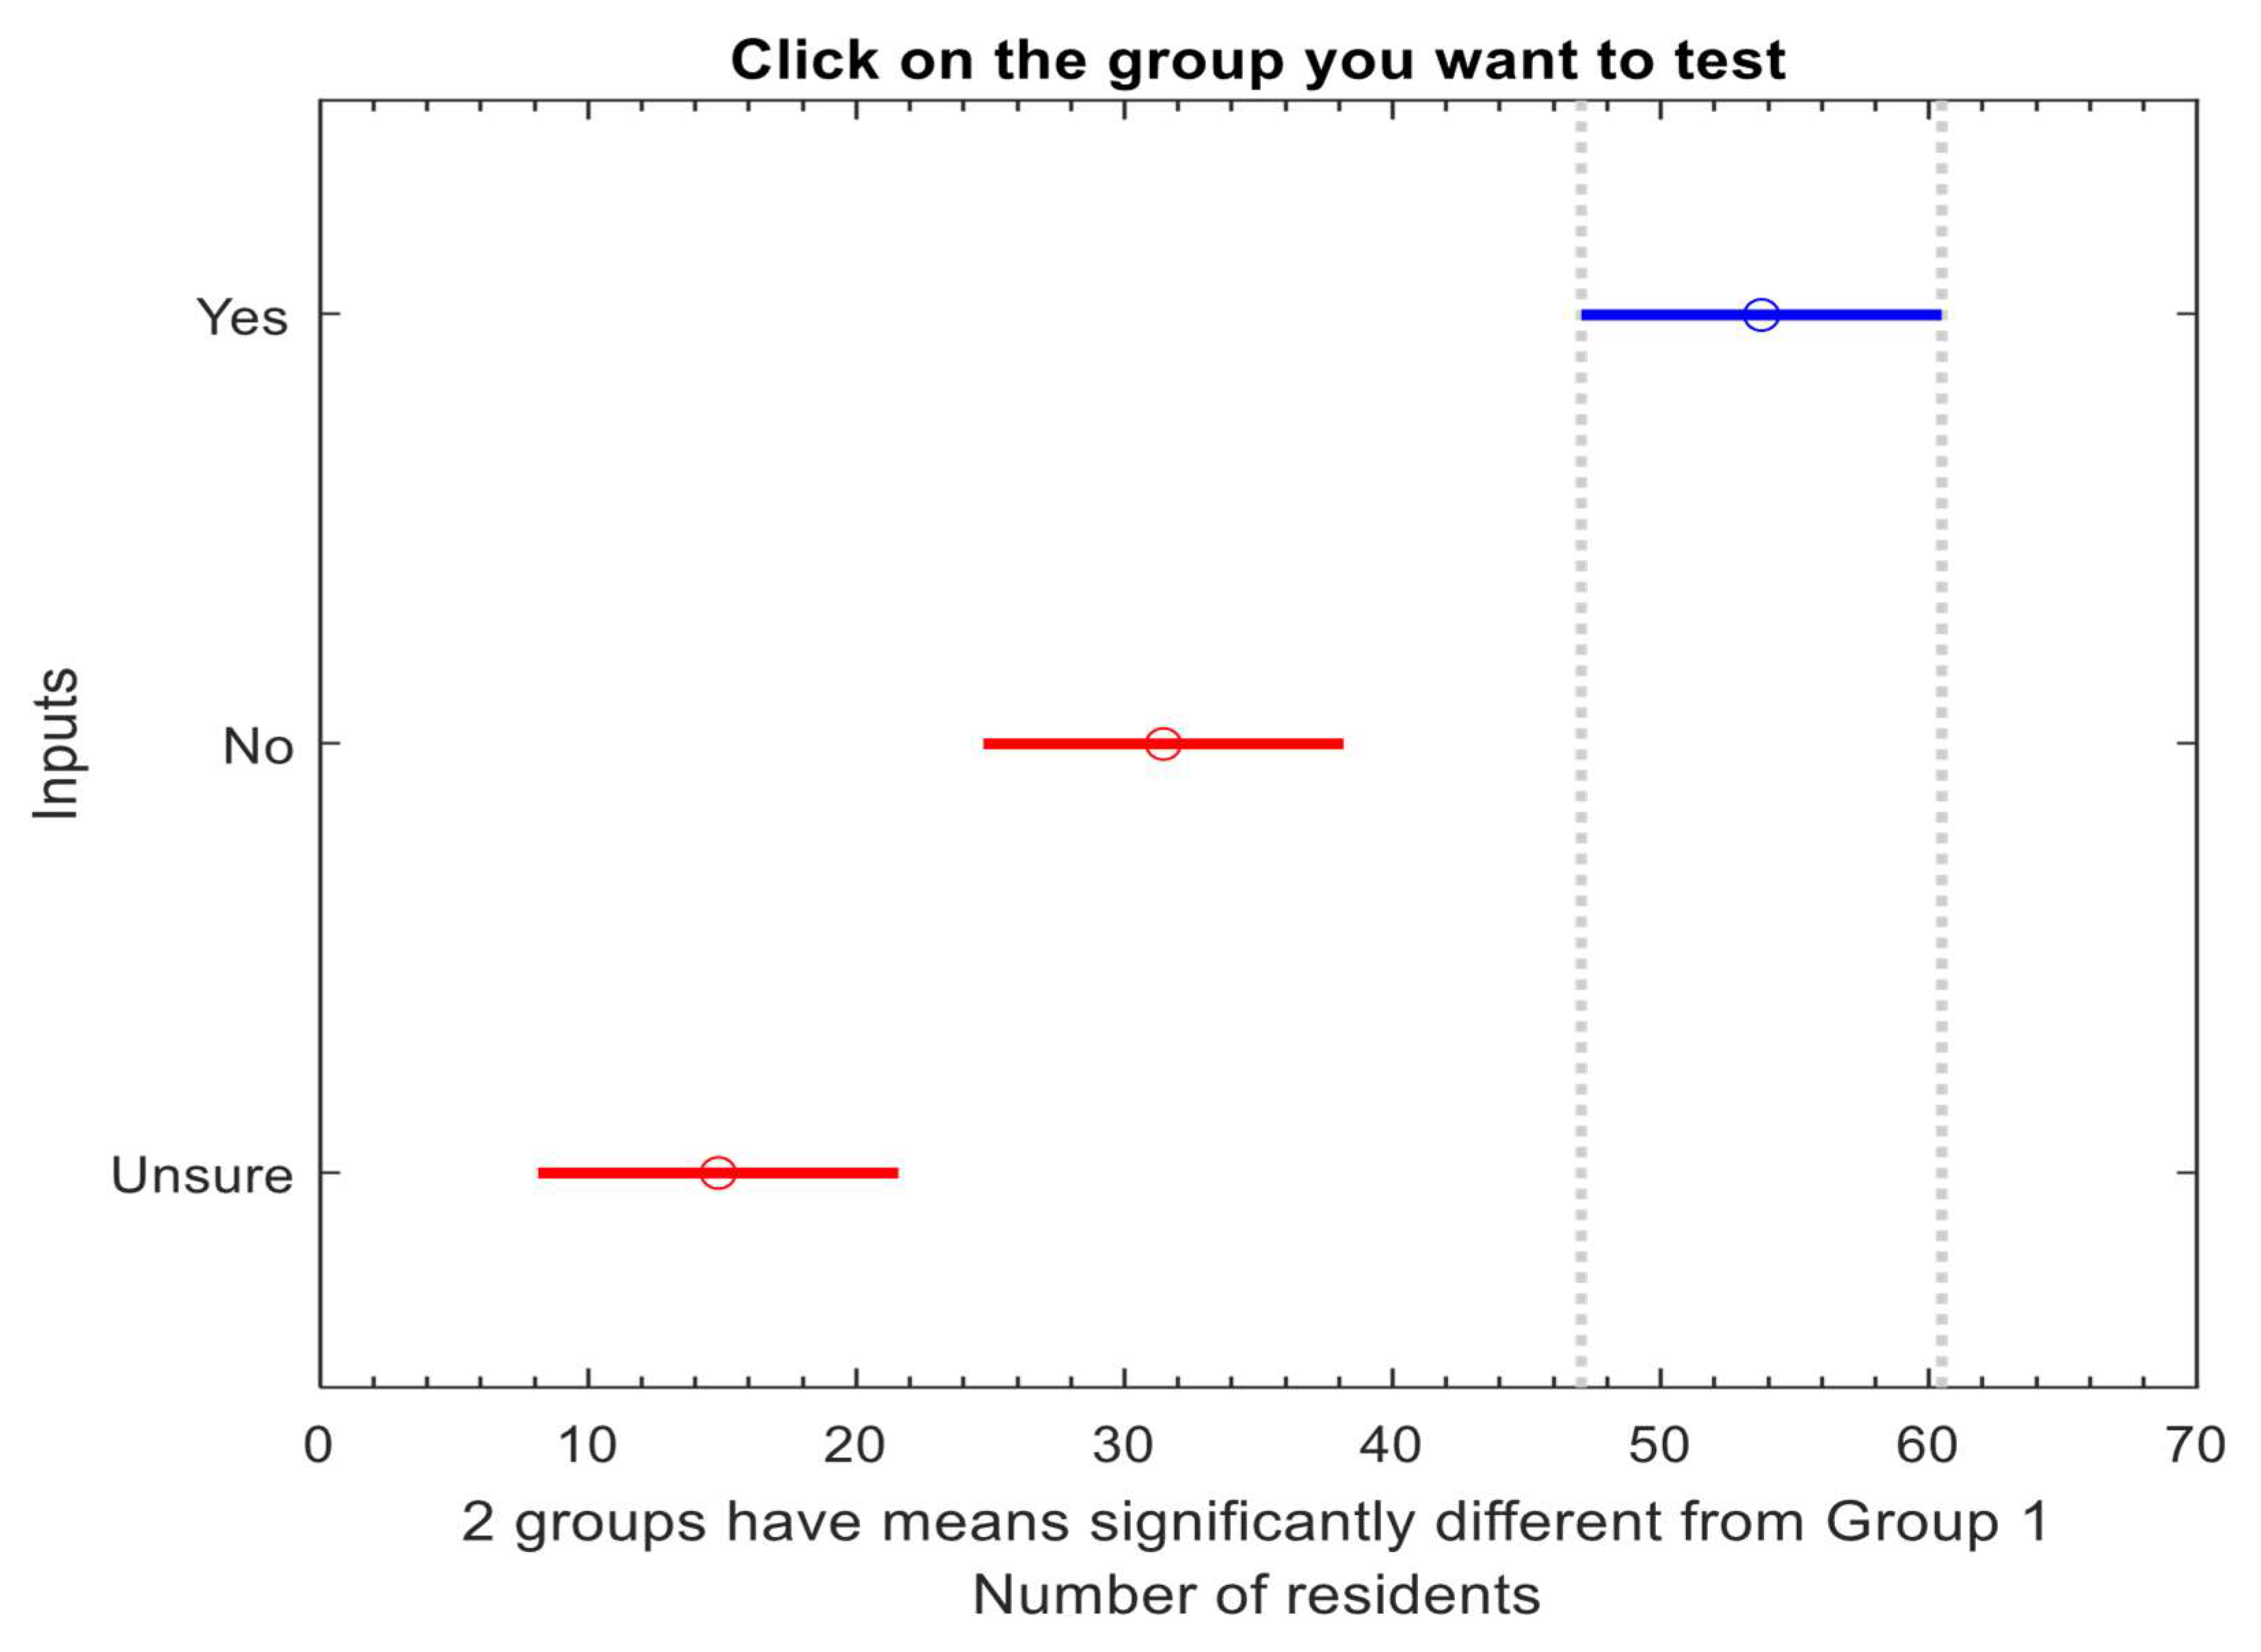
10.3. The One-Way ANOVA Test for the Inputs on Encroachment Risk
10.4. Multiple Comparisons Among Groups
10.5. Relief Tests Used in the Rankings of the Inputs
10.6. Training Neural Network Using Input and Output Datasets
10.7. The ANOVA to Confirm the Accuracy of the Artificial Neural Network Model
11. Policy and Practical Relevance
12. Discussion and Conclusions
13. Recommendations
13.1. Predicting Encroachment
13.2. Mitigating Infrastructure Vandalism
13.3. Education and Training of Local Communities
- Artificial intelligence, such as Gamified apps and simulations, to educate residents on how encroachment and vandalism impact services.
Author Contributions
Funding
Data Availability Statement
Acknowledgments
Conflicts of Interest
Appendix A. Detailed Mathematical Formulas
Appendix A.1. Sample Size Determination
Appendix A.2. Correlation and Determination Coefficients
Appendix A.3. Model Accuracy: Root Mean Square Error (RMSE)
Appendix A.4. ReliefF Algorithm Equations
- ➢
- If and are in the same class, then Equation (A6) is applied
- ➢
- If and are in different classes, then Equation (A7) is employed
- ➢
- For the discrete, the equation is expressed as in Equation (A8)
- ➢
- For the continuous the equation is expressed as in Equation (A9)
Appendix A.5. Statistical Significance (t-Test for Correlation Coefficient)
Appendix A.6. Neural Network Transfer Function
References
- United Nations Human Settlements Programme (UN-Habitat). World Cities Report 2022: Envisaging the Future of Cities; UN-Habitat: Nairobi, Kenya, 2022; Available online: https://unhabitat.org/wcr (accessed on 12 September 2022).
- Mackay, B.R.; Shaker, R.R. A megacities review: Comparing indicator-based evaluations of sustainable development and urban resilience. Sustainability 2024, 16, 8076. [Google Scholar] [CrossRef]
- Thakur, R.; Onwubu, S.C. Household waste management behaviour amongst residents in an informal settlement in Durban, South Africa. J. Environ. Manag. 2024, 349, 119521. [Google Scholar] [CrossRef]
- Mzinyane, B.; Ajodhia, S.; Gumbi, S.N.; Khumalo, G.; Nduli, S.B.; Mfishi, Z.; Funeka, N. An autoethnography of disaster response work with low-income communities in KZN: Implications for Afrocentric social work. J. Soc. Dev. Afr. 2024, 39, 42–67. [Google Scholar] [CrossRef]
- Burstall, M. Bulk Water Pipelines, 1st ed.; Thomas Telford: Oxford, UK, 1997. [Google Scholar]
- American Water Works Association. Advanced Hydraulic Modeling and Master Planning: A Water Distribution System Approach, 2nd ed.; American Water Works Association: Denver, CO, USA, 2012. [Google Scholar]
- Gleick, P.H. Water use. Environ. Resour. 2003, 28, 275–314. [Google Scholar] [CrossRef]
- Shaker, R.R.; Rybarczyk, G.; Brown, C.; Papp, V.; Alkins, S. (Re)emphasizing urban infrastructure resilience via scoping review and content analysis. Urban Sci. 2019, 3, 44. [Google Scholar] [CrossRef]
- Shaker, R.R.; Aversa, J.; Papp, V.; Serre, B.M.; Mackay, B.R. Showcasing relationships between neighborhood design and wellbeing: Toronto indicators. Sustainability 2020, 12, 997. [Google Scholar] [CrossRef]
- Andreou, S.A. Maintenance decisions for deteriorating water pipelines. J. Pipelines 1987, 7, 21–31. [Google Scholar]
- Pandey, M.; Senapati, S.; Bhunia, G.S. Chapter 27—GIS-based modelling for water resource monitoring and management: A critical review. Dev. Environ. Sci. 2024, 16, 621–636. [Google Scholar] [CrossRef]
- Shui, C.C. Enhancing the EPANET hydraulic model through genetic algorithm optimization of pipe roughness coefficients. Water Resour. Manag. 2024, 38, 323–341. [Google Scholar] [CrossRef]
- Ozegin, K.O.; Ilugbo, S.O.; Alile, O.M.; Iluore, K. Integrating in-situ data and spatial decision support systems (SDSS) to identify groundwater potential sites in the Esan plateau, Nigeria. Groundw. Sustain. Dev. 2024, 26, 101276. [Google Scholar] [CrossRef]
- Kumari, N.; Dhiman, R.; Krishnankutty, M.; Kalbar, P. Localising vulnerability assessment to urban floods: A comparative analysis of top-down and bottom-up geospatial approaches in Patna City, India. Int. J. Disaster Risk Reduct. 2024, 100, 10423. [Google Scholar] [CrossRef]
- Mavin, T. Predicting the Failure Performance of Individual Water Mains; Urban Water Research Association of Australia: Melbourne, Australia, 1996. [Google Scholar]
- Fu, G.; Jin, Y.; Sun, S.; Yuan, Z.; Butler, D. The role of deep learning in urban water management: A critical review. Water Res. 2022, 223, 119090. [Google Scholar] [CrossRef]
- Joseph, K.; Shetty, J.; Sharma, A.K.; van Staden, R.; Wasantha, P.L.P.; Small, S.; Bennett, N. Leak and burst detection in water distribution network using logic- and machine-learning-based approaches. Water 2024, 16, 1935. [Google Scholar] [CrossRef]
- Dawood, T.; Elwakil, E.; Novoa, H.M.; Gárate Delgado, J.F. Water pipe failure prediction and risk models: State-of-the-art review. Can. J. Civ. Eng. 2019, 47, 1117–1127. [Google Scholar] [CrossRef]
- Shi, L.; Zhang, J.; Yu, X.; Fu, D.; Zhao, W. Artificial neural network-based water distribution scheme in real-time in long-distance water supply systems. Water Infrastruct. Ecosyst. Soc. 2024, 73, 1611–1620. [Google Scholar] [CrossRef]
- Dawadi, S. Impact of the Secondary Education Examination (English) on Students and Parents in Nepal; The Open University: Kent, UK, 2019. [Google Scholar]
- Fox, A.; Ziervogel, G.; Scheba, S. Strengthening community-based adaptation for urban transformation: Managing flood risk in informal settlements in Cape Town. Int. J. Justice Sustain. 2023, 28, 837–851. [Google Scholar] [CrossRef]
- Creswell, J.W.; Plano Clark, V.L. Designing and Conducting Mixed Methods Research, 3rd ed.; Sage: Thousand Oaks, CA, USA, 2018. [Google Scholar]
- Denzin, N.K. The Research Act: A Theoretical Introduction to Sociological Methods, 2nd ed.; McGraw-Hill: New York, NY, USA, 1978. [Google Scholar]
- Daniel, W.W. Biostatistics: A Foundation for Analysis in the Health Sciences, 7th ed.; Wiley: New York, NY, USA, 1999. [Google Scholar]
- Cochran, W.G. Sampling Techniques, 3rd ed.; John Wiley & Sons: New York, NY, USA, 1977. [Google Scholar]
- Esen, E.; Inalhan, G.; Atrek, B. A hybrid research method integrating qualitative and quantitative techniques for airport terminal evaluation. J. Air Transp. Manag. 2017, 61, 1–9. [Google Scholar] [CrossRef]
- Ponto, J. Understanding and evaluating survey research. J. Adv. Pract. Oncol. 2015, 6, 168. [Google Scholar]
- Taherdoost, H. Designing a questionnaire for a research paper: A comprehensive guide to design and develop an effective questionnaire. Asian J. Manag. Sci. 2022, 11, 8–16. [Google Scholar] [CrossRef]
- Noble, H.; Smith, J. Issues of validity and reliability in qualitative research. Evid.-Based Nurs. 2015, 18, 34–35. [Google Scholar] [CrossRef]
- Vosloo, J.J. A Sport Management Programme for Educator Training in Accordance with the Diverse Needs of South African Schools. Ph.D. Thesis, North-West University, Potchefstroom, South Africa, 2014. [Google Scholar]
- De Vos, A.S.; Strydom, H.; Fouché, C.B.; Delport, C.S.L. Research at Grass Roots: For the Social Sciences and Human Services Professions, 4th ed; Van Schaik Publishers: Pretoria, South Africa, 2011. [Google Scholar]
- Braun, V.; Clarke, V. Successful Qualitative Research: A Practical Guide for Beginners; SAGE Publications: Thousand Oaks, CA, USA, 2013. [Google Scholar]
- Ndawo, M. Developing a Management Framework for Protecting Critical Water Infrastructure Against Informal Settlement Encroachment in the City of Ekurhuleni. Unpublished Ph.D. Thesis, MANCOSA, Durban, South Africa, 2025. [Google Scholar]
- Cooksey, R.W.; Cooksey, R.W. Descriptive statistics for summarising data. In Illustrating Statistical Procedures: Finding Meaning in Quantitative Data; Springer: Singapore, 2020; pp. 61–139. [Google Scholar]
- Kim, T.K. Understanding one-way ANOVA using conceptual figures. Korean J. Anesthesiol. 2017, 70, 22. [Google Scholar] [CrossRef]
- Chen, B.; Sun, X.; Wei, Y.; Liu, J. Application of one-way ANOVA in educational research: A practical guide. J. Educ. Stat. Meas. 2022, 5, 45–58. [Google Scholar]
- Lakens, D. The practical alternative to the p value is the correctly used p value. Perspect. Psychol. Sci. 2021, 16, 639–648. [Google Scholar] [CrossRef]
- Lee, S.W. Methods for testing statistical differences between groups in medical research: Statistical standard and guideline of Life Cycle Committee. Life Cycle 2022, 2, e1. [Google Scholar] [CrossRef]
- Petković, M.; Kocev, D.; Džeroski, S. Feature ranking for multi-target regression. Mach. Learn. 2020, 109, 1179–1204. [Google Scholar] [CrossRef]
- Di Leo, G.; Sardanelli, F. Statistical significance: P value, 0.05 threshold, and applications to radiomics—Reasons for a conservative approach. Eur. Radiol. Exp. 2020, 4, 18. [Google Scholar] [CrossRef] [PubMed]
- Purnama, I. Increasing understanding of one-way ANOVA material for accounting students: A case study of deposit interest. Reflect. Educ. Pedagog. Insights 2023, 1, 69–73. [Google Scholar]
- Sri, P.; Kumar, A.; Reddy, V. Impact of training data volume on the accuracy of machine learning models: A comparative study. J. Artif. Intell. Res. Dev. 2023, 12, 55–68. [Google Scholar]
- Koliousis, A.-s.B. Artificial intelligence and policy making; can small municipalities enable digital transformation? Int. J. Prod. Econ. 2024, 274, 109324. [Google Scholar] [CrossRef]
- Abdel Aziz, K.M.; Daoud, A.O.; Singh, A.K.; Alhusban, M. Integrating digital mapping technologies in urban development: Advancing sustainable and resilient infrastructure for SDG 9 achievement—A systematic review. Alex. Eng. J. 2025, 116, 512–524. [Google Scholar] [CrossRef]
- United Nations Human Settlements Programme (UN-Habitat). Urbanization and Development: Emerging Futures (World Cities Report 2016); UN-Habitat: Nairobi, Kenya, 2016; Available online: https://unhabitat.org/world-cities-report (accessed on 26 March 2024).
- Chumo, I.; Kabaria, C.; Oduor, C.; Amondi, C.; Njeri, A.; Mberu, B. Community advisory committee as a facilitator of health and wellbeing: A qualitative study in informal settlement in Nairobi, Kenya. Front. Public Health 2023, 10, 47133. [Google Scholar] [CrossRef] [PubMed]


| ANOVA Table | |||||
|---|---|---|---|---|---|
| Source | SS | df | MS | F | Prob > F |
| Columns | 15,240.4 | 2 | 7620.2 | 24.45 | 2.15 × 10⁻⁸ |
| Error | 17,765.3 | 57 | 311.67 | ||
| Total | 33,005.7 | 59 |
| Samples | MSE | R | |
|---|---|---|---|
| Training | 10 | 5.59 × 10⁻⁸ | 0.999 |
| Validation | 5 | 1.082 | 0.990 |
| Testing | 5 | 3.09 | 0.965 |
| Source | Sum of Square (SS) | Degree of Freedom (df) | Mean Square (MS) | F-Statistic | Prob > F |
|---|---|---|---|---|---|
| Columns | 0.09 | 1 | 0.0876 | 0.0 | 0.9609 |
| Error | 1366.53 | 38 | 35.9613 | ||
| Total | 1366.62 | 39 |
Disclaimer/Publisher’s Note: The statements, opinions and data contained in all publications are solely those of the individual author(s) and contributor(s) and not of MDPI and/or the editor(s). MDPI and/or the editor(s) disclaim responsibility for any injury to people or property resulting from any ideas, methods, instructions or products referred to in the content. |
© 2025 by the authors. Licensee MDPI, Basel, Switzerland. This article is an open access article distributed under the terms and conditions of the Creative Commons Attribution (CC BY) license (https://creativecommons.org/licenses/by/4.0/).
Share and Cite
Ndawo, M.N.; Dzansi, D.; Tangwe, S.L. Analysis of Residents’ Understanding of Encroachment Risk to Water Infrastructure in Makause Informal Settlement in the City of Ekurhuleni. Urban Sci. 2025, 9, 294. https://doi.org/10.3390/urbansci9080294
Ndawo MN, Dzansi D, Tangwe SL. Analysis of Residents’ Understanding of Encroachment Risk to Water Infrastructure in Makause Informal Settlement in the City of Ekurhuleni. Urban Science. 2025; 9(8):294. https://doi.org/10.3390/urbansci9080294
Chicago/Turabian StyleNdawo, Mpondomise Nkosinathi, Dennis Dzansi, and Stephen Loh Tangwe. 2025. "Analysis of Residents’ Understanding of Encroachment Risk to Water Infrastructure in Makause Informal Settlement in the City of Ekurhuleni" Urban Science 9, no. 8: 294. https://doi.org/10.3390/urbansci9080294
APA StyleNdawo, M. N., Dzansi, D., & Tangwe, S. L. (2025). Analysis of Residents’ Understanding of Encroachment Risk to Water Infrastructure in Makause Informal Settlement in the City of Ekurhuleni. Urban Science, 9(8), 294. https://doi.org/10.3390/urbansci9080294