Article

The Differential Impact of Human Capital on Social Integration Among Rural–Urban and Urban–Urban Migrants in China

Department of Social Work, College of International Education and Social Development, Zhejiang Normal University, Jinhua 321004, China
*
Author to whom correspondence should be addressed.
Urban Sci. 2025, 9(8), 292; https://doi.org/10.3390/urbansci9080292
Submission received: 5 June 2025 / Revised: 13 July 2025 / Accepted: 23 July 2025 / Published: 25 July 2025

Abstract

Differences exist between rural–urban migrants and urban–urban migrants in terms of human capital’s accumulation and pathways of social integration, yet few studies have systematically compared these distinctions. Based on the CMDS2017 survey data, this study constructed a comprehensive social integration index across four dimensions—economic integration, behavioral adaptation, identity recognition, and psychological assimilation—to analyze the influencing factors and decompose the disparities in social integration levels between the two groups from a human capital perspective. Using Oaxaca mean decomposition and Machado–Mata (MM) quantile decomposition, the results indicated that urban–urban migrants exhibited higher social integration levels than rural–urban migrants, with human capital significantly influencing integration outcomes. Better education, health status, longer migration duration, and more work experience positively enhanced migrants’ social integration. Human capital accounted for 38.35% of the social integration gap between the two groups, while coefficient differences were the primary driver of disparities. The returns to education diminish at higher integration levels, suggesting education played a stronger role for those with lower integration. The social integration gap between the two groups followed an inverted U-shaped trend, with smaller disparities at higher quantiles. As integration levels rose, characteristic differences declined continuously, indicating convergence toward homogeneity among high-integration migrants. These research findings indicated that the improvement in the social integration level of migrants still requires continuous investment in cultivating the human capital of migrants.

1. Introduction

Large-scale population mobility has driven economic transformation and urbanization, but the social integration of migrants remains a significant challenge. China’s dynamic monitoring survey of migrants showed that the proportion of agricultural household migrants consistently exceeded 80% between 2012 and 2017. Existing research largely focuses on the urbanization process of rural-to-urban migrants, highlighting the institutional barriers they face, such as the “hidden hukou wall”, and indicating that their social integration directly affects their settlement intentions [1,2]. However, with the deepening of urbanization, the scale of inter-urban migration has continued to expand, and these migrants, with their higher incomes, education levels, and skill sets, have exhibited social integration characteristics that differ from rural-to-urban migrants [3,4,5]. A comparative study of the social integration differences between the two types of migrants might provide new insights for improving the social integration of rural-to-urban migrants. Understanding these differential effects is essential for policymakers to design targeted interventions that promote equitable social integration, reduce urban disparities, and foster inclusive development. This study addresses this gap by examining how human capital influences social integration differently for rural–urban and urban–urban migrants, providing insights for more effective migration and urbanization policies in China.

2. Literature Review

2.1. Social Integration

Theories of social integration can be categorized into traditional and non-traditional schools. The traditional perspective, pioneered by the Chicago School, emphasized the interaction between immigrants and their destination communities, proposing a three-stage model of “settlement–adaptation–assimilation” and using identity consciousness, life satisfaction, and attitudes toward the destination as measures of psychological integration [6,7]. In contrast, non-traditional theories highlighted the diversity of integration, including multiculturalism, segmented assimilation, and the spiral model [8,9,10,11].
In the Chinese context, the concept of social integration has undergone localization, resulting in theories such as re-socialization, progressive integration, and interactive integration [12,13,14,15]. Although there has been no unified consensus on the dimensions of social integration in academia, it has generally encompassed core elements such as economic, cultural, identity, and psychological integration [4,16,17]. Notably, “social integration” and “social cohesion” were often used interchangeably, but Yang pointed out a fundamental difference: social cohesion emphasizes bidirectional cultural permeation, while social integration reflects the unidirectional integration of migrants into the mainstream society [15]. Given the unique characteristics of China’s migrants—primarily driven by the hukou system rather than cultural conflicts, and oriented towards pursuing a better life—this study adopted Yang’s definition, which posited that social integration referred to the process whereby migrants are incorporated into the mainstream social system of their destination areas across economic, behavioral, cultural, and ideological dimensions [15], and which operationalized social integration into four dimensions: economic integration (family income and perceived income difficulties), behavioral adaptation (adaptation to local customs and hygiene habits), psychological integration (willingness to actively integrate and perceived attitudes of locals), and identity (sense of belonging to the local community, desire for household registration, and settlement intentions).

2.2. Human Capital and Migrants’ Integration

Human capital theory suggests that human capital investment includes five types: physical health, education level, non-formal education, training, and migration. Among them, education plays a significant role in the formation of human capital and economic development [18]. Furthermore, Denison’s quantitative study of US economic growth found that human capital significantly promoted economic growth [19]. Based on previous research, Becker focused on the relationship between on-the-job training and income when analyzing human capital, proposing that human capital investment could positively predict income distribution [20]. Mincer further clarified the relationship between individual income and the amount of training received using the principle of compensating differentials [21].
Human capital represents an individual migrant’s ability to integrate into society and also influences their level of social integration [22]. Individuals with higher levels of human capital have more opportunities to interact with residents of the destination location in their work, thereby enhancing their sense of identity in the destination [23]. The human capital of migrants could have a significant positive impact on their economic integration in terms of education level, knowledge of labor law, frequency of migration, skill training, and length of employment [24]. Other scholars found that vocational training could significantly improve the economic, social, and psychological dimensions of migrant integration, and training with skills as its main content and with the destination government and employers as the main training providers was most effective in improving urban integration [25]. For migrants, both formal education received before migration and work experience gained after migration were important factors that significantly promoted their social integration [26].
Migration is another source of human capital and a significant manifestation of human capital investment, promoting higher levels of social integration [27]. The spatiotemporal characteristics of migration and previous migration experiences could influence the size and composition of the social support network of migrants, narrowing the cultural gap between urban and rural areas, expanding the emotional support network to a certain extent, and promoting the integration of migrants into cities [28]. Other studies showed that the educational level and work experience (length of time since the migrant left their registered residence) of non-agricultural migrant workers yielded higher economic returns than those of local urban workers [29]. Some scholars measured the human capital of migrants in terms of formal education (education level), vocational training, labor skills (possession of technical titles or qualifications), and work experience (number of years in the current position and age) and found that human capital had the greatest impact on the economic integration of migrants and the least impact on cultural integration [26].
Generally, the impact of human capital on social integration could be broadly categorized into three pathways:
(1) Economic Pathway: Promoting Social Integration through Improved Labor Market Status. Human capital directly influences an individual’s competitiveness in the labor market, manifested in higher earnings, more stable employment, and a lower risk of unemployment [20]. A higher level of human capital (such as education and occupational skills) enables migrant workers to enter higher-quality labor market positions, thereby gaining economic resources. This resource advantage facilitates the social integration of migrant workers in the economic sphere, such as narrowing the income gap with local residents, increasing tax contributions, and further promoting a economic sense of belonging and status identity. Zhao’s study showed that among rural–urban migrants in China, there was a strong correlation between education level and income level, and migrant workers with higher education levels were more likely to obtain stable urban jobs, thereby achieving economic integration [30]. Borjas pointed out that individuals with higher education levels in immigrant groups had incomes and an employment quality closer to those of local residents, helping to improve their economic integration [31].
(2) Social Network Pathway: Promoting Social Integration through Expanded Social Interactions. Human capital not only enhances an individual’s ability to work but also affects their capacity for social interactions and scope. Individuals with higher levels of education typically possess stronger language skills, social skills, and cultural adaptation abilities, making it easier for them to establish and maintain social networks [32]. Such social networks could provide social support, information resources, and cultural adaptation guidance, thereby promoting interaction and trust between migrant workers and local residents. Liu & Guo’s study of rural–urban migrants in China found that migrant workers with higher levels of education were more likely to participate in community activities, establish social connections with local residents, and had more extensive social networks, thereby promoting social integration [33]. Esser argued that social capital (acquired through social networks) was an important mechanism for immigrants to achieve social integration, and education level was a crucial prerequisite for the accumulation of social capital [34].
(3) Cultural Identity Pathway: Promoting Social Integration through Reducing Cultural Differences. Human capital also affects an individual’s ability to accept cultures and adapt to urban life. Higher levels of education and language skills enable migrant workers to more easily understand and accept the mainstream culture of the city, thereby narrowing the cultural gap with local residents [35]. This cultural adaptation and identity is an important psychological foundation for social integration. Knight & Song’s study showed that rural–urban migrants with higher cultural levels and a proficiency in Mandarin were more likely to accept mainstream values in cities and reduce the isolation caused by cultural differences [36]. Nielsen & Smyth found that individuals with higher levels of education were more likely to trust and accept heterogeneous cultures and could strengthen their sense of belonging to the urban community through psychological identification [37].

2.3. Differences in the Impact of Human Capital on Social Integration Between Rural–Urban and Inter-Urban Migrants

(1) Differences in Economic Integration. Rural–urban migrants’ insufficient human capital directly leads to their disadvantaged position in the labor market. Moreover, rural–urban migrants are often excluded from social security systems, further exacerbating their economic difficulties [38]. In contrast, inter-urban migrants, due to their higher levels of education and occupational skills, are able to quickly enter the mainstream urban labor market and engaged in high-paying jobs. Scholars found that the income levels of inter-urban migrants were close to those of local residents, and their improved economic status laid the foundation for their social integration in other dimensions [39,40,41,42].
(2) Differences in Social Interaction. The social networks of rural–urban migrants are mostly limited to their fellow villagers, and their range of social interactions is narrow. This “in-group” interaction pattern limits their opportunities for interactions with local residents [33]. In addition, rural–urban cultural differences and social discrimination have a negative impact on the social interactions of rural–urban migrants [36]. Inter-urban migrants, due to their similar occupational and cultural backgrounds, are more likely to establish cross-city social networks. They often form deep relationships with local residents through workplaces, community activities, and other platforms. The accumulation of this social capital further promotes their social integration [43].
(3) Differences in Cultural Identity. Rural–urban migrants face greater obstacles in terms of cultural identity due to the significant differences between rural and urban cultures. Knight and Song [36] pointed out that rural–urban migrants often feel “othered” in urban life, and this psychological rejection further weakens their sense of belonging to the city. Inter-urban migrants face relatively smaller obstacles in terms of cultural identity. Due to the cultural similarities between cities, inter-urban migrants can adapt to the lifestyles and values of the new city more quickly. Studies showed that they usually retain emotional ties to their original city, while gradually accepting the culture of the city they migrate to [44].
Academically, research on migrants has evolved in its focus, with much of the existing work analyzing the social integration of rural-to-urban migrant workers. However, with rapid economic development, the proportion of urban-to-urban migrants has increased. While there has been some recent attention to the social integration of urban-to-urban migrants, these studies generally only analyzed basic demographic characteristics, lacking in-depth comparative research between the two groups. Furthermore, even the few studies that noted a higher level of social integration among urban-to-urban migrants, compared to rural-to-urban migrants under similar conditions, merely included this as an independent variable in model analyses. Alternatively, they focused on single-dimensional differences in settlement intentions between urban-to-urban and rural-to-urban migrants. These studies lacked a simultaneous comparison of the two groups and did not delve into the mechanisms behind their differing levels of social integration.
This study employs data from the 2017 China Migrant Dynamic Survey and utilizes Stata 16 software for its statistical analysis. Initially, this study provides a descriptive analysis of the basic characteristics of the two types of migrants. Subsequently, linear regression analysis was conducted to examine the factors influencing social integration among both groups. A decomposition of mean differences was employed to compare the disparities in the impact of these factors on social integration between the two types of migrants. Finally, quantile regression was applied to analyze the varying effects of these factors on social integration at different quantiles, aiming to provide empirical evidence and policy implications for enhancing the level of social integration among migrants.

3. Data, Measurement, and Method

3.1. Data Source

The data for this study was derived from the 2017 China Migrants Dynamic Survey (CMDS) released by the National Health Commission. The CMDS was a nationwide sample survey of migrants, covering 31 provinces (autonomous regions and municipalities directly under the Central Government) and the Xinjiang Production and Construction Corps. The survey collected information on the basic demographics of migrants and their family members, migration scope and trends, employment and social security, income and residence, basic public health services, child migration and education, and social integration. With a sample size of 170,000, the survey provides a comprehensive understanding of migrants and is well-suited to the design of the current study.
Given that this research focused on the level of social integration of different migrants based on household registration status during China’s urbanization process, the study population was limited to migrants who resided in the destination location for one month or more, were 15 years of age or older, and did not have a local household registration (district, county, or city). Additionally, those with agricultural household registrations were defined as rural-to-urban migrants, while those with non-agricultural, agricultural-to-urban resident, and urban resident registrations were defined as inter-urban migrants.

3.2. Measurement

3.2.1. Dependent Variable

The dependent variable was the level of social integration. The level of social integration of migrants was measured from four dimensions: economic integration, behavioral adaptation, identity, and psychological integration. Specifically, in terms of economic integration, the monthly net income of a household was obtained by subtracting the average monthly total expenditure from the average monthly total income of the household, and then the natural logarithm of this value was taken. Additionally, the question “In this locality, does your family have any difficulty with a too low income?” in the questionnaire was used to measure the perception of income difficulties, with “Yes” coded as 0 and “No” coded as 1. In terms of behavioral adaptation, the questions “It was more important for me to follow my hometown customs” and “My hygiene habits are very different from those of local citizens” in the questionnaire were used to measure the level of behavioral adaptation of migrants in the local area. When coding, the scores were reversed, with “strongly disagree” scored as 4 and “strongly agree” scored as 1. In terms of identity, the level of identity was measured by measuring migrants’ willingness to obtain a local household registration, willingness to settle down, and their perception of being identified as a local. In terms of psychological integration, this study mainly measured the psychological integration of migrants by asking whether they were willing to integrate with local people, whether they felt that local people were willing to accept them, and whether they felt that local people looked down on outsiders. Referencing previous studies [45], all data was adjusted to positive indicators, and the multi-dimensional integration scores were standardized and summed to form a comprehensive social integration index and sub-dimensional indicators, with a range of 0–100. When constructing a comprehensive index of social integration, we weighted it based on the importance of each of the four dimensions in the index, thus avoiding the masking of differences among the dimensions. A higher score indicated a higher level of social integration for migrants.

3.2.2. Independent Variables

The core independent variable was human capital. This study primarily measured the human capital of migrants in four dimensions: years of education, self-rated health, duration of migration, and total work experience (Table 1). First, the level of education was converted into years of education and recoded as follows: no schooling = 1, primary school = 6, middle school = 9, high school/secondary technical school = 12, junior college = 15, undergraduate = 16, postgraduate = 19. Second, the question “How is your health condition?” was used to measure the health level of migrants, and the scores were reverse-coded, with higher scores indicating the better self-rated health of migrants. The operationalization of the work experience variable referred to Xie’s data processing method [29], reflecting it through total work experience and work experience accumulated after migration. Among them, total work experience was calculated by subtracting 6 and years of education from the age of the migrant population, and the work experience accumulated after migration was the total duration of the migrant population’s migration. The specific operationalization of indicators was as follows:

3.2.3. Control Variables

This research also controlled for the basic demographic characteristics of migrants. Specifically, following academic research practices, gender (with females as the reference group) and marital status (with unmarried as the reference group) were set as binary variables. Family background was an important influencing factor in the social integration of migrants. Some scholars paid attention to the fact that family migration could improve the level of social integration of migrants and was manifested in two mechanisms: “timely help” and “icing on the cake” [46]. At the same time, parental migration experience also affected the level of social integration. Therefore, given the availability of data, this study also controlled for family members accompanying the migration (with “no” as the reference group) and parental migration experience (with “no” as the reference group). When the number of co-resident family members was greater than 1, it was considered that there were family members accompanying the migration, and a value of 1 was assigned; otherwise, a value of 0 was assigned. For the question “Before your first migration/going out, did your parents have any experience of working or doing business outside?”, if either parent had a migration experience, the parental migration experience was assigned a value of 1; otherwise, it was assigned a value of 0. Industry type and unit type were also controlled in this study.

3.3. Method

3.3.1. Oaxaca–Blinder Decomposition

The Oaxaca–Blinder decomposition (OB decomposition) is a method for decomposing differences in group means [47]. By constructing a counterfactual group, OB decomposition cam decompose the difference in social integration levels of migrants into an explained component (characteristic differences) and an unexplained component (coefficient differences). First, the expression of social integration is simplified as follows:
Y = α +   β X +   μ
where
Y represents the social integration index for migrants; α is a constant term; X is the factors affecting social integration; β   is the coefficients of the factors; μ is the residual term.
By constructing a counterfactual group, we have
Y u Y r = Y u Y c + Y c Y r = β u ( X u X r ) + ( β u β r ) X r + α u α r  
where
u   represent inter-urban migrants, and r represents rural-to-urban migrants; Y u Y r   represents the difference in social integration between inter-urban and rural-to-urban migrants; β u ( X u X r ) represents the explained component, which indicates the difference caused by individual characteristics of migrants. In other words, inter-urban and rural-to-urban migrants have different levels of human capital, and this gap can be narrowed by changing the individual characteristics of the two groups. ( β u β r ) X r   represents the unexplained component, which indicates the difference caused by different effects of the same characteristics on social integration. That is, even if rural-to-urban migrants have the same level of human capital, their level of social integration is still lower than that of inter-urban migrants, and this gap cannot be easily narrowed by simply changing individual characteristics. For the sake of calculation, this paper used the two-stage decomposition method of OB decomposition, assuming an equal coefficient β*:
E Y u E Y r = E X u E X r β *   +   E X u β u β * + E X r β * β r
where
[ E ( X u ) E ( X r ) ] β * represents the characteristic difference; E X u β u β * + E X r β * β r   represents the coefficient difference; E Y u   and   E ( Y r ) represent the mean levels of social integration for inter-urban and rural-to-urban migrants, respectively; E X u   and E X r   represent the means of the factors affecting the social integration of inter-urban and rural-to-urban migrants, respectively.

3.3.2. Quantile Regression Model

Since OB decomposition is based on the conditional expectation of mean regression, it masks the differences between the two types of migrants in different distributions of social integration. At the same time, OLS models are easily affected by extreme values, and the regression results are not very robust. Therefore, this study also used quantile regression to further compare the differences between inter-urban and rural-urban migrants at different quantiles.
Q q ( Y i   |   x ) =   β q 0 + β q i X q i
where
X q i   is the social integration index; X q i   is various influencing factors; q   is the quantile; β q is the regression coefficients at the quantile.

3.3.3. Quantile Decomposition

This paper used the MM2005 decomposition method [48] to decompose the differences in social integration levels at different quantiles. Based on conditional quantile regression, this method obtains a consistent estimate of the unconditional distribution or marginal density function through probability integral transformation, and then it constructs a counterfactual distribution to decompose the differences in social integration levels at different quantiles, obtaining the changes in the effects of various factors at different quantiles. The decomposition equation is as follows:
Q u X u β ^ u q Q R X R β ^ R q = Q u X U β ^ U q Q M X R β ^ U q + Q M X R β ^ U q Q R X R β ^ R q
where
  Q u X u β ^ u q a n d   Q R X R β ^ R q represent the unconditional distributions of social integration for inter-urban and rural–urban migrants, respectively. Q M X R β ^ U q   is the counterfactual distribution, representing the level of social integration of rural-to-urban migrants who are considered as inter-urban migrants.   Q u X U β ^ U q Q M X R β ^ U q represents the characteristic difference, indicating the difference in the level of social integration caused by individual characteristic differences at the qth quantile; Q M X R β ^ U q Q R X R β ^ R q represents the coefficient difference, indicating the difference in the level of social integration caused by different returns of the same characteristic at the qth quantile.

4. Results

4.1. Comparative Analysis of Characteristics Between Inter-Urban and Rural-to-Urban Migrants

4.1.1. Individual Characteristics

As shown in Table 2, males accounted for 50.69% of the total sample of migrants, and married individuals made up 81.04%. Among inter-urban migrants, the proportion of males was slightly lower at 49.69%, while the proportion of married individuals was also slightly lower compared to rural-to-urban migrants. This indicates that among non-agricultural populations, married females are more likely to be migrant workers, whereas among agricultural populations, married males are more likely to be migrant workers.
Regarding family migration backgrounds, a significant proportion of migrants, regardless of their household registration type, had family members accompanying them, and most of their parents had a history of migration. Overall, 88.56% of the population had family members accompanying them, and 21.28% had parents with migration experience. Among rural-to-urban migrants, the proportion with family members accompanying them reached 88.93%, and the proportion with parents with migration experience reached 22.76%, which were 1.45% and 5.93% higher than those of inter-urban migrants, respectively.
In terms of occupational status, there were no significant differences in the distribution of the two types of migrants across the primary, secondary, and tertiary industries, which was generally consistent with the overall migrant population, accounting for 1.47%, 30.98%, and 67.54%, respectively. However, there were notable differences in terms of unit type. Specifically, the proportion of rural-to-urban migrants without a formal unit was 6.05% higher than that of inter-urban migrants. Moreover, rural-to-urban migrants were less likely to be employed in private enterprises (9.83% lower) or state-owned enterprises (10.71% lower) compared to inter-urban migrants. These findings suggested that the two types of migrants differed significantly in terms of the nature of their employment. The findings revealed substantial differences in the employment settings of the two migrant groups. Individuals employed in enterprises, particularly in management or technical roles, tend to have a stronger sense of organizational belonging. The more comprehensive wage systems and social security benefits often associated with these positions contribute to greater economic stability and higher income levels, thereby fostering their social integration.
In terms of human capital as shown in Table 3, the overall educational level of the sample was relatively low, with an average of 10.472 years. Self-rated health scored an average of 3.79, and the average total work experience and migration duration were 20.181 years and 11.125 years, respectively. Inter-urban migrants had a higher level of education, with an average of 12.410 years, compared to 9.809 years for rural-to-urban migrants. Conversely, rural-to-urban migrants had slightly more total work experience (20.365 years) and a slightly longer migration duration (11.211 years) compared to inter-urban migrants (19.653 years and 10.862 years, respectively). Both groups exhibited similar levels of self-rated health.

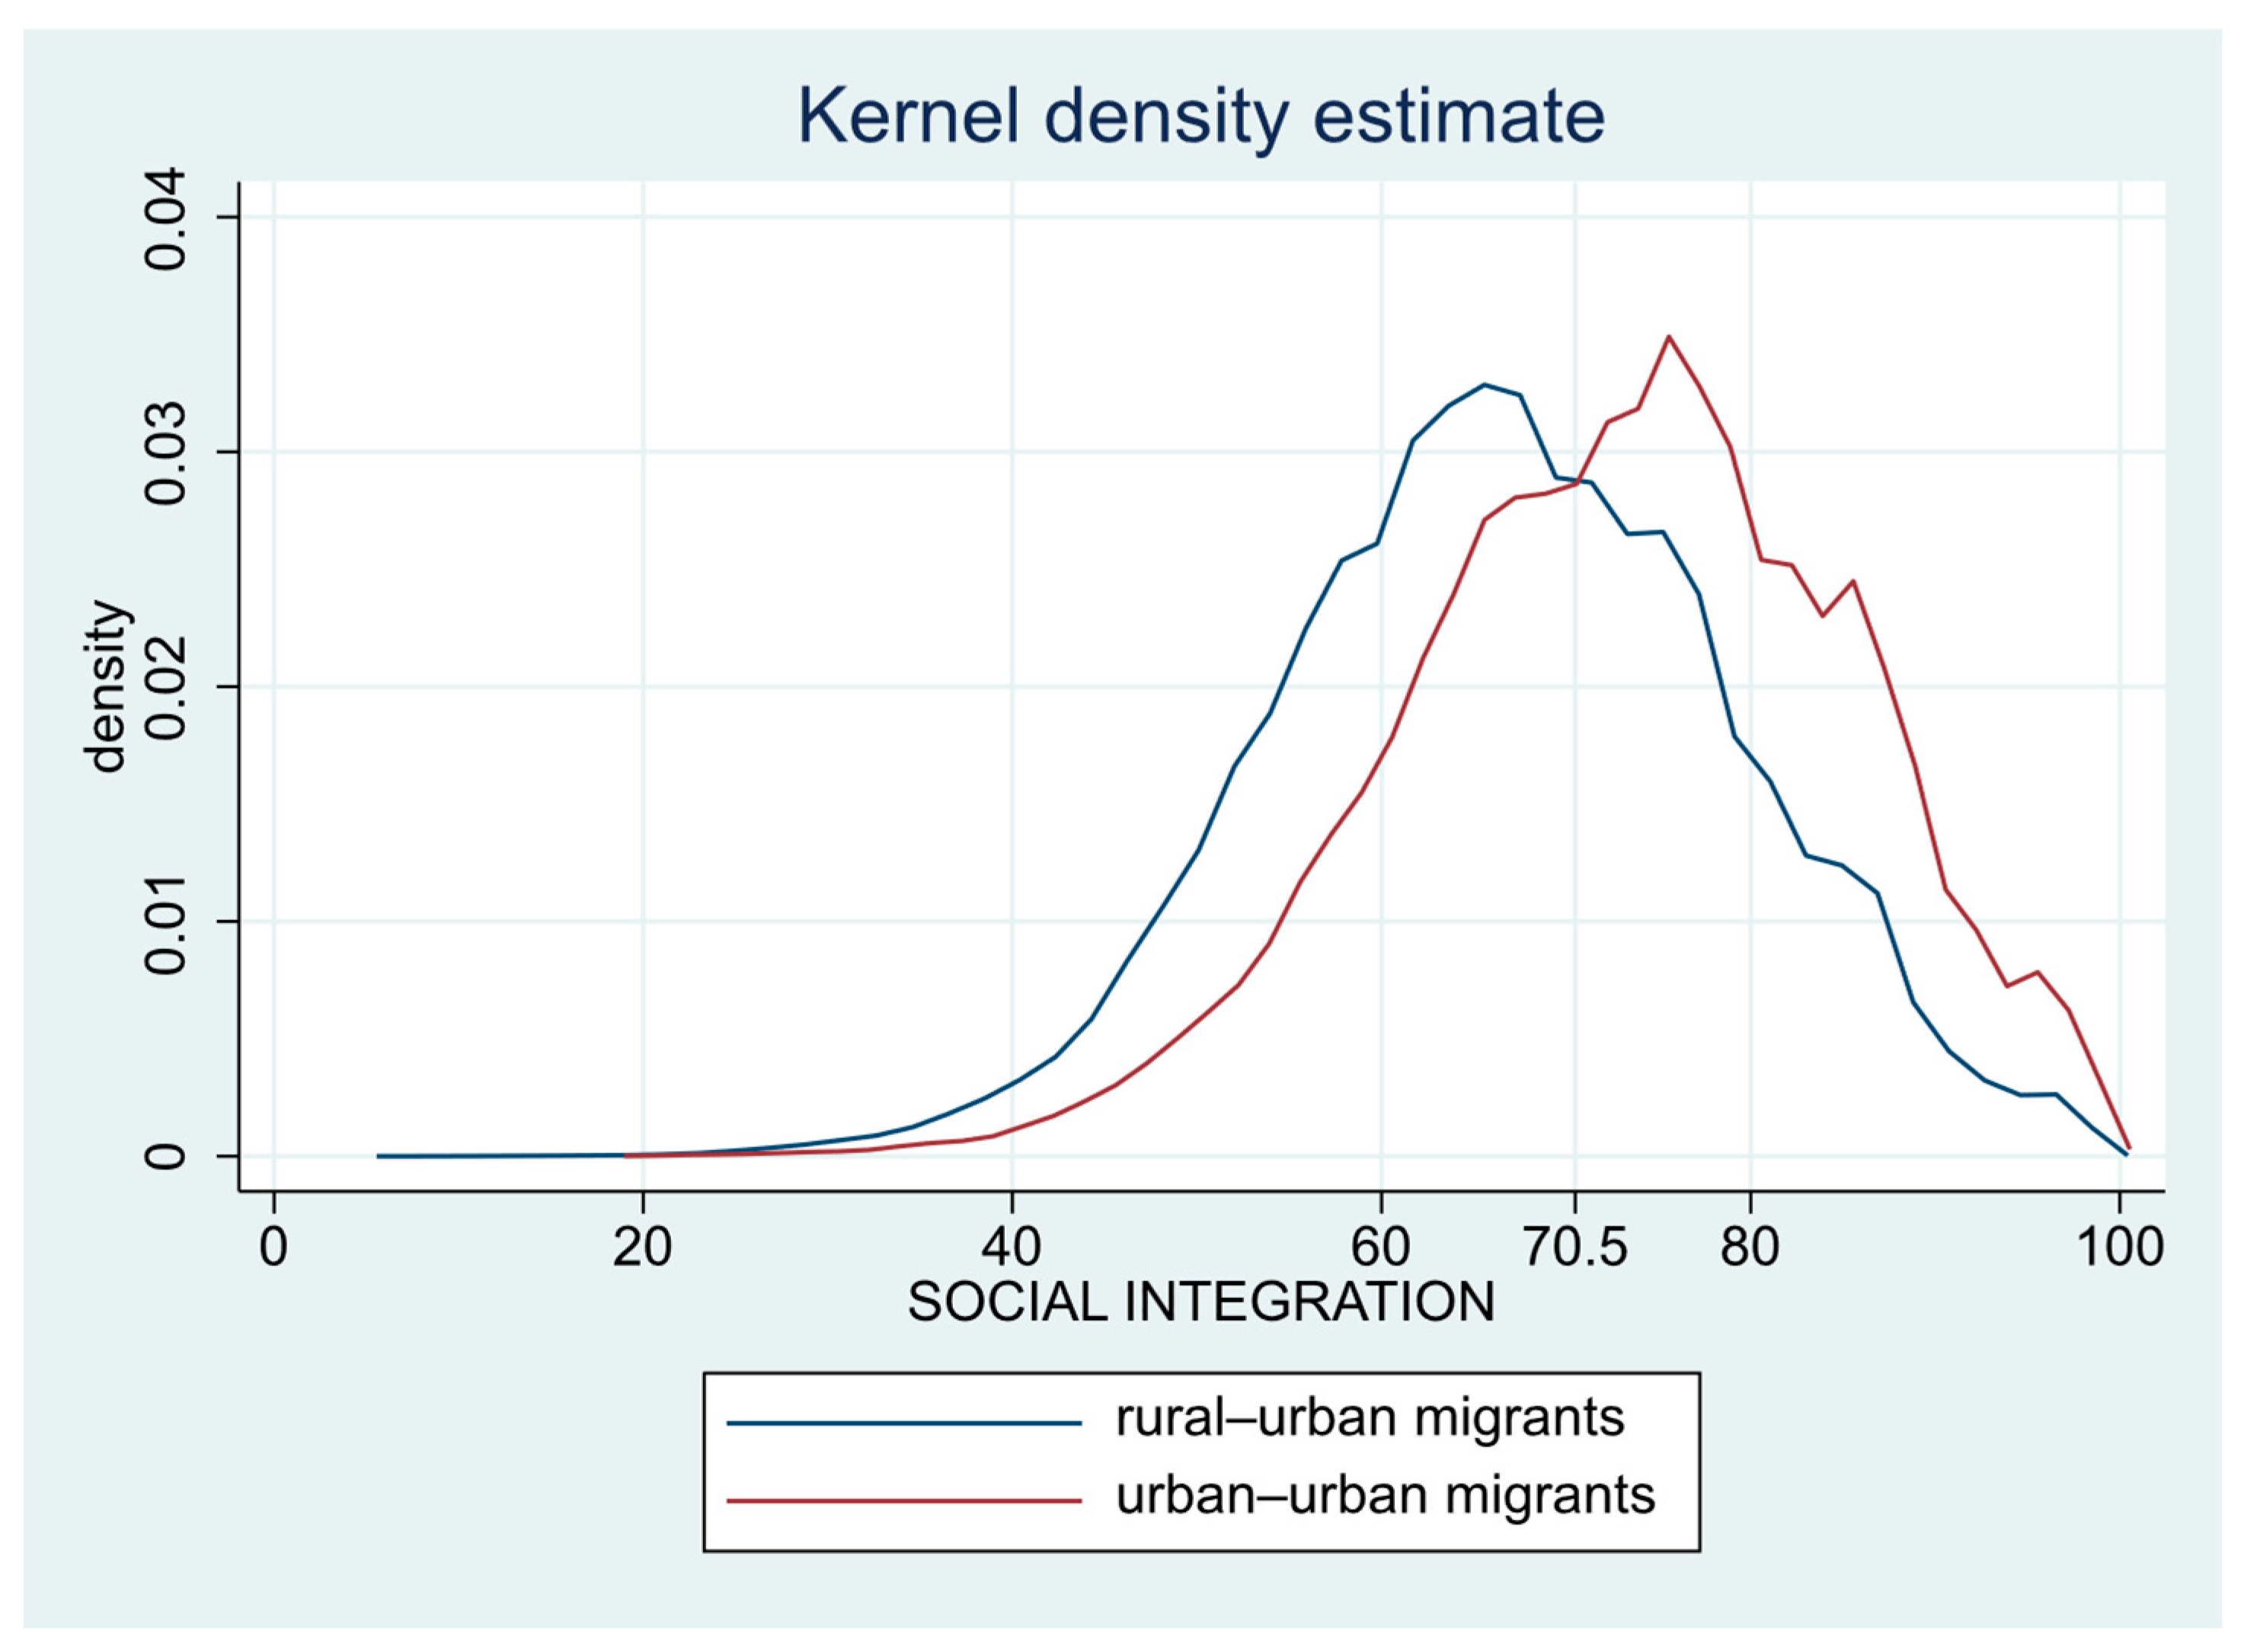
4.1.2. Comparison of Social Integration Levels Between Rural–Urban and Urban–Urban Migrants

The overall social integration level of the migrant population was not high, with a score of only 68.228. The average social integration score of rural–urban migrants was 66.571, while that of urban–urban migrants was 72.994, which was 6.423 points higher than the former. Further observation of the kernel density function plots (see Figure 1) revealed more intuitively that, compared with rural–urban migrants, urban–urban migrants had a clear advantage in their integration distribution. Specifically, urban–urban migrants had a higher proportion of distribution in the intervals with a higher social integration index, while rural–urban migrants had a higher proportion of distribution in the intervals with a lower social integration index. This reflected a significant difference in the social integration level between the two types of migrants, with a greater number of urban–urban migrants exhibiting higher levels of social integration than rural–urban migrants.

4.1.3. Cross-Analysis of Individual Characteristics and Social Integration

To further examine the differences in social integration levels between urban–urban and rural–urban migrants across different groups, this paper conducted a further cross-analysis (see Table 2).
Regarding individual characteristics, female migrants had a higher average social integration level than males, with differences of 0.516 and 0.414 observed in the two types of migrants, respectively. The difference in social integration levels between married and unmarried individuals was not significant in the overall migrant population. However, it exhibited different characteristics in the two migrant types. Among urban–urban migrants, married individuals scored 1.47 points higher than unmarried individuals, while among rural–urban migrants, married individuals scored 0.448 points lower than unmarried individuals.
Regarding family background, migrants with accompanying family members had a 0.481 higher social integration level than those without. The difference between having and not having accompanying family members was more pronounced among urban–urban migrants, with those with accompanying family members scoring 2.152 points higher than those without. In contrast, this difference was only 0.034 among rural–urban migrants. In the overall migrant population, migrants without parental migration experience has a higher social integration level. Urban–urban migrants without parental migration experience scored 0.75 points higher than those with such an experience, but rural–urban migrants without parental migration experience scored 0.476 points lower.
Regarding occupation, whether for the overall migrant population or urban–urban and rural–urban migrants, those engaged in primary industry had the highest social integration level, followed by those in tertiary industry. Among different employer types, state-owned enterprises had the highest social integration level, followed by private enterprises, self-employed individuals, and those without employment.

4.2. Regression Analysis of Factors Influencing Social Integration

This study focused on the relationship between human capital and the social integration of urban–urban and rural–urban migrants. Table 4 presented the regression results of the OLS model. In this study, we constructed Model 1 to examine whether household registration (hukou) status and human capital influenced the social integration level of migrants. Then, in Model 2 and Model 3, the sample was divided into urban–urban and rural–urban migrants.
First, Model 1 showed that different hukou types and human capital had different returns on social integration. The statistical results showed that the social integration level of urban–urban migrants was significantly higher than that of rural–urban migrants (β = 3.875, p < 0.001), indicating that hukou was indeed an important factor affecting the social integration of migrants. At the same time, human capital also significantly affected social integration. Education level (β = 0.807, p < 0.001), self-rated health status (β = 3.421, p < 0.001), migration duration (β = 0.045, p < 0.001), and total work experience (β = 0.024, p < 0.001) all significantly promoted the social integration level of migrants. Specifically, for every one-unit increase in the education level, self-rated health level, migration duration, and total work experience of migrants, their social integration scores increased by 0.807, 3.421, 0.045, and 0.024 units, respectively.
Regarding individual characteristics, family background, and occupational status, male migrants had a significantly lower social integration level than females (β = −0.426, p < 0.001). Migrants with accompanying family members had a significantly higher social integration level than those without (β = 1.117, p < 0.001), while migrants with parental migration experience had a significantly lower social integration level than those without (β = −0.442, p < 0.001). Compared with migrants engaged in primary industry, migrants engaged in secondary (β = −3.698, p < 0.001) and tertiary industries (β = −2.858, p < 0.001) had significantly lower social integration levels.
By comparing Model 2 and Model 3, it could be seen that most of the conclusions after dividing the sample are robust, and the coefficients of each variable had large differences between the two types of migrants. In human capital, education (β = 0.944, p < 0.001), self-rated health (β = 3.792, p < 0.001), and total work experience (β = 0.048, p < 0.001) had a greater impact on the social integration level of urban–urban migrants, confirming hypothesis h1a, but hypotheses h1b and h1d were not confirmed. This may be because, although the work engaged in by rural–urban migrants might have higher demands on health, migrants with poorer health were not capable of migrating. It was precisely those migrants with higher health levels who chose to migrate, and the medical insurance system at that time did not allow for cross-regional medical expense reimbursement, which further limited the possibility of migration for groups with poorer health. Migration duration (β = 0.046, p < 0.05) had a greater impact on the social integration level of rural–urban migrants, confirming hypothesis h1c.

4.3. Robust Test

Considering the potential omitted variable bias and endogeneity issues in our regression model analysis, we employed the propensity score matching method to match the samples and then conducted the corresponding regression analysis again. We implemented PSM as follows: First, for the four dimensions of our key independent variable, human capital—education, self-rated health, migration duration, and work experience—we constructed regression models to examine factors influencing each dimension. We then conducted statistical tests to select variables with significant differences and performed PSM based on these. This yielded matched treatment and control group samples. We then built regression models to assess social integration and compared the results with the above regression results. The matching results showed that, except for a less ideal matching for self-rated health, the other three dimensions achieved an excellent matching (see Supplementary File Tables S1–S4). Moreover, the regression results (Table 5) from the matched samples were consistent with the above findings, with only slight changes in coefficients but identical significance. This indicated that our above conclusion—that human capital significantly affected the social integration of both urban–urban and rural–urban migrants—was robust and reliable.

4.4. Decomposition of Intergroup Differences in Social Integration Between Urban–Urban and Rural–Urban Migrants

The previous OLS regression results showed that different variables had significant impacts on the social integration levels of the two types of migrants, and the returns were different. Therefore, this paper further used the Oaxaca–Blinder decomposition of intergroup mean differences to compare the reasons why the same influencing factors produced different social integration outcomes for the two types of migrants.
The Oaxaca–Blinder decomposition results (see Table 6) showed that the explained part (i.e., differences in characteristics) was 2.417, accounting for 38.35%. This represented that the two types of migrants exhibited different characteristics in different influencing factors, resulting in different social integration levels. The unexplained part (i.e., differences in coefficients) was 3.885, accounting for 61.65%. This represented that migrants exhibited different return coefficients under each identical influencing factor, resulting in different social integration levels. The results indicated that urban–urban and rural–urban migrants exhibited significant differences in human capital, which consequently affected their social integration levels. At the same time, the different returns brought by their own characteristics were also an important reason for the differences in social integration levels.

4.5. Analysis of Impact Changes and Difference Decomposition Under Different Social Integration Level Distributions

The OB decomposition is only a mean decomposition, which masks the impact on different distributions. Quantile regression can effectively compensate for this deficiency and further explore the changes of these influencing factors in different distributions. Table 7 presents the OLS regression and quantile regression results of migrant social integration based on human capital. As can be seen from the table, there were significant differences between the two types of migrants at different quantiles. The social integration level of urban–urban migrants was 3.277–4.333 units higher than that of rural–urban migrants, which was consistent with the OLS estimation results. Moreover, the hukou difference was larger at lower quantiles, indicating that the difference in social integration levels between urban–urban and rural–urban migrants was greater among groups with lower social integration levels and smaller among groups with higher social integration levels.
The quantile regression results showed that each additional year of education could increase the social integration level by 0.713–0.915 units, and they showed a gradually decreasing trend as the social integration level distribution increased. The OLS estimation results were closer to the 50th quantile; that is, the higher the social integration level of migrants, the lower the return on education; and there was a negative correlation between social integration and the marginal return on education. The quantile regression coefficient of education was larger when the social integration index quantile was smaller, indicating that education had a greater impact on people with lower social integration levels than on people with higher social integration levels. In other words, compared with people with higher social integration levels, increasing the years of education had a greater impact on migrants with lower social integration levels. Self-rated health, migration duration, and total work experience had greater returns at higher quantiles of social integration level; that is, in groups with higher social integration levels, the positive effects of self-rated health, migration duration, and total work experience were greater.
The return on gender was greater at lower quantiles (10th and 25th); that is, the gender difference in social integration was mainly reflected in the low social integration group. The social integration status of men was worse in groups with lower social integration levels, while the OLS estimation results were closer to the 90th quantile; that is, OLS regression would overestimate the impact of gender on social integration. Marriage was not significant at all quantiles.
The accompanying family member variable was significant at all quantiles and had the greatest impact at the 75th quantile. Migrants with accompanying family members had a social integration level 0.927–1.489 units higher than those without, which was consistent with the OLS estimation results. Parental migration experience was significant at all quantiles and had the greatest impact at the 25th quantile. Compared with people without parental migration experience, people with parental migration experience had a social integration level 0.350–0.587 units lower, which was consistent with the OLS estimation results.
From the perspective of industry type, at different quantiles, compared with the primary industry, secondary and tertiary industries both showed significantly lower social integration levels. Compared with people without employment, migrants engaged in self-employment, private enterprises, and state-owned enterprises all showed significantly higher social integration levels at different quantiles, and their impact showed a trend of first increasing and then decreasing as the social integration distribution rises; that is, the impact of the unit showed a greater effect in the medium social integration distribution group.

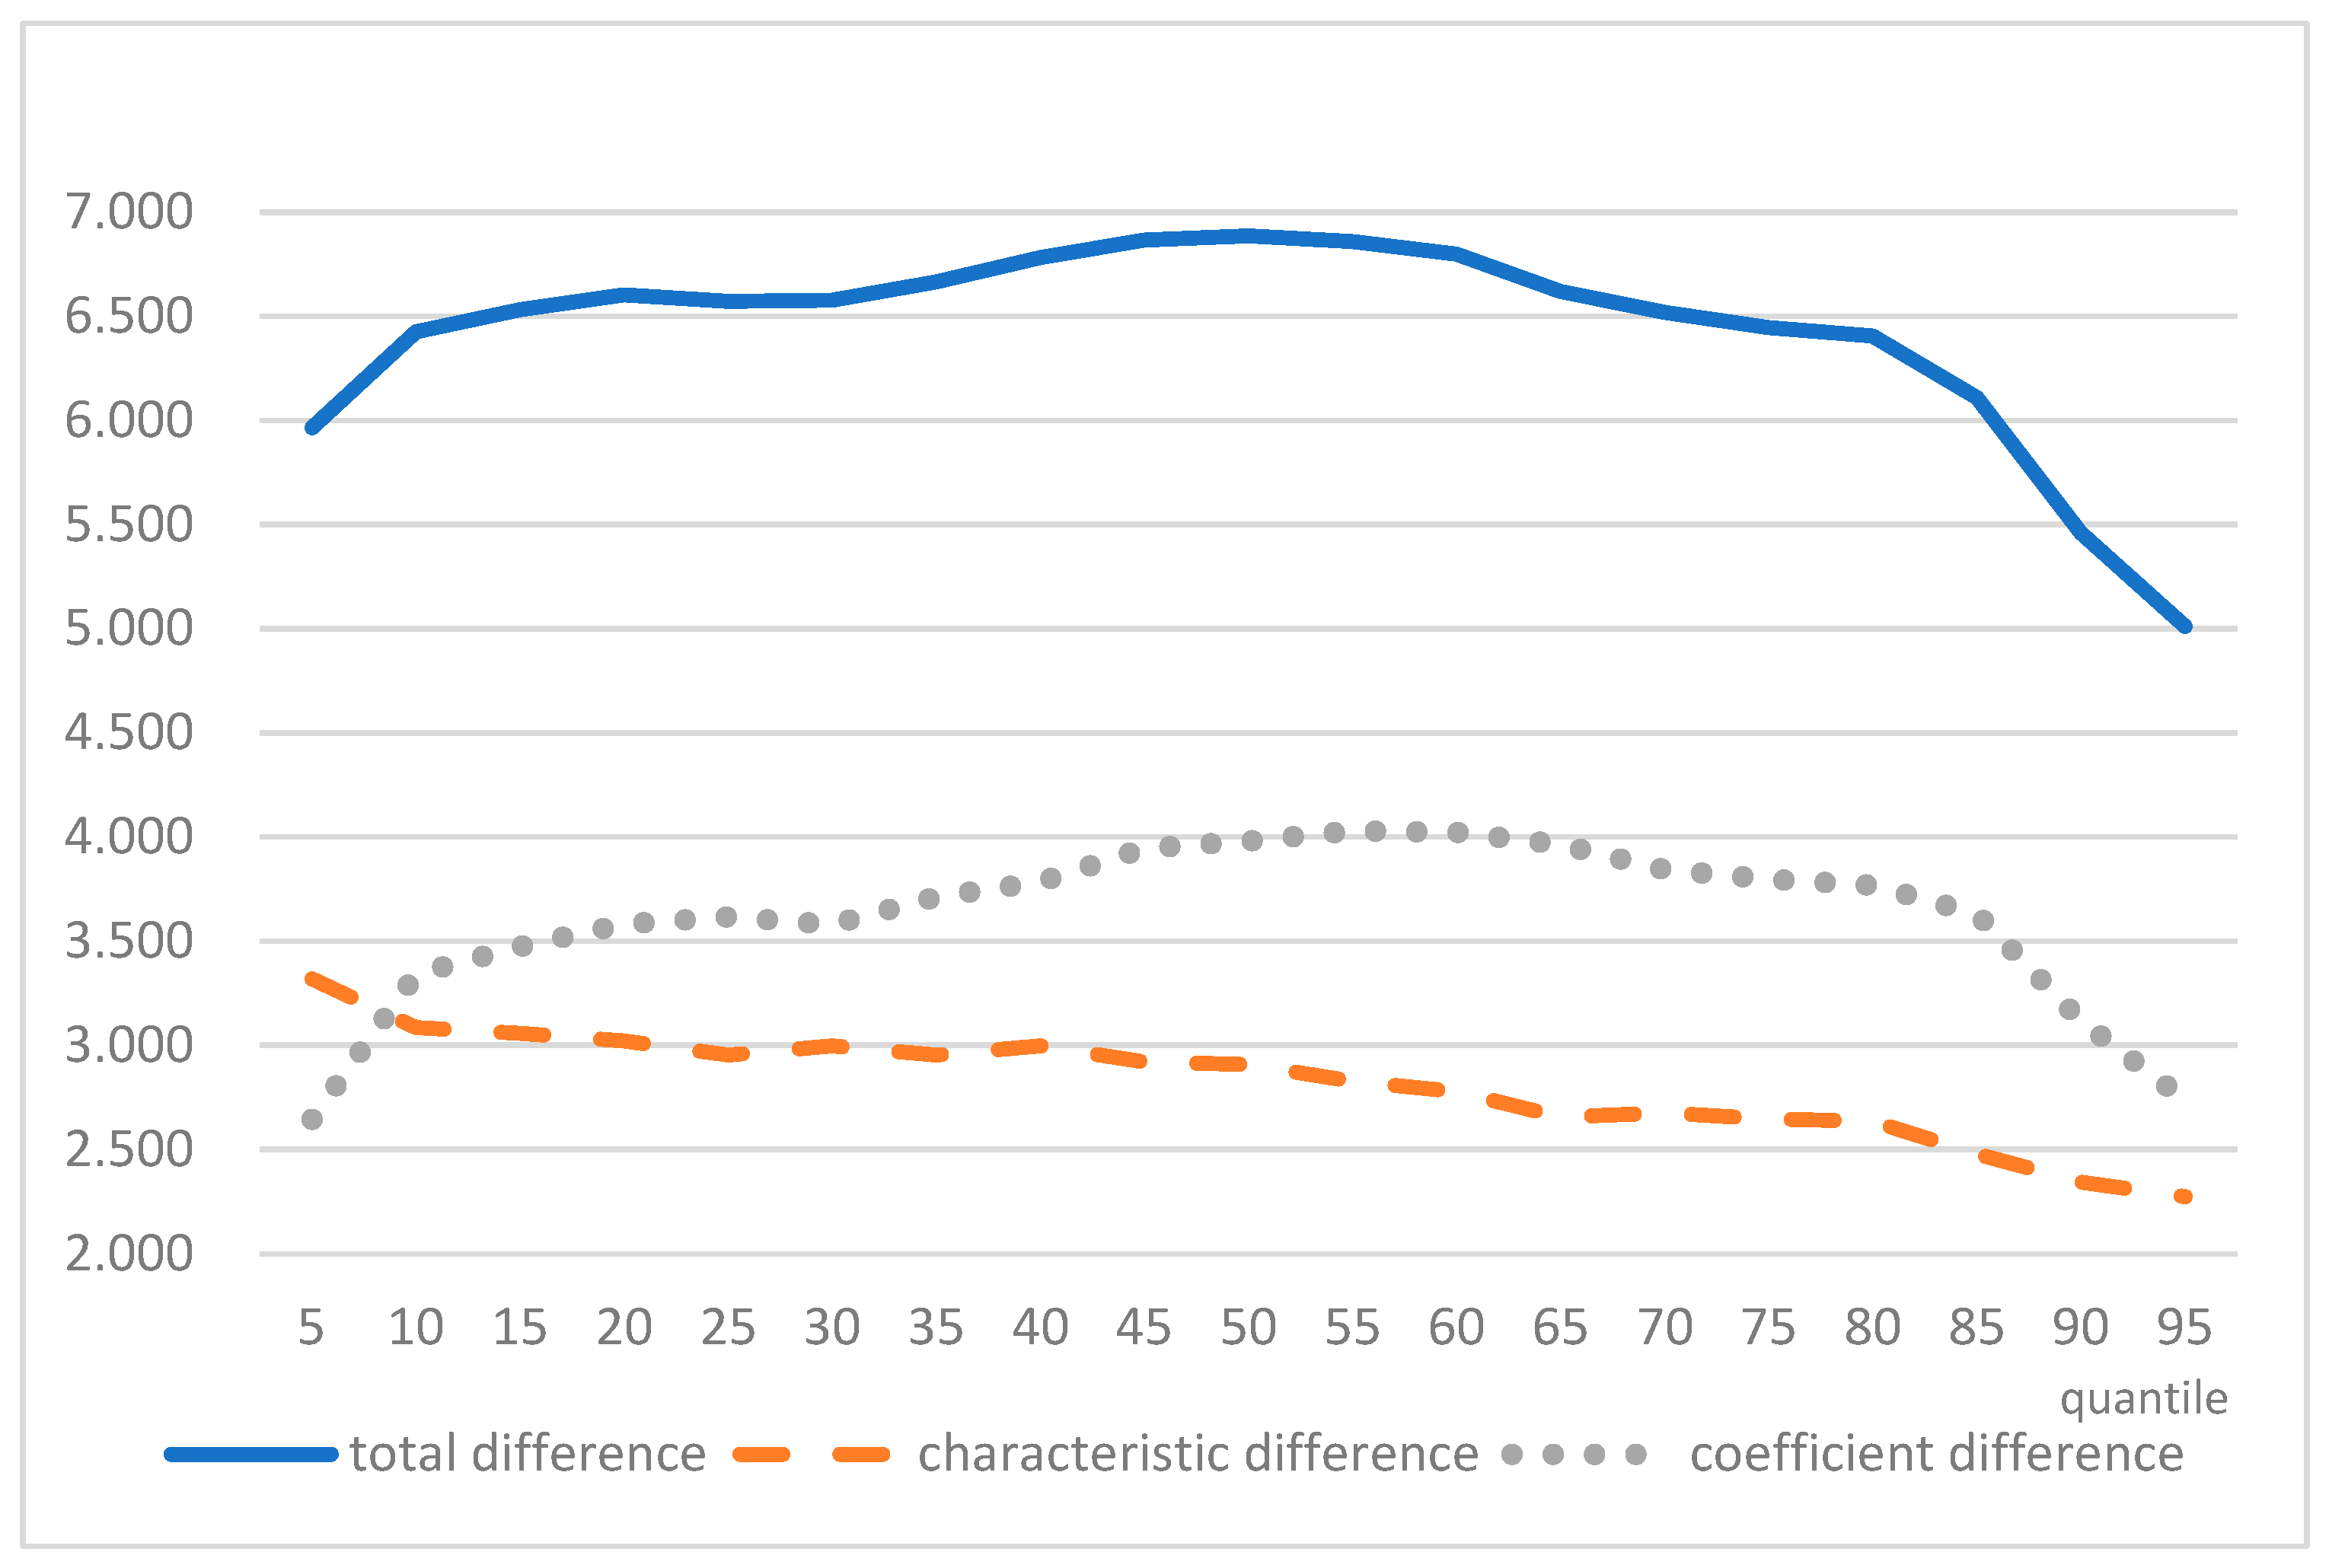
4.6. Decomposition of Social Integration Level Differences at Different Quantiles of the Migrants

Using the MM [48] quantile decomposition method, the differences in social integration levels between urban–urban and rural–urban migrants at different quantiles were decomposed. As shown in Table 8, overall, as the quantile increased, the difference in social integration levels between urban–urban and rural–urban migrants remained substantial, and this difference generally showed an inverted U-shaped relationship, first increasing and then decreasing. At the 50th quantile, the social integration index of urban–urban migrants was 6.887 higher than that of rural–urban migrants, with the largest difference. At the 95th quantile, the former was 5.012 higher than the latter, with the smallest difference. This may indicate that the two types of migrants achieved homogeneity when the social integration level was high, so the integration difference was small. However, when the social integration level was medium or low, the two types of migrants showed a greater heterogeneity, resulting in larger integration differences. The characteristic difference, representing different individual characteristics in the social integration difference, generally showed a continuous decreasing trend, decreasing from 3.319 at the 5th quantile to 2.275 at the 95th quantile. The coefficient difference, representing different returns for the same characteristic, showed a trend of first increasing and then decreasing, basically consistent with the social integration difference, rising from 2.646 at the 5th quantile to 4.030 at the 55th quantile and then decreasing to 2.737 at the 95th quantile. Overall, as the social integration distribution increased, the characteristic difference decreased, while the coefficient difference was the main factor affecting the social integration difference, consistent with the overall change in difference.
To more clearly display the changes in characteristic and coefficient differences across different social integration level distributions, this study presents quantile difference decomposition plots. As shown in Figure 2, as the quantile increased, the total difference in social integration levels between the two types of migrants showed a trend of first increasing and then decreasing. The characteristic difference generally showed a decreasing trend, while the coefficient difference first increased and then decreased. Specifically, as the social integration level increased from lower quantiles to middle quantiles, the characteristic difference gradually decreased, while the coefficient difference gradually increased. As the social integration level increased from middle quantiles to higher quantiles, both the characteristic difference and the coefficient difference decreased. This indicated that the difference in social integration levels between urban–urban and rural–urban migrants was relatively small at both ends of the social integration level distribution but larger in the middle part of the distribution. Moreover, this change was mainly caused by changes in the coefficient difference.

5. Discussion and Conclusions

5.1. Discussion

This study measured the level of social integration of migrants based on four dimensions: economic integration, behavioral adaptation, identity identification, and psychological integration. The results showed that, consistent with previous research findings [4], urban-to-urban migrants had a higher level of social integration than rural-to-urban migrants. Further exploration revealed that this might be due to differences in human capital between the two types of migrants, particularly the uneven distribution of educational resources between urban and rural areas.
Firstly, urban-to-urban migrants had a higher level of education. Education could significantly improve the quality of employment for migrants, including employment stability and social security coverage [41]. Urban-to-urban migrants had an average of 2.6 more years of education than rural-to-urban migrants, which meant that urban-to-urban migrants had more opportunities to achieve a better socioeconomic status. This could be indirectly verified by the higher proportion of urban-to-urban migrants employed in private and public enterprises. Therefore, education had a greater impact on urban-to-urban migrants. Secondly, the return on education was also higher for urban-to-urban migrants. Continuous research from the beginning of the century to recent years showed that the urban–rural education gap in China remained significant, with problems such as low-quality rural compulsory education, insufficient educational investment, and high school dropout rates still existing [49,50]. This indirectly led to rural-to-urban migrants, who received the same level of education, being inferior to urban-to-urban migrants. In contemporary society, education is a direct guarantee for individuals to obtain economic income. Low-quality rural education inevitably affected workers’ survival in the job market and their ability to take root in urban society, while urban-to-urban migrants, due to their higher quality of education, obtained a greater return on education.
The impact of education was multifaceted, as reflected in the work experience of migrants. Due to their relatively lower level of education, rural-to-urban migrants entered the labor market earlier than urban-to-urban migrants and had more work experience, thus indeed showing a higher level of social integration in this regard. However, although rural-to-urban migrants had more work experience, the return on work experience was higher for urban-to-urban migrants. This might be because, even though education occupied a larger part of urban-to-urban migrants’ lives and shortened their relative working years, a higher education also led them to engage in more technical work, which could not be compensated for by accumulating work experience through repetitive work.
The gap in social integration levels was larger for the two types of migrants with medium and low distributions and smaller at the high distribution. This meant that in the process of improving the distribution of social integration levels from low to high, the social integration level of rural-to-urban migrants gradually became equal to that of urban-to-urban migrants. At this time, the characteristic differences between the two groups were smaller, indicating that the reduction in characteristic differences helped to reduce the gap in social integration. The coefficient difference was consistently larger than the characteristic difference, which was also the main reason for the difference in social integration. This showed that the hukou system had a significant impact on social integration. Although it is difficult to make effective changes to the hukou system for the time being, there are still areas worth working on to improve the level of social integration. Efforts should be made to increase the human capital of migrants, improve the quality of rural education, and provide vocational training for migrants to make up for a lack of education.
Our study also revealed an interesting finding, namely that the disparity in the distribution of social integration levels began to decline after reaching a peak between these two groups. It may be explained from the perspective of household registration (hukou) and institutional constraints. In theoretical studies of the labor market, wage disparities in China are often associated with individuals’ hukou characteristics. Compared to rural populations, urban hukou holders typically face fewer institutional restrictions and less discrimination [51,52,53]. At the same time, the Chinese government has placed a great emphasis on education, and the returns on education have exhibited an increasing effect, with investments in human capital yielding significant returns [54]. As wage distribution moved from lower to higher quantiles, the disparities caused by institutional barriers and hukou-based discrimination were partially offset by the returns on human capital, leading to a narrowing trend. Similarly, due to inherent hukou attributes and differences in living environments before migration, urban-to-urban migrants could adapt to city life more quickly and effectively at lower levels of social integration, exhibiting higher levels of social integration. As human capital increased, the benefits derived from human capital compensated for the social integration gaps caused by institutional and hukou constraints. Consequently, at higher levels of social integration, the gap in social integration levels between urban-to-urban and rural-to-urban migrants narrowed, resulting in an inverted U-shaped curve.

5.2. Policy Implications

Human capital plays a pivotal role in the social integration of migrants. However, there are differences in human capital composition and integration challenges between urban–urban migrants and rural–urban migrants. Therefore, to more effectively promote the social integration of migrant populations, comprehensive policies must consider the unique characteristics of different groups, while also emphasizing universality and systematic approaches.
(1) Strengthening a full-chain vocational skills training system: Provide vocational skills training that covers the entire process—pre-employment, on the job, and post-employment—tailored to different migration stages and employment needs. For rural–urban migrants, focus on basic and general skills training to help them adapt to urban industrial demands. For inter-city migrants, offer higher-level professional, innovative, and management skills training to promote their career development and transformation. Promote a “diploma + skill” dual-track education model to broaden career advancement opportunities for migrants. (2) Improving education equity and children’s education guarantees: Ensure all migrant children have equal rights to education. Increase investment in educational resources in receiving areas, expand the supply of school places, and simplify enrollment procedures. For children of rural–urban migrants, pay particular attention to issues related to urban–rural education transition, providing necessary academic tutoring and psychological support. This not only reduces family burdens but also lays the foundation for the next generation of migrants to integrate into urban society. (3) Encouraging lifelong learning and knowledge renewal: Build an open and flexible continuing education system that encourages migrant populations to acquire new knowledge and skills through various channels. For example, promote online learning platforms and community learning centers, offering flexible learning times and methods to help them remain competitive in an ever-changing social environment.
The research also indicated that coefficient differences were the primary reason for the disparities in social integration levels between the two migrant groups. This suggested that, in addition to individual characteristic differences, non-equitable factors in institutional design and policy implementation also played a significant role. (1) Deepening Hukou system reform and advancing equal access to basic public services: Even though social integration disparities at higher quantiles were lower, and highly integrated migrant populations tended to be more homogeneous, initial institutional barriers remain a critical obstacle. Policies should further dismantle public service barriers based on the hukou (household registration) system, ensuring that migrants’ rights regarding education, healthcare, housing, and social security converge with those of local residents. This is particularly crucial for rural–urban migrants, as it could effectively raise their starting point for social integration. (2) Eliminating employment discrimination and fostering a fair employment environment: To address the potential “glass ceiling” effect in employment, strengthen labor supervision and strictly crack down on employment discrimination based on non-ability factors such as hukou, region, or educational background. This ensures migrant populations can compete fairly based on their human capital.

5.3. Limitations

This study also had some limitations: Firstly, in terms of research objects, only a binary distinction was made and compared based on the source of the migrant population, without in-depth exploration of the differences in social integration among heterogeneous groups. Simultaneously, the cross-sectional nature of the data prevented this study from capturing potential temporal dynamics in the integration process, which constraining the ability to establish causal relationships. Secondly, the selection and operationalization of the dependent variable in this paper were relatively simple, and at the same time, the composite index masked the potential differences in different dimensions. The simplicity of the composite index was at the cost of sacrificing the information of different dimensions. Thirdly, the social integration of migrants is affected by many factors, and this study only explored it from the perspective of human capital, while other influencing factors such as social capital and institutional capital need to be further explored in future research. Fourthly, quantitative decomposition methods, like regression-based approaches, effectively identify measurable factors (e.g., education, income) influencing social integration but struggle to capture subjective aspects, such as sense of belonging, or relational dynamics, like social bonds, due to their reliance on quantifiable data. For urban–urban and rural–urban migrants, these methods may miss critical nuances—such as rural migrants’ feelings of cultural alienation or urban migrants’ exclusion from elite networks—because subjective experiences and relational ties are context-specific, dynamic, and often unmeasurable. This could lead to oversimplified conclusions, masking key differences in integration experiences between the two groups.
This study offered a limited examination of how human capital affects social integration among migrants and the disparities therein. However, a thorough analysis of integration differences necessitates a theoretical exploration of the multifaceted factors influencing migrants’ social integration. Scholars have extensively investigated this issue, converging on the consensus that social integration is shaped not only by human capital but also by social capital and networks, legal and institutional frameworks, discrimination and exclusion, cultural commonalities and differences, and societal inclusiveness, among other factors.
Clarifying what precisely drives the integration disparities between two migrant groups is even more complex than identifying the influencing factors. Thus, future research must not only synthesize existing theoretical perspectives but also incorporate empirical analyses to advance our understanding. Moreover, while much of the current literature remains rooted in classical and modernist paradigms, humanity has entered a new era of complexity. Postmodernism has opened novel analytical perspectives, and a metamodern lens might provide fresh insights into migrant integration [55,56]. By developing comprehensive abstract concepts and analytical frameworks, we could integrate ontological, epistemological, axiological, and methodological dimensions. Such an approach would not only explain specific phenomena but also establish more universal conceptual and analytical tools for the social sciences.

5.4. Conclusions

This research compared the levels of social integration of urban-to-urban and rural-to-urban migrants from the perspective of human capital, attempting to explore the factors influencing the social integration levels of different migrant groups and the differentiated needs of groups with different integration levels. Based on the CMDS2017 survey data, this study first conducted a descriptive statistical analysis of the two types of migrants and then conducted an OLS regression analysis of the social integration of migrants from the perspective of human capital and a sub-sample examination. Furthermore, we also conducted an Oaxaca–Blinder decomposition to decompose the reasons for the differences in the levels of social integration between the two types of migrants. Based on the Oaxaca–Blinder decomposition results, we conducted quantile regression and quantile decomposition from different perspectives to analyze the impact on social integration. The research results showed the following: Urban-to-urban migrants had a higher level of social integration than rural-to-urban migrants, and human capital had a significant impact on the level of social integration of migrants. The higher the level of education and health, and the longer the duration of migration and total work experience, the higher the level of social integration of migrants. This research conclusion was consistent with many previous research conclusions. The difference was that it not only revealed the existence of this difference but also further explored the important reasons for this difference.
In this research, human capital explained 38.35% of the difference in the level of social integration between urban-to-urban and rural-to-urban migrants, and the coefficient difference was the main reason for the difference in the level of social integration between the two types of migrants. As the distribution of social integration levels increased, the return on education decreased; that is, education played a greater role when the level of social integration was lower. The difference in social integration between the two types of migrants showed a trend of first rising and then falling, and the social integration difference at the high quantile was lower than that at the low quantile. As the distribution of social integration levels increased from low to high, the characteristic difference showed a continuous downward trend, which meant that as the level of social integration increased, the individual characteristic differences between urban-to-urban and rural-to-urban migrants gradually decreased, indicating that the two types of migrants with high-level social integration tended to be more homogeneous.

Supplementary Materials

The following supporting information can be downloaded at: https://www.mdpi.com/article/10.3390/urbansci9080292/s1. Table S1: Propensity Score Matching Results for Education (1st matching); Table S2: Propensity Score Matching Results for Migration Duration (3rd matching); Table S3: Propensity Score Matching Results for Total Work Experience (3rd matching); Table S4: Propensity Score Matching Results for self-rated health (4th matching).

Author Contributions

The authors confirm their contribution to the paper as follows: study conception and design: T.X. and J.R.; analysis and interpretation of results: T.X. and J.R.; draft manuscript preparation: T.X. and J.R., manuscript revision: T.X. All authors have read and agreed to the published version of the manuscript.

Funding

This work was supported by the National Planning Office of Philosophy and Social Science, China (23BSH105).

Institutional Review Board Statement

Based on the important social value of this research and the public availability of the data, all subject information used is anonymized; the researchers’ data use rights and privacy risk control measures meet the ethical review requirements. In addition, the public database involves a large number of people, and participants have not given informed consent since registration began many years ago, and the possibility of retrospective informed consent is low; the Ethics Committee of Zhejiang Normal University approves the implementation of the study and agrees to the application for exemption of informed consent.

Data Availability Statement

The data presented in this study are available at https://www.chinaldrk.org.cn/.

Conflicts of Interest

The authors declare no conflicts of interest.

References

  1. Liu, C.; Chen, J. The Impact of the Dual “Hukou Wall” on the Citizenization of Migrant Workers. Economist 2009, 10, 66–72. [Google Scholar]
  2. Huang, D.; Wang, G. Empirical Analysis of the Impact of Social Integration on the Willingness of Migrant Workers to Become Citizens—Based on the 2016 China Migrant Population Dynamic Monitoring Survey. Northwest Popul. J. 2021, 42, 12–22. [Google Scholar]
  3. Yang, J. Urban-Rural Segmentation, Economic Development and Income Integration of Rural-Urban Migrants. Popul. J. 2011, 5, 3–15. [Google Scholar]
  4. Yang, J. Research on the Social Integration of China’s Migrant Population. Soc. Sci. China 2015, 2, 61–79. [Google Scholar]
  5. Chen, D.; Zheng, X.; Shangguan, S. The Impact of Social Networks on the Social Integration of Migrant Population—Based on Empirical Analysis of China Labor Dynamics Survey. South. China Popul. 2021, 36, 16–30. [Google Scholar]
  6. Goldlust, J.; Richmond, A.H. A Multivariate Model of Immigrant Adaptation. Int. Migr. Rev. 1974, 8, 193–225. [Google Scholar] [CrossRef]
  7. Park, R.E. Human Migration and the Marginal Man. Am. J. Sociol. 1928, 33, 881–893. [Google Scholar] [CrossRef]
  8. Kallen, H.M. Cultural Pluralism and the American Idea: An Essay in Social Philosophy; University of Pennsylvania Press: Philadelphia, PA, USA, 1956; ISBN 9781512812527. [Google Scholar]
  9. Portes, A.; Zhou, M. The New Second Generation: Segmented Assimilation and Its Variants. Ann. Am. Acad. Pol. Soc. Sci. 1993, 530, 74–96. [Google Scholar] [CrossRef]
  10. Hurh, W.M.; Kim, K.C. Adhesive Sociocultural Adaptation of Korean Immigrants in the U.S.: An Alternative Strategy of Minority Adaptation. Int. Migr. Rev. 1984, 18, 188–216. [Google Scholar] [CrossRef] [PubMed]
  11. Gans, H.J. Second-generation Decline: Scenarios for the Economic and Ethnic Futures of the Post-1965 American Immigrants. Ethn. Racial Stud. 1992, 15, 173–192. [Google Scholar] [CrossRef]
  12. Tian, K. Investigation, Analysis and Reflection on the Urban Adaptability of Migrant Workers. Soc. Sci. Res. 1995, 5, 90–95. [Google Scholar]
  13. Zhang, W.; Lei, K. Analysis of the Structure, Status Quo and Influencing Factors of Social Integration of New Urban Immigrants. Sociol. Stud. 2008, 5, 117–141. [Google Scholar]
  14. Zhu, L. On the Urban Adaptation of Migrant Workers. Jianghai Acad. J. 2002, 6, 82–88. [Google Scholar]
  15. Yang, J. From Isolation, Selective Integration to Assimilation: Theoretical Reflections on the Social Integration of Migrant Population. Popul. Res. 2009, 33, 17–29. [Google Scholar]
  16. Feng, X. “Settling Down”?—Social Adaptation of Rural Migrants from the Three Gorges. Sociol. Res. 2004, 19, 19–27. [Google Scholar]
  17. Zhou, H. Measurement and Theoretical Reflection on the Social Integration of Migrant Population. Popul. Res. 2012, 36, 27–37. [Google Scholar]
  18. Schultz, T.W. Investment in Human Capital. Am. Econ. Rev. 1961, 51, 1–17. [Google Scholar]
  19. Denison, E.F. Education, Economic Growth, and Gaps in Information. J. Polit. Econ. 1962, 70, 124–128. [Google Scholar] [CrossRef]
  20. Becker, G.S. Human Capital: A Theoretical and Empirical Analysis with Special Reference to Education, 3rd ed.; The University of Chicago Press: Chicago, IL, USA, 1964. [Google Scholar]
  21. Mincer, J. Schooling, Experience, and Earnings. Human Behavior & Social Institutions; National Bureau of Economic Research: Cambridge, MA, USA, 1974. [Google Scholar]
  22. Wang, Q.; Ren, T.; Liu, T. Training, Skill-Upgrading and Settlement Intention of Migrants: Evidence from China. Urban Stud. 2018, 56, 2779–2801. [Google Scholar] [CrossRef]
  23. Li, P.; Tian, F. Intergenerational Comparison of Social Integration of Migrant Workers in China. Society 2012, 32, 1–24. [Google Scholar]
  24. Liu, L.; Zhang, C. Migrant Workers’ Wages: Human Capital, Social Capital, Enterprise System or Social Environment?—A Model for Determining Migrant Workers’ Wages in the Pearl River Delta. Sociol. Res. 2007, 6, 114–137. [Google Scholar]
  25. Wan, S.; Qing, B.; Tang, J. Occupational Training and Urban Integration of Migrant Population—Based on the Analysis of China Rural Residents Comprehensive Survey. Urban Dev. Res. 2020, 27, 12–19. [Google Scholar]
  26. Yang, J.; Zhang, J. Human Capital and Social Integration of Migrant Population. Popul. Res. 2016, 40, 3–20. [Google Scholar]
  27. Liu, T.; Wei, C.; Tong, D. Human Capital, Social Support and Social Integration of Migrant Population—Taking Beijing as an Example. Popul. Dev. 2020, 26, 11–22. [Google Scholar]
  28. Liu, S.; Yang, X.; Yue, Z. Research on the Status Quo and Influencing Factors of Migrant Workers’ Social Support Network. J. Xi’an Jiaotong Univ. (Soc. Sci.) 2007, 1, 67–76. [Google Scholar]
  29. Xie, G. Human Capital Return and Social Integration of Migrant Population in China. Soc. Sci. China 2012, 4, 103–124. [Google Scholar]
  30. Zhao, Y. Labor Migration and Earnings Differences: The Case of Rural China. Econ. Dev. Cult. Change 1999, 47, 767–782. [Google Scholar] [CrossRef]
  31. Borjas, G.J. Ethnic Capital and Intergenerational Mobility. Q. J. Econ. 1992, 107, 123–150. [Google Scholar] [CrossRef]
  32. Coleman, J.S. Social Capital in the Creation of Human Capital. Am. J. Sociol. 1988, 94, S95–S120. [Google Scholar] [CrossRef]
  33. Liu, Y.; Guo, F. Social Capital and Migration: How Do Rural Migrants Integrate into Urban Society in China. Asian Pac. Migr. J. 2014, 23, 19–40. [Google Scholar]
  34. Esser, H. Assimilation, Ethnic Stratification, or Selective Acculturation? Recent Theories of the Integration of Immigrants and the Model of Intergenerational Integration. Sociologica 2010, 4, 1–29. [Google Scholar] [CrossRef]
  35. Berry, J.W. Immigration, Acculturation, and Adaptation. Appl. Psychol. 1997, 46, 5–34. [Google Scholar] [CrossRef]
  36. Knight, J.; Song, L. The Rural-Urban Divide: Economic Disparities and Interactions in China; Oxford University Press: Oxford, UK, 1999; ISBN 019168497X. [Google Scholar]
  37. Nielsen, I.; Smyth, R. Who Wants Safer Cities? Perceptions of Public Safety and Attitudes to Migrants among China’s Urban Population. Int. Rev. Law Econ. 2008, 28, 46–55. [Google Scholar] [CrossRef]
  38. Fan, C.C. China on the Move: Migration, the State, and the Household; Routledge: Oxfordshire, UK, 2007; ISBN 0203937376. [Google Scholar]
  39. Chen, N.; Shi, R. Institutional Constraints, Human Capital, and Employment Differentiation of Migrant Population: An Empirical Analysis Based on the 2015 National Migrant Population Dynamic Data. Lanzhou Acad. J. 2020, 11, 150–161. [Google Scholar]
  40. Ma, Z.; Yin, S.; Zhang, Y.; Li, Z.; Wu, Q. Spatial Distribution, Flowing Rules and Forming Mechanism of Inter-Cities Floating Population in China. Geogr. Res. 2019, 38, 926–936. [Google Scholar]
  41. Wang, S.; Liu, M. Research on the Influence of Education Level on the Employment Quality of Migrant Population. Popul. J. 2023, 45, 49–62. [Google Scholar]
  42. Vontroba, J.; Balcar, J.; Šimek, M. Commuting Pays off: Evidence on Wage Returns to Inter-Urban and Intra-Urban Commuting. Morav. Geogr. Rep. 2020, 28, 112–123. [Google Scholar] [CrossRef]
  43. Xing, Z.; Huang, G.; Xue, D. Spatial Pattern and Influencing Mechanism of Social Integration of Migrants in Chinese Cities. ACTA Geogr. Sin. 2022, 77, 2474–2493. [Google Scholar]
  44. Mouate, O.; Travers, M. The Impact of Cultural Amenities on Inter-Urban Location: A Discrete Choice Experiment on French Students. J. Cult. Econ. 2024, 48, 575–614. [Google Scholar] [CrossRef]
  45. Gan, Y.; Zhang, L. Analysis of the Social Integration Status of Ethnic Minority Migrant Population—Based on the 2017 National Migrant Population Dynamic Monitoring Data. J. Southwest Minzu Univ. (Humanit. Soc. Sci. Ed.) 2021, 42, 10–21. [Google Scholar]
  46. Li, Y.; Ren, Y. The Impact of Household Migration on the Social Integration of Migrant Population and Its Heterogeneity Analysis. Popul. Dev. 2021, 27, 18–31. [Google Scholar]
  47. Oaxaca, R. Male-Female Wage Differentials in Urban Labor Markets. Int. Econ. Rev. 1973, 14, 693–709. [Google Scholar] [CrossRef]
  48. Machado, J.A.F.; Mata, J. Counterfactual Decomposition of Changes in Wage Distributions Using Quantile Regression. J. Appl. Econ. 2005, 20, 445–465. [Google Scholar] [CrossRef]
  49. Wang, D. Rural Compulsory Education in China: Status Quo, Problems and Solutions. China Rural Econ. 2023, 4–11. [Google Scholar] [CrossRef]
  50. Yang, L. Poverty Governance and Unequal Distribution of Compulsory Education Resources. J. South China Norm. Univ. (Soc. Sci. Ed.) 2018, 50, 113–120. [Google Scholar]
  51. Chan, K.W.; Zhang, L. The Hukou System and Rural-Urban Migration in China: Processes and Changes. China Q. 1999, 160, 818–855. [Google Scholar] [CrossRef] [PubMed]
  52. Meng, X. Labor Market Outcomes and Reforms in China. J. Econ. Perspect. 2012, 26, 75–102. [Google Scholar] [CrossRef]
  53. Wang, R. Wage Inequality and the Hukou System in China. In Proceedings of the 10th International Conference on E-Education, E-Business, E-Management and E-Learning, Tokyo, Japan, 10–13 January 2019; pp. 397–405. [Google Scholar]
  54. Xu, T. Segmentation and Increasing Marginal Returns: Characteristics and Trends in Individual Education Returns in Chinese Cities—A Multilevel Analysis Based on CGSS2005. Wuhan Univ. J. (Philos. Soc. Sci. Ed.) 2013, 66, 109–114. [Google Scholar]
  55. Pipere, A.; Mārtinsone, K. Metamodernism and Social Sciences: Scoping the Future. Soc. Sci. 2022, 11, 457. [Google Scholar] [CrossRef]
  56. Matlovič, R.; Matlovičová, K. The Metamodern Shift in Geographical Thought: Oscillatory Ontology and Epistemology, Post-Disciplinary and Post-Paradigmatic Perspectives. Folia Geogr. 2025, 67, 22. [Google Scholar]
Figure 1. Kernel density function plots of social integration levels of urban–urban and rural–urban migrants.
Urbansci 09 00292 g001
Figure 2. Human capital: quantile difference decomposition plots of migrant social integration level.
Urbansci 09 00292 g002
Table 1. Definition of core independent variables.
DimensionVariableCoding
Human CapitalEducation levelMeasured in years
Self-rated health1 = Unable to take care of oneself, 4 = Healthy
Duration of migrationCalculated as 2017-Year left registered residence
Total work experienceCalculated as 2017-Year of birth- 6-years of education
Personal CharacteristicsGender0 = Female, 1 = Male
Marital status0 = Unmarried, 1 = Married
Family BackgroundFamily members accompanying migration0 = No, 1 = Yes
Parental migration experience0 = No, 1 = Yes
Occupational StatusIndustry type1 = Primary industry, 2 = Secondary industry, 3 = Tertiary industry
Unit type1 = No unit, 2 = Individual business owner, 3 = Private enterprise, 4 = State-owned enterprise
Economic IntegrationMonthly net income (log)
Perception of economic hardship0 = Yes, 1 = No
Behavioral AdaptationAdherence to customs1 = Strongly agree, 4 = Strongly disagree
Hygiene habits1 = Strongly agree, 4 = Strongly disagree
IdentityWillingness to settle down0 = Unwilling, 1 = Undecided, 2 = Willing
Sense of belonging1 = Strongly disagree, 4 = Strongly agree
Psychological IntegrationWillingness to integrate1 = Strongly disagree, 4 = Strongly agree
Perceived acceptance by locals1 = Strongly disagree, 4 = Strongly agree
Perceived discrimination by locals1 = Strongly agree, 4 = Strongly disagree
Table 2. Comparison of characteristics and social integration of migrants.
VariablesOverallUrban–UrbanRural–Urban
PercentageMean (Std)PercentageMean (Std)PercentageMean (Std)
SexMale50.69%67.980 (12.606)49.69%72.735 (12.194)51.03%66.369 (12.334)
Female49.31%68.484 (12.592)50.31%73.251 (11.913)48.97%66.783 (12.389)
Marital Status Married81.04%68.229 (12.676)80.29%73.281 (11.989)81.3%66.487 (12.437)
Unmarried18.96%68.220 (12.281)19.71%71.811 (12.264)18.7%66.935 (12.030)
Family membersWith88.56%68.283 (12.663)87.48%73.261 (12.018)88.93%66.575 (12.426)
Without11.44%67.802 (12.111)12.52%71.109 (12.165)11.07%66.540 (11.851)
Parents’ migrating experiencesWith21.28%68.101 (12.373)16.83%72.437 (12.027)22.76%66.987 (12.220)
Without78.72%68.329 (12.677)83.17%73.187 (12.052)77.24%66.511 (12.423)
IndustryPrimary1.47%69.188 (12.644)1.2%74.214 (11.305)1.56%67.877 (12.656)
Secondary30.98%67.698 (12.655)31.05%72.372 (12.276)30.94%66.142 (12.396)
Tertiary67.54%68.157 (12.569)67.75%72.915 (12.012)67.5%66.580 (12.349)
UnitNo unit9.66%65.158 (12.520)5.11%69.633 (12.328)11.16%64.467 (12.409)
Self-employed46.21%66.980 (12.385)35.29%71.093 (12.108)49.78%66.003 (12.246)
Private enterprise34.68%69.335 (12.573)42.09%73.735 (11.881)32.26%67.451 (12.393)
Public enterprise9.46%71.406 (12.600)17.51%74.704 (11.904)6.80%68.568 (12.496)
Table 3. Comparison of mean human capital of migrants.
VariableEntire SampleUrban–Urban MigrationRural–Urban Migration
Mean (Standard Deviation)Mean (Standard Deviation)Mean (Standard Deviation)
Years of Education10.472 (3.444)12.410 (3.311)9.809 (3.232)
Self-Rated Health3.790 (0.472)3.794 (0.466)3.788 (0.474)
Total Work Experience20.181 (12.832)19.653 (13.779)20.365 (12.489)
Migration Duration (Years)11.125 (7.883)10.862 (8.188)11.211 (7.774)
Table 4. OLS regression of social integration.
VariableModel 1
(Entire Sample)
Model 2
(Urban–Urban)
Model 3
(Rural–Urban)
Urban–Urban Migrant3.875 ***
(0.10)
Education0.807 ***
(0.02)
0.944 ***
(0.03)
0.758 ***
(0.02)
Self-Rated Health3.421 ***
(0.10)
3.792 ***
(0.21)
3.319 ***
(0.12)
Migration Duration0.045 ***
(0.01)
0.042 ***
(0.01)
0.046 *
(0.01)
Total Work Experience0.024 ***
(0.01)
0.048 ***
(0.01)
0.018 *
(0.01)
Gender (Male = 1)−0.426 ***
(0.08)
−0.562 ***
(0.16)
−0.372 ***
(0.10)
Marital Status (Married = 1)−0.055
(0.16)
−0.082
(0.32)
−0.067
(0.19)
Accompanying Family Members (Yes = 1)1.117 ***
(0.19)
2.334 ***
(0.36)
0.644 **
(0.22)
Parental Migration Experience (Yes = 1)−0.442 ***
(0.10)
−0.581 ***
(0.21)
−0.393 ***
(0.12)
Secondary Industry−3.698 ***
(0.35)
−2.917 ***
(0.74)
−3.840 ***
(0.40)
Tertiary Industry−2.858 ***
(0.35)
−1.695 *
(0.73)
−3.122 ***
(0.40)
Self-Employed0.585 ***
(0.14)
0.658
(0.37)
0.628 ***
(0.16)
Private Enterprise1.505 ***
(0.15)
1.808 ***
(0.37)
1.409 ***
(0.17)
State-Owned Enterprise1.729 ***
(0.19)
1.613
(0.40)
1.816 ***
(0.23)
Constant45.935 ***
(0.58)
44.180
(1.25)
47.547 ***
(0.66)
N92,39723,05169,346
R20.1030.0830.052
Adj. R20.1020.0820.052
* p < 0.05, ** p < 0.01, *** p < 0.001.
Table 5. Regression comparison before and after matching.
Before MatchingAfter MatchingAfter MatchingAfter Matching
(1st Matching)(2nd Matching)(3rd Matching)
Urban–Urban Migrant3.875 ***3.901 ***3.564 ***3.799 ***
(0.10)(0.08)(0.10)(0.10)
Education0.807 ***0.892 ***0.866 ***0.796 ***
(0.02)(0.02)(0.02)(0.02)
Self-Rated Health3.421 ***3.911 ***3.402 ***2.655 ***
(0.10)(0.11)(0.08)(0.09)
Migration Duration0.045 ***0.061 ***0.016 *0.056 ***
(0.01)(0.01)(0.01)(0.00)
Total Work Experience0.024 ***0.048 ***0.057 ***0.009 #
(0.01)(0.01)(0.01)(0.01)
Gender (Male = 1)−0.426 ***−0.967 ***−1.170 ***−0.148 #
(0.08)(0.08)(0.08)(0.08)
Marital Status (Married = 1)−0.0550.182−1.103 ***−0.434 **
(0.16)(0.16)(0.16)(0.16)
Accompanying Family Members (Yes = 1)1.117 ***1.014 ***1.114 ***0.705 ***
(0.19)(0.18)(0.19)(0.19)
Parental Migration Experience (Yes = 1)−0.442 ***−0.321 **0.862 ***−0.939 ***
(0.10)(0.10)(0.10)(0.10)
Secondary Industry−3.698 ***−2.546 ***−5.327 ***−4.397 ***
(0.35)(0.35)(0.38)(0.36)
Tertiary Industry−2.858 ***−2.052 ***−4.521 ***−3.662 ***
(0.35)(0.35)(0.37)(0.36)
Self-Employed0.585 ***1.020 ***0.459 **0.858 ***
(0.14)(0.14)(0.15)(0.15)
Private Enterprise1.505 ***2.553 ***1.051 ***0.750 ***
(0.15)(0.15)(0.16)(0.15)
State-Owned Enterprise1.729 ***2.577 ***2.178 ***1.792 ***
(0.19)(0.18)(0.19)(0.19)
Constant45.935 ***40.979 ***48.259 ***50.595 ***
(0.58)(0.66)(0.57)(0.55)
N92,39792,25691,99391,816
R20.1030.0910.1030.088
adj. R20.1020.0900.1030.088
# p < 0.1, * p < 0.05, ** p < 0.01, *** p < 0.001.
Table 6. Results of the Oaxaca–Blinder decomposition of social integration levels among urban–urban and rural–urban migrants.
Social Integration Level Difference
Difference Value
(Urban–Urban vs. Rural–Urban)
Percentage
Total Difference6.302 ***100
Characteristic Effect2.417 ***38.35
Coefficient Effect3.885 ***61.65
*** p < 0.001.
Table 7. Quantile regression results based on human capital.
VariableOLS10th Quantile25th Quantile50th Quantile75th Quantile90th Quantile
Urban–Urban Migrant3.875 *** (0.10)3.917 *** (0.17)4.045 *** (0.15)4.333 *** (0.12)3.970 *** (0.14)3.277 ***
(0.16)
Education0.807 *** (0.02)0.915 *** (0.03)0.850 *** (0.02)0.822 *** (0.02)0.787 *** (0.02)0.713 ***
(0.03)
Self-Rated Health3.421 *** (0.10)3.398 *** (0.18)3.177 *** (0.15)3.393 *** (0.12)3.736 *** (0.14)3.753 ***
(0.16)
Migration Duration0.045 *** (0.01)0.020 *
(0.01)
0.033 *** (0.01)0.049 *** (0.01)0.074 *** (0.01)0.049 ***
(0.01)
Total Work Experience0.024 *** (0.01)0.027 **
(0.01)
0.021 **
(0.01)
0.021 **
(0.01)
0.030 *** (0.01)0.037 ***
(0.01)
Gender (Male = 1)−0.426 *** (0.08)−0.618 *** (0.14)−0.523 *** (0.12)−0.315 *** (0.10)−0.370 *** (0.12)−0.447 ***
(0.13)
Marital Status (Married = 1)−0.055
(0.16)
−0.034
(0.29)
0.148
(0.24)
0.035
(0.20)
−0.369
(0.23)
−0.440
(0.26)
Accompanying Family (Yes = 1)1.117 *** (0.19)1.300 *** (0.33)0.927 *** (0.28)1.146 *** (0.23)1.489 *** (0.27)1.367 ***
(0.30)
Parental Migration (Yes = 1)−0.442 *** (0.10)−0.397 *
(0.18)
−0.587 *** (0.15)−0.435 *** (0.12)−0.399 *** (0.14)−0.350 **
(0.17)
Secondary Industry−3.698 *** (0.35)−3.934 *** (0.62)−4.102 *** (0.52)−3.694 *** (0.42)−3.539 *** (0.50)−3.799 ***
(0.57)
Tertiary Industry−2.858 *** (0.35)−3.208 *** (0.61)−3.070 *** (0.51)−2.824 *** (0.42)−2.682 *** (0.49)−3.139 ***
(0.56)
Self-Employed0.585 *** (0.14)0.368
(0.25)
0.889 *** (0.21)0.747 *** (0.17)0.718 *** (0.20)0.441 *
(0.23)
Private Enterprise1.505 *** (0.15)1.458 *** (0.27)1.905 *** (0.22)1.729 *** (0.18)1.494 *** (0.22)1.303 ***
(0.25)
State-Owned Enterprise1.729 *** (0.19)1.382 *** (0.33)1.921 *** (0.28)1.979 *** (0.23)2.015 *** (0.27)1.671 ***
(0.31)
Constant45.935 *** (0.58)30.058 *** (1.01)38.621 *** (0.85)45.581 *** (0.69)52.423 *** (0.82)61.403 ***
(0.93)
N92,39792,39792,39792,39792,39792,397
* p < 0.05, ** p < 0.01, *** p < 0.001.
Table 8. Human capital: quantile decomposition of social integration level between urban–urban and rural–urban migrants.
Quantile (%)Total DifferenceCharacteristic DifferenceCoefficient Difference
ValuePercentageValuePercentage
55.9653.31955.64%2.64644.36%
106.4263.08447.99%3.34252.01%
156.5323.05746.80%3.47553.20%
206.6033.02145.75%3.58254.25%
256.5712.95444.96%3.61755.04%
306.5782.99845.58%3.58054.42%
356.6652.95444.32%3.71155.68%
406.7822.99844.21%3.78455.79%
456.8662.92042.53%3.94657.47%
506.8872.90742.21%3.98057.79%
556.8582.82841.24%4.03058.76%
606.7992.77740.84%4.02259.16%
656.6192.65540.11%3.96459.89%
706.5182.67541.04%3.84358.96%
756.4452.64741.07%3.79858.93%
806.4052.63641.16%3.76958.84%
856.1092.47840.56%3.63159.44%
905.4602.34242.89%3.11857.11%
955.0122.27545.39%2.73754.61%
Disclaimer/Publisher’s Note: The statements, opinions and data contained in all publications are solely those of the individual author(s) and contributor(s) and not of MDPI and/or the editor(s). MDPI and/or the editor(s) disclaim responsibility for any injury to people or property resulting from any ideas, methods, instructions or products referred to in the content.

