Article

Pedestrian Mobility Behaviors of Older People in the Face of Heat Waves in Madrid City

by
Diego Sánchez-González
* and
Joaquín Osorio-Arjona
Department of Geography, National University of Distance Education, Paseo de la Senda del Rey, 7, Moncloa-Aravaca, 28040 Madrid, Spain
*
Author to whom correspondence should be addressed.
Urban Sci. 2025, 9(7), 236; https://doi.org/10.3390/urbansci9070236
Submission received: 6 May 2025 / Revised: 11 June 2025 / Accepted: 16 June 2025 / Published: 23 June 2025
(This article belongs to the Special Issue Rural–Urban Transformation and Regional Development: 2nd Edition)

Abstract

Heat waves affect the health and quality of life of older adults, particularly in urban environments. However, there is limited understanding of how extreme temperatures influence their mobility. This research aims to understand the pedestrian mobility patterns of older adults during heat waves in Madrid, analyzing environmental and sociodemographic factors that condition such mobility. Geospatial data from the mobile phones of individuals aged 65 and older were analyzed, along with information on population, housing, urban density, green areas, and facilities during July 2022. Multiple linear regression models and Moran’s I spatial autocorrelation were applied. The results indicate that pedestrian mobility among older adults decreased by 7.3% during the hottest hours, with more pronounced reductions in disadvantaged districts and areas with limited access to urban services. The availability of climate shelters and health centers positively influenced mobility, while areas with a lower coverage of urban services experienced greater declines. At the district level, inequalities in the availability of urban infrastructure may exacerbate the vulnerability of older adults to extreme heat. The findings underscore the need for urban policies that promote equity in access to infrastructure and services that mitigate the effects of extreme heat, especially in disadvantaged areas.

1. Introduction

Heat waves are among the most dangerous phenomena associated with climate change, disproportionately impacting the health and quality of life of older adults [1,2]. Recent studies have shown that older adults are particularly vulnerable to the effects of extreme heat due to biological, social, and economic factors [3,4]. As people age, they experience a decline in thermoregulatory capacity, making them more susceptible to heat-related illnesses such as heatstroke, dehydration, and the exacerbation of chronic conditions [5,6,7]. Additionally, factors such as social isolation, loneliness, and functional dependence increase their vulnerability [8,9].
In Europe, heat waves have caused a significant number of deaths, particularly among those aged 75 and older. For example, during the summer of 2022, 61,672 heat-related deaths were recorded in the region, with 85% occurring in this age group [10]. Similarly, in Spain, and particularly in Madrid, high mortality rates due to heat waves have been documented on several occasions, highlighting the need to better understand how this vulnerable group adapts to extreme climatic conditions [11,12].
Pedestrian mobility is an essential component of urban life, especially for older adults, who often rely on walking to access services, shop, or participate in social activities [13]. However, high temperatures can significantly affect mobility patterns, reducing the distance traveled, altering routes, and avoiding the hottest hours of the day [14,15].
Environmental factors, such as the presence of urban heat islands, the availability of green areas, and access to climate shelters, play a crucial role in the ability of older adults to maintain their mobility during heat waves [16,17]. Specifically, the increase in urbanization and the loss of green spaces are the main causes of the intensification of the heat island effect [18]. Furthermore, urban form can explain approximately two-thirds of temperature variations within the city [19]. In this sense, differences in urban morphology, such as permeable surface (green areas) and the height and surface of the buildings, influences variations in temperature and heat risk within the same city [20,21]. In this regard, urban areas with greater vegetation cover and better shading infrastructure tend to mitigate the effects of heat, facilitating pedestrian mobility [22,23]. Conversely, neighborhoods with less access to these resources experience greater reductions in mobility during periods of extreme heat [24].
Sociodemographic factors, such as gender, socioeconomic status, and living arrangements, also influence the ability to adapt to heat [25]. Older women, especially those living alone, are more likely to experience social isolation and loneliness, which can exacerbate their vulnerability to heat [26,27]. Similarly, individuals with lower incomes often have less access to resources such as air conditioning or private transportation, limiting their ability to adapt to high temperatures [28,29].
Adaptation strategies to extreme heat aim to reduce population vulnerability and increase resilience to the effects of climate change [30]. In cities like Madrid, where heat waves are becoming more frequent and intense, it is essential to implement urban policies that promote equity in access to efficient and sustainable infrastructure and services that mitigate the effects of heat [31,32,33].
One of the most effective strategies is the creation of climate shelters, public spaces equipped to provide thermal relief during heat waves [34]. These shelters, which can include shopping malls, libraries, and senior centers, are particularly important for older adults, who may not have access to air conditioning in their homes [35]. In this regard, site planning and the design of shelters, such as green buildings, constitute comprehensive solutions to urban heat [36,37]. Additionally, improving accessibility to green areas and health services can reduce heat exposure and facilitate pedestrian mobility during periods of extreme temperatures [38,39,40].
The literature indicates that the effectiveness of these strategies depends largely on risk perception and the adoption of adaptive behaviors by older adults [41]. In this regard, previous studies have shown that this group often underestimates the risks associated with extreme heat, making it difficult to implement preventive measures [42,43,44]. Therefore, it is crucial to design awareness campaigns and early warning systems tailored to the specific needs of older adults, especially those living alone or with low incomes [45,46,47].
Despite advances in understanding the vulnerability of older adults to extreme heat, significant gaps remain in the literature [48]. First, most studies have focused on health impacts and mortality, with limited attention to pedestrian mobility patterns [49]. Second, although environmental and sociodemographic factors influencing heat vulnerability have been identified, little is known about how these factors condition the mobility of older adults in specific urban environments, such as Madrid [50]. Given that pedestrian mobility is essential for accessing services and social participation among older adults, understanding how heat waves influence their travel patterns is crucial for designing urban policies that mitigate the effects of extreme heat.
This study aims to fill these gaps by providing empirical evidence on how extreme climatic conditions affect the mobility of older adults in a specific urban environment like Madrid. The findings will contribute to the design of more effective and equitable urban policies, promoting the adaptation of older adults to climate change and improving their quality of life in the context of population aging and climate crisis [51].
A novelty of this work is the use of mobile phone data to obtain large data samples of the mobility of older adults. Traditional sources such as mobility surveys typically provide data with low temporal granularity and are difficult to update, reach a limited sample of people, and have low scalability [52,53]. In contrast, mobile phone data allow multiple dimensions of mobility to be captured simultaneously thanks to their high spatial and temporal detail. The high volume and velocity of the data facilitates obtaining large samples of users and the constant update of the information obtained in a short time and at low cost [54,55,56]. The great value and richness of mobile phone call data records has recently begun to be used for mobility studies during adverse weather periods [57,58,59,60,61]. However, no previous literature has been found that uses mobile phone data to study the intra-urban pedestrian mobility of older adults during heat waves.
The objective of this research is to understand the pedestrian mobility patterns of older adults during the 2022 heat wave in Madrid, analyzing how environmental and sociodemographic factors influence their ability to adapt to high temperatures. To this end, anonymized mobile phone location data from individuals aged 65 and older, population and housing data, building density, green area coverage, facilities, and data on heat islands and extreme temperatures during the July 2022 heat wave in Madrid were analyzed. This study addresses two key questions: What were the intra-urban pedestrian mobility patterns of older adults in Madrid during the 2022 heat wave? What factors conditioned the variations in pedestrian mobility among older adults at the district level during the heat wave? The hypothesis proposes that the pedestrian mobility of older adults during heat waves is primarily conditioned by the availability of urban infrastructure, such as climate shelters and health centers, and, to a lesser extent, by sociodemographic factors such as gender and socioeconomic status.

2. Materials and Methods

2.1. Study Area

The study area is Madrid, the capital of Spain, one of the most populous cities in the European Union, with 3,416,771 inhabitants, of which 19.7% are aged 65 and older. The city has a continental Mediterranean climate, characterized by moderately cold winters and hot summers, with a climatic pattern affected by climate change, urban growth, air pollution, and the urban heat island effect [62]. This city is divided into 21 districts and 131 neighborhoods, allowing for detailed intra-urban analysis. Madrid is one of the European cities with the highest mortality rates due to heat waves [12,63]. Recent studies warn that, without significant mitigation and adaptation measures, Madrid could become one of the European cities with the highest number of heat-related deaths in the coming decades [64].

2.2. Data

Daily mobile phone records were obtained from the Mobility Study with Big Data portal, managed by the Spanish Ministry of Transport and Sustainable Mobility (MITMA). These data represent 27.1% of the country’s total population and include origin–destination travel flows disaggregated spatially at the census district level and temporally by hour. Each record contains information on age, gender, socioeconomic status, travel distance, and activity at the origin and destination.
Records of maximum daily temperatures during the heat wave from 9 to 26 July, 2022, were obtained from the Spanish State Meteorological Agency (AEMET). These data show the maximum daily temperature recorded at Madrid’s weather stations and the time at which this temperature occurred. Likewise, the days that made up this heat wave period and the temperature thresholds used were defined by this same agency, which are indicated in Figure 1. In this regard, the AEMET defines a heat wave as an episode of at least three consecutive days in which at least 10% of meteorological stations record maximum temperatures above the 95th percentile of their historical series of maximum daily temperatures for July and August (1971–2000). Likewise, the AEMET defines normal thermal activity or thermal sensation as the temperature and humidity that do not cause a sensation of excessive cold or heat for most people.
For the exploratory variables, data on the location of climate shelters (public spaces converted into climate shelters, such as shopping malls, senior centers, and libraries), health centers, green areas, and public transport stops were obtained from the Madrid City Council Geoportal and the Regional Transport Consortium of Madrid. Demographic and socioeconomic data from 2022, such as the percentage of older adults living alone, income level, the percentage of individuals with functional dependence, the percentage of older adults receiving home care, and the percentage of senior center members, were obtained from the Madrid City Council Open Data Portal.

2.3. Methods

Mobile phone data from July 2022 were processed and filtered using a Python script. Records corresponding to individuals aged 65 and older (2,679,083 records) were selected, and those with null values in sociodemographic fields were removed. Next, trips shorter than 2 km (731,131 records) were filtered, corresponding to short-distance trips by older adults, based on previous studies [65,66]. Since this study focused on pedestrian mobility, trips of more than 2 km were omitted, assuming that older adults travel these greater distances by public or private transportation. Finally, records corresponding to 4:00 PM (52,544 records), the time when the highest temperatures were reached during the heat wave, were selected.
An exploratory data analysis was conducted, including centrality and dispersion techniques, sociodemographic data summaries, and cartographic visualization. A Pearson correlation matrix was created to analyze the associations between the average number of trips and the sociodemographic and environmental variables used (Table 1). A multiple linear regression model (OLS) was applied to study the influence of these explanatory variables on trips made by older adults. The independent variables included sociodemographic factors (percentage of older adults living alone, income level) and environmental factors (exposure to the urban heat island effect, percentage of green areas, availability of climate shelters, and health centers).
To optimize the model, non-significant variables with VIF values above 5 were removed, and a Moran’s I spatial autocorrelation test was conducted to evaluate the presence of spatial clusters in the residuals. The model was validated using statistical tests, including the Jarque–Bera test for residual normality and the Koenker test to detect heteroscedasticity. The variables were standardized to compare the relative importance of the independent factors.
This study draws on data from various sources, including both random and non-random samples. While combining these two types of data enables the identification of meaningful relationships, it also implies that the regression model should be treated as an exploratory tool. The findings should be interpreted with caution, considering the limitations associated with the non-random component of the sample.
Regarding ethical considerations, the anonymity of mobile phone data was ensured, and only aggregated data at the district level were used to preserve individual privacy. Various software tools, such as Jupyter Notebook 7.4.0 and ArcGIS Pro 3.5.0, were used for data processing, statistical analysis, and cartography.

3. Results

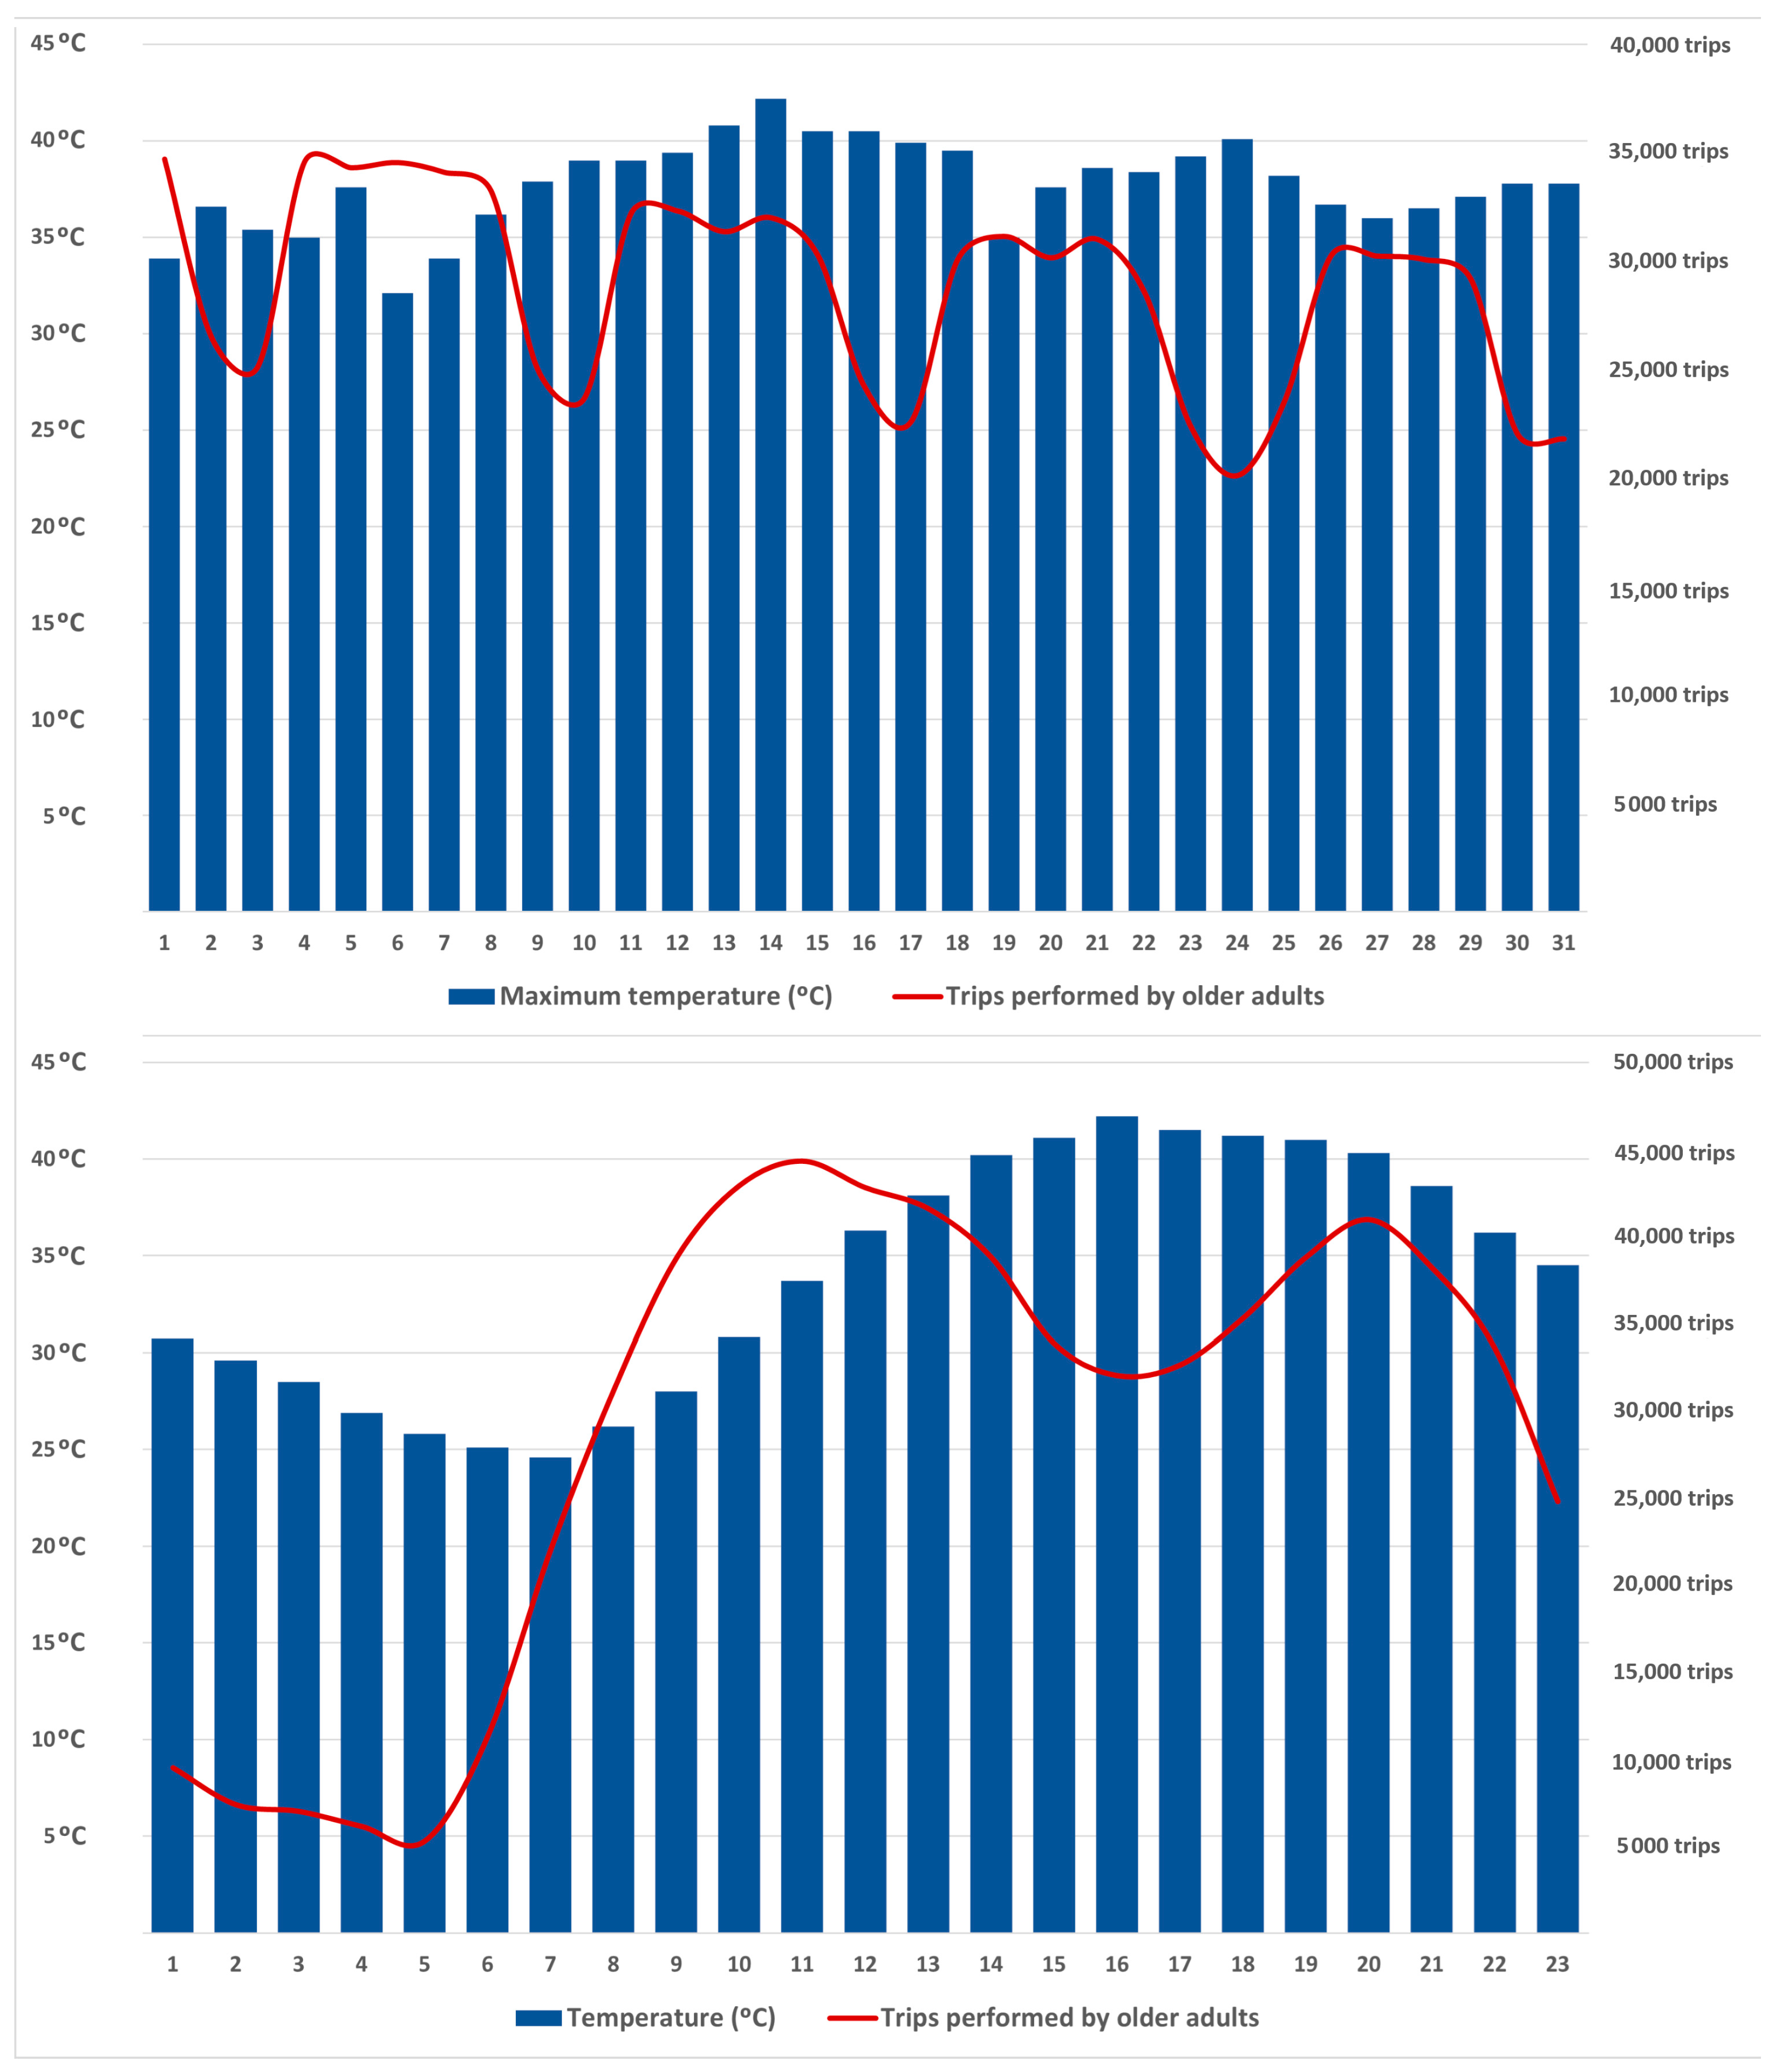
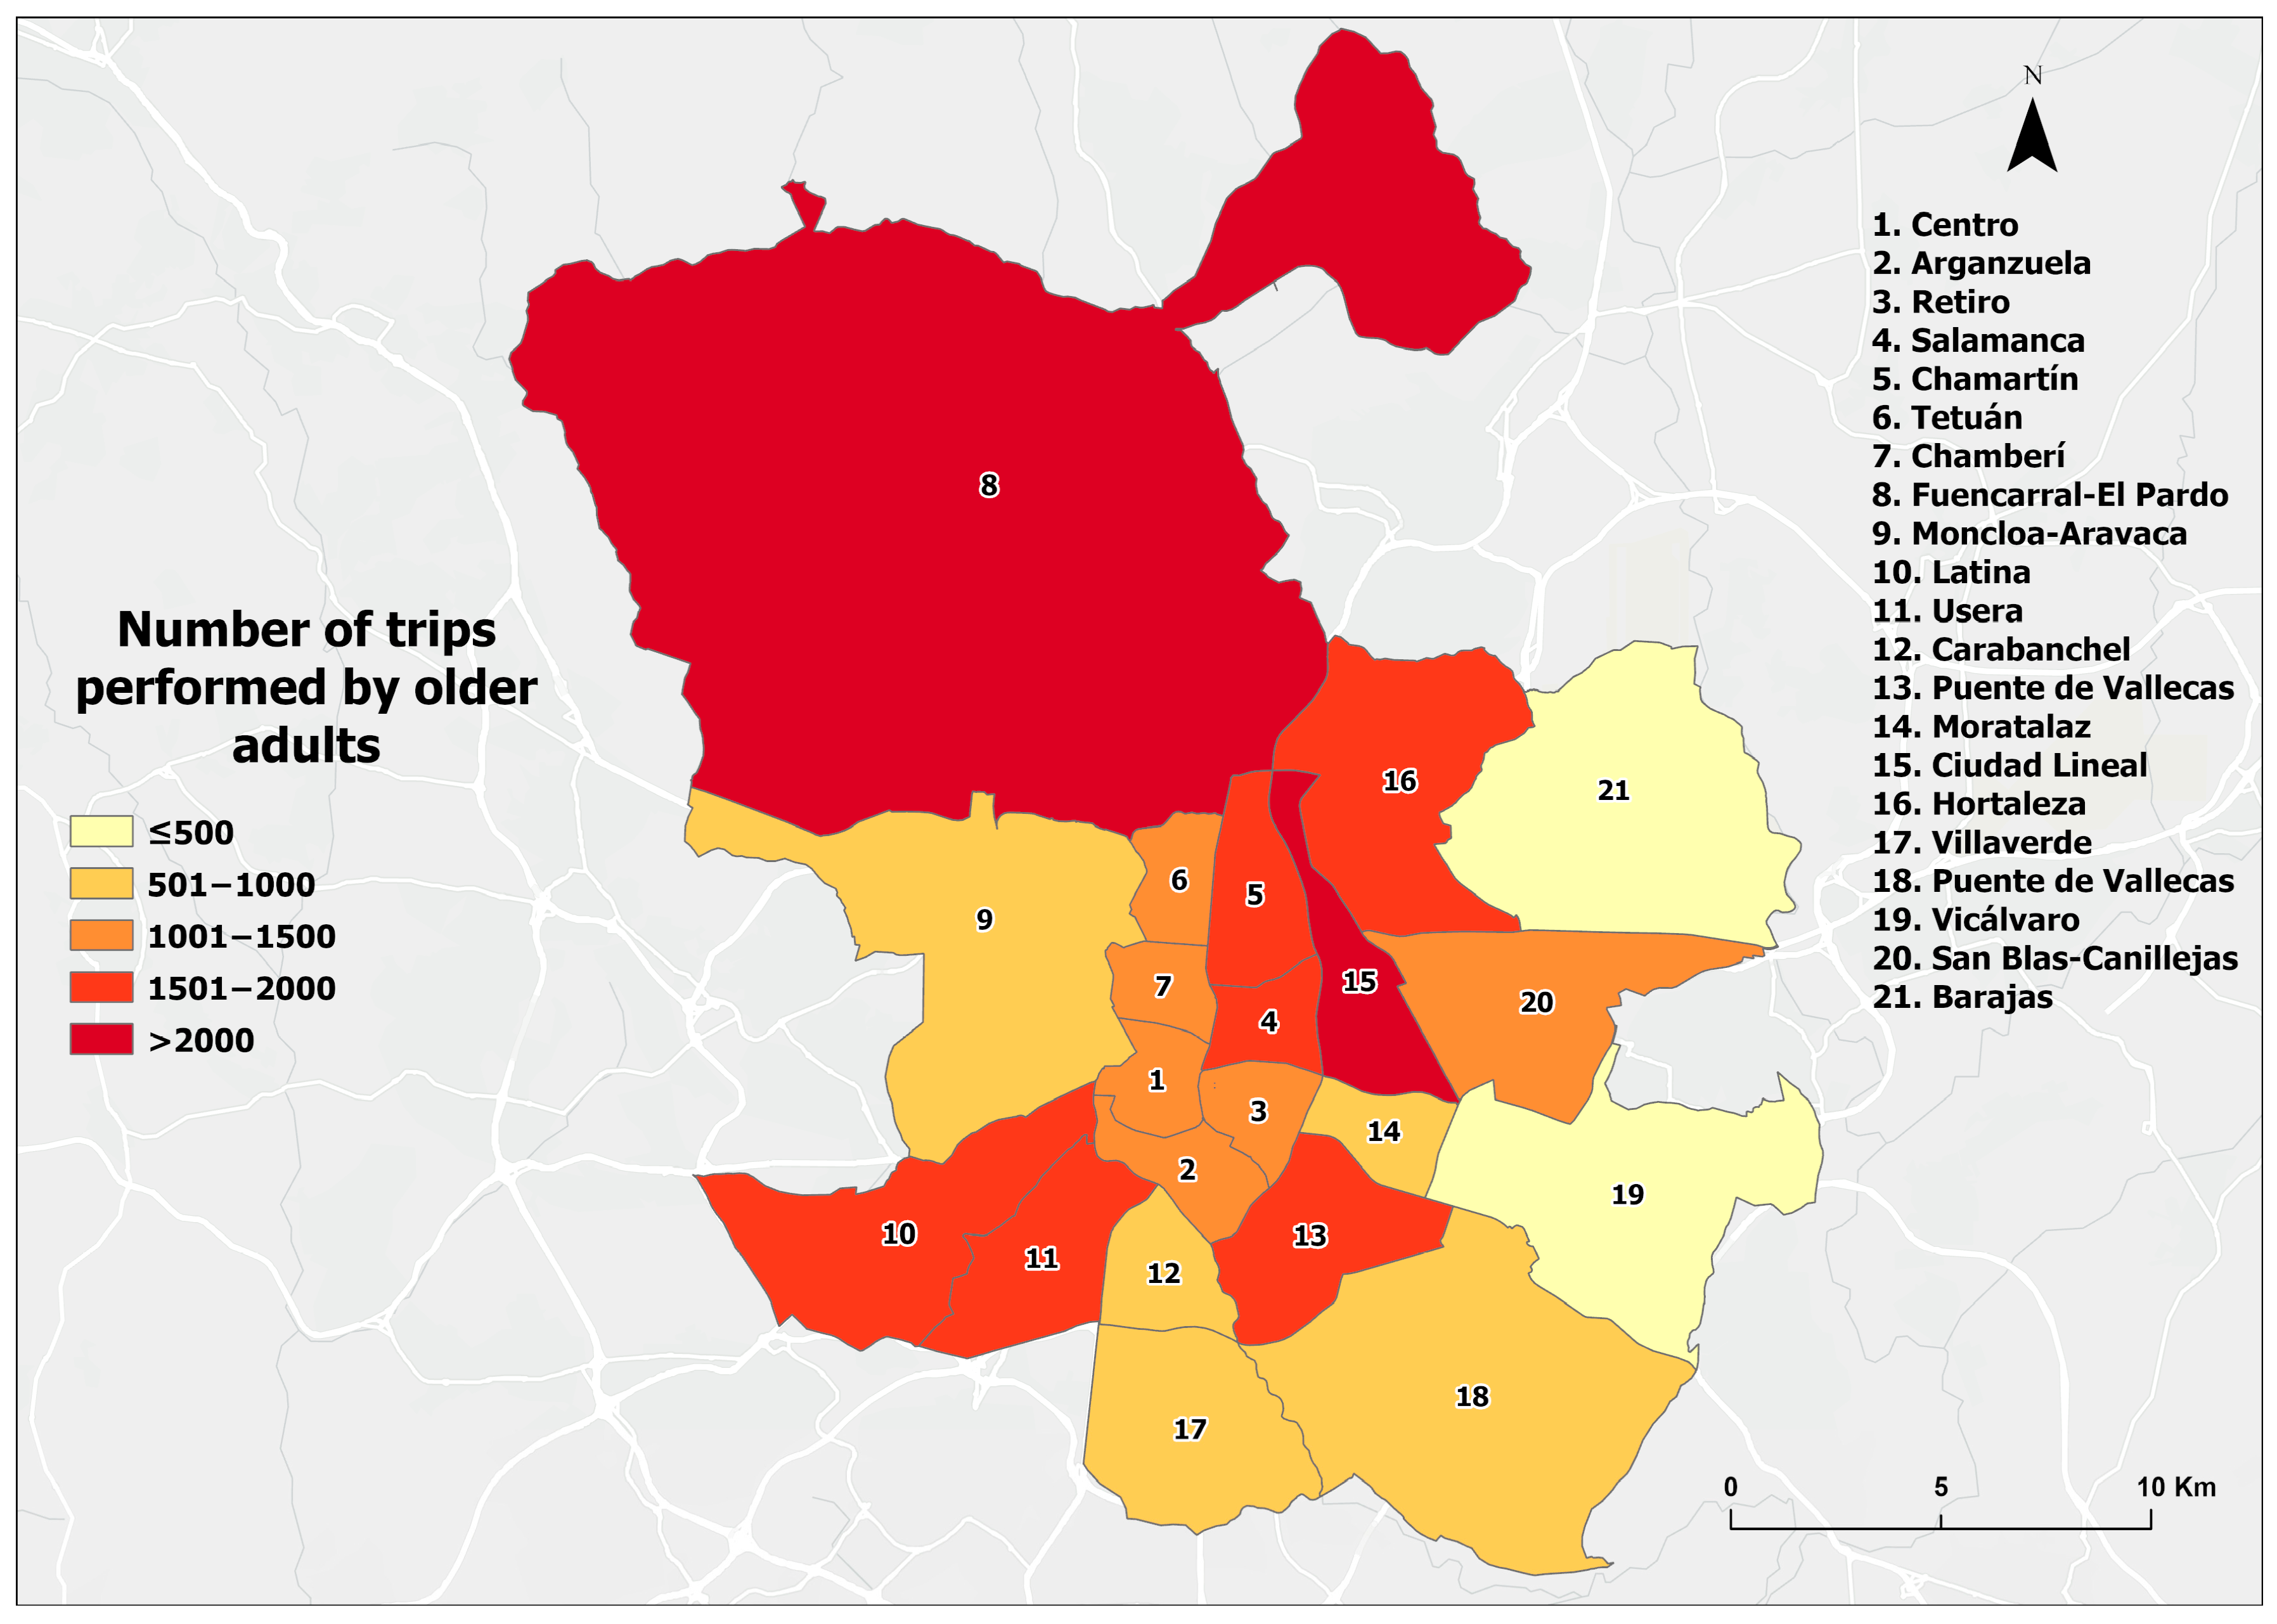
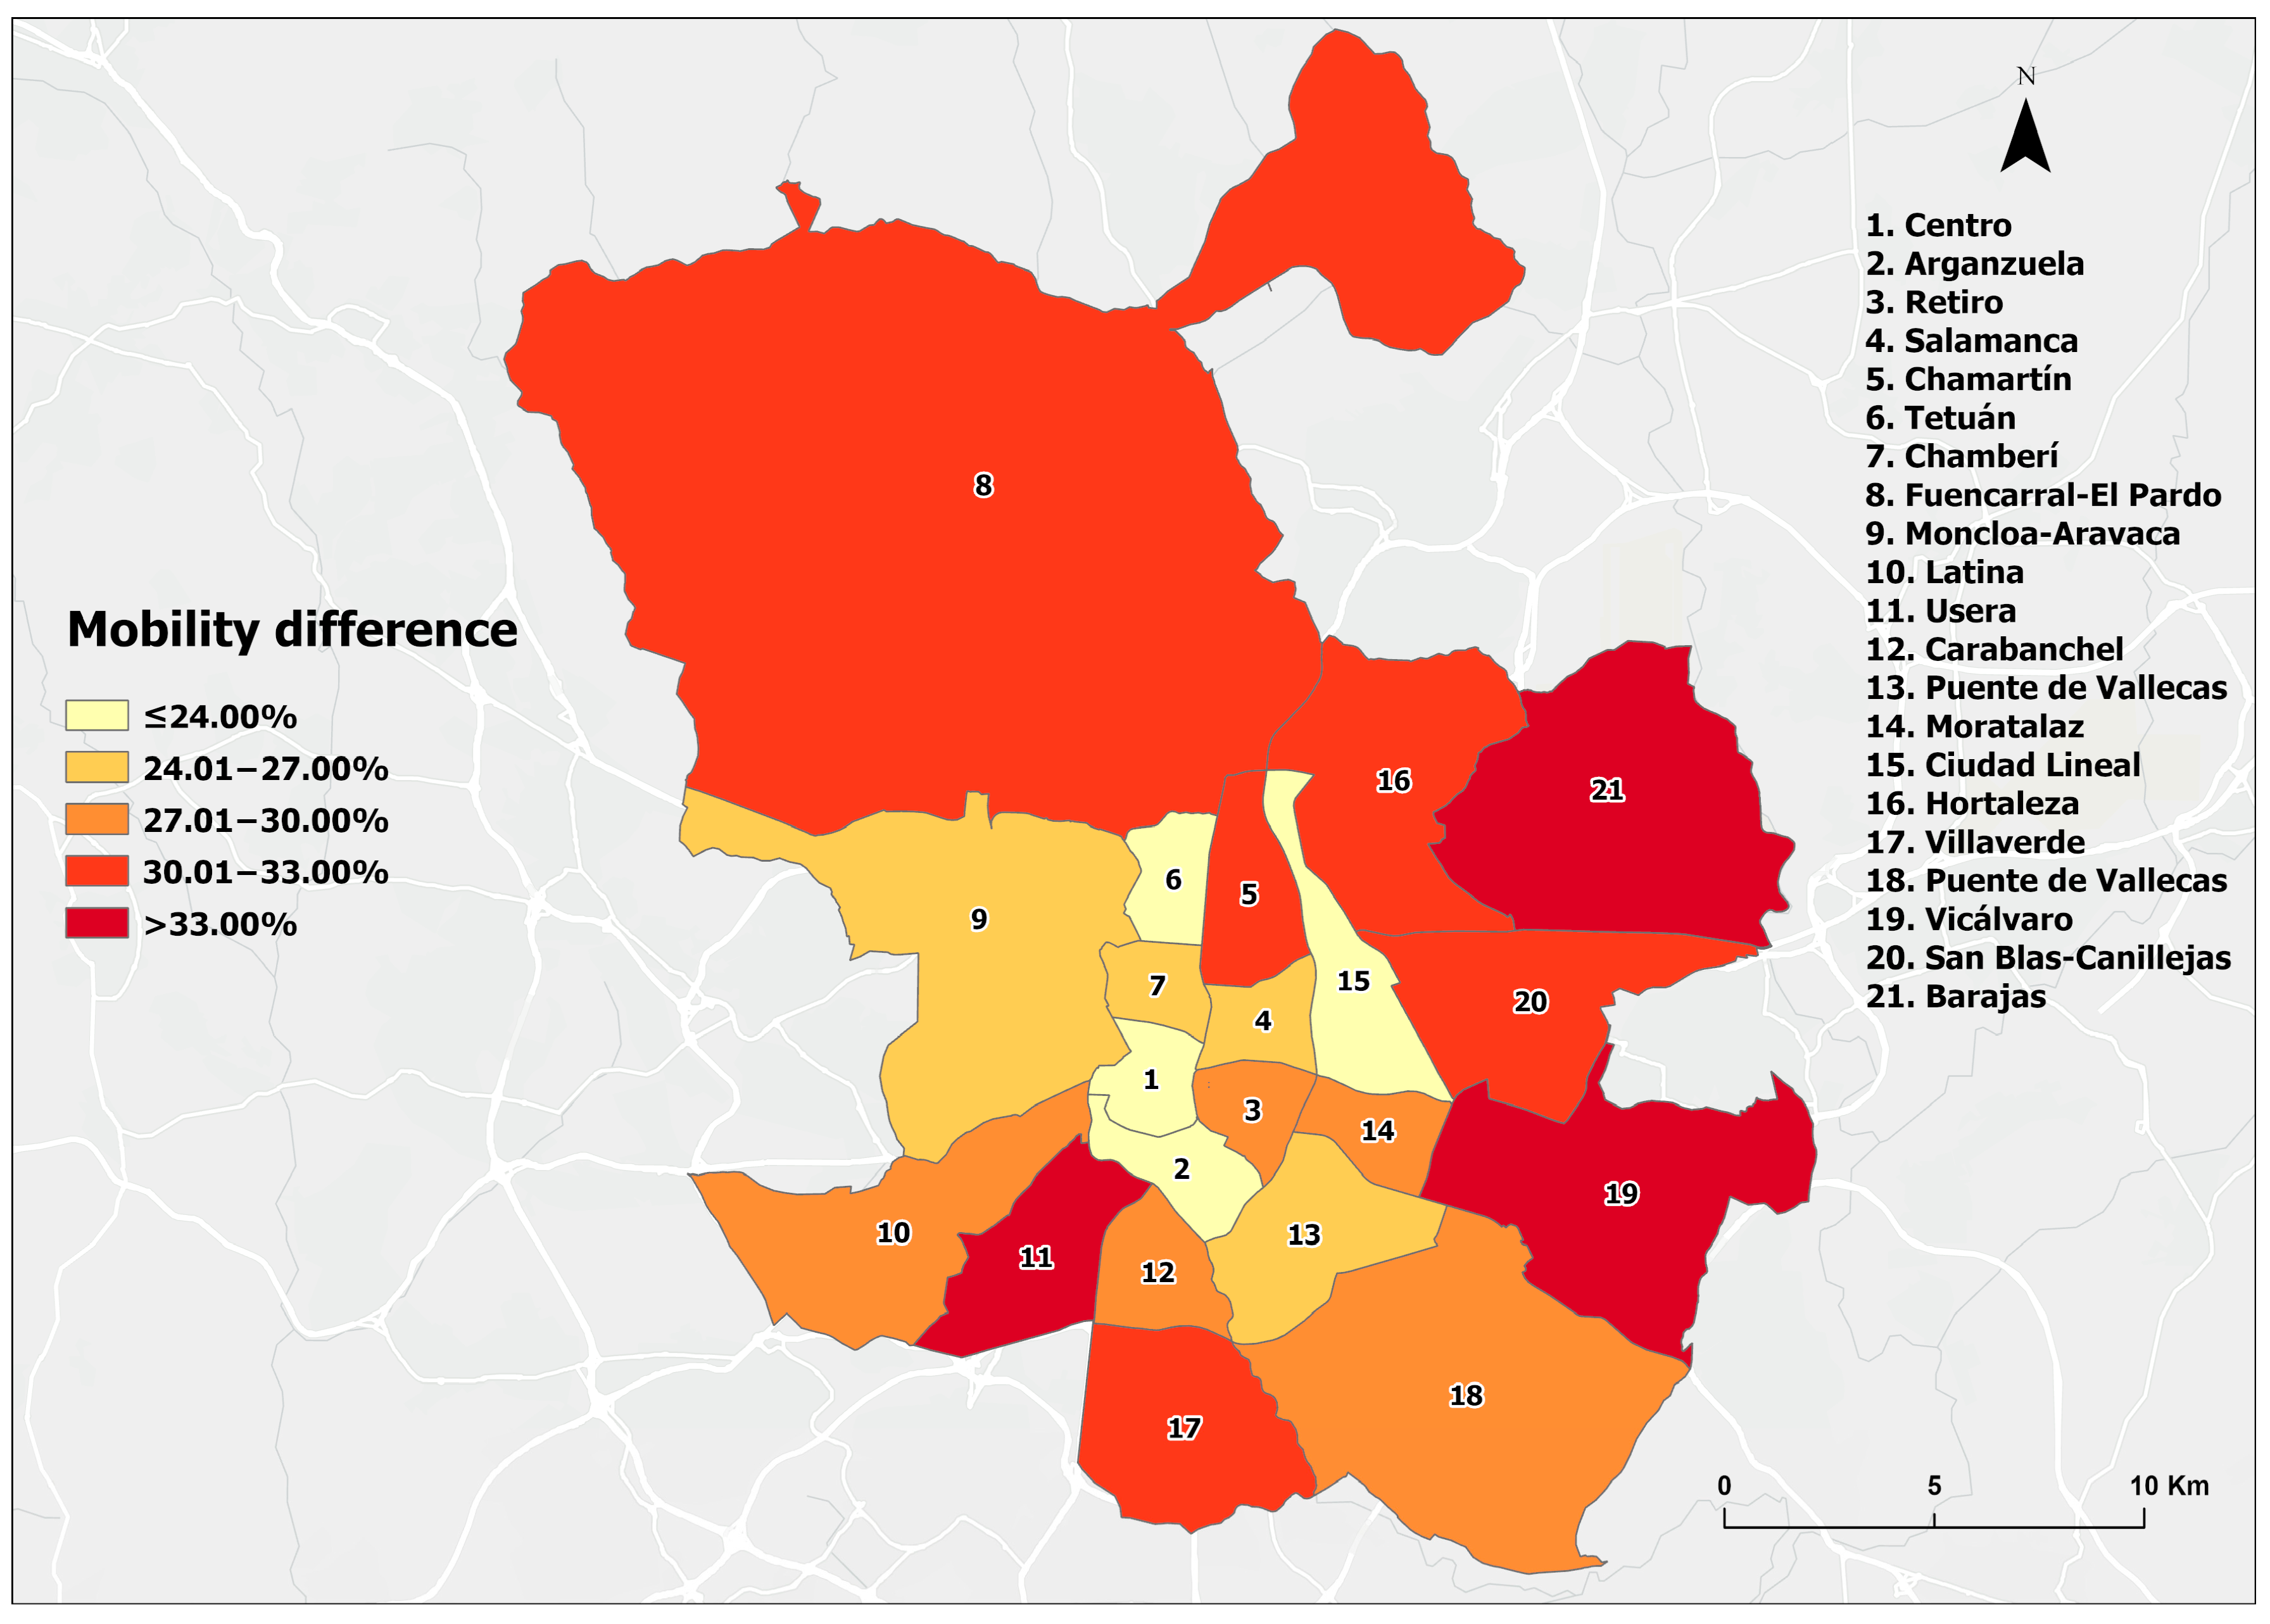
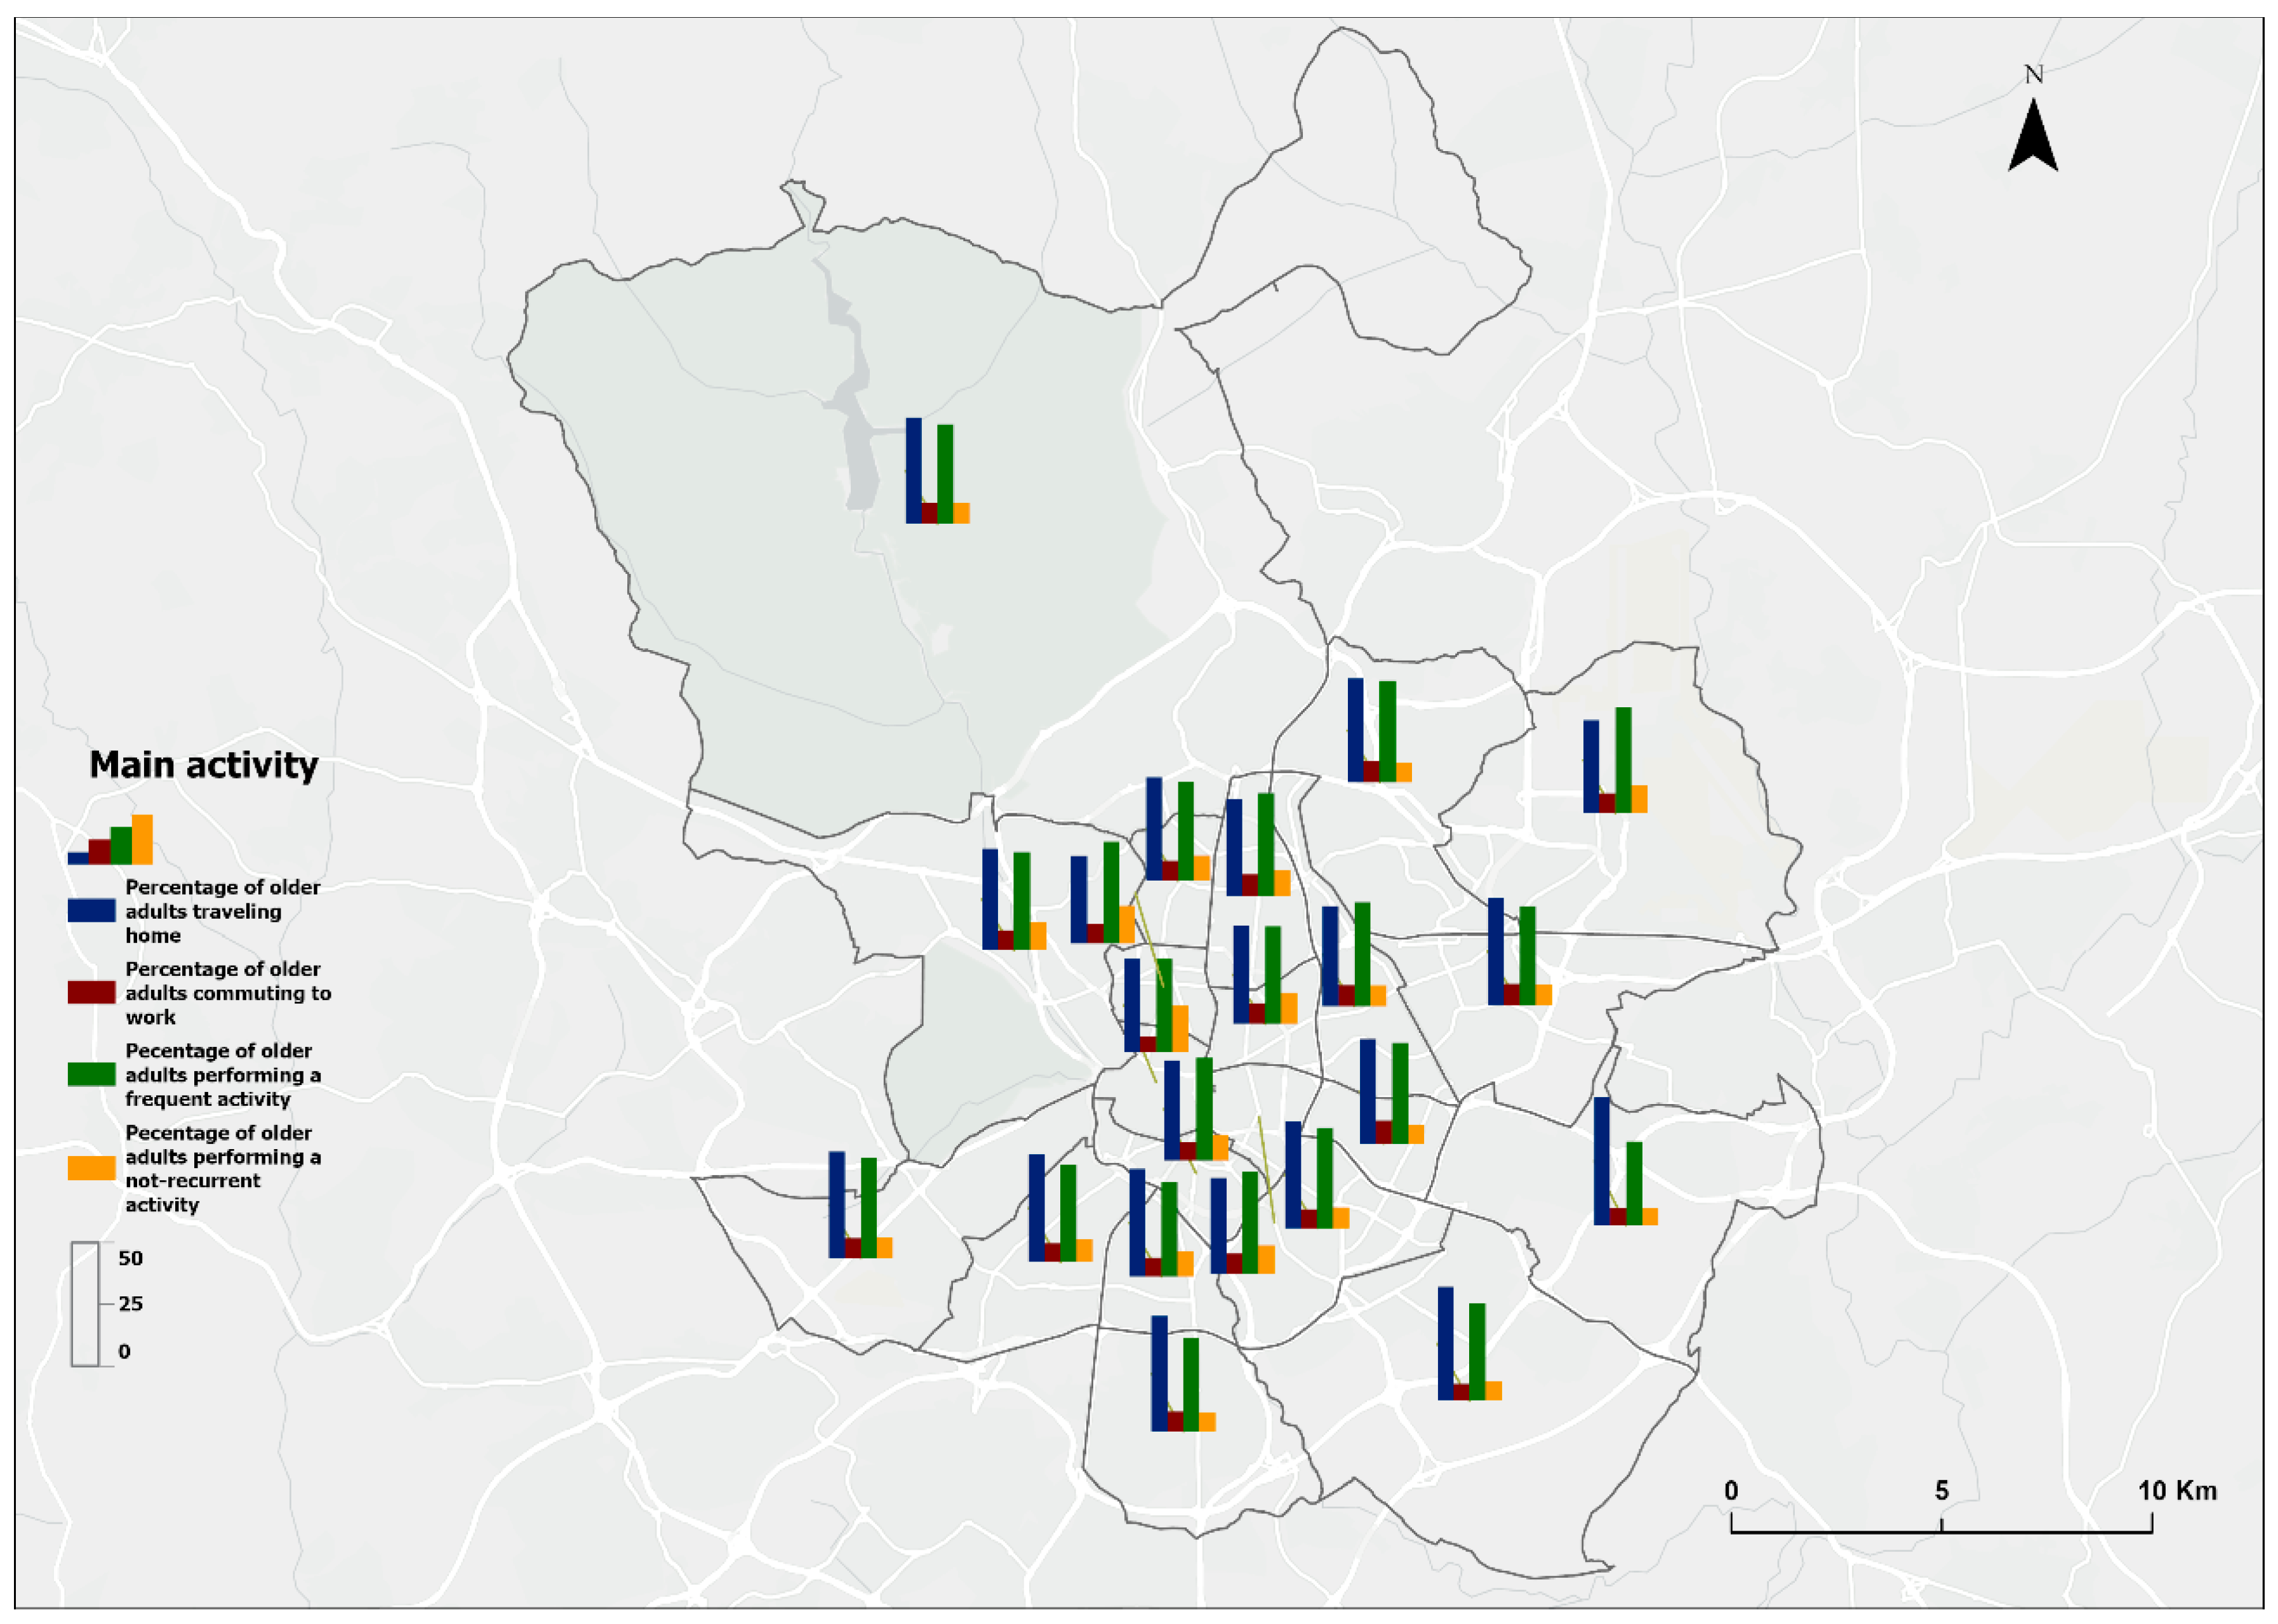
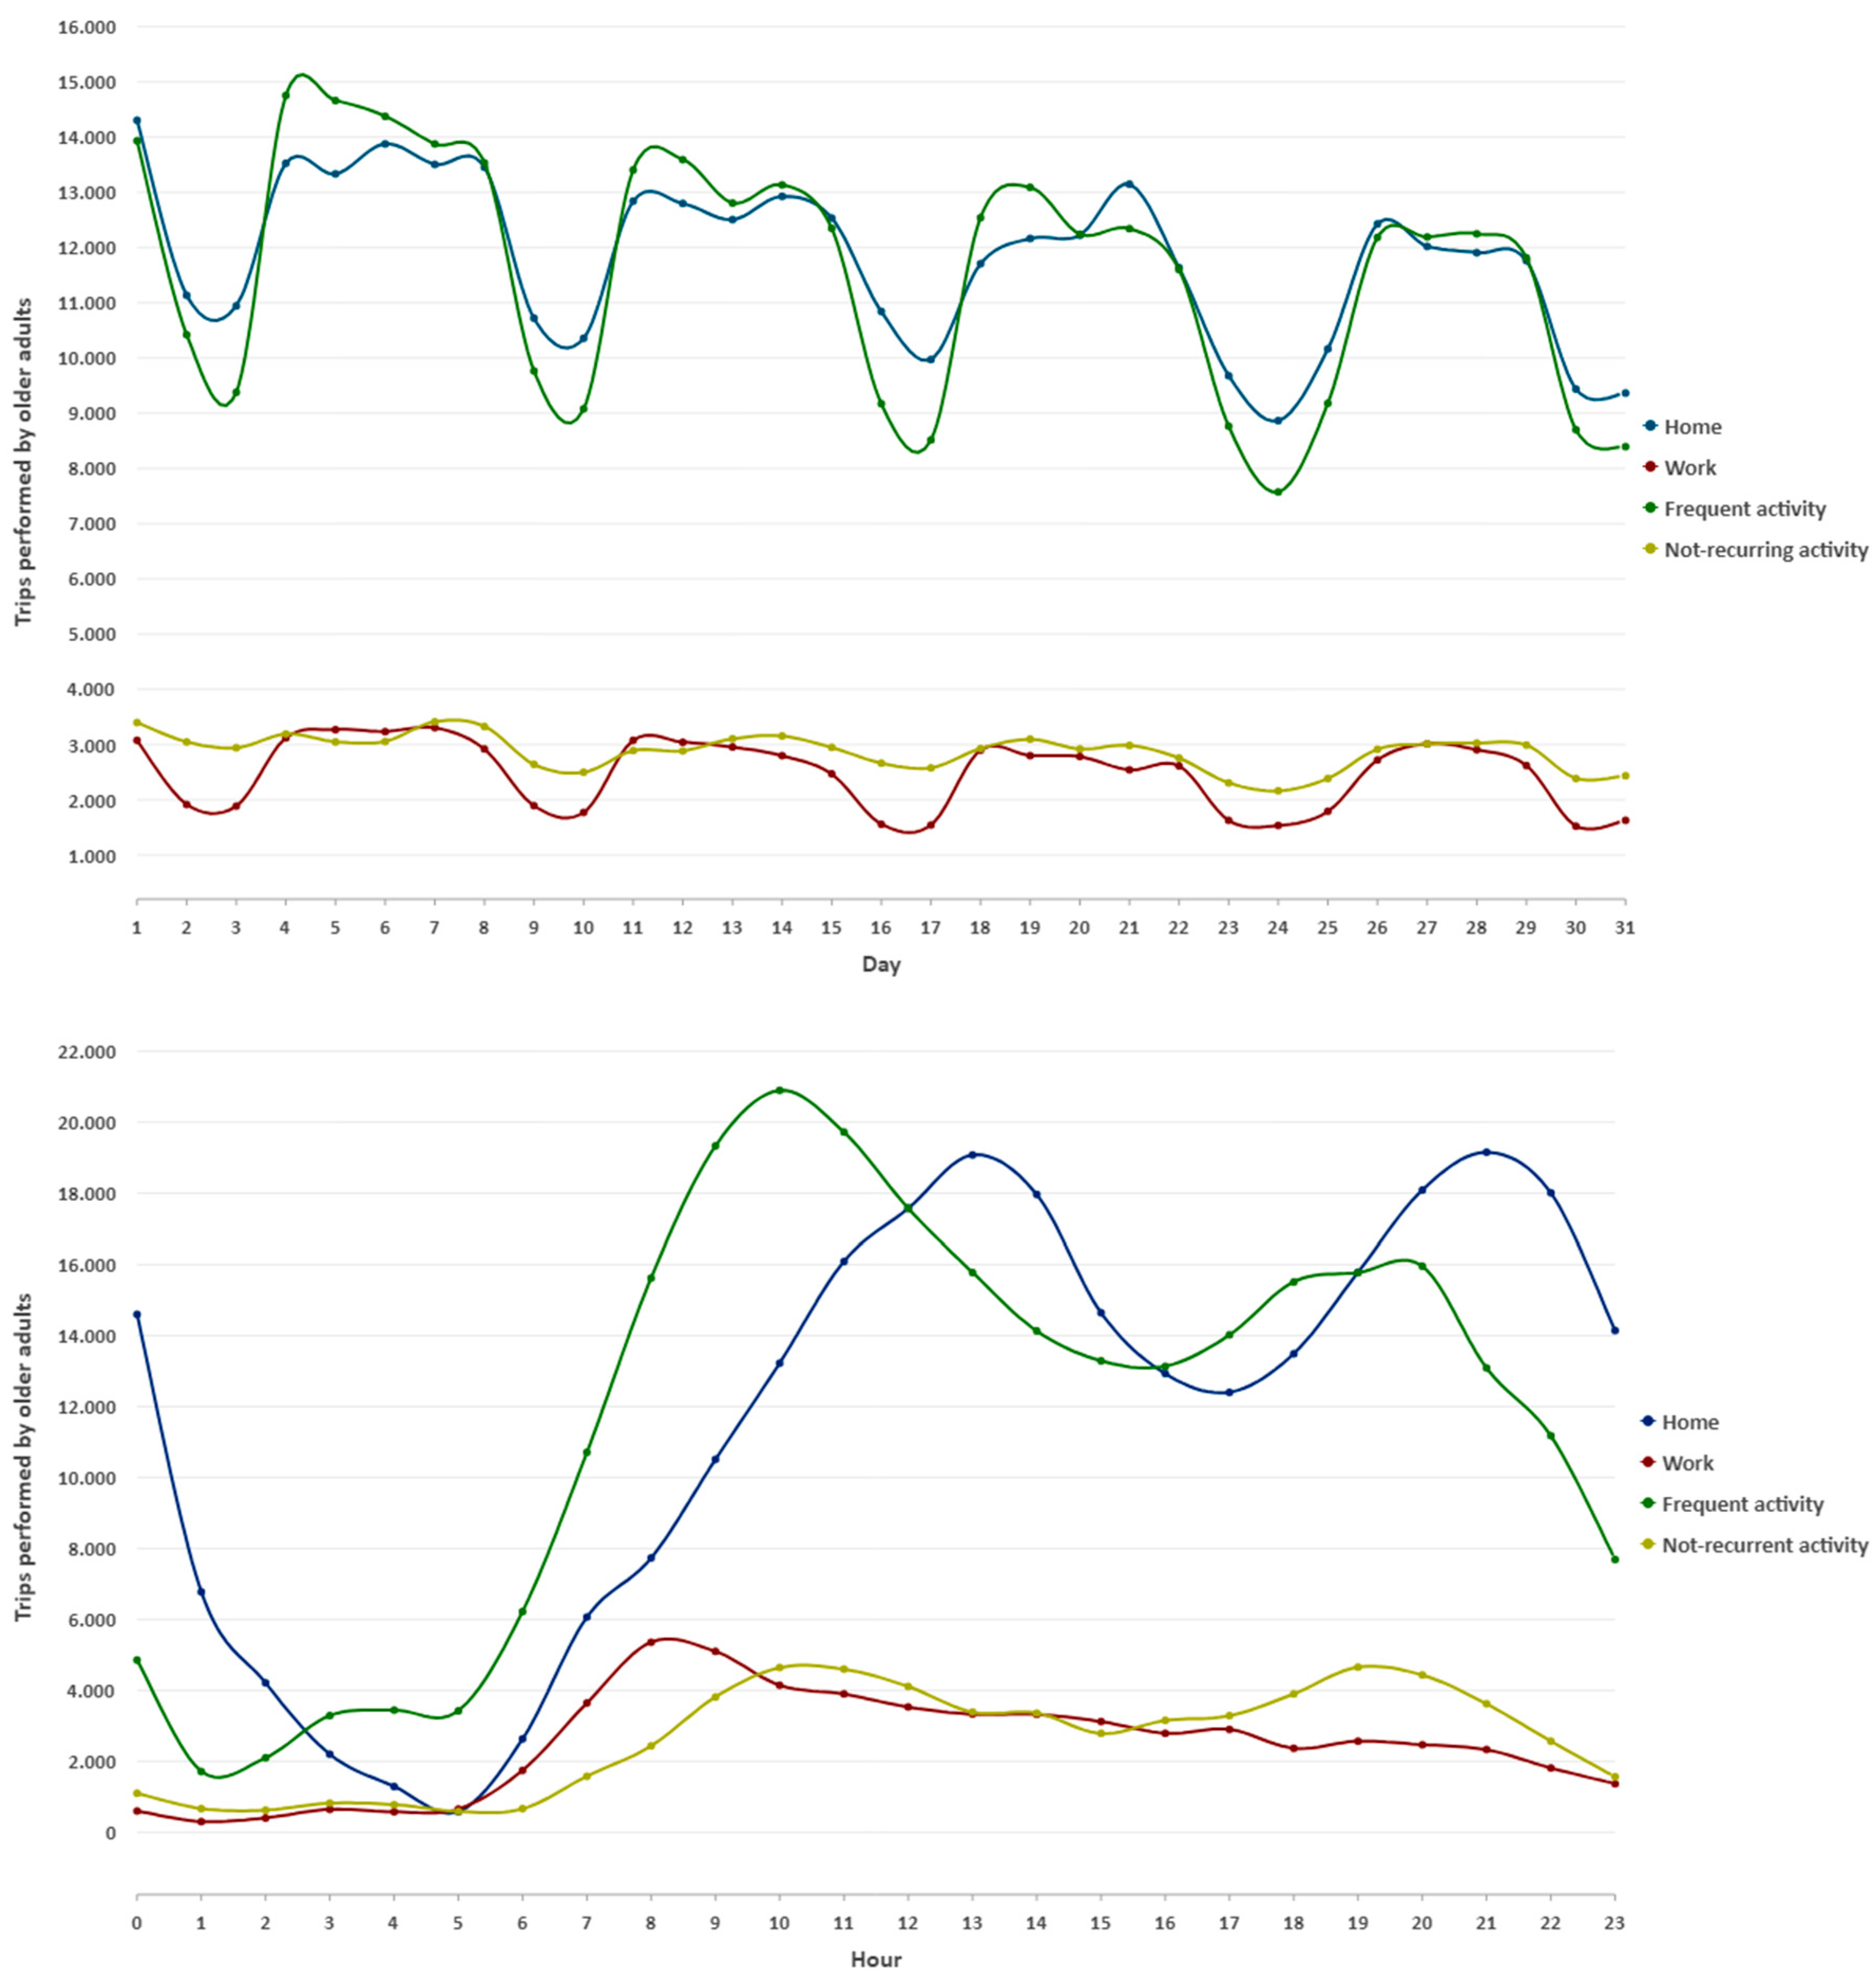
3.1. Analysis of Pedestrian Mobility Among Older Adults

The results indicate that, during the 2022 heat wave in Madrid, 61% of trips made by individuals aged 65 and older during the hottest hours (4:00 PM) were short-distance, i.e., less than 2 km. This type of mobility showed a significant association with the average number of trips (r = 0.99), suggesting that older adults tend to make shorter trips during periods of extreme heat. In contrast, long-distance trips (more than 10 km), which accounted for only 3.1% of trips, experienced a 12.6% reduction compared to days with normal thermal activity. Medium-distance trips (35.9%) showed the smallest decrease at 5.1%, while trips shorter than 2 km decreased by 7.3%. These data indicate an adaptation of mobility based on adverse climatic conditions.
On weekdays, particularly Mondays, 25.9% more trips were recorded than on non-working days. Additionally, a progressive decline in the number of trips was observed as the heat wave progressed, with a 20.9% reduction between the first (Saturday, 9 July) and the last day of extreme temperatures (Wednesday, 26 July). This pattern suggests that older adults adjust their mobility based on the duration and intensity of the heat, avoiding the hottest hours of the day (between 12:00 PM and 6:00 PM). For example, on 14 July, the hottest day, a 30.6% and 35.1% decrease in trips was recorded at 4:00 PM compared to 11:00 AM and 8:00 PM, respectively (Table 2 and Figure 1).
Regarding the spatial distribution of mobility, districts with the highest pedestrian activity during the hottest hours were located near the city center, particularly in the northern, eastern, and southern residential districts (Figure 2). These districts, which have a higher concentration of services, facilities, and green areas, showed a smaller reduction in mobility during the heat wave compared to the southeastern and eastern districts of Madrid, where mobility decreased more significantly (Figure 3). This suggests that the availability of urban infrastructure and services, such as climate shelters and health centers, influences the ability of older adults to maintain their mobility during periods of extreme heat.
The analysis of the sociodemographic characteristics of travelers revealed that 61.2% of trips were made by women aged 65 and older, who experienced a 12.8% reduction in mobility during the heat wave compared to a 10% reduction among men of the same age. A high correlation was observed between the average number of trips and the percentage of older women (r = 0.99), indicating that women are more likely to make short trips during periods of extreme heat. Regarding income level, 61.7% of trips were made by individuals with incomes above EUR 1250 per month, 38.1% by individuals with incomes between EUR 833 and EUR 1250 per month, and only 0.2% by individuals with incomes below EUR 833 per month. The latter two groups showed the greatest reduction in trips during the heat wave, with decreases of 6.1% and 9.8%, respectively, compared to a 4.6% reduction among those with higher incomes. These data suggest that socioeconomic status also influences the ability to adapt to heat. Additionally, trips in the central and northern districts of Madrid were predominantly made by older adults with medium-high incomes, while trips in the southern districts were mainly made by individuals with medium-low or low incomes (Figure 4).
The destination activities of trips showed a high association with trips made by older adults (r = 0.97). Frequent activities, such as grocery shopping or leisure activities, accounted for 40.2% of trips, while trips home constituted 42.1%. The former type of activity was more common in the central districts of the city, while trips home predominated in the southern residential districts of Madrid. On weekdays, frequent activities were the main reason for travel, while on weekends, trips home were more common. Non-recurrent trips, such as tourism or sporadic trips (9.6% of trips), were the only ones that did not show a significant decrease during the heat wave, suggesting that these activities are less sensitive to extreme climatic conditions. Work-related trips (8.1% of trips) were the most dispersed across the municipality based on standard deviation values, while non-recurrent activities were more visible in the central district of the city (Figure 5).
Regarding the time of day, on the hottest day of the month, frequent activities were predominant during the morning and afternoon, while trips home were more common at midday and night. This suggests that, despite having the same pattern, the decrease in activity for recurrent activities was greater than for trips home during the hottest hours (Figure 6).
The correlation analysis revealed a low association between the average number of trips and sociodemographic variables, with only a moderate correlation with the percentage of older adults living alone (r = 0.31). However, a significant correlation was observed between mobility and environmental variables, particularly the availability of climate shelters (r = 0.81), health centers (r = 0.79), and public transport stops (r = 0.78). These variables also showed a high correlation with each other, suggesting that the presence of urban infrastructure and services is a key factor in maintaining the mobility of older adults during periods of extreme heat. Additionally, an inverse relationship was observed between the percentage of green areas and the urban heat island effect index (r = −0.71), indicating that green areas are important for mitigating the urban heat island effect. A certain relationship was also identified between the percentage of the population living alone and the urban heat island effect index (r = 0.47), suggesting that districts with a higher population at risk of social isolation are more exposed to the urban heat island effect (Figure 7).

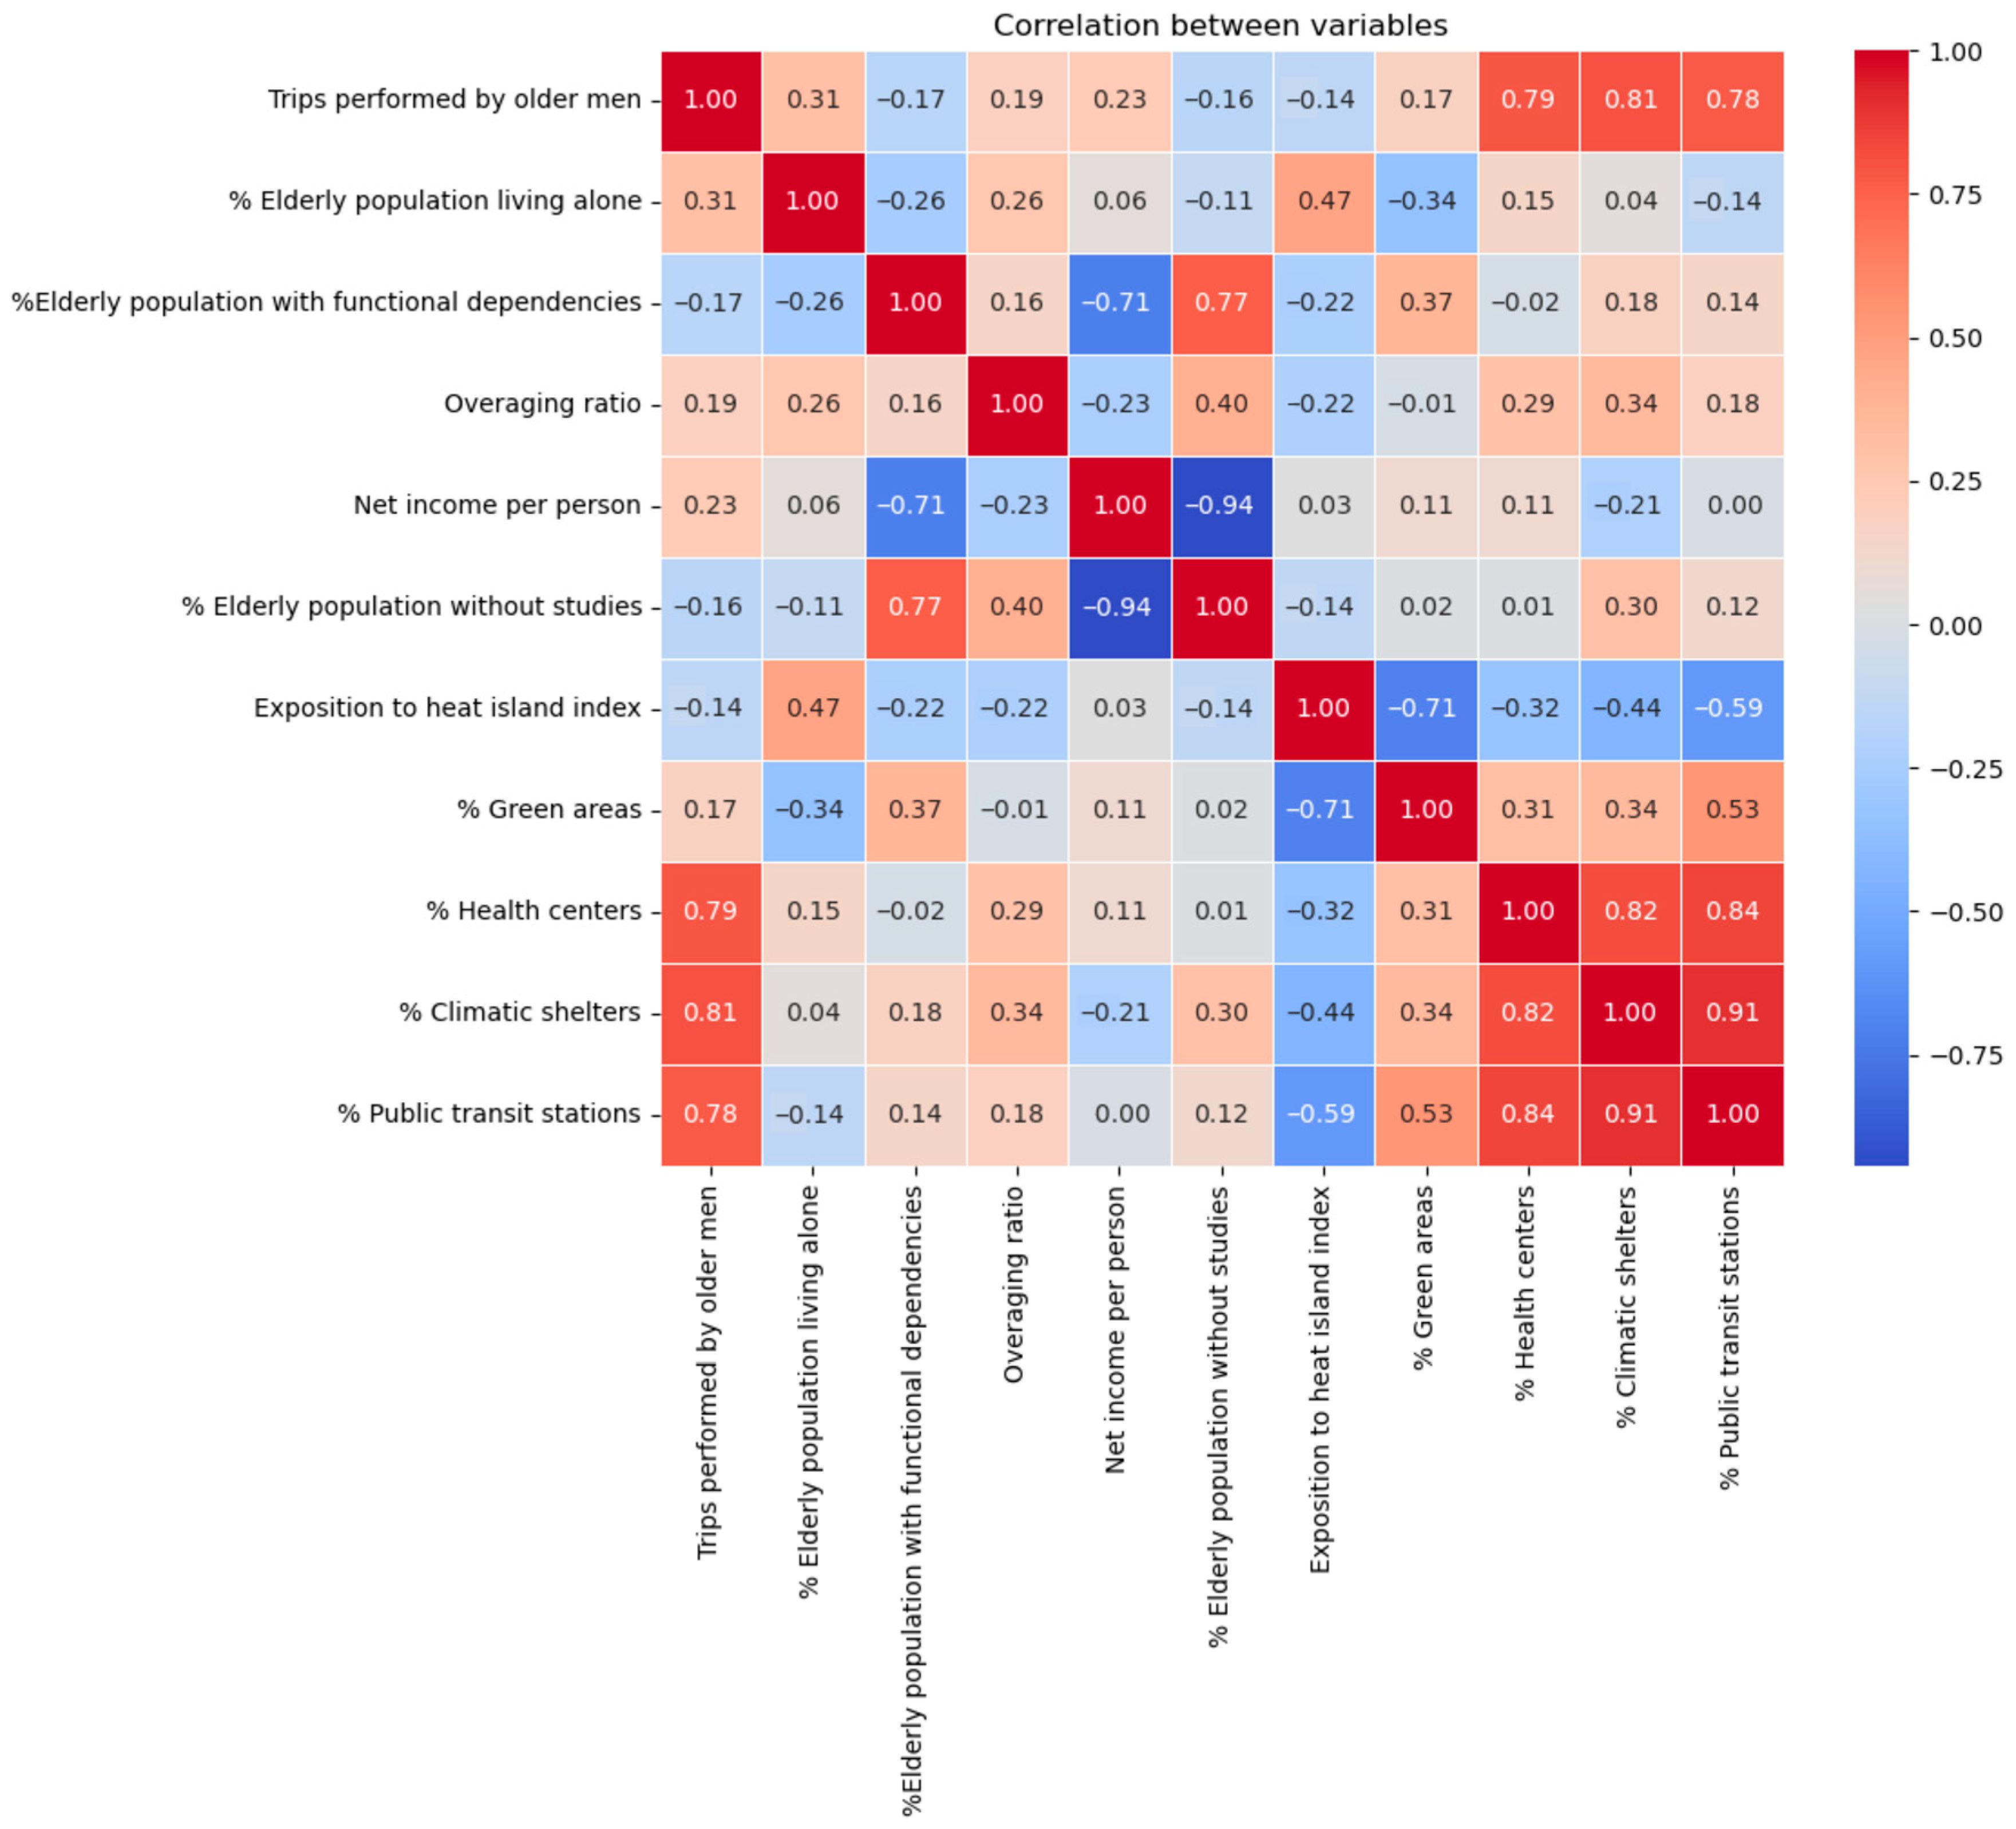
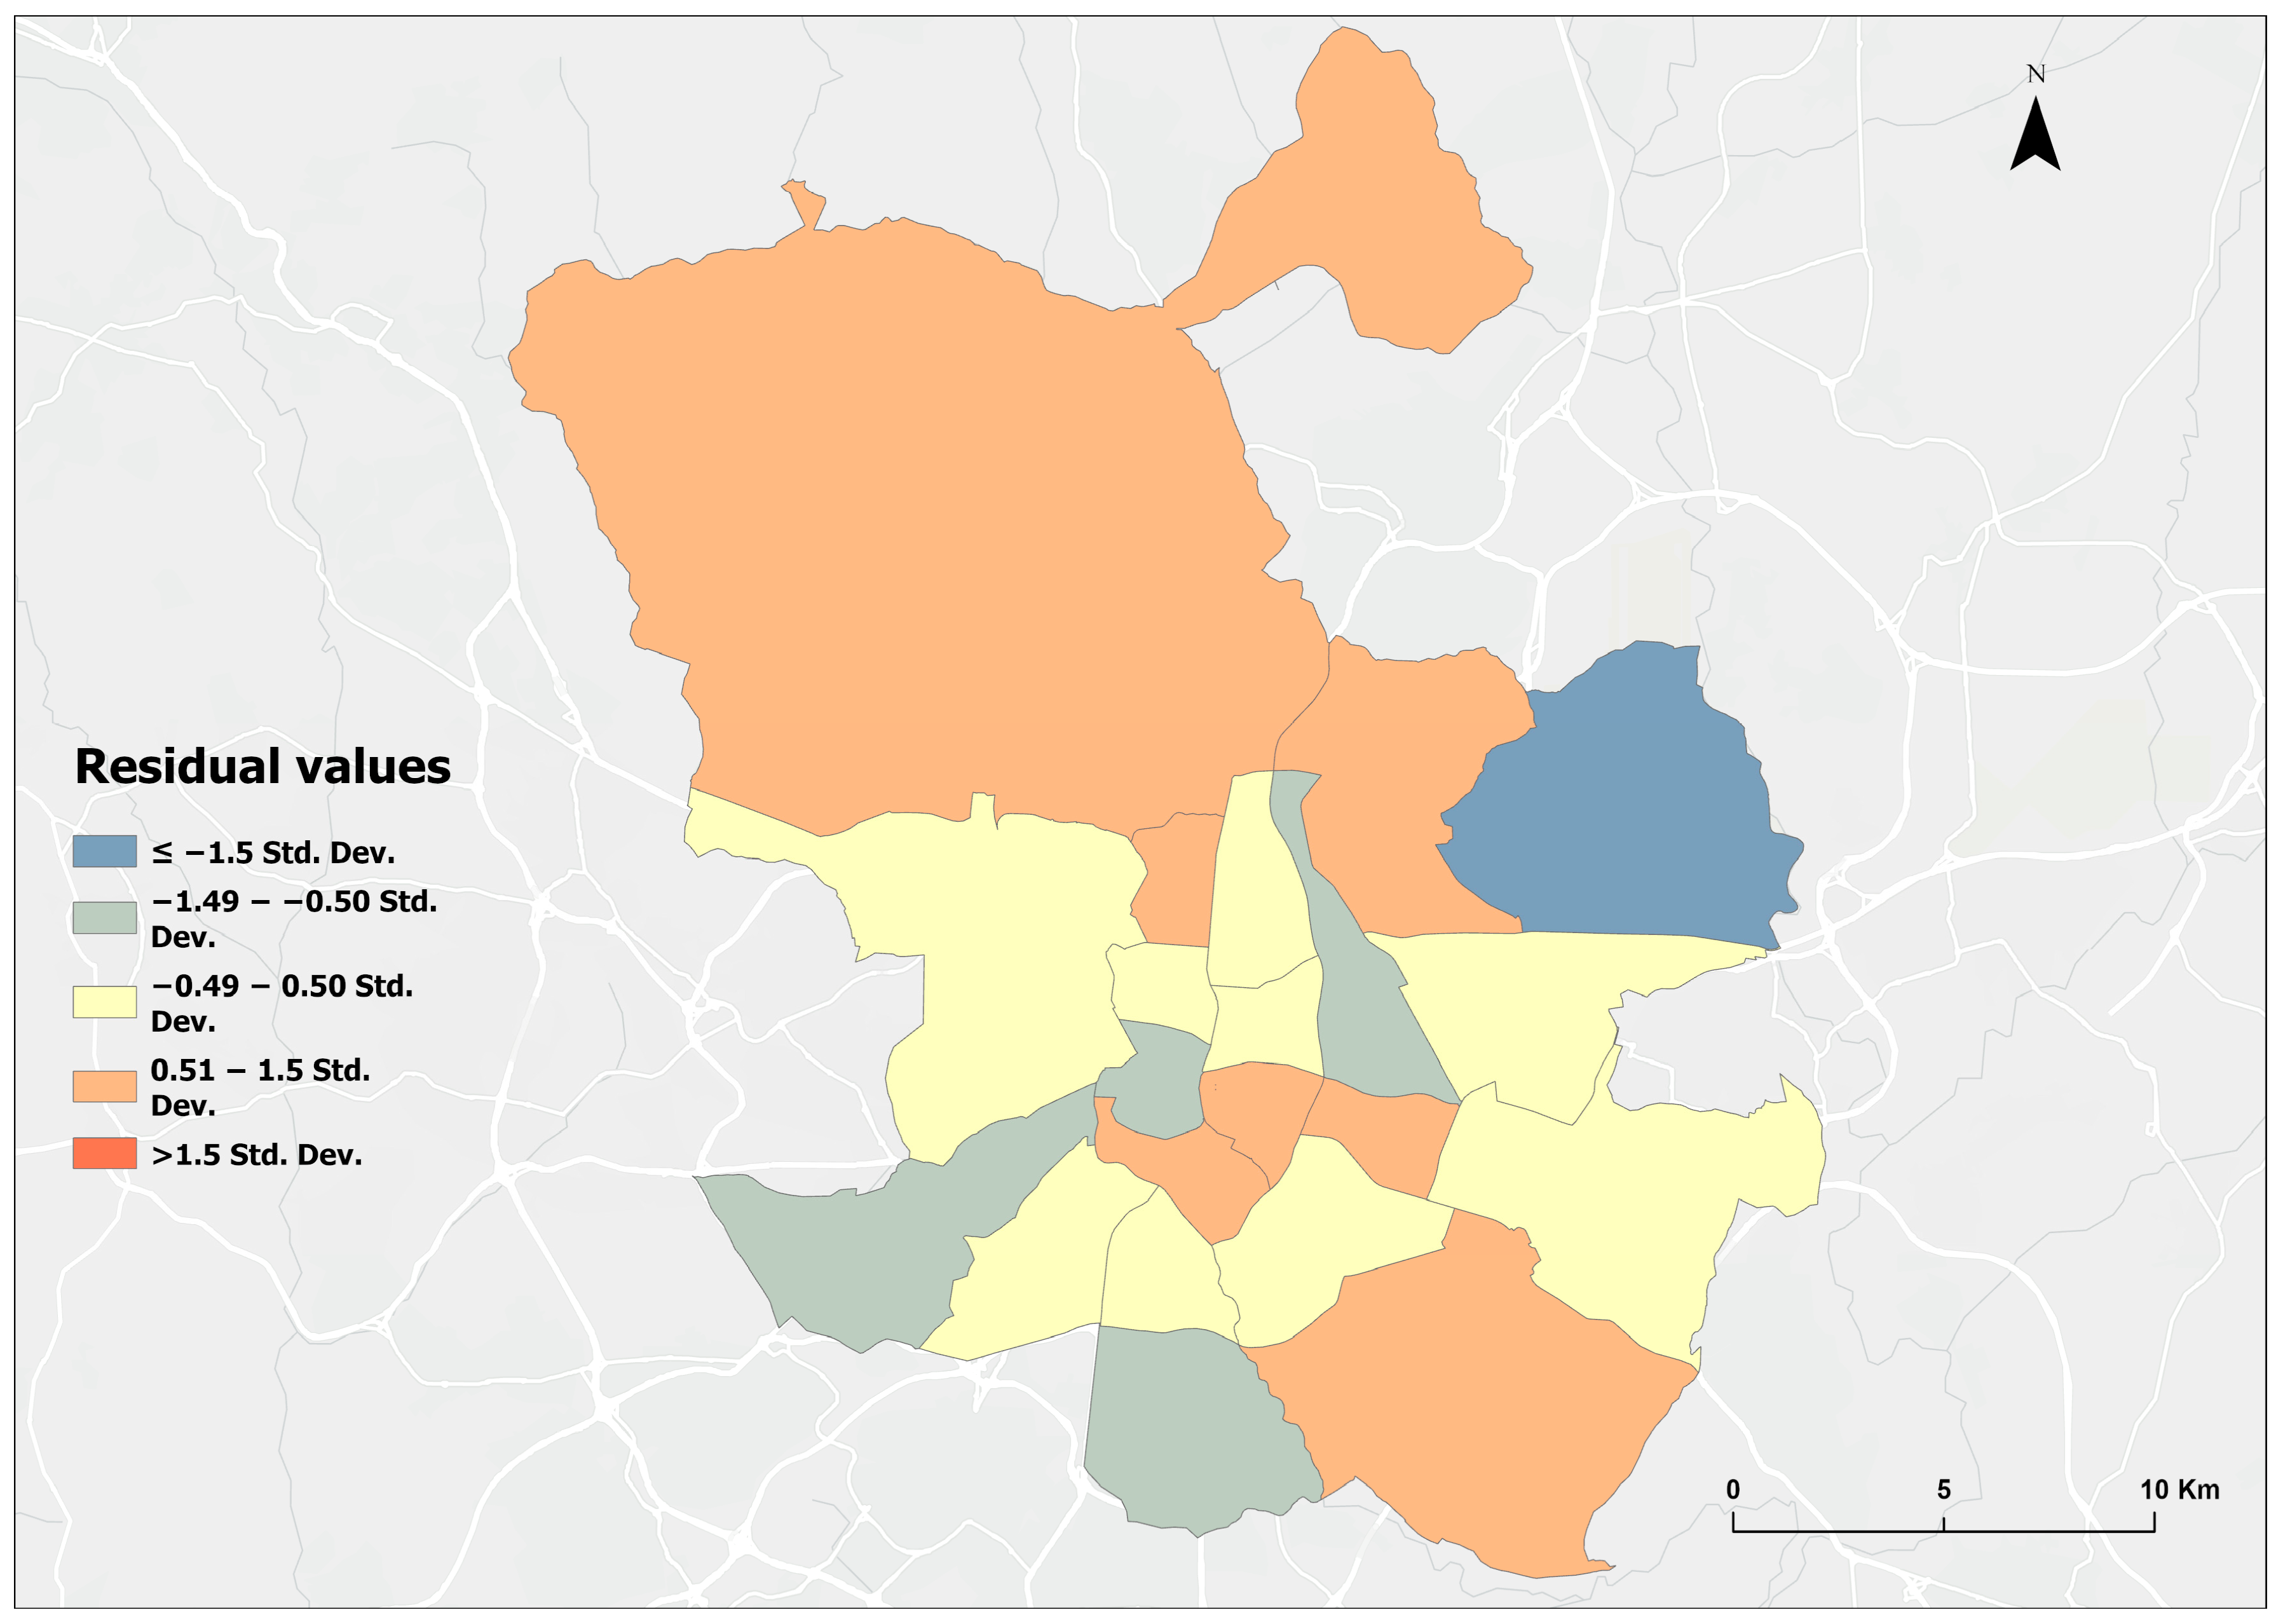
3.2. Analysis of the Multiple Linear Regression Model

The multiple linear regression model, with a high R2 value (0.92), indicates a good model fit (Table 3). The F and Wald statistics have a p < 0.001, making them highly significant and confirming the robustness of the model. The Jarque–Bera test has a p-value of 0.51, indicating that the residuals are normally distributed. The Koenker test has a p-value of 0.71, suggesting no heteroscedasticity in the data and that the standard errors of the estimated coefficients are reliable. The Moran’s I index has a p-value of 0.26, indicating no spatial autocorrelation in the model residuals. Additionally, the model shows no signs of multicollinearity, so the coefficients can be interpreted with confidence.
This model confirmed the importance of environmental variables. The most significant variables were the percentage of public spaces converted into climate shelters (standardized coefficient = 1.015) and the income level (standardized coefficient = 0.623). The percentage of older adults living alone (standardized coefficient = 0.242) is also significant. However, the percentage of green areas showed a negative association with mobility (standardized coefficient = −0.260), which could indicate that, although green areas are important for mitigating the urban heat island effect, their current characteristics (typology, quality, quantity, distribution, and accessibility of tree vegetation) are insufficient to favor pedestrian mobility during extreme heat.
The residual mapping indicates that the model predicts the trips made by older adults well, although it suggests that in the north and central-south of the city, there are more trips than predicted by the model, but within a moderate range. In contrast, in some residential neighborhoods in the south of the city, there are fewer observed trips than predicted by the model, but also within a moderate range. Only the Barajas district, located in the east of the city, falls into an unusual range in the model’s underestimation. This may be due to the special character of this district, which has a low demographic weight due to the location of the city’s airport (Figure 8).

4. Discussion

The influence of climate change on human behaviors, such as pedestrian mobility and the use of public spaces during extreme heat, is poorly understood [49,67]. The literature review shows limited evidence on heat adaptation among older adults, despite their vulnerability and low risk perception [43,68]. This makes it difficult to adopt measures such as hydration, appropriate clothing, and reduced physical activity during heat waves [6]. Additionally, heat prevention campaigns have been questioned for their limited effectiveness and lack of knowledge about the mobility of this group [44,69].
The results of this research provide a detailed understanding of the pedestrian mobility patterns of older adults during the 2022 heat wave in Madrid, largely confirming the hypothesis that the mobility of this group is conditioned by environmental and sociodemographic factors. The findings reveal that older adults adjust their mobility based on extreme climatic conditions, reducing the distance of their trips and avoiding the hottest hours of the day, which supports the two research questions: (1) the patterns of pedestrian mobility behavior during the heat wave are characterized by a decrease in trip distance and temporal adaptation to avoid the hottest hours and (2) variations in mobility are conditioned by factors such as the availability of urban infrastructure, socioeconomic status, and the characteristics of the built environment. These new findings are significant in the context of European cities with a continental Mediterranean climate and high mortality rates due to heat waves among the vulnerable aging population [64].
First, the results show that most trips made by older adults during the hottest hours were short-distance (less than 2 km), suggesting a behavioral adaptation to minimize exposure to extreme heat. This finding aligns with previous studies indicating that older adults tend to reduce the distance of their trips during periods of extreme heat, adopting strategies such as modifying departure times or avoiding the hottest hours of the day [50]. However, the overall reduction in mobility during the heat wave (7.3% for short trips) was lower than expected, which could indicate the limited effectiveness of prevention campaigns and low risk perception in this vulnerable group [70]. This result underscores the need to improve communication and adaptation strategies specifically targeted at older adults, especially in the early days of a heat wave when risk perception may be lower [46,71].
Regarding the spatial distribution of mobility, districts with the highest pedestrian activity during the hottest hours were located near the city center, where the availability of services, facilities, and green areas is greater. This pattern aligns with previous research highlighting the importance of urban infrastructure, such as climate shelters and health centers, in maintaining the mobility of older adults during periods of extreme heat [17,72]. In contrast, the southeastern and eastern districts of Madrid, with less coverage of services and green areas, experienced a greater reduction in mobility, suggesting that intra-urban inequalities in the availability of infrastructure may exacerbate the vulnerability of older adults to extreme heat [73]. This finding reinforces the need for urban policies that promote equity in access to services and public spaces that mitigate the effects of heat, especially in disadvantaged areas [32,74].
The analysis of sociodemographic characteristics revealed that older women, particularly those living alone, made more trips during the heat wave, which aligns with studies identifying this group as especially vulnerable due to their higher risk of social isolation and loneliness [8,26,27]. Additionally, individuals with lower incomes reduced their mobility more during the heat wave, suggesting that socioeconomic status influences the ability to adapt to extreme heat. This finding is consistent with previous research highlighting socioeconomic inequalities in heat exposure and vulnerability [24,28,29]. However, the low correlation between income level and mobility (r = 0.23) suggests that other personal, social, and urban factors may have a more significant impact on older adults’ pedestrian mobility [13,14]. In this regard, previous studies indicate that older adults’ mobility is influenced by factors such as physical and cognitive health, functional dependence, community support, characteristics of public space (accessibility and safety), and access to nearby services [75,76,77]. Furthermore, in retirement, many work-related trips disappear and mobility becomes more closely related to personal, social, or recreational activities [78]. The mobility of older adults often depends on urban factors such as land use, accessibility and adaptation of public spaces (safe and good pedestrian infrastructures), green areas, public transport options, and local services [79]. Moreover, many low-income older adults can maintain acceptable levels of mobility thanks to the support of family or community networks, which dilutes the statistical relationship between income and mobility [80,81].
The multiple linear regression model confirmed the importance of environmental variables, such as the availability of climate shelters and health centers, in the mobility of older adults during the heat wave. These results support the hypothesis that urban infrastructure is a key factor in maintaining mobility during extreme heat conditions. However, the finding of a negative association between the percentage of green areas and mobility (coefficient = −11.93) contrasts with previous studies, which highlight the role of green areas in reducing heat stress and promoting mobility [60]. In this regard, in Madrid, the pedestrian mobility of older people during heat waves occurs mainly in the central districts, which have a significant deficit of green areas. Furthermore, it is suggested that, although green areas are important to mitigate the urban heat island effect, their current characteristics (typology, quality, quantity, distribution, and accessibility of tree vegetation) are insufficient to favor thermal comfort and promote the pedestrian mobility of older people during periods of extreme heat [82]. Indeed, recent studies [83] have indicated that vegetation in urbanized areas of Madrid does not appear to significantly mitigate the effect of urban heat, which persists even in areas with greater vegetation cover, such as the districts on the outskirts. Thus, there is a need to adapt the characteristics of green areas to promote thermal comfort for the most vulnerable pedestrians in the face of extreme heat in a climate change scenario [22,38,84]. In this regard, new research highlights the need to promote heat mitigation strategies, such as increasing street shading and improving pedestrian mobility during extreme heat, through planting trees and climate-appropriate vegetation along sidewalks, creating parks and green corridors, and installing shading infrastructure such as pergolas and awnings [85]. Other studies emphasize the importance of promoting the use of high-albedo urban materials, such as reflective pavements, as well as passive cooling systems like fountains or water misting to help reduce temperatures [86]. Furthermore, the literature suggests that urban planning should prioritize accessibility, with wide shaded sidewalks and pedestrian areas, along with nature-based solutions such as green and aquatic spaces [38,39].
In terms of practical implications, the findings of this research underscore the importance of designing urban policies that favor the adaptation of older adults to climate change, ensuring access to infrastructure and services that mitigate the effects of extreme heat [33,51,87]. Specifically, it is necessary to increase knowledge on the evaluation of urban adaptation strategies to extreme heat events, at different spatio-temporal scales and implemented by local governments, to provide safe and sustainable urban areas and promote resilient communities with a high adaptive capacity to the threats of climate change [88,89]. In this regard, the expansion of the network of urban meteorological stations would contribute to generating more reliable predictive models (estimation of temperatures at the intra-urban level), improving urban planning (land use), regulating routes based on temperature, preventing health problems in vulnerable populations, and promoting urban livability [18]. Also, addressing the relationship between urban morphology factors and heat risks to the health of the aging population is essential to develop effective mitigation strategies to reduce these risks, such as reducing impervious cover and increasing adapted vegetation [19,21]. Likewise, the creation of more climate shelters in disadvantaged areas is recommended, as well as improving the accessibility of public spaces and services, such as green areas and health services [16,90]. Additionally, the results suggest the need to improve heat wave prevention campaigns, tailoring them to the specific needs of older adults, especially those living alone or with low incomes [27].
The originality of this research lies in its geospatial approach and the use of mobile phone data to analyze the pedestrian mobility patterns of older adults during a heat wave. This approach allows for a more precise understanding of how extreme climatic conditions affect the mobility of this vulnerable group, as well as the identification of intra-urban inequalities in heat exposure and adaptation [61]. These findings have significant implications for the design of more effective and equitable public policies, especially in the context of population aging and climate crisis [1]. Future research could delve into the specific adaptation strategies adopted by older adults, as well as the impact of interventions based on active monitoring, aimed at strengthening social and community networks [91]. Additionally, it would be relevant to explore the effect of urban interventions aimed at reducing vulnerability to extreme heat [15].
Despite the significant contributions of this research, it is important to acknowledge several limitations that may affect the generalizability and accuracy of the results. First, the mobile phone data used may affect the representativeness of the observed mobility patterns due to bias related to mobile device ownership among older adults. This could underestimate the mobility of this age group, particularly among those with lower socioeconomic status, where mobile phone ownership is less common. In this regard, previous studies [92,93,94] indicate that the lower ownership and use of these devices is due to various factors, such as economic limitations, a generational digital divide, lower perception of need, physical or cognitive difficulties associated with aging, and geographic location. Specifically, in Madrid, areas with a lower socioeconomic level register greater digital inequality [95]. However, this municipality has a higher income level and a lower level of digital divide than the Spanish average, which could influence a lower relative presence of older people with a low socioeconomic status, reducing the risk of selection bias in the data obtained. Likewise, the data do not allow for a detailed analysis of specific adaptation strategies, such as route modification or changes in transportation mode, which limits a deeper understanding of how older adults adjust their mobility in response to extreme heat. For this, it would be necessary to incorporate a qualitative approach to capture subjective risk perception and barriers to adaptation. Furthermore, although the study employs a robust geospatial approach, the lack of more precise data limits the assessment of the thermal behavior of the characteristics of urban spaces, using remote sensing technologies, computational modeling, albedo and urban materials analysis, and the observation and evaluation of vegetation (typology and quality of tree species) [96]. Additionally, the lack of precise data on the indoor thermal conditions of homes and their relationship with exposure to outdoor heat may limit the ability to fully assess the vulnerability of older adults [97]. These limitations suggest the need for future research that incorporates more comprehensive data and diverse sources of information to improve the accuracy and representativeness of the findings.

5. Conclusions

The results of this research provide a detailed understanding of the pedestrian mobility patterns of older adults during the 2022 heat wave in Madrid, highlighting how extreme climatic conditions influence their travel behaviors. It was observed that older adults adjust their mobility based on high temperatures, reducing the distance of their trips and avoiding the hottest hours of the day, particularly between 12:00 PM and 6:00 PM. This adaptive behavior, although limited, suggests some awareness of the risks associated with heat waves, but also reflects low adherence to prevention recommendations, which may indicate insufficient risk perception in this vulnerable group. Additionally, pedestrian mobility was significantly affected by environmental and sociodemographic factors, such as the availability of urban infrastructure (climate shelters, health centers, and public transport) and socioeconomic status, underscoring the importance of intra-urban inequalities in heat exposure and adaptation.
The spatial distribution of mobility revealed that districts with the highest pedestrian activity during the hottest hours were located near the city center, where the availability of services and green areas is greater. In contrast, the southeastern and eastern districts of Madrid, with less coverage of services and green areas, experienced a greater reduction in mobility, suggesting that inequalities in the availability of urban infrastructure may exacerbate the vulnerability of older adults to extreme heat. This finding reinforces the need for urban policies that promote equity in access to services and public spaces that mitigate the effects of heat, especially in disadvantaged areas.
Regarding sociodemographic characteristics, it was observed that older women, particularly those living alone, made more trips during the heat wave, identifying this group as especially vulnerable due to their higher risk of social isolation and loneliness. Additionally, individuals with lower incomes reduced their mobility more during the heat wave, suggesting that socioeconomic status influences the ability to adapt to extreme heat. However, the low correlation between income level and mobility suggests that other factors, such as the availability of urban services, may have a more significant impact on the pedestrian mobility of older adults.
The multiple linear regression model confirmed the importance of environmental variables, such as the availability of climate shelters and health centers, in the mobility of older adults during the heat wave. However, the finding of a negative association between the percentage of green areas and mobility suggests that, while green areas are important for mitigating the urban heat island effect, their current characteristics (typology, quality, quantity, and accessibility of tree vegetation) are insufficient to promote pedestrian mobility for older adults during periods of extreme heat. These results highlight the importance of implementing urban heat mitigation strategies, such as increasing street shading, improving pedestrian mobility, planting appropriate vegetation, creating parks and green corridors, and utilizing reflective materials and passive cooling systems, while prioritizing accessibility and nature-based solutions. These actions could not only improve thermal comfort, but also promote greater pedestrian mobility and contribute to urban resilience against climate change.
Based on the findings of this research, several future lines of research are proposed to deepen the understanding of pedestrian mobility of older adults during heat waves, paying special attention to its practical usefulness in urban policy design, as well as its potential application in other cities and climatic contexts. First, it would be relevant to promote the evaluation of urban adaptation strategies to extreme heat events, at different spatiotemporal scales and implemented by local governments, to provide safe and sustainable urban areas and promote resilient communities in the face of the threats of climate change [89]. In this regard, it would be necessary to explore in greater detail the specific adaptation strategies adopted by older adults, such as route modification, changes in transportation mode, or seeking climate shelters, using qualitative methodologies that capture subjective risk perception and barriers to adaptation [83]. Additionally, it would be useful to incorporate more precise data on indoor thermal conditions in homes, as the lack of information on heat exposure in enclosed spaces limits the ability to fully assess the vulnerability of older adults. Another promising line of research would be the analysis of the effectiveness of heat wave prevention campaigns specifically targeted at older adults, considering differences in risk perception and barriers to adopting adaptive behaviors. Furthermore, it would be relevant to study the impact of urban interventions, such as the creation of more climate shelters and improving accessibility to green areas, on reducing vulnerability to extreme heat in disadvantaged areas. Finally, future research could explore the role of information and communication technologies (ICT) in promoting heat adaptation among older adults, evaluating the potential of mobile applications and early warning systems to improve risk perception and facilitate the adoption of adaptive behaviors. These research directions would contribute to designing more effective and equitable urban policies, ensuring the adaptation of older adults to climate change and promoting their health and quality of life in the context of population aging and climate crisis.

Author Contributions

Conceptualization, D.S.-G.; methodology, D.S.-G. and J.O.-A.; software, J.O.-A.; validation, D.S.-G. and J.O.-A.; formal analysis, D.S.-G. and J.O.-A.; investigation, D.S.-G. and J.O.-A.; resources, D.S.-G. and J.O.-A.; data curation, J.O.-A.; writing—original draft preparation, D.S.-G. and J.O.-A.; writing—review and editing, D.S.-G. and J.O.-A.; visualization, J.O.-A.; supervision, D.S.-G.; project administration, D.S.-G.; funding acquisition, D.S.-G. All authors have read and agreed to the published version of the manuscript.

Funding

This research received no external funding.

Data Availability Statement

The original data presented in this study are openly available in the portal Estudio de la movilidad con Big Data at the following website: https://movilidad-opendata.mitma.es/index.html (in the consecutive subfolders: estudios_basicos, por-distritos, viajes, ficheros-diarios, 2022-07) (accessed on 26 February 2025).

Conflicts of Interest

The authors declare no conflicts of interest.

References

  1. IPCC. Impacts, Adaptation and Vulnerability; Intergovernmental Panel on Climate Change: Geneva, Switzerland, 2022. [Google Scholar]
  2. Klinenberg, E. Heat Wave: A Social Autopsy of Disaster in Chicago; University of Chicago Press: Chicago, IL, USA, 2015. [Google Scholar]
  3. Benmarhnia, T.; Deguen, S.; Kaufman, J.S.; Smargiassi, A. Review Article: Vulnerability to Heat-related Mortality: A Systematic Review, Meta-analysis, and Meta-regression Analysis. Epidemiology 2015, 26, 781–793. [Google Scholar] [CrossRef] [PubMed]
  4. Gamble, J.L.; Hurley, B.J.; Schultz, P.A.; Jaglom, W.S.; Krishnan, N.; Harris, M. Climate Change and Older Americans: State of the Science. Environ. Health Perspect. 2013, 121, 15–22. [Google Scholar] [CrossRef] [PubMed]
  5. Folkerts, M.A.; Bröde, P.; Botzen, W.J.W.; Martinius, M.L.; Gerrett, N.; Harmsen, C.N.; Daanen, H.A.M. Long Term Adaptation to Heat Stress: Shifts in the Minimum Mortality Temperature in the Netherlands. Front. Physiol. 2020, 11, 225. [Google Scholar] [CrossRef] [PubMed]
  6. Lönn, J.; Lujic, S.; Lindberg, F.; Hansson, I.; Bjälkebring, P.; Gustafsson, S.; Kivi, M.; Thorsson, S. Older adults’ preferences and behaviour during warm weather and heatwaves in the urban environment: A case study in southwestern Sweden. Sustain. Cities Soc. 2025, 119, 106065. [Google Scholar] [CrossRef]
  7. Meade, R.D.; Akerman, A.P.; Notley, S.R.; McGinn, R.; Poirier, P.; Gosselin, P.; Kenny, G.P. Physiological factors characterizing heat-vulnerable older adults: A narrative review. Environ. Int. 2020, 144, 105909. [Google Scholar] [CrossRef]
  8. Courtin, E.; Knapp, M. Social isolation, loneliness and health in old age: A Scoping Review. Health Soc. Care Community 2017, 25, 799–812. [Google Scholar] [CrossRef]
  9. Jiao, Y.; Yu, H.; Wang, T.; An, Y.; Yu, Y. Thermal comfort and adaptation of the elderly in free-running environments in Shanghai, China. Build. Environ. 2017, 118, 259–272. [Google Scholar] [CrossRef]
  10. Ballester, J.; Quijal-Zamorano, M.; Méndez Turrubiates, R.F.; Pegenaute, F.; Herrmann, F.R.; Robine, J.M.; Basagaña, X.; Tonne, C.; Antó, J.M.; Acheback, H. Heat-related mortality in Europe during the summer of 2022. Nat. Med. 2023, 29, 1857–1866. [Google Scholar] [CrossRef]
  11. León, I.; Frías, L.; Delgado, C.; Larrauri, A. Excesos de Mortalidad por Todas las Causas y Atribuibles a Excesos de Temperatura en España; Centro Nacional de Epidemiología: Madrid, Spain, 2022. [Google Scholar]
  12. Smid, M.; Russo, S.; Costa, A.C.; Granell, C.; Pebesma, E. Ranking European capitals by exposure to heat waves and cold waves. Urban Clim. 2019, 27, 388–402. [Google Scholar] [CrossRef]
  13. Götschi, T.; de Nazelle, A.; Brand, C.; Gerike, R. Towards a Comprehensive Conceptual Framework of Active Travel Behavior: A Review and Synthesis of Published Frameworks. Curr. Environ. Health Rep. 2017, 4, 286–295. [Google Scholar] [CrossRef]
  14. Basu, R.; Colaninno, N.; Alhassan, A.; Sevtsuk, A. Hot and bothered: Exploring the effect of heat on pedestrian route choice behavior and accessibility. Cities 2024, 155, 105435. [Google Scholar] [CrossRef]
  15. Gebhart, K.; Noland, R.B. The impact of weather conditions on bikeshare trips in Washington, DC. Transportation 2014, 41, 1205–1225. [Google Scholar] [CrossRef]
  16. Iungman, T.; Cirach, M.; Marando, F.; Pereira Barboza, E.; Khomenko, S.; Masselot, P. Cooling cities through urban green infrastructure: A health impact assessment of European cities. Lancet 2023, 401, 577–589. [Google Scholar] [CrossRef] [PubMed]
  17. Widerynski, S.; Schramm, P.J.; Conlon, K.C.; Noe, R.S.; Grossman, E.; Hawkings, M.; Nayak, S.U.; Roach, M.; Hilts, A.S. Use of Cooling Centers to Prevent Heat-Related Illness: Summary of Evidence and Strategies for Implementation; National Center for Environmental Health: Washington, DC, USA, 2017. [Google Scholar]
  18. Castro-Medina, D.; Guerrero-Delgado, M.C.; Sánchez-Ramos, J.; Palomo-Amores, T.; Romero-Rodríguez, L.; Álvarez-Domínguez, S. Empowering urban climate resilience and adaptation: Crowdsourcing weather citizen stations-enhanced temperature prediction. Sustain. Cities Soc. 2024, 101, 105208. [Google Scholar] [CrossRef]
  19. Zekar, A.; Milojevic-Dupont, N.; Zumwald, M.; Wagner, F.; Creutzig, F. Urban form features determine spatio-temporal variation of ambient temperature: A comparative study of three European cities. Urban Clim. 2023, 49, 101467. [Google Scholar] [CrossRef]
  20. Song, J.; Chen, W.; Zhang, J.; Huang, K.; Hou, B.; Prischepov, A.V. Effects of building density on land surface temperature in China: Spatial patterns and determinants. Landsc. Urban Plan. 2020, 198, 103794. [Google Scholar] [CrossRef]
  21. Zou, B.; Fan, C.; Li, J. Quantifying the Influence of Different Block Types on the Urban Heat Risk in High-Density Cities. Buildings 2024, 14, 2131. [Google Scholar] [CrossRef]
  22. Hughes, C.; Natarajan, S. Summer thermal comfort and overheating in the elderly. Build. Serv. Eng. Res. Technol. 2019, 40, 426–445. [Google Scholar] [CrossRef]
  23. Watanabe, S.; Ishii, J. Effect of outdoor thermal environment on pedestrians’ behavior selecting a shaded area in a humid subtropical region. Build. Environ. 2016, 95, 32–41. [Google Scholar] [CrossRef]
  24. Rosenthal, J.K.; Kinney, P.L.; Metzger, K.B. Intra-urban vulnerability to heat-related mortality in New York City, 1997–2006. Health Place 2014, 30, 45–60. [Google Scholar] [CrossRef]
  25. Bouchama, A.; Dehbi, M.; Mohamed, G.; Matthies, F.; Shoukri, M.; Menne, B. Prognostic Factors in Heat Wave–Related Deaths. A Meta-analysis. Arch. Intern. Med. 2007, 167, 2170–2176. [Google Scholar] [CrossRef]
  26. Beridze, G.; Ayala, A.; Ribeiro, O.; Fernández-Mayoralas, G.; Rodríguez-Blázquez, C.; Rodríguez-Rodríguez, V.; Rojo-Pérez, F.; Forjaz, M.J.; Calderón-Larrañaga, A. Are loneliness and social isolation associated with quality of life in older adults? Insights from Northern and Southern Europe. Int. J. Environ. Res. Public Health 2020, 17, 8637. [Google Scholar] [CrossRef]
  27. Kim, Y.; Lee, W.; Kim, H.; Cho, Y. Social isolation and vulnerability to heatwave-related mortality in the urban elderly population: A time-series multi-community study in Korea. Environ. Int. 2020, 142, 105868. [Google Scholar] [CrossRef] [PubMed]
  28. Benz, S.A.; Burney, J.A. Widespread race and class disparities in surface urban heat extremes across the United States. Earth’s Future 2021, 9, e2021EF002016. [Google Scholar] [CrossRef]
  29. Linares, C.; Martinez-Martin, P.; Rodríguez-Blázquez, C.; Forjaz, M.J.; Carmona, R.; Díaz, J. Effect of heat waves on morbidity and mortality due to Parkinson’s disease in Madrid: A time-series analysis. Environ. Int. 2016, 89–90, 1–6. [Google Scholar] [CrossRef] [PubMed]
  30. Kearl, Z.; Vogel, J. Urban extreme heat, climate change, and saving lives: Lessons from Washington state. Urban Clim. 2023, 47, 101392. [Google Scholar] [CrossRef]
  31. López-Bueno, J.A.; Díaz, J.; Sánchez-Guevara, C.; Sánchez-Martínez, G.; Franco, M.; Gullón, P.; Núñez-Peiró, M.; Valero, I.; Linares, C. The impact of heat waves on daily mortality in districts in Madrid: The effect of sociodemographic factors. Environ. Res. 2020, 190, 109993. [Google Scholar] [CrossRef]
  32. Sánchez-González, D.; Chávez, R. Adjustments to Physical-Social Environment of the Elderly to Climate Change: Proposals from Environmental Gerontology. In Environmental Gerontology in Latin America and Europe. Policies and Perspectives on Environment and Aging; Sánchez-González, D., Rodríguez-Rodríguez, D., Eds.; Springer: Cham, Switzerland, 2016; pp. 105–126. [Google Scholar]
  33. Radford, D.A.G.; Lawler, T.C.; Edwards, B.R.; Disher, B.R.W.; Maier, H.R.; Ostendorf, B.; Nairn, J.; Van Delden, H.; Goodsite, M. A framework for the mitigation and adaptation from heat-related risks to infrastructure. Sustain. Cities Soc. 2022, 81, 103820. [Google Scholar] [CrossRef]
  34. Aigwi, I.E.; Duberia, A.; Nwadike, A.N. Adaptive reuse of existing buildings as a sustainable tool for climate change mitigation within the built environment. Sustain. Energy Technol. Assess. 2023, 56, 102945. [Google Scholar] [CrossRef]
  35. Van Loenhout, J.A.F.; le Grand, A.; Duijm, F.; Greven, F.; Vink, N.M.; Hoek, G.; Zuurbier, M. The effect of high indoor temperatures on self-perceived health of elderly persons. Environ. Res. 2016, 146, 27–34. [Google Scholar] [CrossRef]
  36. Harvison, T.; Newman, R.; Judd, B. Ageing, the Built Environment and Adaptation to Climate Change; University of New South Wales: Sydney, Australia, 2011. [Google Scholar]
  37. He, B.J. Green building: A comprehensive solution to urban heat. Energy Build. 2022, 271, 112306. [Google Scholar] [CrossRef]
  38. De Gea-Grela, P.; Sánchez-González, D.; Gallardo-Peralta, L.P. Urban and Rural Environments and Their Implications for Older Adults’ Adaptation to Heat Waves: A Systematic Review. Land 2024, 13, 1378. [Google Scholar] [CrossRef]
  39. García-Valdez, M.T.; Sánchez-González, D.; Román, R. Aging and adaptation strategies to urban environments from environmental gerontology. Estud. Demográficos Y Urbanos 2019, 34, 101–128. [Google Scholar] [CrossRef]
  40. Walker, R.; Mason, W. Climate Change Adaptation for Health and Social Services; CSIRO: Clayton South, Australia, 2015. [Google Scholar]
  41. Li, J.; Xu, X.; Ding, G.; Zhao, Y.; Zhao, R.; Xue, F.; Li, J.; Gao, J.; Yang, J.; Jiang, B.; et al. A Cross-Sectional Study of Heat Wave-Related Knowledge, Attitude, and Practice among the Public in the Licheng District of Jinan City, China. Int. J. Environ. Res. Public Health 2016, 13, 648. [Google Scholar] [CrossRef] [PubMed]
  42. Carman, J.P.; Zint, M.T. Defining and classifying personal and household climate change adaptation behaviors. Glob. Environ. Change 2020, 61, 102062. [Google Scholar] [CrossRef]
  43. Erens, B.; Williams, L.; Exley, J.; Ettelt, S.; Manacorda, T.; Hajat, S.; Mays, N. Public attitudes to, and behaviours taken during, hot weather by vulnerable groups: Results from a national survey in England. BMC Public Health 2021, 21, 1631. [Google Scholar] [CrossRef]
  44. Valois, P.; Talbot, D.; Bouchard, D.; Renaud, J.S.; Caron, M.; Canuel, M.; Arrambourg, N. Using the theory of planned behavior to identify key beliefs underlying heat adaptation behaviors in elderly populations. Popul. Environ. 2020, 41, 480–506. [Google Scholar] [CrossRef]
  45. Lowe, D.; Ebi, K.L.; Forsberg, B. Heatwave early warning systems and adaptation advice to reduce human health consequences of heatwaves. Int. J. Environ. Res. Public Health 2011, 8, 4623–4648. [Google Scholar] [CrossRef] [PubMed]
  46. Orlando, S.; Mosconi, C.; De Santo, C.; Emberti Gialloreti, L.; Inzerilli, M.C.; Madaro, O.; Mancinelli, S.; Ciccacci, F.; Marazzi, M.C.; Palombi, L.; et al. The Effectiveness of Intervening on Social Isolation to Reduce Mortality during Heat Waves in Aged Population: A Retrospective Ecological Study. Int. J. Environ. Res. Public Health 2021, 18, 11587. [Google Scholar] [CrossRef]
  47. Voelkel, J.; Hellman, D.; Sakuma, R.; Shandas, V. Assessing Vulnerability to Urban Heat: A Study of Disproportionate Heat Exposure and Access to Refuge by Socio-Demographic Status in Portland, Oregon. Int. J. Environ. Res. Public Health 2018, 15, 640. [Google Scholar] [CrossRef]
  48. Wanka, A.; Arnberger, A.; Allex, B.; Eder, R.; Hutter, H.P.; Wallner, P. The challenges posed by climate change to successful ageing. Z. Gerontol. Geriatr. 2014, 47, 468–474. [Google Scholar] [CrossRef] [PubMed]
  49. Song, Y.; Guo, Z.; Yang, R.; Wang, N. Utilizing Mobility Data to Investigate Seasonal Hourly Visiting Behavior for Downtown Parks in Dallas. Urban Sci. 2024, 8, 59. [Google Scholar] [CrossRef]
  50. Fan, Y.; Wang, J.; Obradovich, N.; Zheng, S. Intraday adaptation to extreme temperatures in outdoor activity. Sci. Rep. 2023, 13, 473. [Google Scholar] [CrossRef]
  51. Sánchez-González, D.; Chávez, R. Envejecimiento de la población y cambio climático. In Vulnerabilidad y Resiliencia Desde la Gerontología Ambiental; Comares: Granada, Spain, 2019. [Google Scholar]
  52. Osorio-Arjona, J.; de las Obras Loscertales-Samperiz, J. Estimation of mobility and population in Spain during different phases of the COVID-19 pandemic from mobile phone data. Sci. Rep. 2023, 13, 8962. [Google Scholar] [CrossRef] [PubMed]
  53. Poom, A.; Järv, O.; Zook, M.; Toivonen, T. COVID-19 is spatial: Ensuring that mobile Big Data is used for social good. Big Data Soc. 2020, 7. [Google Scholar] [CrossRef]
  54. Ahmad Yar, A.W.; Bircan, T. Challenges with International Migration Data: An Analysis of the Experience of National Statistical Institutions. Int. Migr. Rev. 2023. [Google Scholar] [CrossRef]
  55. Berke, A.; Doorley, R.; Alonso, L.; Arroyo, V.; Pons, M.; Larson, K. Using mobile phone data to estimate dynamic population changes and improve the understanding of a pandemic: A case study in Andorra. PLoS ONE 2022, 17, e0264860. [Google Scholar] [CrossRef]
  56. Osorio-Arjona, J. Analyzing post-COVID-19 demographic and mobility changes in Andalusia using mobile phone data. Sci. Rep. 2024, 14, 14828. [Google Scholar] [CrossRef]
  57. Deng, H.; Aldrich, D.P.; Danziger, M.M.; Gao, J.; Phillips, N.E.; Cornelius, S.P.; Wang, Q.R. High-resolution human mobility data reveal race and wealth disparities in disaster evacuation patterns. Humanit. Soc. Sci. Commun. 2021, 8, 144. [Google Scholar] [CrossRef]
  58. Hatchett, B.J.; Benmarhnia, T.; Guirguis, K.; VanderMolen, K.; Gershunov, A.; Kerwin, H.; Khlystov, A.; Lambrecht, K.M.; Samburova, V. Mobility data to aid assessment of human responses to extreme environmental conditions. Lancet Planet. Health 2021, 5, e665–e667. [Google Scholar] [CrossRef]
  59. Li, W.; Liu, Y.; Gao, J. A spatiotemporal decay model of human mobility when facing large-scale crises. Proc. Natl. Acad. Sci. USA 2022, 119, e2203042119. [Google Scholar] [CrossRef] [PubMed]
  60. Tian, H.; Cai, H.; Hu, L.; Qiang, Y.; Zhou, B.; Yang, M.; Lin, B. Unveiling community adaptations to extreme heat events using mobile phone location data. J. Environ. Manag. 2024, 366, 121665. [Google Scholar] [CrossRef] [PubMed]
  61. Xie, C.; Huang, B.; Liu, X.; Zhou, T.; Wang, Y. Population exposure to heat waves in Shenzhen base on mobile phone location data. Prog. Geogr. 2020, 39, 231–242. [Google Scholar] [CrossRef]
  62. Prieto-Flores, M.E.; Gómez-Barroso, D.; Cañada, R.; Moreno, A. Geographic health inequalities in Madrid city: Exploring spatial patterns of respiratory disease mortality. J. Stud. Res. Hum. Geogr. 2021, 15, 5–16. [Google Scholar] [CrossRef]
  63. MoMo. Informe MoMo, Verano 2022; Centro Nacional de Epidemiología: Madrid, Spain, 2022. [Google Scholar]
  64. Masselot, P.; Mistry, M.N.; Rao, S.; Huber, V.; Monteiro, A.; Samoli, E.; Stafoggia, M.; de Donato, F.; Garcia-Leon, D.; Ciscar, J.C.; et al. Estimating future heat-related and cold-related mortality under climate change, demographic and adaptation scenarios in 854 European cities. Nat. Med. 2025, 31, 1294–1302. [Google Scholar] [CrossRef]
  65. Cole, R.; Turrell, G.; Koohsari, M.J.; Owen, N.; Sugiyama, T. Prevalence and correlates of walkable short car trips: A cross-sectional multilevel analysis. J. Transp. Health 2017, 4, 73–80. [Google Scholar] [CrossRef]
  66. Morency, C.; Demers, M.; Poliquin, E. Shifting short motorized trips to walking: The potential of active transportation for physical activity in Montreal. J. Transp. Health 2014, 1, 100–107. [Google Scholar] [CrossRef]
  67. Deschenes, O. Temperature, human health, and adaptation: A review of the empirical literature. Energy Econ. 2014, 46, 606–619. [Google Scholar] [CrossRef]
  68. Navas-Martín, M.A.; López-Bueno, J.A.; Ascaso-Sanchéz, M.S.; Follos, F.; Vellón, J.M.; Mirón, I.J.; Luna, M.Y.; Sánchez-Martínez, G.; Linares, C.; Díaz, J. Heat Adaptation among the Elderly in Spain (1983–2018). Int. J. Environ. Res. Public Health 2023, 20, 1314. [Google Scholar] [CrossRef]
  69. Martínez-Solanas, È.; Basagaña, X. Temporal changes in temperature-related mortality in Spain and effect of the implementation of a Heat Health Prevention Plan. Enviromental. Res. 2019, 169, 102–113. [Google Scholar] [CrossRef]
  70. Mehiriz, K. The effects of attitudes, norms, and perceived control on the adaptation of elderly individuals and individuals with chronic health conditions to heatwaves. BMC Public Health 2024, 24, 256. [Google Scholar] [CrossRef]
  71. Mehiriz, K.; Gosselin, P.; Tardif, I.; Lemieux, M.A. The Effect of an Automated Phone Warning and Health Advisory System on Adaptation to High Heat Episodes and Health Services Use in Vulnerable Groups-Evidence from a Randomized Controlled Study. Int. J. Environ. Res. Public Health 2018, 15, 1581. [Google Scholar] [CrossRef] [PubMed]
  72. Heudorf, U.; Schade, M. Heat waves and mortality in Frankfurt am Main, Germany, 2003–2013: What effect do heat-health action plans and the heat warning system have? Z. Gerontol. Geriatr. 2014, 47, 475–482. [Google Scholar] [CrossRef]
  73. Ebi, K.L.; Capon, A.; Berry, P.; Broderick, C.; de Dear, R.; Havenith, G.; Honda, Y.; Kovats, S.; Ma, W.; Malik, A.; et al. Hot weather and heat extremes: Health risks. Lancet 2021, 398, 698–708. [Google Scholar] [CrossRef]
  74. López-Bueno, J.A.; Díaz, J.; Linares, C. Differences in the impact of heat waves according to urban and peri-urban factors in Madrid. Int. J. Biometeorol. 2019, 63, 371–380. [Google Scholar] [CrossRef] [PubMed]
  75. Jancloes, M.; Anderson, V.; Gosselin, P.; Mee, C.; Chong, N.J. WWOSC 2014: Research Needs for Better Health Resilience to Weather Hazards. Int. J. Environ. Res. Public Health 2015, 12, 2895–2900. [Google Scholar] [CrossRef] [PubMed]
  76. Gálvez-Pérez, D.; Guirao, B.; Ortuño, A.; Picado-Santos, L. The Influence of Built Environment Factors on Elderly Pedestrian Road Safety in Cities: The Experience of Madrid. Int. J. Environ. Res. Public Health 2022, 19, 2280. [Google Scholar] [CrossRef]
  77. García-Valdez, M.T.; Sánchez-González, D.; Román-Pérez, R.; Pozo-Menendez, E. Problems of accessibility of public space and social isolation of elderly people with disabilities in Hermosillo, Mexico. Rev. Geogr. Norte Gd. 2023, 85, 1–27. [Google Scholar] [CrossRef]
  78. Maresova, P.; Krejcar, O.; Maskuriy, R.; Abu Bakar, N.A.; Selamat, A.; Truhlarova, Z.; Horak, J.; Joukl, M.; Vítkova, L. Challenges and opportunity in mobility among older adults—Key determinant identification. BMC Geriatr. 2023, 23, 447. [Google Scholar] [CrossRef]
  79. Gorman, M.; Jones, S.; Turner, J. Older People, Mobility and Transport in Low- and Middle-Income Countries: A Review of the Research. Sustainability 2019, 11, 6157. [Google Scholar] [CrossRef]
  80. Ariyanti, O.; Sampaio, D.; Bailey, A. Barriers and facilitators to urban mobility for older adults in LMICs: A scoping review. J. Transp. Geogr. 2025, 127, 104289. [Google Scholar] [CrossRef]
  81. Litwin, H.; Stoeckel, K.J. Social network and mobility improvement among older Europeans: The ambiguous role of family ties. Eur. J. Ageing 2013, 10, 159–169. [Google Scholar] [CrossRef] [PubMed]
  82. Park, J.; Kim, J.-H.; Lee, D.K.; Park, C.Y.; Jeong, S.G. The influence of small green space type and structure at the street level on urban heat island mitigation. Urban For. Urban Green. 2017, 21, 203–212. [Google Scholar] [CrossRef]
  83. Galán-Díaz, J.; Gutiérrez-Bustillo, A.M.; Rojo, J. Influence of urbanisation on the phenology of evergreen coniferous and deciduous broadleaf trees in Madrid (Spain). Landsc. Urban Plan. 2023, 235, 104760. [Google Scholar] [CrossRef]
  84. Park, C.Y.; Thorne, J.H.; Hashimoto, S.; Lee, D.K.; Takahashi, K. Differing spatial patterns of the urban heat exposure of elderly populations in two megacities identifies alternate adaptation strategies. Sci. Total Environ. 2021, 781, 146455. [Google Scholar] [CrossRef]
  85. Jia, S.; Wang, Y. Effect of heat mitigation strategies on thermal environment, thermal comfort, and walkability: A case study in Hong Kong. Build. Environ. 2021, 201, 107988. [Google Scholar] [CrossRef]
  86. Taleghani, M.; Sailor, D.; Ban-Weiss, G.A. Micrometeorological simulations to predict the impacts of heat mitigation strategies on pedestrian thermal comfort in a Los Angeles neighborhood. Environ. Res. Lett. 2016, 11, 024003. [Google Scholar] [CrossRef]
  87. Haq, G.; Brown, D.; Hards, S. Older People and Climate Change: The Case for Better Engagement; Stockholm Environment Institute: Stockholm, Sweden, 2010. [Google Scholar]
  88. Martín, Y.; Paneque, P. Moving from adaptation capacities to implementing adaptation to extreme heat events in urban areas of the European Union: Introducing the U-ADAPT! research approach. J. Environ. Manag. 2022, 310, 114773. [Google Scholar] [CrossRef] [PubMed]
  89. Mikellidou, C.V.; Shakou, L.M.; Boustras, G.; Dimopoulos, C. Energy critical infrastructures at risk from climate change: A state of the art review. Saf. Sci. 2018, 110, 110–120. [Google Scholar] [CrossRef]
  90. Stähl, A.; Carlsson, G.; Hovbrandt, P.; Iwarsson, S. ‘Let’s Go for a Walk’: Identification and Prioritisation of Accessibility and Safety Measures Involving Elderly People in a Residential Area. Eur. J. Ageing 2008, 5, 265–273. [Google Scholar] [CrossRef]
  91. Liotta, G.; Inzerilli, M.C.; Palombi, L.; Madaro, O.; Orlando, S.; Scarcella, P.; Betti, D.; Marazzi, M.C. Social Interventions to Prevent Heat-Related Mortality in the Older Adult in Rome, Italy: A Quasi-Experimental Study. Int. J. Environ. Res. Public Health 2018, 15, 715. [Google Scholar] [CrossRef] [PubMed]
  92. Chan, D.Y.L.; Lee, S.W.; Teh, P.-L. Factors influencing technology use among low-income older adults: A systematic review. Heliyon 2023, 9, e20111. [Google Scholar] [CrossRef] [PubMed]
  93. Gonzales, A.L. Health benefits and barriers to cell phone use in low-income urban U.S. neighborhoods: Indications of technology maintenance. Mob. Media Commun. 2014, 2, 233–248. [Google Scholar] [CrossRef]
  94. Steele, J.E.; Pezzulo, C.; Albert, M.; Brooks, C.J.; Erbach-Schoenberg, E.; O’Connor, S.B.; Sundsøy, P.R.; Engø-Monsen, K.; Nilsen, K.; Graupe, B.; et al. Mobility and phone call behavior explain patterns in poverty at high-resolution across multiple settings. Humanit. Soc. Sci. Commun. 2021, 8, 288. [Google Scholar] [CrossRef]
  95. Arroyo-Menéndez, M.; Barañano-Cid, M.; Uceda-Navas, P. Unequal in the smart city?: Spatial segregation and digital inequalities in Madrid. Rev. Española Investig. Sociológicas 2024, 180, 19–46. [Google Scholar] [CrossRef]
  96. Yang, J.; Santamouris, M. Urban Heat Island and Mitigation Technologies in Asian and Australian Cities—Impact and Mitigation. Urban Sci. 2018, 2, 74. [Google Scholar] [CrossRef]
  97. Van Hoof, J.; Bennetts, H.; Hansen, A.; Kazak, J.K.; Soebarto, V. The Living Environment and Thermal Behaviours of Older South Australians: A Multi-Focus Group Study. Int. J. Environ. Res. Public Health 2019, 16, 935. [Google Scholar] [CrossRef]
Figure 1. Number of short trips made by older adults on the days of July 2022 at 4:00 PM (top) and during the hours of 14 July 2022 (bottom).
Urbansci 09 00236 g001
Figure 2. Average number of trips made by older adults on heat wave days in July 2022 at 4:00 PM by district.
Urbansci 09 00236 g002
Figure 3. Difference between the average number of trips made by older adults on heat wave days and days with normal thermal activity in July 2022 at 4:00 PM by district.
Urbansci 09 00236 g003
Figure 4. Percentage of older adults by income level making trips on heat wave days in July 2022 at 4:00 PM.
Urbansci 09 00236 g004
Figure 5. Percentage of older adults by main activity making trips on heat wave days in July 2022 at 4:00 PM.
Urbansci 09 00236 g005
Figure 6. Number of trips made by older adults by trip purpose and day in July 2022 at 4:00 PM (top) and by trip purpose and time of day on 14 July 2022 (bottom).
Urbansci 09 00236 g006
Figure 7. Pearson correlation matrix.
Urbansci 09 00236 g007
Figure 8. Residual value mapping of the OLS model.
Urbansci 09 00236 g008
Table 1. Variables used in the district-level correlation analysis.
DimensionVariableTypeSource
MobilityAverage number of trips made by individuals aged 65 and older at 4:00 PM in JulyDependentSpanish Ministry of Transport and Sustainable Mobility (MITMA)
SocialPercentage of individuals aged 65 and older living aloneExplanatoryMadrid City Council
SocialPercentage of individuals aged 65 and older with functional dependenciesExplanatoryMadrid City Council
SocialPercentage of over-agingExplanatoryMadrid City Council
SocialIncome level per person ExplanatoryMadrid City Council
SocialPercentage of individuals aged 65 and older without primary educationExplanatoryMadrid City Council
EnvironmentalExposure to the urban heat island effectExplanatoryMadrid City Council
EnvironmentalPercentage of green areas over total surface areaExplanatoryMadrid City Council
EnvironmentalPercentage of health centers and hospitals per 100,000 inhabitantsExplanatoryMadrid City Council
EnvironmentalPercentage of public spaces converted into climate shelters (shopping malls, senior centers, libraries) per 100,000 inhabitantsExplanatoryMadrid City Council
EnvironmentalPercentage of public transport stops per 100,000 inhabitantsExplanatoryMadrid Community Transport Consortium
Table 2. Parameters of the number of short trips made during the heat wave days of July 2022 at 4:00 PM.
VariableMeanMedianStandard DeviationRangeInterquartile RangeCoefficient of VariationSkewnessKurtosis
Number of trips during heat wave days27,84130,1274104.712,193.97286.40.14−0.491.67
Number of trips during days with normal thermal activity30,04830,2464800.112,898.57787.70.15−0.591.94
Table 3. Parameters of the multiple linear regression model.
ModelUnstandardized CoefficientsStandardized Coefficientstp-ValueCollinearity Statistics
BTypical Error BetaIVF
(Constant)−1,564,262768,277 −20360.061
Percentage of older adults living alone40,26714,0760.24228610.0131298
Percentage of older adults with functional dependencies21,26611,2430.27318910.0793791
Percentage of over-aging−19,33112,637−0.128−1.530.1481279
Income level per person0.0610.0140.62344740.0013521
Percentage of green spaces over the total surface area−11,9395223−0.260−22860.0382347
Percentage of public spaces converted into climate shelters per 100,000 inhabitants171,74515,375101511.170.0001501
Disclaimer/Publisher’s Note: The statements, opinions and data contained in all publications are solely those of the individual author(s) and contributor(s) and not of MDPI and/or the editor(s). MDPI and/or the editor(s) disclaim responsibility for any injury to people or property resulting from any ideas, methods, instructions or products referred to in the content.

