
An Analysis of the Urban Green Space Index in Ecuadorian Cities Through Mathematical Modeling: A Territorial Analysis

 ,
,  ,
, 
Abstract
1. Introduction
2. Materials and Methods
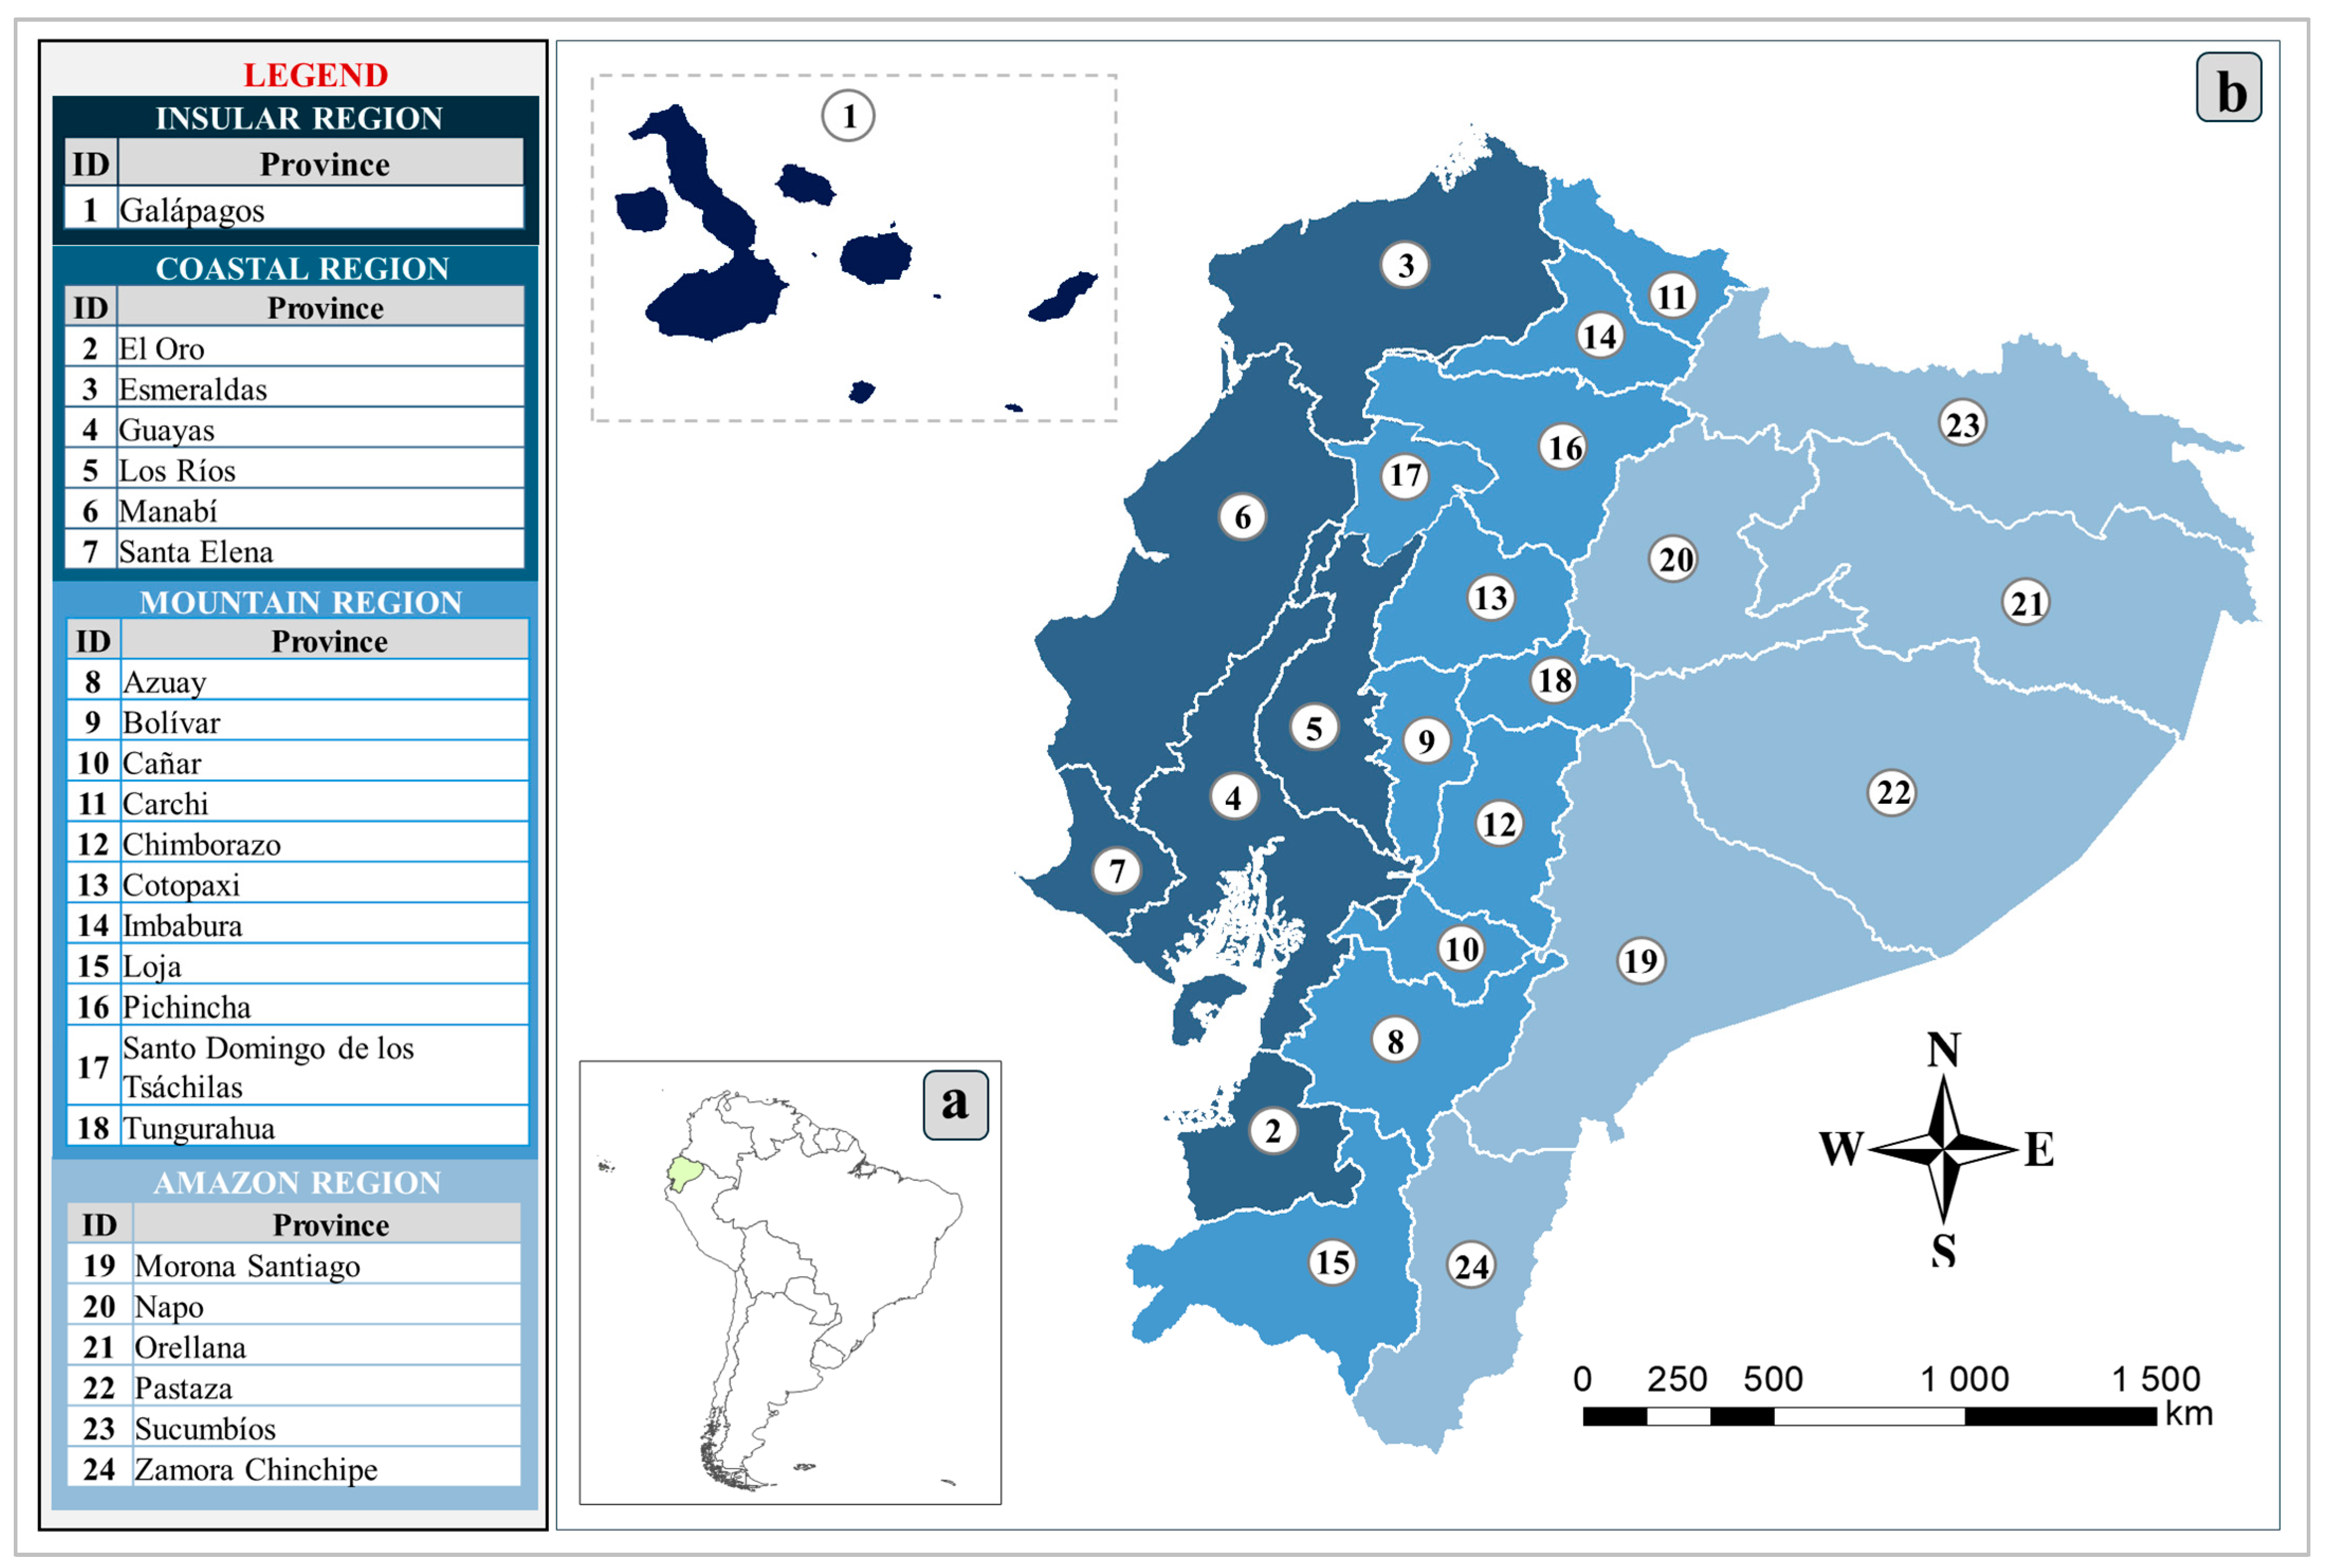
2.1. Study Area
2.2. Methodology
2.2.1. Data Collection
2.2.2. Determining Model Variables
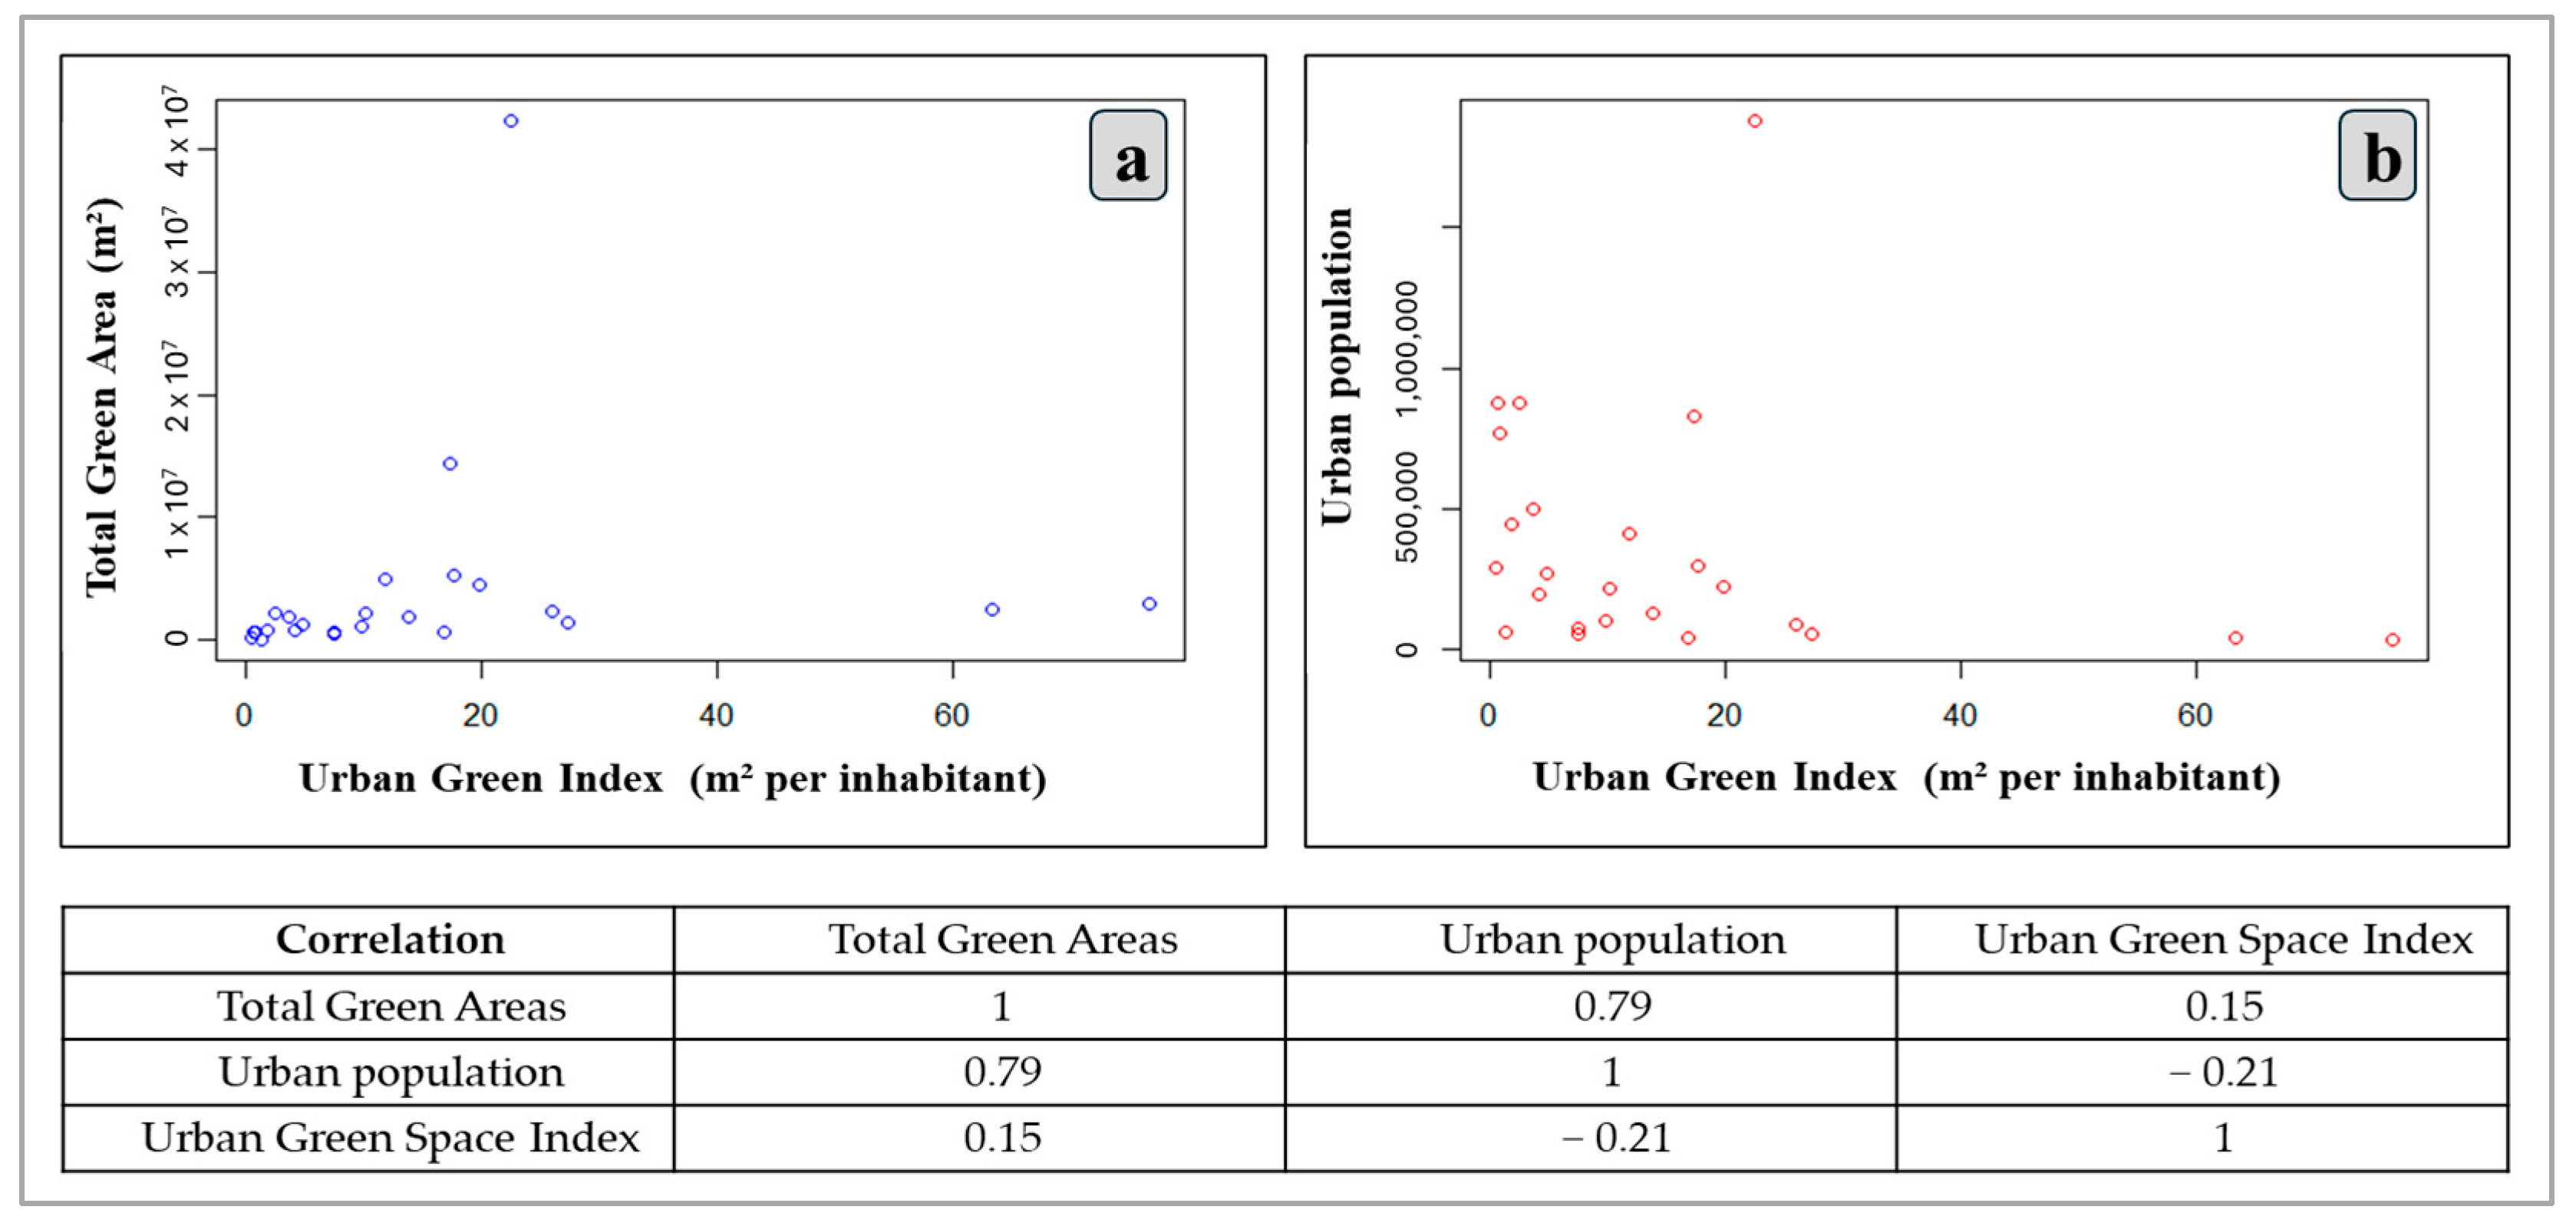
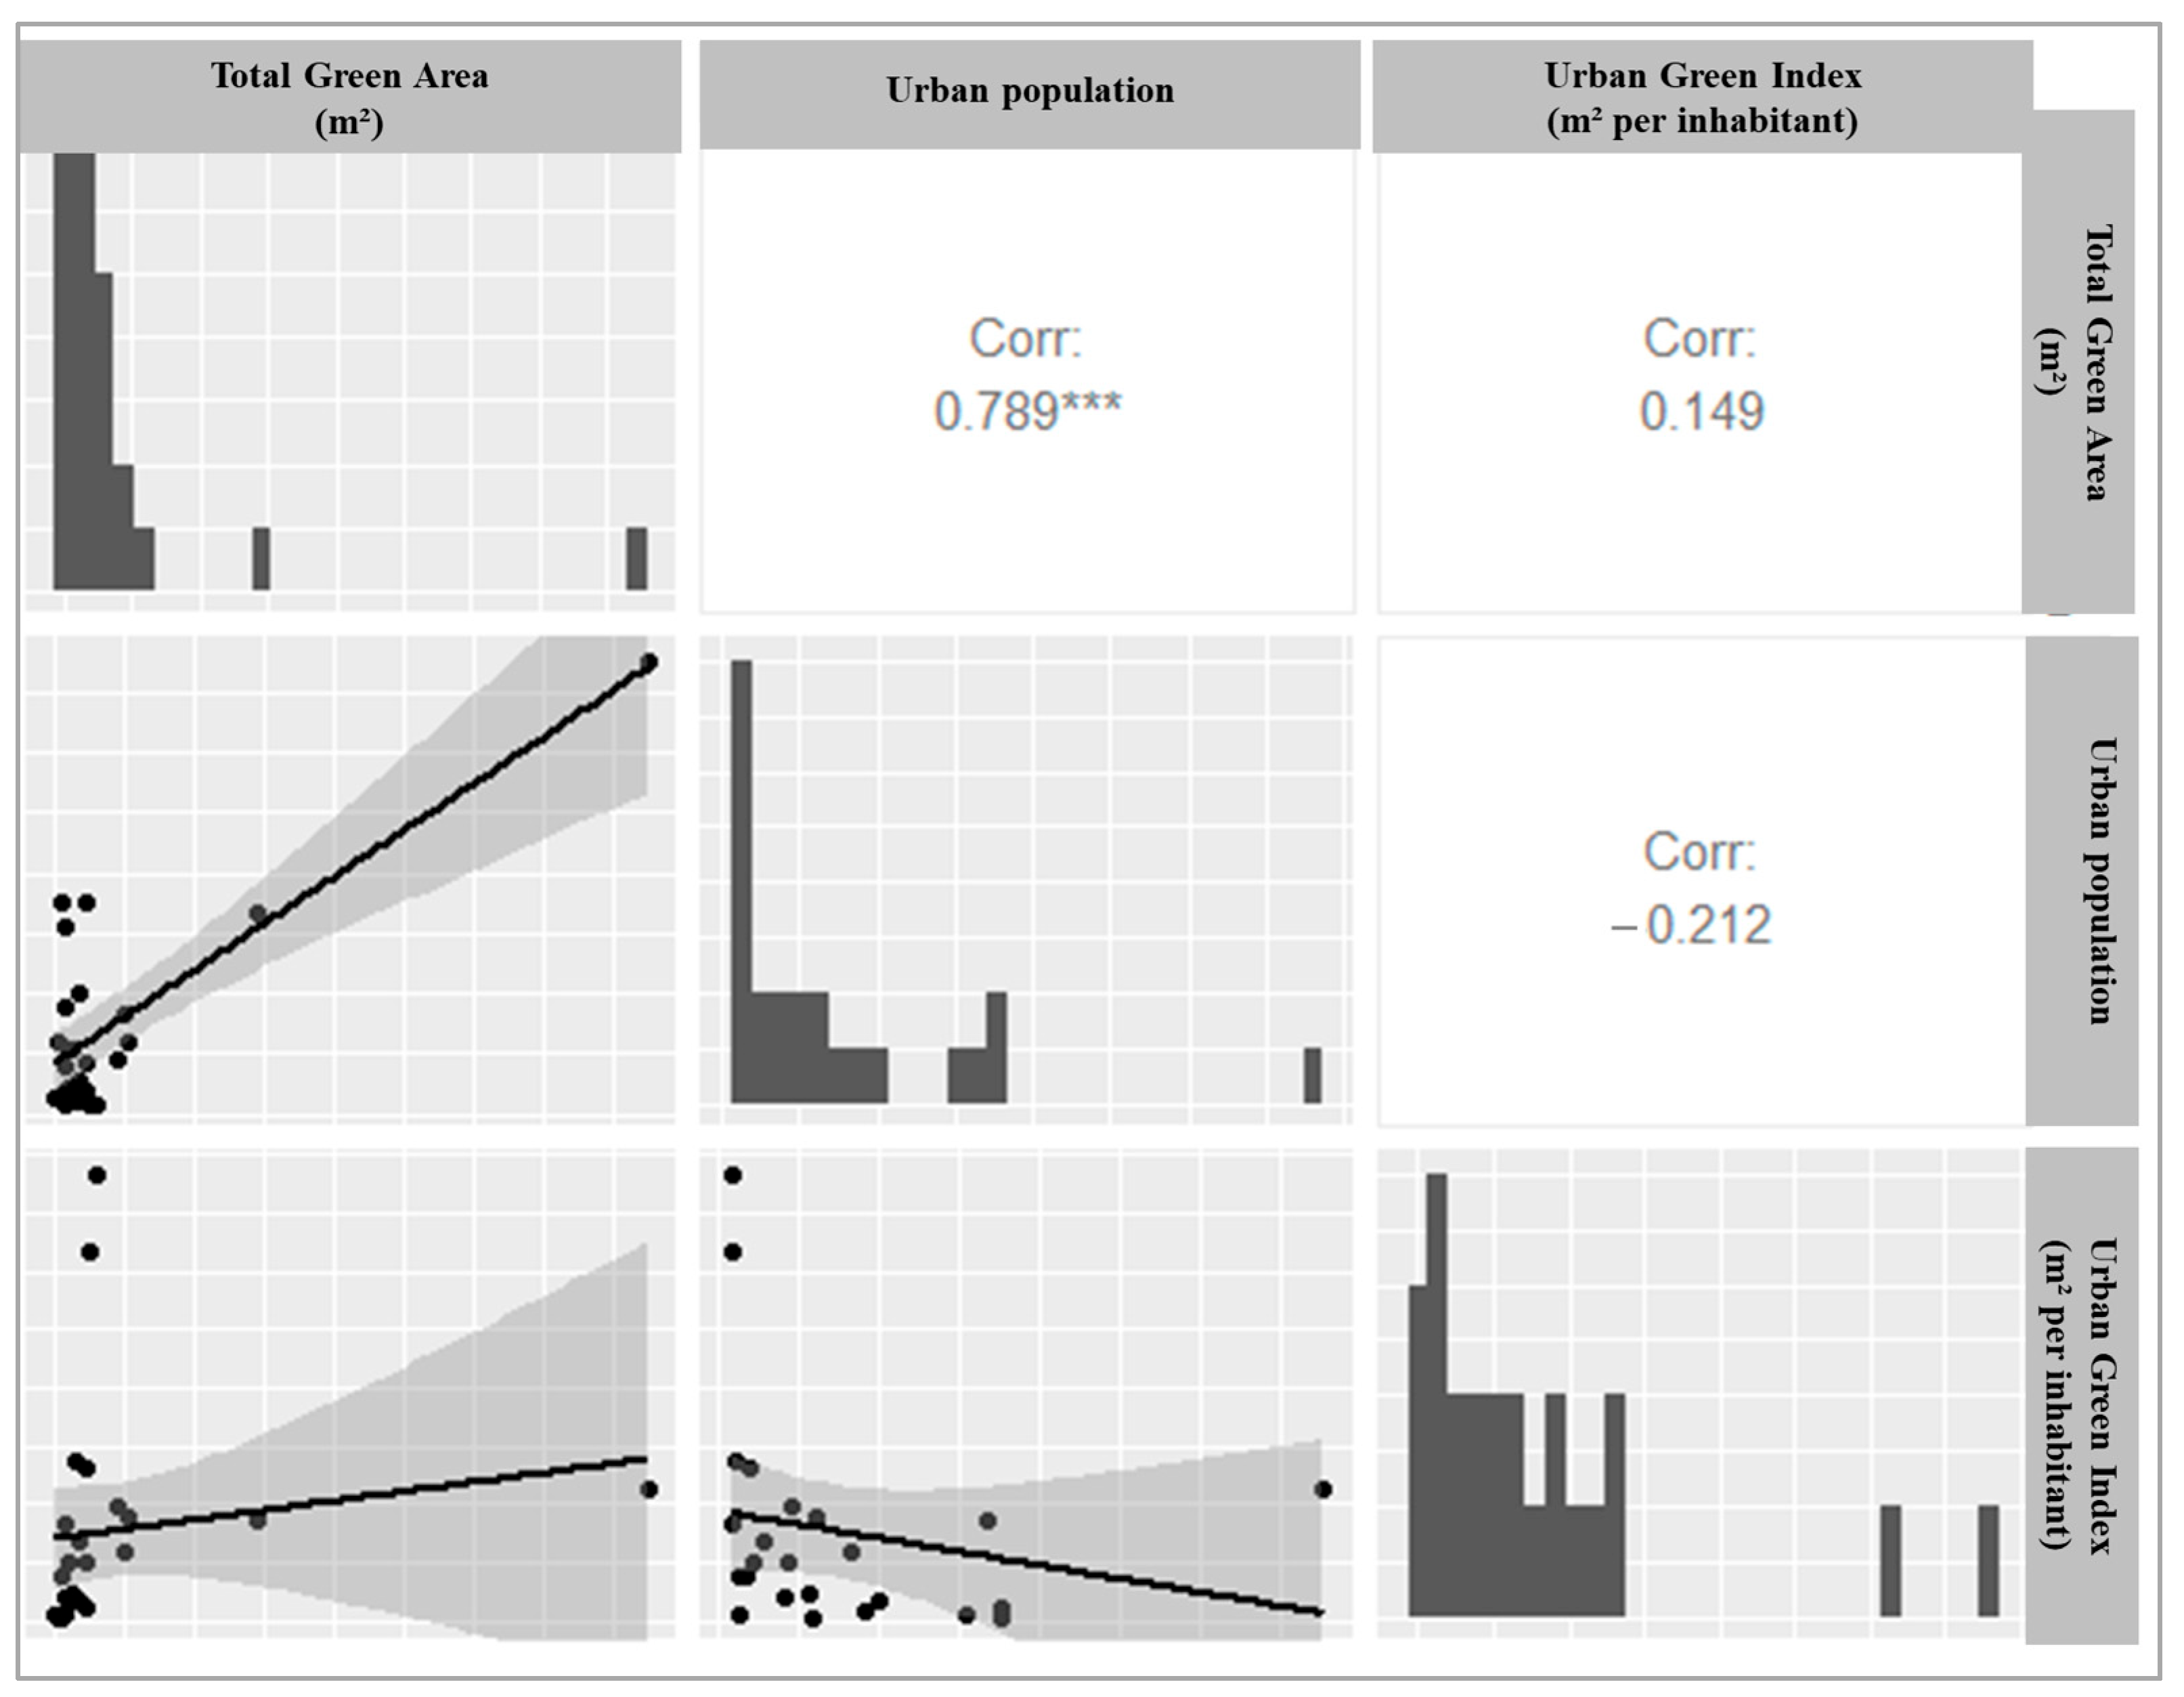
2.2.3. Statistical Analysis and Model Development
2.2.4. Model Evaluation
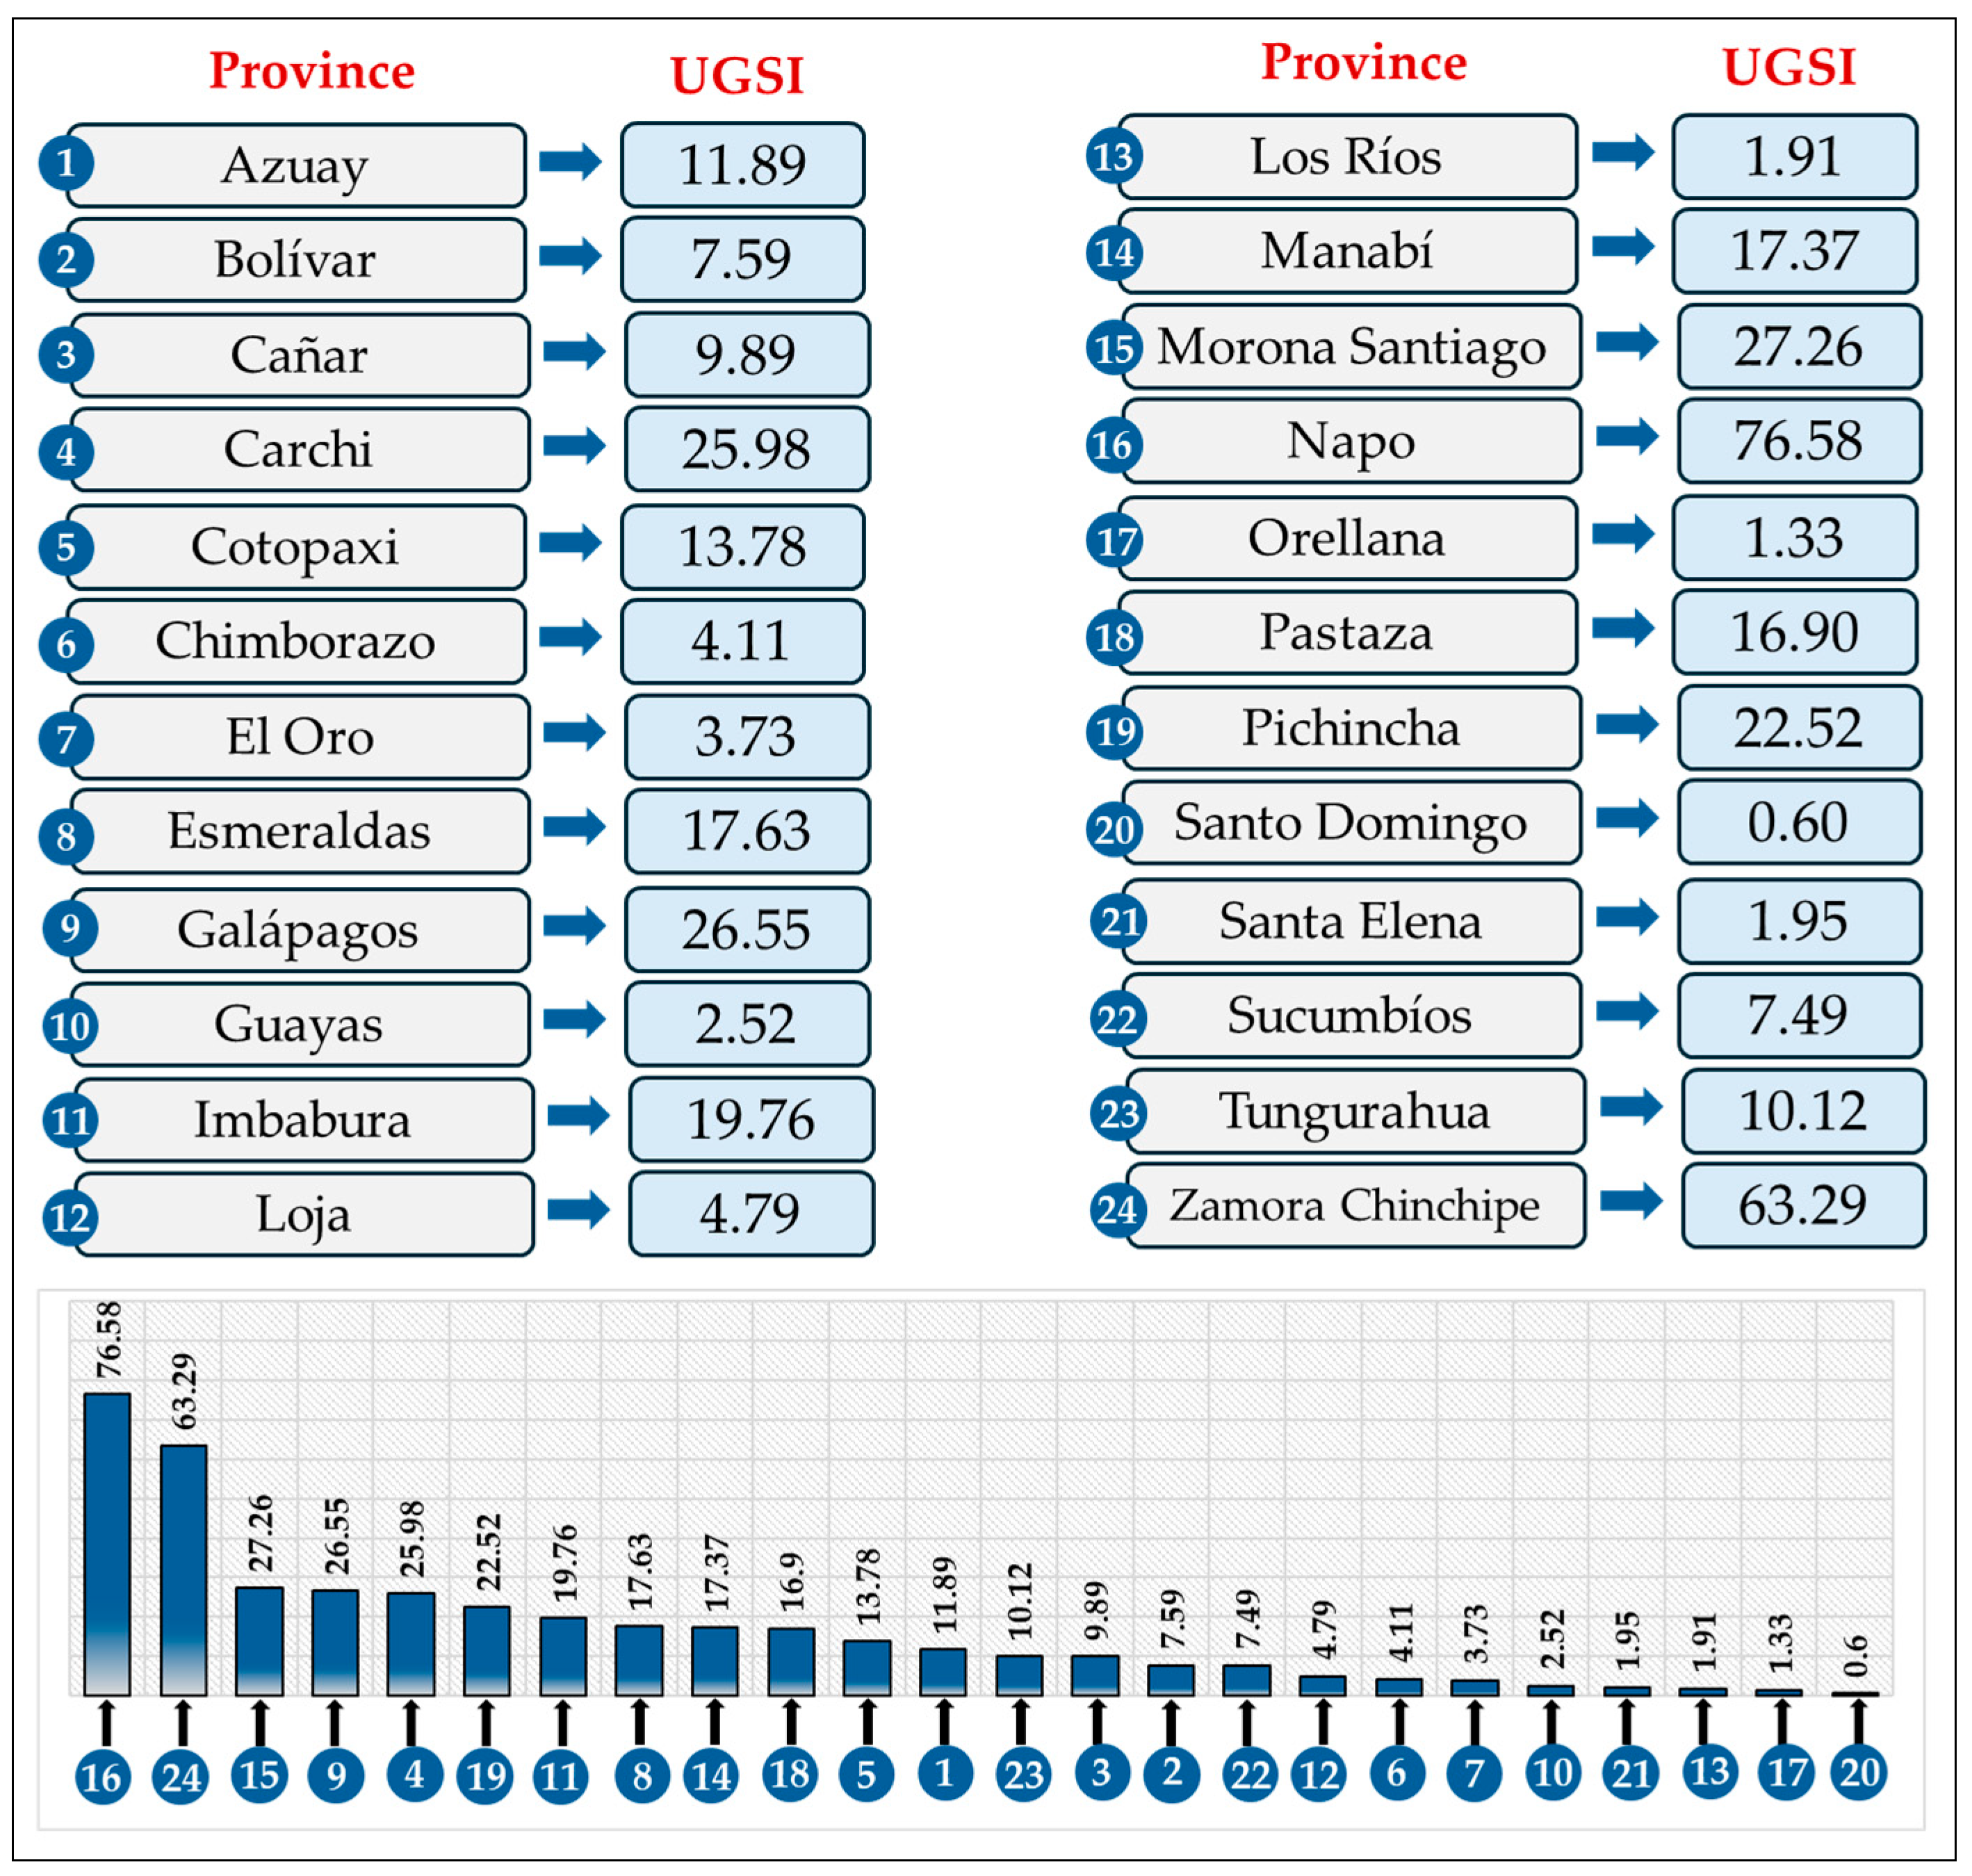
3. Results
4. Discussion
5. Conclusions
Author Contributions
Funding
Data Availability Statement
Acknowledgments
Conflicts of Interest
Appendix A
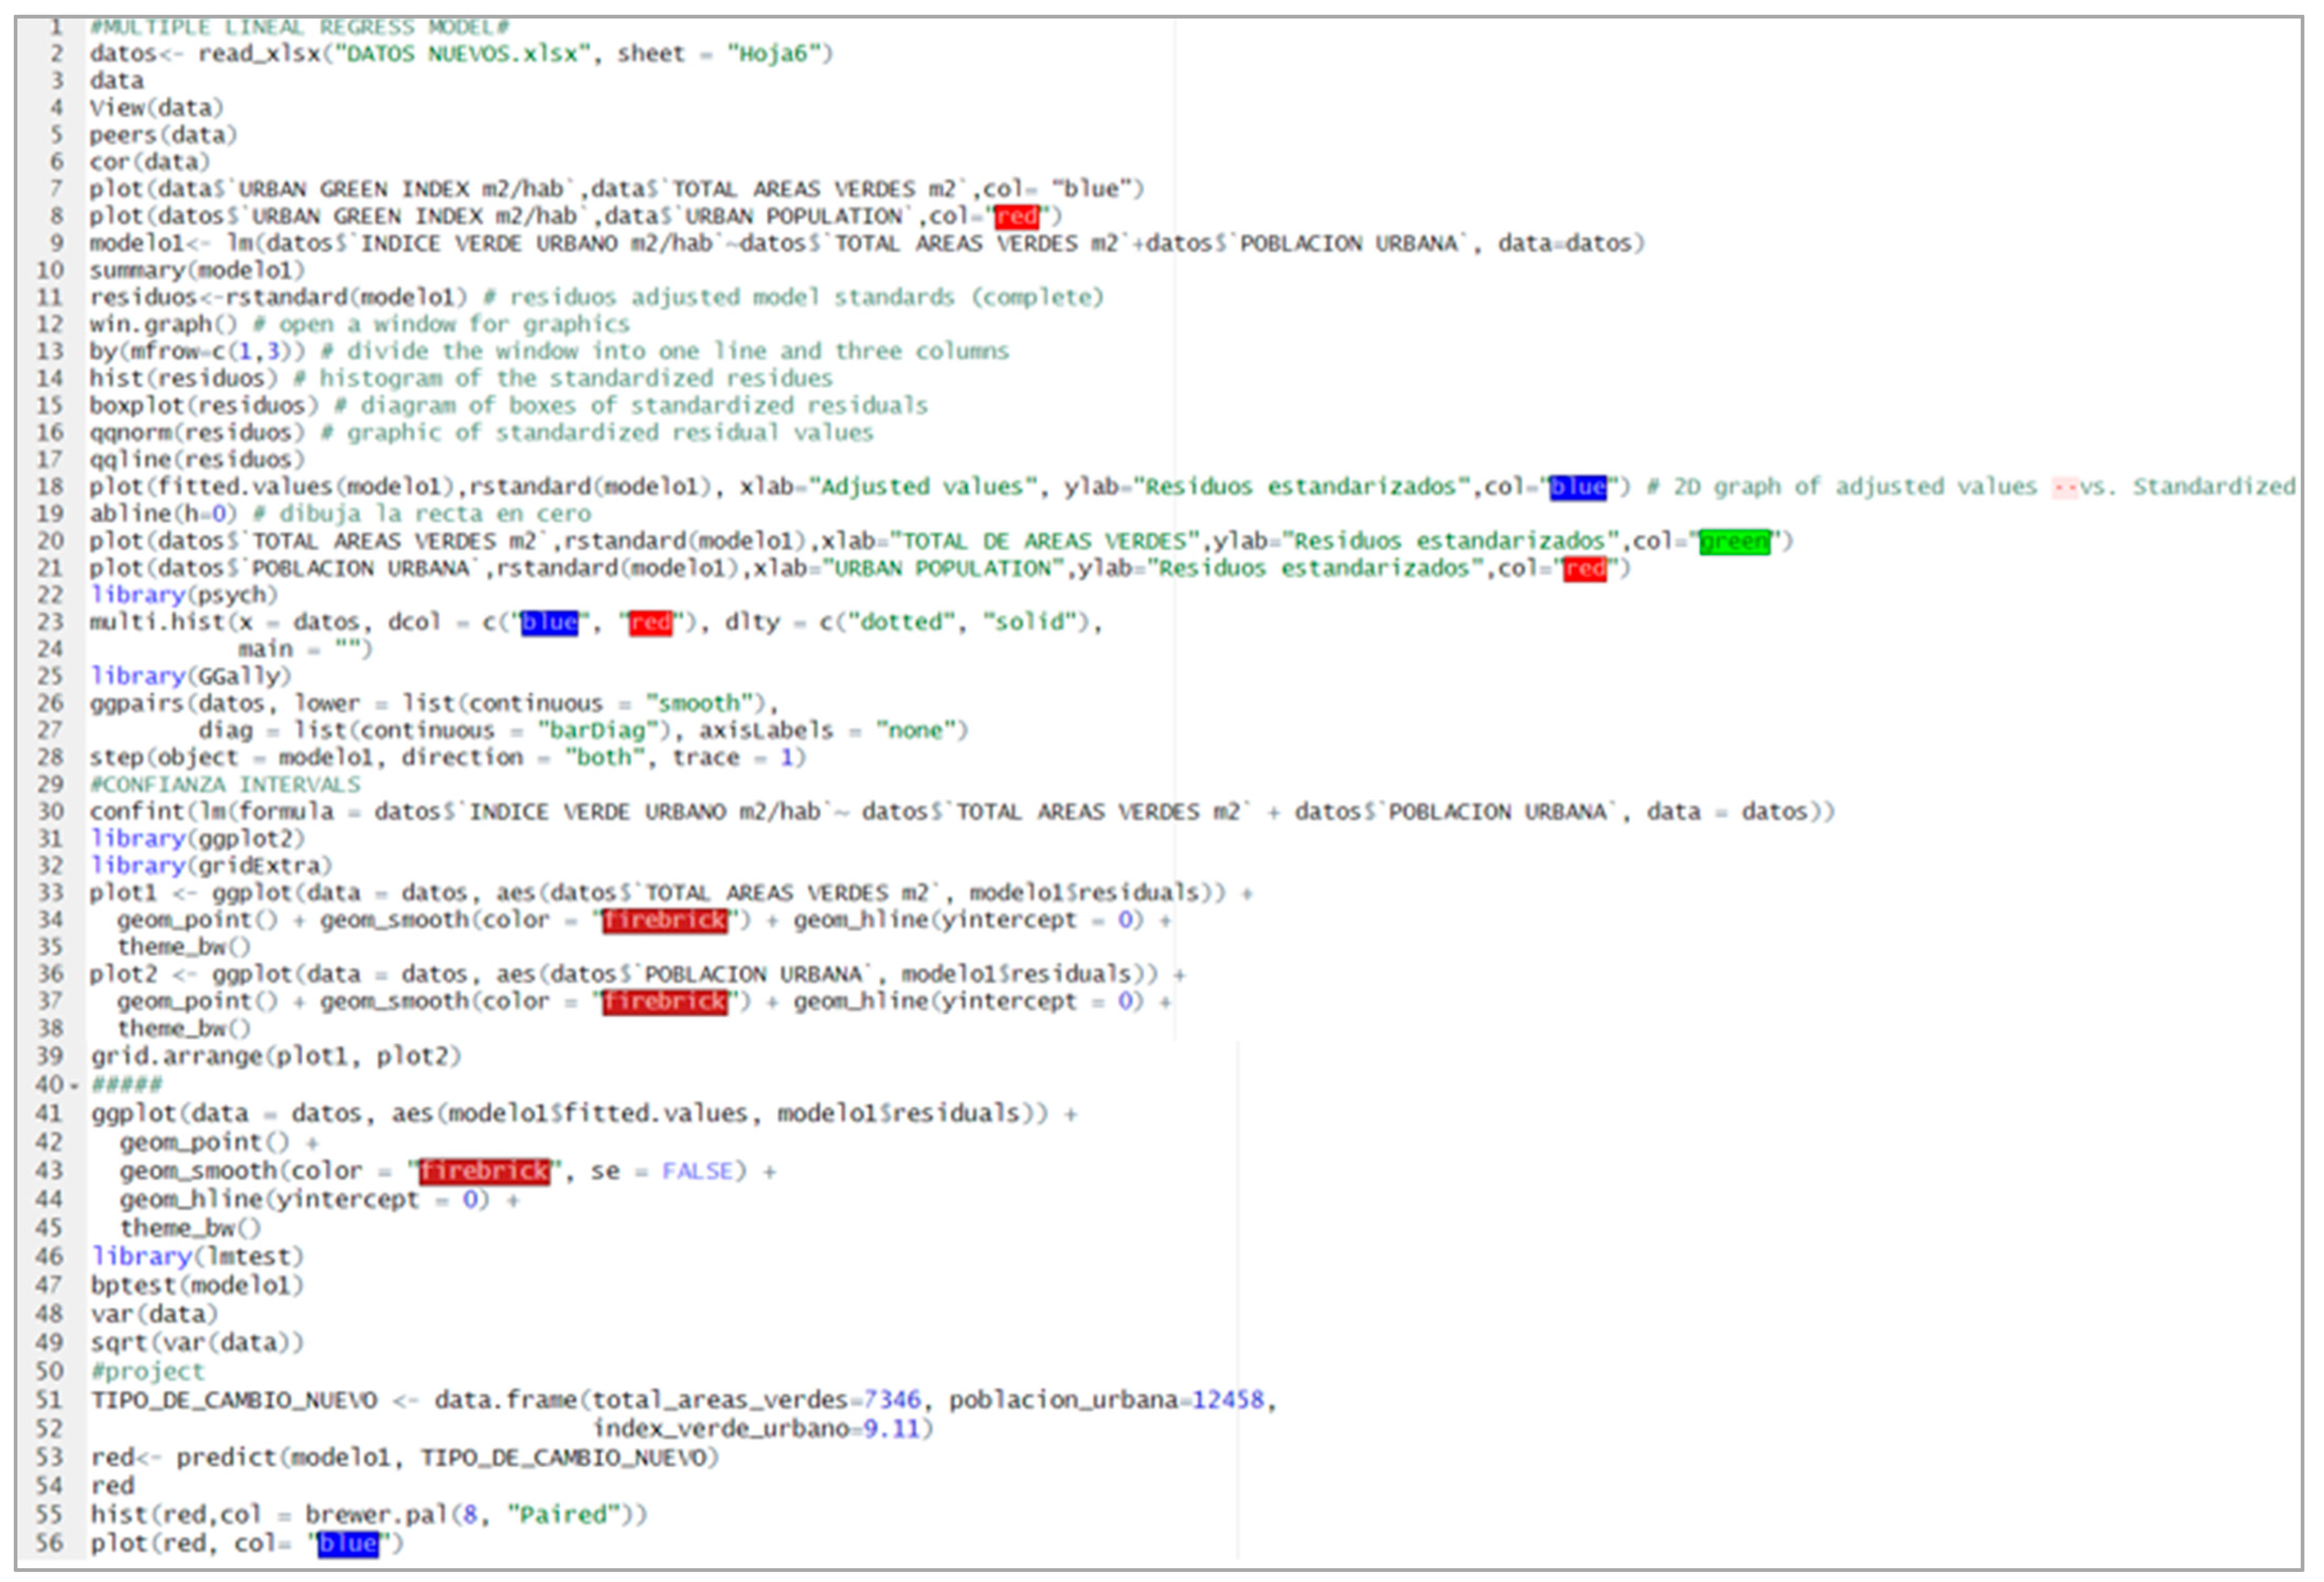
Model Development

References
- Hansen, R.; Olafsson, A.S.; Van Der Jagt, A.P.; Rall, E.; Pauleit, S. Planning Multifunctional Green Infrastructure for Compact Cities: What Is the State of Practice? Ecol. Indic. 2019, 96, 99–110. [Google Scholar] [CrossRef]
- Rall, E.; Hansen, R.; Pauleit, S. The Added Value of Public Participation GIS (PPGIS) for Urban Green Infrastructure Planning. Urban For. Urban Green. 2019, 40, 264–274. [Google Scholar] [CrossRef]
- Jabbar, M.; Yusoff, M.M.; Shafie, A. Assessing the Role of Urban Green Spaces for Human Well-Being: A Systematic Review. GeoJournal 2022, 87, 4405–4423. [Google Scholar] [CrossRef] [PubMed]
- Aram, F.; Solgi, E.; Holden, G. The Role of Green Spaces in Increasing Social Interactions in Neighborhoods with Periodic Markets. Habitat Int. 2019, 84, 24–32. [Google Scholar] [CrossRef]
- Wan, C.; Shen, G.Q.; Choi, S. Underlying Relationships between Public Urban Green Spaces and Social Cohesion: A Systematic Literature Review. City Cult. Soc. 2021, 24, 100383. [Google Scholar] [CrossRef]
- Barron, S.; Rugel, E.J. Tolerant Greenspaces: Designing Urban Nature-Based Solutions That Foster Social Ties and Support Mental Health among Young Adults. Environ. Sci. Policy 2023, 139, 1–10. [Google Scholar] [CrossRef]
- Cilek, M.U.; Uslu, C. Modeling the Relationship between the Geometric Characteristics of Urban Green Spaces and Thermal Comfort: The Case of Adana City. Sustain. Cities Soc. 2022, 79, 103748. [Google Scholar] [CrossRef]
- Kruize, H.; van Der Vliet, N.; Staatsen, B.; Bell, R.; Chiabai, A.; Muiños, G.; Higgins, S.; Quiroga, S.; Martinez-Juarez, P.; Aberg Yngwe, M. Urban Green Space: Creating a Triple Win for Environmental Sustainability, Health, and Health Equity through Behavior Change. Int. J. Environ. Res. Public Health 2019, 16, 4403. [Google Scholar] [CrossRef]
- Hunter, R.F.; Cleland, C.; Cleary, A.; Droomers, M.; Wheeler, B.W.; Sinnett, D.; Nieuwenhuijsen, M.J.; Braubach, M. Environmental, Health, Wellbeing, Social and Equity Effects of Urban Green Space Interventions: A Meta-Narrative Evidence Synthesis. Environ. Int. 2019, 130, 104923. [Google Scholar] [CrossRef]
- Semeraro, T.; Scarano, A.; Buccolieri, R.; Santino, A.; Aarrevaara, E. Planning of Urban Green Spaces: An Ecological Perspective on Human Benefits. Land 2021, 10, 105. [Google Scholar] [CrossRef]
- Hewitt, C.N.; Ashworth, K.; MacKenzie, A.R. Using Green Infrastructure to Improve Urban Air Quality (GI4AQ). Ambio 2020, 49, 62–73. [Google Scholar] [CrossRef] [PubMed]
- Vidal, D.G.; Barros, N.; Maia, R.L. Public and Green Spaces in the Context of Sustainable Development. In Sustainable Cities and Communities; Springer: Cham, Switzerland, 2020; pp. 479–487. [Google Scholar]
- Grace, O.; Iqbal, K.; Rabbi, F. Creating Sustainable Urban Environments: The Vital Link between Development, Health, and Smart Cities. Int. J. Sustain. Infrastruct. Cities Soc. 2023, 8, 53–72. [Google Scholar]
- Liu, D.; Kwan, M.-P.; Kan, Z. Analysis of Urban Green Space Accessibility and Distribution Inequity in the City of Chicago. Urban For. Urban Green. 2021, 59, 127029. [Google Scholar] [CrossRef]
- Zhang, J.; Yu, Z.; Cheng, Y.; Chen, C.; Wan, Y.; Zhao, B.; Vejre, H. Evaluating the Disparities in Urban Green Space Provision in Communities with Diverse Built Environments: The Case of a Rapidly Urbanizing Chinese City. Build. Environ. 2020, 183, 107170. [Google Scholar] [CrossRef]
- Mahtta, R.; Fragkias, M.; Güneralp, B.; Mahendra, A.; Reba, M.; Wentz, E.A.; Seto, K.C. Urban Land Expansion: The Role of Population and Economic Growth for 300+ Cities. Npj Urban Sustain. 2022, 2, 5. [Google Scholar] [CrossRef]
- Rajendran, L.P.; Raúl, L.; Chen, M.; Andrade, J.C.G.; Akhtar, R.; Mngumi, L.E.; Chander, S.; Srinivas, S.; Roy, M.R. The ‘Peri-Urban Turn’: A Systems Thinking Approach for a Paradigm Shift in Reconceptualising Urban-Rural Futures in the Global South. Habitat Int. 2024, 146, 103041. [Google Scholar] [CrossRef]
- Jiang, F.; Ma, J.; Webster, C.J.; Chiaradia, A.J.; Zhou, Y.; Zhao, Z.; Zhang, X. Generative Urban Design: A Systematic Review on Problem Formulation, Design Generation, and Decision-Making. Prog. Plan. 2024, 180, 100795. [Google Scholar] [CrossRef]
- Puplampu, D.A.; Boafo, Y.A. Exploring the Impacts of Urban Expansion on Green Spaces Availability and Delivery of Ecosystem Services in the Accra Metropolis. Environ. Chall. 2021, 5, 100283. [Google Scholar] [CrossRef]
- Pattanakiat, S.; Vongvassana, S.; Phutthai, T.; Nakmuenwai, P.; Chiyanon, T.; Bhuket, V.R.N.; Sattraburut, T.; Chinsawadphan, P.; Khincharung, K. Spatial Green Space Assessment in Suburbia: Implications for Urban Development. Environ. Nat. Resour. J. (EnNRJ) 2024, 22, 76–92. [Google Scholar] [CrossRef]
- Rejaur Rahman, M.; Rahman, A. Urban Green and Blue Spaces Dynamics—A Geospatial Analysis Using Remote Sensing, Machine Learning and Landscape Metrics in Rajshahi Metropolitan City, Bangladesh. In Advancements in Urban Environmental Studies: Application of Geospatial Technology and Artificial Intelligence in Urban Studies; Springer: Cham, Switzerland, 2023; pp. 137–159. [Google Scholar]
- Rahman, K.A.; Zhang, D. Analyzing the Level of Accessibility of Public Urban Green Spaces to Different Socially Vulnerable Groups of People. Sustainability 2018, 10, 3917. [Google Scholar] [CrossRef]
- Zhong, J.; Li, Z.; Sun, Z.; Tian, Y.; Yang, F. The Spatial Equilibrium Analysis of Urban Green Space and Human Activity in Chengdu, China. J. Clean. Prod. 2020, 259, 120754. [Google Scholar] [CrossRef]
- Bardhan, R.; Debnath, R.; Bandopadhyay, S. A Conceptual Model for Identifying the Risk Susceptibility of Urban Green Spaces Using Geo-Spatial Techniques. Model. Earth Syst. Environ. 2016, 2, 144. [Google Scholar] [CrossRef]
- Salazar-Llano, L.; Rosas-Casals, M.; Ortego, M.I. An Exploratory Multivariate Statistical Analysis to Assess Urban Diversity. Sustainability 2019, 11, 3812. [Google Scholar] [CrossRef]
- Yeh, C.-T.; Cheng, Y.-Y.; Liu, T.-Y. Spatial Characteristics of Urban Green Spaces and Human Health: An Exploratory Analysis of Canonical Correlation. Int. J. Environ. Res. Public Health 2020, 17, 3227. [Google Scholar] [CrossRef]
- Jennings, V.; Larson, L.; Yun, J. Advancing Sustainability through Urban Green Space: Cultural Ecosystem Services, Equity, and Social Determinants of Health. Int. J. Environ. Res. Public Health 2016, 13, 196. [Google Scholar] [CrossRef] [PubMed]
- Zambrano-Monserrate, M.A.; Ruano, M.A.; Yoong-Parraga, C.; Silva, C.A. Urban Green Spaces and Housing Prices in Developing Countries: A Two-Stage Quantile Spatial Regression Analysis. For. Policy Econ. 2021, 125, 102420. [Google Scholar] [CrossRef]
- Toapanta Orbea, L.A.; Leyva Vazquez, M.; Hechavarría Hernández, J.R. AHP Applied to the Prioritization of Recreational Spaces in Green Areas. Case Study: Urban Area of the El Empalme Canton, Ecuador. In Advances in Artificial Intelligence, Software and Systems Engineering; Springer: Cham, Switzerland, 2021; pp. 292–297. [Google Scholar]
- Monteros, K.; Dall’Orto, V.; Cempini, C. The Formation of the Urban–Rural Fringe Space in the San Cayetano Area: The Transformation of a Peripheral Urban Landscape in Ecuador. Land 2024, 13, 494. [Google Scholar] [CrossRef]
- Llorente, E.S.; Mora, F.C.; Hinojoza, L.C.; Suarez, M.V. Microbiological Risk Assessment of High-Demand Food from Three Major Cities in Ecuador. Bionatura J. 2024, 1, 1–17. [Google Scholar] [CrossRef]
- Watson, C.S.; Elliott, J.R.; Ebmeier, S.K.; Vásquez, M.A.; Zapata, C.; Bonilla-Bedoya, S.; Cubillo, P.; Orbe, D.F.; Córdova, M.; Menoscal, J. Enhancing Disaster Risk Resilience Using Greenspace in Urbanising Quito, Ecuador. Nat. Hazards Earth Syst. Sci. 2022, 22, 1699–1721. [Google Scholar] [CrossRef]
- Flores, S.; Van Mechelen, C.; Vallejo, J.P.; Van Meerbeek, K. Trends and Status of Urban Green and Urban Green Research in Latin America. Landsc. Urban Plan. 2022, 227, 104536. [Google Scholar] [CrossRef]
- Calderón, F.; Orellana, D.; Carrasco, M.I.; Astudillo, J.; Hermida, M.A. Urban Sustainability Through the Lens of Urban Fabric Typologies: A Case Study of Cuenca, Ecuador. Sustainability 2024, 16, 10260. [Google Scholar] [CrossRef]
- Reyes-Riveros, R.; Altamirano, A.; De La Barrera, F.; Rozas-Vásquez, D.; Vieli, L.; Meli, P. Linking Public Urban Green Spaces and Human Well-Being: A Systematic Review. Urban For. Urban Green. 2021, 61, 127105. [Google Scholar] [CrossRef]
- Pinto, L.V.; Inácio, M.; Ferreira, C.S.S.; Ferreira, A.D.; Pereira, P. Ecosystem Services and Well-Being Dimensions Related to Urban Green Spaces–A Systematic Review. Sustain. Cities Soc. 2022, 85, 104072. [Google Scholar] [CrossRef]
- Basu, S.; Nagendra, H. Perceptions of Park Visitors on Access to Urban Parks and Benefits of Green Spaces. Urban For. Urban Green. 2021, 57, 126959. [Google Scholar] [CrossRef]
- Pamukcu-Albers, P.; Ugolini, F.; La Rosa, D.; Grădinaru, S.R.; Azevedo, J.C.; Wu, J. Building Green Infrastructure to Enhance Urban Resilience to Climate Change and Pandemics. Landsc. Ecol. 2021, 36, 665–673. [Google Scholar] [CrossRef]
- Li, X.; Ma, X.; Hu, Z.; Li, S. Investigation of Urban Green Space Equity at the City Level and Relevant Strategies for Improving the Provisioning in China. Land Use Policy 2021, 101, 105144. [Google Scholar] [CrossRef]
- Gradinaru, S.R.; Onose, D.A.; Oliveira, E.; Slave, A.R.; Popa, A.M.; Gavrilidis, A.A. Equity in Urban Greening: Evidence from Strategic Planning in Romania. Landsc. Urban Plan. 2023, 230, 104614. [Google Scholar] [CrossRef]
- Waheeb, S.A.; Zerouali, B.; Elbeltagi, A.; Alwetaishi, M.; Wong, Y.J.; Bailek, N.; AlSaggaf, A.A.; Abd Elrahman, S.I.; Santos, C.A.G.; Majrashi, A.A. Enhancing Sustainable Urban Planning through GIS and Multiple-Criteria Decision Analysis: A Case Study of Green Space Infrastructure in Taif Province, Saudi Arabia. Water 2023, 15, 3031. [Google Scholar] [CrossRef]
- Díaz-Sánchez, J.P.; Lanchimba, C.; Albuja, D.; Ramírez, Y. Unveiling the Determinants of Femicide in Ecuador: A Comprehensive Analysis. Front. Sociol. 2025, 9, 1452438. [Google Scholar] [CrossRef]
- Instituto Nacional de Estadísticas y Censos (INEC) Índice Verde Urbano. Quito, Ecuador. 2020. Available online: https://www.ecuadorencifras.gob.ec/institucional/home/ (accessed on 27 January 2025).
- Xie, J.; Liu, X.; Wang, M. SFKNN-DPC: Standard Deviation Weighted Distance Based Density Peak Clustering Algorithm. Inf. Sci. 2024, 653, 119788. [Google Scholar] [CrossRef]
- Yutian, L.; Running, C.; Bin, C.; Jiayu, W. Inclusive Green Environment for All? An Investigation of Spatial Access Equity of Urban Green Space and Associated Socioeconomic Drivers in China. Landsc. Urban Plan. 2024, 241, 104926. [Google Scholar]
- Sadler, J.; Bates, A.; Hale, J.; James, P. Bringing Cities Alive: The Importance of Urban Green Spaces for People and Biodiversity. In Urban Ecology; Cambridge University Press: New York, NY, USA, 2010; pp. 231–260. [Google Scholar]
- Graviola, G.R.; Ribeiro, M.C.; Pena, J.C. Reconciling Humans and Birds When Designing Ecological Corridors and Parks within Urban Landscapes. Ambio 2022, 51, 253–268. [Google Scholar] [CrossRef] [PubMed]
- Berdejo-Espinola, V.; Suárez-Castro, A.F.; Amano, T.; Fielding, K.S.; Oh, R.R.Y.; Fuller, R.A. Urban Green Space Use during a Time of Stress: A Case Study during the COVID-19 Pandemic in Brisbane, Australia. People Nat. 2021, 3, 597–609. [Google Scholar] [CrossRef]
- Sharifi, F.; Levin, I.; Stone, W.M.; Nygaard, A. Green Space and Subjective Well-Being in the Just City: A Scoping Review. Environ. Sci. Policy 2021, 120, 118–126. [Google Scholar] [CrossRef]
- Anguelovski, I.; Irazábal-Zurita, C.; Connolly, J.J. Grabbed Urban Landscapes: Socio-spatial Tensions in Green Infrastructure Planning in Medellín. Int. J. Urban Reg. Res. 2019, 43, 133–156. [Google Scholar] [CrossRef]
- Rendón-Mera, D.I.; Burckhardt, D.; Durán, J.; Ocampo, V.; Vargas-Fonseca, S.A. The Jumping Plant-Lice (Hemiptera, Psylloidea) in Urban Green Spaces of Bogotá (Colombia), with Descriptions of Two New Species and Redescription of Mastigimascolombianus Burckhardt, Queiroz and Drohojowska. ZooKeys 2024, 1209, 199. [Google Scholar] [CrossRef] [PubMed]
- Lopez, B.; Kennedy, C.; Field, C.; McPhearson, T. Who Benefits from Urban Green Spaces during Times of Crisis? Perception and Use of Urban Green Spaces in New York City during the COVID-19 Pandemic. Urban For. Urban Green. 2021, 65, 127354. [Google Scholar] [CrossRef]
- Van den Bosch, M. Impacts of Urban Forests on Physical and Mental Health and Wellbeing. In Routledge Handbook of Urban Forestry; Routledge: London, UK, 2017; pp. 82–95. [Google Scholar]
- Jensen, B.C.S.; Engsig-Karup, A.P.; Knudsen, K. Efficient Uncertainty Quantification and Variance-Based Sensitivity Analysis in Epidemic Modelling Using Polynomial Chaos. Math. Model. Nat. Phenom. 2022, 17, 8. [Google Scholar] [CrossRef]
- Polat, H.I. An Approach to the Green Area Parameter in Urban Transformation. Civ. Eng. J. 2017, 3, 1020–1028. [Google Scholar] [CrossRef]
- Paoin, K.; Pharino, C. Outlooks and Challenges for Urban Green Space Development: A Review Case Study in Thailand. Appl. Environ. Res. 2024, 46. [Google Scholar] [CrossRef]
- Bakker, V.; Verburg, P.H.; van Vliet, J. Trade-Offs between Prosperity and Urban Land per Capita in Major World Cities. Geogr. Sustain. 2021, 2, 134–138. [Google Scholar] [CrossRef]
- Zhao, R.; Fang, C.; Liu, H.; Liu, X. Evaluating Urban Ecosystem Resilience Using the DPSIR Framework and the ENA Model: A Case Study of 35 Cities in China. Sustain. Cities Soc. 2021, 72, 102997. [Google Scholar] [CrossRef]
- Miguez, M.G.; Gomes, M.V.R.; Amback, B.C.; de Mello Neto, H.; Thomaz, F.R.; de Mattos, R.R.; Veról, A.P.; de Sousa, M.M.; Rezende, O.M.; de Magalhães, P.C. Conceptual Framework to Incorporate Drainage Solutions in the Urban Open Space System. Front. Water 2024, 6, 1468975. [Google Scholar] [CrossRef]
- Tao, Y.; Tao, Q.; Sun, X.; Qiu, J.; Pueppke, S.G.; Ou, W.; Guo, J.; Qi, J. Mapping Ecosystem Service Supply and Demand Dynamics under Rapid Urban Expansion: A Case Study in the Yangtze River Delta of China. Ecosyst. Serv. 2022, 56, 101448. [Google Scholar] [CrossRef]
- Huang, B.-X.; Li, W.-Y.; Ma, W.-J.; Xiao, H. Space Accessibility and Equity of Urban Green Space. Land 2023, 12, 766. [Google Scholar] [CrossRef]
- Kato-Huerta, J.; Geneletti, D. A Distributive Environmental Justice Index to Support Green Space Planning in Cities. Landsc. Urban Plan. 2023, 229, 104592. [Google Scholar] [CrossRef]
- Russo, A. Renaturing for Urban Wellbeing: A Socioecological Perspective on Green Space Quality, Accessibility, and Inclusivity. Sustainability 2024, 16, 5751. [Google Scholar] [CrossRef]
- Chu, M.; Lu, J.; Sun, D. Influence of Urban Agglomeration Expansion on Fragmentation of Green Space: A Case Study of Beijing-Tianjin-Hebei Urban Agglomeration. Land 2022, 11, 275. [Google Scholar] [CrossRef]
- Qiu, M.; Yang, Z.; Zuo, Q.; Wu, Q.; Jiang, L.; Zhang, Z.; Zhang, J. Evaluation on the Relevance of Regional Urbanization and Ecological Security in the Nine Provinces along the Yellow River, China. Ecol. Indic. 2021, 132, 108346. [Google Scholar] [CrossRef]
- Krzyżaniak, M.; Świerk, D.; Szczepańska, M.; Urbański, P. Changes in the Area of Urban Green Space in Cities of Western Poland. Bull. Geogr. Socio-Econ. Ser. 2018, 65–77. [Google Scholar] [CrossRef]
- Bonilla-Bedoya, S.; Mora, A.; Vaca, A.; Estrella, A.; Herrera, M.Á. Modelling the Relationship between Urban Expansion Processes and Urban Forest Characteristics: An Application to the Metropolitan District of Quito. Comput. Environ. Urban Syst. 2020, 79, 101420. [Google Scholar] [CrossRef]
- Peek, O.; Hordijk, M.; d’Auria, V. User-Based Design for Inclusive Urban Transformation: Learning from ‘Informal’and ‘Formal’Dwelling Practices in Guayaquil, Ecuador. In Housing Policy Innovation in the Global South; Routledge: London, UK, 2020; pp. 38–66. [Google Scholar]
- Takalo, S.K.; Tooranloo, H.S. Green Innovation: A Systematic Literature Review. J. Clean. Prod. 2021, 279, 122474. [Google Scholar] [CrossRef]
- Noszczyk, T.; Gorzelany, J.; Kukulska-Kozieł, A.; Hernik, J. The Impact of the COVID-19 Pandemic on the Importance of Urban Green Spaces to the Public. Land Use Policy 2022, 113, 105925. [Google Scholar] [CrossRef] [PubMed]
- Kadaverugu, R.; Gurav, C.; Rai, A.; Sharma, A.; Matli, C.; Biniwale, R. Quantification of Heat Mitigation by Urban Green Spaces Using InVEST Model—A Scenario Analysis of Nagpur City, India. Arab. J. Geosci. 2021, 14, 82. [Google Scholar] [CrossRef]
- Wang, X.; Chen, Y.; Han, Z.; Yao, X.; Gu, P.; Jiang, Y. Evaluation of Mobile-Based Public Participation in China’s Urban Planning: Case Study of the PinStreet Platform. Cities 2021, 109, 102993. [Google Scholar] [CrossRef]
- De Serres, A.; Murtin, F.; Nicoletti, G. A Framework for Assessing Green Growth Policies; OECD: Paris, France, 2010. [Google Scholar]
- Georgeson, L.; Maslin, M.; Poessinouw, M. The Global Green Economy: A Review of Concepts, Definitions, Measurement Methodologies and Their Interactions. Geo Geogr. Environ. 2017, 4, e00036. [Google Scholar] [CrossRef]
- Yu, P.; Yung, E.H.; Chan, E.H.; Wong, M.S.; Wang, S.; Chen, Y. An Integrated Approach for Examining Urban Fragmentation in Metropolitan Areas: Implications for Sustainable Urban Planning. J. Clean. Prod. 2023, 419, 138151. [Google Scholar] [CrossRef]
- Pristeri, G.; Peroni, F.; Pappalardo, S.E.; Codato, D.; Masi, A.; De Marchi, M. Whose Urban Green? Mapping and Classifying Public and Private Green Spaces in Padua for Spatial Planning Policies. ISPRS Int. J. Geo-Inf. 2021, 10, 538. [Google Scholar] [CrossRef]


| Variable | Definition |
|---|---|
| Total green areas (m2) | Square meters corresponding to green areas in a zone or region |
| Urban population | Number of inhabitants in a region |
| Urban green index (m2/inhab.) | Proportion of green areas per m2 per inhabitant |
| Number of projects | Number of green area expansion projects |
| Investment value | Monetary value of the green area expansion projects |
Disclaimer/Publisher’s Note: The statements, opinions and data contained in all publications are solely those of the individual author(s) and contributor(s) and not of MDPI and/or the editor(s). MDPI and/or the editor(s) disclaim responsibility for any injury to people or property resulting from any ideas, methods, instructions or products referred to in the content. |
© 2025 by the authors. Licensee MDPI, Basel, Switzerland. This article is an open access article distributed under the terms and conditions of the Creative Commons Attribution (CC BY) license (https://creativecommons.org/licenses/by/4.0/).
Share and Cite
Hernández-Allauca, A.D.; Gavilánez, J.G.P.; Salazar, S.P.M.; Guadalupe, C.S.A.; Uvidia, J.F.V.; Castañeda, E.P.S.; Silva, V.F.N.; Chávez, R.F.S. An Analysis of the Urban Green Space Index in Ecuadorian Cities Through Mathematical Modeling: A Territorial Analysis. Urban Sci. 2025, 9, 232. https://doi.org/10.3390/urbansci9060232
Hernández-Allauca AD, Gavilánez JGP, Salazar SPM, Guadalupe CSA, Uvidia JFV, Castañeda EPS, Silva VFN, Chávez RFS. An Analysis of the Urban Green Space Index in Ecuadorian Cities Through Mathematical Modeling: A Territorial Analysis. Urban Science. 2025; 9(6):232. https://doi.org/10.3390/urbansci9060232
Chicago/Turabian StyleHernández-Allauca, Andrea Damaris, Jorge Gualberto Paredes Gavilánez, Sandra Patricia Miranda Salazar, Carla Sofía Arguello Guadalupe, Juan Federico Villacis Uvidia, Eduardo Patricio Salazar Castañeda, Vilma Fernanda Noboa Silva, and Roberto Fabián Sánchez Chávez. 2025. "An Analysis of the Urban Green Space Index in Ecuadorian Cities Through Mathematical Modeling: A Territorial Analysis" Urban Science 9, no. 6: 232. https://doi.org/10.3390/urbansci9060232
APA StyleHernández-Allauca, A. D., Gavilánez, J. G. P., Salazar, S. P. M., Guadalupe, C. S. A., Uvidia, J. F. V., Castañeda, E. P. S., Silva, V. F. N., & Chávez, R. F. S. (2025). An Analysis of the Urban Green Space Index in Ecuadorian Cities Through Mathematical Modeling: A Territorial Analysis. Urban Science, 9(6), 232. https://doi.org/10.3390/urbansci9060232