
Determinants of Fare Evasion in Urban Bus Lines: Case Study of a Large Database Considering Spatial Components


Abstract
1. Introduction
2. Literature Review
3. Materials and Methods
3.1. Data
3.2. Model Formulation
4. Results
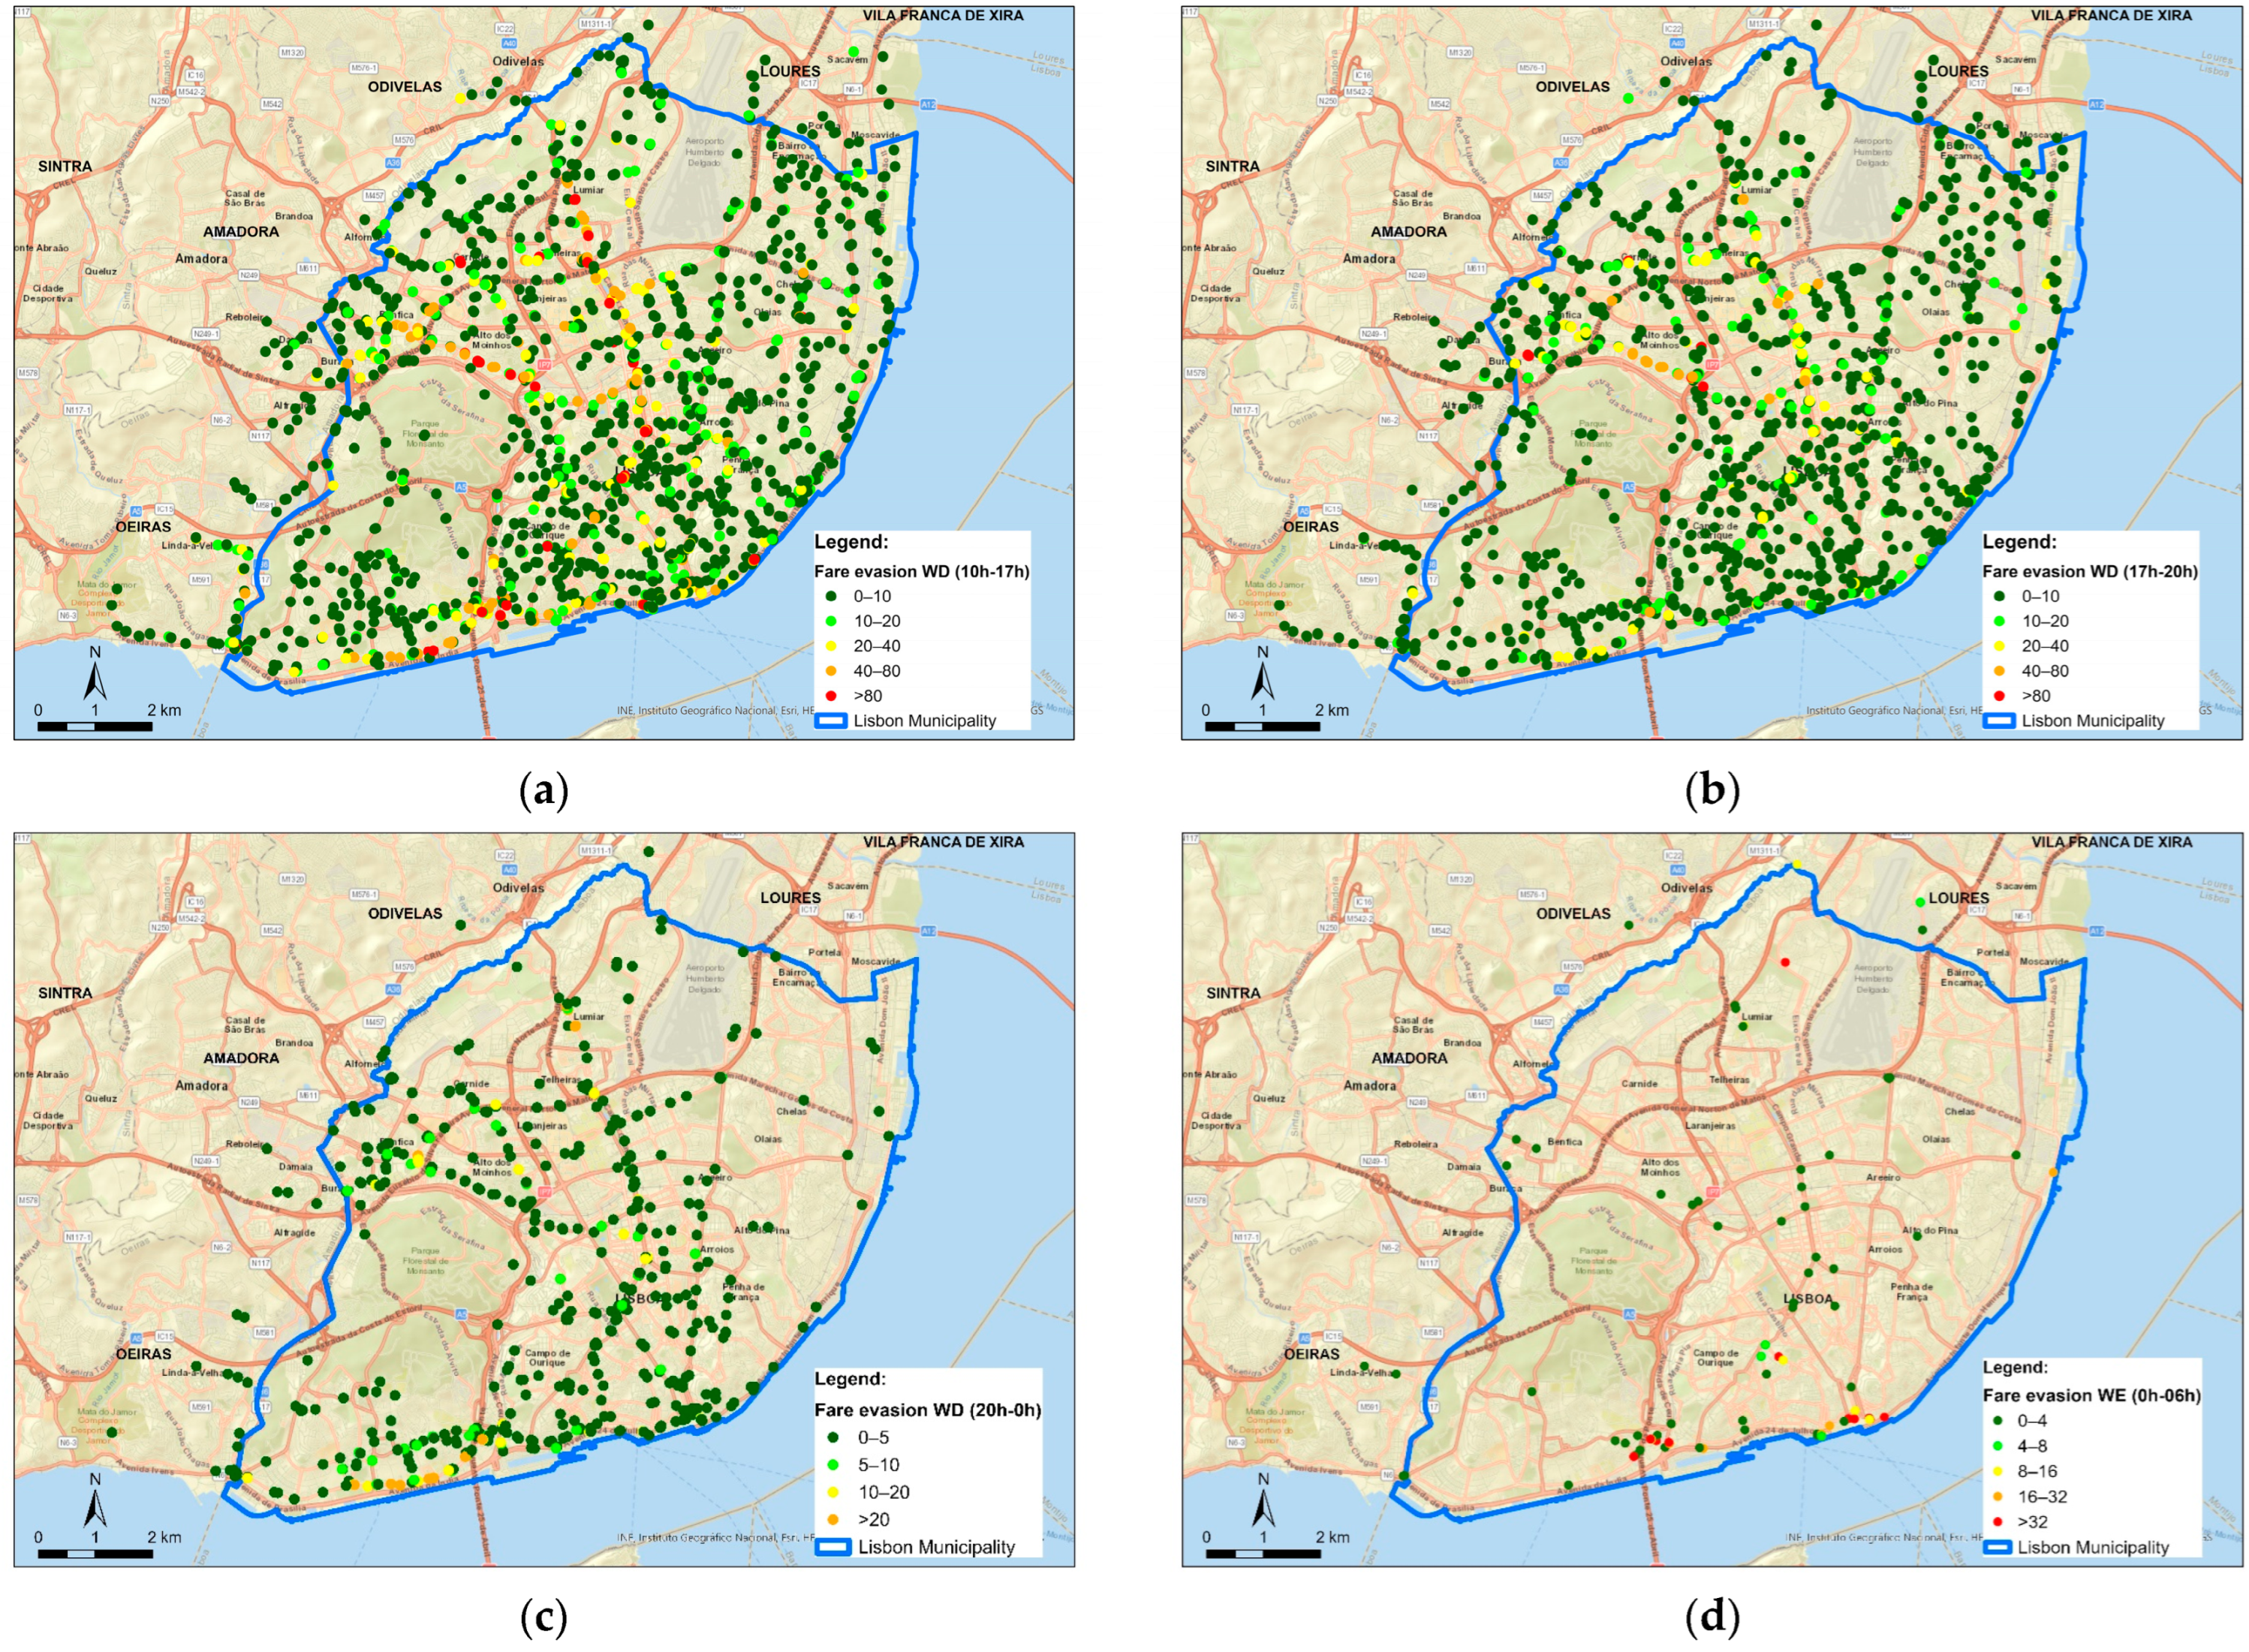
- The five derived models exhibit similarities across the day, but the statistical significance of some explanatory variables varies considerably depending on the period of day, confirming that fare evasion is indeed influenced by the time factor. The extent to which the period of the day influences evasion is best seen from Table 2, whose results confirm higher evasion rates during 10–17 h off-peak, as noted in [22], both in absolute terms and detection rates, placing this period as likely more prone to evasion than rush hours. What Table 4 also shows is that the structure of fare evasion tendencies also varies with the period of the day, as explained below.
- The intercept term is mostly not relevant. This term represents a baseline tendency for infringement. The fact that such tendencies did not show up can perhaps be explained by their absorption into the explanatory power of the inspection actions. It was only for weekdays 10–17 h that a significant intercept was found, of 1.724 evaders per inspected bus. It is tempting to interpret this as evidence of a structural nature of fare evasion in the 10–17 h off-peak period, i.e., that some evasion is likely to exist, even if no inspections were carried out. It is worth noting that the alternative of running the model with infringements per inspective action as dependent variable does yield significant intercepts, which is expectable as they would then have the interpretation of baseline infringement per inspection action.
- The age appears not to be relevant, contrary to findings by other authors. In the only case where the model did find a tendency, weekends 0–6 h, that tendency was that young males were less likely to infringe, in line with the findings of [18] and opposite to those of [19,22,23]. As the large database used in this research decreases the likelihood of a statistical type II error (false negative), a case can be made for young age not being a predictor of evasion in general. At most young age can produce local, city-scale effects and are unlikely to be significant as a global, worldwide trend.
- The dependent variable spatial lag has an influence in some time periods, suggesting that some endogeneity in fare evasion at those periods. The negative coefficient on weekdays 17–20 h is perhaps somewhat unexpected, as it suggests anticorrelation: stops with high infringement detection tend to pair with those with low detection. This hints at inspection actions having a stronger deterrent effect at this period, which is a rush hour (many passengers) and has the highest number of inspections per hour (Table 2), leading to a higher visibility of inspections. Passengers who take the inspected bus lines are likely to have witnessed those inspections and refrain from evading, leading to less detection at the nearby stops. On the other hand, the mild positive correlation at weekends late night (0–6 h) suggests a contagion in infringements, i.e., “if they skip the ticket, so will I”.
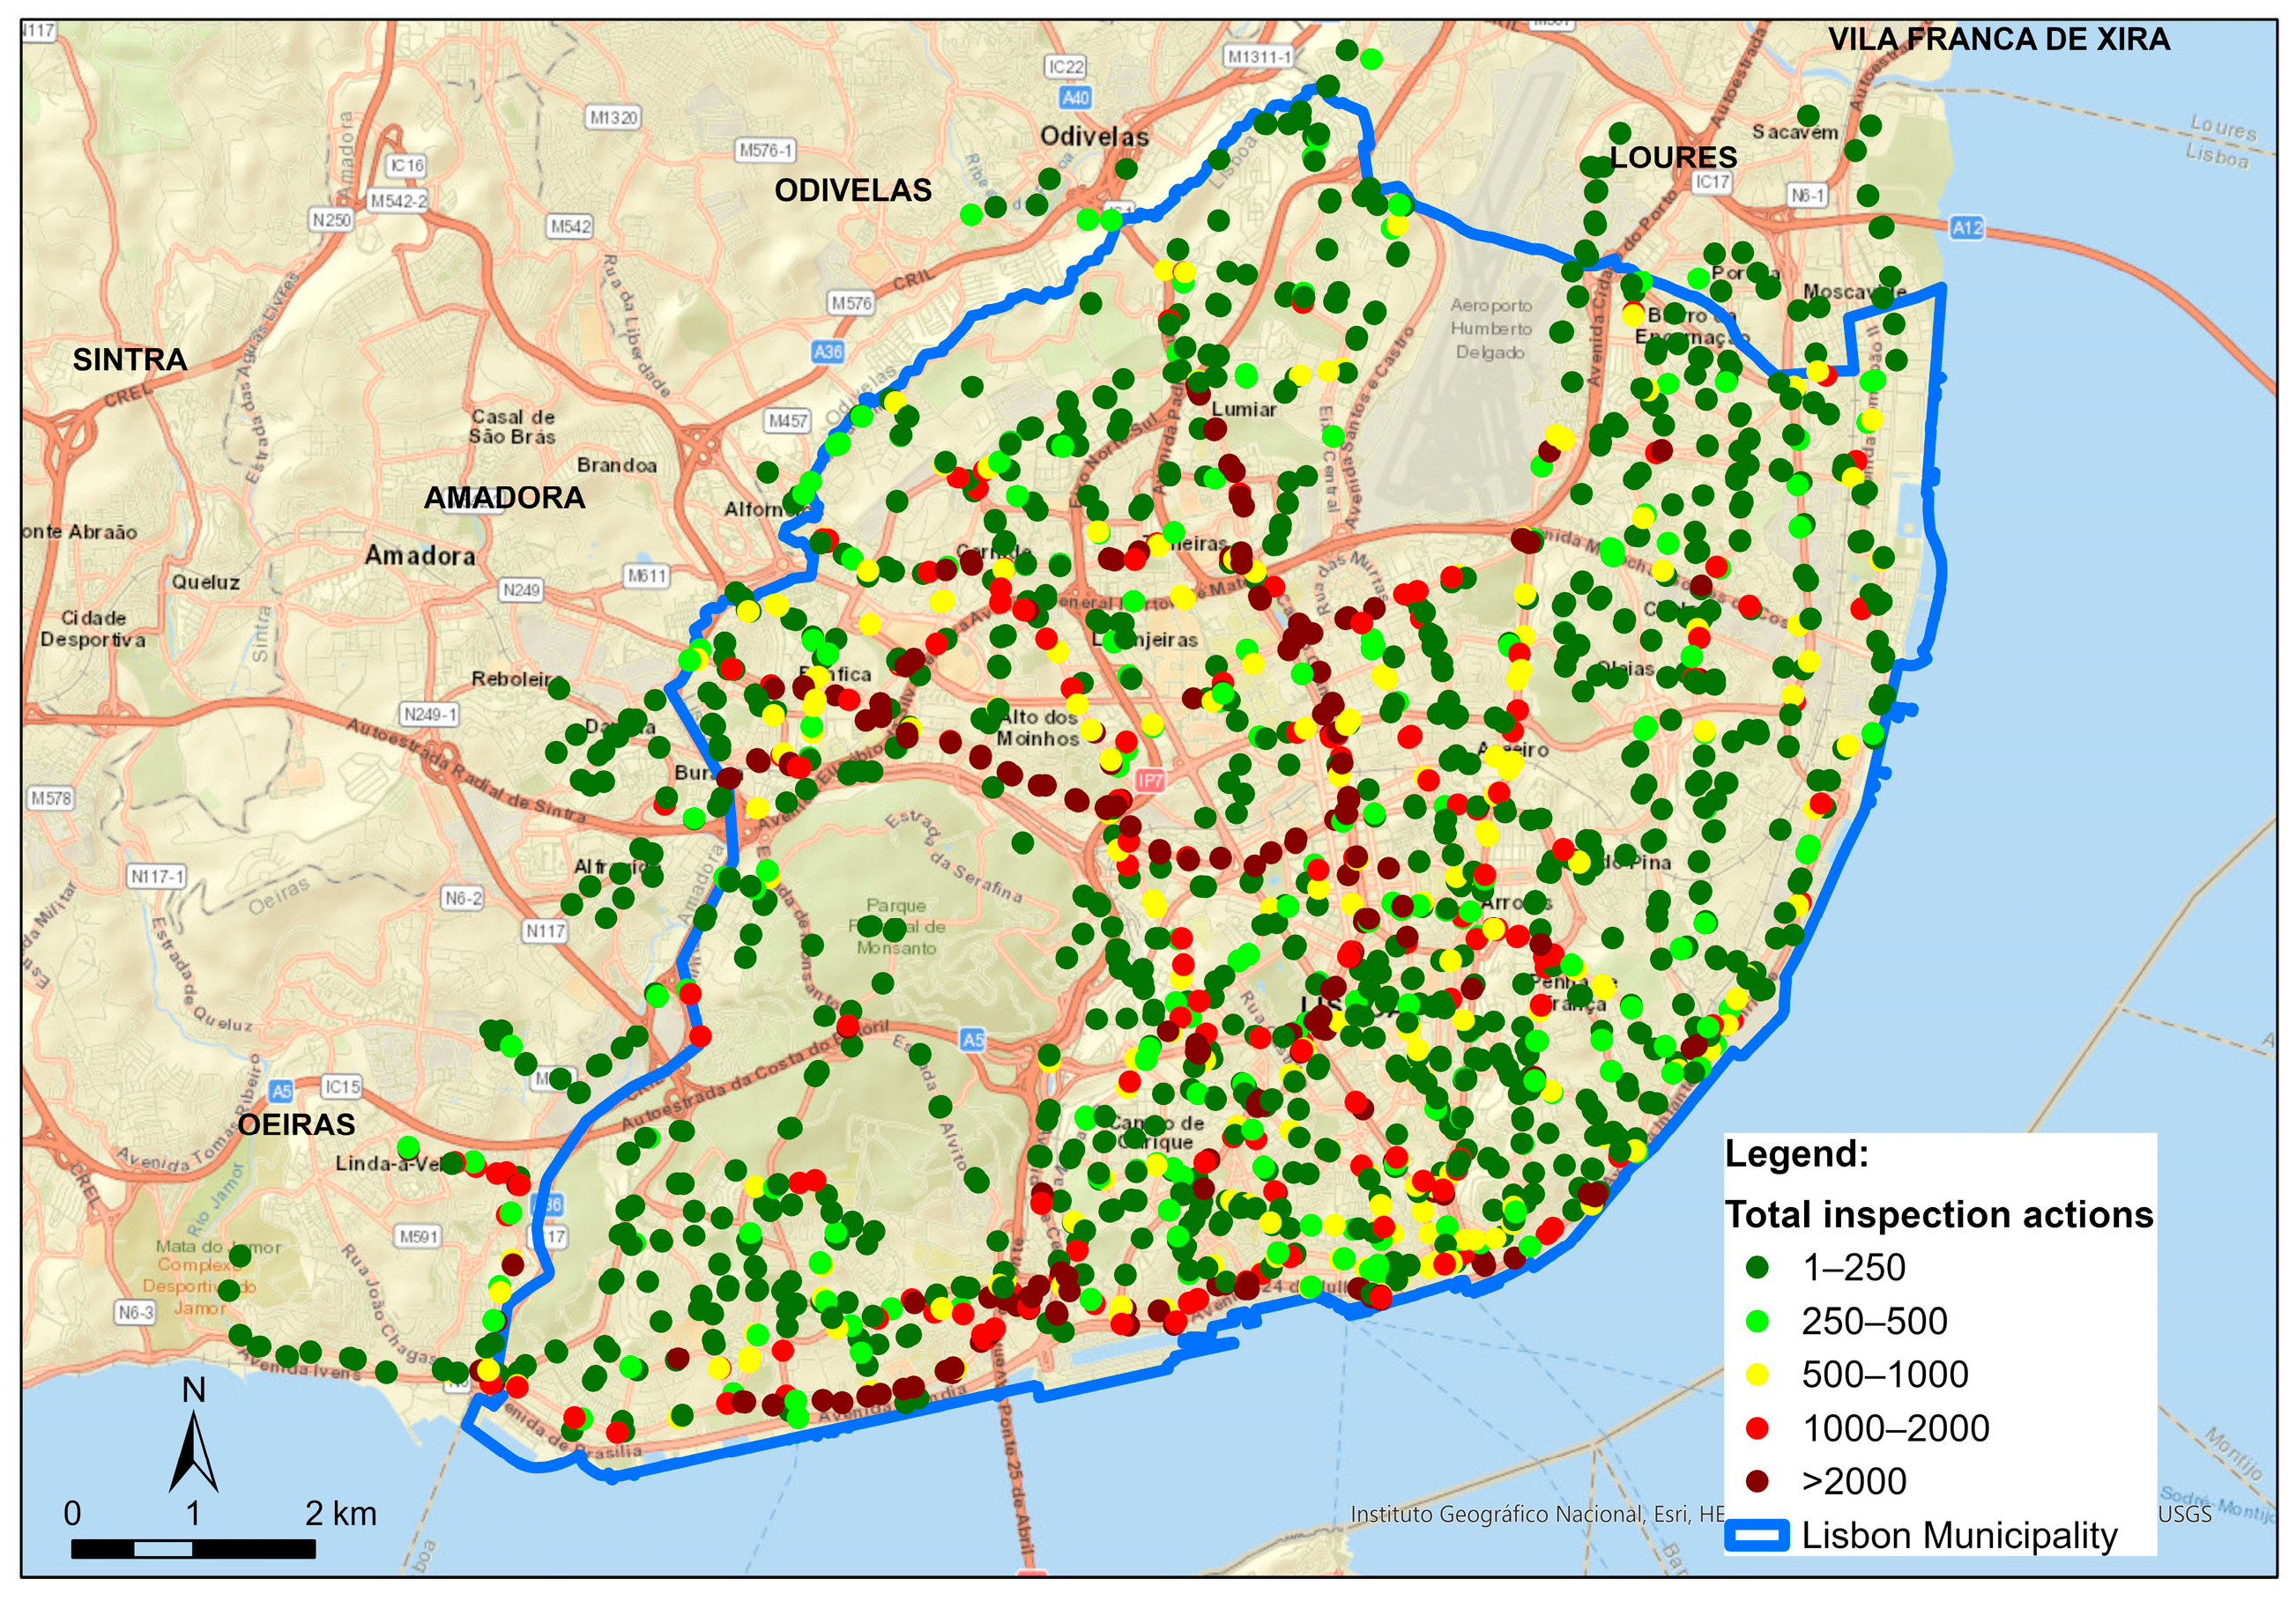
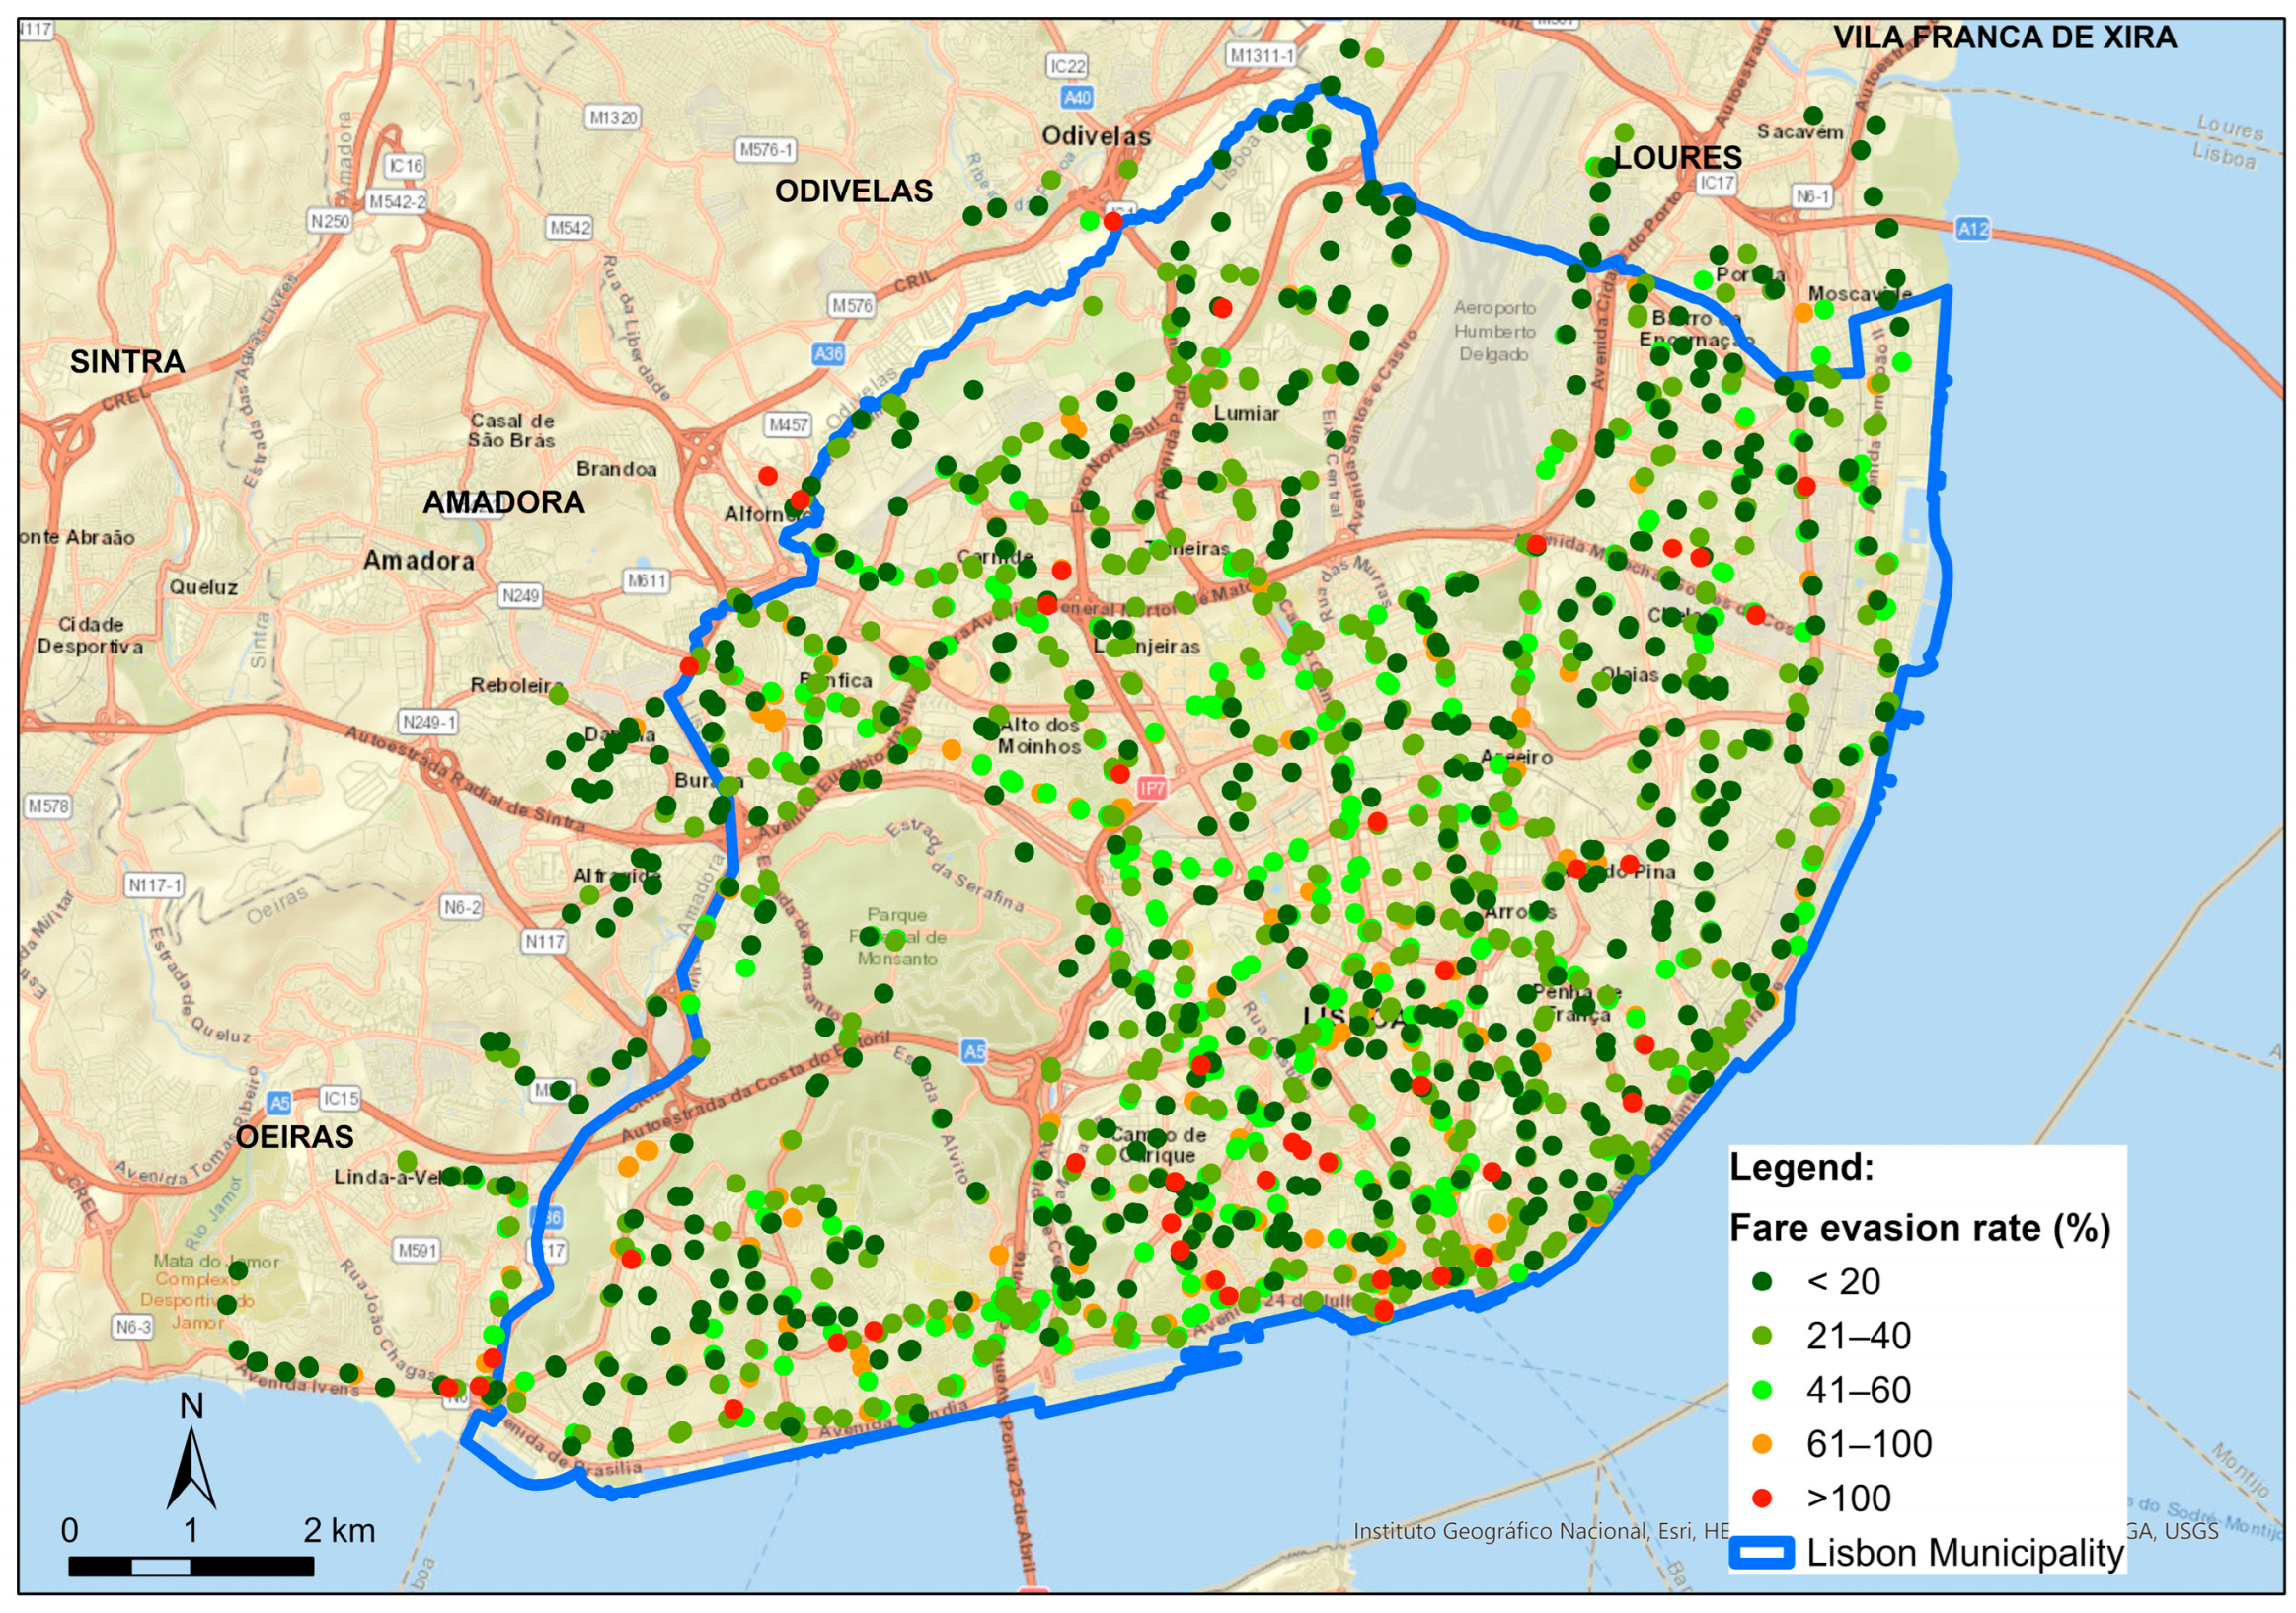
- Inspective actions have by far the highest explicative power. This was expected, as one can only detect what one looks for, and is in line with findings of [29,30], who advocate for intensifying inspection actions as the best way to fight fare evasion offences. At this point, it is important to note that, as Figure 2 shows, there is unevenness in the distribution of inspection actions, with some stops being more intensively scrutinized than others. It is because of this imbalance that detected evasion must be controlled for the number of inspection actions. Had the inspection actions been evenly distributed, the number of actions would have very little predictive power, if any at all. But, as will be seen, the high explicative power of such actions does not preclude other statistically significant trends for detected evasion. Returning to the results, detection rates are consistent during the day, with regression coefficients revealing about 0.02–0.03 detections per action, and rising during the night, especially on weekends, climbing to 0.04–0.13 detections, possibly revealing infringers trust that they will not be inspected due to the off-hours. An exception is late night weekdays (0–6 h), which have the lowest infringement rates with about 0.01 detections per action. This might be due to people using buses at these hours on weekdays being mostly early workers, who usually have public transport passes. Note that for weekdays 10–17 h, the baseline tendency adds to the effect of inspective actions, yielding the highest absolute number of detected infringements. This was the only case where variance could be significantly split into an explanation of baseline plus inspection actions.
- Bus frequency has a small effect. Positive at weekdays 10–17 h, a possible explanation for it might be the temptation to skip the ticket believing that the inspective workforce, which is limited, cannot be on all buses at the same time and so it may prefer the rush hours, losing grip in the period in-between. At early night, the negative effect may come from a fear to be sent off the bus from infringement at an inconvenient time when other busses are scarce and the surroundings potentially unsafe. The daytime frequency effect may be worth considering in the context of frequency-setting algorithms, such as, e.g., [41].
- POI density has a negative effect on infringement detection at rush hours, suggesting that some people that head to POI-dense locations, perhaps the tourists or workers at the POI, have a lower tendency to infringe. This point seems worthy of further research.
- The error spatial lag has positive-signed significance during the 10–17 h and 20–0 h weekday periods, suggesting increased evasion trends in some spatially clustered bus stops. Since the error term captures unknown factors, this clustering may be due to geographic variables that influence evasion but do not feature in the models.
- Finally, concerning model quality (R2 values), most of the GS2SLS models adhere quite well to the data. The fitness is not so good for weekdays late nighttime (0–6 h) and weekends daytime (6–20 h), but even in that case, the models capture a considerable part of the data.
5. Discussion
6. Conclusions
Author Contributions
Funding
Data Availability Statement
Acknowledgments
Conflicts of Interest
Abbreviations
| GS2SLS | Generalized spatial two-stage least-squares regression |
| IA | Inspection actions |
| DE | Detected evasion |
| POI | Point of interest |
| OSM | OpenStreetMap |
| INE | Instituto Nacional de Estatística—Portuguese statistics bureau |
References
- Killias, M.; Scheidegger, D.; Nordenson, P. The Effects of Increasing the Certainty of Punishment: A Field Experiment on Public Transportation. Eur. J. Criminol. 2009, 6, 387–400. [Google Scholar] [CrossRef]
- Reddy, A.V.; Kuhls, J.; Lu, A. Measuring and Controlling Subway Fare Evasion: Improving Safety and Security at New York City Transit Authority. Transp. Res. Rec. 2011, 2216, 85–99. [Google Scholar] [CrossRef]
- Celse, J.; Grolleau, G. Fare Evasion and Information Provision: What Information Should Be Provided to Reduce Fare-Evasion? Transp. Policy 2023, 138, 119–128. [Google Scholar] [CrossRef]
- Abrate, G.; Fraquelli, G.; Meko, E.; Rodia, G. L’evasione Tariffaria Nel Trasporto Pubblico Locale: Un’analisi Empirica. In Proceedings of the Conferenza Società Italiana di Economia Pubblica, XX Riunione Scientifica, Pavia, Italy, 25–26 September 2008; pp. 25–26. [Google Scholar]
- Suquet, J.-B. Drawing the Line: How Inspectors Enact Deviant Behaviors. Emerald 2010, 24, 468–475. [Google Scholar]
- Currie, G.; Delbosc, A. An Empirical Model for the Psychology of Deliberate and Unintentional Fare Evasion. Transp. Policy 2017, 54, 21–29. [Google Scholar] [CrossRef]
- Lee, J. Uncovering San Francisco, California, Muni’s Proof-of-Payment Patterns to Help Reduce Fare Evasion. Transp. Res. Rec. 2011, 2216, 75–84. [Google Scholar] [CrossRef]
- Munizaga, M.A.; Gschwender, A.; Gallegos, N. Fare Evasion Correction for Smartcard-Based Origin-Destination Matrices. Transp. Res. A Policy Pract. 2020, 141, 307–322. [Google Scholar] [CrossRef]
- Egu, O.; Bonnel, P. Can We Estimate Accurately Fare Evasion without a Survey? Results from a Data Comparison Approach in Lyon Using Fare Collection Data, Fare Inspection Data and Counting Data. Public Transp. 2020, 12, 1–26. [Google Scholar] [CrossRef]
- Cantillo, A.; Raveau, S.; Muñoz, J.C. Fare Evasion on Public Transport: Who, When, Where and How? Transp. Res. A Policy Pract. 2022, 156, 285–295. [Google Scholar] [CrossRef]
- Almutairi, A.; Owais, M.; Ahmed, A.S. Notes on Bus User Assignment Problem Using Section Network Representation Method. Appl. Sci. 2024, 14, 3406. [Google Scholar] [CrossRef]
- Guarda, P.; Galilea, P.; Paget-Seekins, L.; Ortúzar, J. de D. What Is behind Fare Evasion in Urban Bus Systems? An Econometric Approach. Transp. Res. A Policy Pract. 2016, 84, 55–71. [Google Scholar] [CrossRef]
- Barabino, B.; Salis, S. Do Students, Workers, and Unemployed Passengers Respond Differently to the Intention to Evade Fares? An Empirical Research. Transp. Res. Interdiscip. Perspect. 2020, 7, 100215. [Google Scholar] [CrossRef]
- Busco, C.; González, F.; Jaqueih, Y.; Jiménez, F.; Alonso, B. Understanding Transantiago Users’ Motivations for Paying or Evading Payment of Bus Fares. J. Public Transp. 2022, 24, 100016. [Google Scholar] [CrossRef]
- Delbosc, A.; Currie, G. Why Do People Fare Evade? A Global Shift in Fare Evasion Research. Transp. Rev. 2019, 39, 376–391. [Google Scholar] [CrossRef]
- Barabino, B.; Salis, S.; Useli, B. Fare Evasion in Proof-of-Payment Transit Systems: Deriving the Optimum Inspection Level. Transp. Res. B Methodol. 2014, 70, 1–17. [Google Scholar] [CrossRef]
- Delbosc, A.; Currie, G. Four Types of Fare Evasion: A Qualitative Study from Melbourne, Australia. Transp. Res. Part F: Traffic Psychol. Behav. 2016, 43, 254–264. [Google Scholar] [CrossRef]
- Eddy, D. Fare Evasion Is It a Youth Issue? Transit Aust. 2010, 65, 1–7. [Google Scholar]
- Cools, M.; Fabbro, Y.; Bellemans, T. Identification of the Determinants of Fare Evasion. Case Stud. Transp. Policy 2018, 6, 348–352. [Google Scholar] [CrossRef]
- Perrotta, A.F. Transit Fare Affordability: Findings from a Qualitative Study. Public Works Manag. Policy 2017, 22, 226–252. [Google Scholar] [CrossRef]
- Dai, Z.; Galeotti, F.; Villeval, M.C. Cheating in the Lab Predicts Fraud in the Field: An Experiment in Public Transportation. Manag. Sci. 2018, 64, 1081–1100. [Google Scholar] [CrossRef]
- Bucciol, A.; Landini, F.; Piovesan, M. Unethical Behavior in the Field: Demographic Characteristics and Beliefs of the Cheater. J. Econ. Behav. Organ. 2013, 93, 248–257. [Google Scholar] [CrossRef]
- Barabino, B.; Salis, S.; Useli, B. What Are the Determinants in Making People Free Riders in Proof-of-Payment Transit Systems? Evidence from Italy. Transp. Res. A Policy Pract. 2015, 80, 184–196. [Google Scholar] [CrossRef]
- Guzman, L.A.; Arellana, J.; Camargo, J.P. A Hybrid Discrete Choice Model to Understand the Effect of Public Policy on Fare Evasion Discouragement in Bogotá’s Bus Rapid Transit. Transp. Res. A Policy Pract. 2021, 151, 140–153. [Google Scholar] [CrossRef]
- Sasaki, Y. Optimal Choices of Fare Collection Systems for Public Transportations: Barrier versus Barrier-Free. Transp. Res. B Methodol. 2014, 60, 107–114. [Google Scholar] [CrossRef]
- Milioti, C.; Panoutsopoulos, A.; Kepaptsoglou, K.; Tyrinopoulos, Y. Key Drivers of Fare Evasion in a Metro System: Evidence from Athens, Greece. Case Stud. Transp. Policy 2020, 8, 778–783. [Google Scholar] [CrossRef]
- Clarke, R.V.; Contre, S.; Petrossian, G. Deterrence and Fare Evasion: Results of a Natural Experiment. Secur. J. 2010, 23, 5–17. [Google Scholar] [CrossRef]
- González, F.; Busco, C.; Codocedo, K. Fare Evasion in Public Transport: Grouping Transantiago Users’ Behavior. Sustainability 2019, 11, 6543. [Google Scholar] [CrossRef]
- Bonfanti, G.; Wagenknecht, T. Human Factors Reduce Aggression and Fare Evasion. Public Transp. Int. 2010, 59, 28–32. [Google Scholar]
- Fürst, E.W.M.; Herold, D.M. Fare Evasion and Ticket Forgery in Public Transport: Insights from Germany, Austria and Switzerland. Societies 2018, 8, 98. [Google Scholar] [CrossRef]
- Larwin, T.F.; Koprowsky, Y. Off-Board Fare Payment Using Proof-of-Payment Verification. In Sustaining the Metropolis: LRT and Streetcars for Super Cities, Proceedings of the 12th International Light Rail Conference, Salt Lake City, Utah, 11–13 November 2012; Transportation Research Board 2013 Executive Committee Officers: Washington, DC, USA, 2013; pp. 71–83. [Google Scholar]
- Porath, K.; Galilea, P. Temporal Analysis of Fare Evasion in Transantiago: A Socio-Political View. Res. Transp. Econ. 2020, 83, 100958. [Google Scholar] [CrossRef]
- Freiria, S.; Sousa, N. The Impact of Accessibility Changes on Local Development: A Spatial Approach. J. Transp. Geogr. 2024, 120, 103975. [Google Scholar] [CrossRef]
- Carris. Relatório & Contas 2019; Carris: Lisbon, Portugal, 2019. [Google Scholar]
- Pourmonet, H.; Bassetto, S.; Trépanier, M. Vers La Maîtrise de l’évasion Tarifaire Dans Un Réseau de Transport Collectif. In Proceedings of the 11e Congrès International de Génie Industriel, Saint-Sauveur, QC, Canada, 26–28 October 2015. [Google Scholar]
- Elhorst, J.P. Relever Le Niveau de l’économetrie Spatial Appliquée. Spat. Econ. Anal. 2010, 5, 9–28. [Google Scholar] [CrossRef]
- Cordera, R.; Chiarazzo, V.; Ottomanelli, M.; dell’Olio, L.; Ibeas, A. The Impact of Undesirable Externalities on Residential Property Values: Spatial Regressive Models and an Empirical Study. Transp. Policy 2019, 80, 177–187. [Google Scholar] [CrossRef]
- INE. CENSOS 2021-Resultados Definitivos; INE: Lisboa, Portugal, 2021. [Google Scholar]
- Schneider, W. Bbbike Extract Service. Available online: https://extract.bbbike.org/ (accessed on 28 April 2025).
- Hensher, D.A.; Li, Z.; Mulley, C. Drivers of Bus Rapid Transit Systems—Influences on Patronage and Service Frequency. Res. Transp. Econ. 2014, 48, 159–165. [Google Scholar] [CrossRef]
- Owais, M.; Osman, M.K. Complete Hierarchical Multi-Objective Genetic Algorithm for Transit Network Design Problem. Expert Syst. Appl. 2018, 114, 143–154. [Google Scholar] [CrossRef]
- Wang, Z.; Zheng, J.; Han, C.; Lu, B.; Yu, D.; Yang, J.; Han, L. Exploring the Potential of OpenStreetMap Data in Regional Economic Development Evaluation Modeling. Remote Sens. 2024, 16, 239. [Google Scholar] [CrossRef]


| Authors | Location, City | Type of Survey | Sample Size (Passengers) | Analytical Tool |
|---|---|---|---|---|
| Abrate et al. [4] | Italy, 12 cities | Intercept (stop) interviews | 16,000 | Logistic regression |
| Barabino et al. [23] | Italy, Cagliari | Intercept (on-board) interviews | 2177 | Logistic regression |
| Barabino and Salis [13] | Italy, Cagliari | Intercept (on-board) interviews | 4404 | Logistic regression |
| Bucciol et al. [22] | Italy, Reggio Emilia | Intercept (stop) interviews | 544 | Probit regression/correlation analysis |
| Busco et al. [14] | Chile, Santiago | Intercept (on-board) interviews | 503 | Factor analysis |
| Cantillo et al. [10] | Chile, Santiago | Intercept (on-board) interviews | 10,559 | Binomial Logit Model |
| Cools et al. [19] | Belgium, Flanders | Web-based questionnaire | 638 | Logistic regression |
| Currie and Delbosc [6] | Australia, Melbourne | Web-based questionnaire | 1561 | Structural equation modelling |
| Eddy [18] | Australia, Melbourne | Intercept (stop) observations | 288 | Descriptive statistics |
| Egu and Bonnel [9] | France, Lyon | Intercept (on-board) interviews | 56,746 | Descriptive statistics |
| Delbosc and Currie [15] | Australia, Melbourne | Web-based questionnaire | 1561 | Two-step cluster analysis |
| Dai et al. [21] | France, Lyon | Intercept (stop) interviews and lab experiment | 279 | Descriptive statistics and logistic regression |
| Gonzalez et al. [28] | Chile, Santiago | Intercept (on-board) interviews | 457 | K-means clustering |
| Guzman et al. [24] | Colombia, Bogotá | Intercept (stop) interviews | 324 | Hybrid discrete choice model |
| Milioti et al. [26] | Greece, Athens | Intercept (stop) interviews | 304 | Ordinal logistic model |
| Weekdays | Weekend | ||||||||
|---|---|---|---|---|---|---|---|---|---|
| Statistic | 0–6 h | 6–10 h | 10–17 h | 17–20 h | 20–0 h | Total (WD) | 0–6 h | 6–20 h | |
| Inspection actions (IA) | Total IA/h | 16,347 10.9 | 342,647 341.3 | 646,125 367.7 | 295,531 392.5 | 48,206 48.0 | 1,348,856 223.9 | 9029 14.5 | 62,693 43.1 |
| Detected evasion (DE) | Total DE/h | 355 0.24 | 8752 8.72 | 19,159 10.90 | 8027 10.66 | 1716 1.71 | 38,009 6.31 | 1130 1.81 | 2101 1.44 |
| Detection rate | DE/IA × 100% | 2.17 | 2.55 | 2.97 | 2.72 | 3.56 | 2.82 | 12.5 | 3.4 |
| Variable | Role | Description | Year | Source |
|---|---|---|---|---|
| Detection evasion | Dependent | Number of people travelling without a ticket detected by inspection agents at a given stop | 2019 | Carris [34] |
| Bus frequency | Explanatory | Number of buses serving each stop at a given period of the day (not used at weekends) | 2019 | Carris [34] |
| Age 15–25 (Male) | Explanatory | Number of males between 15 and 25 years old residing in the statistical subsection 1 of the bus stop | 2021 | INE [38] |
| POI density | Explanatory | Density of touristic points of interest 2 in the statistical subsection of the bus stop (POI/km2) | 2022 | OSM [39] |
| Inspection actions | Explanatory | Number of inspection actions assigned to a given bus stop | 2019 | Carris [34] |
| Detected Infringements | 0–6 h | 6–10 h | 10–17 h | 17–20 h | 20–0 h |
|---|---|---|---|---|---|
| Intercept | 1.645 | 0.276 | 0.546 | 1.724 ** | 0.900 |
| Age 15–25 | 0.046 | 0.009 | 0.012 | −0.013 | 0.034 |
| Rho W | 0.012 | 0.038 | −0.20 | −0.110 *** | 0.023 |
| Inspection actions | 0.0124 **** | 0.0234 **** | 0.0236 **** | 0.0268 **** | 0.0390 **** |
| Bus frequency | 0.066 | 0.024 | 0.336 *** | 0.007 | −0.286 *** |
| POI density | −0.351 | −0.0979 **** | −0.017 | −0.144 *** | −0.073 |
| Lambda W | −0.244 | 0.039 | 0.155 **** | 0.073 | 0.208 ** |
| Pseudo R2/spatial R2 | 31%/32% | 82%/82% | 77%/78% | 64%/64% | 72%/71% |
| Detected Infringements | 0–6 h | 6–20 h |
|---|---|---|
| Intercept | 0.093 | −1.095 |
| Age 15–25 | −0.265 ** | 0.016 |
| Rho W | 0.121 * | −0.076 |
| Inspection actions | 0.133 **** | 0.0330 **** |
| Bus frequency | 0.205 | 0.004 |
| POI density | 0.035 | 0.069 |
| Lambda W | −0.175 | 0.031 |
| Pseudo R2/spatial R2 | 88%/88% | 34%/34% |
Disclaimer/Publisher’s Note: The statements, opinions and data contained in all publications are solely those of the individual author(s) and contributor(s) and not of MDPI and/or the editor(s). MDPI and/or the editor(s) disclaim responsibility for any injury to people or property resulting from any ideas, methods, instructions or products referred to in the content. |
© 2025 by the authors. Licensee MDPI, Basel, Switzerland. This article is an open access article distributed under the terms and conditions of the Creative Commons Attribution (CC BY) license (https://creativecommons.org/licenses/by/4.0/).
Share and Cite
Freiria, S.; Sousa, N. Determinants of Fare Evasion in Urban Bus Lines: Case Study of a Large Database Considering Spatial Components. Urban Sci. 2025, 9, 231. https://doi.org/10.3390/urbansci9060231
Freiria S, Sousa N. Determinants of Fare Evasion in Urban Bus Lines: Case Study of a Large Database Considering Spatial Components. Urban Science. 2025; 9(6):231. https://doi.org/10.3390/urbansci9060231
Chicago/Turabian StyleFreiria, Susana, and Nuno Sousa. 2025. "Determinants of Fare Evasion in Urban Bus Lines: Case Study of a Large Database Considering Spatial Components" Urban Science 9, no. 6: 231. https://doi.org/10.3390/urbansci9060231
APA StyleFreiria, S., & Sousa, N. (2025). Determinants of Fare Evasion in Urban Bus Lines: Case Study of a Large Database Considering Spatial Components. Urban Science, 9(6), 231. https://doi.org/10.3390/urbansci9060231