1. Introduction
The quality of life in crowded cities is heavily influenced by indoor air quality (IAQ), an important yet often overlooked area of urban research. With cities growing larger and more people spending most of their time indoors, maintaining clean air in homes and workplaces is becoming critical. Breathing poor-quality air indoors has been linked to various health problems, including respiratory issues, cardiovascular diseases, and even challenges with mental clarity [
1]. The emergence of the COVID-19 pandemic introduced stringent requirements for indoor environmental quality, with a particular emphasis on mitigating airborne viral transmission risks in buildings. In response, recent research [
2] has proposed a targeted methodology for determining the optimal rate of outdoor air changes in HVAC systems for educational buildings. Moreover, indoor spaces can act as reservoirs for airborne pathogens, and mitigation strategies—particularly those involving enhanced ventilation—may substantially influence building energy consumption and operational efficiency. Recent studies [
3] on post-pandemic indoor air quality improvements in office buildings emphasize the importance of achieving a balance between infection risk reduction and energy performance. These risks underline the need for deeper research to uncover the causes and find meaningful solutions.
Indoor air quality is not just an environmental concern, it is deeply tied to urban science, which examines the complex interactions between buildings, human behavior, and nature. Historically, urban studies have mostly focused on outdoor factors like air pollution, transport systems, and parks. But there is increasing recognition that IAQ plays a vital role in the urban ecosystem. By bridging IAQ research with urban science, experts can craft more holistic strategies for sustainable city planning and public health. This multidisciplinary approach sheds light on how urban design, infrastructure, and everyday human activities together shape indoor environments. When we understand these links better, we can inspire policy changes that create healthier, more enjoyable living spaces.
The advancement of IAQ research has been greatly facilitated by the rise of open data initiatives. These initiatives provide researchers, policymakers, and local communities with essential tools to monitor trends, assess impacts, and implement data-driven solutions aimed at improving indoor air quality. By making datasets openly available and easily accessible, we not only encourage collaboration across disciplines but also empower communities to advocate for healthier indoor environments. A cornerstone of this effort is the collection and sharing of reliable open data. Freely accessible and reusable datasets have become indispensable in modern urban research, allowing for the study of IAQ alongside key factors like energy consumption, housing conditions, and public health metrics.
Open data platforms [
4] play a transformative role by integrating real-time sensor data, satellite imagery, and environmental monitoring from crowdsourced sources. These platforms create a comprehensive view of air quality patterns over time and across locations. Furthermore, they help ensure accountability in urban governance by enabling both researchers and the public to assess the effectiveness of policies and demand data-driven solutions to improve indoor environments. Open data are a critical pillar of urban science, driving transparency, collaboration, and decisions based on solid evidence.
As cities grow increasingly complex, open data provide researchers, policymakers, and planners with tools to track trends, identify challenges, and craft targeted solutions for urban improvement. These platforms unite diverse datasets—ranging from air quality monitoring and transportation patterns to housing data—offering a more integrated understanding of urban systems. By opening up these data to a wider audience, it sparks public involvement, fuels innovation, and fosters interdisciplinary research, which collectively paves the way for more sustainable, inclusive cities.
This study highlights how open data enable a deeper understanding of IAQ and its significance for urban life quality. It also examines how systematically publishing open data can support urban research, particularly by focusing on IAQ as a vital yet often overlooked factor. Challenges like data standardization, privacy concerns, and equitable access are addressed, with the proposed framework, Zenodo [
5], to amplify the positive societal impact of open data projects. Ultimately, this work emphasizes the game-changing potential of open data to reshape urban resilience, fairness, and sustainability in a rapidly urbanizing world.
The study presented in this paper has the following aims:
The study presented in this paper does NOT specifically aim to achieve the following:
Interpret indoor air quality data in private indoor spaces. The indoor air quality monitoring platform, AirQ, is used only as a source of experimental data in the archiving process. The platform architecture is presented as a starting point for data acquisition. The data archiving process presented in this article can also be used on other categories of measured data (electricity consumption, water consumption, biometric parameters, and monitoring the number of people);
Evaluate the effects of air quality on human health or make comparisons between current air quality standards and data recorded by the AirQ platform. These aspects are outside the scope of this paper;
Propose specific data cleaning methods for air quality parameters. The archiving, analysis, and cleaning methods presented in this paper are generic and necessary for any experimental data.
2. Related Works
Based on the information discussed, we analyzed some studies at the urban level for indoor air quality in private homes, studies based on open-data, and others with studies that aim to automatically provide data in open format in the context of urban science.
2.1. Studies at Urban Level for Indoor Air Quality in Private Homes
Many studies have delved into IAQ in urban homes all over the world, revealing the main drivers of residential air pollution and outlining its health implications. For example, research in Saudi Arabia has shown that factors such as ventilation performance, day-to-day household activities, and the influence of outdoor pollution can significantly shape the air quality indoors. In some cases, levels of particulate matter and volatile organic compounds have been found to exceed recommended limits [
6]. Similarly, work done in Hong Kong points to common indoor activities like cooking and smoking as key sources of pollutants; levels of PM
2.5 and nitrogen dioxide tend to vary based on how well households are ventilated [
7]. In Poland, studies comparing office and home environments have found that everyday practices—from cooking and heating to smoking—can lead to indoor pollution levels that even surpass those measured outside [
8].
A case study from Singapore illustrates that indoor aerosol levels in residential buildings are influenced not only by external pollution but also by cooking practices and the very materials used in construction. This finding underscores the complex relationship between a city’s built environment and its IAQ [
9]. Likewise, survey work in the Philippines has drawn attention to enduring air quality challenges in urban homes—especially in low-income areas—where crowded living conditions and poor ventilation lead to elevated amounts of particulate matter and volatile compounds [
10].
In densely populated urban centers like Kuala Lumpur, the indoor air quality in high-rise social housing is often compromised by insufficient ventilation and the infiltration of outdoor pollutants, raising serious health concerns for vulnerable residents [
11]. In Alexandria, Egypt, research has highlighted how economic disparities play a role in IAQ; lower-income households frequently have fewer resources to secure proper ventilation and filtering systems, resulting in higher levels of indoor pollutants [
12].
Research in Kenya further emphasizes the uneven burden of IAQ issues. In poorer urban neighborhoods, inadequate ventilation combined with reliance on indoor fuel combustion and exposure to external pollutants results in higher concentrations of indoor contaminants compared to their rural counterparts [
13]. Across Asia, seasonal shifts also play a role; during colder months, reduced ventilation and increased use of heating systems tend to worsen indoor pollution, potentially affecting respiratory health [
14].
The materials used in construction and the design of modern urban buildings have also been shown to impact IAQ, particularly in China. While contemporary airtight structures may enhance energy efficiency, they can also trap pollutants if not paired with effective ventilation strategies [
15].
Additional studies have highlighted regional IAQ differences. For instance, research in Mumbai’s urban slums has found a strong link between housing conditions, the type of fuel used for cooking, and indoor pollution levels that strongly suggests the need for policy interventions aimed at boosting ventilation and reducing pollutant exposure [
16]. A broader multi-city investigation in the United States further compared IAQ in green-certified low-income housing with traditional structures and discovered significantly lower pollutant levels in the former, reaffirming the benefits of sustainable building practices [
17].
As shown in
Table 1, these findings collectively indicate that IAQ in urban homes is shaped by a combination of building design, socio-economic conditions, and environmental factors. Addressing these challenges requires a multidisciplinary approach, integrating urban planning, public health policies, and technological advancements to ensure healthier indoor environments in densely populated cities.
2.2. Studies Based on Open Data
Over the past few years, many researchers have highlighted the transformative potential of open data across various fields. For example, Wright et al. demonstrate how integrating real-world open case studies into statistics and data science curricula not only deepens understanding but also connects academic theory with practical applications [
18]. Their work suggests that such initiatives can make learning more engaging and directly relevant to everyday challenges.
Hyland-Wood offers another perspective by examining the intricate relationship between public data and their users. She argues that open data are far more than a simple resource, by actively shaping user behavior and influencing public discourse, and serving as a catalyst for wider societal change [
19]. This perspective underscores that our interactions with data are dynamic and bidirectional.
In addition, Ali et al. provide a thorough exploration of the many open data platforms available today. Their review focuses on the prevailing technologies and functionalities that make robust data sharing possible, highlighting the necessity of a strong technological backbone to support accessible, interoperable, and secure data environments [
4]. Complementing this technological focus, Sinhababu et al. discuss practical solutions for building digital repositories. By leveraging open-source software like Invenio within a SaaS model (as seen in Zenodo), they illustrate innovative approaches for archiving and disseminating data in a scalable manner [
20].
Standardization also plays a key role. Kučera et al. emphasize that reliable and consistent data publication practices are essential. Their discussion of methodologies and best practices illustrates how standardized approaches can greatly enhance data usability and trustworthiness [
21].
Finally, Ayre and Craner remind us that the societal benefits of open data extend well beyond technical and educational realms. They stress that easy access to well-organized data not only fosters transparency and accountability in public institutions but also encourages civic involvement and sparks social innovation [
22].
Together, these studies reveal a multi-dimensional picture of open data. They show that while the technical foundations—such as platform design and standardization—are crucial, the real power of open data lies in their ability to bridge knowledge gaps, empower communities, and drive meaningful changes across society.
2.3. Studies That Aim to Automatically Provide Data in Open Format in Urban Science
Recent research in urban science shows that open data are becoming a game-changer for understanding and managing our cities. For example, Angelis et al. [
23] put together comprehensive air quality datasets from various European cities. Their work demonstrates how pooling accessible data helps highlight pollution trends and guides precise environmental actions.
Similarly, the SmartAirQ framework by Kaginalkar et al. [
24] illustrates how a big data governance model can be applied in smart cities. By incorporating real-time data from multiple sensors, this system provides crucial insights that help urban managers monitor air quality and devise strategies to safeguard public health.
Citizen science also plays a significant role in this field [
25]. Roman et al. [
26] explored various community-led projects aimed at tracking pollution levels. Their analysis reveals that when citizens contribute data, it not only democratizes environmental monitoring but also strengthens scientific efforts to address urban pollution challenges. In a related study, Fayomi and Onyari [
27] carried out on-site analyses that connect residents’ perceptions of pollution with measurable health outcomes, thereby linking everyday experiences with concrete environmental data.
The integration of advanced technologies further enhances these efforts. Kaginalkar et al. [
28] reviewed the potential of combining IoT, AI, and cloud solutions to revolutionize urban air quality management. Their findings suggest that these technologies can significantly improve traditional monitoring techniques. Meanwhile, Tsagkis et al. [
29] used artificial neural networks to study urban growth in five Greek cities. Their work underscores how machine learning, driven by open data, can effectively track and predict patterns of city expansion.
In addition, advances in data fusion are paving the way for even more comprehensive urban analysis. Liu et al. [
30] examined various algorithms that merge data from different sources, offering new tools for optimizing urban planning and real estate management. Complementing this, Fadhel et al. [
31] provided a systematic review of information fusion methods, highlighting how synthesizing diverse open data streams is critical for developing innovative solutions in smart cities.
The decision to structure the literature review around three specific domains—studies on indoor air quality in private urban homes, research based on open data, and studies aiming to automatically provide data in open formats—stems from their direct relevance to the overarching objective of this paper: contributing to the understanding and improvement of quality of life in inner urban environments through open data publication. Indoor air quality in private homes is a fundamental component of urban well-being, yet it remains insufficiently monitored and integrated into broader urban data systems. Open data research, on the other hand, offers the methodological foundation for ensuring the transparency, interoperability, and reusability of environmental data. Finally, the integration of automated data pipelines capable of publishing information in real-time and standardized formats addresses the practical challenges of scaling and sustaining such initiatives in the urban context. Together, these domains form the conceptual and technical basis upon which the current study builds its contribution to urban science.
Together, these studies paint a picture of open data as a vital resource in urban science. They reveal that when data are made widely accessible and integrated with modern analytical techniques, they pave the way for more sustainable, efficient, and resilient urban environments, empowering both policymakers and communities to drive meaningful change.
3. AirQ Platform Architecture
The AirQ platform is an IoT platform for indoor air quality monitoring hosted in the datacenter of the Faculty of Automatic Control and Computers, National University of Science and Technology Politehnica Bucharest. The platform is used to carry out several research projects related to studying air quality in private spaces within the perimeter of the city of Bucharest, Romania. The operation of this platform over a period of over three years led to the need for the study presented in this paper. The data from the experimental measurements performed with over 100 IoT sensors led to the accumulation of over 10 GB of data that could not be managed satisfactorily within the IoT platform. This study presents the original solution for the archiving and initial processing of data within the AirQ platform designed for the research activities carried out. The open publication of archived data on the Zenodo platform is part of a broader approach for the collaboration and support of scientific research in the fields of urban science, smart buildings, and smart cities. The presentation of the AirQ architecture is the first step in presenting the original solution proposed in this study.
The AirQ platform is based on the open-source ThingsBoard platform [
32] and hosts IoT sensors for indoor air quality monitoring, originating from studies conducted by PhD students and researchers from the Faculty of Automation and Computers. All sensors registered in the platform measure at least three environmental and indoor air quality parameters: ambient temperature and humidity and TVOC (total volatile organic compounds)—
Figure 1. All the sensors are located in the urban area of Bucharest and measure these parameters at a maximum interval of 5 min.
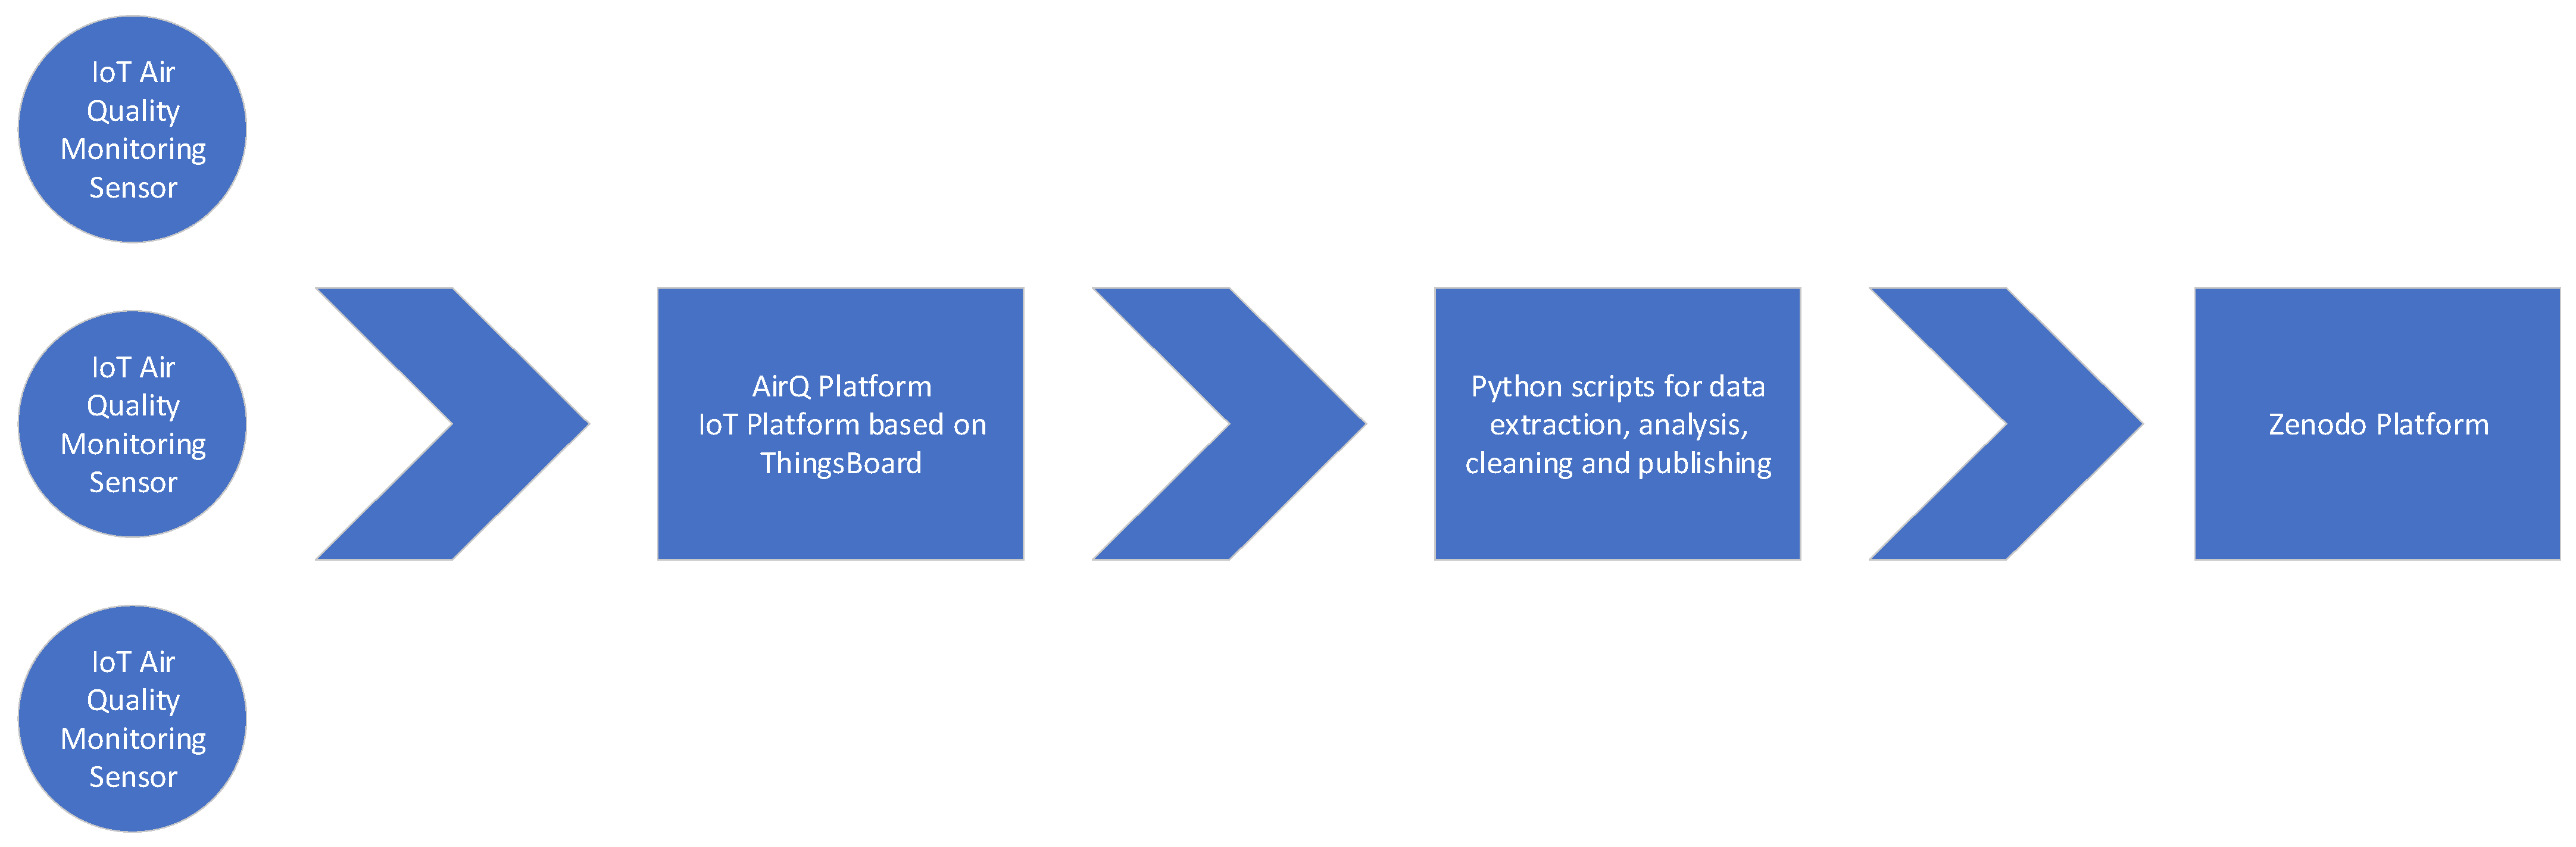
The data path within the automatic archiving solution proposed in the paper can be seen in
Figure 2. The data sent from the air quality sensors is recorded within the AirQ platform. Periodically, the stored data are extracted, analyzed, cleaned, and published on the open platform Zenodo.
The AirQ platform does not store information about the owners of the sensors managed by the platform. The data linking the name of the sensors in the platform and the owner are kept by the platform administrator outside the platform. In this way, the data and positioning of a sensor cannot be associated with a person. In the unlikely event that the AirQ platform is compromised from a security point of view, the privacy of the sensor owners does not suffer. The same anonymization considerations are also used in the open publication of data from the sensors in the platform.
The hardware architecture of IoT sensors is similar, containing a development board based on ESP8266 or ESP32 WiFi microprocessors (manufacturer: Espressif Systems, Shanghai, China), a temperature and humidity sensor, and a TVOC sensor. All sensors registered on the AirQ platform use digital sensors that are initially calibrated at the factory by the manufacturer. Users are advised to use the sensors for a maximum of 3–5 years in accordance with the manufacturer’s lifetime specifications. In the case of MOX TVOC sensors, temperature and humidity compensation is performed and the internal periodic recalibration functionality is used. All these elements lead to a decrease in measurement uncertainty in the case of measurements made by IoT sensors within the AirQ platform.
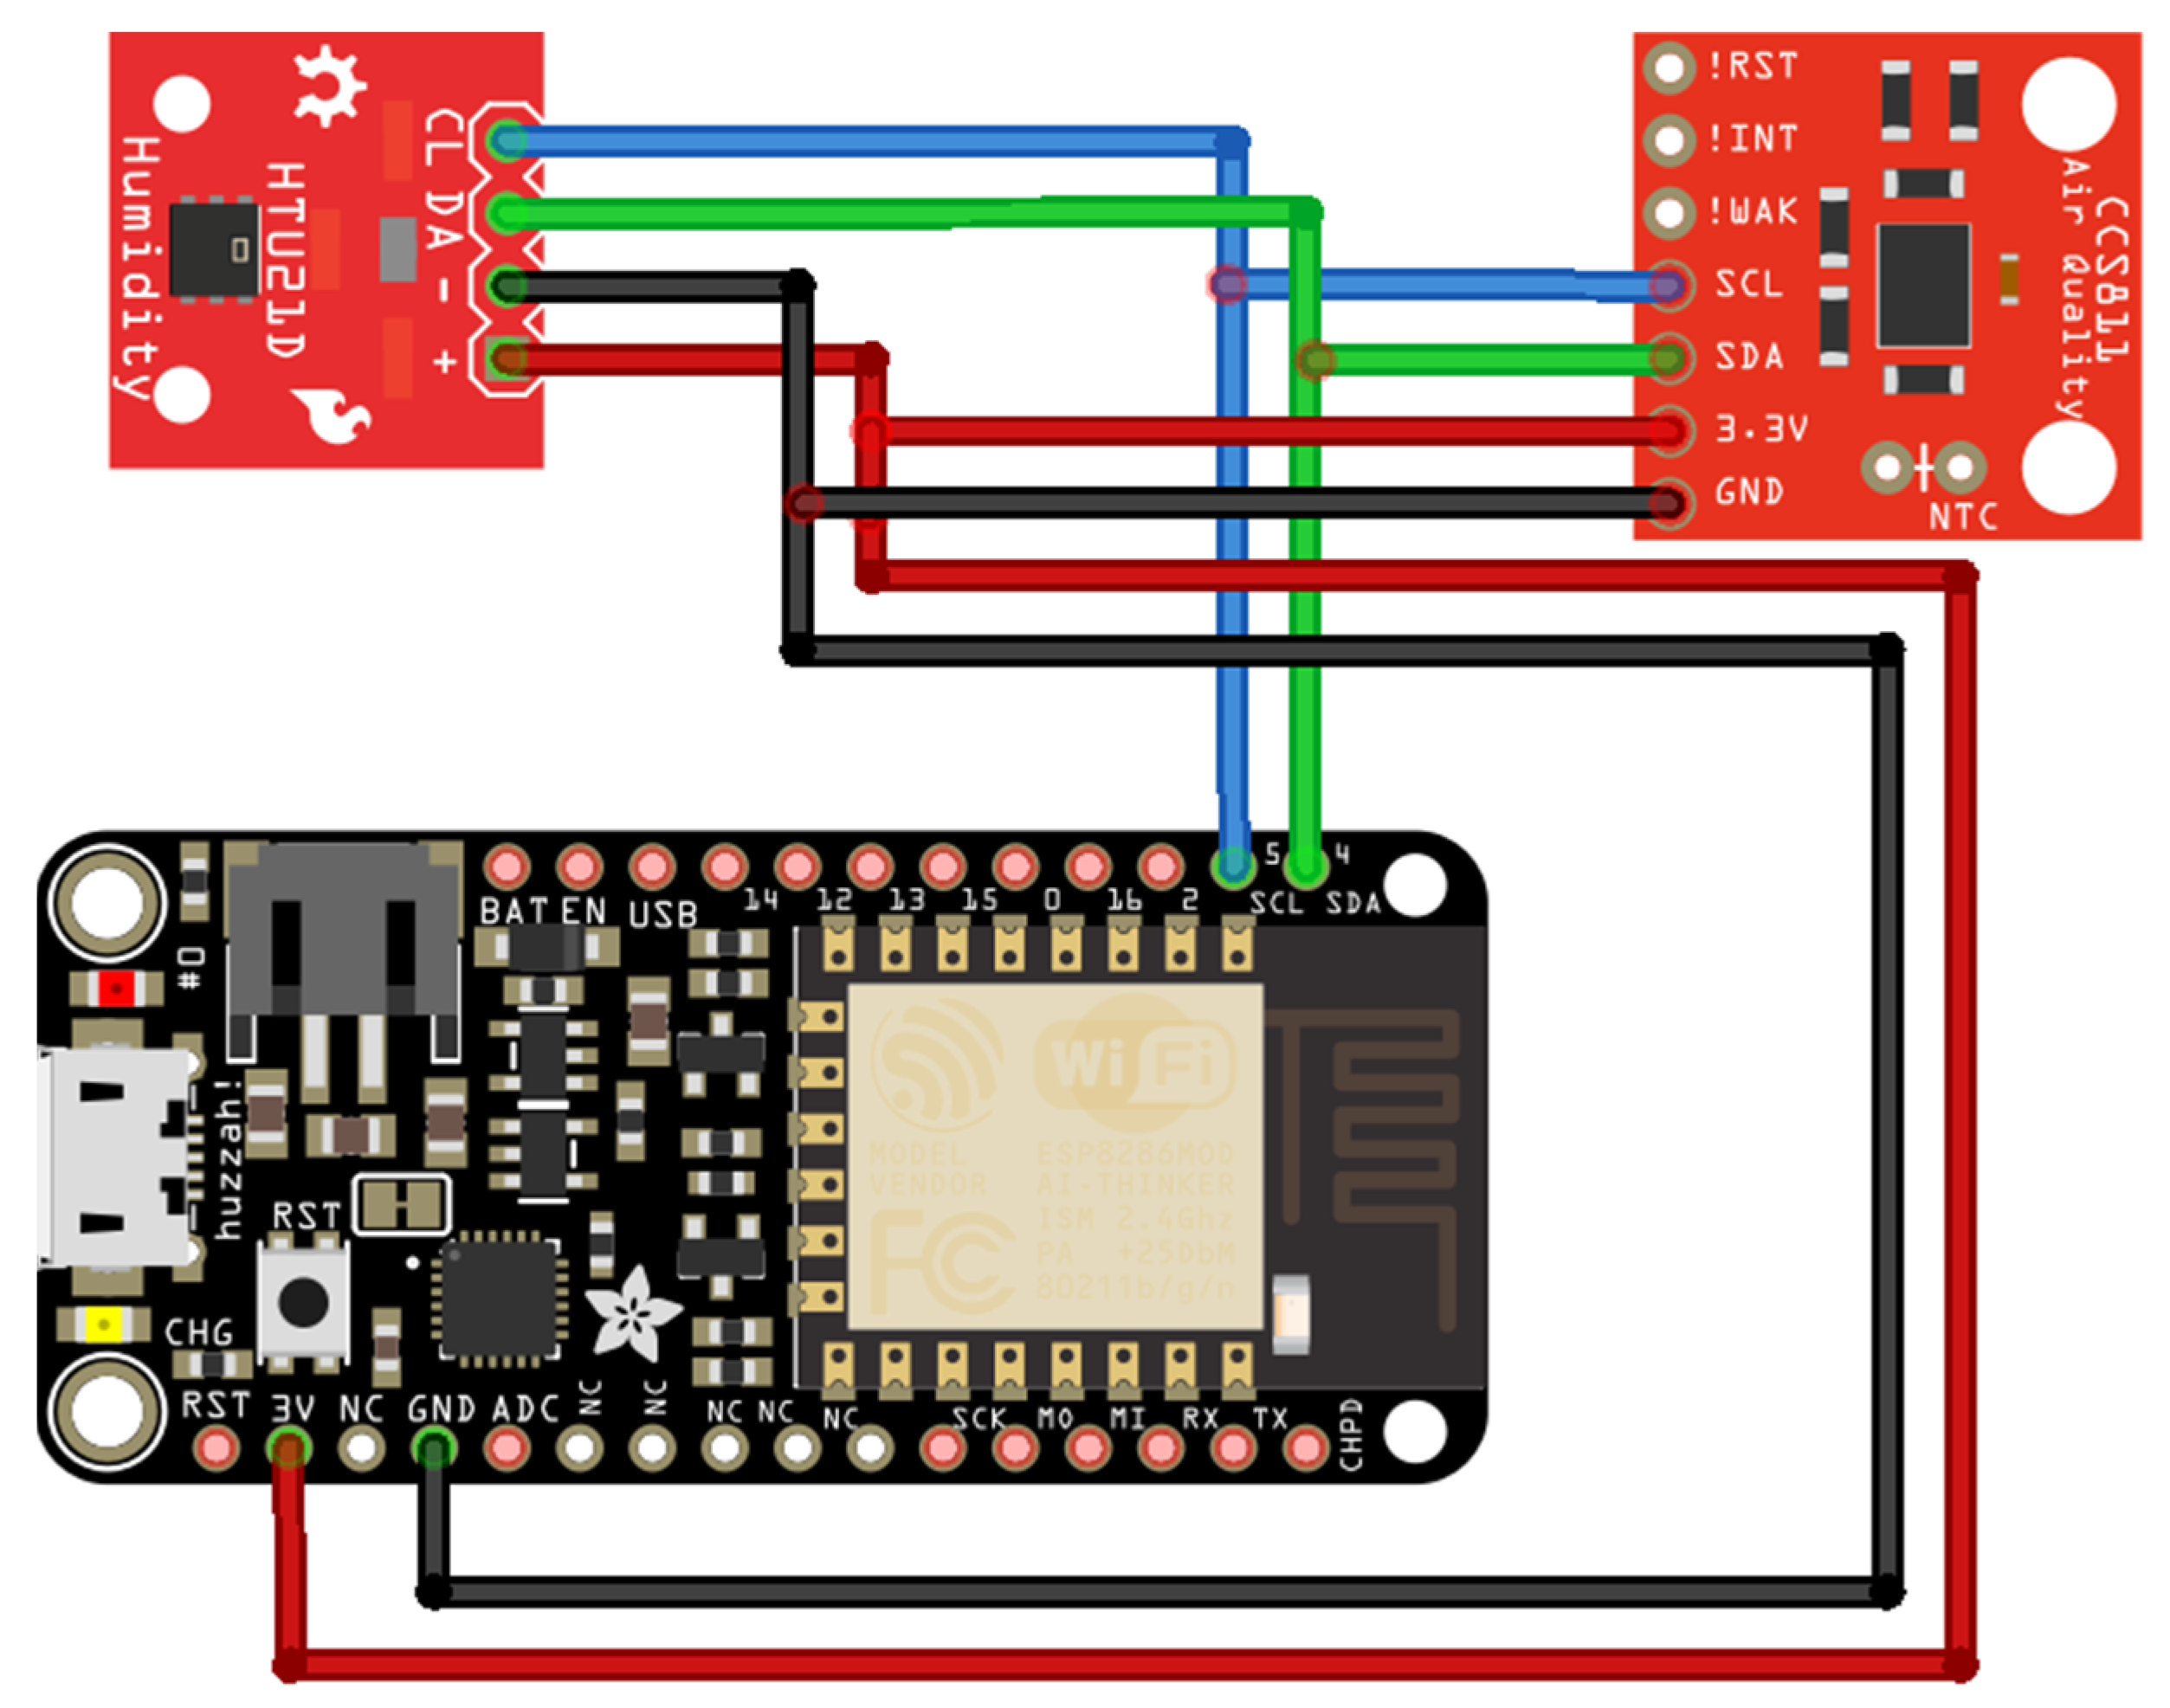
Figure 3 shows the electronic diagram of an IoT sensor (Device_RP) connected to the AirQ platform. The IoT sensor contains an Adafruit Feather HUZZAH ESP8266 development board, an HTU21D digital temperature and humidity sensor, and a CCS811 digital TVOC sensor. Communication between the sensors and the development board is achieved via the I2C (Inter-Integrated Circuit) protocol. The development board has WiFi communication capabilities and can be easily integrated into the local network of any private home. The IoT sensor is powered by the electrical network via a 5 V, 1 A adapter (mobile charger). All sensors designed, built, and used within the AirQ platform respect two important characteristics: the total cost of the components must be under 50 euros, and the system must be easy to install in any home location.
Communication between IoT sensors and the AirQ platform is achieved through the MQTT (message queue telemetry transport) protocol, a protocol specific to IoT devices. Device authorization within the AirQ platform is based on the registration and allocation of a unique 20-byte access token for each device.
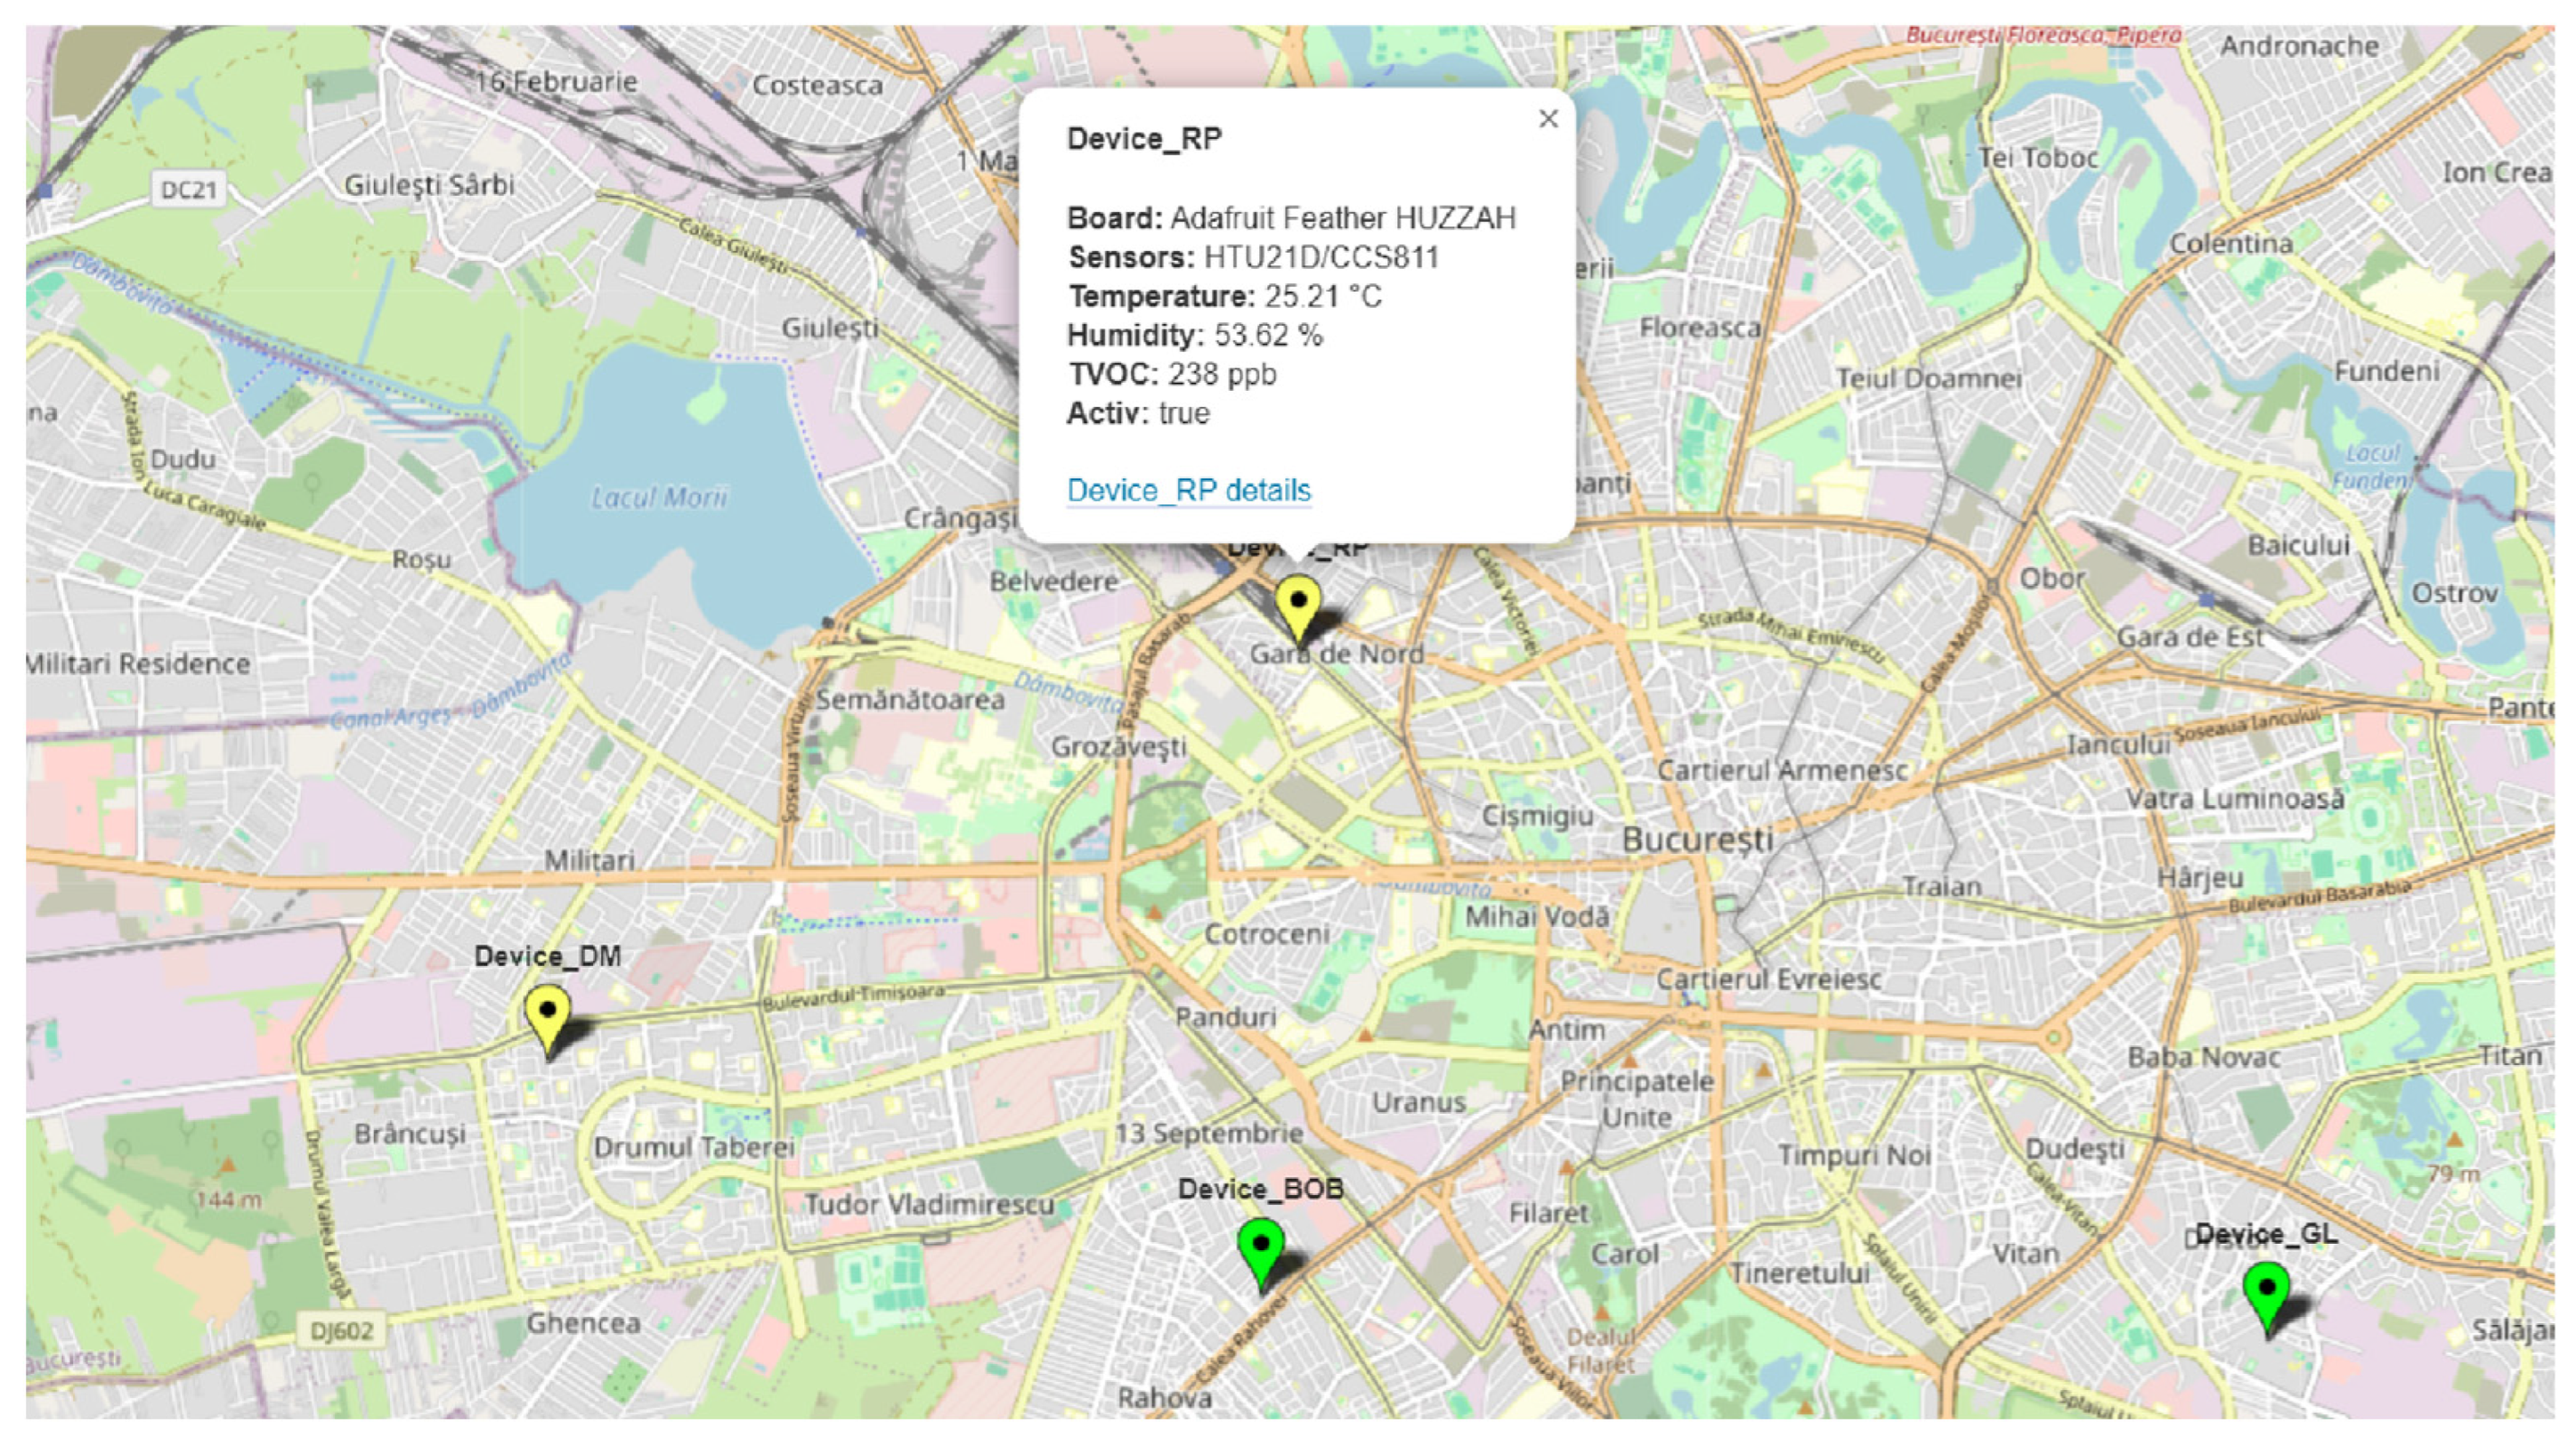
The AirQ platform is based on the open-source version ThingsBoard Community Edition 3.8.1. The platform functionality includes IoT device management, saving data received from IoT devices in a PostgreSQL v12.17 database, and processing and displaying recorded data. The display of recorded data is done through two main dashboards. The first dashboard, AirQ Map, presents all IoT devices on a map of Bucharest (all devices are currently operating in homes in Bucharest)—
Figure 4. The device map is used to easily find a device by geographical positioning and to quickly inspect the air quality status for various devices (the color of the pin on the map quickly indicates the indoor air quality, green—very good quality, yellow—good quality, orange—average quality, red—poor quality, purple—very poor quality, and the white color indicates that the device is not online). Owners of IoT devices can choose whether their device is public (visible on the map to anyone and the data are publicly accessible) or private (visible only to the owner and the data can only be accessed by them).
For any device available on the map, additional details can be checked by clicking on the device—
Figure 1—and the history of the parameters can be checked by selecting the device details option—
Figure 5.
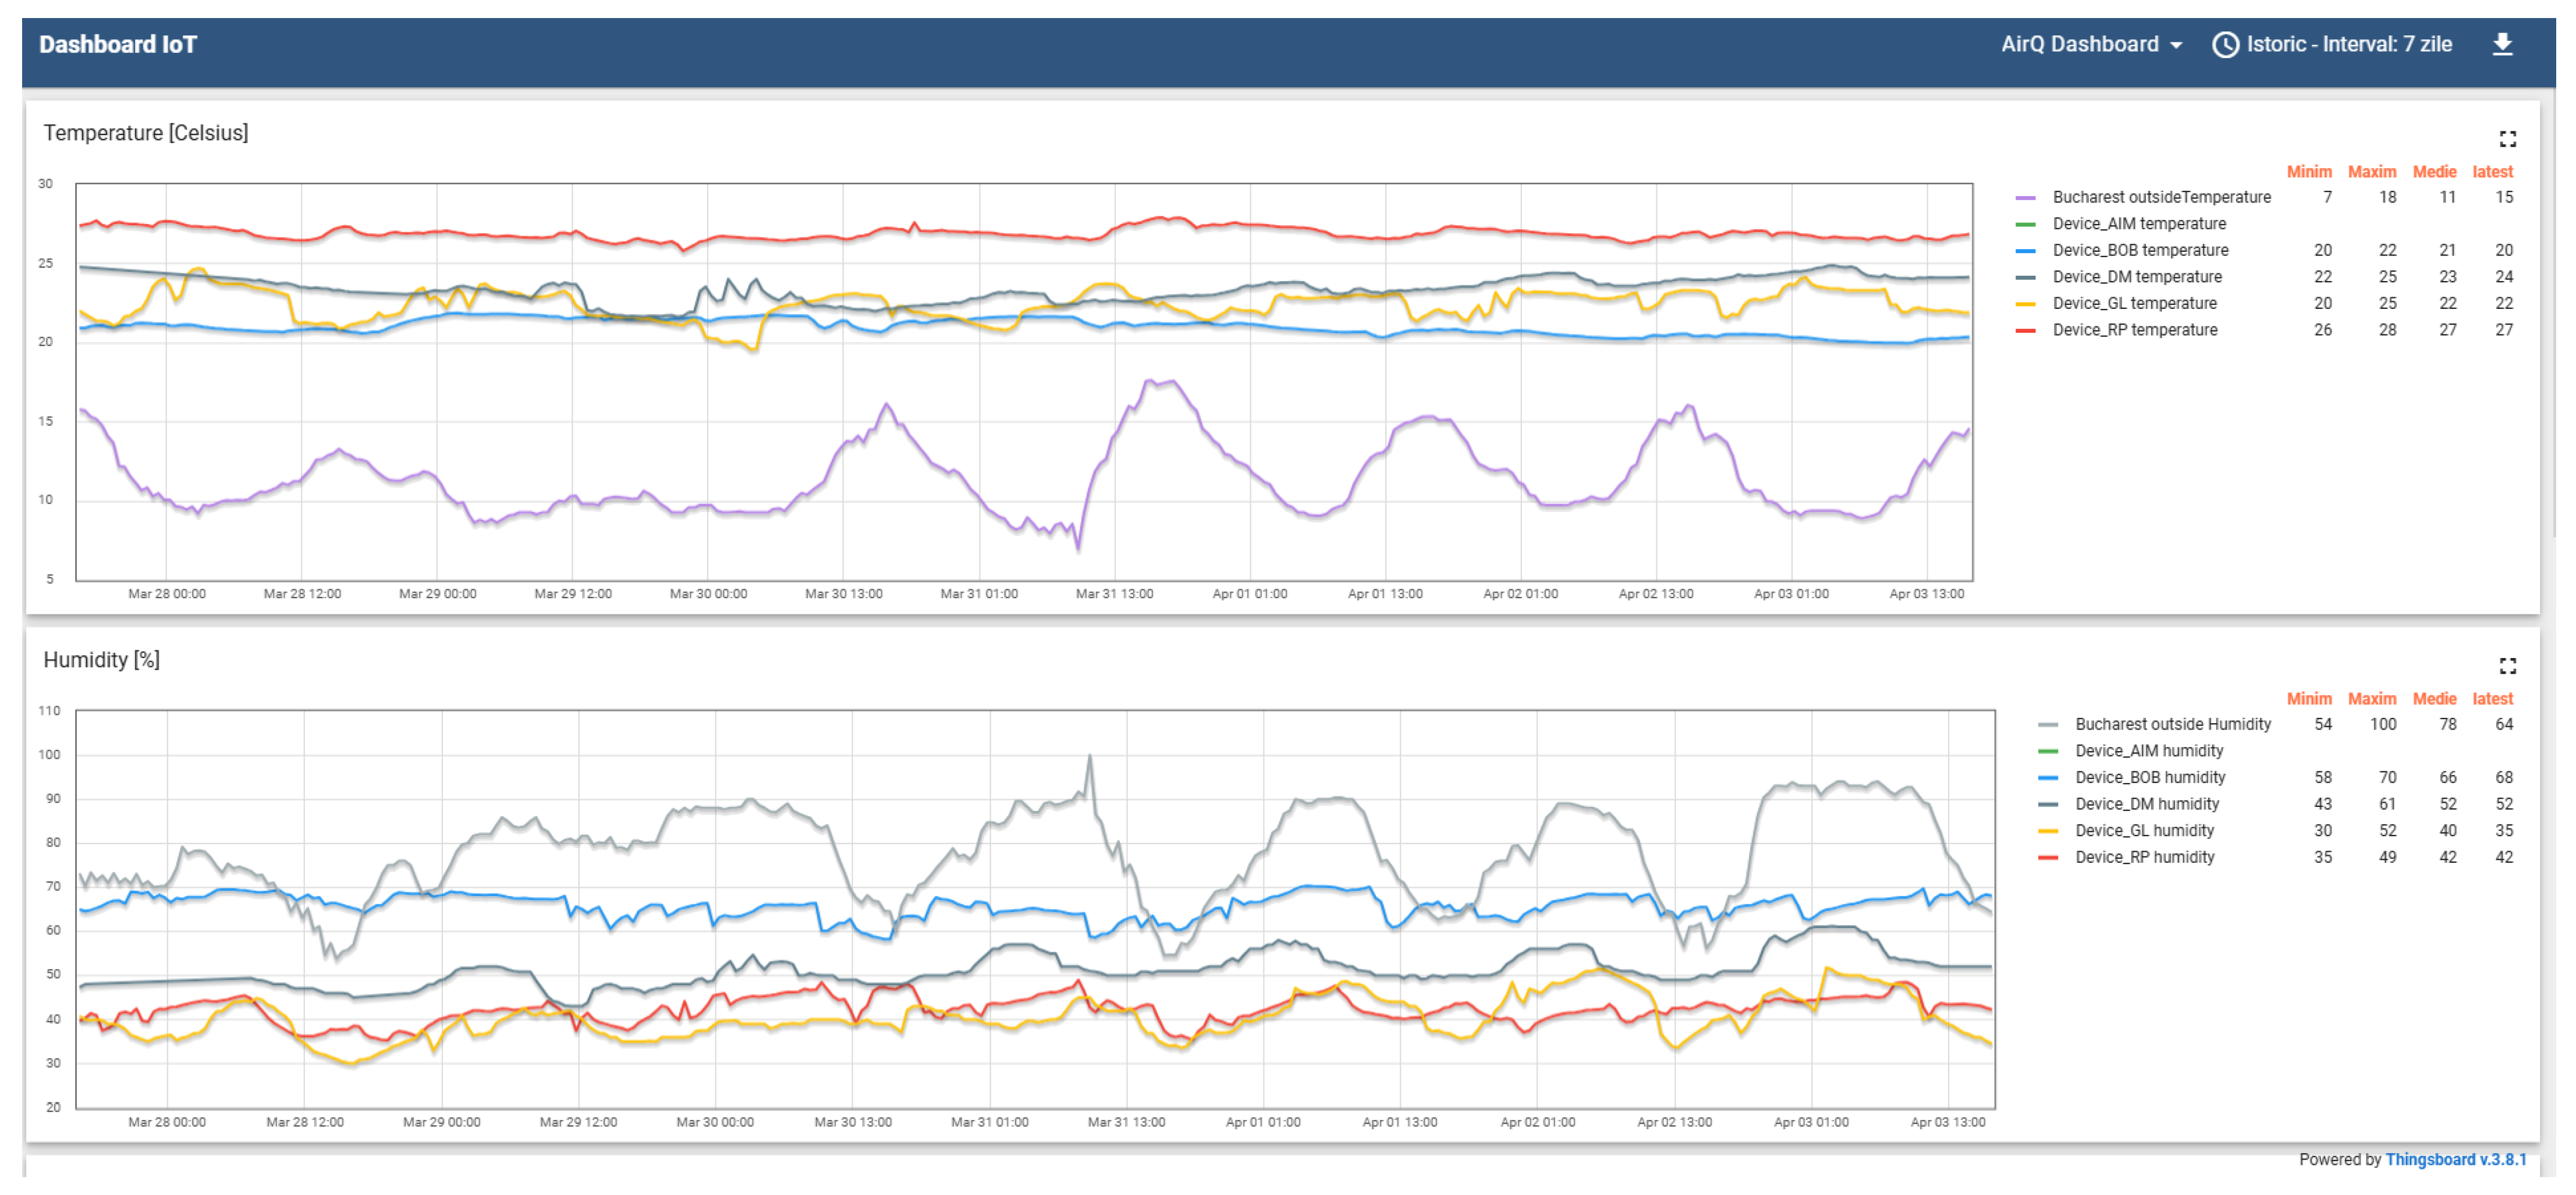
The second dashboard of the AirQ platform similarly presents the evolution of the parameters measured by the sensors recorded in a comparative manner—
Figure 6. This dashboard allows for visual comparative analysis between the data measured by the IoT sensors and the evaluation in order to identify environmental anomalies.
In the more than three years of operation, the AirQ platform has allowed users to become aware of the evolution of indoor air quality in their own homes and to identify habits and events that lead to air quality degradation and ways in which they can be avoided. In other words, the platform has helped users improve the air quality in their own homes and many users have voluntarily chosen to use the system in the long term to be able to monitor the maintenance of air quality within good parameters.
As part of scientific research activities, the AirQ platform has allowed the completion of several studies whose results have been published in specialized scientific papers. In the paper [
33], the danger of a decrease in indoor air quality in private homes during the winter due to the increase in energy costs was analyzed. The solution for low-cost installation and operation of an extensive network of IoT sensors for indoor air quality monitoring was presented in paper [
34], and the possibilities for correcting data recording anomalies for large series of values were presented in paper [
35].
The scientific research potential of the data currently recorded in the AirQ application is quite large and the variety of studies that can be carried out based on these data exceeds the capabilities of the research team involved in the development and maintenance of the platform. This is the reason why the decision was made to create an automatic mechanism that would allow the export of data in an open format that would be accessible to any researcher interested in these data. The description of the mechanism is presented in the following sections.
4. Data Archiving Methodology
4.1. ThingsBoard API Description
Within ThingsBoard architecture, the API (application programming interface) provides a clear set of rules and protocols that enable efficient communication between the platform and various IoT devices. This programming interface defines standardized methods for entity management, data processing, and alarm administration. In accordance with REST (representational state transfer) architectural principles [
36], the implementation of this interface provides specific endpoints for CRUD operations (create, read, update, and delete) on each entity type. For ensuring interoperability, the ThingsBoard platform uses the JSON format for data exchange, and for authentication it employs standard mechanisms based on JWT (JSON Web Token), which facilitates simple and efficient integration in most modern programming environments.
The ThingsBoard platform presents limitations regarding long-term data storage capabilities, as it is designed for efficient real-time visualization and monitoring of telemetric data. This architectural constraint necessitated the identification of a complementary solution for systematic archiving, as well as controlled deletion of records from the AirQ platform. This implementation was conceived not only as a solution for efficient data collection, but also as a tool for providing records for scientific analysis and further research.
4.2. Architecture of the Archiving and Deletion Mechanism
The architecture of the archiving mechanism is based on implementing a client–server architecture with the purpose of extracting, processing, and ensuring the persistence of telemetric data from the AirQ platform, for monitoring and visualizing data from devices belonging to volunteers involved in the process of recording indoor air quality measurements. The identified solution is based on REST services for interaction with the ThingsBoard API and follows a processing flow in distinct stages.
The architecture for downloading data is built on an asynchronous communication model, in which the client initiates a session with the ThingsBoard server through authentication with the credentials of a registered account, to obtain a JWT, which it then uses to initiate a series of HTTP (hypertext transfer protocol) requests aimed at obtaining the device metadata, associated through an identification key, as well as the time series of telemetry over the entire specified time period.
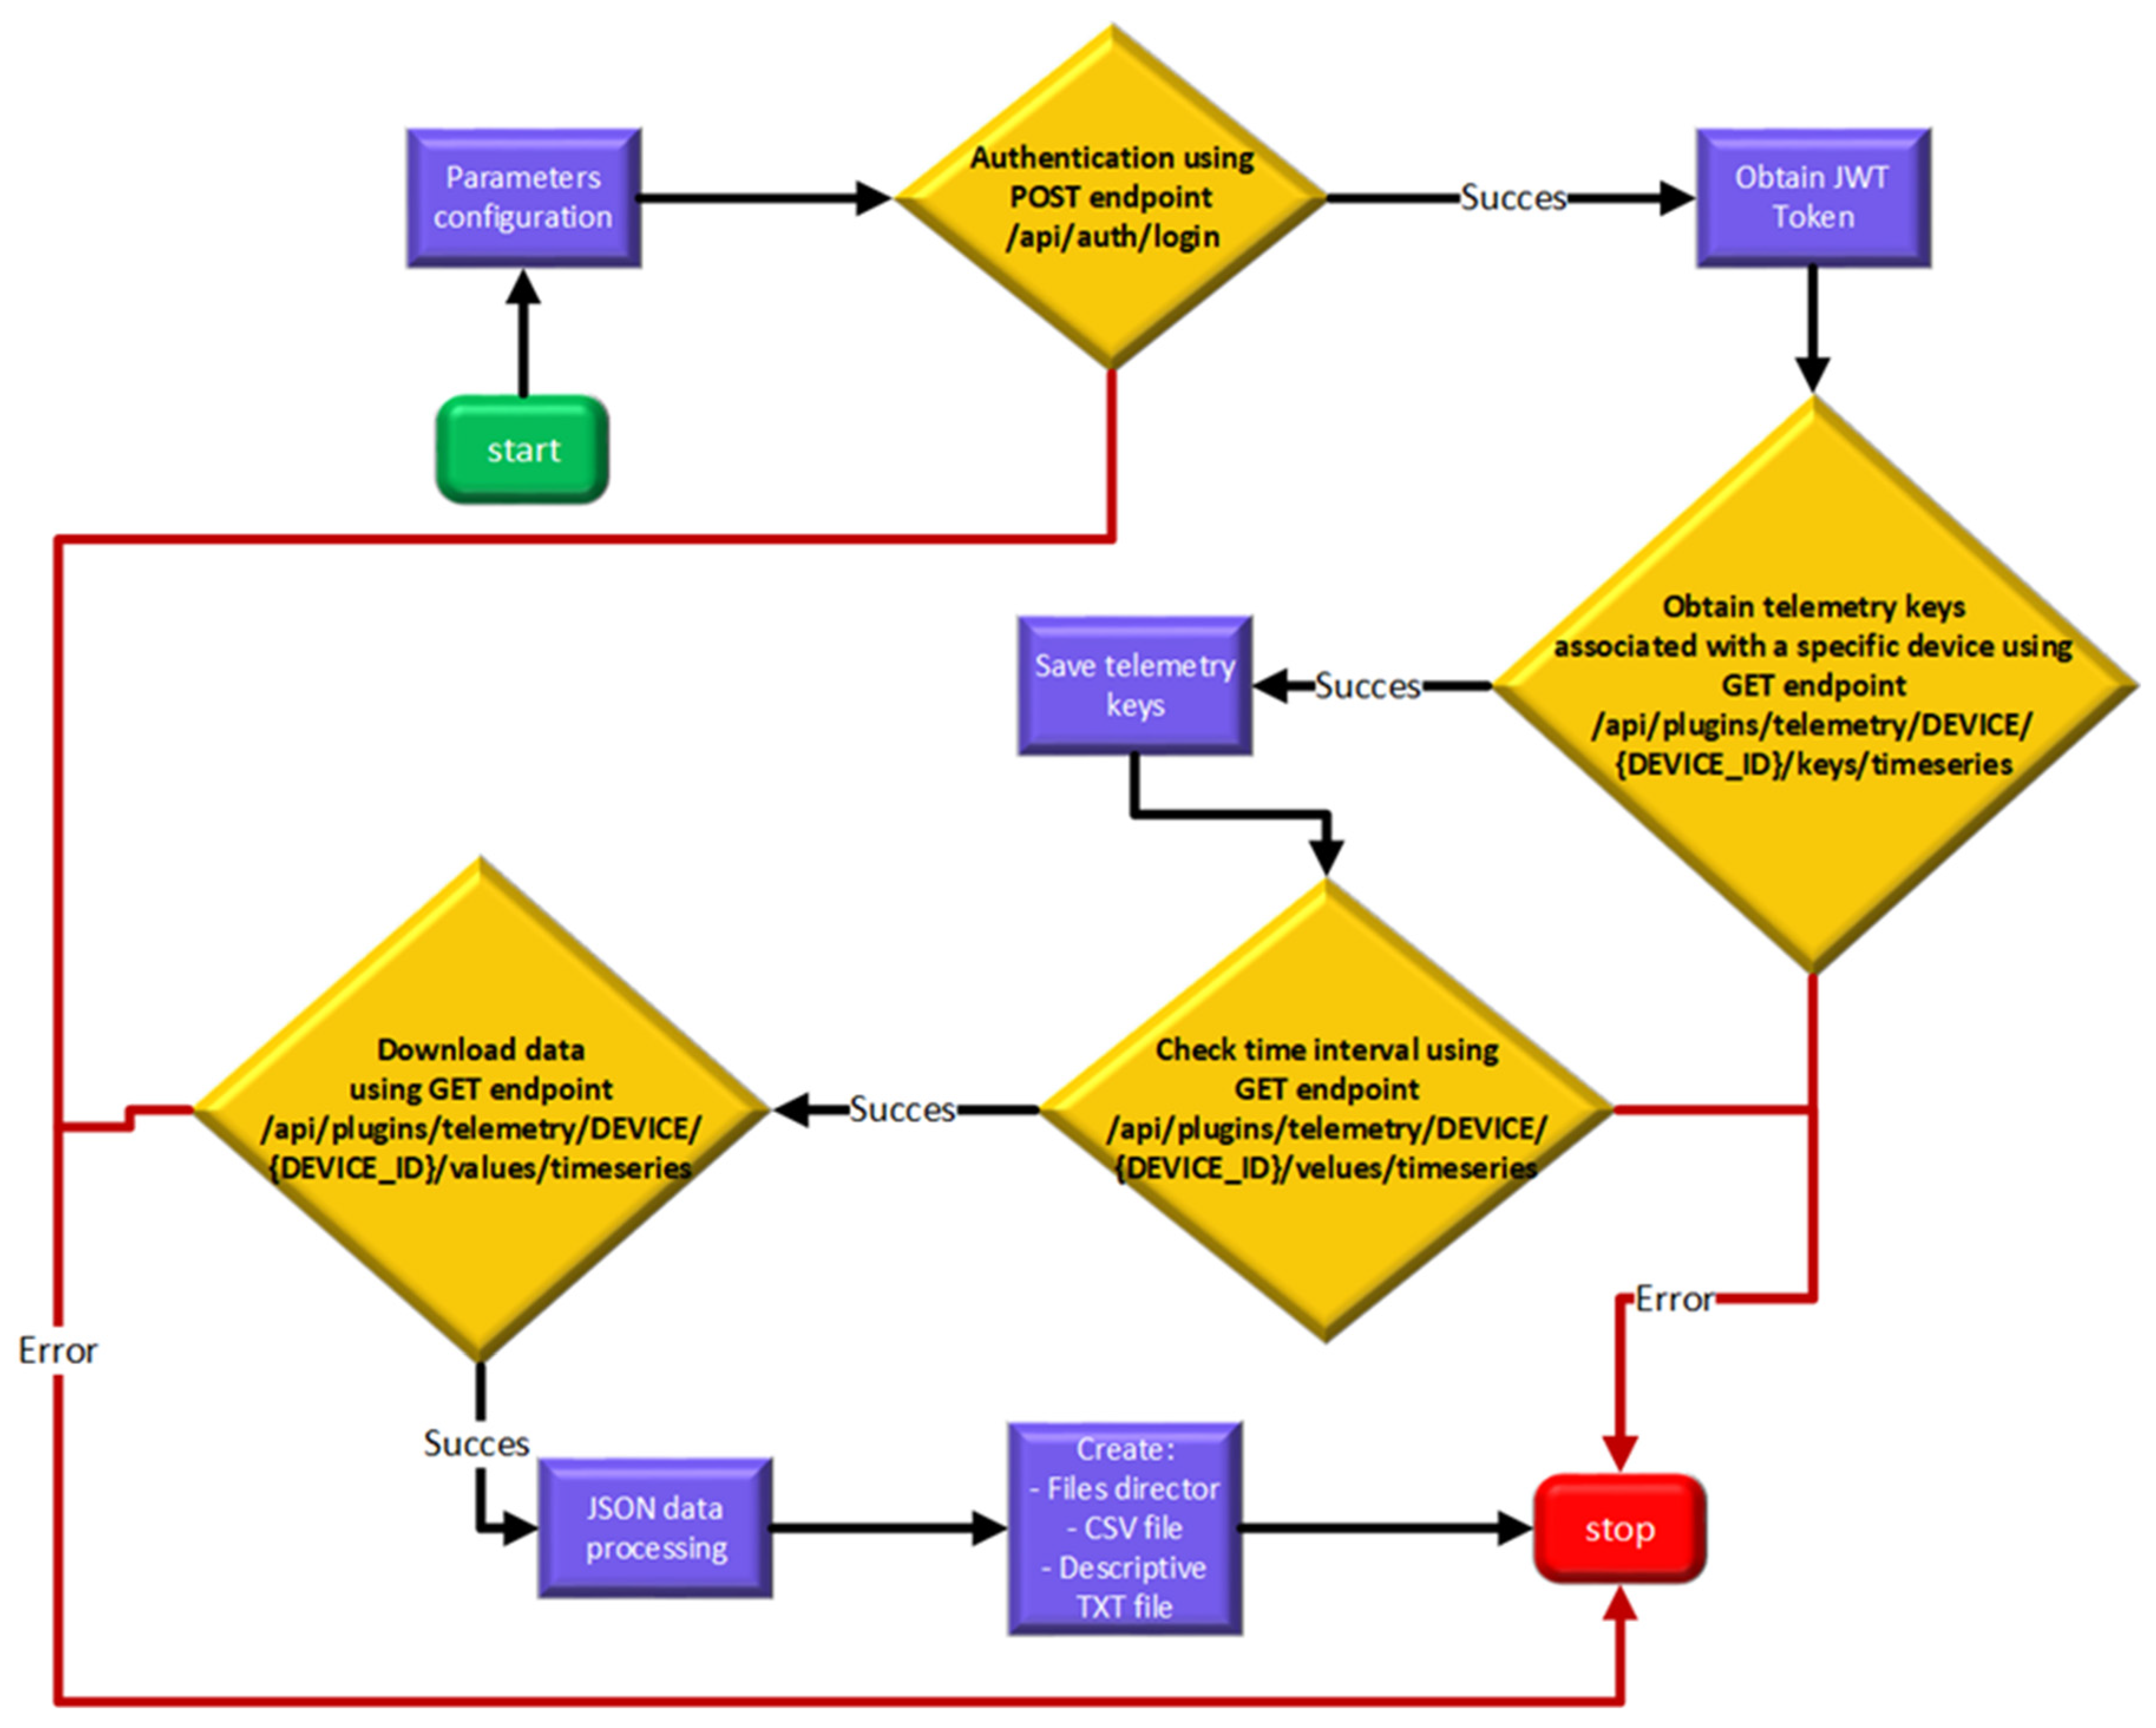
The download-archiving mechanism (
Figure 7) is based on a well-defined modular functional structure for extracting and persisting telemetry data from the ThingsBoard infrastructure. The process begins with an authentication management module for the ThingsBoard server, which uses the configured credentials to obtain access to JWT, necessary for subsequent operations. Authentication is initiated through an HTTP POST request to the /api/auth/login endpoint, which, if validated with a status 200 response, then begins the process of automatic identification of the target device, extracting all available telemetry keys, through a new query to another endpoint, /api/plugins/telemetry/DEVICE/{DEVICE_ID}/keys/timeseries. The records associated with these keys are then checked to test if they fall within the specified time interval, adjusting the query parameters according to the identified time limits. The process of extracting time series is performed through a parameterized HTTP GET request to the telemetry endpoint, considering the efficient management of large volumes of data. The response given by the server is in JSON format, which means that the data require a normalization process to transform the data from the API responses into standardized time series, by applying chronological sorting and indexing algorithms. In the final stage, the system implements a transactional mechanism to ensure data persistence and integrity, saving records in CSV format, creating directories corresponding to the device, and generating descriptive TXT files. This approach ensures, in addition to structured management of time series, the facilitation of subsequent analyses, by providing a solid, descriptive foundation necessary for the appropriate use of the data.
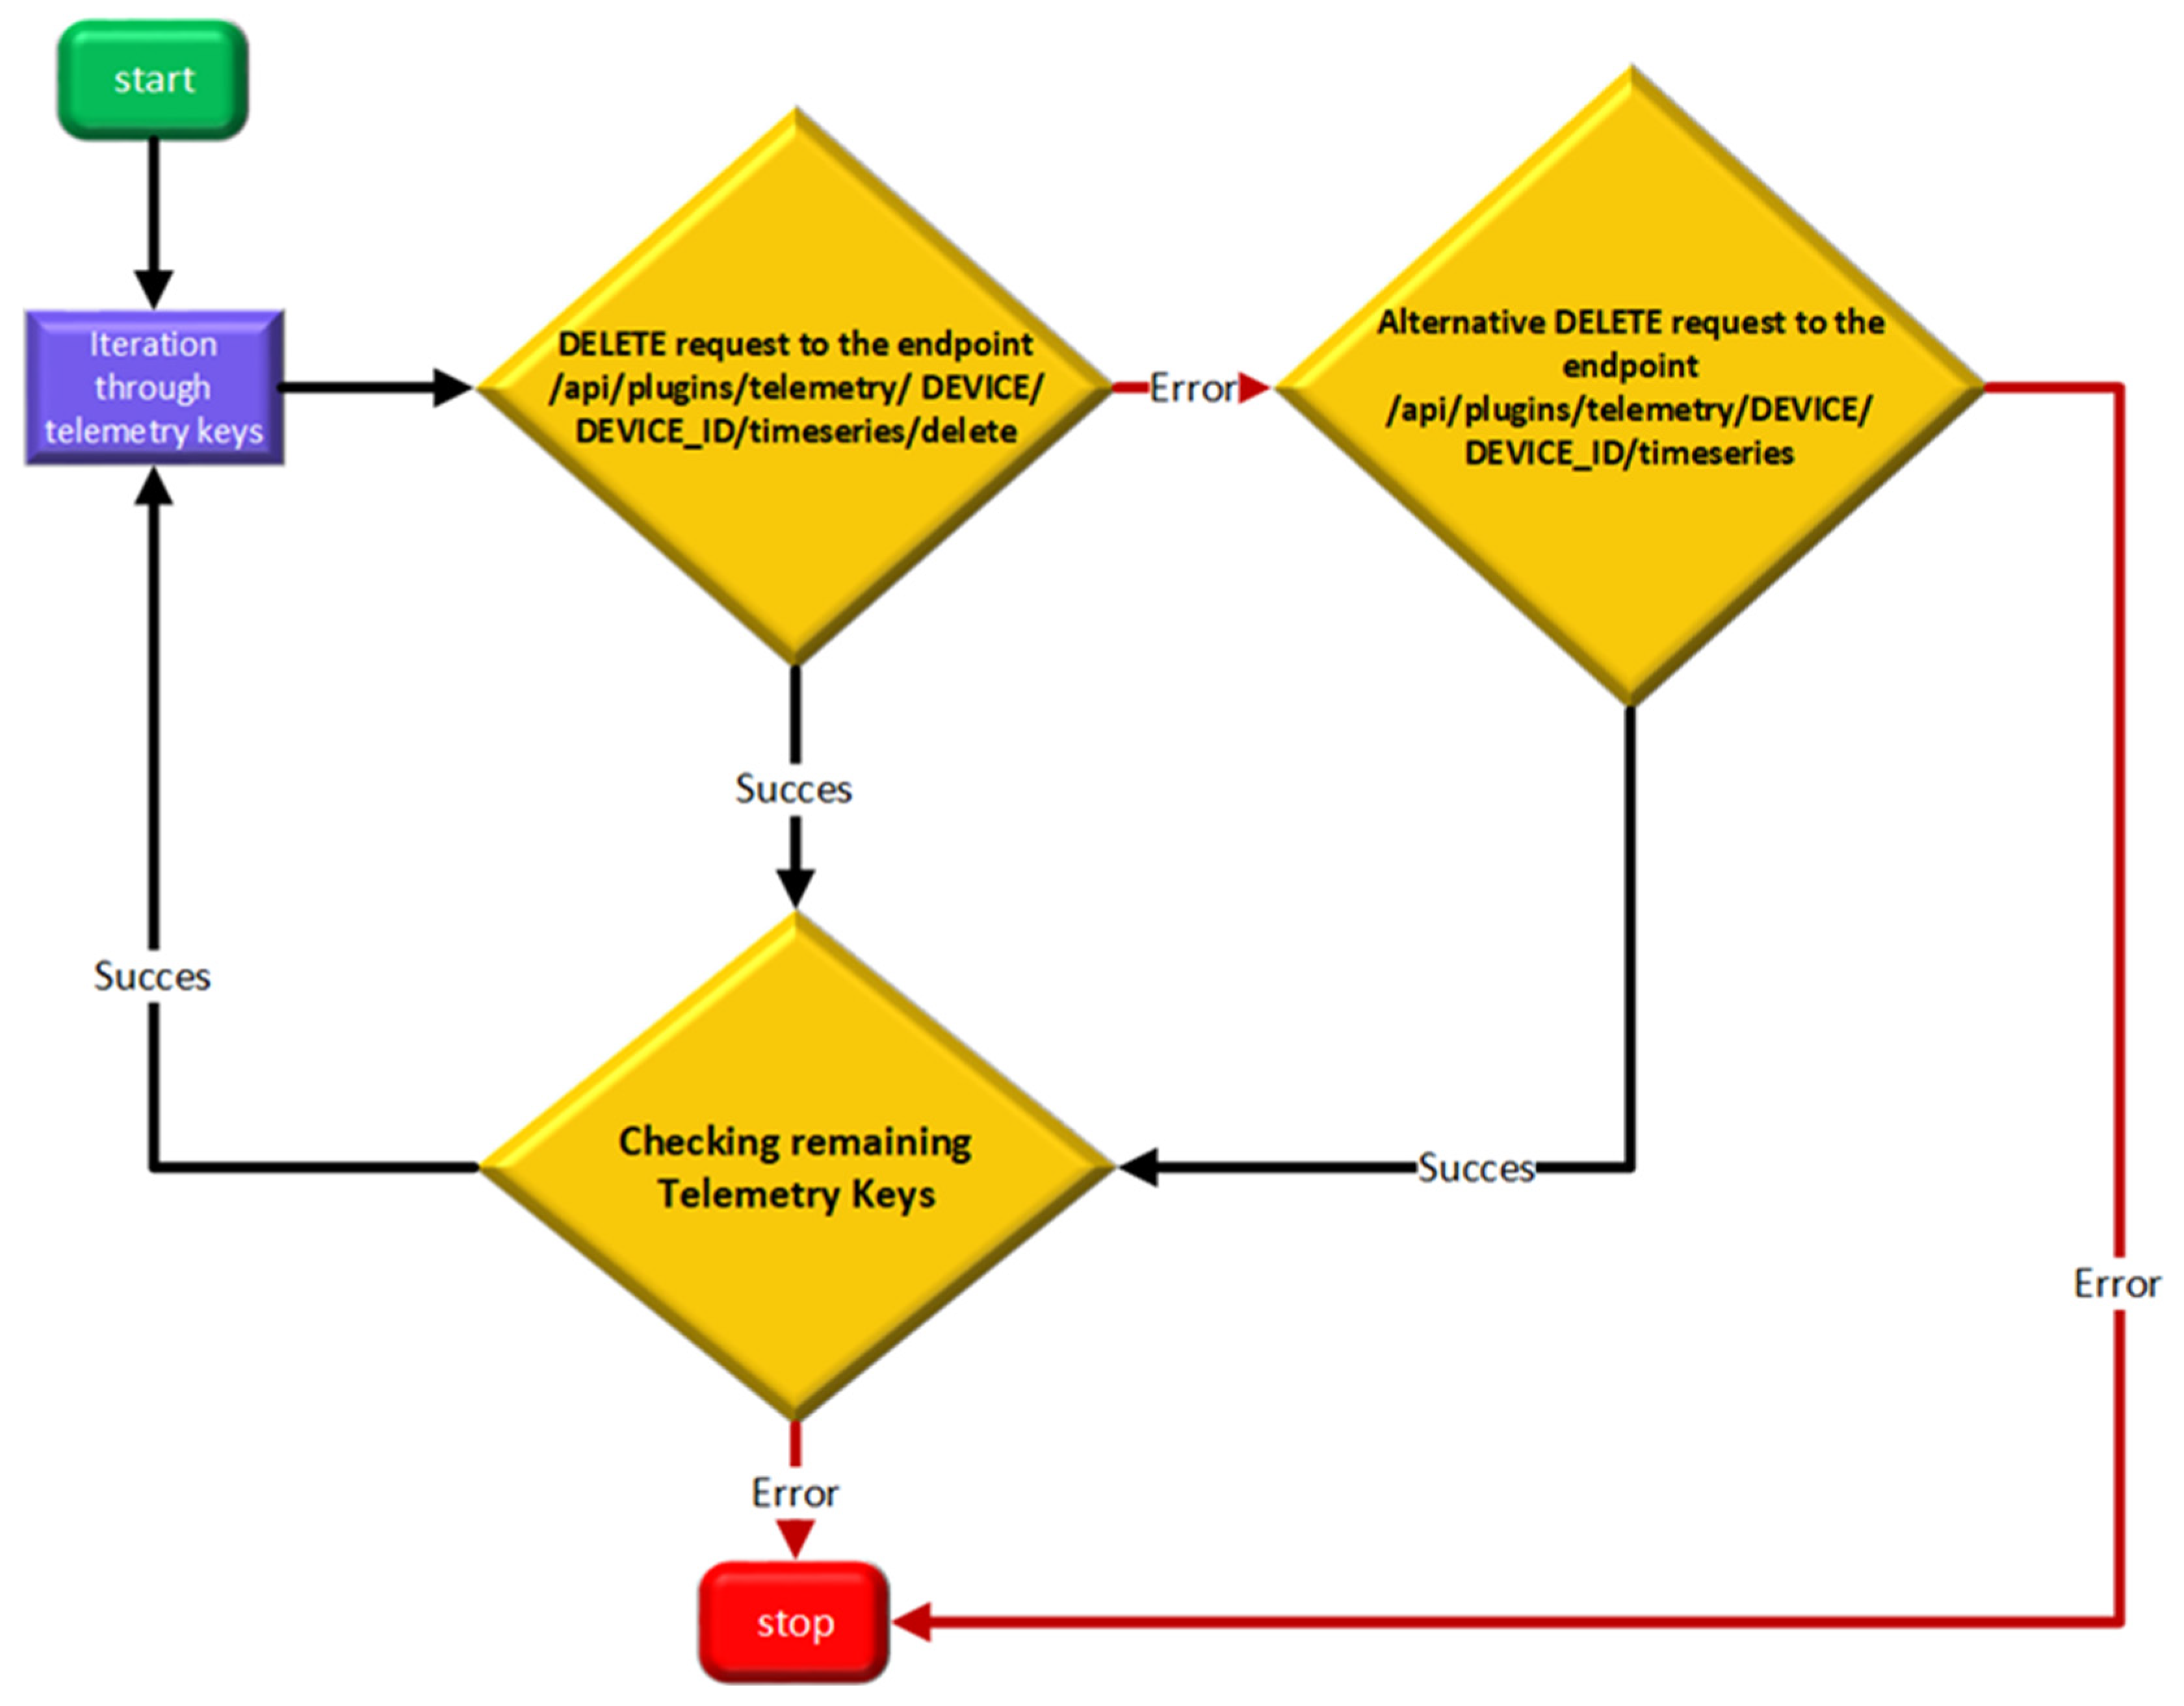
The deletion mechanism (
Figure 8) is based on using a REST API that sends an HTTP DELETE request to the server, using the appropriate headers for authentication. The removal of records associated with a device uses as the main endpoint, /api/plugins/telemetry/DEVICE/{DEVICE_ID}/timeseries/delete, which ensures the deletion of data associated with each telemetry key identified in the list resulting from the download mechanism, over the entire time interval associated with the timestamp defined for the beginning and end of the interval. In the case of the failure of the main request, the process attempts to delete the data using an alternative endpoint that also initiates a DELETE request, but using a different API structure, continuing to process each telemetry key from the list individually. The entire process is well monitored through an ‘ok’ flag that indicates the global status of the operation, which ends with the display of a confirmation or error message depending on the result of the deletion mechanism. This stage of the data collection–processing procedure is possible only after successfully downloading the data from the server, to reduce the risk of unintentional elimination of unsaved data, a situation that would lead to the loss of records with favorable potential for analysis.
4.3. Archiving Format
In addition to establishing the connection to the Thingsboard server and successfully processing HTTP requests, the data download architecture also includes an essential file formatting component. This stage ensures the proper structuring and presentation of data for subsequent analysis.
For the hierarchical organization of data, logically organized directories were created by categories, based on the name of the device from which the data are collected. The implementation of this stage included checking the existence of directories, thus reducing the risk of overwriting errors.
The data download was performed using ThingsBoard’s RESTful API, utilizing a predefined configuration of desired time intervals, as well as the exact definition of telemetry keys. To ensure temporal precision, timestamps in milliseconds are used for API queries, according to the ThingsBoard standard [
32]. Using the formatted timestamp, data processing follows a very well-structured methodical flow:
Grouping of records is performed, resulting in a uniform structure for all telemetric values;
Standardization of columns in the DataFrame is ensured, adding missing columns that were not part of the priority-defined columns, to ensure data consistency;
Columns are ordered using fundamental parameters: temperature, humidity, TVOC, and eCO2;
Data are chronologically sorted by the DateTime field.
Upon the successful completion of all the stages described above, the result is saved in a file with a standardized name: {device_name}_{start_date}to{end_date}.csv, which can be found in the directory, associated with the device name. This systematic approach ensures data integrity and accessibility.
To facilitate the easy interpretation of data from CSV files, a descriptive file has been implemented that provides useful information about the records from devices. The descriptive file is automatically generated and has the same base name as the CSV file, but with the suffix “_info.txt”. In the content of this file, comprehensive metadata about the dataset can be identified such as the following:
Device name;
GPS coordinates (latitude and longitude) are useful because the data reflect air quality in a specific urban area;
Sensors used (important for evaluating measurement accuracy);
Time interval of data acquisition;
Total number of records;
Detailed description of available columns, including data type;
Date and time when the file was generated.
As emphasized from the beginning, the issue of indoor air quality is currently relevant on a global scale, regardless of geographical area. In this context, just as there are numerous studies on the importance of monitoring indoor air quality, there are also numerous publicly available datasets containing values from measurements taken using various sensors. To contextualize the relevance of the collected dataset, using data from the AirQ platform, several similar datasets can be identified, published as open resources for research.
For example, the dataset [
37] includes recordings collected throughout year 2023 in an area of Germany and contains parameters measured indoors, such as temperature, humidity, TVOC, eCO
2, or even atmospheric pressure and suspended particles PM
2.5. Another relevant example is the dataset titled “IoT- Indoor Air Quality Dataset” [
38], which contains measurements taken by IoT sensors that monitor similar parameters (TVOC and eCO
2) in various contexts. Additionally, datasets focusing on the same field, but contextualized in a specific area were identified, such as the “Kitchen Environment Air Quality” dataset [
39], which captures aspects of air quality in a kitchen, in an indoor setting exposed to local pollution sources, such as cooking, over the course of a day. This comparison contributes to the validation and framing of the obtained dataset, presenting its relevance in an international context, highlighting the fact that the recorded parameters are similar to those monitored in other open research initiatives.
5. Processing and Analysis of Archived Data
5.1. Identified Problems in the Archived Data
Following the data download process, several anomalies were identified in the records that could compromise the effectiveness of machine learning models. For any type of ML algorithm, data should be relevant to the applicable domain and should not contain inconsistencies, but values collected from the real world, originating from sensors, do not satisfy the standardized criteria for direct use in the analysis process. The data preprocessing stage is essential precisely because it can modify the dataset in such a way that it meets the requirements imposed by each algorithm; without this stage, the data would not be feasible to apply in a machine learning or analysis process.
Among the identified problems are the following:
Table 3.
Values collected from Device_BPS.
Table 3.
Values collected from Device_BPS.
| DateTime | Temperature | Humidity | TVOC | eCO2 |
|---|
| 19 December 2024 14:42:29 | 28.76 | 42.05 | 4 | 406 |
| 19 December 2024 14:42:29 | 28.76 | 42.05 | 4 | 406 |
| 19 December 2024 14:43:00 | 28.77 | 41.89 | 4 | 413 |
| 19 December 2024 14:43:00 | 28.77 | 41.89 | 4 | 413 |
Telemetry keys with different names that represent the same thing (CO
2, instead of eCO
2)—
Table 4;
Table 4.
Values collected from Device_MEN.
Table 4.
Values collected from Device_MEN.
| DateTime | Temperature | Humidity | TVOC | eCO2 | CO2 |
|---|
| 17 December 2024 17:27:40 | 23.85 | 53.43 | 0.0 | 400.0 | |
| 17 December 2024 18:33:39 | 24.55 | 51.22 | 0.0 | | 450.0 |
To ensure a dataset that is as complete and useful as possible for future applications, a series of data processing steps were implemented to eliminate redundant values. This entire process was rigorously documented and tracked, with each relevant result being stored in a new descriptive TXT file. This file contains additional information that complements the telemetric data files, to present the changes in records throughout the preprocessing mechanism.
5.2. Processing Solution to Improve Data Quality
5.2.1. Alignment Stage and Duplicate Data Removal
The first step in improving data quality was a process of structural alignment of telemetric records to ensure the dimensional uniformity of DataFrames for each device involved in data acquisition. In other words, this stage involved concatenating records associated with the same timestamp but transmitted in different packets, which produced gaps in the data matrix, as well as eliminating duplicate records.
The group of associated records was analyzed for each unique timestamp. In the case of singular records, these were added unchanged to the new DataFrame. For timestamps where multiple records were identified (temporal duplicates), the original temporal value was kept, and for each parameter found in the priority telemetric key structure, the first non-null value was retained. This technique was implemented to ensure the preservation of all columns from the original DataFrame useful for analysis, standardizing the temporal structure and eliminating redundancies from the dataset. To be able to reference both datasets, the raw and the processed one, this process was completed by exporting the processed data to a new file distinct from the original.
Identification and Removal Outliers Stage—the mechanism for detecting outliers was implemented using a simple approach based on imposing a fixed standard deviation threshold, using the deviation factor k = 3, as well as natural limits for parameters such as eCO
2 or TVOC. The permitted limits between which a value is not considered to be an outlier are defined by the following mathematical formulas:
where
µ represents the parameter mean,
σ represents the standard deviation, and
Lmin is the natural threshold imposed for the parameters with positive physiological significance (TVOC ≥ 0 and eCO
2 ≥ 400).
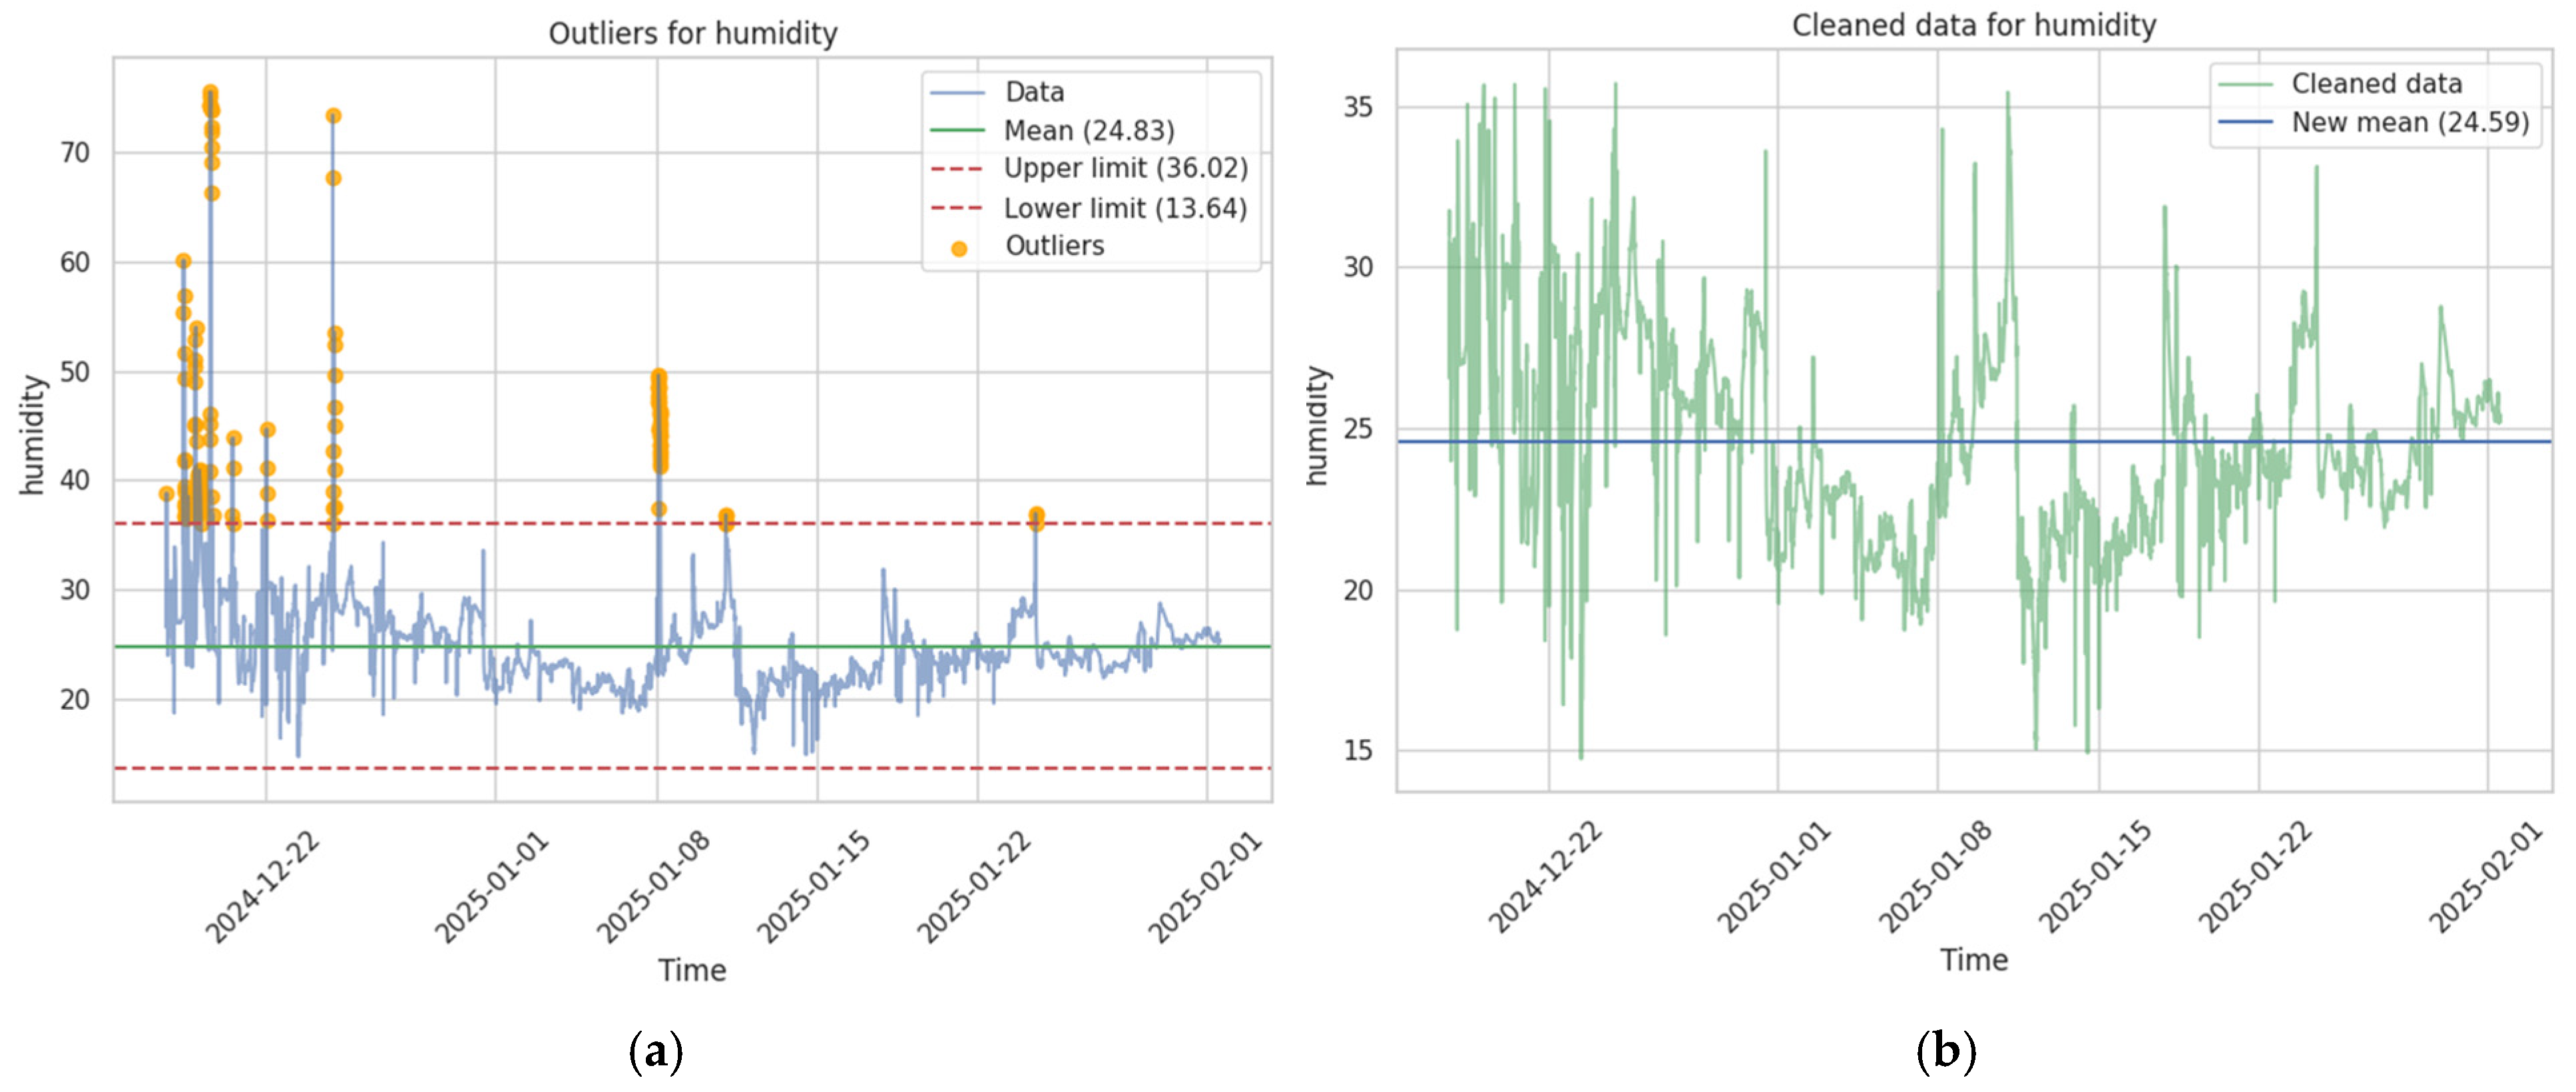
The algorithm identifies the outliers that exceed one of the two imposed limits and based on them build a set of indices in which records containing at least one anomaly were stored. After identifying records that did not meet the imposed standard, filtering was performed with the aim of eliminating those data, which resulted in a dataset more suitable for subsequent analyses, with records better reflecting the trends of parameter changes for measuring air quality—
Figure 9.
After the outlier removal process, the descriptive file was supplemented with information to reflect the effect produced by this raw data processing stage. The information provided presents results about the modification of each parameter for which values were recorded in that time interval, as well as the percentage of eliminated data in the relation to the total number of values from the raw data file—
Figure 10.
5.2.2. Stage of Filling in Missing Values and Rebuilding the Temporal Index
The raw data collected from sensors contained, besides outliers, a series of gaps, temporal inconsistencies, and structural discontinuities. To identify all these missing periods, which could negatively influence the results of machine learning models, a process was implemented to identify these temporal anomalies. The first step that was carried out consisted in attempting to determine all the time periods that do not fit into the standard sampling interval between two consecutive recordings. For this purpose, a fixed threshold of 10 min between two consecutive values was imposed, with an allowance of a 10 s tolerance, to include minor variations that occurred in the data acquisition process. The intervals that exceeded these imposed limits were marked as structural discontinuities that required subsequent correction.
The sampling frequency underwent a normalization process to standard value of 5 min, with this process constituting the main objective of this stage, which is why the average frequency of values associated with a device was calculated, using a mathematical foundation calculated according to the following formula:
where
f represents the sampling frequency and (
ti+1 −
ti) represents the temporal difference between consecutive measurements.
The process included going through the entire set of timestamps associated with a device, based on which all intervals that did not validate the imposed criteria were identified, intervals which were marked in dedicated data structures, with the purpose of facilitating subsequent corrective interventions.
After identifying the temporal discontinuities, the stage of standardizing the temporal index followed, which would allow the subsequent completion of all marked gaps. This process aimed at transforming the irregular time series into a uniform structure with fixed sampling intervals.
The standardization stage began by determining the absolute temporal limits of the data set, thus defining the complete domain of the time series, after which each timestamp was adjusted to 5 min intervals by rounding or truncating to the nearest temporal value The standardized temporal index, which a fixed resolution of 5 min, throughout the sampling period, was created according to the following expression:
where
t0 represents the initial timestamp,
represents the standard 5 min interval, and
N represents the total number of intervals covering the entire temporal domain for the recorded values transmitted by a device.
After creating the standardized temporal index, the stage of associating the values from the original set with the new index followed, with each record associated with the original timestamp being associated with the closest standardized timestamp, a value that could be identified by implementing a temporal distance minimization algorithm, according to the following criterion:
It was found that this method produced a problem in cases where multiple values were associated with the same standardized timestamp. This happened for records transmitted at intervals shorter than 5 min, for which the approximation was made to the same standardized index. To resolve this situation, the arithmetic mean of the duplicated values of the sensor parameters was used, and thus the process was completed with the association of a single value for a standardized timestamp.
This process of rebuilding the time index generated a uniform data structure that contains certain periods with missing values, represented by the gaps identified in the previous stage. This step is essential in creating a coherent and uniform framework, suitable for the subsequent application of interpolation algorithms or filling in missing values to ensure a robust dataset, specifically designed for training various machine learning models.
The next stage in the data quality improvement process involved filling in the discontinuities, using a strategy calibrated according to the size of each identified gap. This approach was used because no generally valid completion method was identified for any type of gap, which could contain either a single missing value or a larger number of consecutive missing values.
For isolated missing values or small groups of discontinuities, an interpolation based on the mean of nearby neighbors was used. For medium-sized sequences of discontinuities, which were not covered by the previous method, linear interpolation was used, based on the following equation:
where
t1 and
t2 are the known timestamps between which the discontinuity interval falls, and
val(
t1) and
val(
t2) are the values corresponding to these time indices.
If even after this stage, gaps of even larger intervals were identified, the need for a more complex approach was recognized, implemented through cubic spline interpolation, based on the following equation:
where the coefficients
ai,
bi,
ci, and
di, were determined by imposing continuity and smoothness conditions at the interpolation nodes.
These algorithms were gradually applied to completely cover all discontinuity intervals, but if gaps remained in the end, then a final strategy was used, which involved filing based on the global mean value of the time series.
The result of this stage consisted of a complete time series, temporally standardized at fixed sampling intervals, but also characterized by value continuity, useful for extracting meaningful insights into the trends of environmental parameters. This ensures obtaining a clear and more relevant assessment of indoor air quality, as highlighted by the comparison of dataset characteristics before and after the cleaning and completion process, presented in
Table 5.
5.3. Analysis of Archived Data Series for Use in Training Machine Learning Models
Machine learning (ML) algorithms are particularly important in the statistical analysis of datasets, as they can perform tasks such as prediction, classification, or even detecting anomalies that may occur due to sensor malfunctions or the emergence of unexpected pollutant sources.
The quality and size of the dataset directly influence the efficiency of ML models. Large datasets with well-balanced values lead to greater statistical power, reducing the risk of overfitting and improving the generalization capability of the models [
40]. Therefore, a preprocessing stage that includes cleaning, normalization, or even feature engineering is essential, as it produces an appropriate format of raw data suitable for training ML models, which can also be observed in recent studies on the impact of preprocessing techniques [
41].
For indoor air quality datasets, multiple linear regression (MLR) has been shown to provide the best results in predicting parameters for temperature, humidity, and concentrations of TVOC and eCO
2, with a coefficient of determination (R
2) of up to 0.94 for temperature and humidity. However, comparable results to those obtained through MLR are also provided by multilayer perceptron (MLP), an artificial neural network with one or more hidden layers, for which temperature and humidity prediction leads to an R
2 of up to 0.70 [
42]. Regarding the identification of anomalies with high accuracy in indoor air quality datasets, the long short-term memory–autoencoder (LSTM–AE) model has demonstrated a high efficiency, correctly identifying 1888 out of 2100 abnormal values, without positive or negative errors [
43].
Nevertheless, even for preprocessed datasets, it is important to analyze the quality and statistical balance of the dataset, as they have a strong impact on the predictive power and robustness of the model, influencing its generalization capacity to provide new observations.
In this regard, after completing the process of improving the quality of data from sensors, the next stage involved validating and analyzing the time series to provide a complete and coherent dataset for future uses. This analysis was carried out in two stages: stationarity evaluation and structural components analysis.
5.3.1. Stationarity Evaluation
The analysis of stationarity forms the foundation for the proper evaluation of time series for use in machine learning processes. In other words, to determine whether a time series is stationary or not, one must observe if its statistical properties (mean, variance, and autocovariance) remain constant over time, meaning the mean shows no trend, the variance remains stable, and the temporal dependency between two observations depends only on the distance between them, not on the specific moment they are measured. To test this, two specific tests were used, ADF (augmented Dickey–Fuller) and KPSS (Kwiatkowski–Phillips–Schmidt–Shin).
The ADF test helps determine the presence of a unit root in a time series, which is essential for determining stationarity. It has as its null hypothesis the presence of a unit root and the rejection of this hypothesis indicates stationarity.
The KPSS test is complementary to the ADF test and evaluates the null hypothesis that the series is stationary. The approach is based on two types of stationarity: one around a constant, called level stationarity and the other around a trend, called trend stationarity.
The two tests are very useful in performing the analysis because they provide a more reliable result regarding the tendency of the time series. In cases where the two tests indicate different results, then two cases are distinguished:
If ADF indicates stationarity and KPSS indicates non-stationarity, then the time series is stationary, but presents some structural breaks, which indicates that it is piecewise stationary;
If ADF indicates non-stationarity and KPSS indicates stationarity, then the time series has weak statistical power, found on a small sample, or indicates the presence of near-unit roots.
5.3.2. Structural Components Analysis
At this stage, each time series has been decomposed into structural components which represent an important step in the deep understanding of the dynamics of recorded data, separating the series into three main components: trend, seasonal component, and noise (
Figure 11).
The trend of a series was estimated by applying a centered moving average to the original series, with the averaging window chosen to attenuate high-frequency fluctuations (Equation (8)).
m = 2 ∗ k + 1 represents the dimensions of the averaging window.
The trend reflects the general direction in which the data evolve over time and shows the structural changes that affect the series, influencing the evolutionary trajectory of the measurements. This characteristic can reflect possible sensor degradation or a long-term change in environmental conditions.
The seasonal component could be observed by specifying the seasonal period with a value of 288, which defines the length of the seasonal cycle in time units, represented by a complete cycle throughout a day. To observe the seasonal component, the trend was removed from the original series, and then the deseasonalized values were averaged at similar positions within the seasonal cycle. This captures patterns that repeat regularly at fixed intervals.
The residual component (noise) is the component that remains after removing both the trend and the seasonal component and is represented by random fluctuations in the data, parameter anomalies and possibly sudden variations in environmental factors.
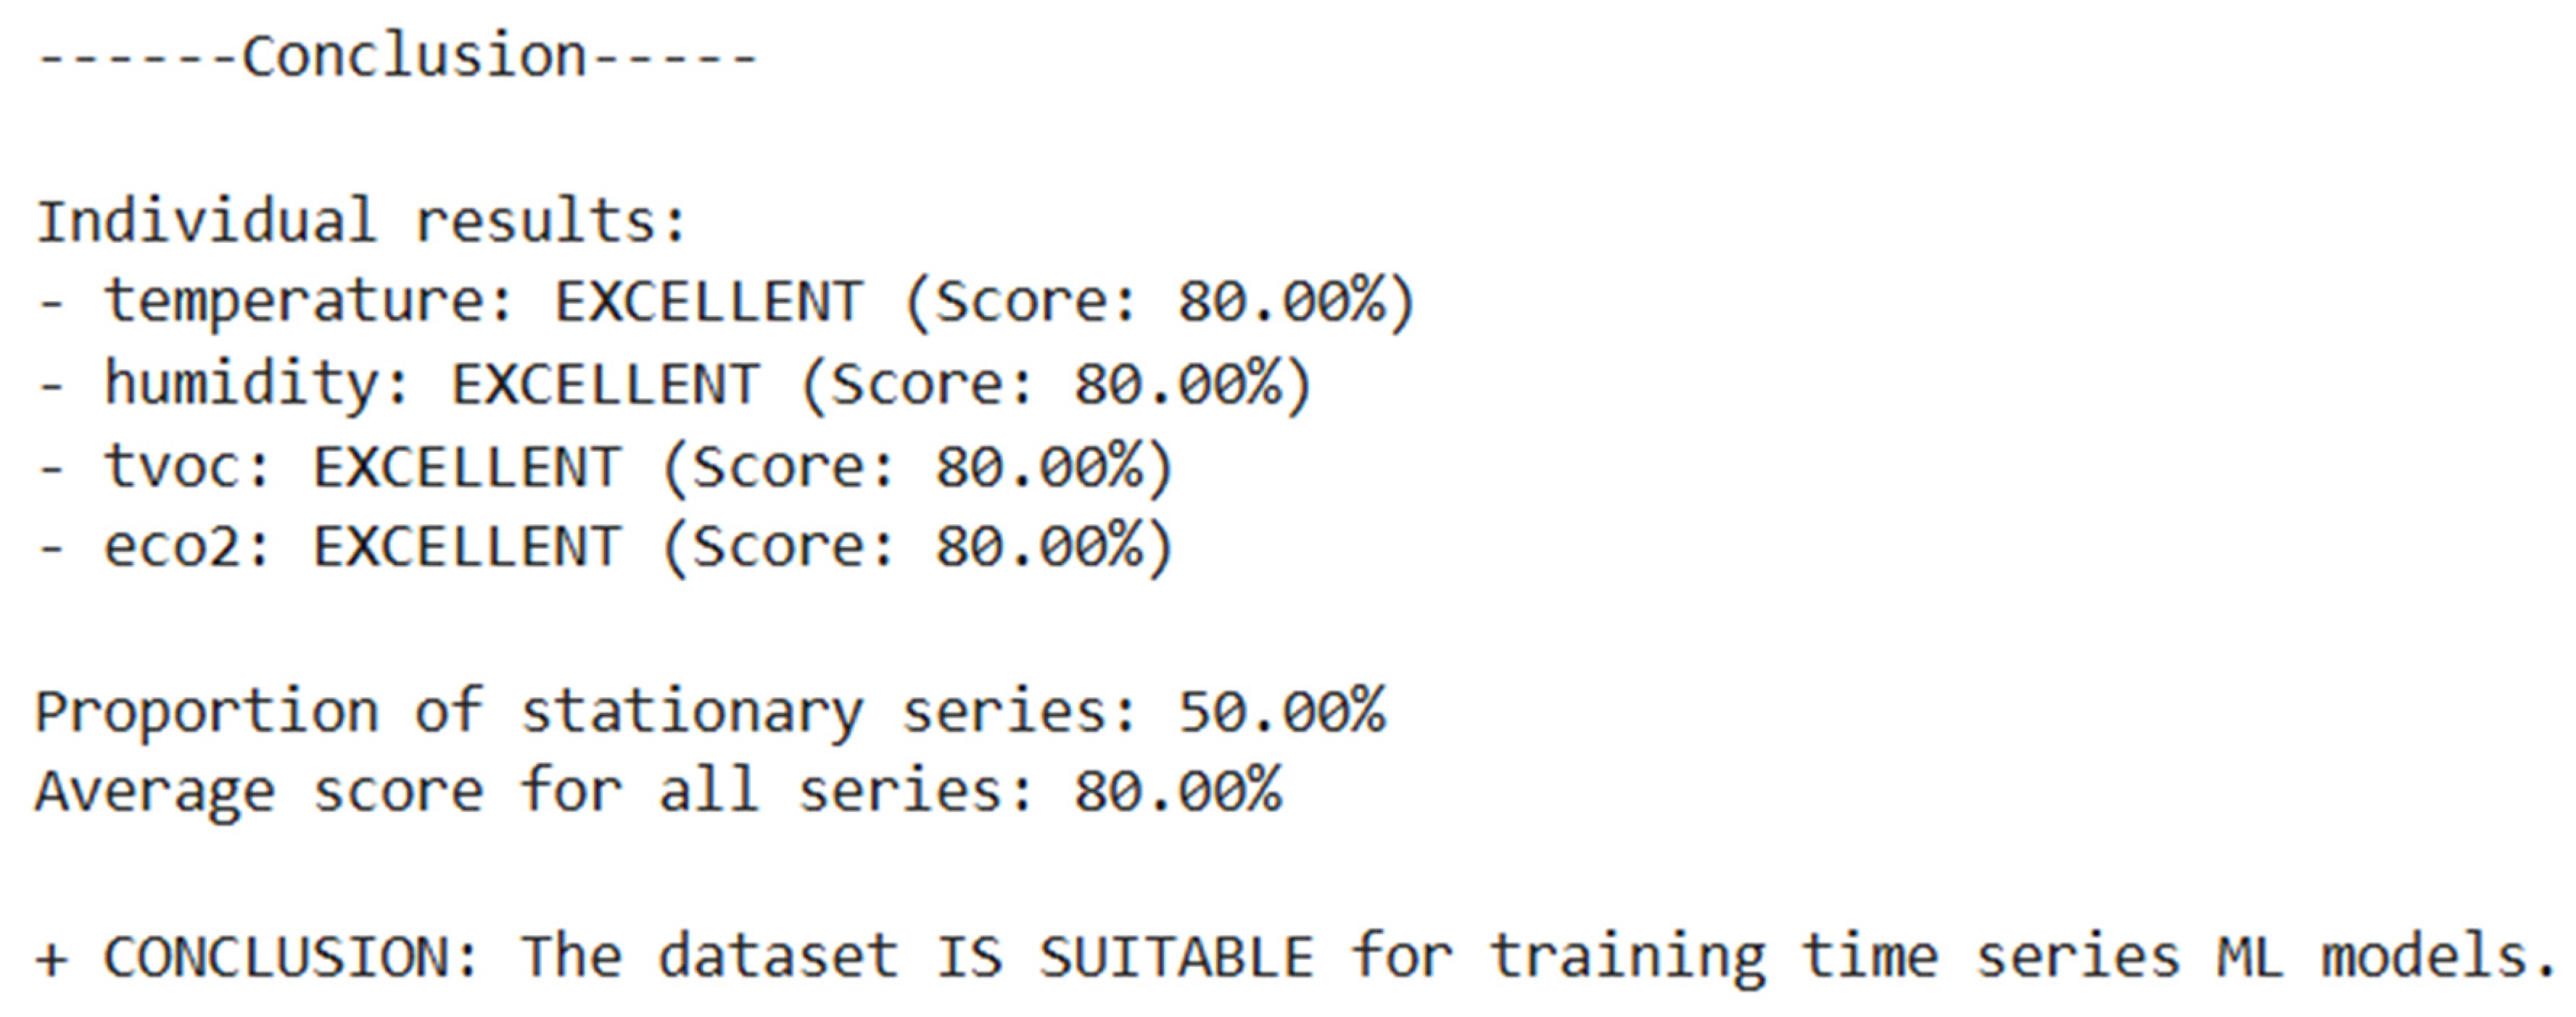
Following the decomposition of all the time series associated with each parameter transmitted by a device and the application of the two stationarity tests, a unified result was concluded regarding the possibility of using or not using the dataset in future analyses (
Figure 12).
6. Sharing as Open Data
After completing all the necessary operations to improve data quality and adequately documenting the process, it was found that the dataset represents an important resource worth utilizing. The obtained data are suitable for both statistical analysis and training machine learning models. Given the positive impact that the resulting data archive would have on research, the decision was made to share this resource in the form of open data. This allows access for any person interested in monitoring and understanding the evolution of indoor air quality in an urban agglomeration.
For this purpose, a mechanism was created on Zenodo for publishing the processed data collected from the AirQ platform.
6.1. Presentation of the Zenodo Platform
Zenodo represents an open research data archiving and storage platform, developed and managed by CERN (European Organization for Nuclear Research) in collaboration with OpenAIRE, launched in May 2013.
The Zenodo platform is built on a technical infrastructure based on the framework provided by InvenioRDM, an open-source framework designed for building and operating large-scale digital repositories. The ability to efficiently manage large volumes of data is ensured by the EOS service, which also belongs to CERN, where all uploaded files are stored in a disk cluster with a size of 5 petabytes. At the same time, all metadata are stored in JSON format using a PostgreSQL instance, in a structure described by versioned JSON Schemas [
44].
The choice to publish on this platform was made based on the multitude of advantages offered for publishing a dataset specifically intended for the research domain, in a community that relies on the same principles. Among these advantages, the following can be enumerated:
The possibility of unique identification of records, with the Zenodo platform automatically providing a DOI (digital object identifier) when publishing data [
45];
Storage capacity per submission, with the platform accepting up to 50 GB of storage space for individual files, which is more than sufficient for the size of data collected from the AirQ platform [
46];
The possibility of integration with other services, using RESTful API, with the Zenodo platform offering a fully documented process, allowing the complete automation of the data publication process [
47].
6.2. Data Publication Architecture
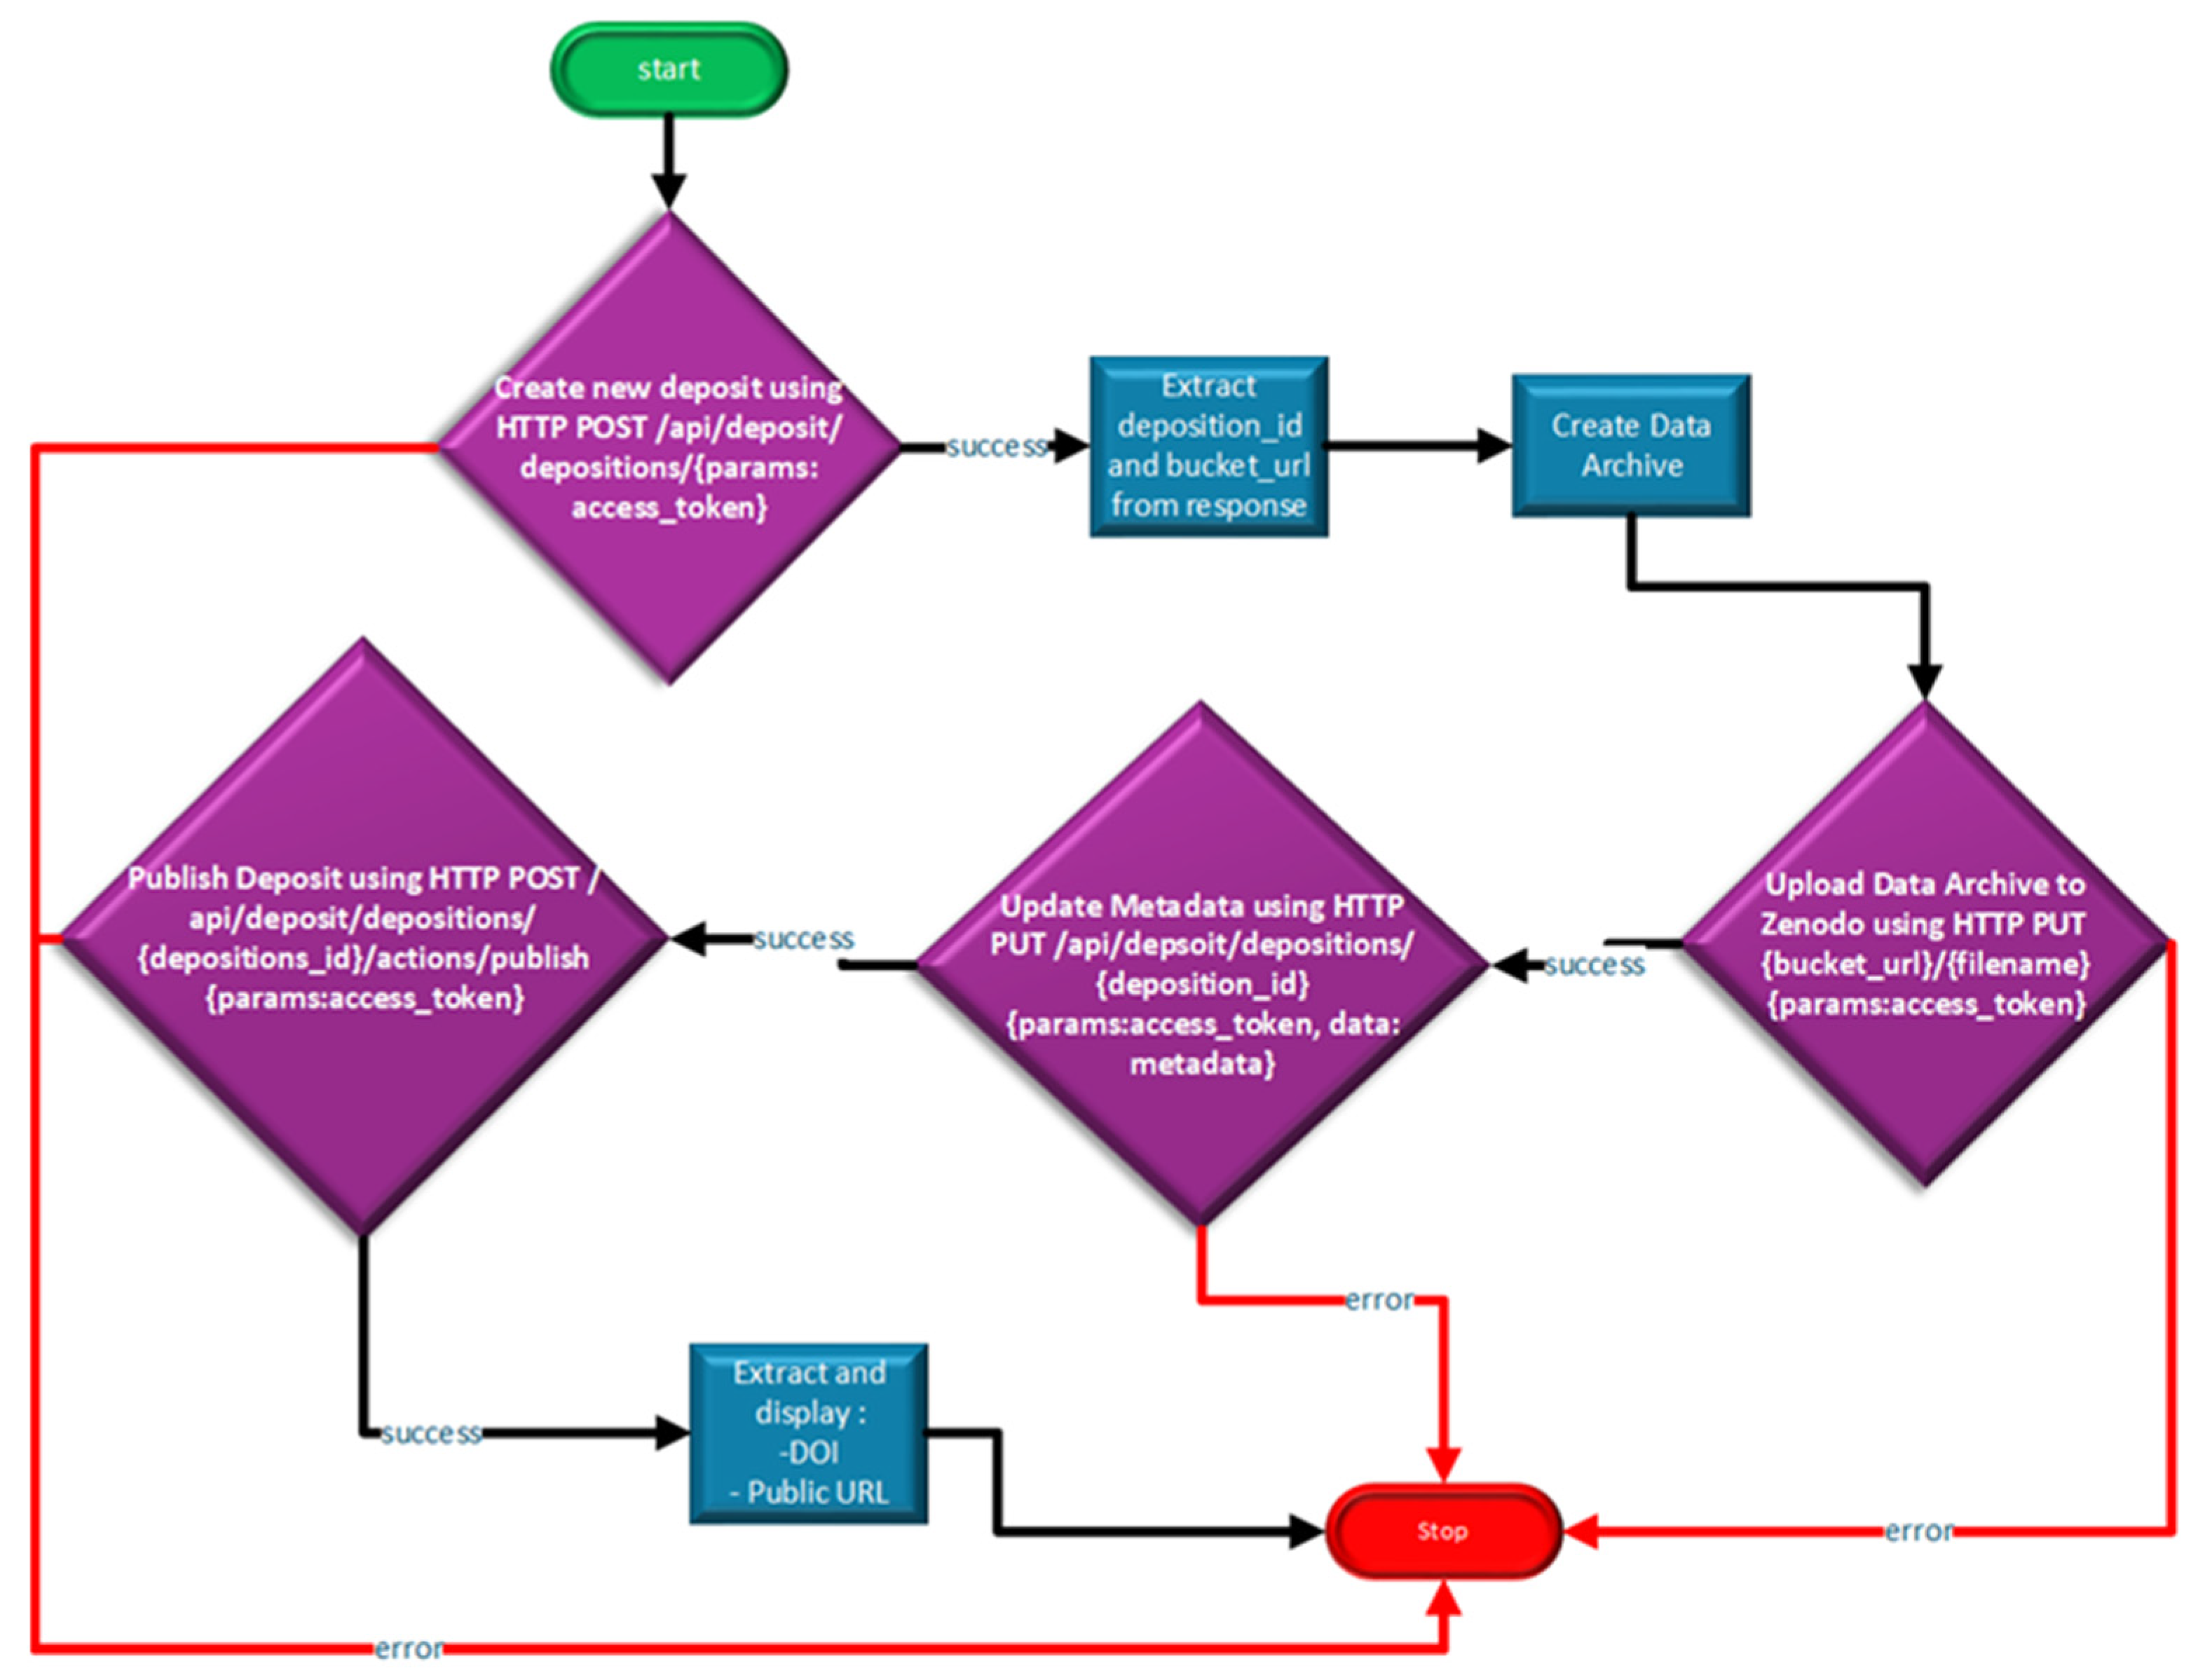
Publishing air quality monitoring data on the Zenodo platform was implemented using a fully automated script that utilizes the REST API provided by Zenodo—
Figure 13.
The first step in creating the data publication mechanism on Zenodo consisted of authenticating to the Zenodo API using a personal access token, generated from the interface, which was also used to define the base URL of the Zenodo API.
The next stage, after authentication validation, was based on the principle of creating a new repository. This was accomplished through a POST request to the /deposit/depositions endpoint to create an empty deposit, using the access token from the previous step as the access method. As the result of this process, the identification ID and the associated bucket URL were captured for future uploads or additions.
After this stage was validated, the next step was to create an archive containing all the data collected and processed through the mechanisms described earlier. Based on the archive content, the information presented through metadata was outlined, providing an overview of the data found in the archive. This information is sent to Zenodo using a PUT request to the /api/deposit/depositions/{deposit_id} endpoint. The dataset is sent as binary data to the Zenodo bucket using a PUT request to the bucket URL.
Before publication, a final verification is performed to ensure the repository was created successfully. For this purpose, a GET request is made to the /api/deposit/depositions/{deposition_id} endpoint. If the verification process completes successfully, then the final step of publishing the repository follows. For this purpose, a POST request is made to the /deposit/depositions/{deposition_id}/actions/publish endpoint, which specifies the publication action for the previously created repository. Upon the successful completion of the publication process, the assigned DOI (digital object identifier) is extracted and displayed, along with the public URL of the published record.
The implemented architecture ensures an automated and reproducible data publication flow, adhering to scientific metadata standards and the FAIR principles (findable, accessible, interoperable, reusable) for research data, as stated by Zenodo [
48].
7. Conclusions
This paper has as its main original contribution the presentation of an automatic mechanism for archiving data from an IoT platform and publishing the data in an open format on the Zenodo platform. The design and implementation of the automatic mechanisms presented is the result of a real need that could not be satisfied by the existing mechanisms at the time of this study. At the time of writing this paper, no technical or scientific studies were found to exemplify a complete solution for transporting historical data from a collection of IoT sensors to a public area for publishing scientific data.
The AirQ platform, presented in
Section 3 of this paper, was used as the first stage of recording and presenting data from a collection of IoT sensors for indoor air quality monitoring. The AirQ platform has been a functional platform in use for more than three years and is based on a proven solution for the IoT platform—the open-source solution ThingsBoard. The data recorded by the platform, indoor air quality data, do not confer specificity to the automatic data archiving and publishing mechanism. The presented mechanism can be used for any type of data coming from a collection of IoT sensors.
The research behind this paper is based on the design, operation, and continuous development of an IoT platform for monitoring indoor air quality in personal living spaces—the AirQ platform. Even though the AirQ platform has been in continuous operation for over three years, the number of researchers who have access to the recorded data is limited and for this reason the focus of the paper is the proposal of a mechanism for archiving, cleaning, and publishing data in open-source format using the Zenodo platform in order to support future scientific studies related to how the quality of life in urban environments is affected not only by outdoor air quality but also by indoor air quality. The open-source publishing process is not just a simple process of copying data from one platform to another but involves cleaning operations and testing of properties for subsequent use in artificial intelligence algorithms.
Future research directions for the data published by the mechanism presented in this paper can be considered the study of the link between indoor air quality in personal living spaces and the urban ecosystem of which they are part. This is difficult because it involves environmental factors, economic factors, and not least social factors related to culture and education. Ensuring a clean atmosphere in the urban environment does not automatically lead to a good quality personal living environment. During energy crises in winter, ventilation in personal homes can be deficient and lead to personal living environments with very poor air quality regardless of the quality of the outside air. The study of urban ecosystems must consider all aspects of human well-being. Even if the quality of life in personal living environments can be considered an individual problem, this is not exactly the case. General problems at the urban ecosystem level can lead to the general impairment of personal living environments, and here we can give an example of the cost of energy for heating homes, standards related to the quality of construction materials and interior decoration elements, standards of minimum living space for one person, etc. The study of indoor air quality in personal living spaces is an important challenge for urban science and must be given due attention as part of the effort to improve the quality of human life in urban agglomerations.
The mechanism for publishing data to be accessible to any interested researcher, in an open format, brings two major directions that support scientific research in the field of urban science: creating an example of good practice regarding publishing data in an open format and offering the chance for scientific research to any interested researcher. The publication method presented in this paper involves the following essential elements absolutely necessary in such a process:
Safely extracting data from the IoT platform with the possibility of relieving the platform of handling large amounts of data;
Using a simple format for saving data that is compatible with all programming languages and development environments currently used in scientific research;
Rigorous labeling of saved data;
Data cleaning (alignment, elimination of duplicates and outliers, filling in missing data, and reconstructing time indexes);
Testing time series for later use in training artificial intelligence algorithms (for prediction or anomaly detection) and labeling data based on the scores obtained in these tests.
This paper aims to contribute to the study of quality of life in inner urban environments through the contributions presented.


