


Impact of Urban Green Spaces on the Livelihoods of Residents in Bulawayo and Johannesburg Cities


Abstract
1. Introduction
2. Materials and Methods
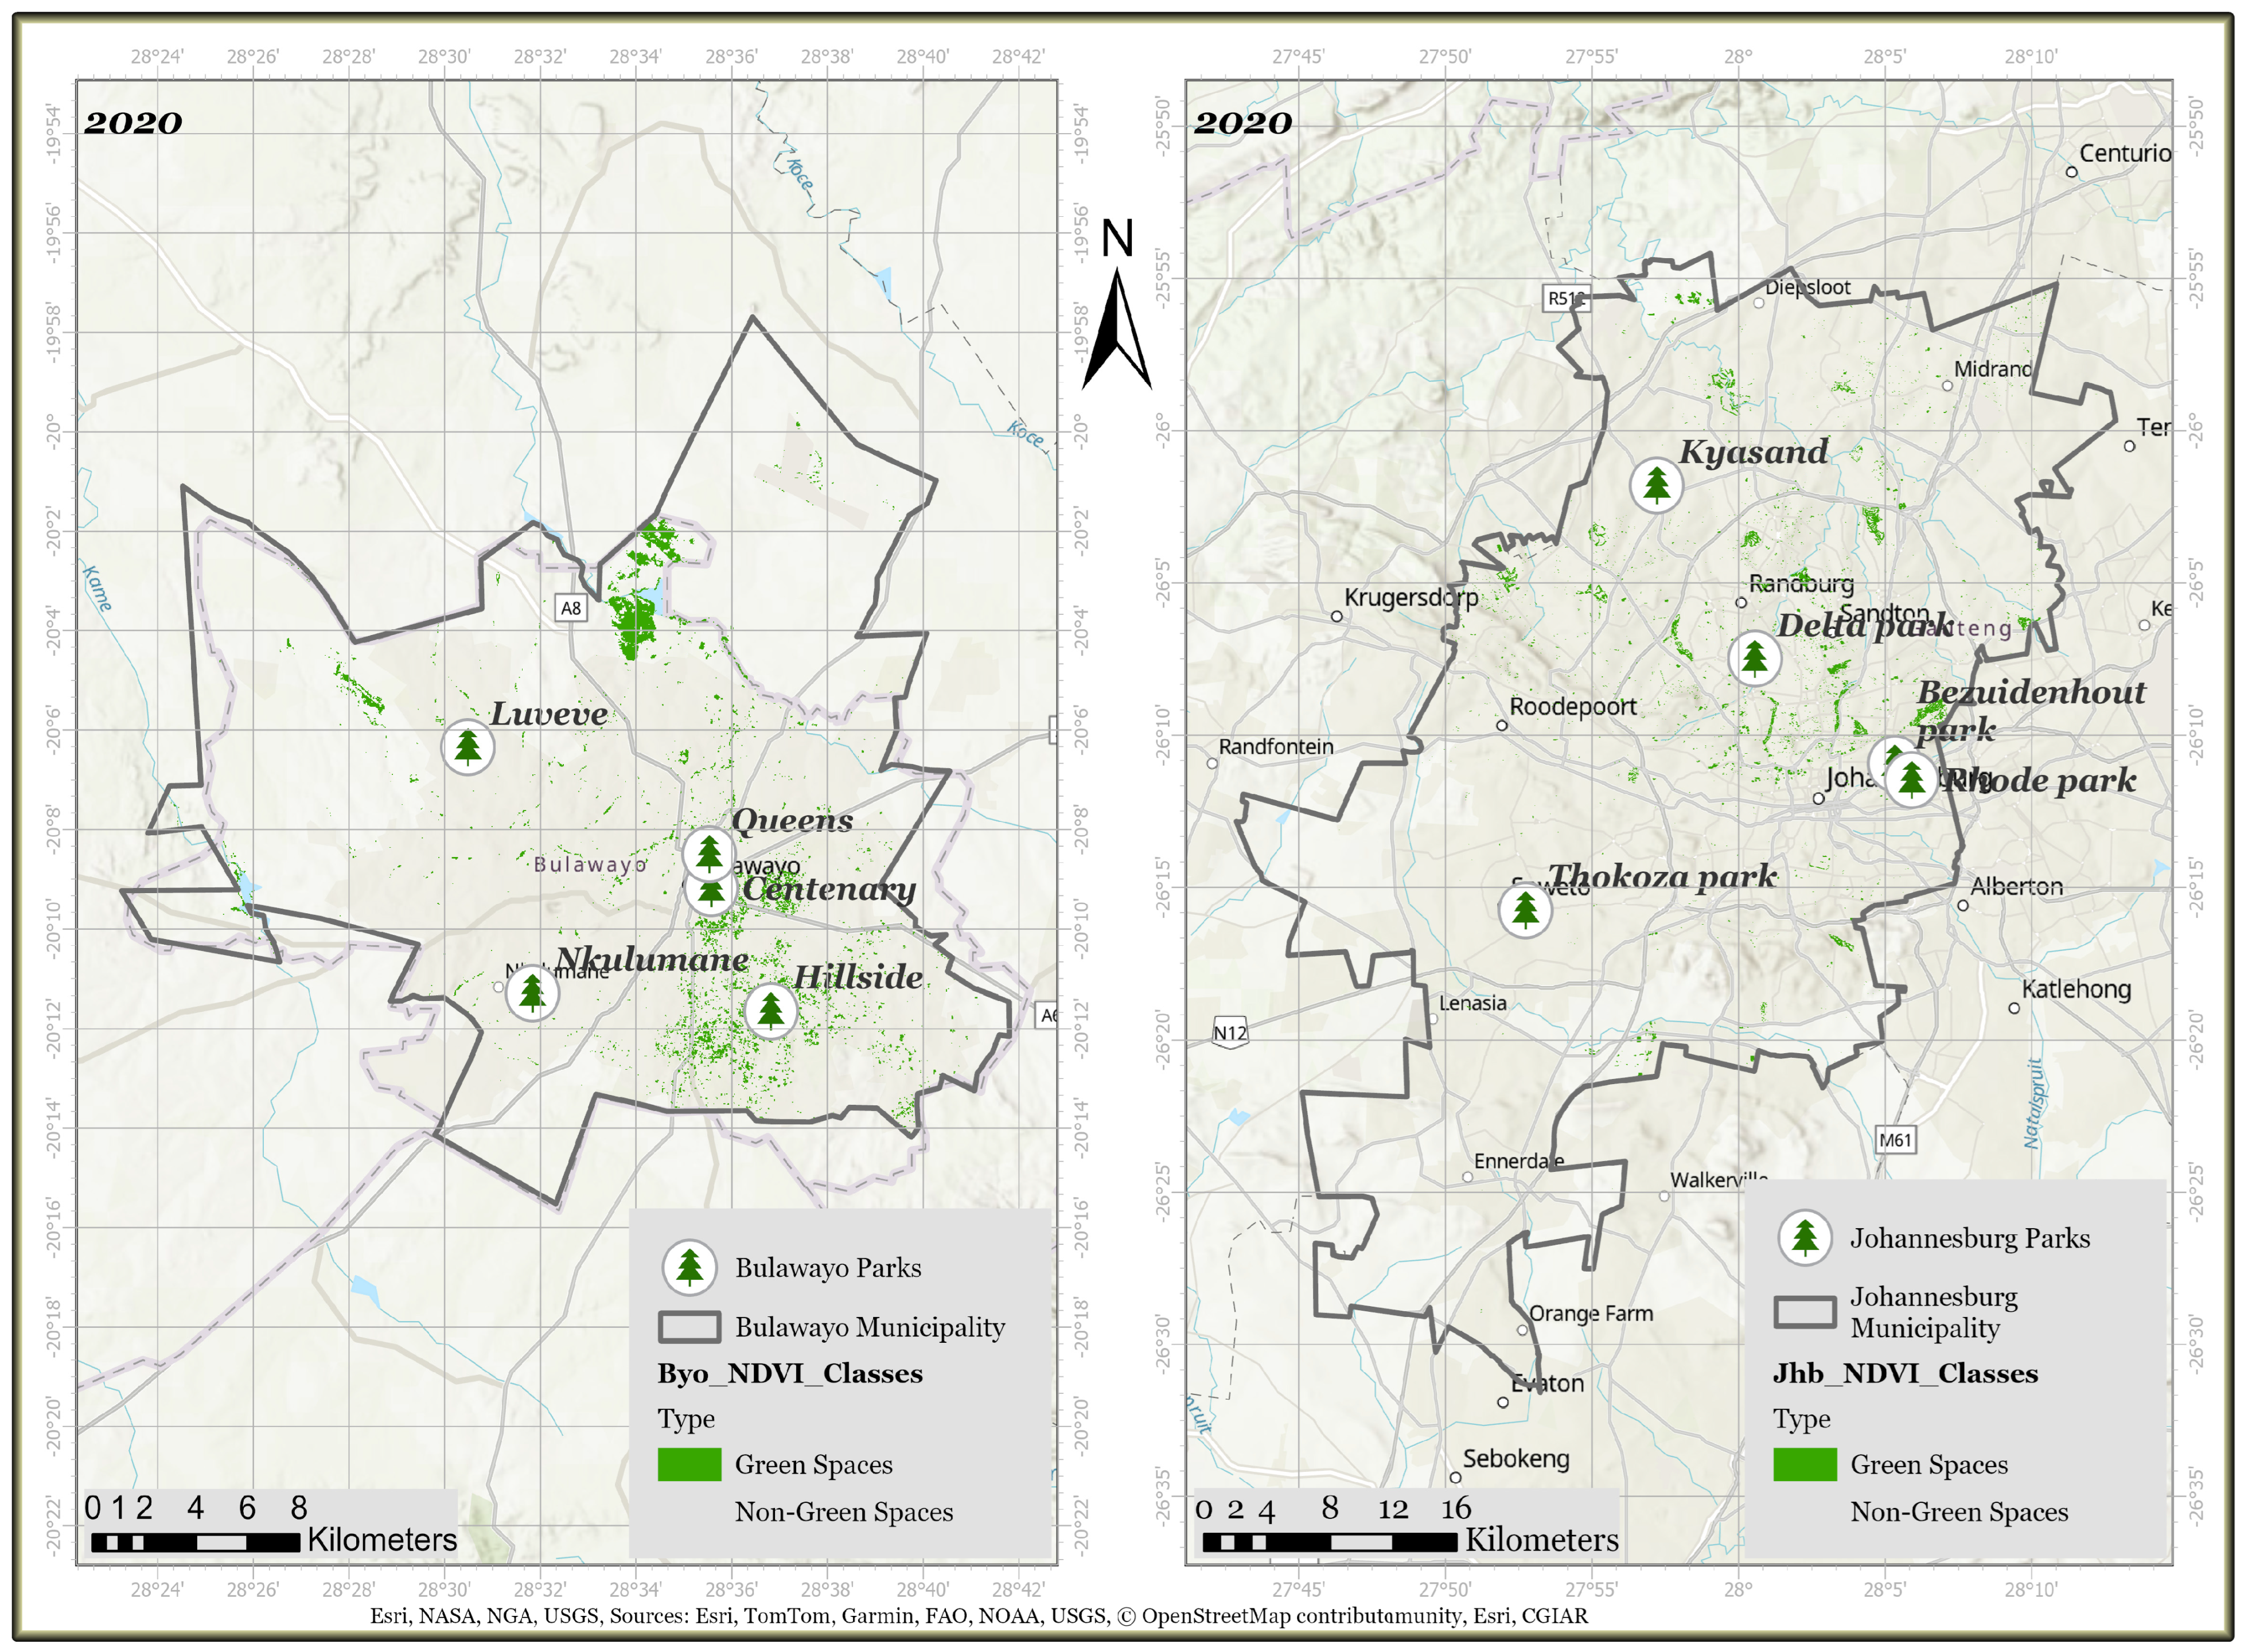
2.1. Study Area
2.2. Data Collection
2.3. Methods
3. Results and Discussion
3.1. Demographic Characteristics of Respondents
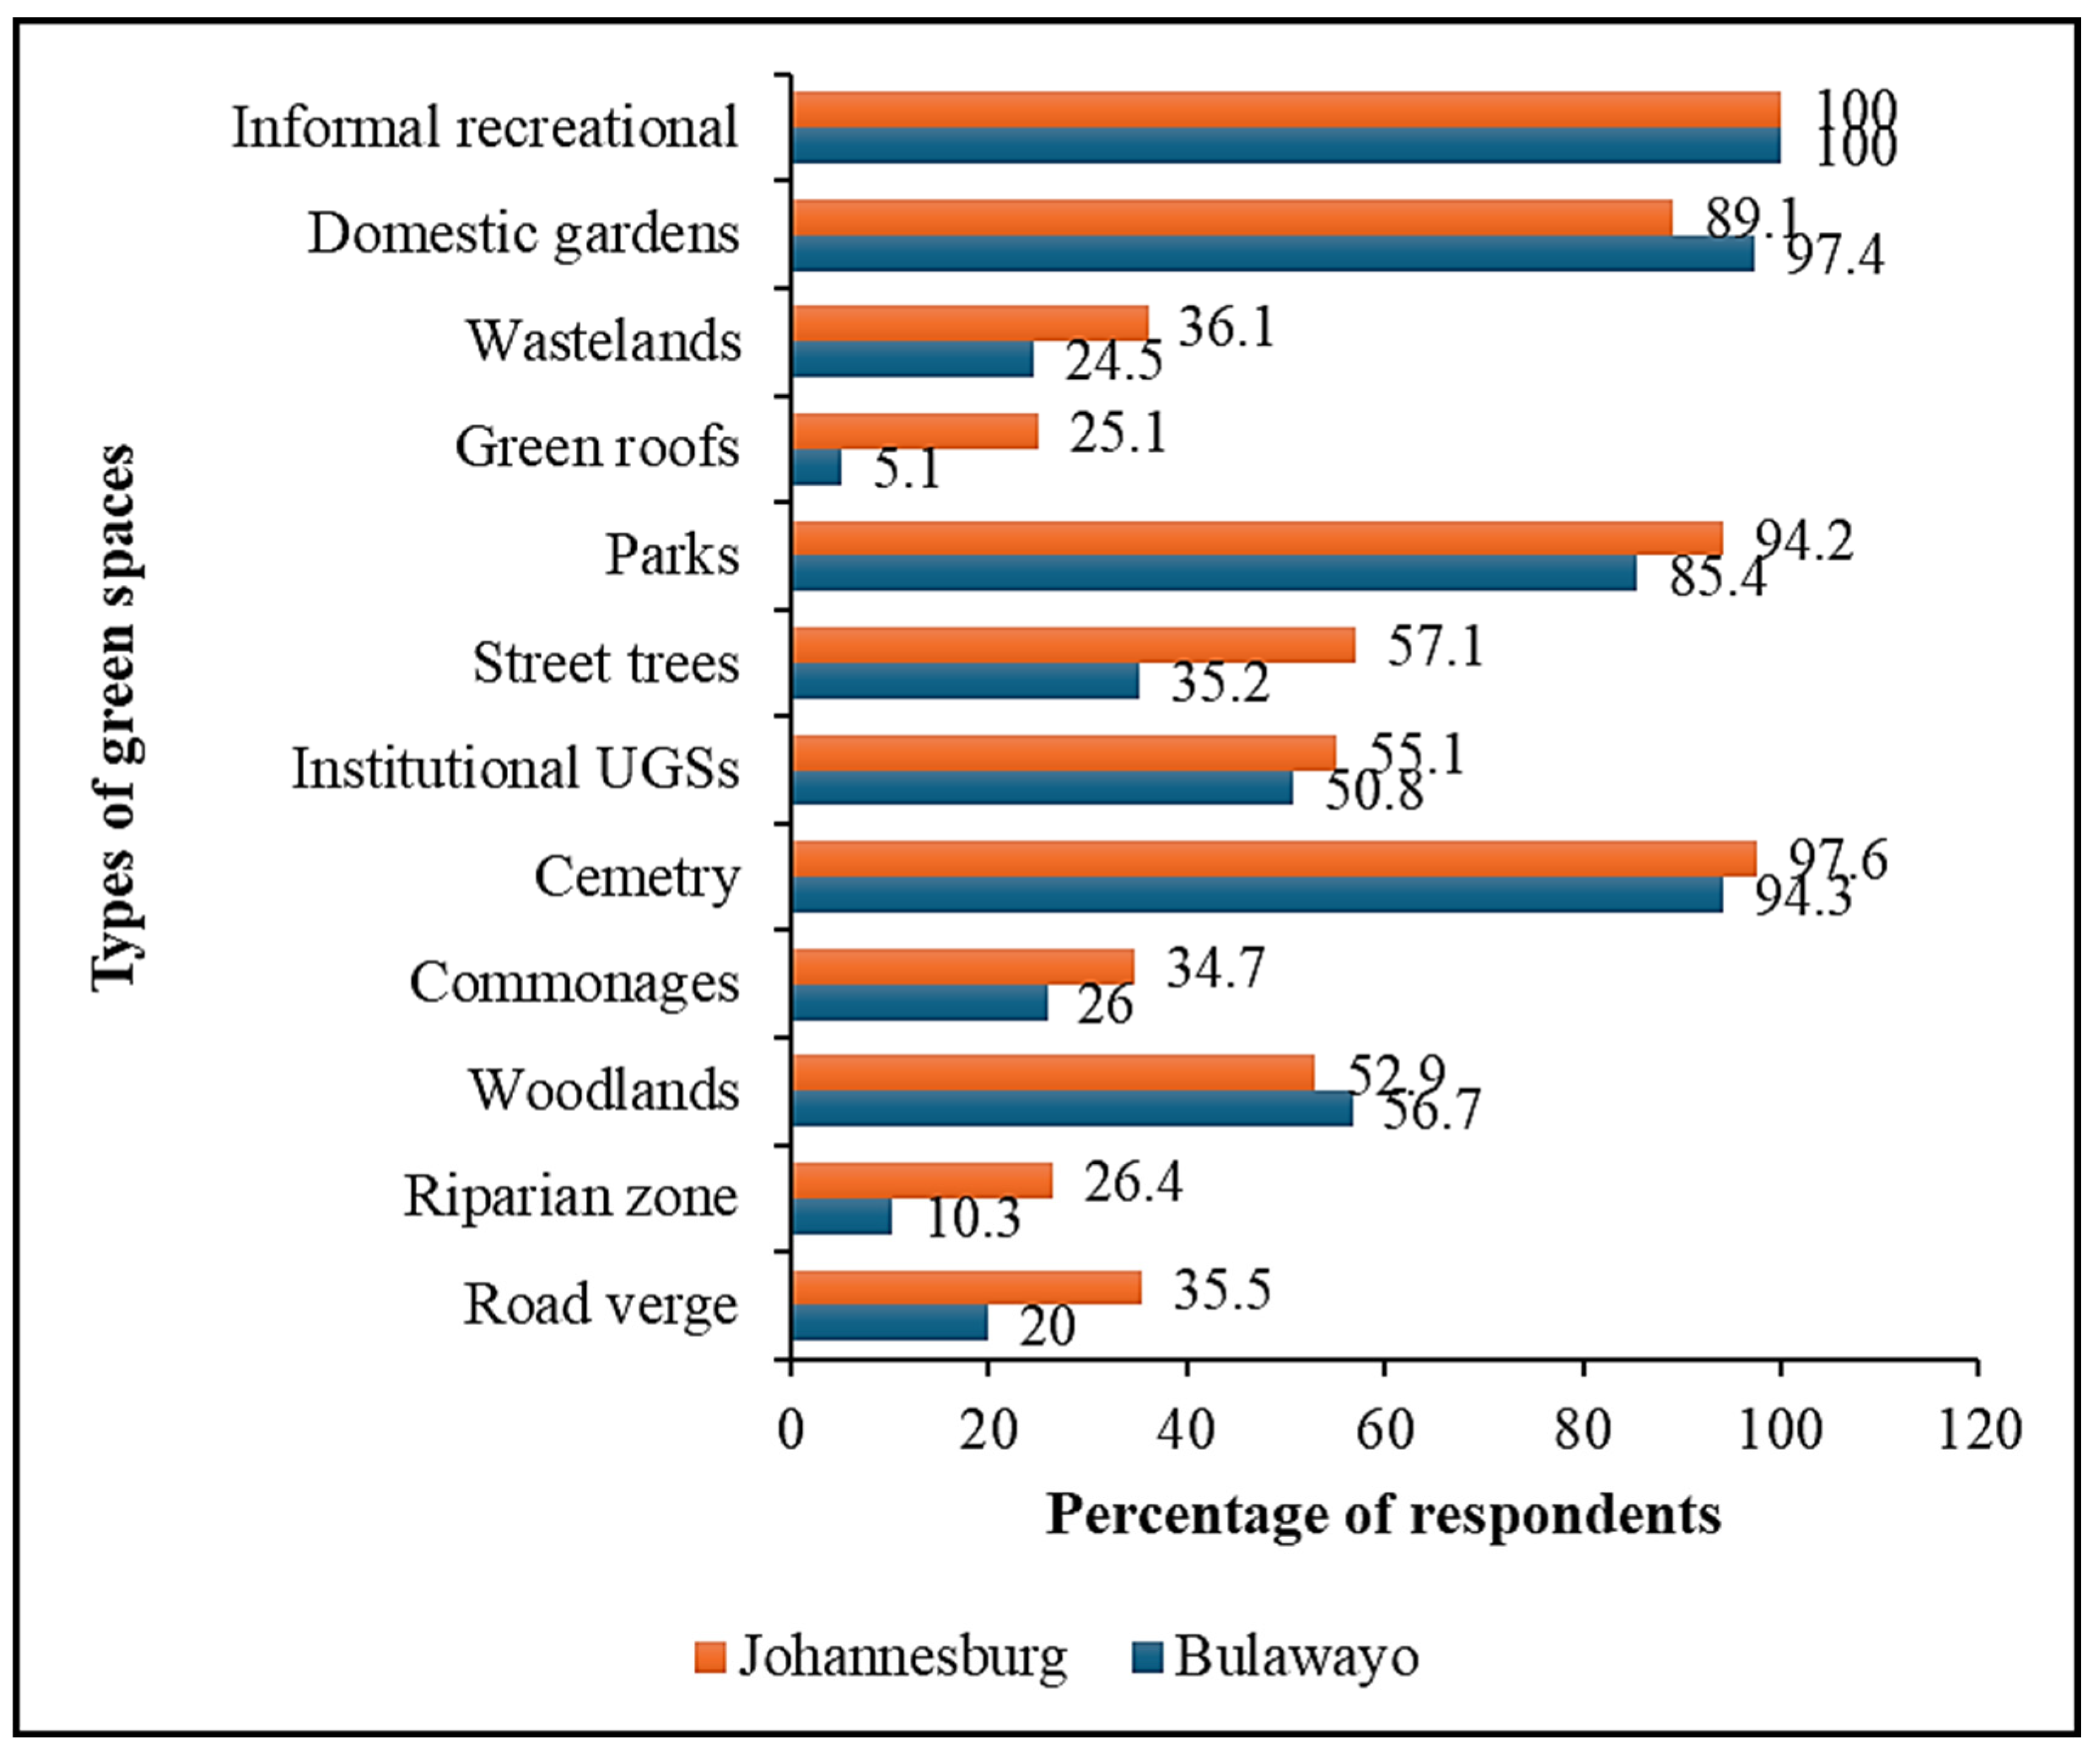
3.2. Types of Urban Green Spaces in Bulawayo and Johannesburg
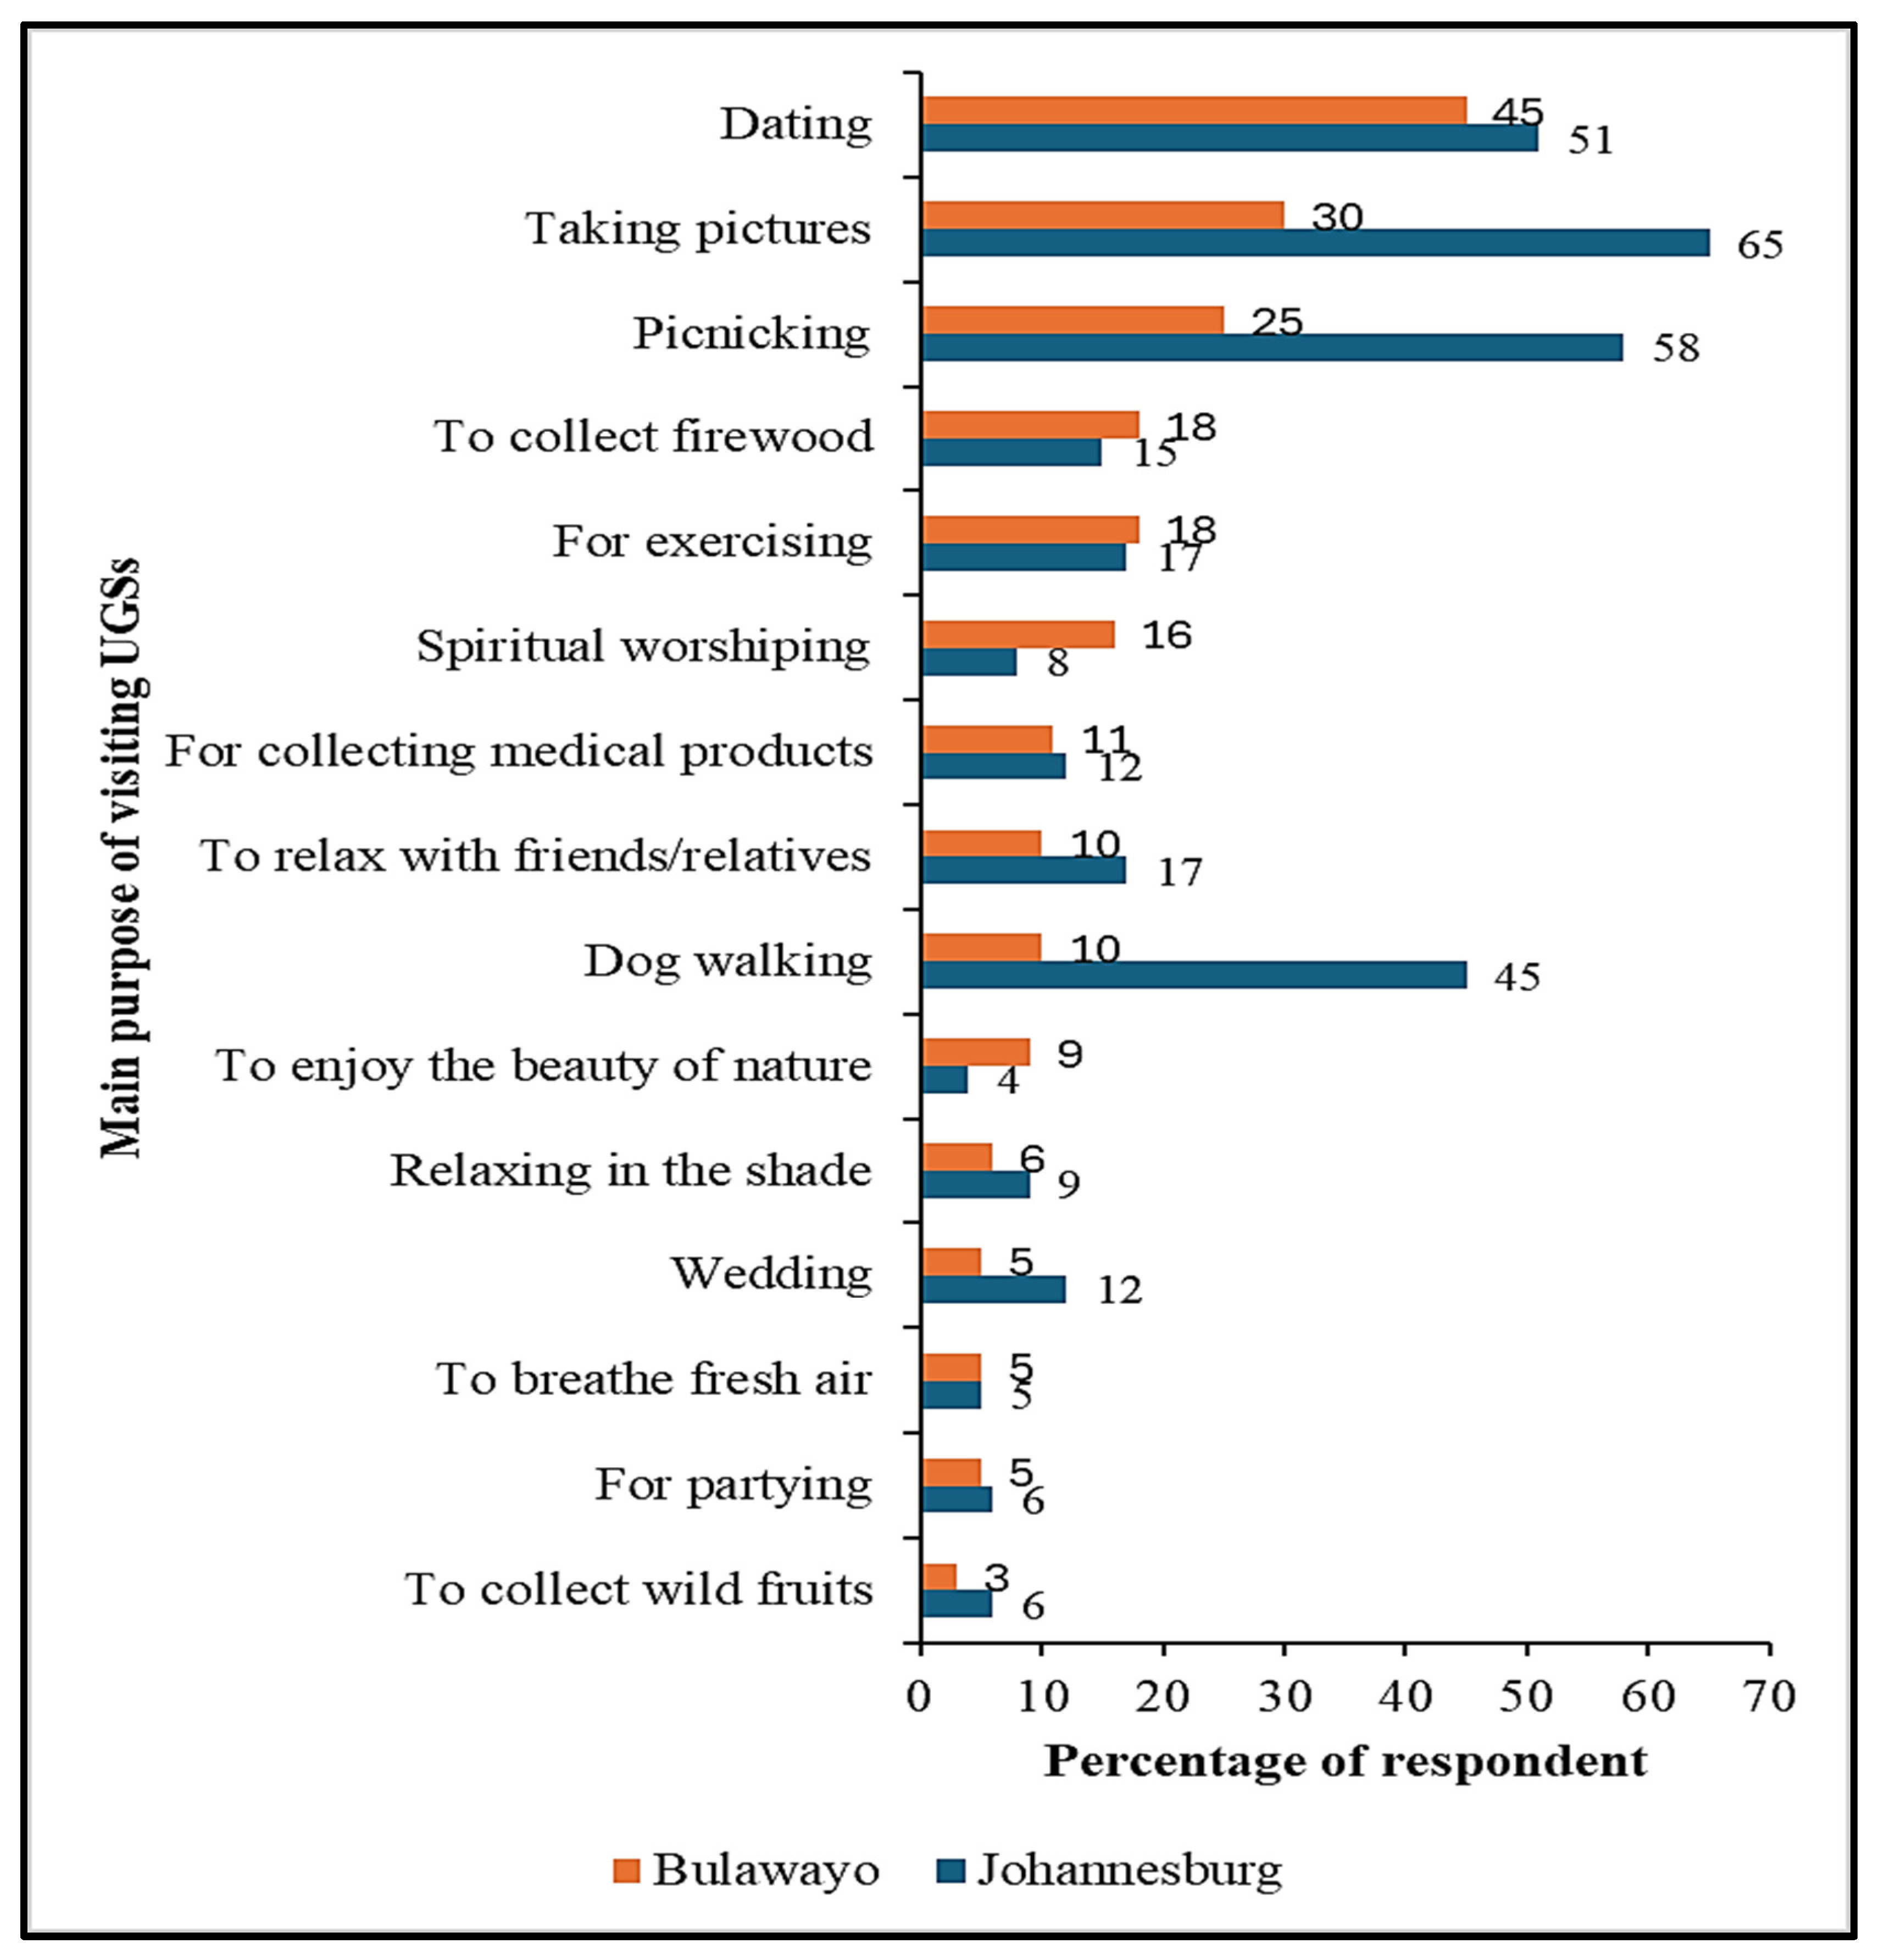
3.3. Livelihood Benefits from Urban Green Spaces in Bulawayo and Johannesburg
3.3.1. Social
3.3.2. Economic
3.3.3. Environmental
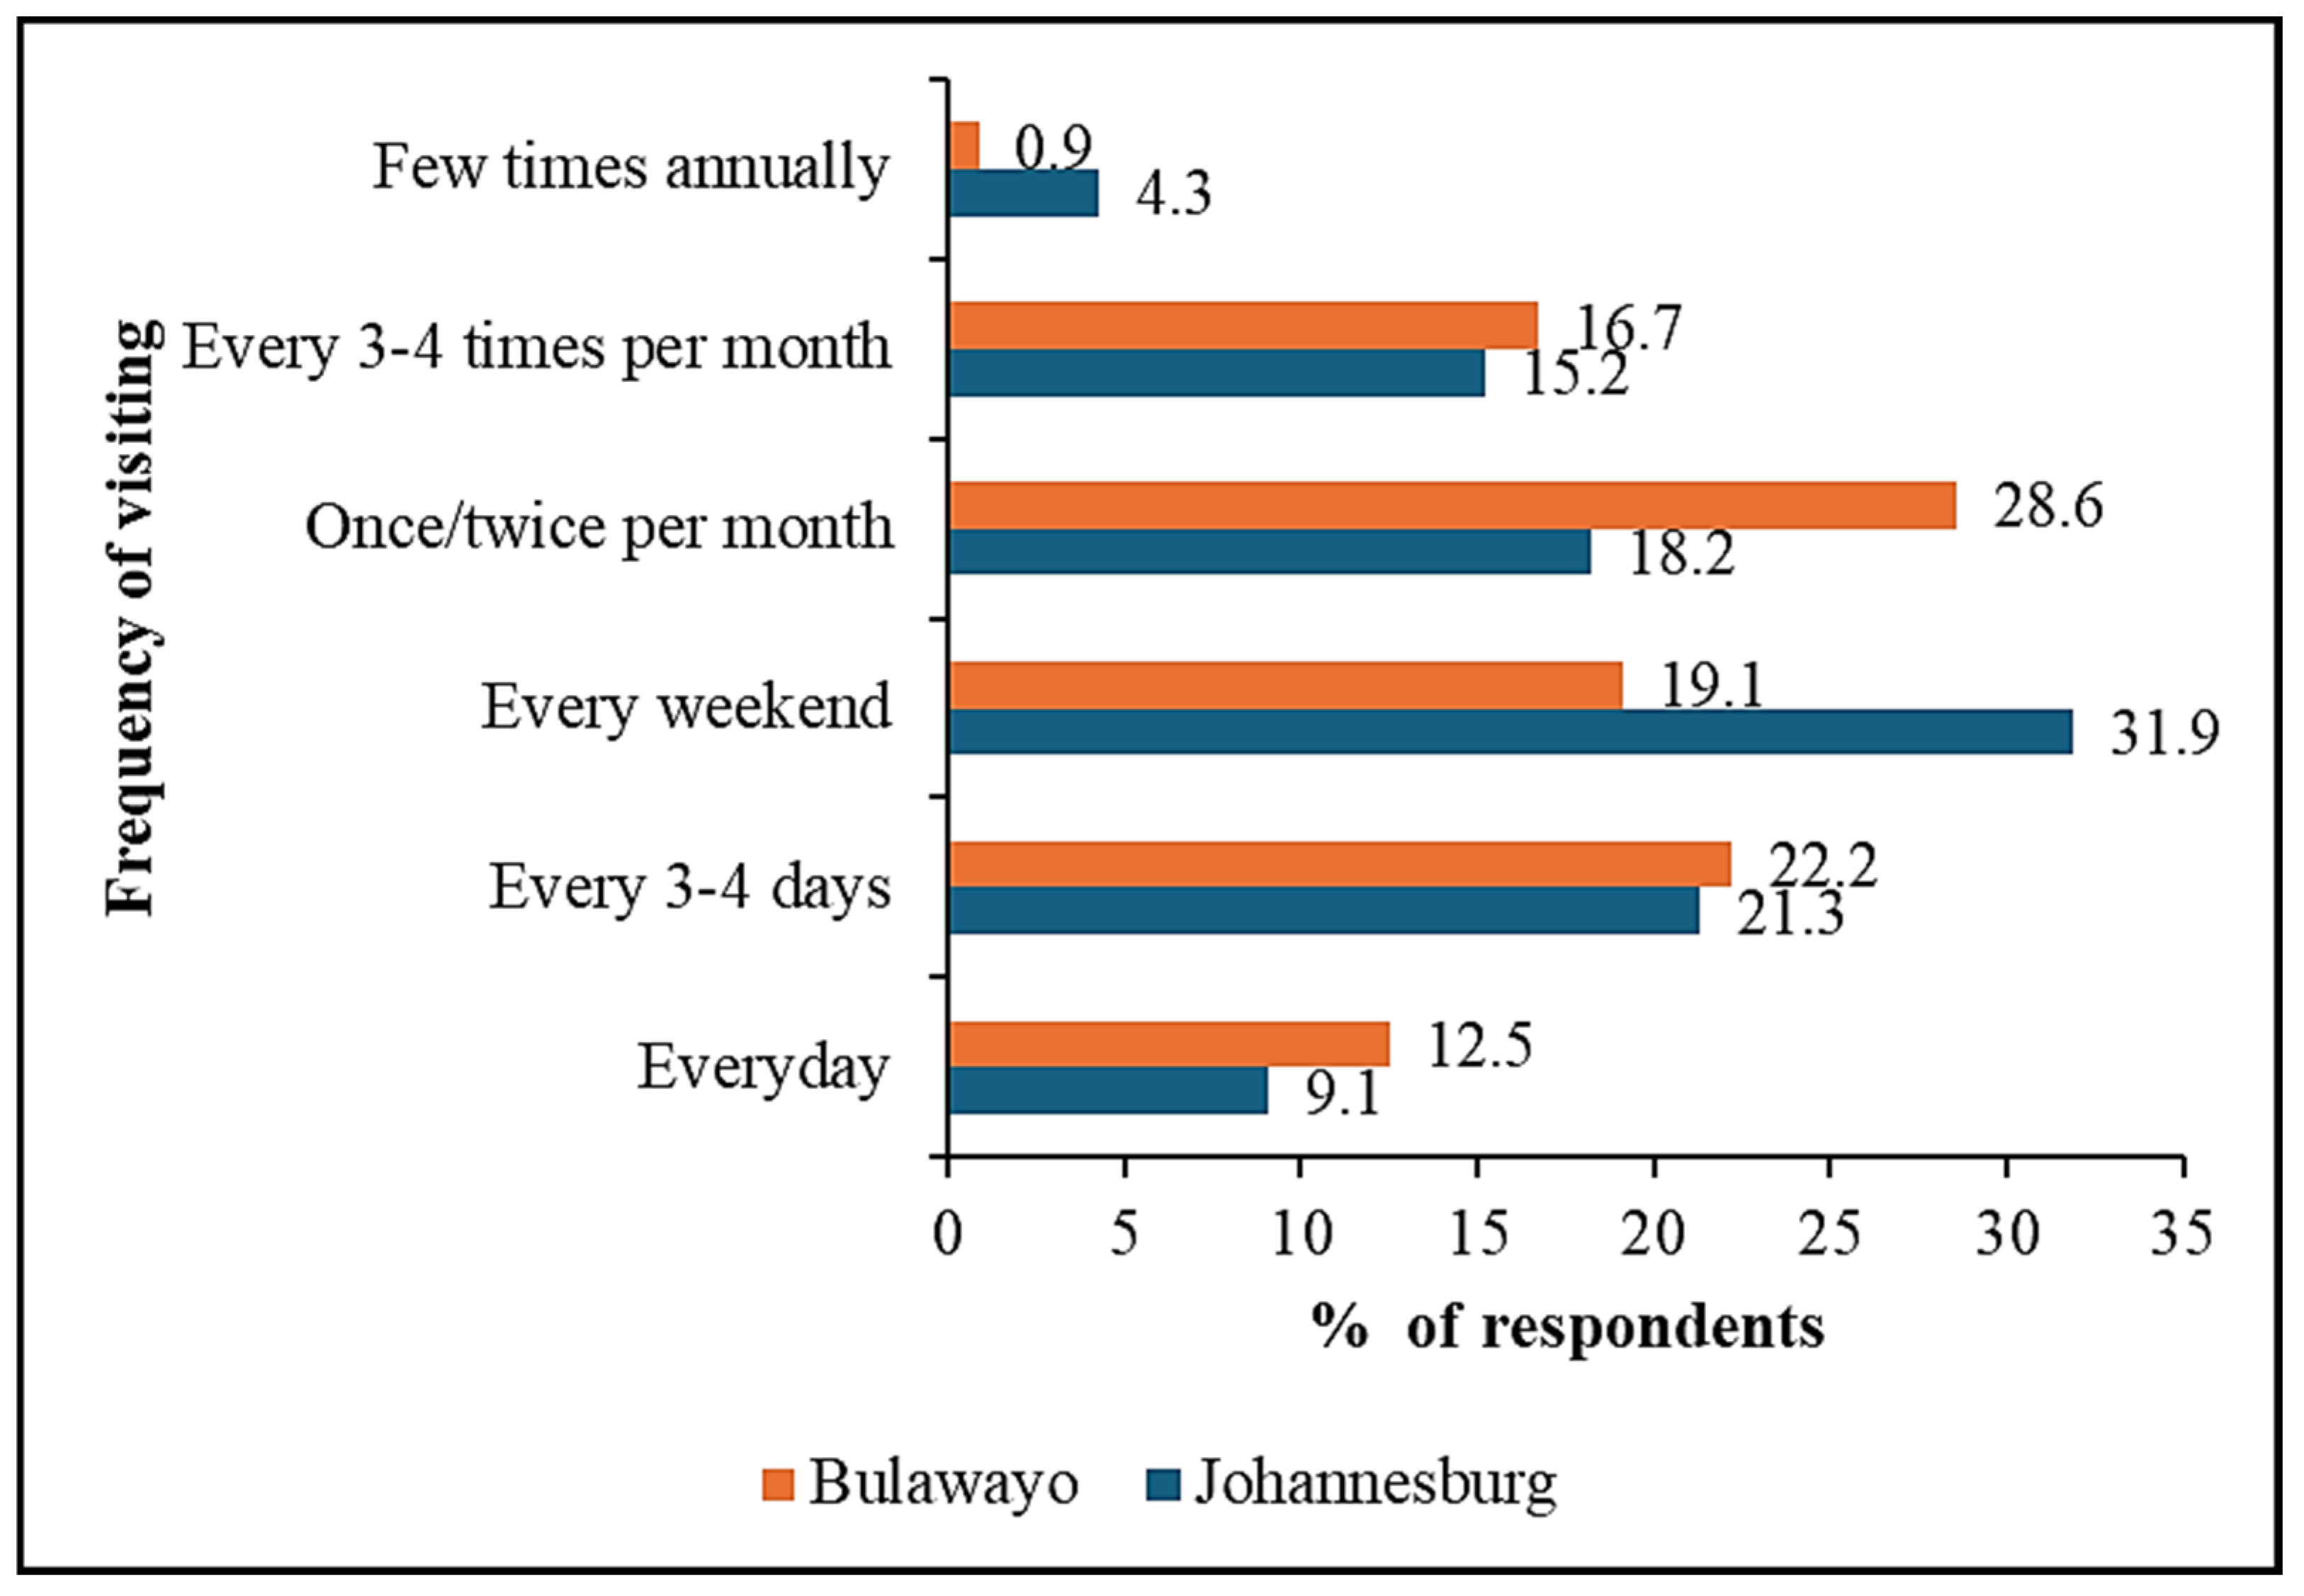
3.4. Frequency of Visiting Urban Green Spaces
3.5. Mode of Accessing Urban Green Spaces
4. Conclusions
Author Contributions
Funding
Institutional Review Board Statement
Informed Consent Statement
Data Availability Statement
Acknowledgments
Conflicts of Interest
Abbreviations
| UGS | Urban green space |
| UGSs | Urban green spaces |
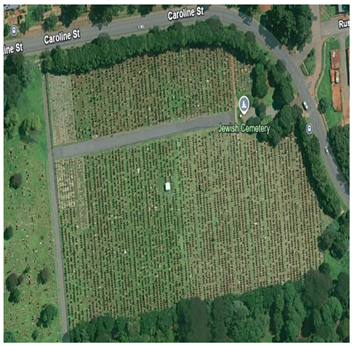
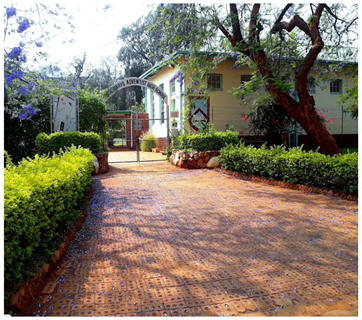
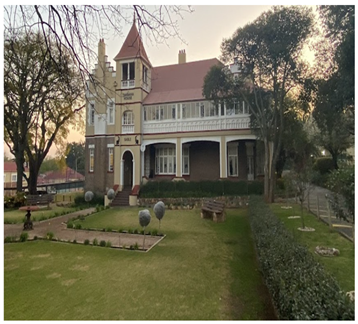
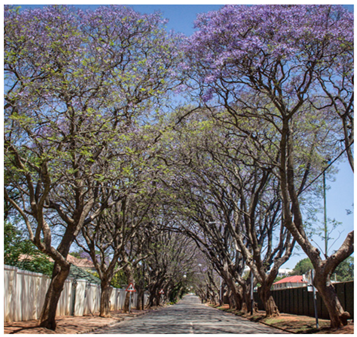
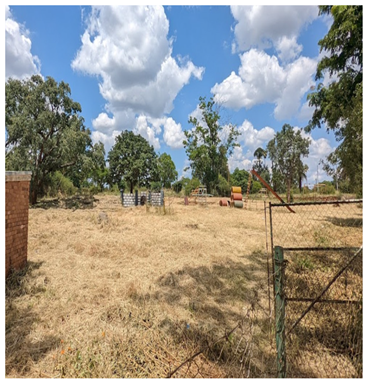
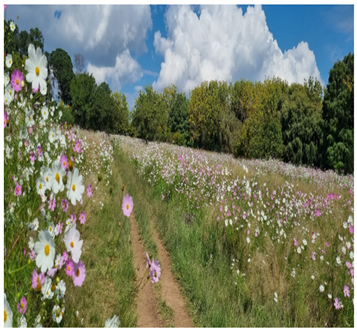
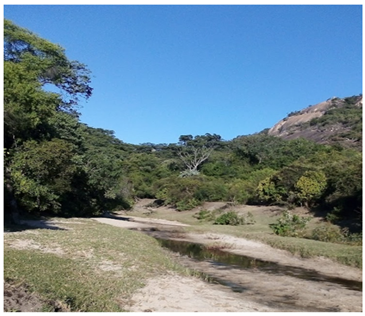
Appendix A. Visual Comparison of Some Types of Green Spaces in Bulawayo and Johannesburg
| Bulawayo Green Spaces | Johannesburg Green Spaces |
| Cemetery Green Spaces | |
 |  |
| Institutional Green Spaces | |
 |  |
| Street Treet | |
 |  |
| Parks | |
 | 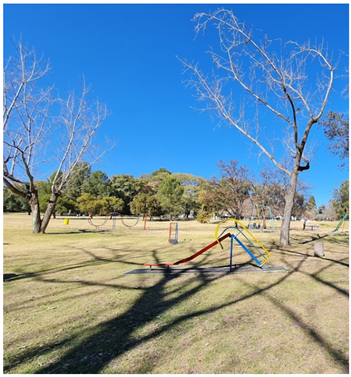 |
| Gardens | |
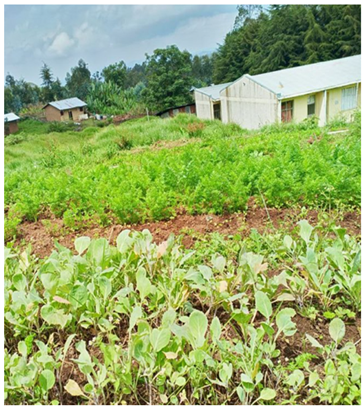 |  |
| Informal Green space | |
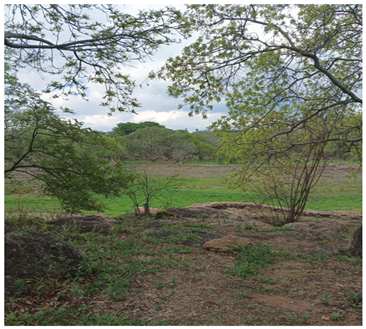 |  |
| Reparian Zone | |
 | 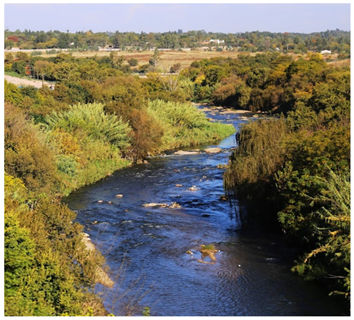 |
| Source: Google Earth: https://shorturl.at/R2mzB and survey | |
Appendix B. Household Survey Questionnaire and Key Informants Interview Guide
- Date of survey_______________________ Suburb________________________________
- Green space_________________________ Questionnaire no_______________________
Research Project Title: An Assessment of the Distribution, Contribution, and Management of Urban Green Spaces to Local Livelihoods of Bulawayo (Zimbabwe) and Johannesburg (South Africa)
- A. Knowledge of Urban Green Spaces.
- A1. What is an urban green space?____________________________________________________________________________________________________________________________________________________________
- A2. Which ones do you consider as urban green spaces? (Please tick all applicable boxes)
Street trees
Cemeteries
Woodlands
School GroundsWastelands
Institutional green space
Parks
Domestic GardensCommonages
Informal recreational areas
Green roofs
Reparian ZoneOther (specify) - A3. Are urban green spaces important?
Yes No - A4. Give a reason for your answer above.____________________________________________________________________________________________________________________________________________________________
- B. Accessibility of green spaces.
- B1. How often do you visit the above mentioned urban green space? (tick one answer)
everyday Every 3-4 days Every weekend Once/twice per month Every 3-4 times per month Few times annually Never - B2. How far away is your closest urban green space?
˂500 m 500 m–1 km 1 km–1.5 km 1.5 km–2 km ˃2 km - B3. Are there enough urban green spaces in your area?
Yes No - B4. Why?____________________________________________________________________________________________________________________________________________________________
- B5. Are urban green spaces in your town/area/neighbourhood in equal abundance/distribution?
Yes No Don’t know - B6. If no, which part of your area has more/many green spaces?____________________________________________________________________________________________________________________________________________________________
- B7. Is there any green space at your home?
Yes No - B8. If yes, how may percent of your property is covered with green space? (tick one)
˂10% 10–40% 40–50% ˃50% - B9. Other than the green space in your area, do you visit other green spaces?
Yes No - B10. What causes you to visit other green spaces?
Proximity (nearby) It’s quiet Better security/safety Cool temperatures Good aesthetic appeal Sound of nature (birds/blowing trees) Good maintenance Others (specify) It’s amenities - B11. How do you to the green space?
Bicycle Taxi Bus Private vehicles Walking/jogging others - C. Uses of this green space.
- C1. What is the main purpose of visiting this green space?
To breath fresh air To collect wild fruits Spiritual worshipping To collect building material Relaxing in the shade To relax with friends/relatives For exercising (jogging/sports/touring) For partying For collecting medical products To enjoy the beauty of nature To collect firewood Others (specify) - C2. Have you ever participated in any economic activities (eg selling products, conducting classes)?
Yes No - C3. If yes, please elaborate.____________________________________________________________________________________________________________________________________________________________
- C4. Do you perceive any economic opportunities linked to the presence of green spaces in your community?
Yes No - C5. If your answer is yes, please explain.____________________________________________________________________________________________________________________________________________________________
- C6. In what ways do urban green spaces contribute to local businesses of job opportunities within your neighbourhood?____________________________________________________________________________________________________________________________________________________________
- C7. Have you noticed any improvements in property values or housing demand due to the presence of nearby green space?
Yes No - C8. How do you think access to urban green spaces affects your ability to balance work and leisure time?
Positively Negatively - C9. Explain your answer in question C8 (give the reason).____________________________________________________________________________________________________________________________________________________________
- C10. How do you perceive the role of urban green spaces in promoting social interactions and community bonding?
Positively Negatively - C11. Explain your answer in C10.____________________________________________________________________________________________________________________________________________________________
- C12. Have you ever participated in community events or gatherings that took place in urban green spaces?
Yes No - C13. If yes, tick the box with the type of event.
Partying Burial societies Political meeting Cultural activities Church services Others (specify) Sport activities - C14. Do you think that the availability of green spaces influences the sense of belonging and attachment to your community?
Yes No - C15. How have urban green spaces contributed to cultural or recreational activities within your neighbourhood?____________________________________________________________________________________________________________________________________________________________
- C16. What aspects of urban green spaces do you find most appealing or essential for your well-being and quality of life?
Fresh air Detaching your mind from stress Viewing animals/birds Watching other people enjoying Relaxation Others (specify) Good place for spiritual meditation Others (specify) Good place for thinking Others (specify) - D. Identification of different types of urban green spaces.
- D1. Which type of urban green space is found in your neighbourhood? (tick where applicable)
Road verges Parks/greenbelts Riparian zone Green roofs Woodlands Wastelands Commonages Domestic gardens Cemetery Churchyards Institutional green space (school/hospital) Informal recreational Street trees/row of trees Others (specify) wetlands - E. Perceptions of green spaces.
- E1. What is your perception about this green space. Please rate your level of agreement regarding the different perceptions.
Statement SA A N D SD This green space is safe during the day This green is dangerous during the night The green space is clean and well maintained There are enough amenities in this green space (e.g., benches and litter bins) It is easily accessible There is enough vegetation density in this green space It is important for hosting community activities such as meetings, partying, praying etc This green space cools down temperature since it is a carbon sink This green space is quiet and peaceful This green space is highly respected by community members - Key
SA- Strongly Agree A- Agree N- Neutral D- Disagree SD- Strongly Disagree - F. Changes and maintenance of green spaces.
- F1. Have you noticed any changes to this green space?
Yes No - F2. If yes, indicate the changes.____________________________________________________________________________________________________________________________________________________________
- F3. What are the possible causes of these changes?____________________________________________________________________________________________________________________________________________________________
- F4. What should be done to maintain and preserve urban green spaces?____________________________________________________________________________________________________________________________________________________________
- F5. Did colonisation increase the number of plant species in your community?
Yes No - G. Demographic Information.
- G1. Gender?
Male Female - G2. State your age_________________
- G3. What is your highest qualification or level of education?____________________________________________________________________________________________________________________________________________________________
- G4. How long have you been in this place?____________________________________________________________________________________________________________________________________________________________
- G5. Are you working?
Yes No - G6. If working, what is your occupation?____________________________________________________________________________________________________________________________________________________________
- G7. Were you born in this area?
Yes No
- THANK YOU FOR YOUR CONTRIBUTION!
- Key Informant Interview Guide
- NB: You have the right to stop and quit the interview. Participation is voluntary.
- Interview Guide for councilors, teachers and municipality workers
- How often do you visit your community’s urban green spaces, such as parks or gardens?
- Do urban green spaces offer a sense of escape or respite for urban life? Please provide examples.
- Do you have residents who participate in any economic activities (such as selling products, playing competitive games, conducting classes, etc) related to urban green spaces? If yes, please elaborate.
- How do you perceive the role of urban green spaces in promoting social interactions and community bonding?
- Do you perceive any economic opportunities linked to the presence of green spaces in your community? Please explain.
- Have you ever participated in community events or gatherings that took place in urban green spaces within your jurisdiction? What was your experience like?
- Are there any challenges experienced in the management of urban green spaces?
- Give examples of vegetation and animal species in this green space.
- How does colonization influence species richness?
- Interview guide for the police
- Are there any criminal activities committed in the urban green spaces within your area?
- How often do you monitor or safeguard urban green spaces such as parks (green belts)?
- In your own opinion, do urban green spaces reduce or increase crime rate? Please explain.
- What should be done to safeguard urban green spaces?
References
- Addas, A. Influence of urban green spaces on quality of life and health with smart design. Land 2023, 12, 960. [Google Scholar] [CrossRef]
- Opoku, S.A.; Manu, K.K.; Asibey, M.O.; Amponsah, O. Tragedy of urban green spaces depletion in selected sub-Saharan African major cities. J. Afr. Stud. Dev. 2023, 15, 46–61. [Google Scholar] [CrossRef]
- Ngolo, A.M.E.; Wanatabe, T. Integrating geographic information systems, remote sensing, and machine learning techniques to monitor urban expansion, An application to Luanda, Angola. Geo-Spat. Inf. Sci. 2022, 26, 446–464. [Google Scholar] [CrossRef]
- Mwageni, N.; Kuinsi, R. Green spaces in residential areas of Dar es Salaam City: Types, Coverage and uses. J. Sustain. Dev. 2021, 14, 121. [Google Scholar] [CrossRef]
- Mensah, C.A. Urban Green Spaces in Africa: Nature and Challenges. Int. J. Ecosyst. 2014, 1, 1–11. [Google Scholar]
- Sun, Y.; Saha, S.; Tost, H.; Kong, X.; Xu, C. Literature Review Reveals a Global Access Inequity to Urban Green Spaces. Sustainability 2022, 14, 1062. [Google Scholar] [CrossRef]
- Jabbar, M.; Yusoff, M.M.; Shafie, A. Assessing the role of urban green spaces for human well-being: A systematic review. Geo-J. 2022, 90, 4405–4423. [Google Scholar] [CrossRef]
- Atiqq Haq, S.M.; Islam, M.N.; Sidhannta, A.; Ahmed, K.J.; Choudrey, M.T.A. Public Perception of green spaces: Convergences and Divergence. Front. Sustain. Cities 2022, 3, 1–13. [Google Scholar] [CrossRef]
- Barrera, F.; Reyes Paeke, S.; Harris, J.; Buscanian, D.; Farias, J.M. Peoples’ perceptions influences on the use of urban green spaces in socially economically different neighbourhoods. Urban For. Urban Green. 2016, 20, 254–264. [Google Scholar] [CrossRef]
- Russo, A. Urban green spaces and health living, A landscape architecture perspective. Urban Sci. 2024, 8, 213. [Google Scholar] [CrossRef]
- Falayi, M.; Shackleton, S.E.; Kemp, G.C.; Shackleton, C.M. Changes in household use and sale of locally collected environmental resources over a 15-year period in rural village, South Africa. For. Trees Livelihoods 2019, 12, 90–107. [Google Scholar] [CrossRef]
- Guiffre, L.; Bonafina, C.; Vespasiano, C.; Ciarlo, E.A. Social impact of urban green spaces. IOSR J. Humanit. Soc. Sci. 2019, 24, 29–35. [Google Scholar] [CrossRef]
- Radebe, D.S. An assessment of amount, distribution and use of urban green spaces in small towns of the Eastern Cape. Master’s Thesis, Rhodes University, Grahamstown, South Africa, 2018; pp. 1–60. Available online: https://rb.gy/2rlz1o (accessed on 1 June 2018).
- Ngulani, T.; Shackleton, C. Use of public urban green spaces for spiritual services in Bulawayo, Zimbabwe. Urban For. Urban Green. 2018, 38, 97–104. [Google Scholar] [CrossRef]
- Huang, B.X.; Chiou, S.C.; Li, W.Y. Landscape pattern and ecological network structure in urban green space planning: A case study of Fuzhou city. Land 2021, 10, 769. [Google Scholar] [CrossRef]
- Wakuru, M. Urbanisation and its impacts on food systems and environmental sustainability in urban space, Evidence from urban agriculture livelihoods in Dar es Salam, Tanzania. J. Environ. Prot. 2023, 4, 1137–1148. [Google Scholar]
- Arshad, S.; Ahmad, S.R.; Abbas, S.; Asharf, A.; Siddiqui, N.A.; Islam, Z.L. Quantifying the contribution of diminishing green spaces and urban sprawl to urban heat island effect in a rapidly urbanizing metropolitan city of Pakistan. Land Use Policy 2022, 113, 2–12. [Google Scholar] [CrossRef]
- Knobel, P.; Maneja, R.; Bartoll, X.; Alonso, L.; Bauwelinck, M.; Valentin, A.; Zijlema, W.; Borrell, C.; Nieuwenhuijsen, M.; Dadvand, P. Quality of urban green spaces influences residents’ use of these spaces, physical activity, and overweight/obesity. Environ. Pollut. 2021, 271, 2–7. [Google Scholar] [CrossRef]
- Chari, F.; Ngcamu, B.S. Achieving social inclusion for vulnerable urban residents through community gardens: A case of Bulawayo city, Zimbabwe. Local Environ. 2024, 6, 766–775. [Google Scholar] [CrossRef]
- ZimStats. Administrative Map of Zimbabwe. 2022. Available online: https://encr.pw/Y8iDu (accessed on 20 April 2022).
- Mushore, T.D.; Mutanga, O.; Odindi, J. Understanding Growth-Induced Trends in Local Climate Zones, Land Surface Temperature, and Extreme Temperature Events in a Rapidly Growing City: A Case of Bulawayo Metropolitan City in Zimbabwe. Front. Environ. Sci. 2022, 10, 2–4. [Google Scholar] [CrossRef]
- Statistics South Africa. Improving Lives Through Data Ecosystems. 2022. Available online: https://www.statssa.gov.za/ (accessed on 2 February 2022).
- Vogel, C.; Mukute, M.; Coetzer, K.; Gwata, M. Creating a climate of change in the City of Johannesburg: Co-learning to adapt to climate change. S. Afr. J. Sci. 2021, 117, 2–11. [Google Scholar] [CrossRef]
- Selanon, P.; Chuangchai, W. The importance of urban green spaces in enhancing holistic health and sustainable well-being for people with disabilities: A Narrative Review. Buildings 2023, 13, 2100. [Google Scholar] [CrossRef]
- Bryman, A. Social Research Methods, 4th ed.; Oxford University Press: Oxford, UK, 2012; Available online: https://openlibrary.org/books/OL25298852M/Social_research_methods (accessed on 9 August 2012).
- Rajab, B.S.; Jahlan, R.A.; Mobarki, A.M.; Alhazmi, O.A.; Hakami, E.F.; Shayari, W.H.; Darabshi, N.A.; Basamad, A.K.; Alhazmi, A.H. Assessment of knowledge, attitudes, and practices regarding microbiota composition and influencing factors among the general population in Jazan province: A cross-sectional study. J. Adv. Vet. Anim. Res. 2023, 10, 773–781. [Google Scholar] [CrossRef]
- Markum, R.B.; Wolf, S.; Claisse, C.; Hoefer, M. Mediating the Sacred: Configuring a Design Space for Religious and Spiritual Tangible Interactive Artifacts. In Proceedings of the Eighteenth International Conference on Tangible, Embedded, and Embodied Interaction, Cork, Ireland, 11–14 February 2024; ACM International Conference Proceeding Series. 5, pp. 1–22. [Google Scholar] [CrossRef]
- Derkzen, M.L.; Ja Van, T.; Nagendra, H.; Verburg, P.H. Shifting roles of urban green spaces in the context of urban development and global change. Curr. Opin. Environ. Sustain. 2017, 29, 32–39. [Google Scholar] [CrossRef]
- Pedrosa, E.L.J.; Okyere, S.A.; Frimpong, L.K.; Diko, S.K.; Commodore, T.S.; Kita, M. Planning for Informal Urban Green Spaces in African Cities: Children’s Perception and Use in Peri-Urban Areas of Luanda, Angola. Urban Sci. 2021, 5, 50. [Google Scholar] [CrossRef]
- Harris, J.; Tan, W.; Raneri, J.E.; Schreinemachers, P.; Herforth, A. Vegetables for Healthy Diets in Low- and Middle-Income Countries: A Scoping Review of the Food Systems Literature. In Food and Nutrition Bulletin; SAGE Publications Inc.: Thousand Oaks, CA, USA, 2022; Volume 43, pp. 232–248. [Google Scholar] [CrossRef]
- Abrahams, C.; Everett, D. City Profile: Johannesburg, South Africa. Environ. Urban ASIA 2019, 10, 255–270. [Google Scholar]
- Xu, J.; Xu, J.; Wang, F.; Chen, I.; Zhang, W. Perceived urban green and resident’s health in Beijing. SSM Popul. Health 2021, 14, 100790. [Google Scholar] [CrossRef]
- Yao, W.; Zhang, X.; Gong, Q. The effect of exposure to the natural environment on stress reduction: A meta-analysis. Urban For. Urban Green. 2021, 57, 126932. [Google Scholar] [CrossRef]
- Hoyle, H.; Jorgensen, A.; Hitchmough, J.D. What determines how we see nature? Perceptions of Naturalness in urban green spaces. People Nat. 2019, 1, 167–180. [Google Scholar] [CrossRef]
- Venter, Z.S.; Barton, D.N.; Gundersen, V.; Figari, H.; Nowell, M.S. Back to nature: Norwegians sustain increased recreational use of urban green space months after the COVID-19 outbreak. Landsc. Urban Plan. 2021, 214, 104175. [Google Scholar] [CrossRef]
- Vikram, L.; Bhardwaj, M. Assessment of Urban Wastelands using GIS and IoT as Tools for Spatial Data Analysis. Curr. World Environ. 2023, 18, 893–903. [Google Scholar] [CrossRef]
- Edeigba, B.; Ashinze, U.K.; Umoh, A.A.; Biu, P.W. Urban green spaces and their impact on environmental health, A Global Review. World J. Adv. Res. Rev. 2024, 21, 917–927. [Google Scholar] [CrossRef]
- Wooster, E.I.F.; Fleck, R.; Torpy, F.; Ramp, D.; Irga, P.J. Urban green roofs promote metropolitan biodiversity: A comparative case study. Build. Environ. 2022, 207, 108458. [Google Scholar] [CrossRef]
- Liu, D.; Li, H.; Qiu, M.; Liu, Y. Understanding coupled coordination relationships between social and ecological functions of urban green spaces. Geo-Spat. Inf. Sci. 2023, 26, 431–445. [Google Scholar] [CrossRef]
- Song, P.; Kim, G.; Mayer, A.; He, R.; Tian, G. Assessing the ecosystem services of various types of urban green spaces based on i-Tree Eco. Sustainability 2020, 12, 1630. [Google Scholar] [CrossRef]
- Wen, H.; Zhang, Y.; Zhang, L. Assessing amenity effects of urban landscapes on housing price in Hangzhou, China. Urban For. Urban Green 2015, 14, 1017–1026. [Google Scholar] [CrossRef]
- Mukherjee, M.; Takara, K. Urban green spaces as a countermeasure to increasing urban risk and the UGS-3CC resilience framework. Int. J. Disaster Risk Reduct. 2018, 28, 854–861. [Google Scholar] [CrossRef]
- Gascon, M.; Triguero-Mas, M.; Martinez, M.; Dadvand, P.; Forns, J.; Plasencia, A. Mental health benefits of long-term exposure to residential green and blue spaces, a systematic review. Int. J. Environ. 2015, 12, 4354–4379. [Google Scholar] [CrossRef]
- Fabella, F.E. The Love Attitude that Influences One’s Happiness: The Relationship Between Love Attitude Scale Scores and Oxford Happiness Scores of Selected College Students. Galore Int. J. Appl. Sci. Humanit. 2023, 7, 7–14. [Google Scholar] [CrossRef]
- Jennings, V.; Rigolon, A.; Thompson, J.; Murray, A.; Henderson, A.; Gragg, R.S. The Dynamic Relationship between Social Cohesion and Urban Green Space in Diverse Communities: Opportunities and Challenges to Public Health. Int. J. Environ. Res. Public Health 2024, 21, 800. [Google Scholar] [CrossRef]
- Narh, S.N.; Takyi, S.A.; Asibey, M.O.; Amponsah, O. Garden city without parks: An assessment of the availability and conditions of parks in Kumasi. Urban For. Urban Green. 2020, 55, 126819. [Google Scholar] [CrossRef]

| Johannesburg | Bulawayo | ||
|---|---|---|---|
| Name of Green Space | No of Respondents | Name of Green Space | No of Respondents |
| Bezuidenhout Park | 66 | Centenary Park | 66 |
| Delta Park | 66 | Hillside Park | 65 |
| Kya Sand | 65 | Luveve Park | 66 |
| Rhodes Park | 66 | Nkulumane Park | 66 |
| Thokoza Park | 66 | Queens Park | 66 |
| Total | 329 | Total | 329 |
| Demographic | Characteristic or Variable | Bulawayo (%) | Johannesburg (%) |
|---|---|---|---|
| Sex | Female | 57.8 | 54.7 |
| Male | 42.2 | 45.3 | |
| Total | 100 | 100 | |
| Age (years) | 15–25 | 45.6 | 44.7 |
| 26–36 | 36.5 | 30.4 | |
| 37–47 | 15.2 | 17.0 | |
| 48–58 | 2.4 | 6.1 | |
| 59+ | 0.3 | 1.8 | |
| Total | 100 | 100 | |
| Level of education | Primary | 10.3 | 29.2 |
| High school | 54.7 | 47.7 | |
| Tertiary | 35.9 | 23.1 | |
| No schooling | 0.0 | 0.0 | |
| Total | 100 | 100 | |
| Period of stay in the community (years) | 5–10 | 24.3 | 56.2 |
| 11–15 | 45.6 | 24.9 | |
| 16+ | 30.1 | 18.9 | |
| Total | 100 | 100 | |
| Occupation | Formal job | 9.1 | 20.4 |
| Informal job | 63.8 | 49.2 | |
| Unemployed | 27.1 | 30.4 | |
| Total | 100 | 100 |
| Methods of Visiting UGSs | ||||
|---|---|---|---|---|
| Bulawayo | Johannesburg | |||
| Walking or jogging | 246 | 74.8 | 107 | 32.5 |
| Bicycle | 15 | 4.6 | 72 | 21.9 |
| Private vehicles | 36 | 10.9 | 67 | 20.1 |
| Taxi | 20 | 6.1 | 42 | 12.8 |
| Bus | 12 | 3.6 | 41 | 12.5 |
| Total | 329 | 100 | 329 | 100 |
Disclaimer/Publisher’s Note: The statements, opinions and data contained in all publications are solely those of the individual author(s) and contributor(s) and not of MDPI and/or the editor(s). MDPI and/or the editor(s) disclaim responsibility for any injury to people or property resulting from any ideas, methods, instructions or products referred to in the content. |
© 2025 by the authors. Licensee MDPI, Basel, Switzerland. This article is an open access article distributed under the terms and conditions of the Creative Commons Attribution (CC BY) license (https://creativecommons.org/licenses/by/4.0/).
Share and Cite
Maphosa, S.N.; Nkosi, S.E.; Chabalala, Y. Impact of Urban Green Spaces on the Livelihoods of Residents in Bulawayo and Johannesburg Cities. Urban Sci. 2025, 9, 194. https://doi.org/10.3390/urbansci9060194
Maphosa SN, Nkosi SE, Chabalala Y. Impact of Urban Green Spaces on the Livelihoods of Residents in Bulawayo and Johannesburg Cities. Urban Science. 2025; 9(6):194. https://doi.org/10.3390/urbansci9060194
Chicago/Turabian StyleMaphosa, Shepard Nyamambi, Sellina Ennie Nkosi, and Yingisani Chabalala. 2025. "Impact of Urban Green Spaces on the Livelihoods of Residents in Bulawayo and Johannesburg Cities" Urban Science 9, no. 6: 194. https://doi.org/10.3390/urbansci9060194
APA StyleMaphosa, S. N., Nkosi, S. E., & Chabalala, Y. (2025). Impact of Urban Green Spaces on the Livelihoods of Residents in Bulawayo and Johannesburg Cities. Urban Science, 9(6), 194. https://doi.org/10.3390/urbansci9060194