Article

Formulation of Urban Growth Scenarios for Middle-Sized Cities Towards Metropolization: The Case of Puerto Montt, Los Lagos Region

by
Mauricio Morales
1,*,
Francisco Maturana
2,
Severino Escolano
1 and
Fernando Peña-Cortés
3
1
Department of Geography and Spatial Planning, University of Zaragoza, 50009 Zaragoza, Spain
2
Institute of Earth Sciences, University Austral of Chile, Valdivia 5090000, Chile
3
Territorial Planning Laboratory, Department of Environmental Sciences, School of Natural Resources, Catholic University of Temuco, Temuco 4810399, Chile
*
Author to whom correspondence should be addressed.
Urban Sci. 2025, 9(5), 165; https://doi.org/10.3390/urbansci9050165
Submission received: 15 March 2025 / Revised: 6 May 2025 / Accepted: 7 May 2025 / Published: 12 May 2025

Abstract

This study models changes in land cover and land use in the intermediate city of Puerto Montt, Chile, up to 2050. Three distinct time periods—1988, 2005, and 2020—were used to examine Puerto Montt’s urban growth during these years. These periods were described using the Local Climate Zones (LCZ) technique. Urban growth scenarios were simulated using the Patch-generating Land Use Simulation (PLUS) model. Using Machine Learning (ML) techniques, this model has been widely utilized to explain how urban growth patterns have evolved based on the dynamics that drive changes in land use and land cover. Three scenarios were developed for this study: Business-As-Usual (BAU) (S1), Urban-Regional Planning (S2), and Conservationist (S3). According to the findings, Puerto Montt is predicted to undergo morphological changes by 2050, shifting from rural areas primarily composed of woods and agricultural land to open, low-density, low-rise areas outside the municipal limits set by the Communal Regulatory Plans. According to this study, Puerto Montt’s relative entropy level was high, ranging from 0.87 to 0.96, with a maximum value of 1.00 by 2050. These findings are anticipated to provide planners and decision-makers with further knowledge on the territorial design of upcoming urban areas.

1. Introduction

Urbanization is advancing worldwide, and its impact extends far beyond urban spaces [1]. According to UN-Habitat III [2], the global urban population is expected to nearly double by 2050, making urbanization one of the most transformative trends of the 21st century. Urbanization in southern Chile has profoundly transformed its cities, generating both progress and challenges [3]. On the one hand, it has driven economic growth and the modernization of infrastructure, improving access to basic services, healthcare, education, and transportation [1]. However, this process has also brought negative consequences, such as unplanned urban sprawl, increased pressure on the environment, loss of green spaces, and pollution of bodies of water [4]. In addition to this, housing problems, traffic congestion, and growing social fragmentation are marked by segregation between sectors with differing levels of access to opportunities and quality of life [5].
Currently, there are methodologies that integrate different scales (local or regional), allowing for the analysis of the dynamics of this process by understanding the effects generated by future land use/land cover changes based on their classification [6]. These methodologies influence the modification of current territorial planning strategies [4,7,8].
Their application has increased through probabilistic methodologies [9], and studies have been further developed with new analyses that enable modeling of future land use/land cover change scenarios. These serve as tools to assess the potential impacts of urbanization demand on rural and natural environments in the future [10].
This urbanization process has affected not only metropolitan areas but also regions undergoing metropolization and smaller areas near urban zones [11,12,13].
The cities and territories of Latin America have been a clear example of such processes, driven by rapid peri-urban transformations and an accelerated expansion of urban boundaries into areas originally designated for agricultural activities and natural resource protection in the region’s major urban centers [14].
This phenomenon can be explained by the impacts of a neoliberal model and deregulation in planning instruments, which have resulted in dispersed urban areas, high levels of fragmentation, and significant pressure on areas of high ecological value [15,16]. This type of urban development is reflected, among other phenomena, in the proliferation of informal settlements on urban peripheries, which are particularly distinctive and visible in certain countries in the region [17].
In this regard, Chilean cities represent a paradigm case. The country has a high urbanization rate of approximately 87.8% [18]; however, it faces significant regulatory shortcomings that drive notable dynamics in built-up areas and urban expansion. These factors contribute to dispersed and fragmented growth, affecting both cities and their hinterlands beyond Chile’s three classic metropolitan areas (Santiago, Valparaíso, and Concepción) [19,20,21].
As a result, spatial models of land occupation and spatial relationships are being profoundly transformed, fostering new organizational logics of space in Chile [22].
One of the cities that has closely followed these processes and exhibited exceptional population dynamics compared to other cities in the country, due to an economy based on commerce and services sustained by the salmon commodity, is the city of Puerto Montt and its associated system of satellite cities [12].
This city has been characterized by urban transformation processes driven by differential growth patterns in consolidated urban areas, prioritizing the development of social housing over other types of residential solutions [23]. Additionally, there are high levels of fragmentation in rural territories, where single-family homes are developed in gated communities or isolated enclaves for wealthier sectors, largely due to amenity-driven migration [21].
This form of territorial organization was enabled by Decree Law 3516, enacted during the dictatorship (1980), which allowed rural land to be subdivided into plots as small as 5000 m2. This regulation has often enabled the proliferation of informal urban settlements, a trend that intensified in southern Chilean cities during the COVID-19 pandemic [17].
To guide this study, we raised one central question: How have profound changes in land use and occupation occurred in medium-sized cities, conditioned by economic processes and the absence of planning instruments?
The hypothesis of this research is that, over the past 30 years, an increase in the subdivision of rural areas originally designated for agricultural and forestry activities has led to the emergence of new urban centers outside the scope of planning. These areas are characterized by low-density construction and a dispersed distribution across the rural territory of Puerto Montt. By simulating these changes for 2050, the city is projected to form a new metropolitan space based on the conurbation of smaller populated areas with larger, higher-hierarchy zones.
To fill this knowledge gap, this article aims to understand the evolution of these processes and project future scenarios within such developmental contexts, contributing to the understanding of spatial urbanization models in Latin American settings.
The objective of this research is to simulate land use/land cover changes in medium-sized cities undergoing metropolization processes by 2050. Methodologically, this study first analyzes current land use/land cover changes in the urban system of Puerto Montt according to the Local Climate Zone (LCZ) classification scheme. Subsequently, different scenarios are simulated based on various drivers or constraints affecting land occupation patterns. Finally, urban expansion patterns for 2050 are analyzed using a concentric zone model to measure urban surface density.

2. Background

Rapid urbanization and its scattered patterns are significant factors contributing to biodiversity loss and fragmentation of natural habitats [24]. The southern macrozone of Chile has undergone significant transformations, as evidenced by the expansion of urban areas at the expense of agricultural land, which has also affected native forest cover [25]. This pattern presents a crucial challenge: to generate accurate knowledge about the evolution of land use and land cover to guide sustainable urban development policies that mitigate the environmental impact of city growth [24].
Various methodologies exist that integrate different scales (local or regional) to analyze urbanization processes by understanding the effects generated by future land use/land cover changes [4]. This approach is grounded in the potential these methodologies offer for territorial planning, thereby enabling more effective spatial planning [26].
In this regard, the use of such methodologies in urban and geographical studies provides a structured and systematic way to understand the complexity of urban systems, allowing researchers and planners to explore different outcomes and more robustly comprehend the interaction of the factors that influence urban development [27,28].
The development of these approaches can be traced back to the 1980s and the 1990s, with the emergence of probabilistic proposals aimed at measuring the impact of land use/land cover changes in a region or urban system, as well as the possibilities enabled by satellite imagery [9,29].
With the rise of Geographic Information Systems (ArcGIS, QGIS), programming libraries with spatial applications (Python (https://www.python.org/), R (https://www.r-project.org/), or Google Earth Engine), improved image resolution (e.g., Sentinel program), and increased computing capacity, studies have proliferated that not only aim to understand land use/land cover changes but also carry out spatial analyses based on future scenarios. These are conceived as tools to anticipate the impacts of urbanization demand on rural and natural environments [10,30].
In this context, simulation models such as Patch-generating Land Use Simulation (PLUS), SLEUTH, and FLUS—based on Cellular Automata (CA)—as well as newer approaches like Agent-Based Models (ABM) or system dynamics, have become consolidated [7,30], establishing themselves as key tools in prospective territorial studies.
A wide range of contributions [4,8,29,31] has thus been oriented toward developing simulations of land use/land cover change scenarios, emphasizing the importance of incorporating various driving or restricting forces, differentiated time horizons, and the inclusion of social, economic, political, and environmental variables [20], along with the application of diverse models.
One notable model is the Patch-generating Land Use Simulation (PLUS), proposed by Liang et al. [32], which offers the strength of simulating land use change through stochastic pixel-based movement modelling. This model has been applied in various studies, such as those of Wang et al. [33] and Feng et al. [34].
Numerous studies have employed these tools to analyze urban growth processes in medium-sized cities [7,13,19,20]. These studies have expanded their application to the analysis of spatial representations. However, little attention has been paid to the pressure exerted by crops and plantations on areas of high ecological value [14] or to how different types of construction in rural areas are rapidly consuming agricultural land [21].

3. Materials and Methods
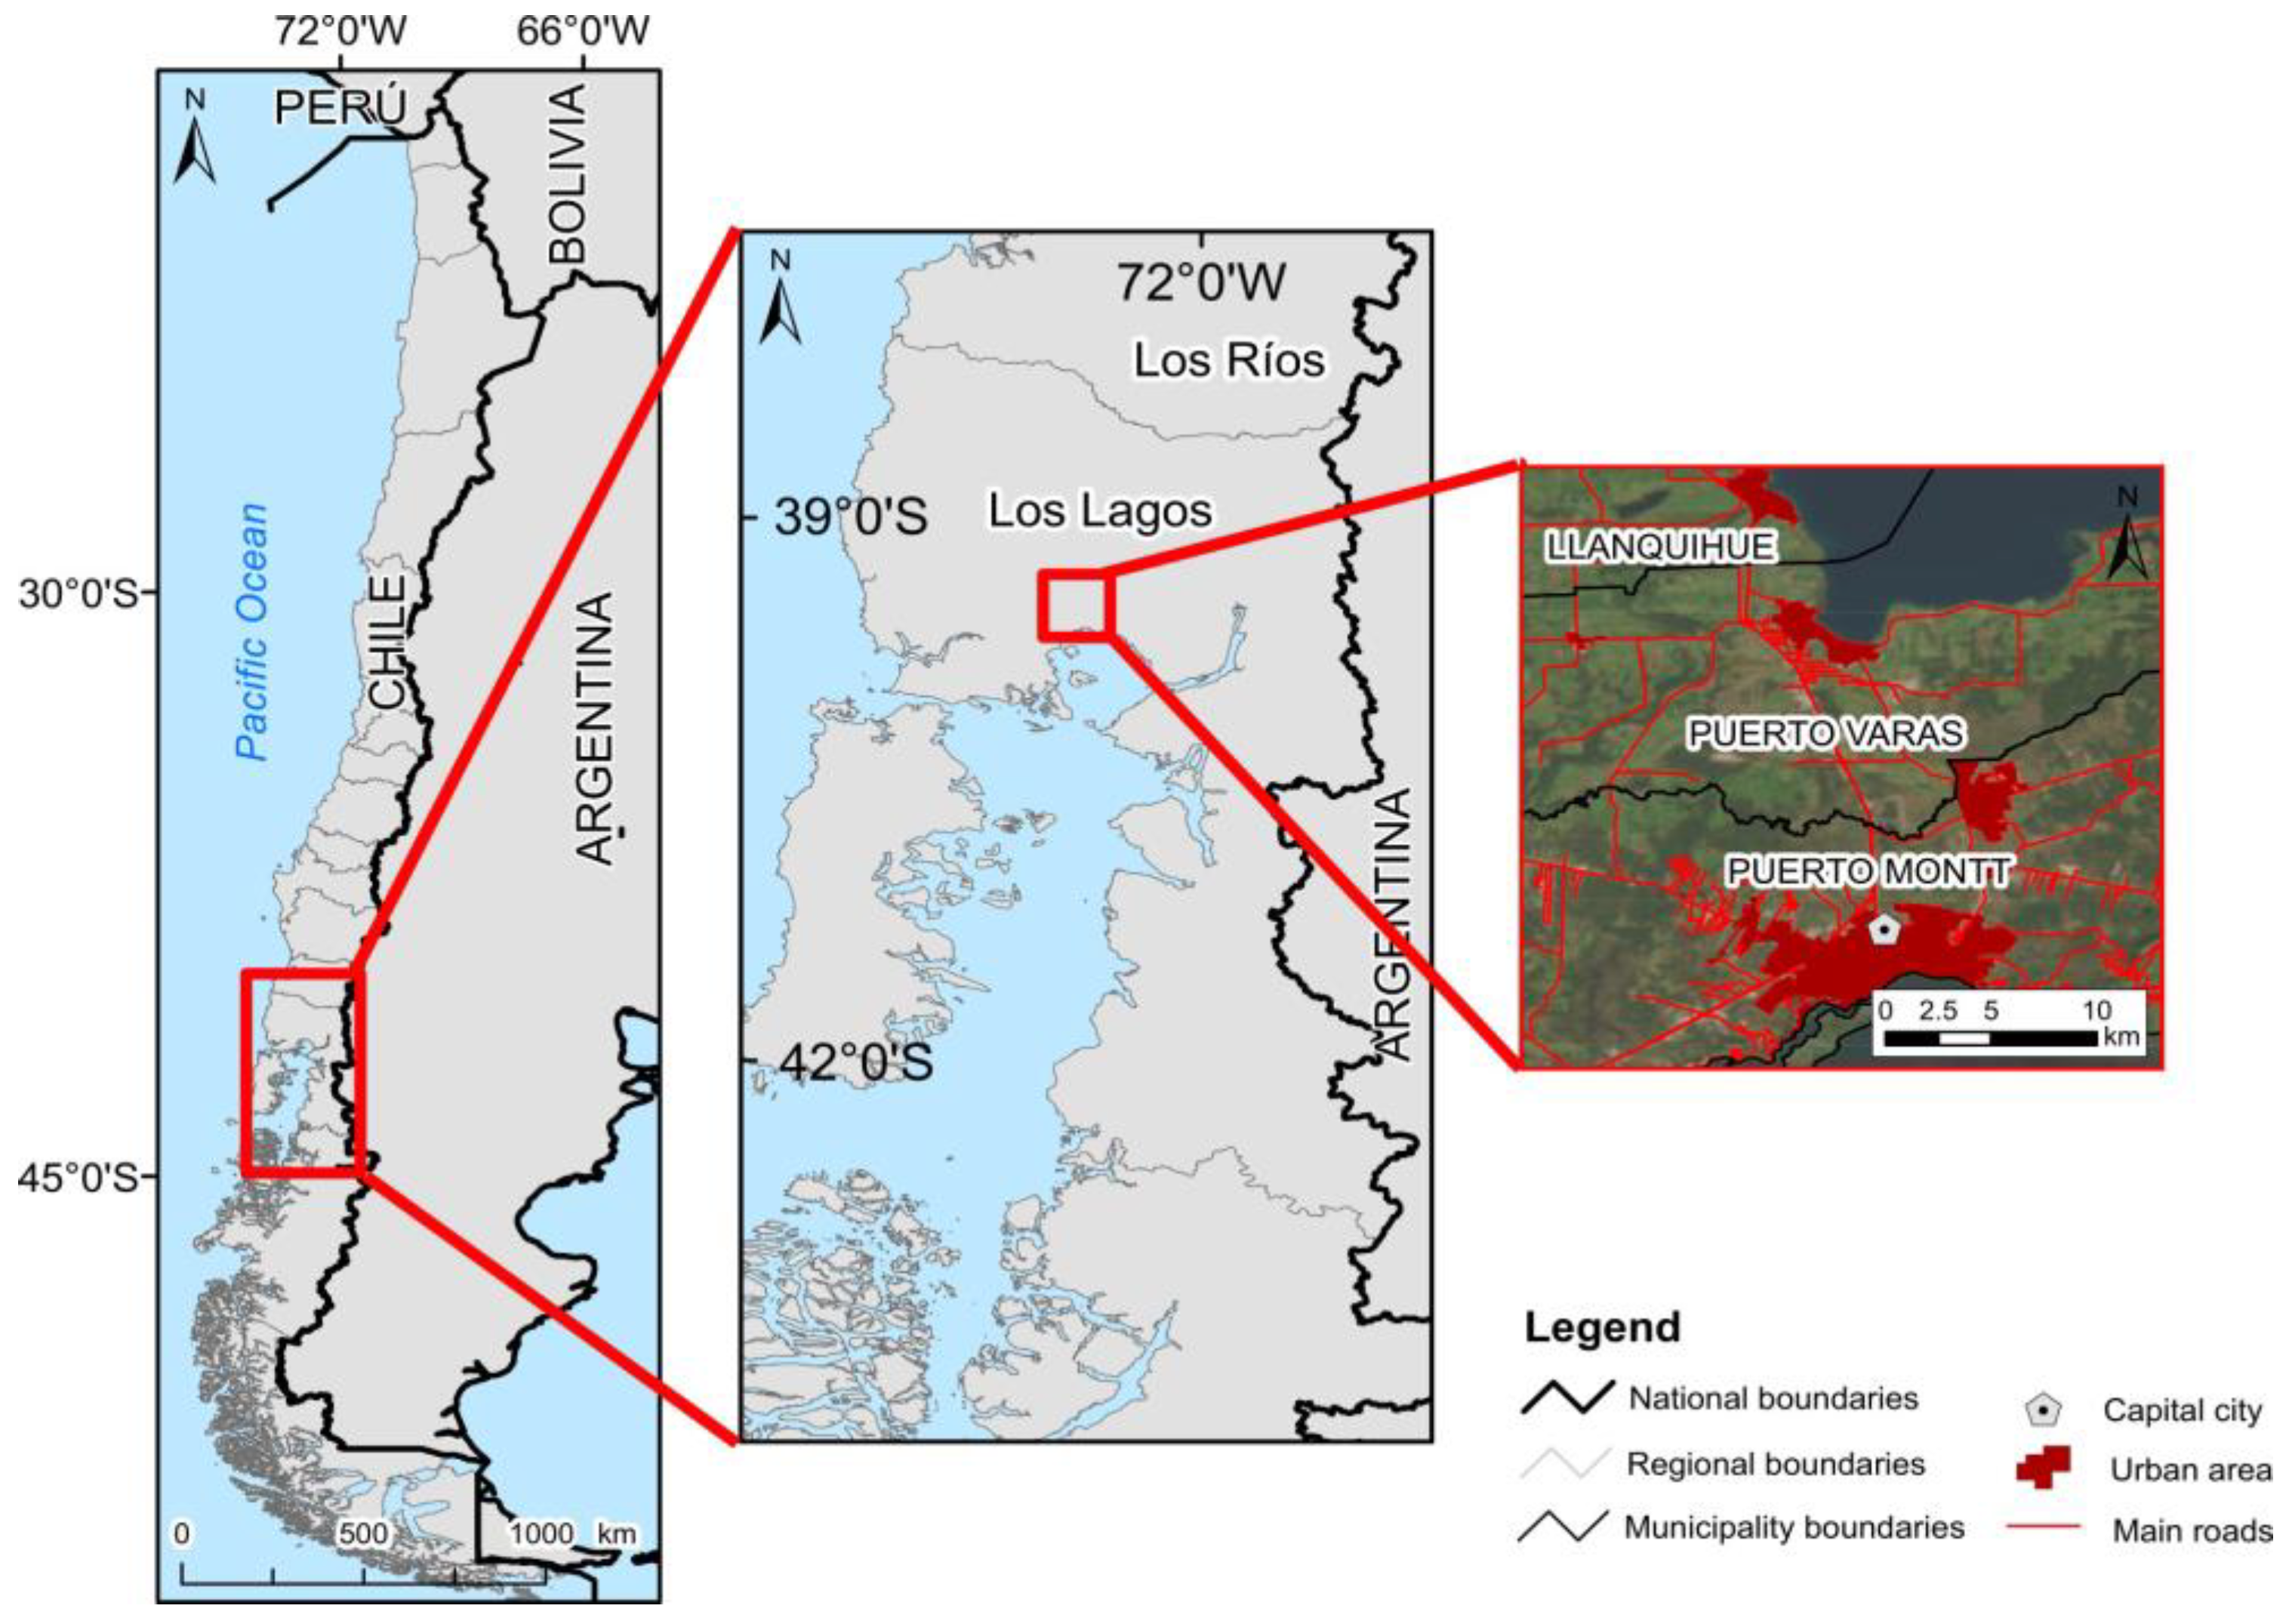
3.1. Study Area

Puerto Montt is functionally conurbated with other lower-hierarchy areas, such as Puerto Varas and Llanquihue, forming a functional unit with a total population of 308,071 inhabitants [35]. The combined urban area of these three urban centers is 78.24 km2, with Puerto Montt accounting for 81.25% of the total (Figure 1).
Future population estimates for the functional unit of Puerto Montt-Puerto Varas-Llanquihue estimate that it will reach 381,326 inhabitants by 2035. This represents a 19.21% increase in the total population compared to 2017 [36]. Morphologically, like other cities in the southern macrozone of Chile, it is located within the Central Depression, characterized by irregular terrain embedded within the coastal mountain relief [37]. Situated within the Maullín River Basin, the city extends northward, oriented toward the visual basin of Lake Llanquihue, and southward toward the Reloncaví Sound.
Puerto Montt’s role within the regional system of cities is driven by globally impactful economic activities, such as the fishing industry based on salmon production, as well as livestock and tourism activities [38]. According to Escolano and Ortiz [39], its growth has been characterized by the outward expansion of pre-existing urban fabric rather than densification in consolidated areas, where commercial and tourism activities coexist with residential land uses. Historically, both the city of Puerto Montt and its hinterland (Puerto Varas and Llanquihue) have a European heritage stemming from the development of German settlements in the mid-19th century [40].

3.2. Data Collection

To map the different LCZs that allow for the analysis and simulation of land use/land cover changes in the city and hinterland of Puerto Montt, medium spatial resolution images from the Landsat satellite have been selected. According to Dou et al. [41], this series of images has been widely used in land use/land cover change analyses for large-scale areas such as cities or regions.
A supervised classification analysis was conducted on satellite images from Landsat 4 Thematic Mapper (TM) and Landsat 7 Enhanced Thematic Mapper Plus (ETM+). These images were obtained from the United States Geological Survey (USGS) (Table 1).
The Landsat 7 (ETM+) images used were corrected for banding effects using the “Landsat Toolbox” tool in ArcGIS 10.2, developed by the USGS (USGS, 2017). The FLAASH method was applied for radiometric and atmospheric corrections [42].

3.3. Data Analysis

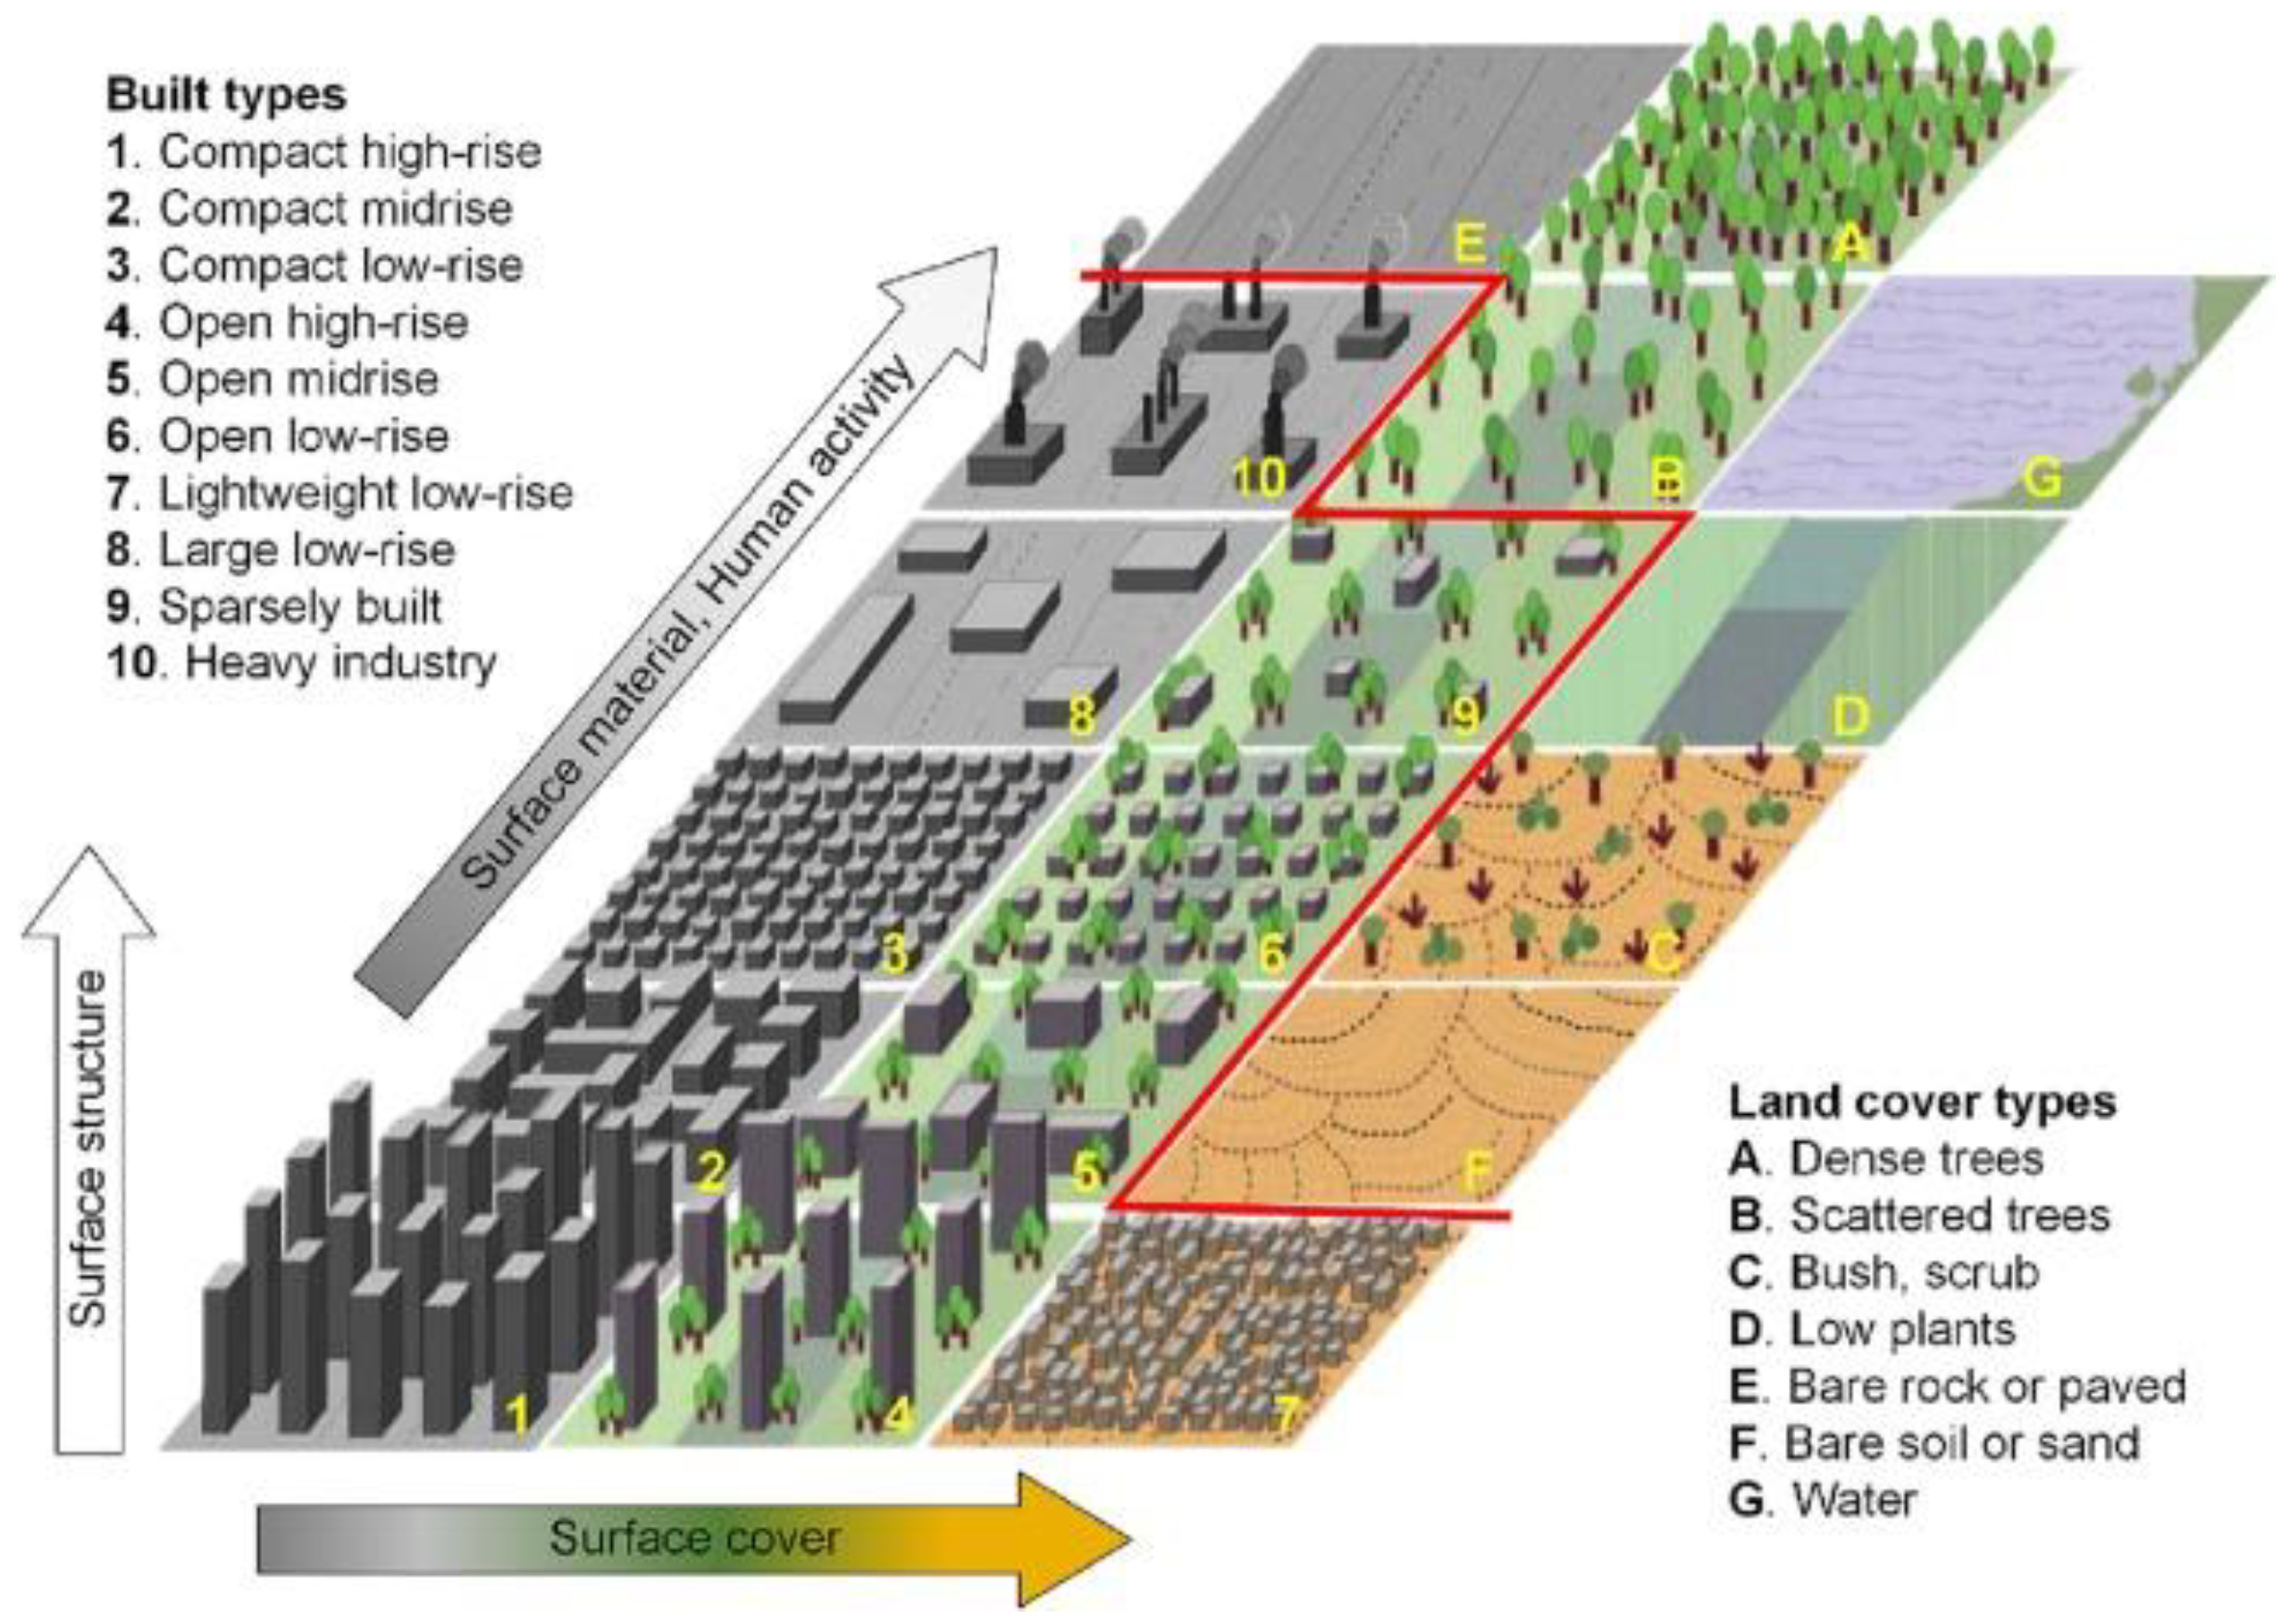
3.3.1. Image Processing

Once the satellite images were corrected, the Local Climate Zones (LCZ) method was applied [43]. This method allows for the definition of regions with similar characteristics based on their land use/land cover. Its criteria have been established to differentiate zones, all of which are anthropogenic in nature [44].
The LCZ method is divided into 17 standard classes, with 10 categories for built-up areas (e.g., high-rise compact areas, low-rise compact areas, open low-rise areas, and heavy industry) and seven categories for vegetation (e.g., dense trees, scattered trees, bare soil, and water). Each of these categories is associated with different microclimatic and structural conditions that influence air temperature variations in different zones [45].
For this study, nine of the 17 LCZ classes were selected, which were validated through fieldwork conducted in January 2021 and a literature review of studies applying the LCZ method in other middle-sized cities in Chile [7,46,47]. These correspond to LCZ 2 through LCZ D (Figure 2).
To classify LCZs, the methodology of the World Urban Database and Access Portal Tools Project was applied [48], which establishes a series of successive steps to generate static LCZ maps. This method is based on supervised classifications of preprocessed Landsat satellite images using Machine Learning (ML) techniques based on Random Forest within the Geographical Information System (GIS) SAGA (v.6.3.0). The Local Climate Zone Classification module was employed, applying a filter that approximates contiguous cells (majority filter) within a neighborhood of three pixels, equivalent to a 90-m radius. The generated maps were visually inspected using Google Earth Pro [49] software.
Figure 2. Local Climate Zones (LCZ) classification Scheme: Typologies based on built structures or urban land use (1–10) and land cover typologies (A–G). Source: Huang et al. [50], based on Stewart and Oke [43].
Urbansci 09 00165 g002

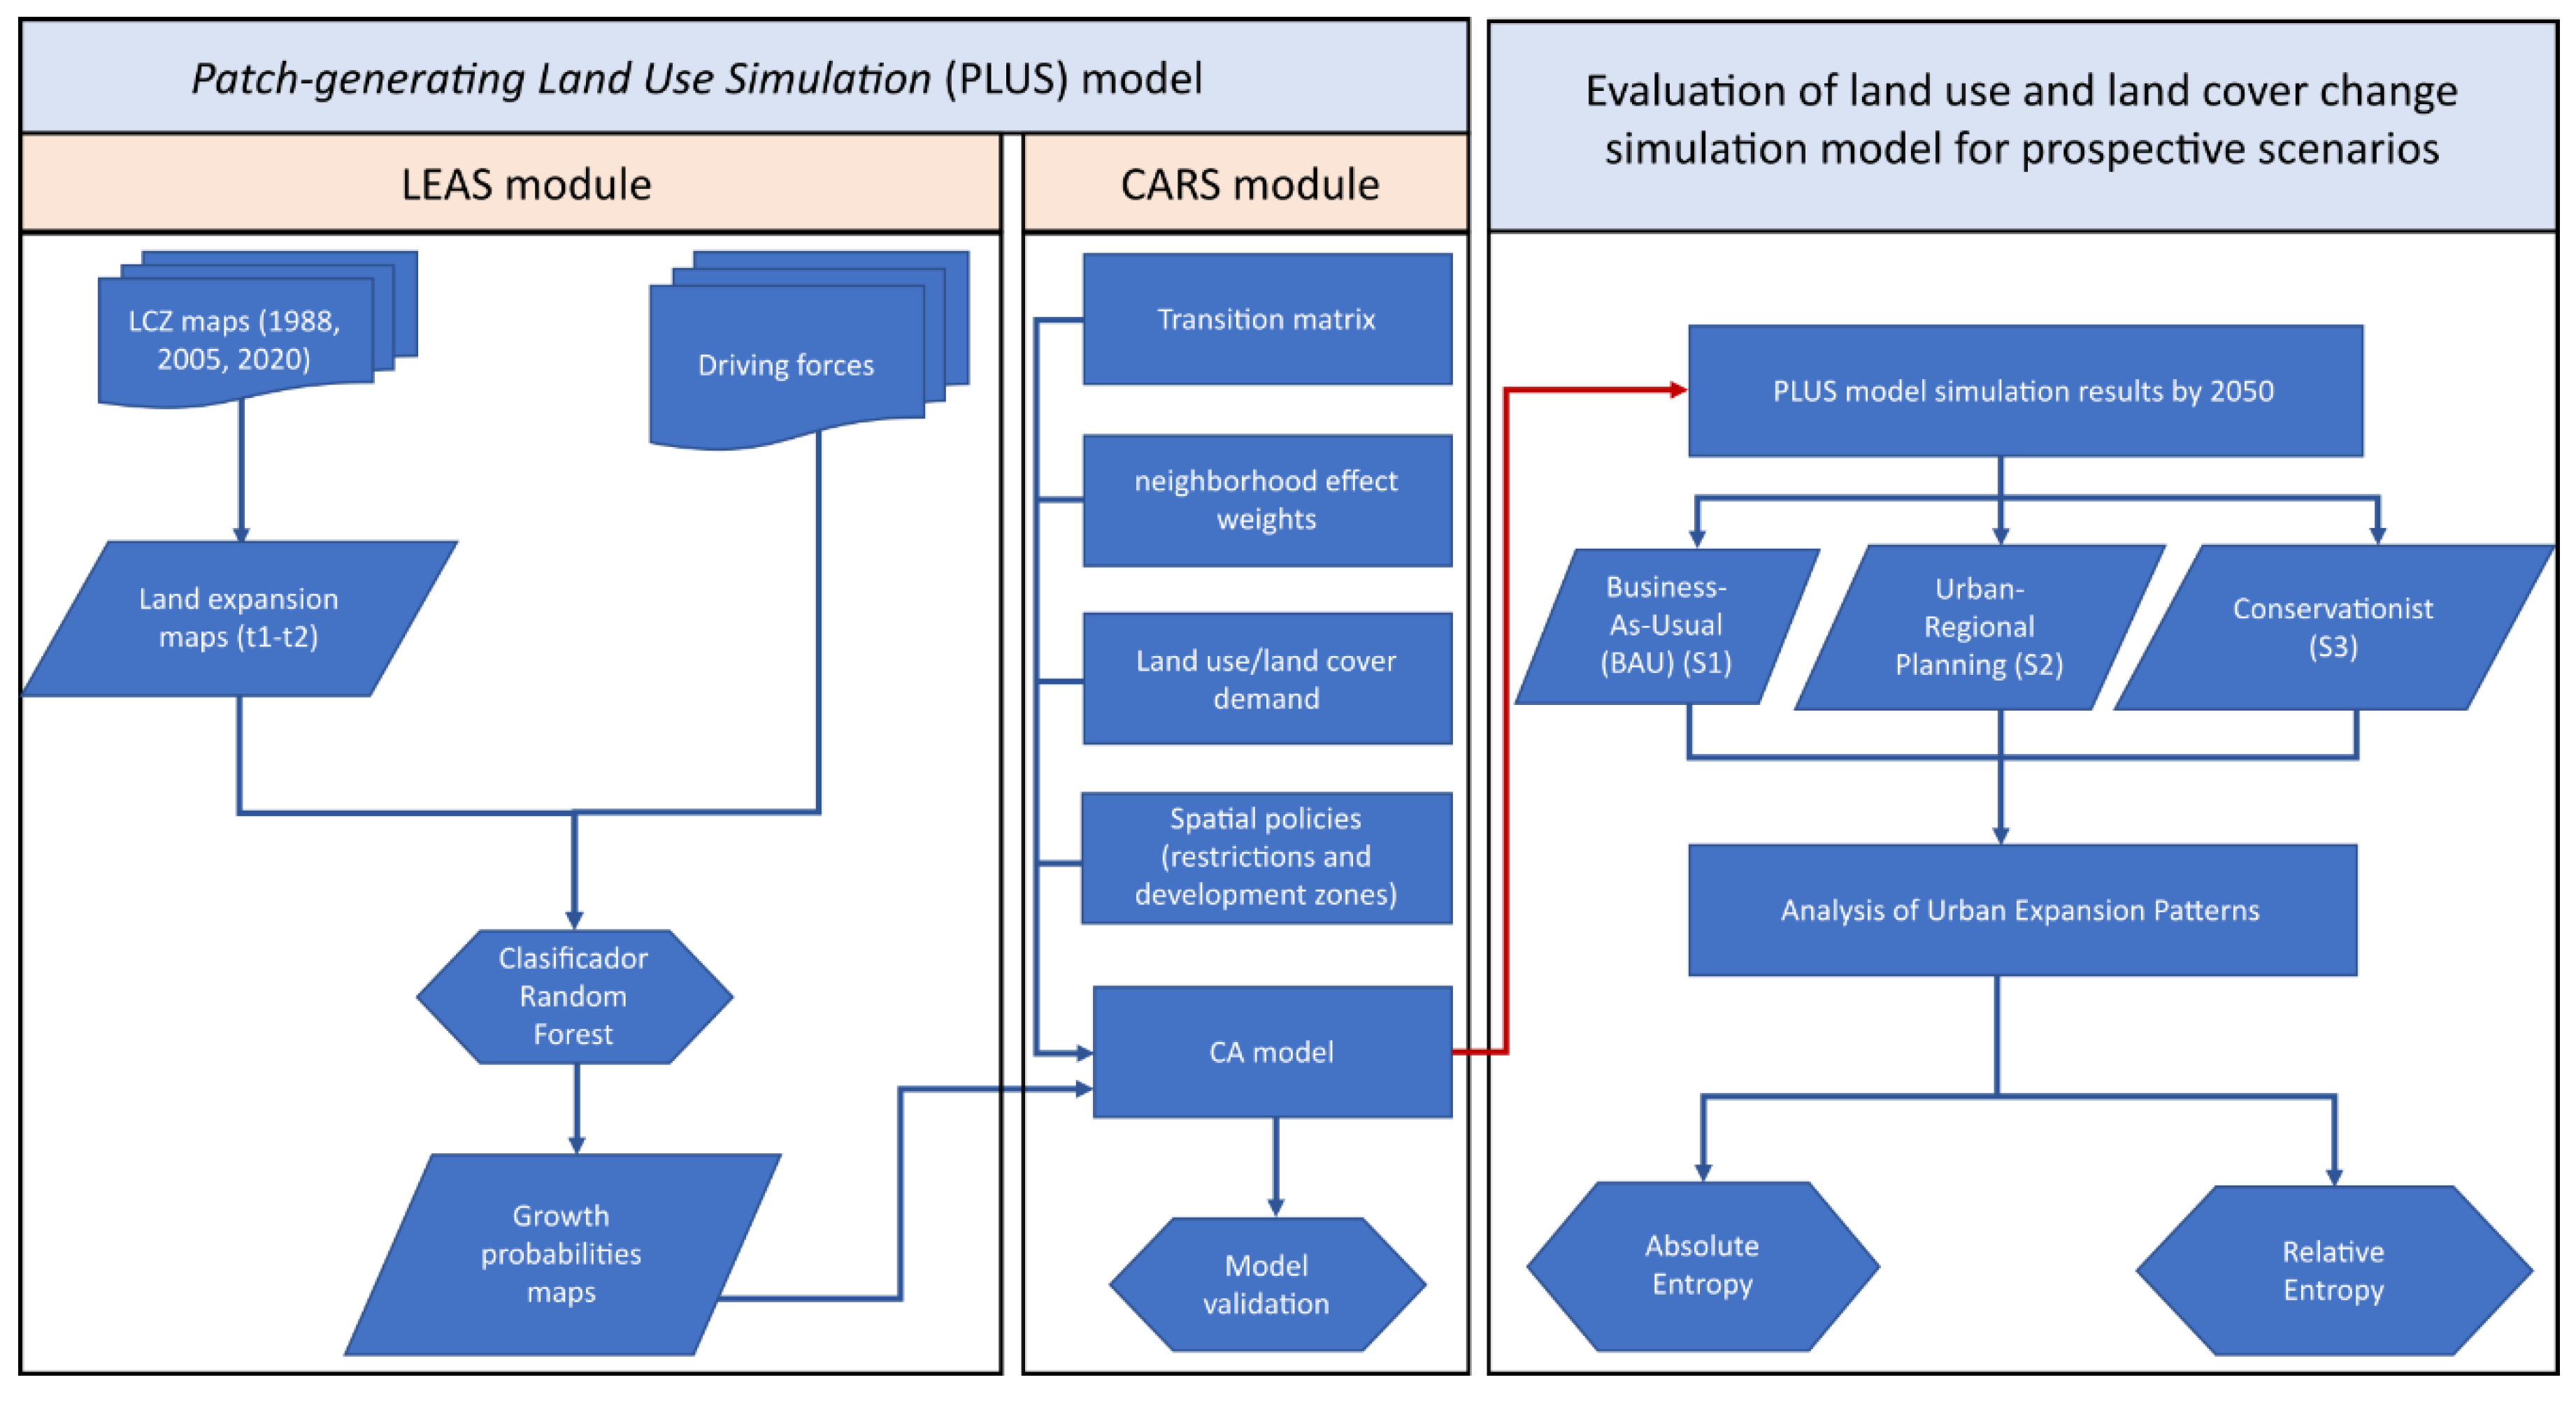
3.3.2. PLUS Model Framework

Land use and land cover change models are highly valued in geographical sciences and urban studies because they explicitly represent spatial relationships and patterns. They can be integrated into Geographic Information Systems (GIS), remote sensing, and statistical techniques to simulate and analyze land use and land cover changes at various scales.
To investigate the evolution of urban growth patterns based on the driving forces that influence land use and land cover changes, the Patch-generating Land Use Simulation (PLUS) model was applied [32]. This model simulates land use and land cover changes with the capacity to integrate a rule-based framework known as the Land Expansion Analysis Strategy (LEAS) and a cellular automata model based on multi-type Random Seeds (CARS). This approach illustrates the driving forces influencing the expansion and landscape dynamics of land use and land cover (Figure 3).
The growth probabilities of each LCZ within the study area were calculated using the LEAS module. These probabilities are combined with the number of pixels corresponding to each LCZ, the conversion matrix, and the neighborhood weight of pixels for each land use/land cover category, all of which are estimated within the same module before being implemented in the CARS module.
The driving forces used in the LEAS module to calculate growth probability were segmented into three dimensions: sociodemographic, environmental, and socioeconomic (Table 2).
The CARS module is a Cellular Automata model that incorporates a patch-generation mechanism (grouped units) based on multiple random seeds for land use. This approach ensures that the analysis does not examine pixels in isolation but rather considers their spatial relationships [32].

3.3.3. Application of the PLUS Model and Scenario Definition

Considering all the parameters within the PLUS model and the definition of the three scenarios to be simulated for 2050, as proposed by Liang et al. [32], “spatial policy development zones” were applied to establish a prioritization of spatial policies within each scenario. This process involved directing land-use change preferences with values ranging from 0 (lower preference for change) to 1 (higher preference for change).
For the urban growth scenarios of the analyzed cities based on the PLUS model, only one land-use category influencing the application of spatial policy was considered within these “spatial policy development zones”: the territorial planning instruments at the municipal scale (Municipal Regulatory Plans) [31,32] (Table 3 and Table 4).
This methodological decision allowed for directing the change of pixels observed in the 2020 period and simulating their transition to another state by 2050.

3.3.4. Analysis of Urban Growth Patterns

To measure the complexity of future urban land use expansion simulated for 2050 in the city of Puerto Montt, Shannon’s entropy values were estimated as a quantitative measure reflecting the degree of homogeneity or diversity within a dataset [51]. In order to assess the degree of diversity or homogeneity in urban land use, the Shannon’s entropy model was applied [52], where two indicators were calculated as follows:
A b s o l u t e   E n t r o p y = H n = i = 1 n P i   l o g e 1 P i
The absolute entropy ( H n ) is defined, where P i represents the proportion of urban Surface for the final or simulated period in 2050 in the i -th concentric zone relative to the total urban surface of the city ( P i = x i j n x j ) and n corresponds to the total number of concentric zones.
The absolute entropy values range between 0 and l o g n .
R e l a t i v e   E n t r o p y = H n = i = 1 n P i   l o g e 1 P i / l o g e n
Relative entropy ( H n ) is based on the ratio between absolute entropy ( H n ) and the natural logarithm of the analyzed concentric zone ( n ). The relative value ranges between 0 and 1, providing a better understanding of the balance or imbalance in urban growth across different types of land use/land cover.
According to Nazarnia et al. [53], relative entropy values of 1 indicate high levels of urban sprawl.
From a methodological perspective, entropy values are sensitive to variations in the shapes and sizes of regions (or study areas) when calculating the proportion of urban land observed in each ring relative to the total urban land analyzed ( P i = x i j n x j ) [53,54].

3.3.5. Model Validation

This process consisted of two phases. The first phase was based on a comparison of two pairs of maps using the Kappa statistic [55]. Validation was conducted at a global level, reflecting the degree of similarity between the maps, as well as the sub-indicators KLocation and KHistogram for each of the observed and simulated LCZs in 2020 for the analyzed cities. The PLUS model criteria used correspond to the parameters of the Business-As-Usual (BAU) Scenario for 2050, considering the requirements or demands for each LCZ as observed in the 2020 map (Figure 4).

4. Results

4.1. LCZs Trajectories Between 1988 and 2020

4.1.1. 1988–2005

The land use/land cover change processes for the city of Puerto Montt show an increase in the area corresponding to urban zones during this period, although, in terms of the total landscape analyzed, they represent a small percentage. When examining the growth rates of the LCZs, urban land covers (LCZs 2, 3, 6, 8, and 9) experienced the greatest increase, representing an average growth of 503.4% for the period (Table 5). Regarding the changes in the form and spatial distribution of urban typologies of LCZs, it is evident that there is a trend toward urbanization based on typologies 6, 8, and 9, where low-density residential urban areas (LCZ 6) have increased their surface area by 10.91 km2 during this period. The same trend is observed for LCZ 9 (sparsely built), which increased its surface area by 13.57 km2.

4.1.2. 2005–2020

The urban-type LCZs (LCZ 2 to 9) only increased their area by 140.3% during this period, showing less dynamism than the previous period (Table 5). However, the dynamic change of LCZ 9 was higher than the average (292.1%), followed by LCZ 8 (130.5%), indicating a clear trend towards the occupation of peripheral areas in the city of Puerto Montt. Agricultural land consumption (LCZ D) decreased the most during this period (−13%), followed by forest cover (LCZ A), which decreased by −4.9%.

4.2. Simulation of Urban Expansion of Puerto Montt to 2050

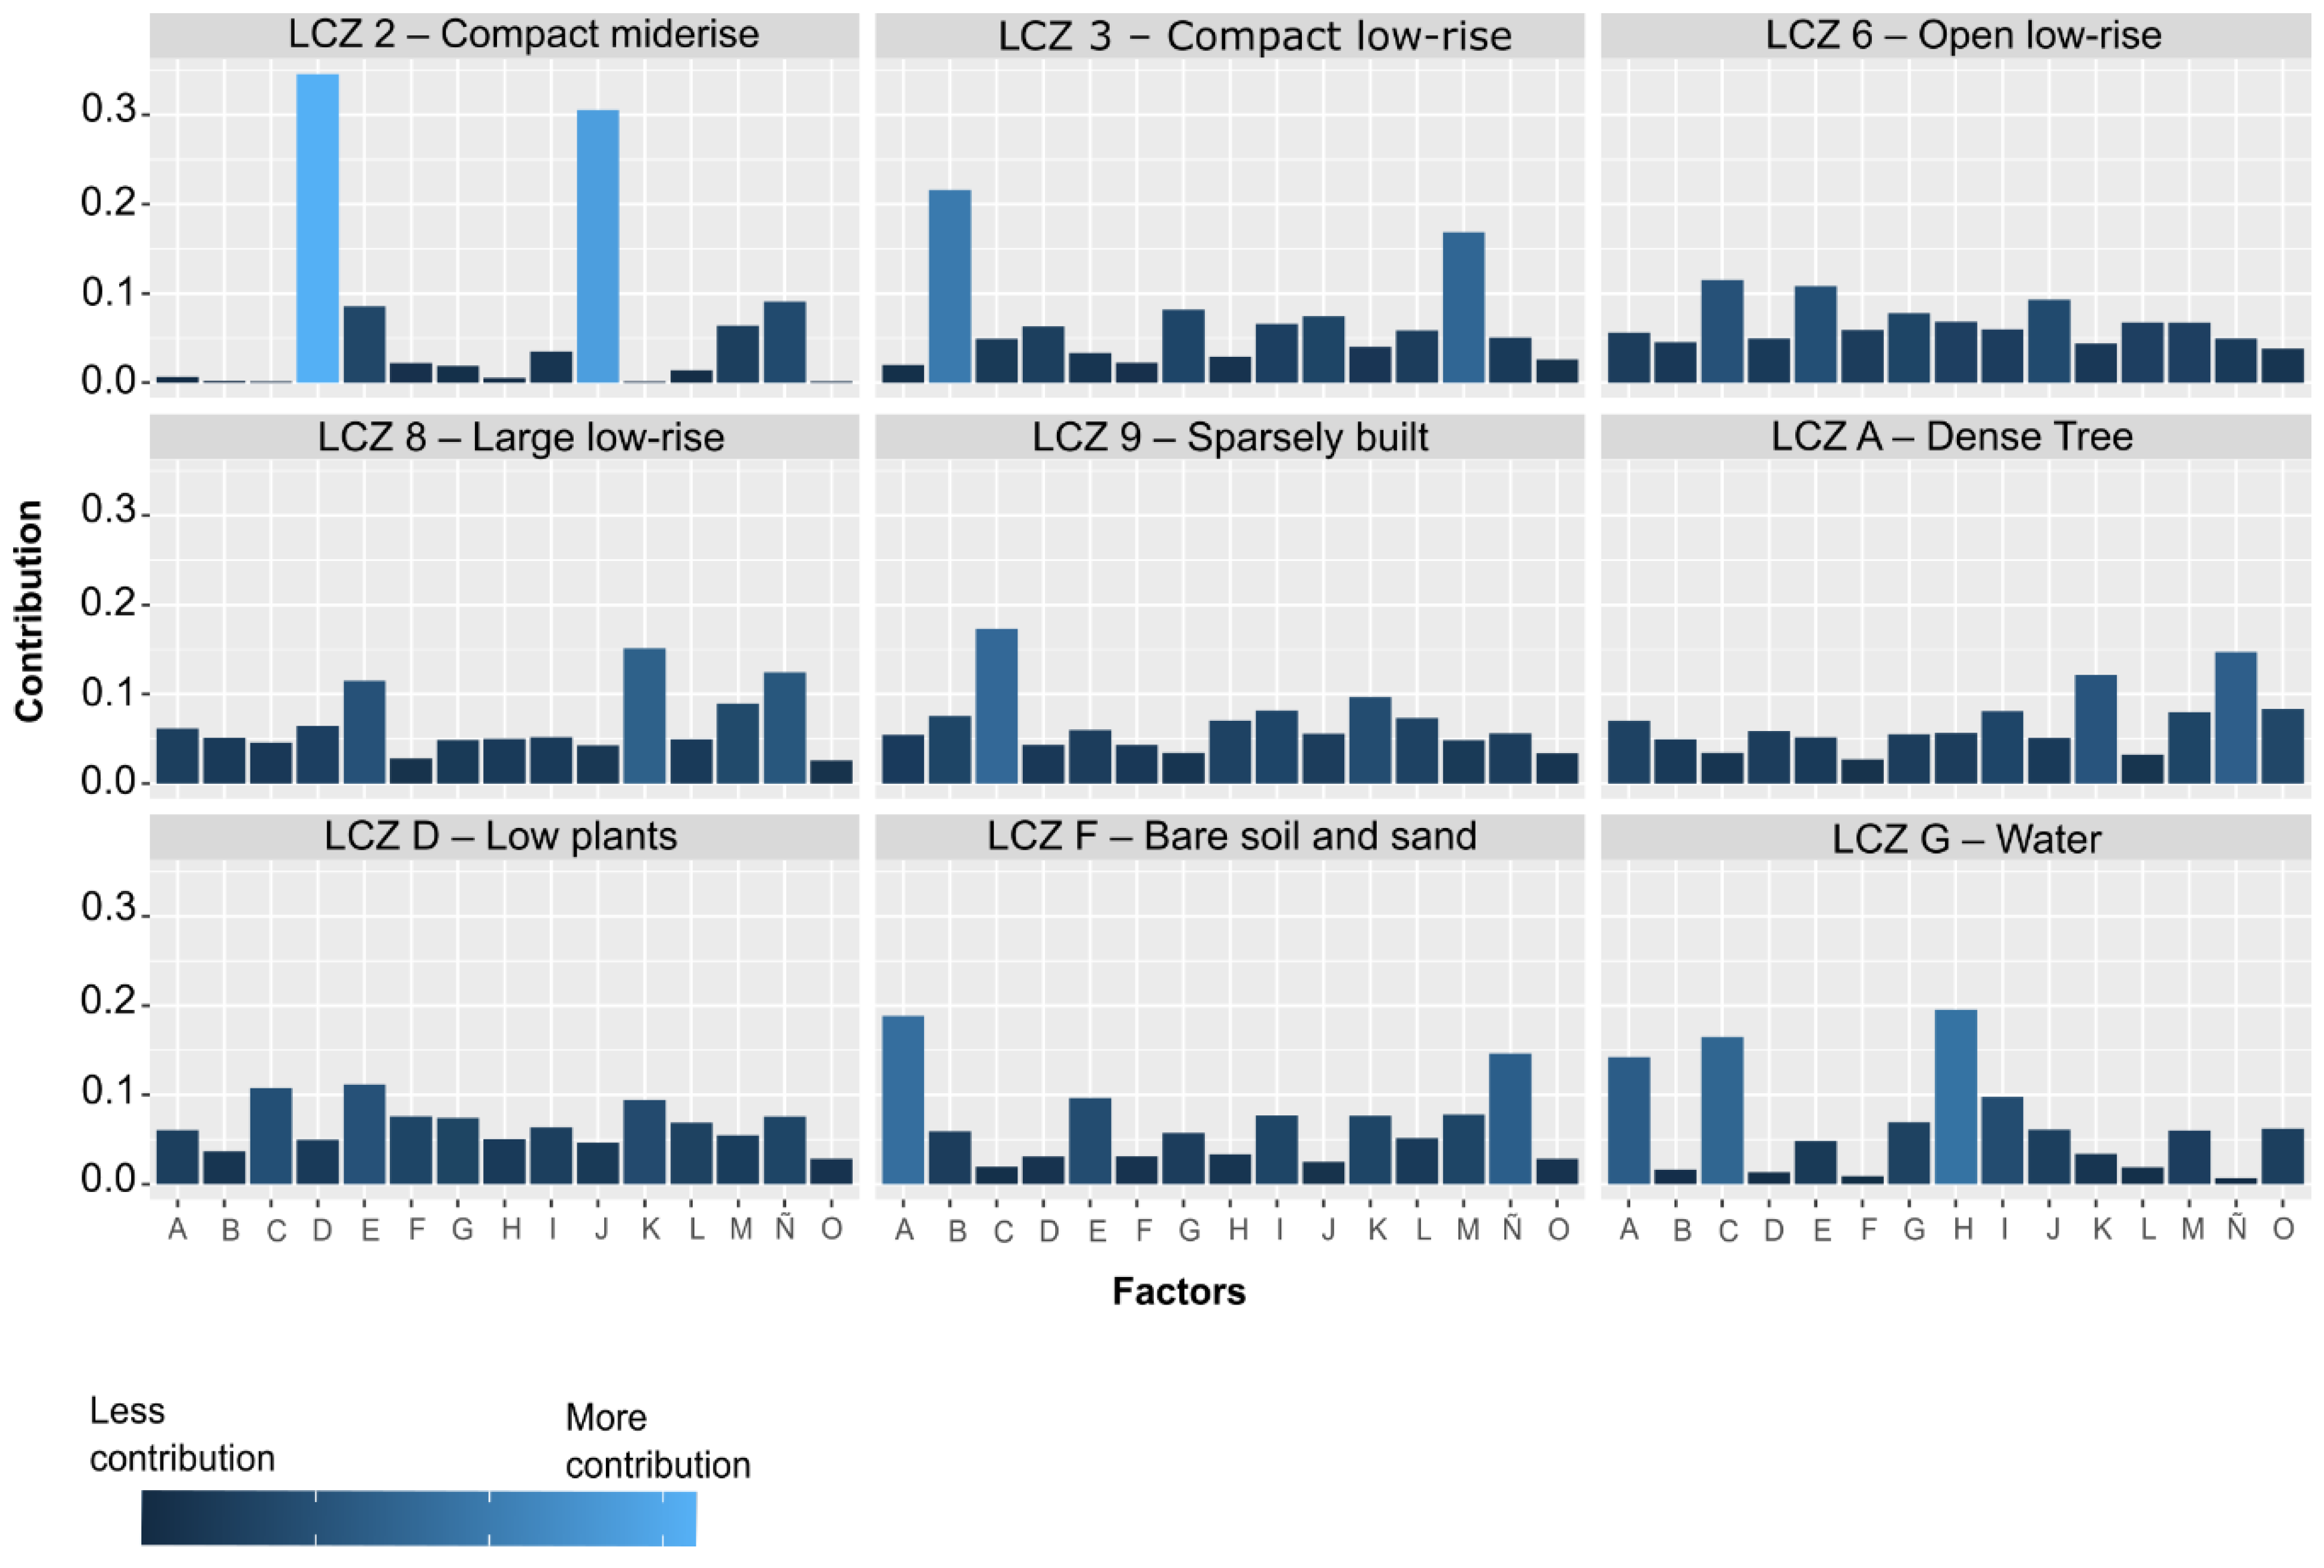
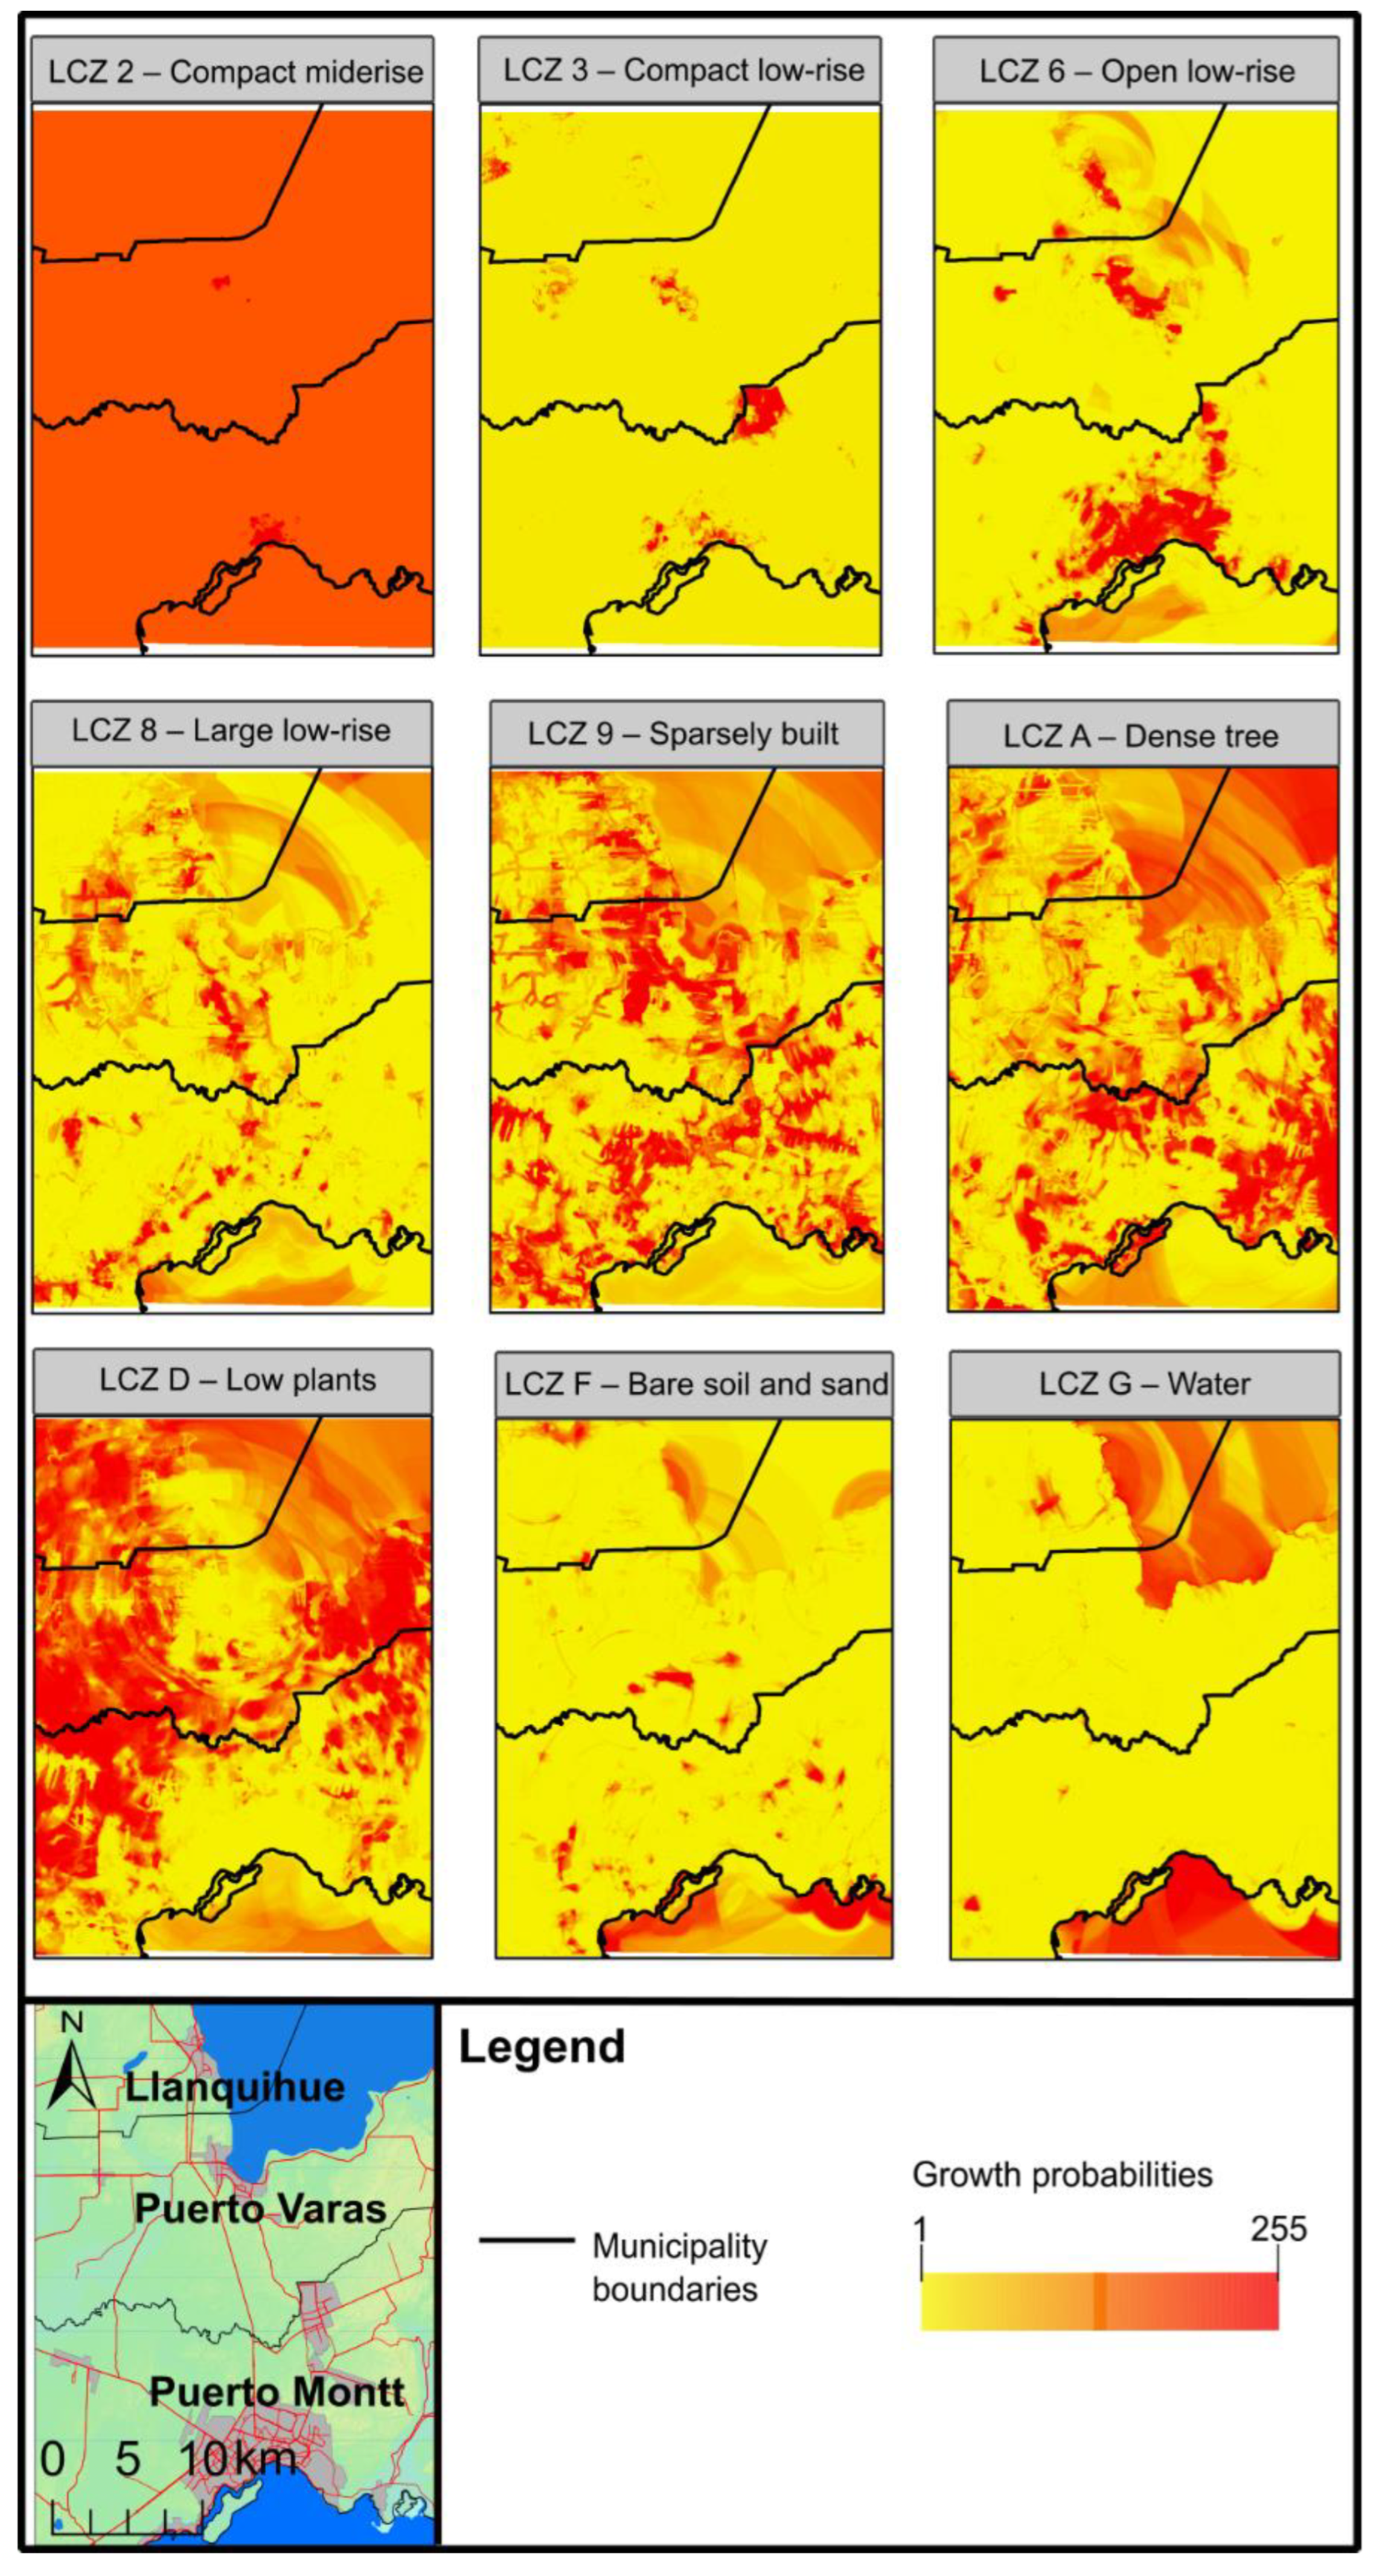
4.2.1. Land Expansion Analysis Strategy (LEAS)

The urban expansion probability maps show a trend towards a high probability of land use/land cover change in the peripheral sectors of the consolidated urban areas in Puerto Montt. Specifically, land use corresponding to compact areas of medium-height buildings (LCZ 2) has a high probability of urbanization throughout the entire study area (Figure 5 and Figure 6).
In the other Local Climate Zones, particularly LCZ 6 (low-density constructions), LCZ 8 (industries), and LCZ 9 (scattered buildings), a more diffuse probability is observed in rural areas. This leads to the emergence of new land uses in areas that are currently rural. LCZ 9 has a high probability of change according to the urban expansion probability map, which is explained by the contribution of the housing density variable and distance to the road network (which together account for 28.1% of that Local Climate Zone).
Regarding areas designated for agricultural activity (LCZ D), the variables that most influence the expansion of this land cover are altitude, housing density, and distance to rural land subdivision projects or land subdivisions. Although in this case, each of these variables does not represent more than 10% on average for each of the three cities, they are variables related to how rural space is used in the hinterland of the city of Puerto Montt (Figure 5).

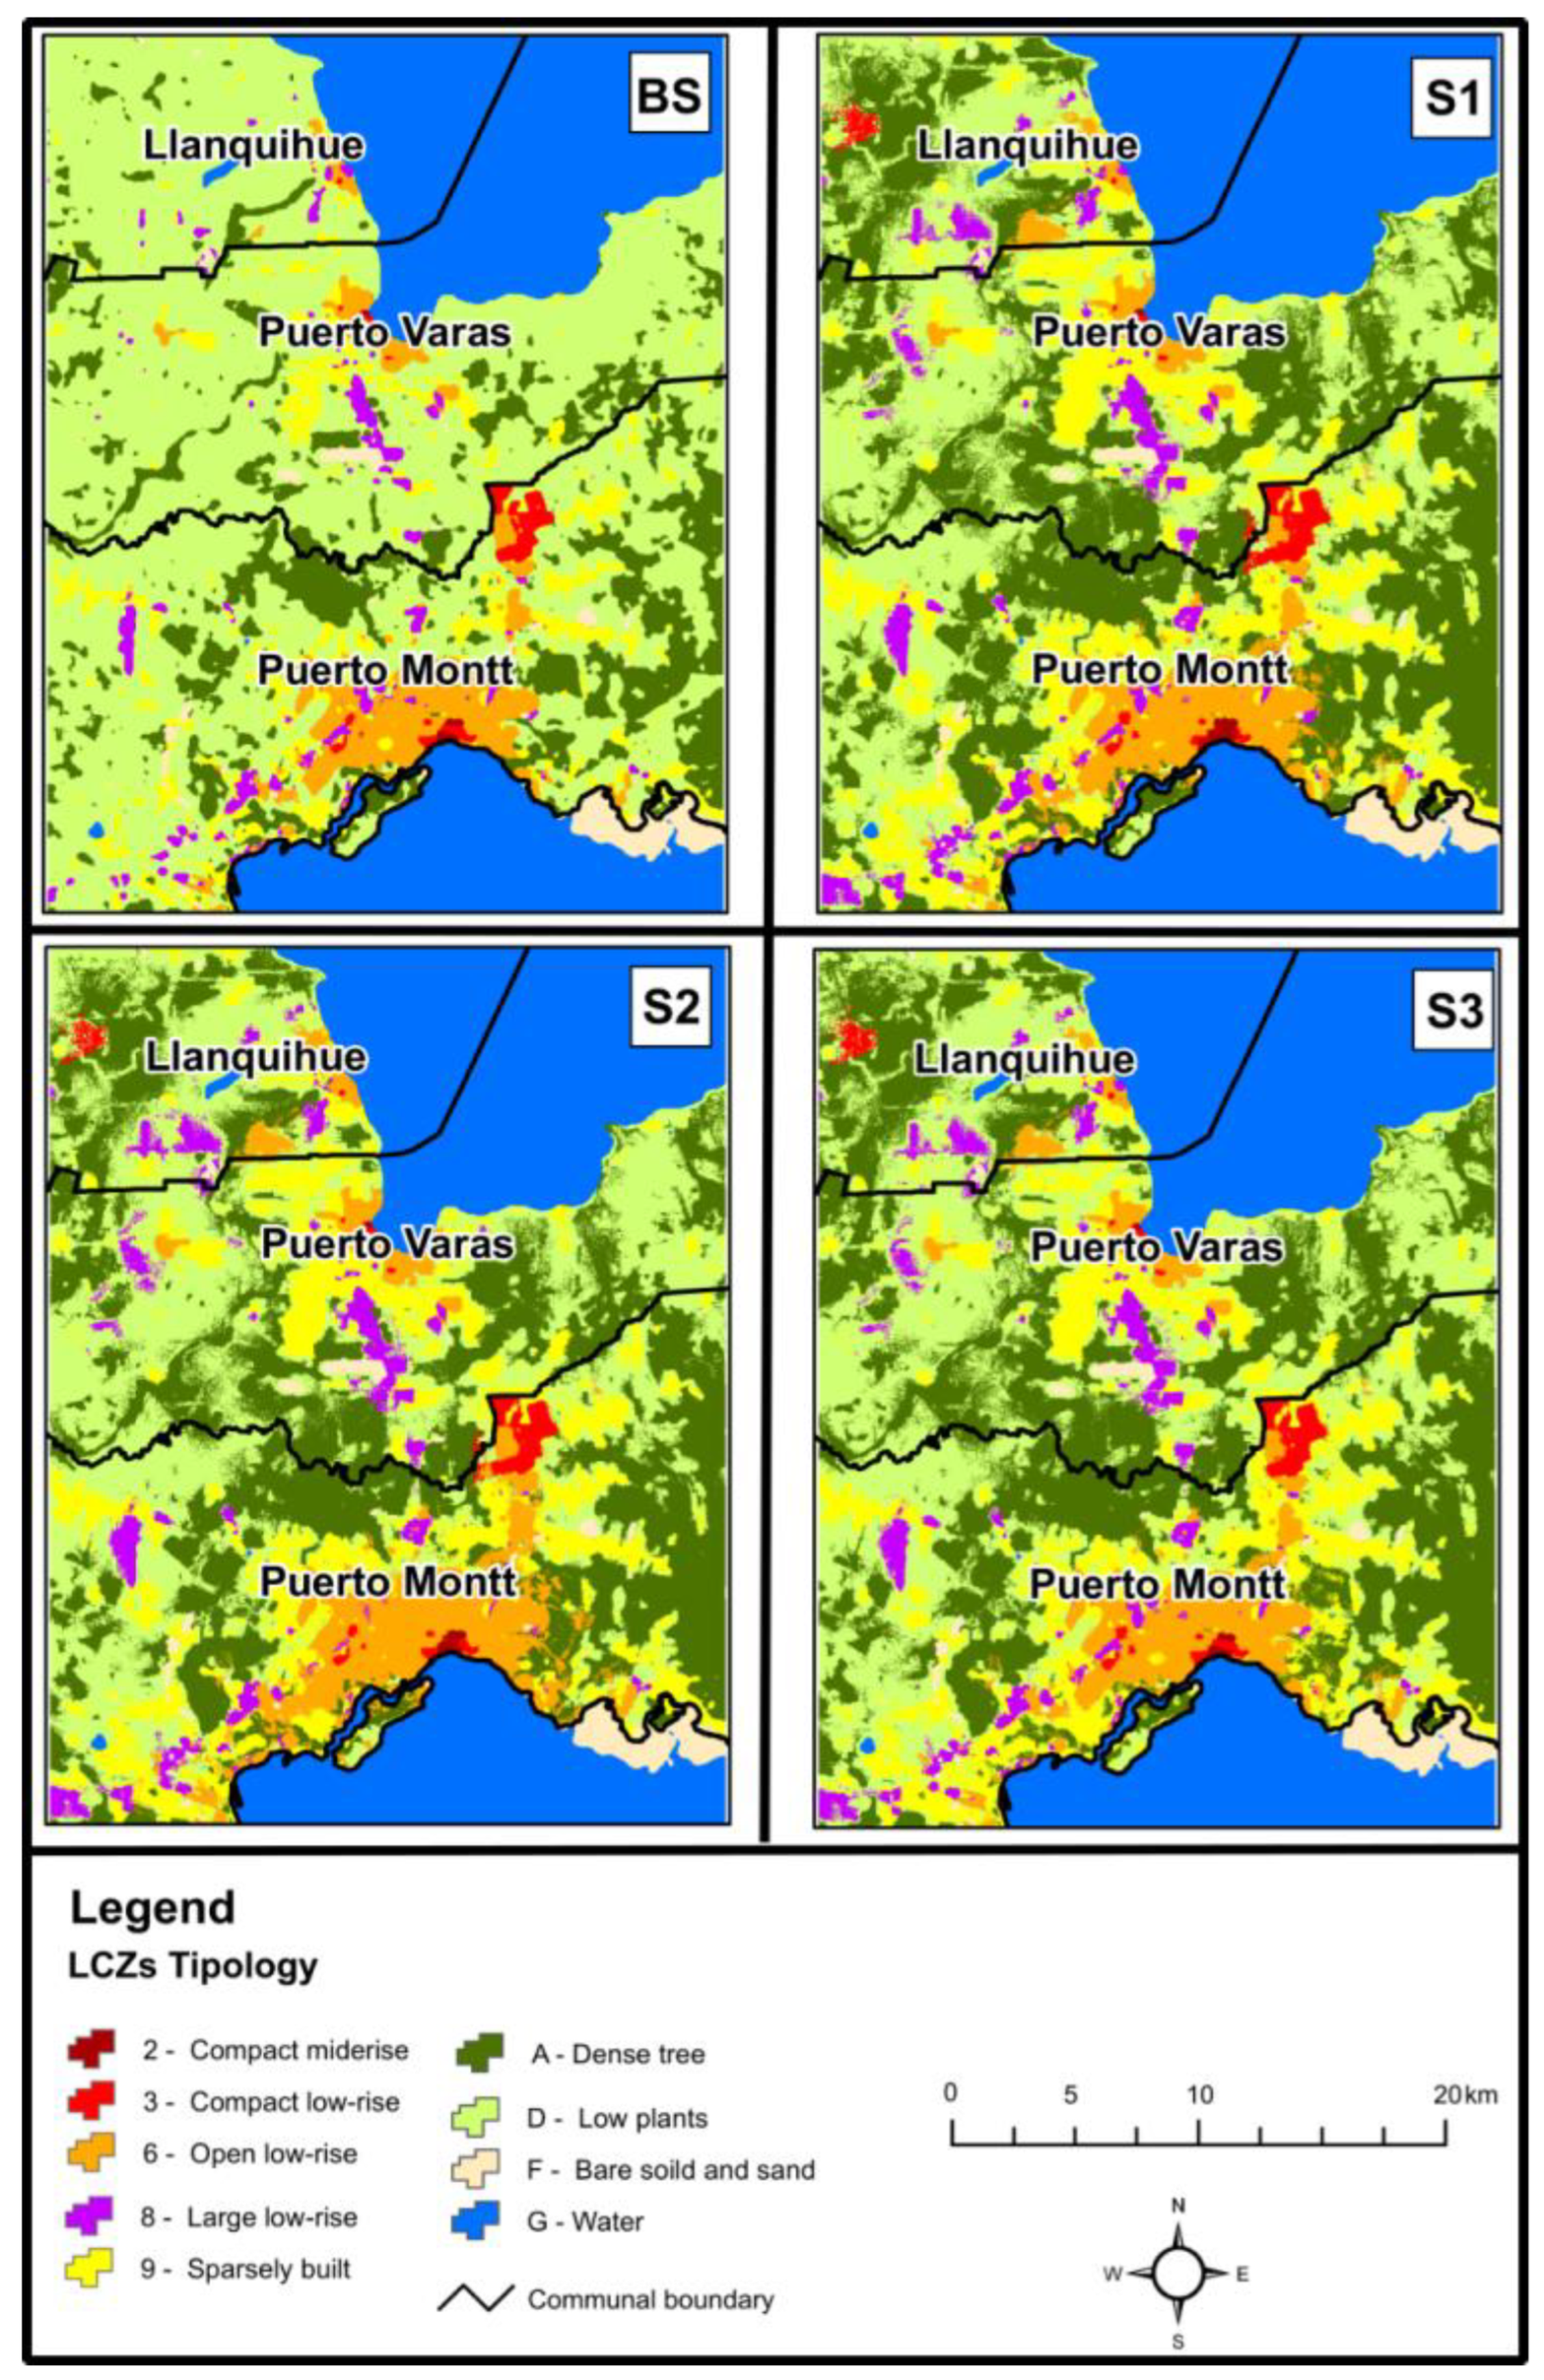
4.2.2. Business-As-Usual (BAU) Scenario Simulation

This scenario allowed for the identification of a clear trend toward an increase in the area corresponding to land use for scattered buildings (LCZ 9) towards the Alerce sector (north to the city of Puerto Montt). Additionally, land uses corresponding to medium-density (LCZ 3) and low-density (LCZ 6) constructions were observed. In particular, industrial land use (LCZ 8) strongly increased in peri-urban areas, resulting from the conversion of areas previously designated for agricultural production (Figure 7 and Table 6).

4.2.3. Urban-Regional Planning Scenario Simulation

This scenario shows a trend similar to E1 in terms of land use/land cover conversion processes (Figure 7), where a greater increase in land use for low-rise buildings (LCZ 6) was observed. It is evident that by 2050, there would be a predominance in the landscape of the city and the hinterland of Puerto Montt of scattered buildings (LCZ 9), which would represent 53.43% of the total simulated urban land. These would be increased in areas near smaller cities, such as Puerto Varas and Llanquihue (to the north of Puerto Montt) (Table 6).

4.2.4. Conservationist Scenario Simulation

The scenario shows that by 2050, larger areas will be designated for land uses of isolated buildings (LCZ 9), which will preferably be located in sectors such as Chinquihue (southwest) and Alerce (west). Compared to the other two analyzed scenarios (S1 and S2), it is evident that the land use change simulation reveals areas that do not undergo changes compared to the base scenario (BS), such as the urban area of Alerce (north) and the northern sector at the boundary of the Puerto Varas commune (Figure 7 and Table 6).

4.3. Validation of the Results Obtained by Simulation

In the validation process of the land use/land cover change simulation model, the Kappa index and KLocation, and KHistogram indicators were estimated. For the city of Puerto Montt, the obtained Kappa values exceeded 0.67 (Table 7).
The simulated land use/land cover categories for the city of Puerto Montt exhibit a KLocation (pixel assignment probability) ranging from moderate to high adjustment (0.69), indicating that the model in this city is predicting land use changes consistent with those observed in 2020. In this regard, urban land uses generally show similar values between the KLocation and KHistogram indicators, demonstrating that the model is consistently capturing both the location and magnitude of land use changes. For instance, LCZ 6, which corresponds to low-density buildings, reflects this relationship (Figure 8).

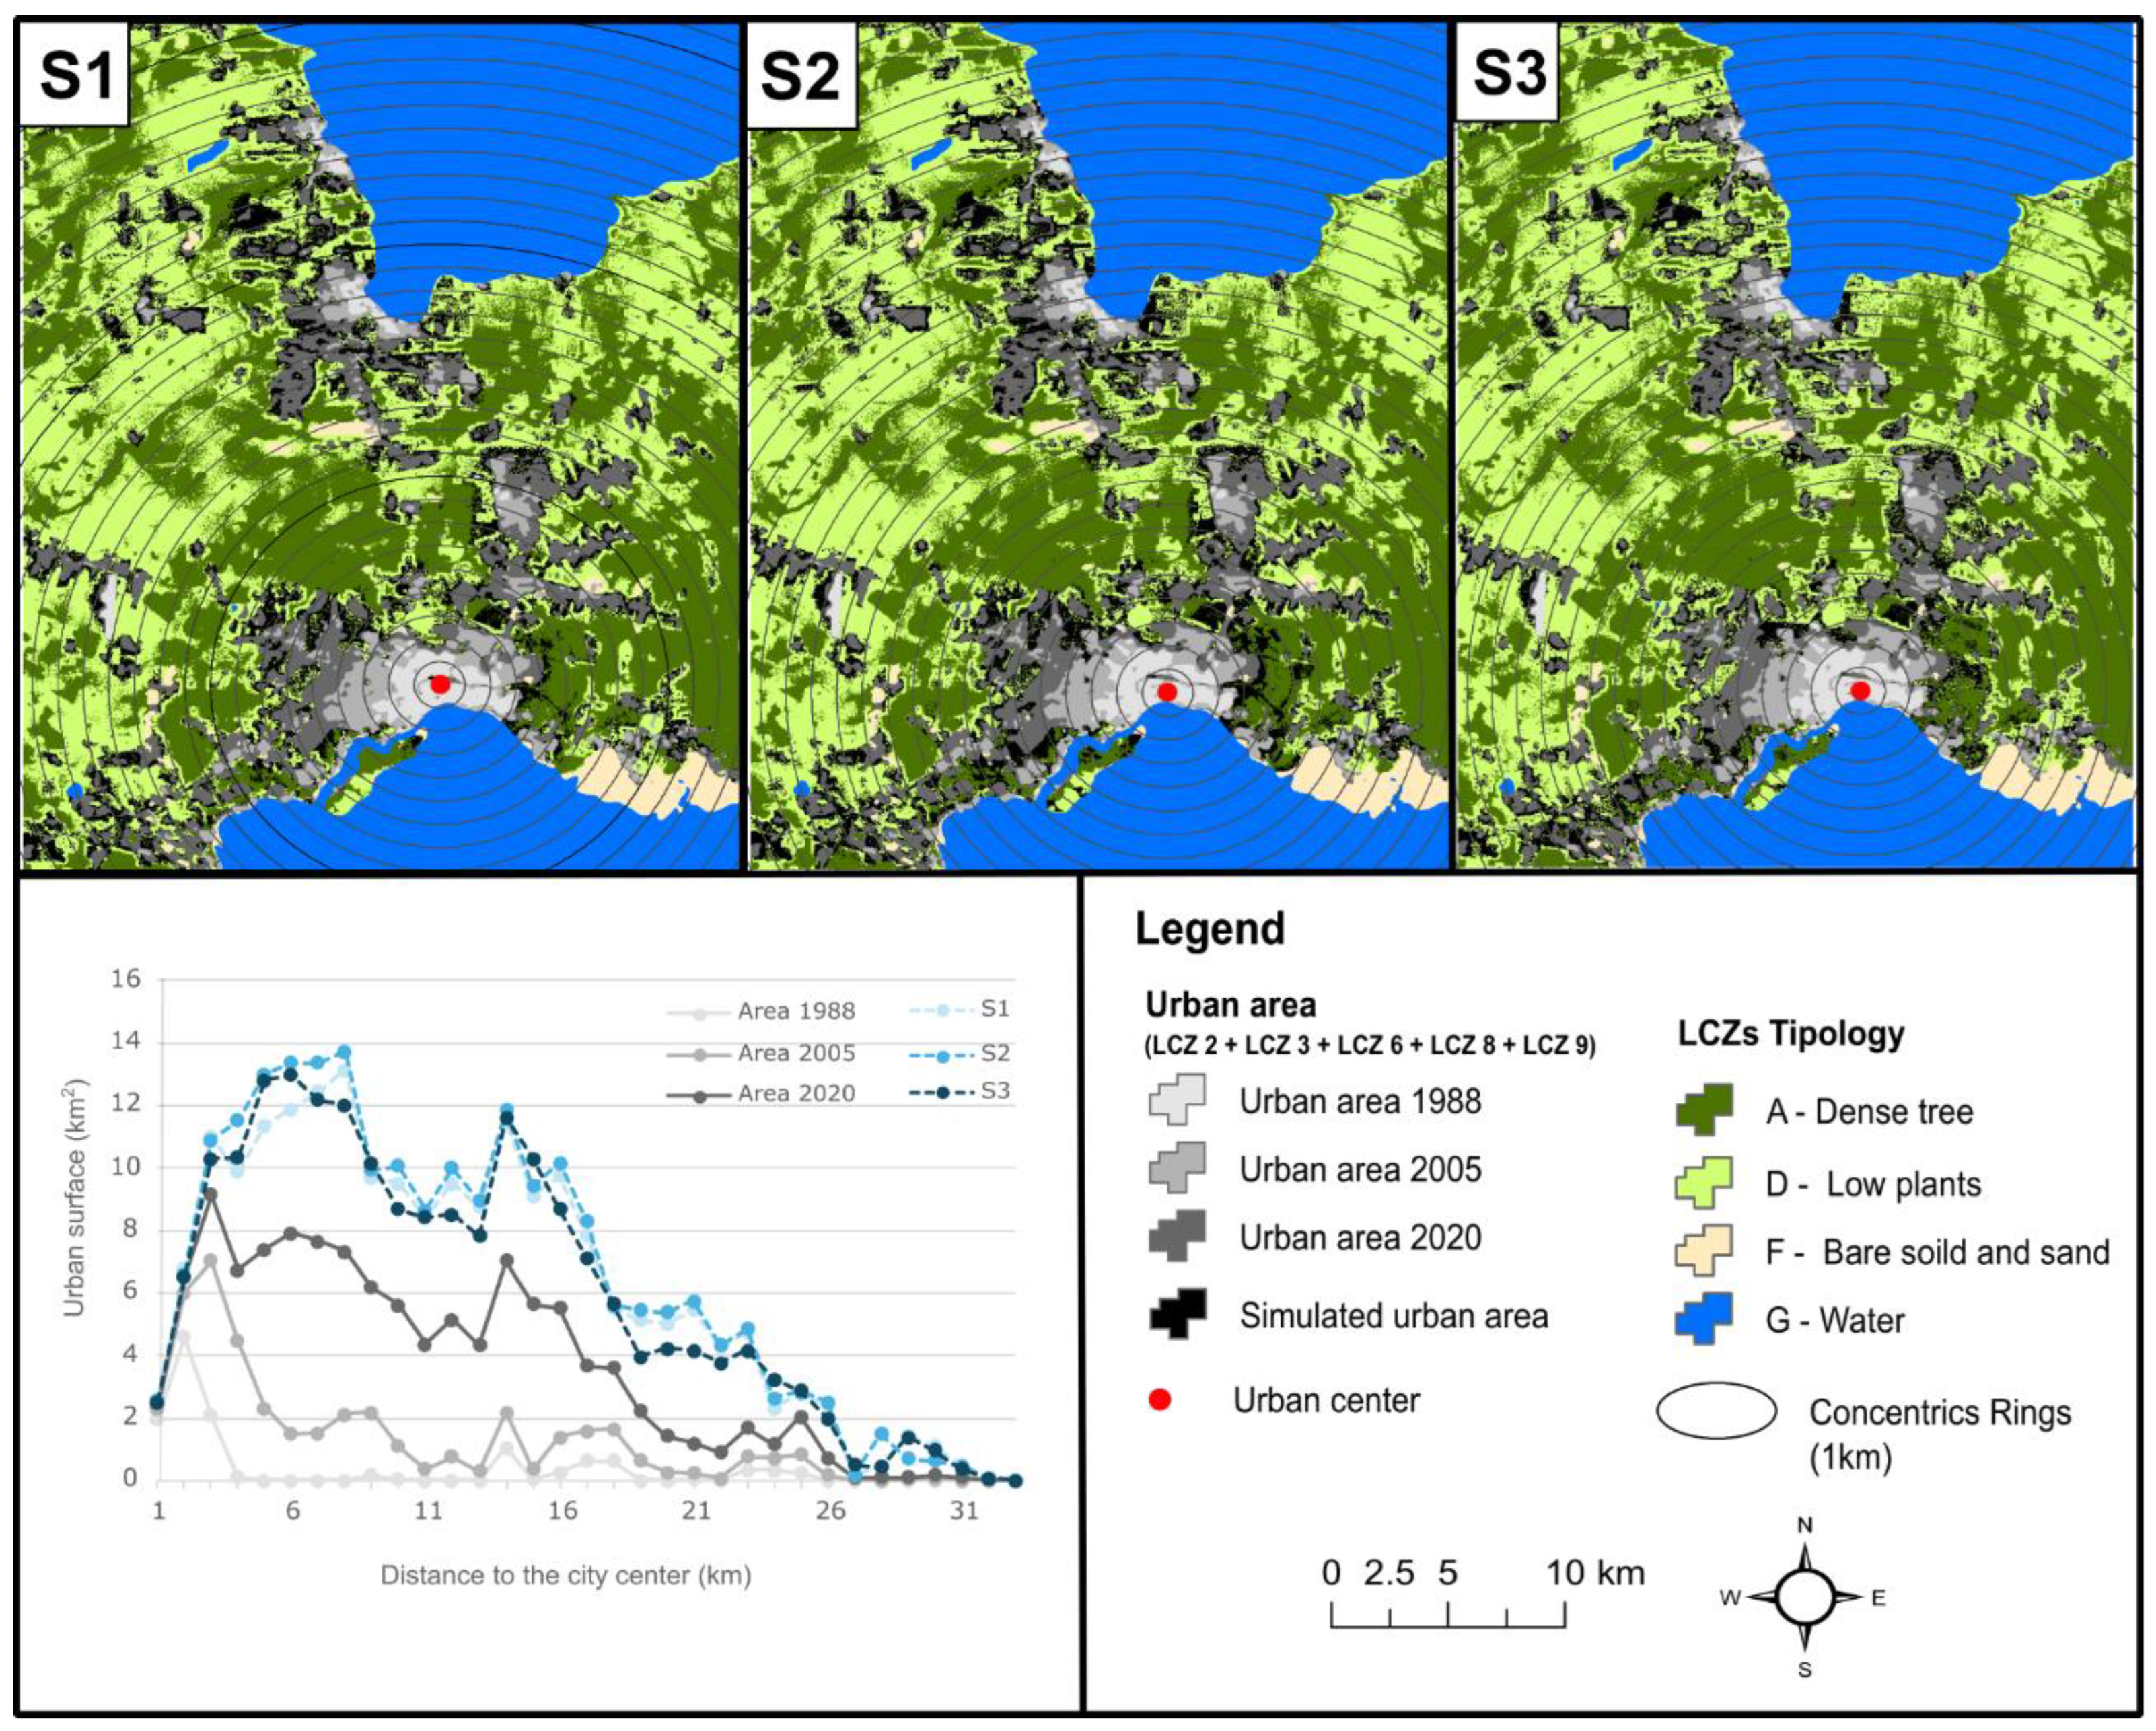
4.4. Analysis of Urban Expansion Patterns Simulated by 2050

For the city of Puerto Montt, an analysis of urban land density was conducted based on 33 rings or zones with a radius of 1 km (Figure 9). The highest absolute entropy value [Ln(33)] corresponds to 3.497. This value is very close to the absolute entropy simulated in the Business-As-Usual (BAU) Scenario 1 (S1), which is 3.218. These absolute entropy values decrease in the other two scenarios, being 3.210 in both the Urban-Regional Planning Scenario (S2) and the Conservationist Scenario (S3) (Table 8).
Figure 9 shows that the comparison of the three scenarios reveals variations in different sections of the ring zone. Near the city center (up to a distance of 2 km), the scenarios do not show significant changes in the distribution of the built-up urban area (LCZs 2 to 9). However, this trend begins to shift as the distance from the center increases, with a reduction in urban surface area around the 10-km mark, followed by an increase in the built-up area up to kilometer 16. This pattern indicates strong pressure for new construction on the outskirts of Puerto Montt. The highest relative entropy values (i.e., those closest to 1) are observed in Puerto Montt, suggesting that this city is likely to experience significant urban sprawl by 2050.

5. Discussion

5.1. Current and Future Dynamics of the Urban Expansion Simulation

In the analyzed period, the trajectories of the Local Climatic Zones (LCZ) reflect that in the hinterland of the city of Puerto Montt, the predominant zones are LCZ A (dense trees) and LCZ D (low plants). This pattern has also been documented in previous studies [56]. Furthermore, the parallel analysis of the three cities allowed us to explore whether there are general trends or irregularities in the distribution patterns of LCZs as a way to approach the presence of different urban uses. For instance, LCZ A (Dense trees) and LCZ D (Low plants) show irregular changes, where in the period 1988–2005, the annual growth rate increases, but in the period 2005–2020, it decreases.
The Random Forest model used to estimate the weight of the driving forces in the PLUS model predicted the probability of development of future Local Climatic Zones, improving the understanding of the factors driving this process in their future changes. Thus, the existence of spatial and temporal patterns of land use and land cover change evidenced for the city of Puerto Montt aligns with the general trend observed by Morales et al. [57], where a sustained increase in land cover changes (mainly agricultural) to low-density urban land (LCZ 6) or dispersed land (LCZ 9) is observed in each proposed scenario.

5.2. Potential Impacts of the Predicted LULC Changes

The spatiotemporal modeling of driving forces influencing the expansion of urban areas, particularly dispersed and low-density urban areas, as stated by Dubovyk et al. [58], demonstrates that the driving forces related to distances from primary or secondary urban centers are the most significant when estimating the weight of a variable in these explanatory models of land use and land cover [58], indicating that the driving forces related to distances from primary or secondary urban centers hold the greatest significance when estimating the weight of a variable in these explanatory models of land use and land cover. Additionally, the importance of distance to the structural road network of the city of Puerto Montt is also highlighted. These same variables have been emphasized in other studies simulating land use changes in cities in southern Chile, such as Temuco [12].
Unlike other studies simulating land use and land cover changes, the PLUS model incorporates driving forces, such as slope [59]. This variable is crucial in determining the weight within the Random Forest model used for each of the nine Local Climatic Zones. This reflects a significant bias when conducting this type of analysis, thereby preventing ecological fallacy in the regression.
Among the prevailing theoretical perspectives in Latin American urbanism, Bonilla-Bedoya et al. [60] highlight the role of infrastructure as a driver of urbanization—a subject that has been extensively debated over the past thirty years. The identification of infrastructure and services (e.g., buildings, potable water, and sewage systems) has been recognized as a key factor that increases the likelihood of urbanization (Quito, Ecuador). Similarly, López Granados et al. [61] observe a strong correlation between population growth and urban expansion, specifically in the Mexican context.

5.3. Diversity of Selected Scenarios by 2050

The results of the land use/land cover change simulations for Puerto Montt reveal a clear future trend toward the expansion of low-density construction urban areas (LCZ 6) and zones with sparse buildings (LCZ 9). This pattern of diffuse urban growth in the currently analyzed urban areas has already been observed in similar studies [7,12].
The main assumption for the different scenarios was that land transitioning to residential areas (LCZ 2, 3, 6, and 9) and industrial construction zones (LCZ 8) would not be converted to another use (elasticities greater than 0.7). This explicit change condition within the model determined that the results of the land use/land cover change simulations across all three scenarios (Business-As-Usual (BAU) Scenario, Urban-Regional Planning Scenario, and Conservationist Scenario) exhibit a significant alteration of land cover patterns in favor of new urban areas. This should not be surprising, as Chen and Man [62] indicate that in the application of the PLUS model to identify areas of rapid dispersed urban growth in Chinese cities, future urban land transitions are based on the loss of land designated for forestry plantations and agricultural activities. A similar trend was observed in the case of Puerto Montt city.

5.4. Limitations and Future Areas of Research

Regarding the use of the PLUS model, no studies were found applying this model to Chilean cities. The advantage and, at the same time, the opportunity of using this model in middle-sized cities in Latin America represent an innovation, given that the PLUS model originates from China [32] and has initially been applied in cities such as Nanjing (China) [31] and Zambia (Africa) [63].
For the implementation of the PLUS model, basic inputs are required (e.g., an updated land registry of rural subdivisions) to simulate changes in the patterns of dispersed urban expansion based on land-use and land-cover changes. In this regard, the scale of analysis that allows for the generation of land use/land cover maps using Landsat images is only suitable for large-scale analyses and not for neighborhood- or district-level studies.
Given the above, land use/land cover change simulations are considered a tool that should be closely monitored to identify spatial fragmentation patterns in rural areas caused by the advancement of dispersed urbanization. In the future, these simulations may help identify not only ongoing processes but also more complex urban phenomena, such as the formation of new metropolitan areas. However, the success of these policies hinges on addressing the fragmentation of governance structures, particularly in rural areas, where coordination between national, regional, and local authorities remains weak. The real test of these policies will be their ability to reconcile the differing priorities of stakeholders, ranging from environmental conservation to economic development, while also ensuring that local communities are not marginalized in decision-making processes [64].
Both private and public entities (municipalities or regional governments) can employ prospective scenario methodologies to address the inefficient use of urban areas or abandoned spaces within their respective territorial planning instruments. Studies conducted by Sanhueza-Aros and Peña-Cortés [65] have shown that prospective analysis is an appropriate approach for contexts characterized by high uncertainty and social conflict.
It would be beneficial for decision-makers to understand the attributes of geo-information tools in relation to changes in the urban-rural landscape by simulating future land use changes. For instance, this could be achieved using the CLUE model [66], the PLUS model itself [32], or other models that facilitate an understanding of the factors influencing urban area expansion in middle-sized cities.

6. Conclusions

The prospective scenarios of dispersed urban growth enabled the characterization of current urban expansion processes in Puerto Montt, which aligns with trends observed in other middle-sized cities in the southern macrozone of Chile, as well as the identification of potential future conurbations.
This pattern of urban growth is driven by a preference for city expansion rather than densification or the concentration of new housing and industrial areas. This form of urban development is characterized by fragmentation, and consequently, over the next 30 years, new low-rise, low-density residential areas, as well as commercial and industrial zones, are expected to be separated and scattered across the current rural hinterland of Puerto Montt.
The methodological application of entropy indicators in urban growth studies has enabled an objective and precise assessment and quantification of urban development distribution. In this regard, this study revealed that the relative entropy level for Puerto Montt is high, ranging between 0.87 and 0.96 out of a maximum value of 1.00 by 2050. This high figure implies that low-density or dispersed residential land use is fragmented across all the analyzed zones in the city.
As a result, this will lead to a lack of cohesion and continuity in the urban fabric, generating medium- and long-term social and environmental impacts. Utilizing such land use and land cover change simulation tools allows decision-makers, who are directly responsible for urban planning and territorial management in medium-sized cities transitioning toward metropolitan status, to identify, compare, and critically reflect on how to manage future land use patterns with different urban development objectives at the regional scale.
The formulation of multiple urban growth scenarios is based on the simplification of observed changes and dynamics over a 30-year period. Under the Business-As-Usual (BAU) Scenario, urban growth trends remain consistent. The implementation of two alternative scenarios (Urban-Regional Planning and Conservationist) has demonstrated that the proposed model for the city of Puerto Montt is sensitive when specific land uses are weighted.
Of the three simulated scenarios, both the Business-As-Usual (BAU) and Urban-Regional Planning scenarios incorporate the largest urban surface area into the city of Puerto Montt by 2050. According to the applied entropy indicators, and consistent with findings from other global studies, this increase occurs most significantly in the outer rings of the city. However, the Urban-Regional Planning scenario displays higher concentrations of future construction (primarily in rings 6, 14, 16, and 21).
Therefore, zoning-based planning and the selection of an appropriate land-use change model tailored to the medium-sized city under analysis are fundamental to ensuring comprehensive and coordinated development in areas transitioning toward metropolitan spaces. Thus, the diversity of urban contexts makes it necessary to adapt urban growth modeling and management approaches, for example, by emphasizing the integration of climate and environmental risk factors into planning strategies.

Author Contributions

Conceptualization, M.M., F.M., S.E. and F.P.-C.; methodology, M.M., F.M. and S.E.; writing—original draft preparation, M.M.; writing—review and editing, M.M., F.M., S.E. and F.P.-C.; visualization, M.M., F.M., S.E. and F.P.-C. All authors have read and agreed to the published version of the manuscript.

Funding

This work was supported by funding provided by FONDECYT of Agencia Nacional de Investigación (ANID), Chile, grant numbers 1221931 and 1230159.

Data Availability Statement

Data will be made available upon request.

Conflicts of Interest

The authors declare no conflicts of interest.

References

  1. Glaeser, E. Triumph of the City; Pan Books: London, UK, 2012. [Google Scholar]
  2. UN-Habitat III Declaración De Quito Sobre Ciudades Y Asentamientos Humanos Sostenibles Para Todos, Borrador De Septiembre 10 De 2016. 2016, p. 35. Available online: https://habitat3.org/wp-content/uploads/NUA-Spanish.pdf (accessed on 1 November 2024).
  3. Henríquez, C. Modelando El Crecimiento de Ciudades Medias. Hacia Un Desarrollo Urbano Sustentable; Ediciones Universidad Católica de Chile: Santiago de Chile, Chile, 2014. [Google Scholar]
  4. Nilsson, K.; Pauleit, S.; Bell, S.; Aalbers, C.; Nielsen, T.S. Peri-Urban Futures: Scenarios and Models for Land Use Change in Europe; Springer Publication: Berlin/Heidelberg, Germany, 2013; ISBN 978-3-642-30529-0. [Google Scholar]
  5. Echeverría, C.; Newton, A.C.; Lara, A.; Benayas, J.M.R.; Coomes, D.A. Impacts of Forest Fragmentation on Species Composition and Forest Structure in the Temperate Landscape of Southern Chile. Glob. Ecol. Biogeogr. 2007, 16, 426–439. [Google Scholar] [CrossRef]
  6. Williams, B.; Shahumyan, H.; Boyle, I.; Convery, S.; White, R. Utilizing an Urban-Regional Model (MOLAND) for Testing the Planning and Provision of Wastewater Treatment Capacity in the Dublin Region 2006–2026. Plan. Pract. Res. 2012, 27, 227–248. [Google Scholar] [CrossRef]
  7. Henríquez, C.; Morales, M.; Qüense, J.; Hidalgo, R. Future Land Use Conflicts: Comparing Spatial Scenarios for Urban-Regional Planning. Environ. Plan. B Urban Anal. City Sci. 2023, 50, 332–349. [Google Scholar] [CrossRef]
  8. Sleeter, B.M.; Sohl, T.L.; Bouchard, M.A.; Reker, R.R.; Soulard, C.E.; Acevedo, W.; Griffith, G.E.; Sleeter, R.R.; Auch, R.F.; Sayler, K.L.; et al. Scenarios of Land Use and Land Cover Change in the Conterminous United States: Utilizing the Special Report on Emission Scenarios at Ecoregional Scales. Glob. Environ. Change 2012, 22, 896–914. [Google Scholar] [CrossRef]
  9. IPCC. Special Report on Emissions Scenarios; Cambridge University Press: Cambridge, UK, 2000; p. 570. [Google Scholar]
  10. OECD. The Governance of Land Use in OECD Countries: Policy Analysis and Recommendations; OECD Publishing: Paris, France, 2017; ISBN 978-92-64-26878-4. [Google Scholar]
  11. Cebrián, F.; Sánchez, I. Urban Sprawl in Inner Medium-Sized Cities: The Behaviour in Some Spanish Cases Since the Beginning of the 21st Century. Urban Sci. 2019, 3, 10. [Google Scholar] [CrossRef]
  12. Maturana, F.; Morales, M.; Peña-Cortés, F.; Peña, M.A.; Vielma, C. Urban Growth, Real Estate Development and Indigenous Property: Simulating the Expansion Process in the City of Temuco, Chile. ISPRS Int. J. Geo-Inf. 2021, 10, 101. [Google Scholar] [CrossRef]
  13. Morales, M.; Maturana, F. Analysis of Spatial Patterns in the Urban Expansion of Middle-Sized Cities. The Case of San Fernando, Chile. Cuad. Vivienda Urban. 2019, 12. [Google Scholar] [CrossRef]
  14. Salazar, A.; Baldi, G.; Hirota, M.; Syktus, J.; McAlpine, C. Land Use and Land Cover Change Impacts on the Regional Climate of Non-Amazonian South America: A Review. Glob. Planet. Change 2015, 128, 103–119. [Google Scholar] [CrossRef]
  15. Borsdorf, A. Cómo Modelar El Desarrollo y La Dinámica de La Ciudad Latinoamericana. Eure 2003, 29, 37–49. [Google Scholar] [CrossRef]
  16. Zunino, H.; Hidalgo, R. Las Políticas de Vivienda En El Chile Neoliberal: Efectos Socioespaciales y Relaciones de Poder En El Caso Del Área Metropolitana de Valparaíso y Su Periferia. In Chile: Del País Urbano al País Metropolitano; Pontificia Universidad Católica de Chile: Santiago, Chile, 2009; p. 469. [Google Scholar]
  17. Allard, P.; Correa, J.I.; Sánchez, J.F. Parcelaciones Rurales: Propuestas Para El Desarrollo de Las Subdivisiones Rústicas En Chile; Centro de Estudios Públicos: Santiago, Chile, 2022. [Google Scholar]
  18. Instituto Nacional de Estadísticas. Censo de Vivienda y Población 2017; Gobierno de Chile: Santiago, Chile, 2017. [Google Scholar]
  19. Henríquez, C.; Pontius, R.G.; Contreras, P. Performance of CA_Markov and DINAMICA EGO Models to Evaluate Urban Risk in Antofagasta and Mejillones, Chile. Nat. Hazards 2024, 120, 8411–8435. [Google Scholar] [CrossRef]
  20. Mustelier, D.; Henríquez, C. Modeling Land Use Change of Mid-Sized Cities in the Process of Metropolization. Case Study La Serena-Coquimbo Conurbation, Chile. Geogr. Environ. Sustain. 2024, 17, 106–118. [Google Scholar] [CrossRef]
  21. Herrera-Benavides, J.; Pfeiffer, M.; Galleguillos, M. Land Subdivision in the Law’s Shadow: Unraveling the Drivers and Spatial Patterns of Land Subdivision with Geospatial Analysis and Machine Learning Techniques in Complex Landscapes. Landsc. Urban Plan. 2024, 249, 105106. [Google Scholar] [CrossRef]
  22. Ubilla-Bravo, G.F. A Geospatial Model of Periurbanization—The Case of Three Intermediate-Sized and Subregional Cities in Chile. Land 2024, 13, 694. [Google Scholar] [CrossRef]
  23. Aguila, M.J.; Prada, J. Crecimiento Urbano y Segregación Socioespacial En Valdivia. Rev. Urbano 2020, 23, 32–43. [Google Scholar] [CrossRef]
  24. Asubonteng, K.; Pfeffer, K.; Ros-Tonen, M.A.F.; Baud, I.; Benefoh, D.T. Integration versus Segregation: Structural Dynamics of a Smallholder-Dominated Mosaic Landscape under Tree-Crop Expansion in Ghana. Appl. Geogr. 2020, 118, 102201. [Google Scholar] [CrossRef]
  25. Del Pozo, A.; Catenacci-Aguilera, G.; Acosta-Gallo, B. Consequences of Land Use Changes on Native Forest and Agricultural Areas in Central-Southern Chile during the Last Fifty Years. Land 2024, 13, 610. [Google Scholar] [CrossRef]
  26. Abass, K.; Ko, S.; Agyemang, S. Peri-Urbanisation and Loss of Arable Land in Kumasi Metropolis in Three Decades: Evidence from Remote Sensing Image Analysis. Land Use Policy 2018, 72, 470–479. [Google Scholar] [CrossRef]
  27. Batty, M. The New Science of Cities; Massachusetts Institute of Technology: Cambridge, MA, USA, 2013. [Google Scholar]
  28. Batty, M.; Karmeshu, A. Strategy for Generating and Testing Models of Migration and Urban Growth. Reg. Stud. 1983, 17, 223–236. [Google Scholar] [CrossRef]
  29. Chen, M.; Samat, N.; Maghsoodi Tilaki, M.J.; Duan, L. Land Use/Cover Change Simulation Research: A System Literature Review Based on Bibliometric Analyses. Ecol. Indic. 2025, 170, 112991. [Google Scholar] [CrossRef]
  30. Wang, J.; Bretz, M.; Dewan, M.A.A.; Delavar, M.A. Machine Learning in Modelling Land-Use and Land Cover-Change (LULCC): Current Status, Challenges and Prospects. Sci. Total Environ. 2022, 822, 153559. [Google Scholar] [CrossRef]
  31. Gao, L.; Tao, F.; Liu, R.; Wang, Z.; Leng, H.; Zhou, T. Multi-Scenario Simulation and Ecological Risk Analysis of Land Use Based on the PLUS Model: A Case Study of Nanjing. Sustain. Cities Soc. 2022, 85, 104055. [Google Scholar] [CrossRef]
  32. Liang, X.; Guan, Q.; Clarke, K.C.; Liu, S.; Wang, B.; Yao, Y. Understanding the Drivers of Sustainable Land Expansion Using a Patch-Generating Land Use Simulation (PLUS) Model: A Case Study in Wuhan, China. Comput. Environ. Urban Syst. 2021, 85, 101569. [Google Scholar] [CrossRef]
  33. Wang, Z.; Li, X.; Mao, Y.; Li, L.; Wang, X.; Lin, Q. Dynamic Simulation of Land Use Change and Assessment of Carbon Storage Based on Climate Change Scenarios at the City Level: A Case Study of Bortala, China. Ecol. Indic. 2022, 134, 108499. [Google Scholar] [CrossRef]
  34. Feng, H.; Wang, S.; Zou, B.; Nie, Y.; Ye, S.; Ding, Y.; Zhu, S. Land Use and Cover Change (LUCC) Impacts on Earth’s Eco-Environments: Research Progress and Prospects. Adv. Space Res. 2023, 71, 1418–1435. [Google Scholar] [CrossRef]
  35. MINVU-SUBDERE-INE. Metodología Para las Áreas Urbanas Funcionales; Ministerio de Vivienda y Urbanismo: Santiago, Chile, 2020. [Google Scholar]
  36. Instituto Nacional de Estadísticas. Proyecciones de Población al 2035; Instituto Nacional de Estadísticas: Santiago, Chile, 2024. [Google Scholar]
  37. Sánchez, A.; Morales, R. Las Regiones de Chile: Espacio Físico y Humano-Económico; Editorial Universitaria: Santiago, Chile, 2004. [Google Scholar]
  38. Rovira, A. La Construcción de Una Metrópolis Regional: El Caso de Puerto Montt, Centro Urbano Intermedio Del Sur de Chile. In Chile: De País Urbano al País Metropolitano; Hidalgo, R., De Mattos, C., Arenas, F., Eds.; Pontificia Universidad Católica de Chile: Santiago de Chile, Chile, 2009; pp. 415–424. [Google Scholar]
  39. Escolano, S.; Ortíz, J. La Complejidad de Los Procesos de Reestructuración Socio Espacial de Las Ciudades Intermedias. An. Geogr. Univ. Complut. 2004, 24, 79–106. [Google Scholar]
  40. Contreras, J. Transformación Territorial de Puerto Montt: Del Intersticio Hostil al Escenario Metropolitano; Pontificia Universidad Católica de Valparaíso: Valparaíso, Chile, 2015. [Google Scholar]
  41. Dou, P.; Shen, H.; Huang, C.; Li, Z.; Mao, Y.; Li, X. Large-Scale Land Use/Land Cover Extraction from Landsat Imagery Using Feature Relationships Matrix Based Deep-Shallow Learning. Int. J. Appl. Earth Obs. Geoinf. 2024, 129, 103866. [Google Scholar] [CrossRef]
  42. Kaufman, Y.J.; Wald, A.E.; Remer, L.A.; Gao, B.-C.; Li, R.-R.; Flynn, L. The MODIS 2.1-Μm Channel-Correlation with Visible Reflectance for Use in Remote Sensing of Aerosol. IEEE Trans. Geosci. Remote Sens. 1997, 35, 1286–1298. [Google Scholar] [CrossRef]
  43. Stewart, I.D.; Oke, T.R. Local Climate Zones for Urban Temperature Studies. Am. Meteorol. Soc. 2012, 93, 1879–1900. [Google Scholar] [CrossRef]
  44. Aslam, A.; Rana, I.A. The Use of Local Climate Zones in the Urban Environment: A Systematic Review of Data Sources, Methods, and Themes. Urban Clim. 2022, 42, 101120. [Google Scholar] [CrossRef]
  45. Zheng, Y.; Ren, C.; Xu, Y.; Wang, R.; Ho, J.; Lau, K.; Ng, E. GIS-Based Mapping of Local Climate Zone in the High-Density City of Hong Kong. Urban Clim. 2018, 24, 419–448. [Google Scholar] [CrossRef]
  46. Smith, P.; Peralta, O.; Sarricolea, P.; Thomas, F.; Meseguer-Ruiz, O. Climate-Sensitive Planning. Opportunities through the Study of LCZs in Chile. Build. Environ. 2023, 242, 110444. [Google Scholar] [CrossRef]
  47. Romero, H.; Henríquez, C.; Smith, P.; Vásquez, A.; Tesser, C.; Opazo, D. Study of Urban Climate as a Basis for Climate Adaptation and Urban Planning in Chilean Cities. In Proceedings of the 9th International Conference on Urban Climate (ICUC9), Toulouse, France, 20–24 July 2015. [Google Scholar]
  48. WUDAPT. World Urban Database and Access Portal Tools Project. Available online: http://www.wudapt.org (accessed on 5 May 2018).
  49. Bechtel, B.; Demuzere, M.; Sismanidis, P.; Fenner, D.; Brousse, O.; Beck, C.; Van Coillie, F.; Conrad, O.; Keramitsoglou, I.; Middel, A.; et al. Quality of Crowdsourced Data on Urban Morphology—The Human Influence Experiment (HUMINEX). Urban Sci. 2017, 1, 15. [Google Scholar] [CrossRef]
  50. Huang, F.; Jiang, S.; Zhan, W.; Bechtel, B.; Liu, Z.; Demuzere, M.; Huang, Y.; Xu, Y.; Ma, L.; Xia, W.; et al. Mapping Local Climate Zones for Cities: A Large Review. Remote Sens. Environ. 2023, 292, 113573. [Google Scholar] [CrossRef]
  51. Shannon, C.E. A Mathematical Theory of Communication. Bell Syst. Tech. J. 1948, 27, 379–423. [Google Scholar] [CrossRef]
  52. Manesha, E.P.P.; Jayasinghe, A.; Kalpana, H.N. Measuring Urban Sprawl of Small and Medium Towns Using GIS and Remote Sensing Techniques: A Case Study of Sri Lanka. Egypt. J. Remote Sens. Space Sci. 2021, 24, 1051–1060. [Google Scholar] [CrossRef]
  53. Nazarnia, N.; Harding, C.; Jaeger, J.A.G. How Suitable Is Entropy as a Measure of Urban Sprawl? Landsc. Urban Plan. 2019, 184, 32–43. [Google Scholar] [CrossRef]
  54. Yeh, A.; Li, X. Measurement and Monitoring of Urban Sprawl in a Rapidly Growing Region Using Entropy. Photogramm. Eng. Remote Sens. 2001, 67, 83–90. [Google Scholar]
  55. Foody, G.M. Status of Land Cover Classification Accuracy Assessment. Remote Sens. Environ. 2002, 80, 185–201. [Google Scholar] [CrossRef]
  56. Colli, M.F.; Correa, É.N.; Martinez, C.F. Application of the Wudapt Method in the City of Mendoza-Argentina to Define Local Climate Zones. Urbano 2020, 23, 18–31. [Google Scholar] [CrossRef]
  57. Morales, M.; Maturana, F.; Escolano, S. Dinámicas de Cambios de Cobertura y Usos de Suelo de Las Ciudades y El Hinterland de La Macrozona Sur de Chile: El Caso de Temuco, Valdivia y Puerto Montt. In Proceedings of the Actas del XIX Congreso de Tecnologías de la Información GeográficaTIG al Servicio de los ODS, Zaragoza, Spain, 12–14 September 2022. [Google Scholar]
  58. Dubovyk, O.; Sliuzas, R.; Flacke, J. Spatio-Temporal Modelling of Informal Settlement Development in Sancaktepe District, Istanbul, Turkey. ISPRS J. Photogramm. Remote Sens. 2011, 66, 235–246. [Google Scholar] [CrossRef]
  59. Yu, Z.; Zhao, M.; Gao, Y.; Wang, T.; Zhao, Z.; Wang, S. Multiscenario Simulation and Prediction of Land Use in Huaibei City Based on CLUE-S and PLUS Models. Appl. Sci. 2023, 13, 7142. [Google Scholar] [CrossRef]
  60. Bonilla-Bedoya, S.; Mora, A.; Vaca, A.; Estrella, A.; Herrera, M.Á. Modelling the Relationship between Urban Expansion Processes and Urban Forest Characteristics: An Application to the Metropolitan District of Quito. Comput. Environ. Urban Syst. 2020, 79, 101420. [Google Scholar] [CrossRef]
  61. Lopez Granados, E.M.; Bocco, G.; Mendoza Cantú, M. Predicción Del Cambio de Cobertura y Uso Del Suelo. El Caso de La Ciudad de Morelia. Investig. Geogr. 2001, 1, 56–76. [Google Scholar] [CrossRef]
  62. Chen, L.; Ma, Y. Current and Future Characteristics of Land Use Based on Intensity Analysis and PLUS Model: A Case Study of Foshan City, China. SN Appl. Sci. 2023, 5, 83. [Google Scholar] [CrossRef]
  63. Mutale, B.; Qiang, F. Modeling Future Land Use and Land Cover under Different Scenarios Using Patch-Generating Land Use Simulation Model. A Case Study of Ndola District. Front. Environ. Sci. 2024, 12, 1362666. [Google Scholar] [CrossRef]
  64. Valdivia-Orrego, O.; Peña-Cortés, F. Mountain Territories: The Need to Approach Territorial Planning and Governance. Plan. Theory Pract. 2025, 25, 731–740. [Google Scholar] [CrossRef]
  65. Sanhueza-Aros, J.; Soria-Lara, J.A.; Peña-Cortés, F. Strategic Scenario Building for Planning Energy Resources: The Case of Araucania, Chile. Futures 2022, 141, 102968. [Google Scholar] [CrossRef]
  66. Veldkamp, A.; Fresco, L.O. CLUE: A Conceptual Model to Study the Conversion of Land Use and Its Effects. Ecol. Model. 1996, 85, 253–270. [Google Scholar] [CrossRef]
Figure 1. Map of the study area in the city of Puerto Montt.
Urbansci 09 00165 g001
Figure 3. Methodological flow for the simulation of land use and land cover based on the Patch-generating Land Use Simulation (PLUS) model for Puerto Montt.
Urbansci 09 00165 g003
Figure 4. Simplified diagram of the validation process for the LCZs simulation for 2020 applied to the city of Puerto Montt using the PLUS model.
Urbansci 09 00165 g004
Figure 5. Contribution of driving forces to the expansion of each Local Climate Zone in Puerto Montt. Key: A = Altitude; B = Density of people; C = Density of housing; D = Distance to financial activities; E = Distance to real estate projects of houses; F = Distance to commercial activities; G = Distance to real estate projects of apartments; H = Distance to educational establishments; I = Distance to projects of rural lots (parcels); J = Distance to main urban center; K = Distance to road network; L = Distance to health centers; M = Distance to secondary urban centers; Ñ = Distance to waste treatment centers; O = Slope.
Urbansci 09 00165 g005
Figure 6. Urban expansion probability maps obtained for the Local Climate Zones analyzed by the Random Forest method for the city of Puerto Montt.
Urbansci 09 00165 g006
Figure 7. Simulation results of land use and land cover in 2050 for the city and hinterland of Puerto Montt. Note: BS = Base Scenario (2020 observed); S1 = BAU Scenario; S2 = Urban-Regional Planning Scenario; S3 = Conservation Scenario.
Urbansci 09 00165 g007
Figure 8. Distribution of spatial allocation indicators (KLocation) and quantitative similarity (KHistogram) for the simulated LCZ categories in 2020 for the validation process.
Urbansci 09 00165 g008
Figure 9. Distribution of zones for the estimation of Shannon entropy values for the city of Puerto Montt. Note: S1 = BAU Scenario; S2 = Urban-Regional Planning Scenario; S3 = Conservationist Scenario.
Urbansci 09 00165 g009
Table 1. Images and bands were used for the periods of 1988, 2005, and 2020.
198820052020
Date imagesJune 5November 8January 2
ImagesLandsat 4 TMLandsat 7 ETM+
BandsB1/B2/B3/B4/B5/B7
Cloud cover percentage<10%
Horizontal resolution30 m
Table 2. List of independent variables (driving forces) used in the LEAS module.
DimensionVariableDirection of
Valorization
Source
SocioeconomicDistance to financial activitiesDirectOpenStreetMap https://www.openstreetmap.org (accessed on 20 October 2023).
Distance to commercial activitiesDirect
Distance to the structuring road networkDirect
Distance to housing real estate projectsDirectPortal Inmobiliario, https://www.portalinmobiliario.com (accessed on 10 October 2023), TocToc https://www.toctoc.com (accessed on 15 October 2023), and Real Estate Report, Chilean Chamber of Construction, 2023.
Distance to apartment real estate projectsDirect
Distance to rural land subdivision projectsDirect
Distance to educational centersDirectMinistry of Education, through IDE Chile, 2023.
Distance to healthcare centersDirectMinistry of Health, through IDE Chile, 2023.
Distance to main urban centerDirectOwn elaboration.
Distance to secondary urban centerDirect
Distance to landfill siteInverseInventory of final disposal sites, SUBDERE, 2019.
EnvironmentalAltitudeDirectALOS Satellite, Japan Aerospace Exploration Agency (JAXA), 2015.
SlopeDirect
SociodemographicPopulation densityDirectPopulation Census, National Statistics Institute (INE), 2017.
Housing densityDirect
Table 3. Details of the different land-use change scenarios based on the PLUS model.
Urban Growth Scenario for 2050Land Demand EstimationPolicy Development Zones
Application of Prioritization in Specific Development ZonesConstraints on Future Urban Developments
Business-as-usual (BAU) (S1)Calculated according to the historical trend of the LCZ using linear regression for two points, adjusted to the demand of key stakeholders.does not applyHydrography
(rivers, lakes, oceans)
Ecological protection and biodiversity areas (SNASPE Sites)
Indigenous communities
Urban wetlands
Urban-Regional Planning (S2)Calculated based on interviews with local stakeholdersCurrent urban boundary as of 2020 + 500-m buffer zone
Conservationist (S3)
Table 4. Definition of elasticities (weights) and priority development areas for each LCZ in the different scenarios proposed in the PLUS model for the city of Puerto Montt.
Typology of
Local Climate Zones (LCZ) Used in the Simulations
Definition of Urban Growth Scenario
Business-As-Usual (BAU) (S1)Urban-Regional Planning (S2)Conservationist
(S3)
ElasticitySpecific
Development Zones
ElasticitySpecific
Development Zones
ElasticitySpecific
Development Zones
LCZ 2—Compact mid-rise0.4does not apply0.4-0.4-
LCZ 3—Compact low-rise0.40.2-0.5-
LCZ 6—Open low-rise0.60.9Weight 0.80.5-
LCZ 8—Large low-rise0.10.1-0.1-
LCZ 9—Sparsely built0.90.7-0.5Weight 0.8
LCZ A—Dense tree0.30.7-0.1-
LCZ D—Low plants0.60.9-0.1-
LCZ F—Bare soil and sand0.10.1-0.1-
LCZ G—Water0.10.1-0.1-
Table 5. Distribution and variation of the LCZs in the city of Puerto Montt between 1988 and 2020.
Typology of
Local Climate Zones (LCZ) Used in the Simulations
ZCL Area (km2)Rate of Change
1988200520201988–20052005–2020
LCZ 2—Compact mid-rise0.400.410.623.6%51.2%
LCZ 3—Compact low-rise1.492.625.6475.6%115.3%
LCZ 6—Open low-rise8.6619.5741.53126.1%112.2%
LCZ 8—Large low-rise1.446.4114.79345.7%130.5%
LCZ 9—Sparsely built0.6914.2655.921966.0%292.1%
LCZ A—Dense tree144.02126.32120.08−12.3%−4.9%
LCZ D—Low plants588.73573.95499.59−2.5%−13.0%
LCZ F—Bare soil and sand10.7014.5417.2235.8%18.5%
LCZ G—Water229.60227.66230.35−0.8%1.2%
Total985.73
Table 6. Distribution of the proportion of simulated land use and land cover in 2050 for the city and hinterland of Puerto Montt.
Typology of Local Climate Zones (LCZ) Used in the SimulationsBusiness-As-Usual (BAU) (S1)Urban-Regional Planning (S2)Conservationist (S3)
LCZ 2—Compact mid-rise0.2%0.1%0.1%
LCZ 3—Compact low-rise1.2%1.1%1.1%
LCZ 6—Open low-rise7.1%8.7%6.5%
LCZ 8—Large low-rise3.4%3.4%3.4%
LCZ 9—Sparsely built15.2%15.9%14.7%
LCZ A—Dense tree33.8%32.4%34.6%
LCZ D—Low plants36.8%36.2%37.4%
LCZ F—Bare soil and sand2.3%2.3%2.3%
Table 7. Adjustment levels presented by the Kappa index for the land use/land cover change simulation model for the city of Puerto Montt.
Index
Kappa0.67
KLocation0.69
KHistogram0.97
Table 8. Shannon entropy values for the three simulated scenarios by 2050 for the city of Puerto Montt.
Scenarios to 2050Built Urban Area (km2)Absolute Entropy ValueRelative Entropy Value
S1 (Business-As-Usual)204.33.2180.920
S2 (Urban-Regional Planning)215.43.2100.918
S3 (Conservationist)198.73.2070.917
Ln (33)3.497
Disclaimer/Publisher’s Note: The statements, opinions and data contained in all publications are solely those of the individual author(s) and contributor(s) and not of MDPI and/or the editor(s). MDPI and/or the editor(s) disclaim responsibility for any injury to people or property resulting from any ideas, methods, instructions or products referred to in the content.

