Article

Urban Green Space in a Tropical Area—Quantification of Surface Energy Balance and Carbon Dioxide Flux Dynamics

by
Parkin Maskulrath
1,
Wladyslaw W. Szymanski
1,2,
Thanawat Jinjaruk
3,*,
Surat Bualert
1,
Jutapas Saiohai
1,
Siriwattananonkul Narisara
4 and
Yossakorn Fungkeit
1
1
Department of Environmental Science, Faculty of Environment, Kasetsart University, Bangkok 10900, Thailand
2
Faculty of Physics, University of Vienna, 1090 Vienna, Austria
3
Research and Innovation for Sustainability Center (RISC), Magnolia Quality Development Corporation Limited (MQDC), Samut Prakan 10540, Thailand
4
Graduate School of Natural Science and Technology, Kanazawa University, Kanazawa 920-1192, Ishikawa, Japan
*
Author to whom correspondence should be addressed.
Urban Sci. 2025, 9(5), 153; https://doi.org/10.3390/urbansci9050153
Submission received: 21 February 2025 / Revised: 22 April 2025 / Accepted: 30 April 2025 / Published: 6 May 2025

Abstract

:
Integrating green spaces into urban designs and planning for ecosystem services has become vital; however, in creating these spaces, the growth phase is often overlooked. This study provides insight into the changing energy and carbon dioxide (CO2) fluxes in a developing forest, “The Forestias” project in Thailand. The eddy covariance technique was applied to determine real-time surface energies and CO2 fluxes from December 2021 to September 2023. The results suggest that under fast growing conditions of the green areas, the diurnal latent energy flux corresponded with the area gained. This effect was supported by increasing evapotranspiration through the byproduct of canopy gas exchange. Consequently, the influence of green areas on lowering the average ambient temperature compared with the urban non-green surroundings was observed. In terms of CO2 flux dynamics, the increasing efficacy of photosynthesis was parallel with the growing forest canopy. Changes in flux dynamics due to urban green areas show their potential as a mitigation tool for moderating ambient air temperatures. Moreover, they can serve as a carbon sink within tropical cities and provide a pivotal contribution in reaching carbon neutrality.

1. Introduction

The growing need for urban green areas has raised the societal demand for real estate and urban developers to promote the well-being of residents, minimize negative impacts on the environment, and contribute to global sustainability goals towards net-zero emissions and carbon neutrality.
Thailand is strongly encouraging the construction of green real estate, a commercial development model that adopts green building ideas and combines them with real estate development. Theoretically, the established green areas are treated as local climate controllers, providing the uptake of local atmospheric carbon dioxide (CO2) and thus becoming a carbon sink. The release of water vapor through evapotranspiration (ET) supports an increase in latent heat (LE) and controls the different heat fluxes that regulate ambient temperature. Heat flux control has become increasingly important considering the climate-change-dependent ambient temperatures and observed linkage between extreme temperatures and mortality [1]. Surface energy balance and CO2 flux are pivotal factors driving natural phenomena, such as the water cycle, carbon cycle, and meteorological conditions [2]. However, the rapid expansion of cities due to population growth and economic development has considerably shifted land use. Green areas, such as agriculture, wetlands, and groves, are being replaced by buildings, roads, and various structures. This transformation contributes significantly to the urban heat island phenomenon, prompting increased energy consumption in urban areas and a consequent rise in city air temperatures [3,4,5].
The surge in urban air temperatures can be explained through the principle of surface energy balance, particularly concerning the release of greenhouse gases, predominantly CO2 flux, in tropical areas such as Thailand due to irradiation. The received solar radiation energy can be allocated to three main activities: LE energy in water evaporation, heat energy stored in the soil, and energy used in metabolism [6,7]. The increase in impervious surfaces such as buildings and roads diminishes water evaporation, directing energy towards air heating and consequently elevating ambient air temperatures. This transition also affects the release of CO2 from human activities (anthropogenic sources) coinciding with urban lifestyles.
Green area technology, known for its influence on increasing LE through water evaporation and CO2 fixation via ET and plant photosynthesis, is a principle or technology applied to address such challenges. It aims to balance energy and CO2 levels in urban areas by considering physical, biological, and human resource utilization [8].
Studies on the movement of CO2 and energy balance have revealed that green spaces mitigate the impact of the urban heat island effect, contributing to the population’s comfort and lowering surrounding temperatures, even beyond the factual area covered by trees [9].
This phenomenon, termed the urban greenspace cooling effect, has been reported recently, demonstrating that the best results have been observed in urban parks with an area of 10 ha [10]. Furthermore, urban carbon sequestration studies suggest that higher and larger trees often provide better sequestration rates than shrubs and lawns [11]. However, these urban green spaces usually indicate a significantly lower sequestration rates when compared with that of natural forests. While these problems are well-quantified in many high-latitude cities, knowledge regarding effects of tropical urban green areas is still rather limited. This study aims to provide quantified findings regarding this issue and help to describe the spatial correlations of land use carbon emissions with inter-regional economic interactions and transportation factors for the development of future cities [12], thus providing supporting information for strategic planning in managing carbon emissions.
The present research describes a scientific and systematic study conducted on-site on the Forestias Project in Bangna, Thailand. This study was designed to obtain reliable evidence regarding the local environmental impacts on energy balance and CO2 fluxes by applying the eddy covariance (EC) technique aiming to quantify the potential of urban green space for sequestering carbon dioxide. The EC technique is considered a representative micrometeorological method in carbon cycle studies. All measurements were performed inside an area named the “Deep Forest”. In addition, the progress in plant growth within the Deep Forest linked to the in situ measurement of changing energy fluxes was studied, covering the spatial and temporal forestry characteristics from the seeding stage in December 2021 until September 2023.

2. Materials and Methods

2.1. Study Site and Measured Forest Parameters

The study site was located in the middle of the Forestias Project, a mixed-usage zone consisting of residential areas covering over 636,800 m2 that includes hospitals, hotels, shopping centers, industrial houses, and condos. The surroundings can be best described applying the land use and land cover map utilizing the Normalized Different Vegetation Index (NDVI) in describing the areas of forest and built-up areas (Figure 1). Within the Forestias Project, a central area of 6000 m2 was designated as the natural zone of the Deep Forest, in which fast-growing vegetation was planted following the methodology suggested by Miyawaki [13].
The following steps were employed in this study: (1) employment of four layers of plants; (2) planting of native species, including Toona ciliata, Oroxylum indicum, Spathodea campanulate, and Albicia procera; (3) determination of the plant density of the four species per square meter, and (4) covering the base of trees after planting with rice straw or other organic materials aimed at reducing water loss in the soil.
The Deep Forest is characterized by the coexistence of different evergreen and deciduous forest species. In an annual measurement plan for all planted species, these three main parameters were considered: (1) tree density, (2) average tree height, and (3) diameter at breast height (DBH). For trees with a height below 1.3 m, the root collar diameter (RCD) was determined. These forest parameters were measured on site during the period as the flux measurement campaign.

2.2. EC Technique

This study utilized eddy covariance (EC) techniques, comprising the Campbell Scientific Open-Path Eddy Covariance (OPEC), an IRGASON infrared gas analyzer (IRGA), and 3D sonic (SON) systems to measure CO2 density (mg m−3), which takes into account the 3-dimensional wind gradient in the calculation of the CO2 flux, H2O density (g m−3), sensible heat (H) and LE fluxes (W m−2), and momentum flux between the atmosphere and the Earth’s surface, obtaining the net radiation (Rn) shown in Equation (1) and Table 1. A fast-response three-dimensional sonic anemometer (CSAT3) measured the wind speed, wind direction, temperature, and ambient humidity. The obtained data enabled the computation of the H and LE fluxes. The momentum flux was acquired with a temporal resolution of 10 Hz using Easy Flux DL (Campbell Scientific, Logan, UT, USA). For the calculation of the surface energy balance, all determined heat fluxes were considered:
Rn = LE + H + G
The EC system was mounted on a tower positioned 15 m above ground level. Notably, the average height of the trees in the Deep Forest was 3.1 m as of September 2023. This signifies the importance of the tower height being approximately five times higher than the average canopy height, which is shown later using a modelling approach. With respect to the local microclimate measurements, the net radiation was also bidirectionally monitored for short-wave and long-wave irradiances (downward long-wave and short-wave radiation and upward long-wave and short-wave radiation). Photosynthesis-active radiation (PAR) was measured to assess the absorption ability of plants with respect to CO2 flux. Furthermore, in addition to the flux assessment above the ground surface, the flux below the ground was also measured with the ground heat flux plate and soil humidity sensor to calculate the ground heat flux.

2.3. Data Collection Periods—Dry and Wet Seasons

The study period (December 2021–September 2023) was divided into phases corresponding to the two weather seasons, covering the typical climate patterns of Thailand: the dry and wet seasons. The rationale for this approach was to observe the seasonal impacts on surface energy and CO2 fluxes.
The months of December through February are considered the dry season in Thailand based on the volume and average frequency of rainfall. The available climate data from the Kasetsart University Meteorology Department showed that the 30-year cumulative annual (1993–2023) averages of the rainfall during January and February were 9.1 and 9.7 mm, respectively. The dry season provides favorable measuring conditions that limit the noise in the data by reducing the interference caused by rainfall. Additionally, dry and cooler periods often exhibit a more stable surface boundary layer [14,15].
September and October are representative of the wet season in Thailand. Data available from the Meteorology Department showed that the aggregated average 30-year rainfall was 344.2 and 241.6 mm for 21 and 17 rainy days, respectively. Therefore, the measurement periods were planned according to the seasons, with the specific times and locations detailed in Table 2.
Measurements were conducted continuously for each period between 16 and 27 d. However, owing to occasional missing data during the measurement times, periods of 14 d with complete datasets were selected for this study. This was performed following the reasoning suggested in analogous studies [16], which showed that based on the comparison of seasonal averages for 200 sites and 1500 site-years of forest data globally, a 95% confidence interval was calculated when periods of 6–11, 8–14, 10–15, and 15–23 d were used for gross primary productivity, ecosystem respiration, LE flux, and H flux, respectively. Consequently, the chosen period of 14 d for the determination of CO2 flux and surface energy balance was suitable and representative for this study.

3. Results and Discussion

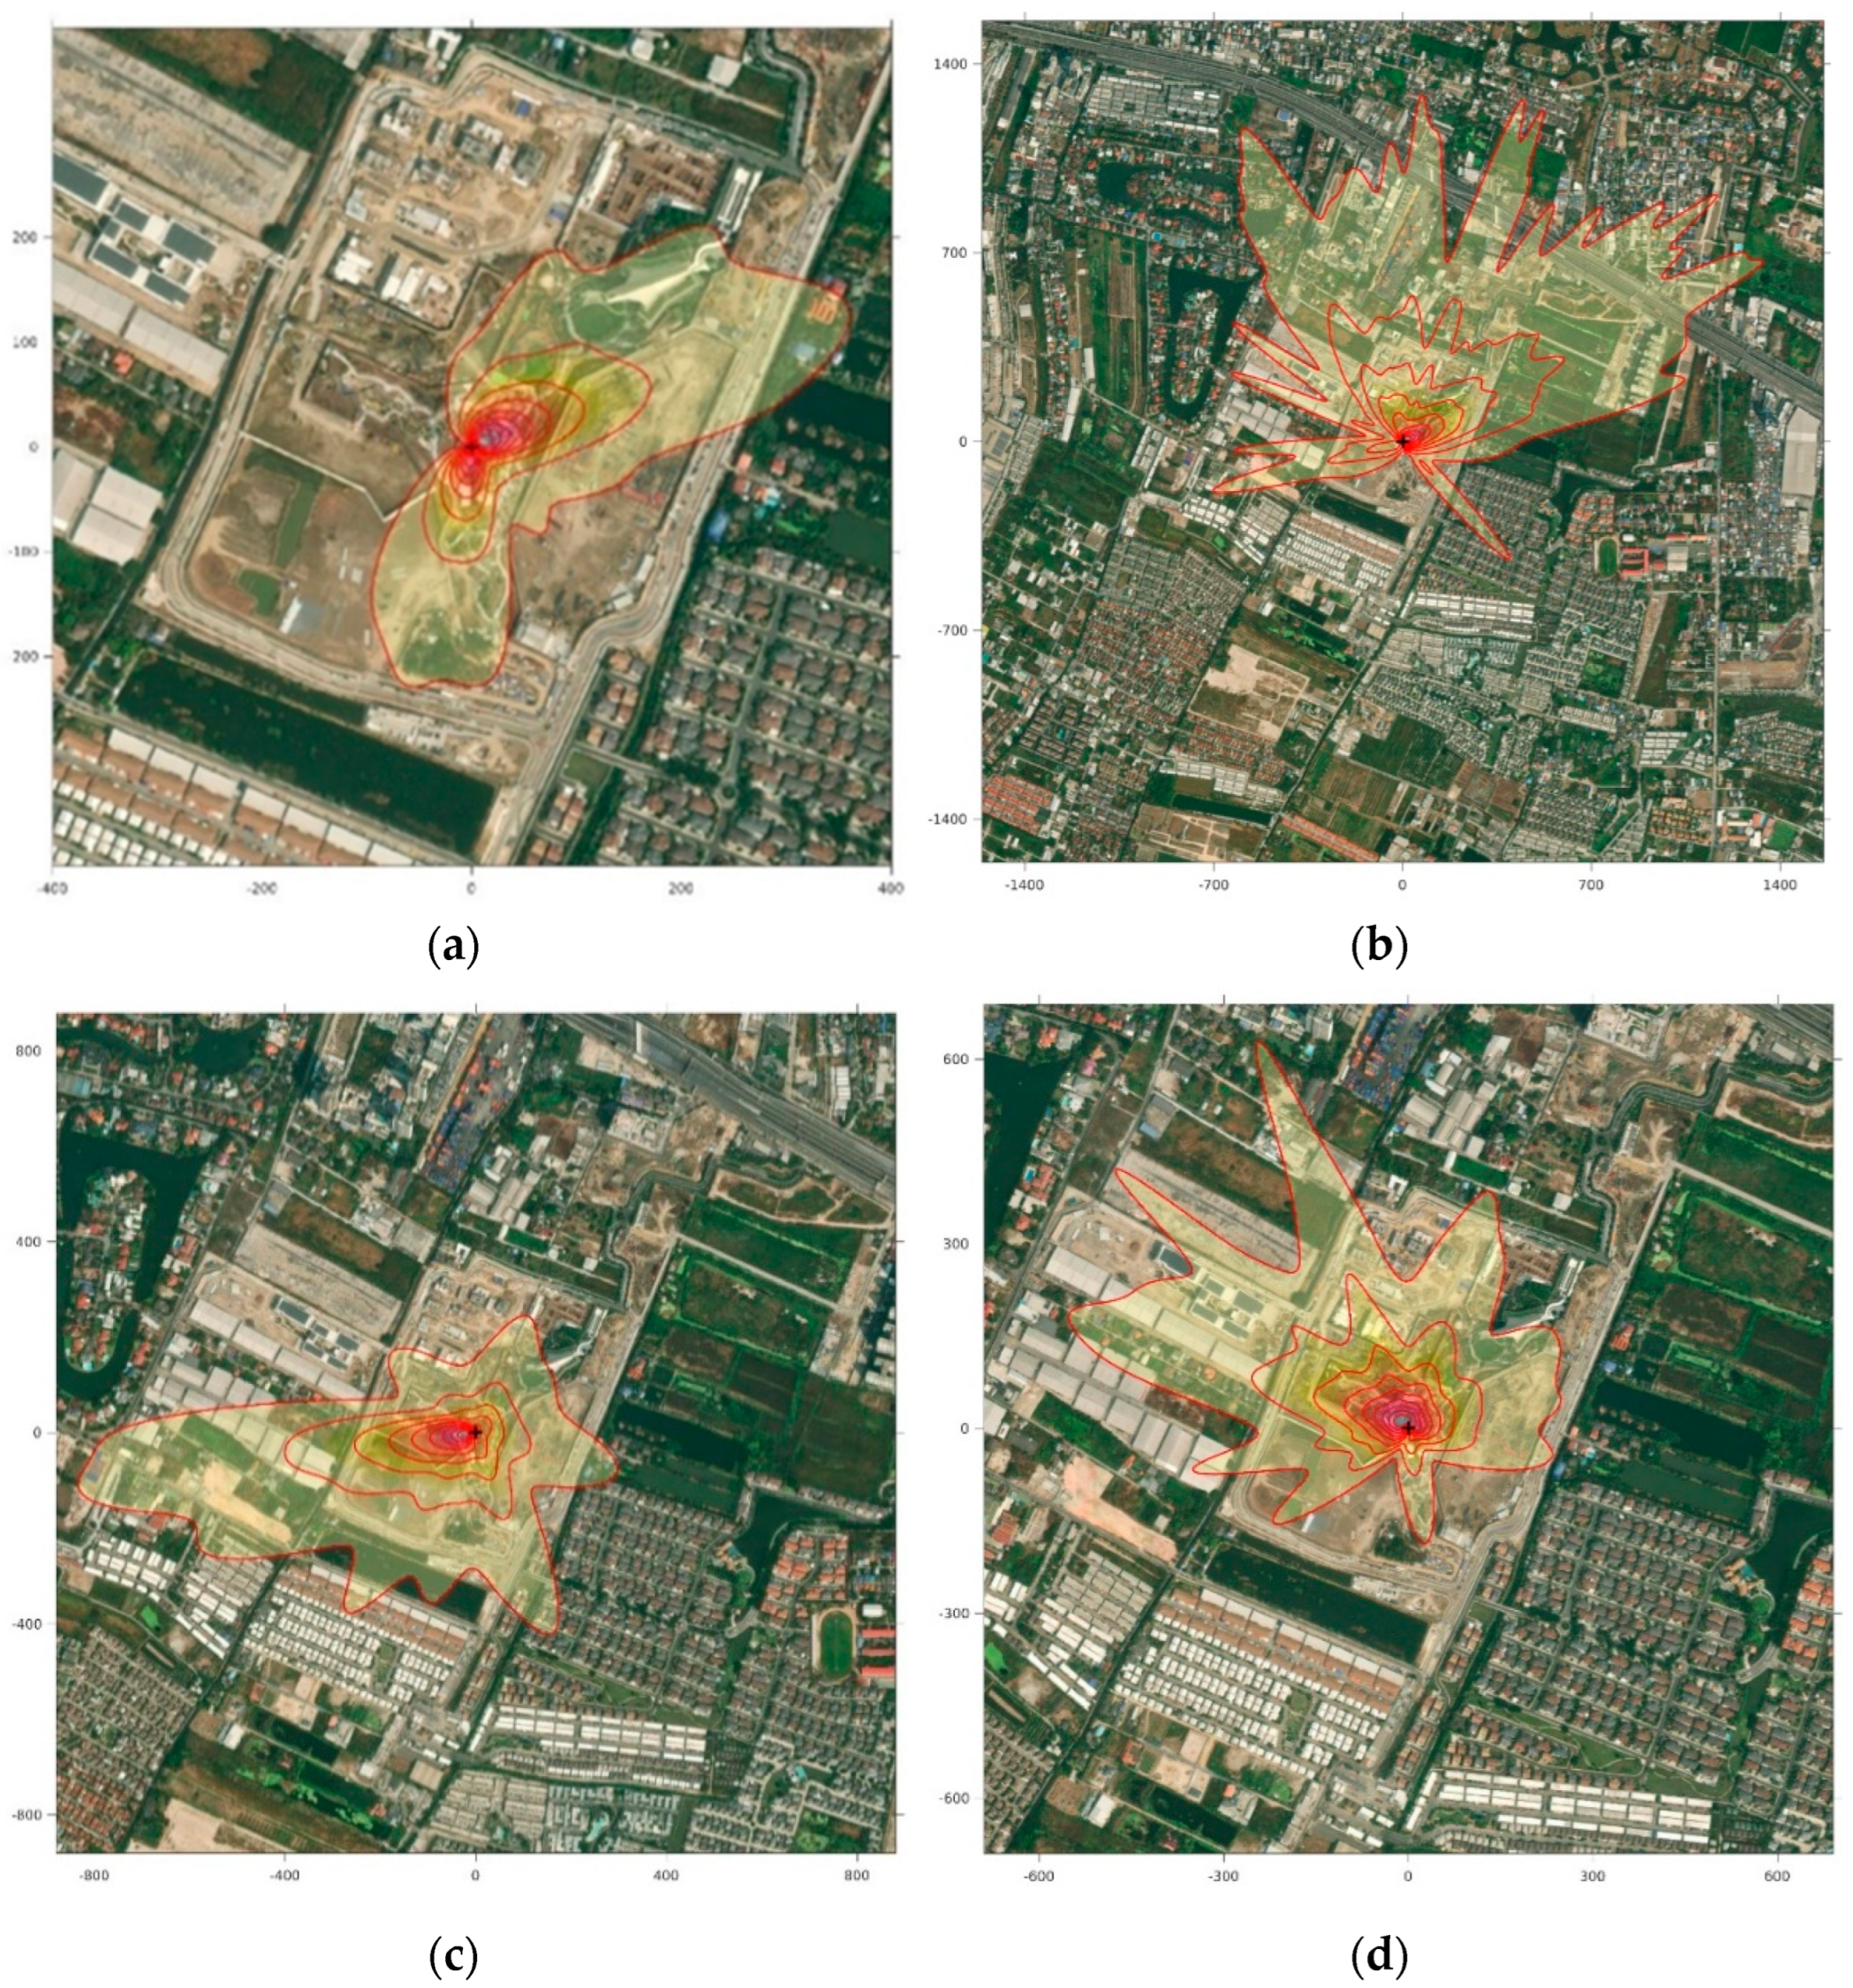
3.1. Flux Footprint Prediction (FFP)

Energy flux measurements from towers provide single-point information. To assess the significance of the location of a measuring system, FFP models are often used to portray the spatial coverage of the surface area by considering the surface characteristics. These characteristics usually influence the turbulent flux measurements under specific atmospheric conditions at a given time. Hence, FFP modelling has gained popularity as an important tool in local and remote studies on the interaction between surface properties and energy fluxes [17].
Data were acquired using the described experimental arrangement at a rate of 10 Hz. The half-hourly averaged data were then derived from the postprocessing program. These values were used to calculate the FFP based on a previously described 2D model [18]; (http://footprint.kljun.net). The FFP analysis for the Deep Forest reveals that the areas covered by the footprint included the forest pavilion (north) as well as some small areas of the current construction site. With 90% of the data footprint being within the scale of the Deep Forest area, the collected data evidently fell within the desired spatial scale. Considering the land classification scheme [19], 45.5–53.1% of the footprint coverage fell within the defined land use of the green areas. Quantification of the positive impact of developing urban green areas and the flux footprint of the areas beyond the “Deep Forest” provide the influence of the anthropogenic (construction) areas that have to be accounted for in the addition of CO2 into the ambient concentration values. This uncertainty frequently results from the actual setting of urban green areas, where it is inevitable to include anthropogenic activities (Figure 1 and Figure 2).

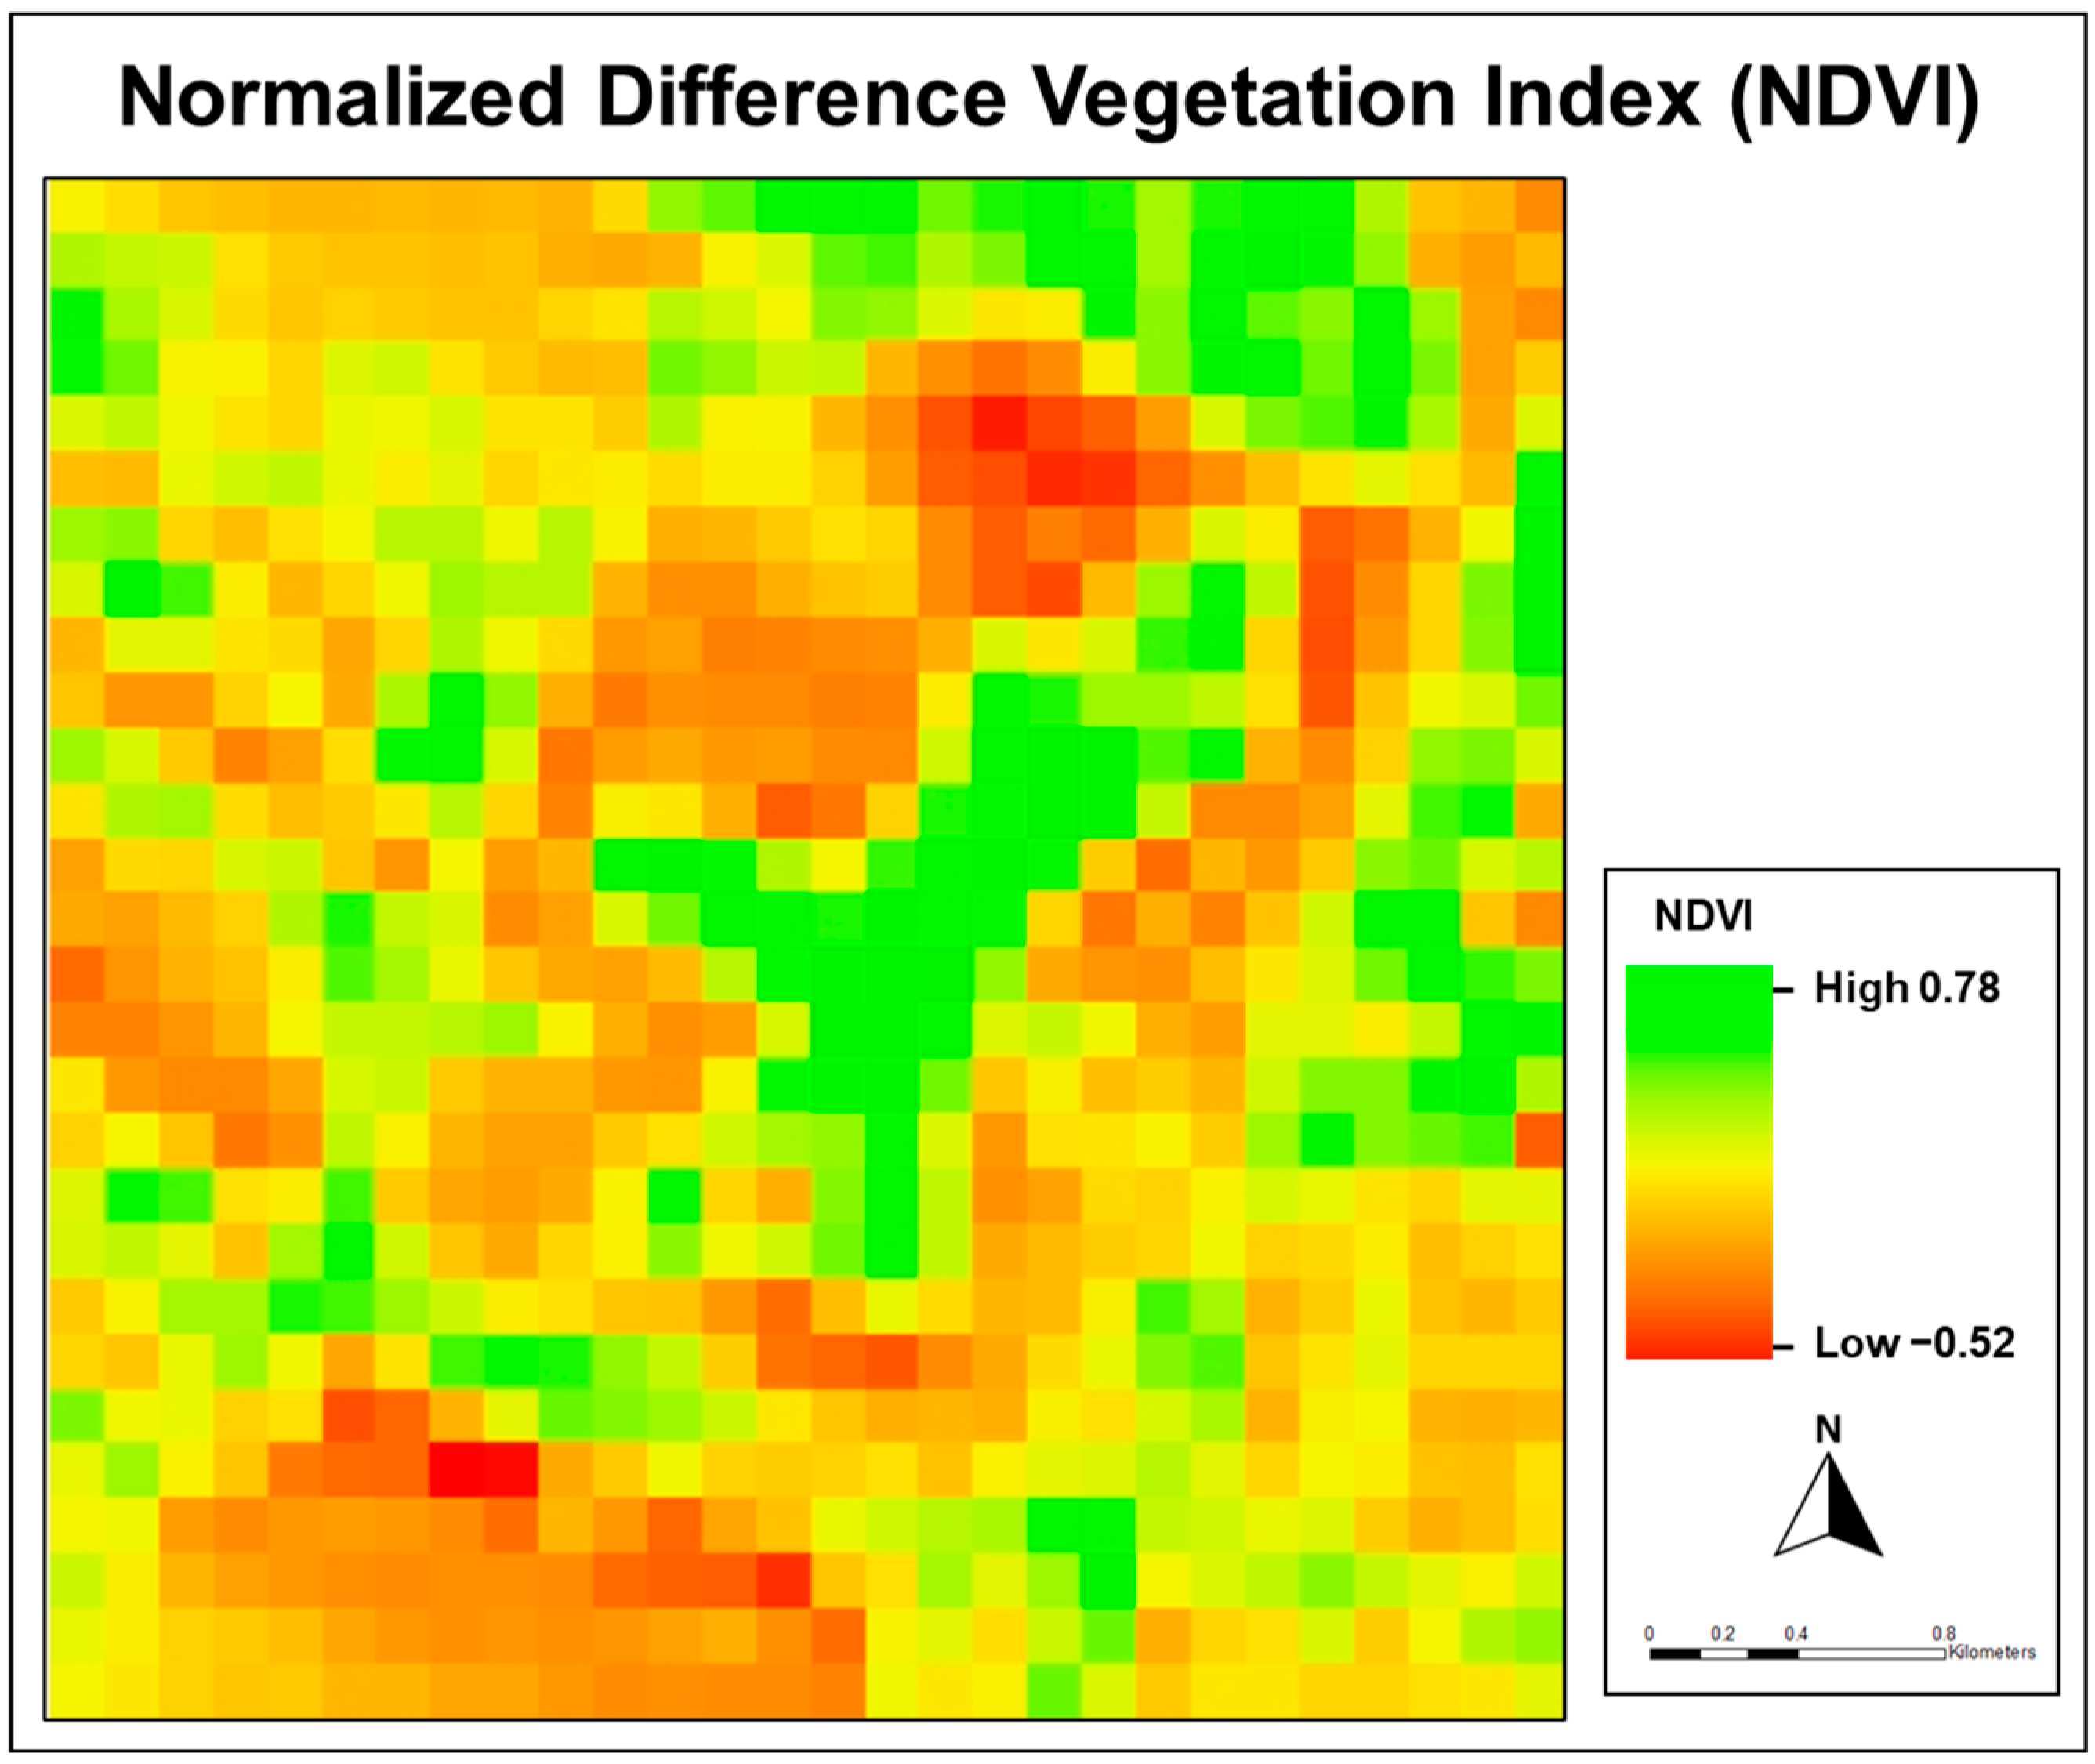
3.2. Forest Characteristics

The temporal development of the Deep Forest was examined annually regarding the surface tree density, average tree height, and the diameter at the breast height (DBH). In cases where tree height was less than 1.3 m, the root collar diameter (RCD) was measured. The height, DBH, and RCD increased from the initial planting stage in 2021 to a recent measurement in September 2023. This increase can be explained by the uptake of nutrients, including carbon, nitrogen, and other micronutrients from the soil and atmosphere, by the forest for growth in terms of both height and diameter. However, tree density would eventually decrease owing to forest secession and plant competition driven by the need for light for photosynthesis. With decreasing density, canopy coverage increased. This increase is expected to result in changes in the ET rate, supporting a higher rate of gas exchange in the leaves and thus promoting higher LE and CO2 sequestration rates within the forest zone.
Table 3 summarizes the progress of plant growth in the Deep Forest area of The Forestias from the beginning of the planning phase until September 2023.

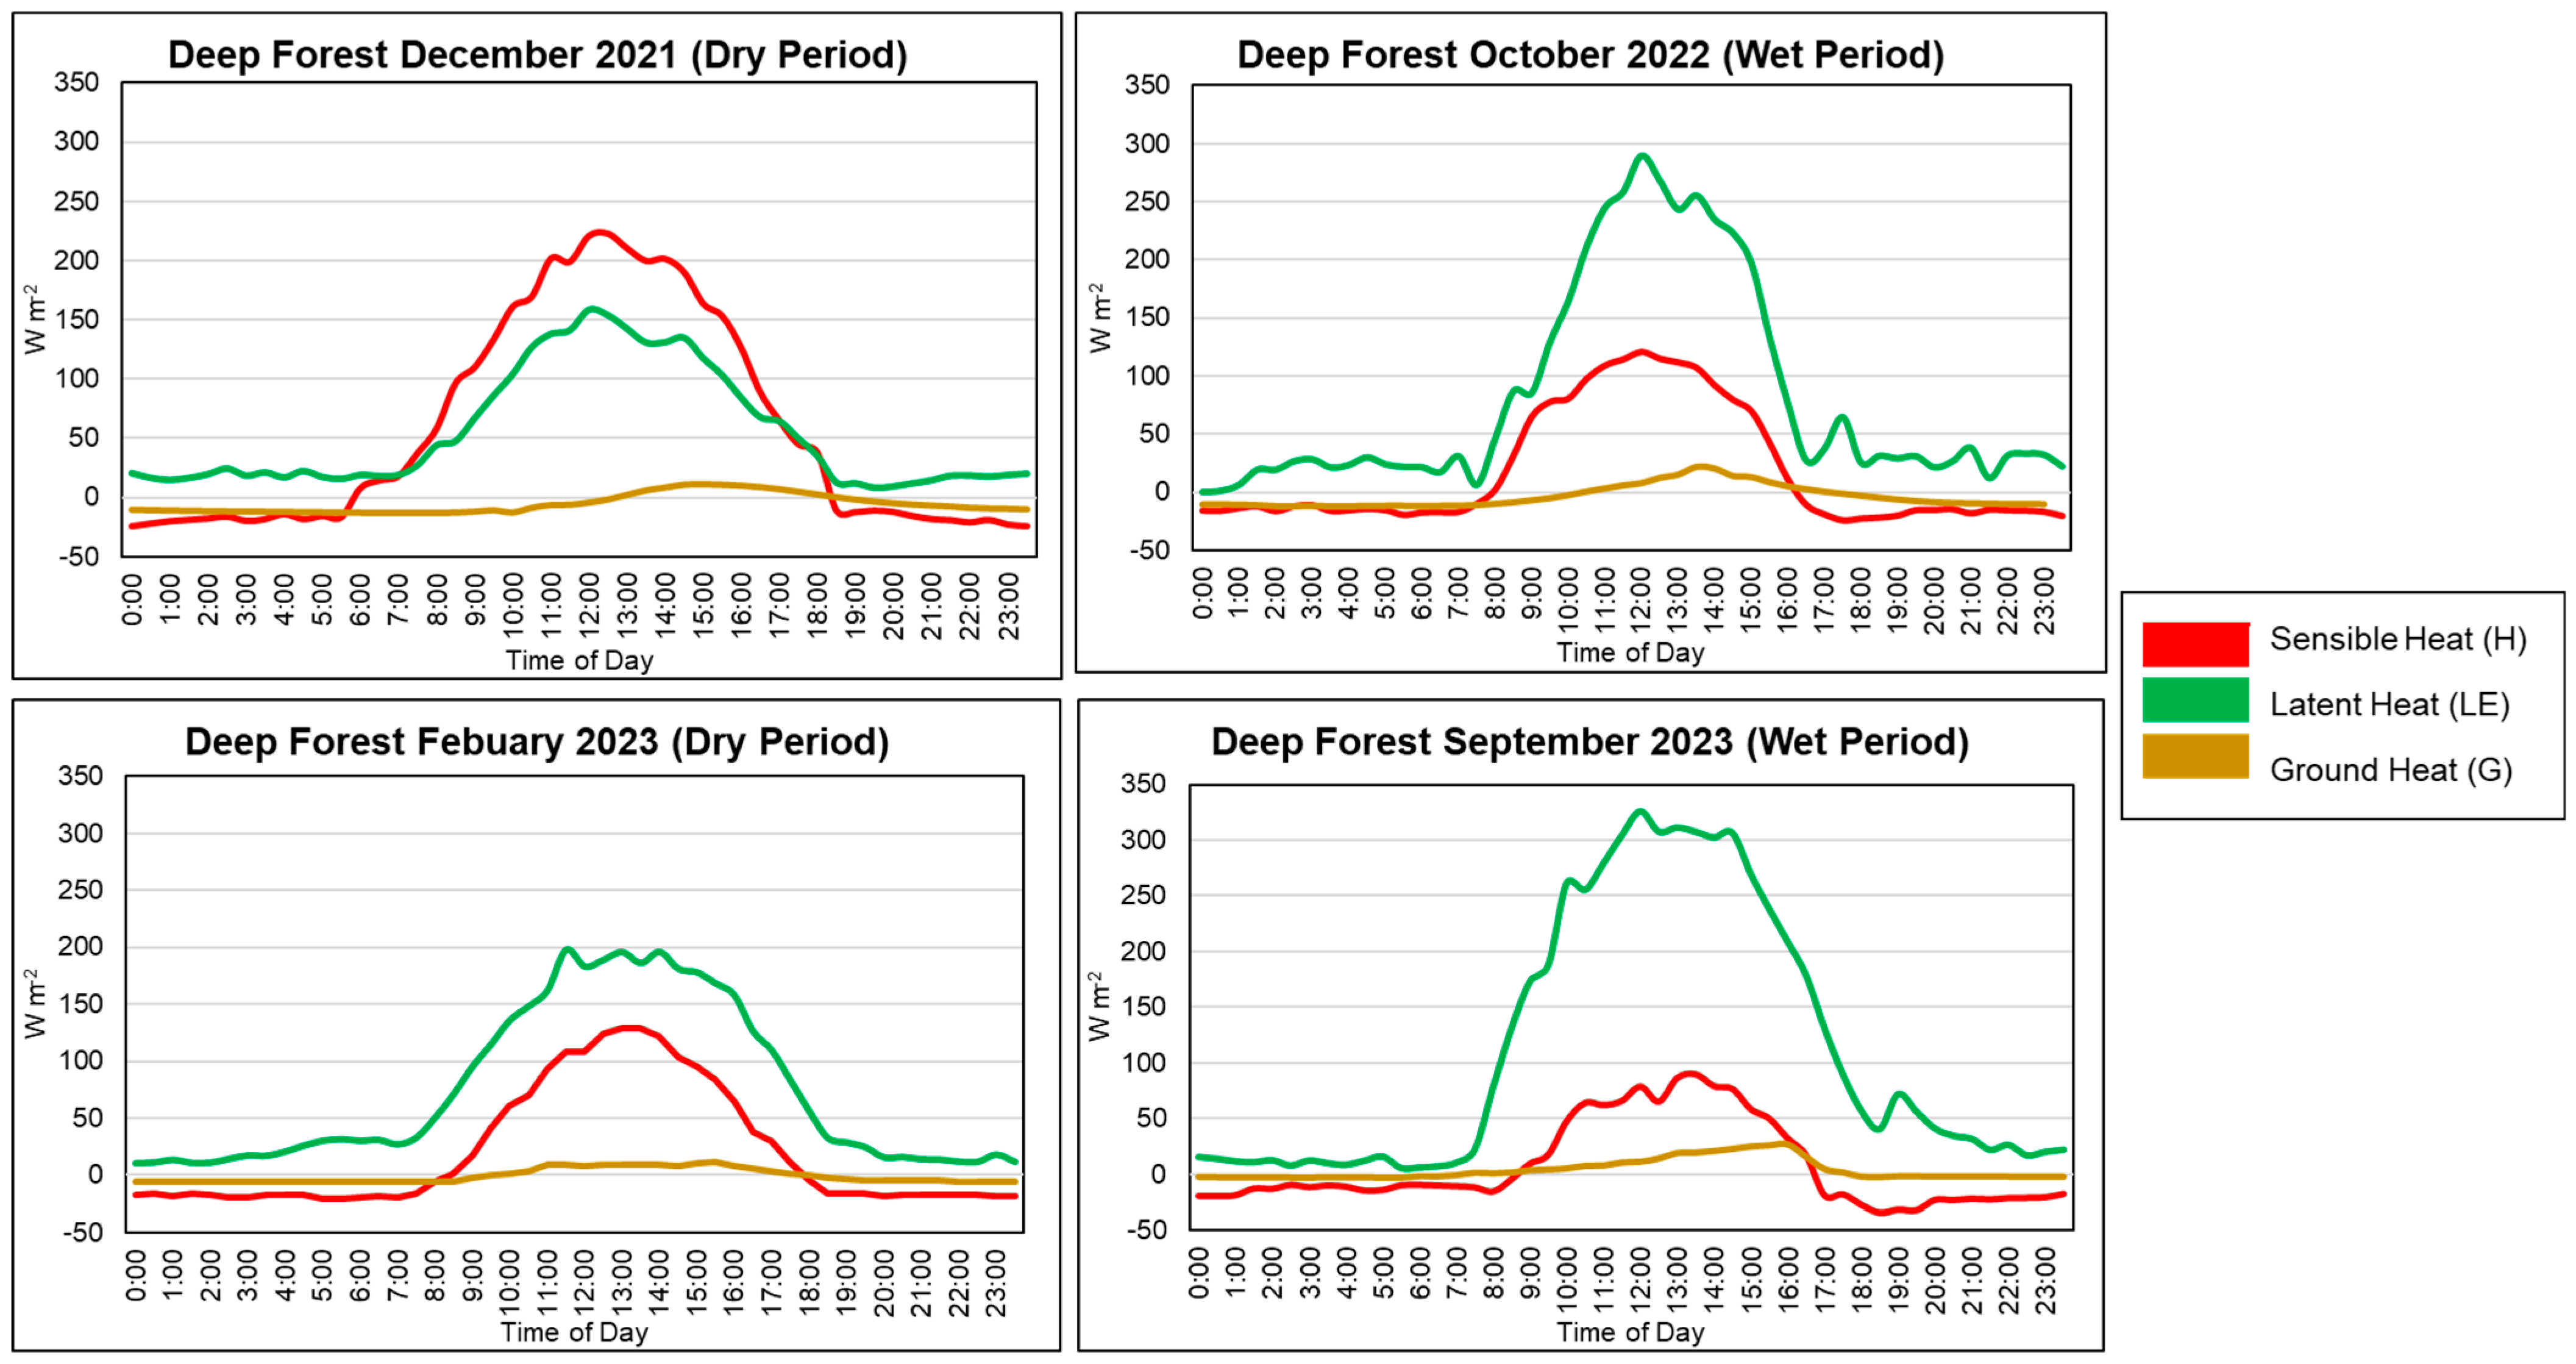
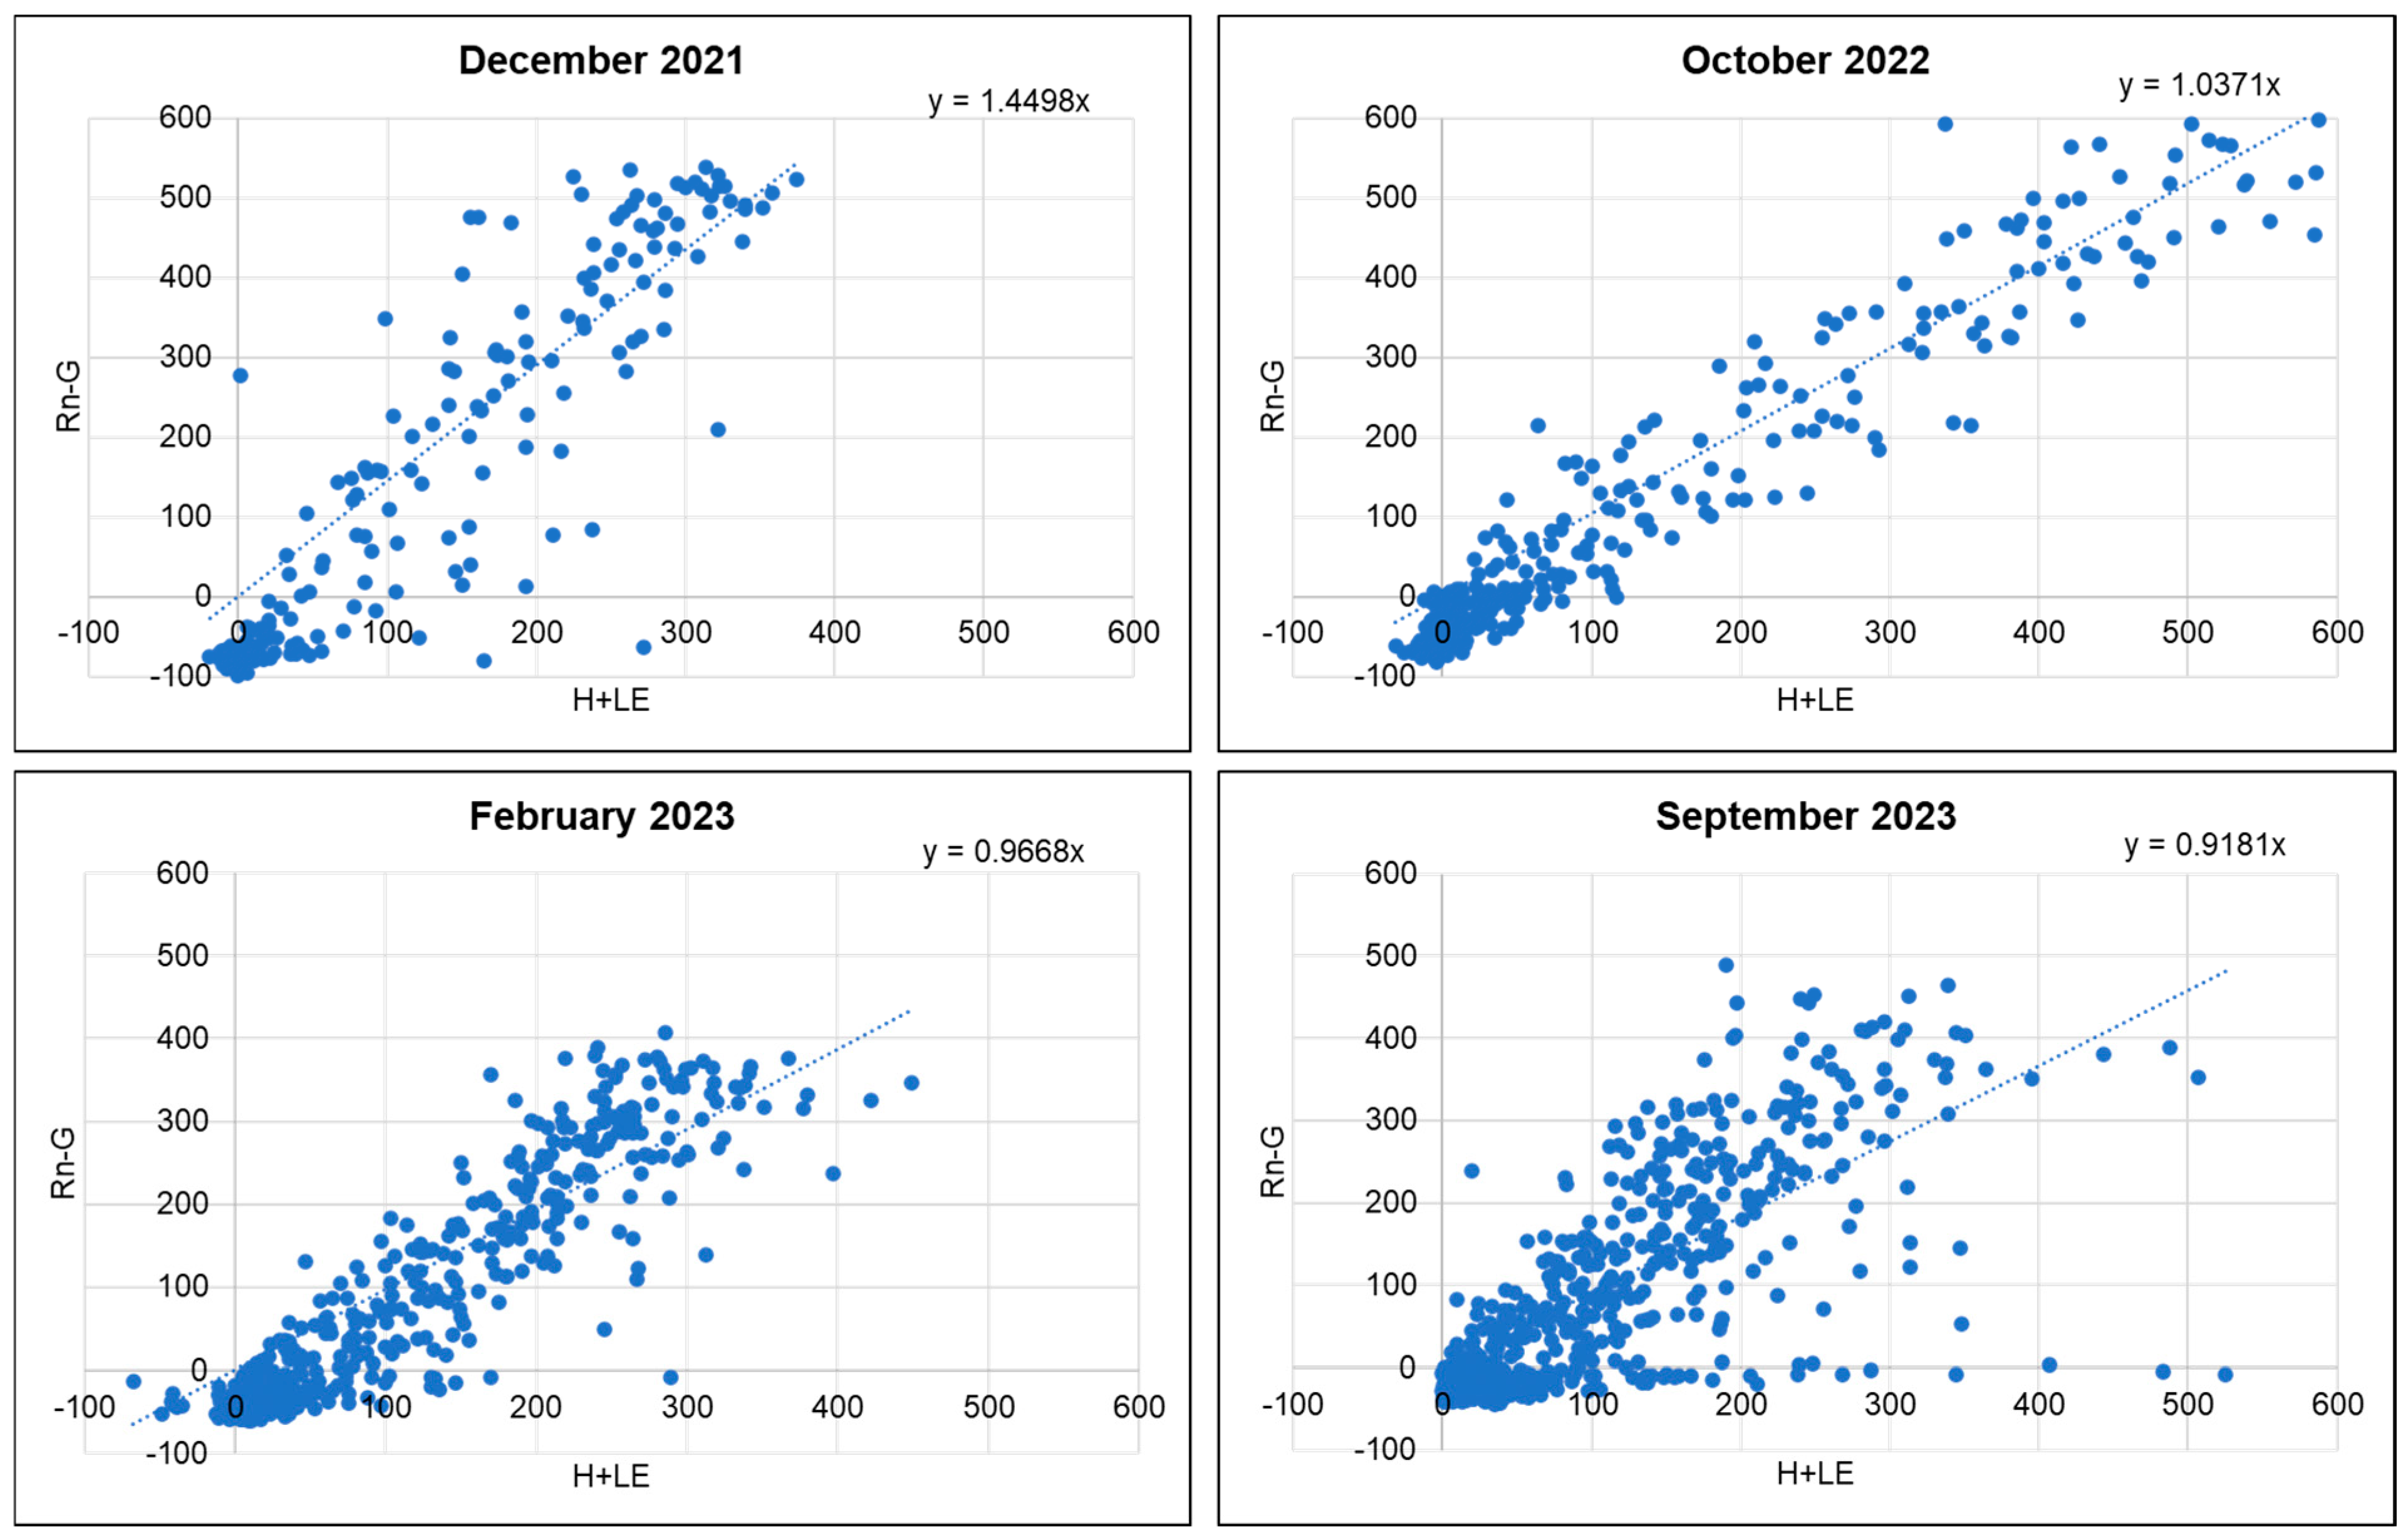
3.3. Surface Energy Balance

Forest structure complexity is an important factor in the promotion of ET because it enhances the trapping of water vapor within the forest layers, which contributes to the increase in LE heat flux within the study area. The obtained results were evaluated by considering the temporal availability of the data. Therefore, different time steps were taken depending on the data used. Comparing the heat flux changes from December 2021 to September 2023, noticeable growth was observed in the Deep Forest trees, both in DBH and height. This growth contributes to an increase in the leaf area index and crown coverage [20], signifying a greater presence of leaves driven by competition for light as a key factor in the photosynthesis process. Consequently, changes in the canopy layers are likely to increase the ET rate. This is because water vapor is released through stomata as a byproduct of photosynthesis. Seasonal effects were present, in which the dry period resulted in a lower ET, as has been reported for lowland dipterocarp forests [21]. In this research, the ET was calculated based on the gap-filled data of the EasyFlux Program, showing a rate of 2.63 in 2021 to 3.82 mm d−1 in 2023, respectively [22].
The measurement of ET in forested areas can be viewed as a key component of surface water heat transfer. As the forest expands, its complexity aids in regulating water balance. The intricate canopy coverage resulting from decreased density, coupled with increased height and DBH, contributed to this complexity. Figure 3 demonstrates that during the wet period, the LE was notably higher owing to increased water vapor availability during the rainy season in Thailand. However, the overall trend showed that the net radiation remained relatively constant throughout the measurement period. The increase in LE within the Deep Forest, coupled with the decrease in H, illustrates the impact of green areas [23] also observed that an increase in crown cover promotes higher ET, which in turn increases the water vapor content within the forest area, resulting in a larger LE flux. This is in agreement with other studies [24], in which urban energy balance data derived from the cities of London, Basel, and Heraklion showed that LE was highest in vegetated areas, as moisture advection enhanced LE flux and reduced H.
The linkage of LE to the forest ecosystem via photosynthesis, which involves CO2 absorption into the leaf and the subsequent release of water vapor into the atmosphere, leads to an increase in LE in the surrounding areas [25]. This increase was evident in the measured LE flux, which increased from a diurnal average of 22% in 2021 to 37% in 2023 in the dry period and 27% in 2022 to 39% in 2023 in the wet period. Figure 3 shows the changes in the energy balance. However, in an urban environment, the magnitude of LE is still lower than that in a rural or natural setting, in which the LE is much higher within the same tropical zones. The increase in LE can be further explained by forest growth, suggesting that a higher release of water vapor is related to canopy complexity, as suggested by ref. [26], in which differences among canopy surfaces also generated cooler temperatures supported by LE. The results from a similar study in Manchester also found that mature trees have a significant impact on the urban surface temperature, with the results indicating that an increase in mature tree density (5%) reduces the surface temperature by 0.5–1.0 °C [27].
Considering the observed overall energy conversion, the average temperature of the Deep Forest zone was found to decrease from an average of 29.6 °C in 2021 to 27.3 and 28.5 °C during the dry and wet seasons of 2023, respectively. Similar results were also shown in a study conducted in Seoul [28], with the conclusion that small green spaces with an area of 300 and 650 m2 can result in a 1–2 °C temperature reduction. Furthermore, ref. [29] found that the enhanced heat transport efficiency achieved through park creation in Sakai, Japan decreased daytime surface temperatures by 3.9–4.9 and 0.1–0.6 °C during the night-time. The greatest contribution to daytime surface cooling was achieved in the summer months, when the temperature gradient was the greatest between urban and green areas.
The energy balance ratio = (LE + H)/(Rn − G) was calculated, in which LE and H are the latent and sensible heat fluxes, Rn represents the net radiation, and G is the ground heat flux. The slope values were found to decrease from 1.41, 1.03, 0.96, and 0.91 during the timespan from 2021 to 2023 (Figure 4). This indicates that the turbulent heat fluxes decreased, reflecting that the study contained more available energy, which in these circumstances reflects the land use, referring to canopy storage or photosynthetic heat flux. However, in urban applications, differences in the closure ratio are often referred to as the remaining energy from storage and anthropogenic heat fluxes, which in urban settings are often converted into H and later promote an increase in temperature [30]. According to the acquired data, the decrease in these fluxes was influenced by the increasing dominance and maturity of the Deep Forest area. This shift indicates an increase in LE flux as part of the increasing ET rates as well as in the ground heat flux, which is attributed to the forest floor holding more water owing to natural microbial activities playing a crucial part in the nutrient cycle that supports the growing forest.
Because of the relationship with the anthropogenic heat fluxes (Qf), an increase in green areas would provide a higher LE flux, which helps the overall energy balance and decreases the gap within the energy closure ratio. This change plays an important role in the implementation of green areas in urban environments [31,32]. In relation to the rising concerns of urban heat island intensity translated into Qf, the outdoor comfort temperature was suggested to be in the range of 23.1–31.0 °C [31]. The progression trends exhibited by the Deep Forest can be further studied in terms of its impacts on the surface temperature of the entire project area.

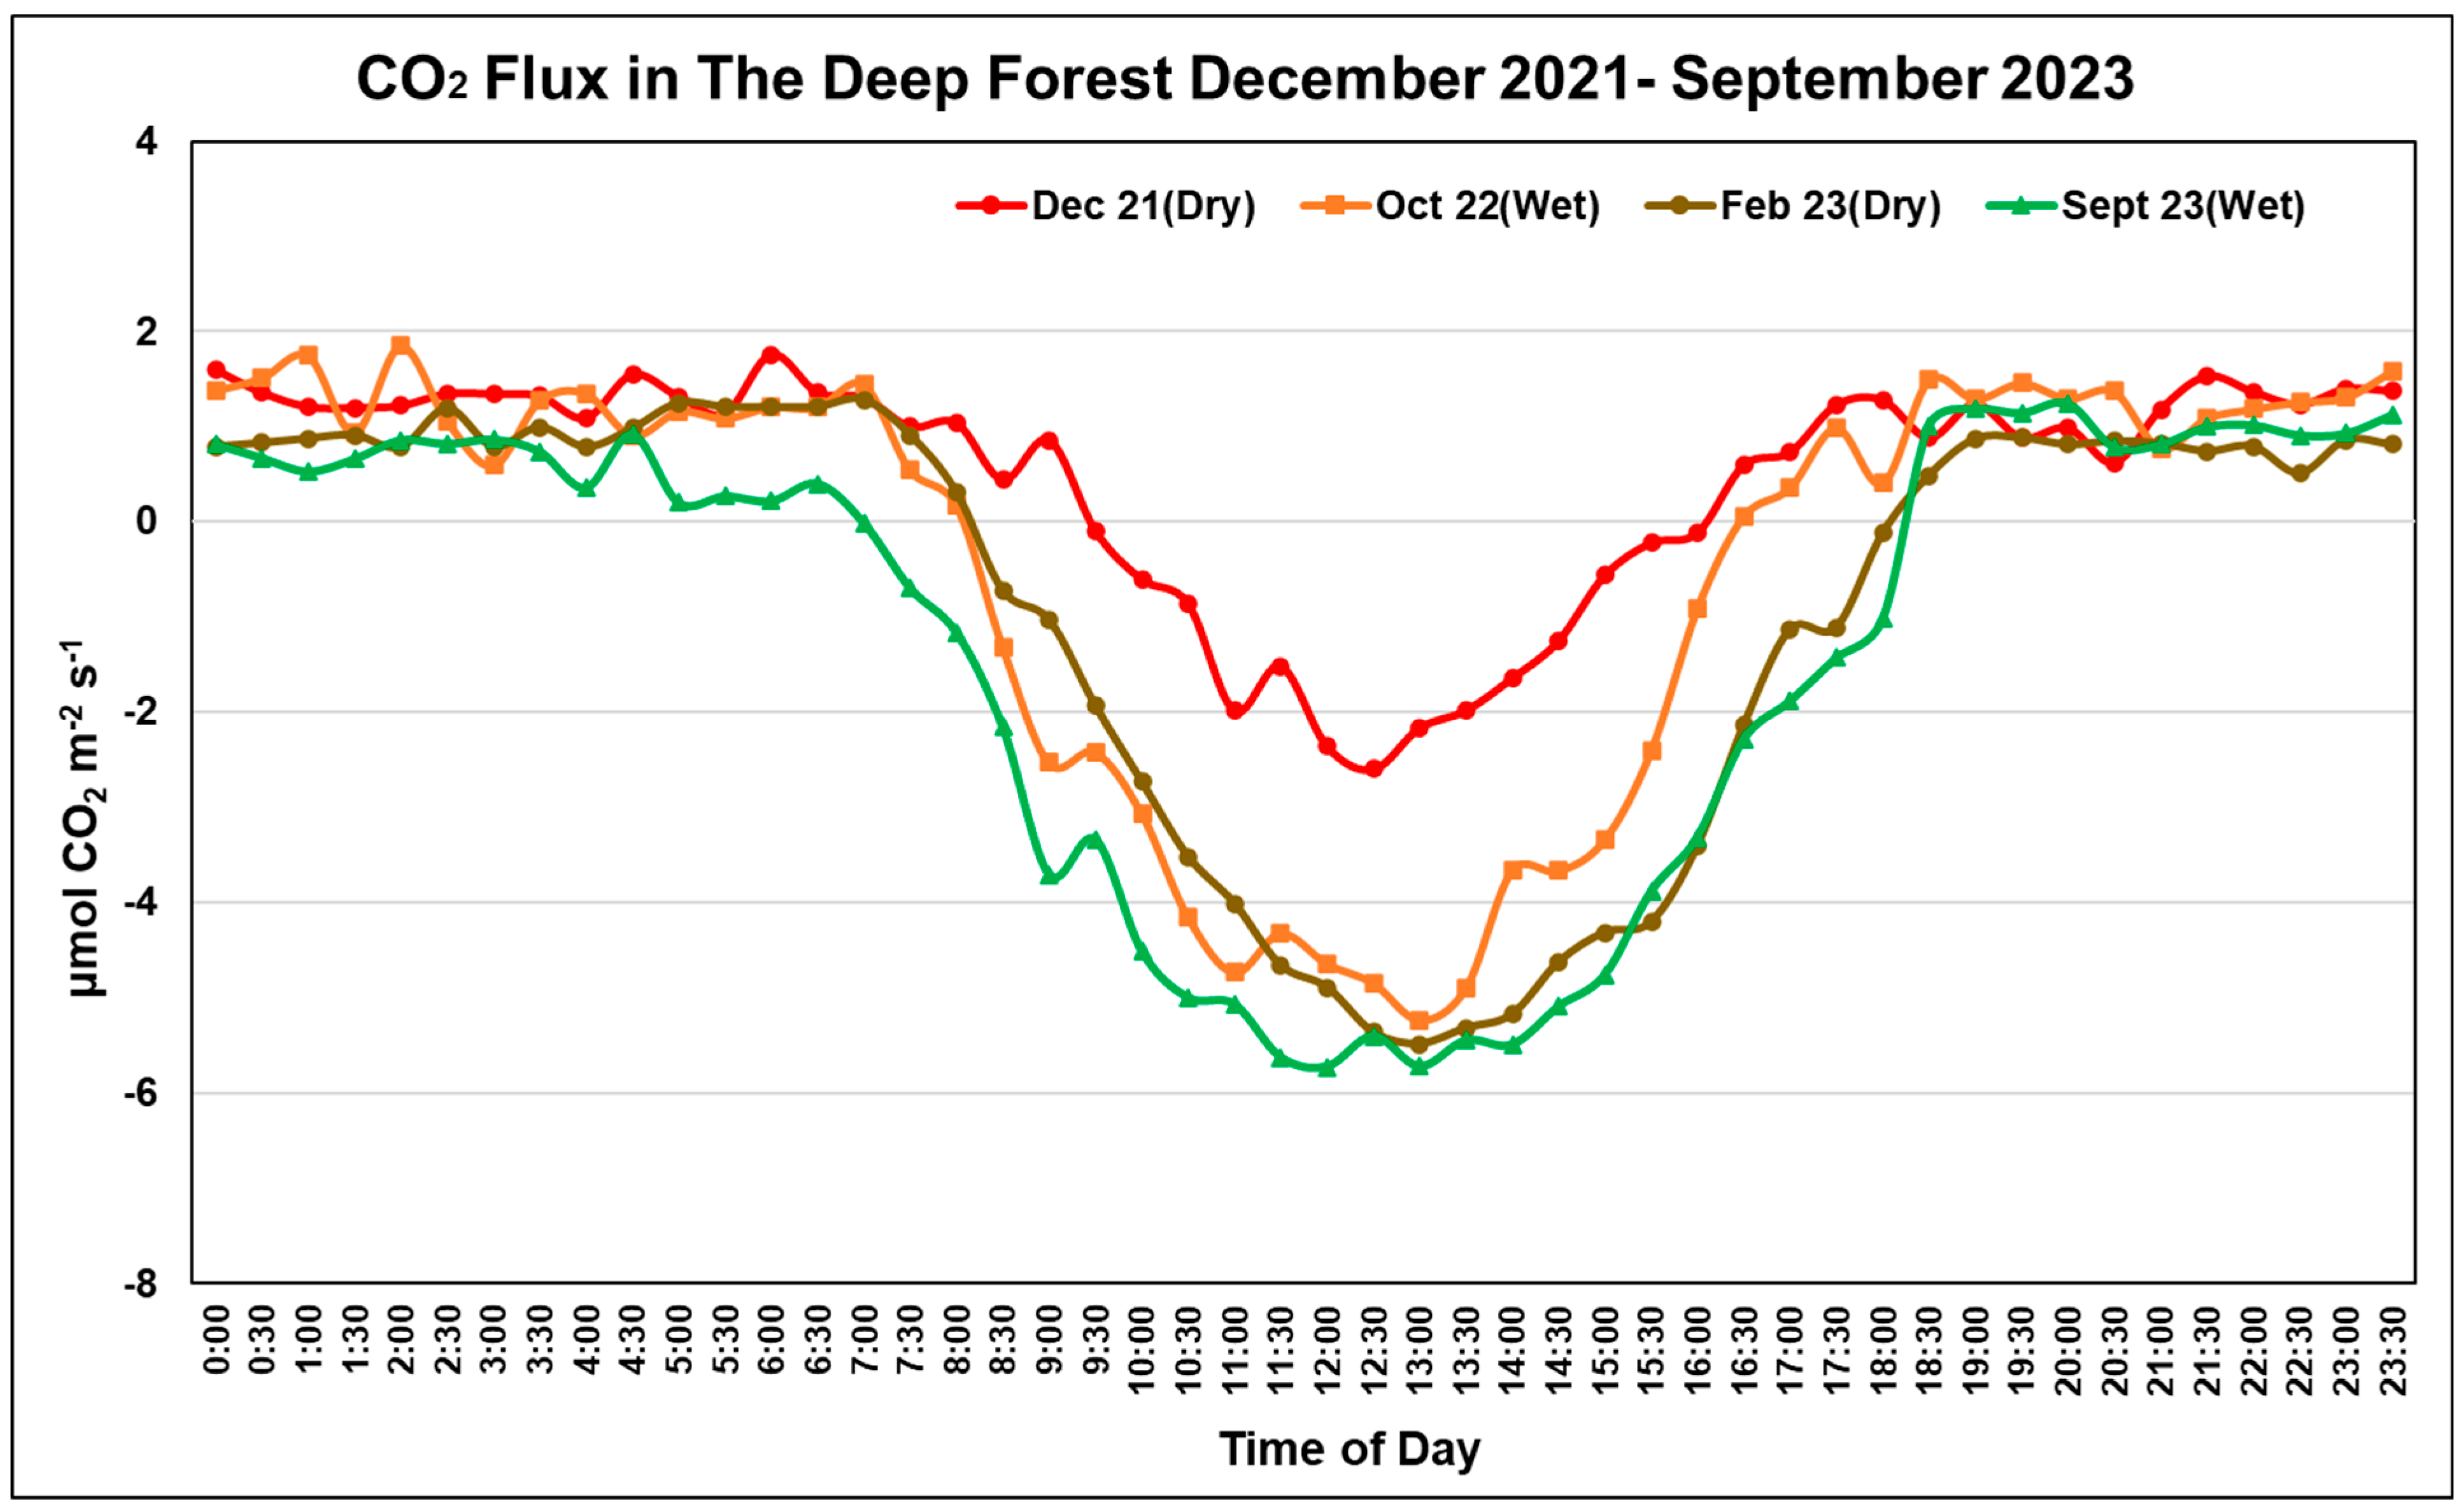
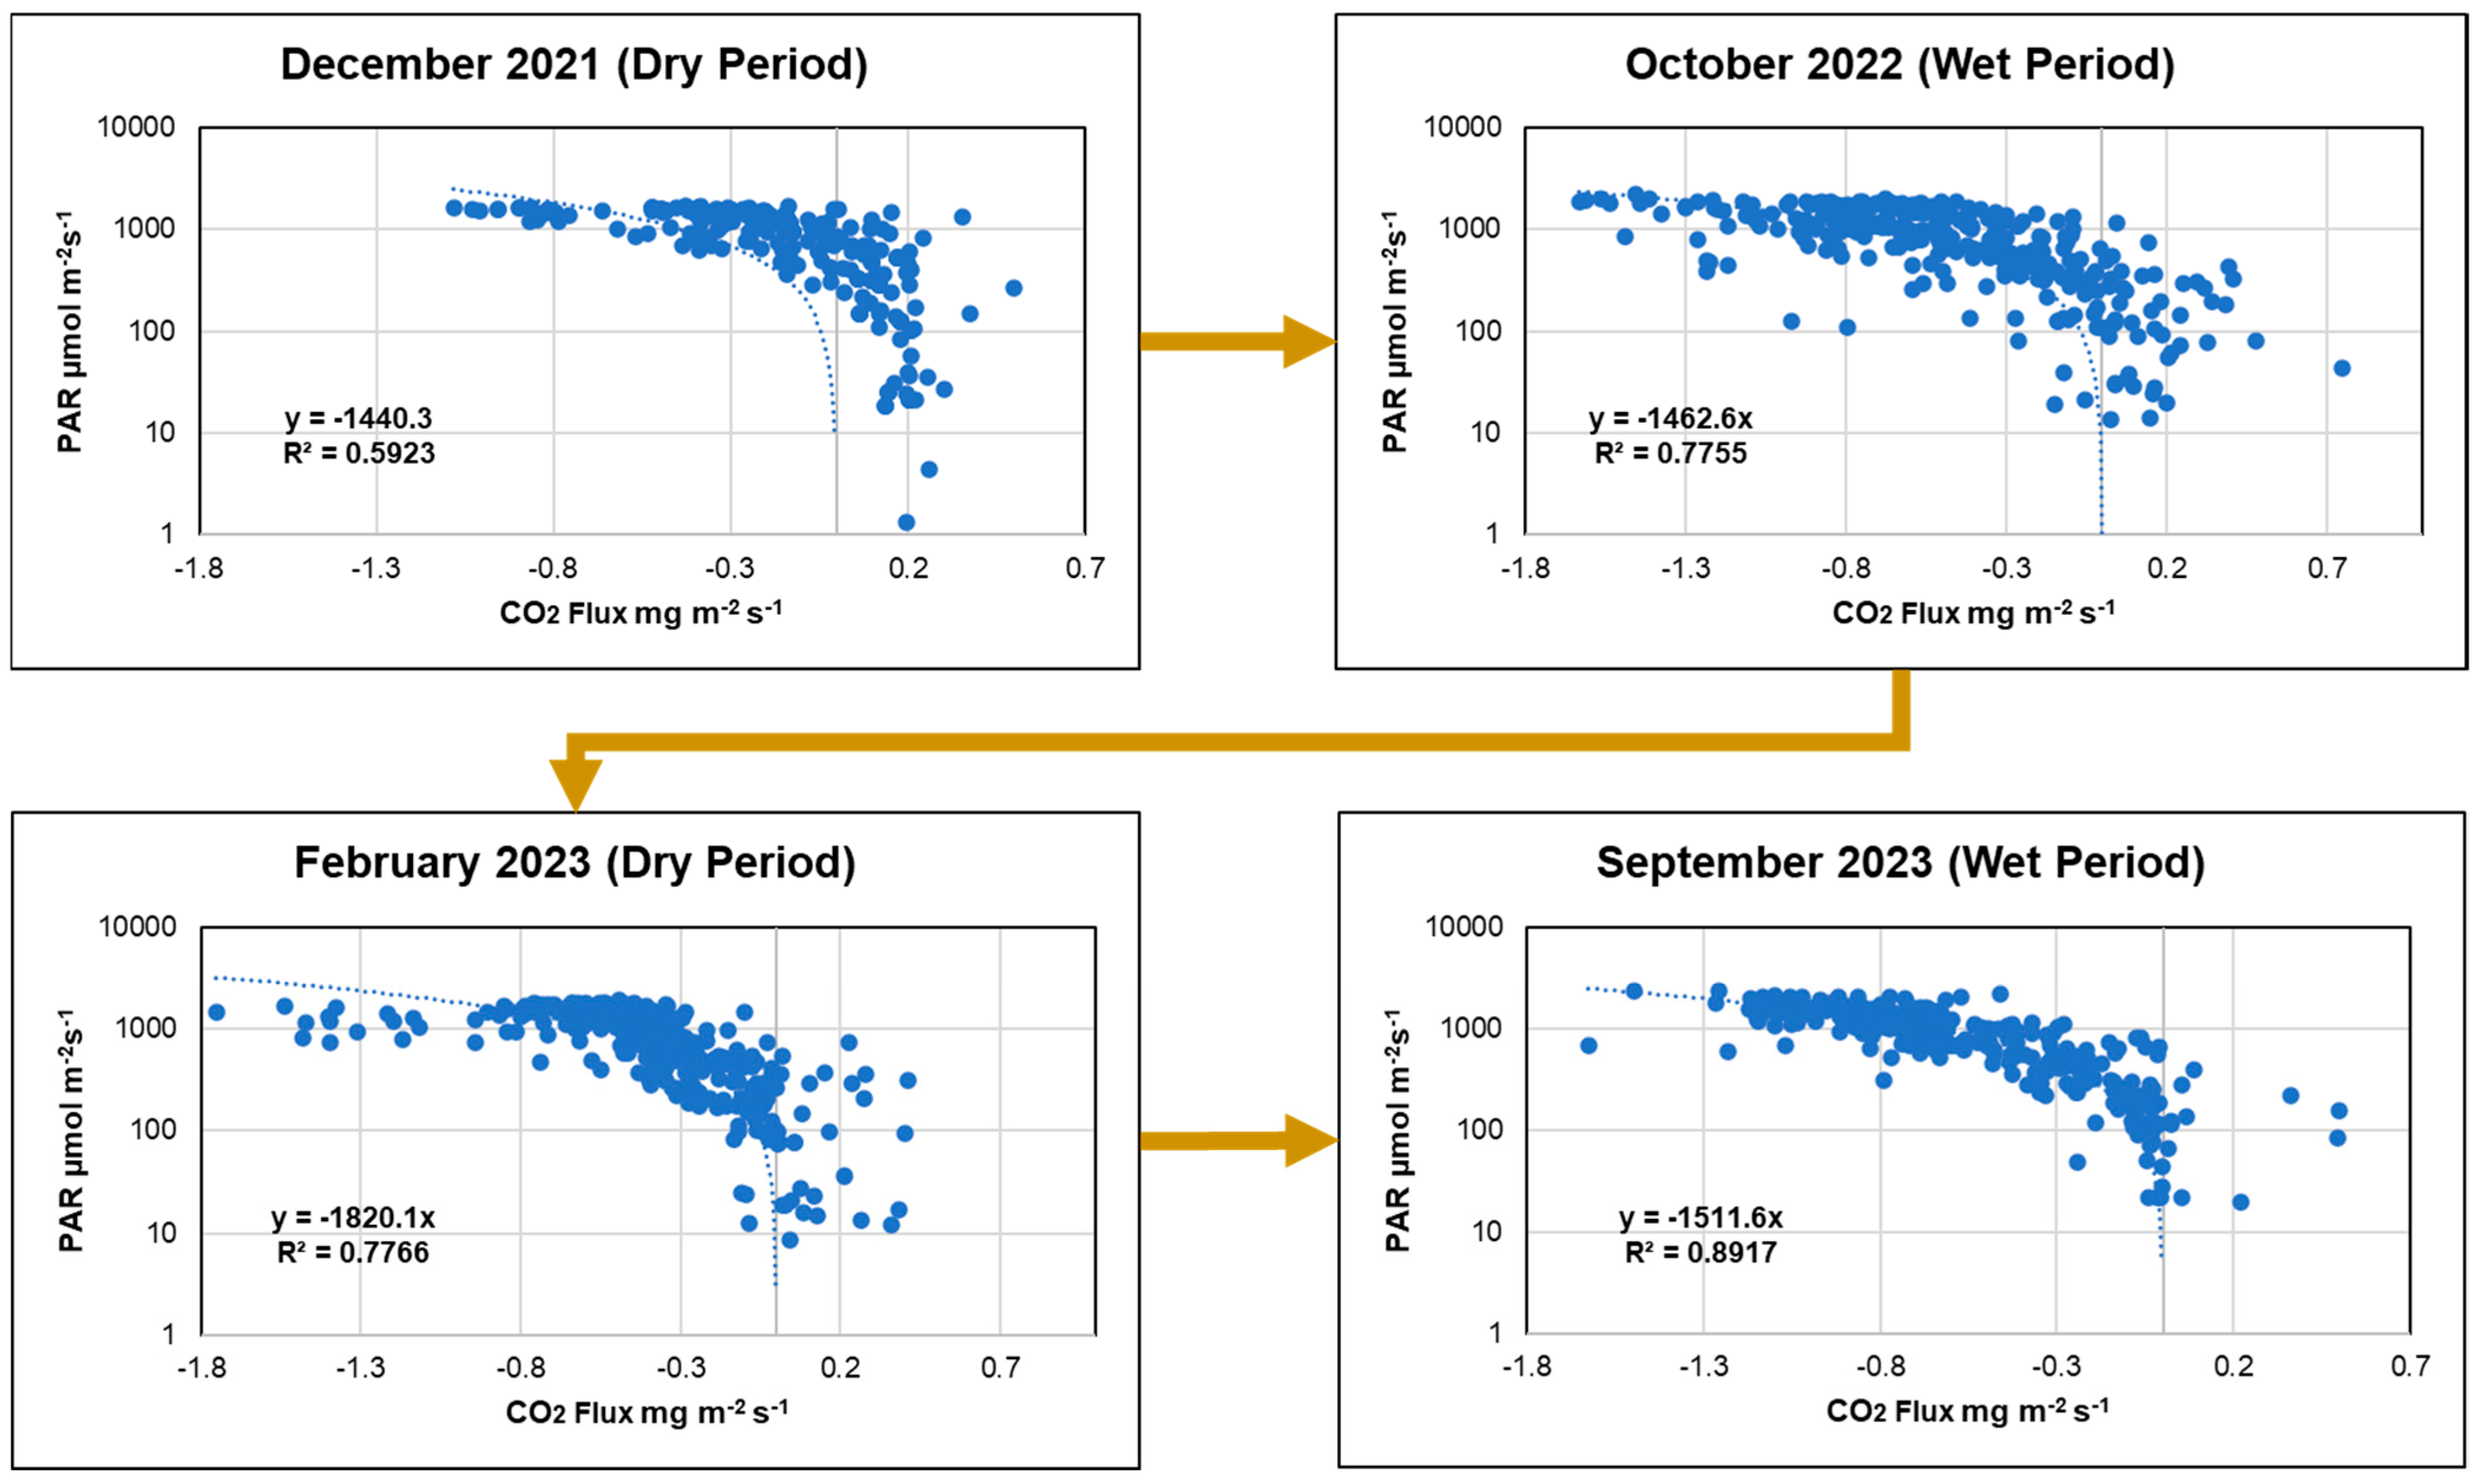
3.4. CO2 Flux Changes

The changes in CO2 fluxes in the Deep Forest from December 2021 to September 2023 are shown in Figure 5, demonstrating the temporal increase in the CO2 flux. Not only did the downward flux peak become stronger, but the area with negative CO2 flux expanded. The average diurnal CO2 flux increased from 3.19 to −3.02 to −5.99 to −6.11 μmol m−2 s−1 in 2023, thereby regarding the Deep Forest site as a carbon sink. This negative increase could be attributed to the growth in the Deep Forest. The parallel increase in tree diameter with the DBH, LAI, and crown canopy coverage facilitates higher gas exchange due to an increased leaf area available for exchange [33,34,35,36].
Furthermore, the decrease in density is also an indicator that the forest is reaching its maturity, as succession lowers the density of the forest and increases the crown cover convergence as a result of the larger tree canopy. This increases the CO2 flux within the Deep Forest [37]. An extrapolation of the area’s ability to sequester CO2 is shown in Figure 6, showing the CO2 flux and photosynthesis photon flux density (PPDF) or the light energy in the wavelength used for the photosynthesis process. The temporal changes were seen as an increase in negative flux with increasing PPDF, indicating that the ability to sequester CO2 increased [35,38]. This was then confirmed with the slope and the R2 values that increased with the time in which the forest grew (Figure 6) [39].
The diurnal effects were the result of biogenic and anthropogenic forcings, influencing the fluctuation of CO2 within the site; the Deep Forest data showed a similar trend as the natural site, with the negative flux being dominant during the daytime, while night-time fluxes revealed a higher positive flux, similar to that found in urban settings, as the measurement site is surrounded by background CO2 [40,41].
Seasonal effects were observed in the wet season of 2023, showing higher CO2 sequestration and higher photosynthetic rates of the forest canopy, in accordance with favorable growing conditions. The effects of increased LE (Figure 3) were influenced by increased soil moisture and more stable temperatures with lower uncertainties in the wet period compared with that in the dry period [42,43,44].
Despite the differences in measurements between the different dry and wet periods, the daily VPD did not differ. The daily VPD of the Deep Forest in 2023 ranged from 0.02 to 2.72 kPa, with the highest values observed during the wet period. The measured VPD was related to the forest because of stomatal conductance and sensitivity, in which the gas exchange process was inhibited. This was found in relation with the soil water content being 0.51 and 0.34 in the wet and dry period of 2023, respectively. Thus, a high VPD allows for higher gas exchange rates; however, a low soil water content often results in a decrease in ET, suggesting stomatal closure [21].
In comparing the Deep Forest data with the study of an urban park [45], the diurnal course during the vegetation period exhibited negative daytime fluxes up to −10.0 μmol m−2 s−1, with a mean of 0.8 μmol m−2 s−1; park sector fluxes were slightly positive, as suggested from a flux influence of the surrounding urban land cover. These fluxes were attributed to biogenic and anthropogenic CO2 sources [46]. In Beijing, China, during the mid-day in summer, a CO2 uptake of −0.034 mg m−2 s−1 indicated that vegetation is an important sink of CO2 [47]. In the Deep Forest, the negative average flux was attributed to the location being surrounded by residential land use.

4. Conclusions

During the restoration of an urban green area into an urban forest, the establishment of the Deep Forest zone within The Forestias Project area revealed that the forest that was nearing maturity resembled a natural forest-like area. However, the intensity of the carbon sink and the energy balance showed an influence from local anthropogenic activities, which promoted the release of excess CO2 and heat. The data acquired from the EC measurements revealed that an increase in LE flux lowered the H flux along with the increase in average latent heat flux from 22% in 2021 to 37% in 2023, thus reducing the EBR closure value. These processes resulted in lower ambient temperatures, while the expanding canopy coverage and its complexity directly influenced the increased CO2 flux sequestration. In terms of CO2 flux dynamics, the increasing efficacy of photosynthesis was parallel to the growing forest canopy, with the CO2 diurnal flux rate increasing from 3.19 in the year 2021 to −6.11 μmol m−2 s−1 in 2023. Monitoring of the developing forest allowed flux data correlation with changes in forest density, tree height, and tree diameter. The continuation of presented measurements is crucial to better understand the observed positive trend of the tropical urban forest system, which should be viewed as long-term research on CO2 absorption regulating the carbon cycle. Further improvement of the measurement accuracies and the temporal increase in data acquisition would provide a deeper understanding of annual flux changes and seasonal variability of urban green spaces contributing to the carbon cycle.
Establishing and refining the Deep Forest area to mimic nature will not only provide nature-like carbon and energy ratio dynamics, but the continuation of these efforts will also support the overall area of The Forestias or similar development projects as sites for better urban biodiversity and well-being. Moreover, these steps would improve the local urban climate as well. This research can be viewed as a fundamental study that reveals the environmental impacts and role of integrating green areas into urban structures and potentially provides recommendations for urban development in tropical locations towards reaching carbon neutrality.

Author Contributions

Conceptualization, P.M., W.W.S. and S.B.; formal analysis P.M.; data curation, J.S. and S.N. writing—original draft preparation, P.M.; writing—review and editing, P.M. and W.W.S.; project administration, Y.F.; funding acquisition, T.J. All authors have read and agreed to the published version of the manuscript.

Funding

The Research and Innovation for Sustainability Center (RISC) by Magnolia Quality Development Corporation Limited (MQDC), Thailand.

Data Availability Statement

Dataset available on request from the authors.

Conflicts of Interest

The authors declare no conflict of interest.

References

  1. Alahmad, B.; Khraishah, H.; Royé, D.; Vicedo-Cabrera, A.M.; Guo, Y.; Papatheodorou, S.I.; Koutrakis, P. Associations Between Extreme Temperatures and Cardiovascular Cause-Specific Mortality: Results From 27 Countries. Circulation 2023, 147, 35–46. [Google Scholar] [CrossRef] [PubMed]
  2. Hang, J.; Shi, Y.; Zeng, L. Seasonal and diurnal urban energy balance and carbon exchanges over a residential neighborhood in a humid subtropical city. Urban Clim. 2024, 53, 101774. [Google Scholar] [CrossRef]
  3. Gupta, M.; Murtugudde, R.; Ghosh, S. Simulating urban surface energy balance of an academic campus and surroundings in Mumbai, India. Urban Clim. 2024, 56, 102044. [Google Scholar] [CrossRef]
  4. Cuce, P.M.; Cuce, E.; Santamouris, M. Towards Sustainable and Climate-Resilient Cities: Mitigating Urban Heat Islands Through Green Infrastructure. Sustainability 2025, 17, 1303. [Google Scholar] [CrossRef]
  5. Deng, Z.; Liu, X.; Zu, H.; Luo, J.; Chen, Y.; Yi, M.; Wang, X.; Liang, X.; Zhang, X.; Yan, W. Spatial and Temporal Variations of Carbon Dioxide Fluxes in Urban Ecosystems of Changsha, China. Forests 2023, 14, 2201. [Google Scholar] [CrossRef]
  6. Byrne, B.; Liu, J.; Lee, M.; Baker, I.; Bowman, K.W.; Deutscher, N.M.; Wunch, D. Improved Constraints on Northern Extratropical CO2 Fluxes Obtained by Combining Surface-Based and Space-Based Atmospheric CO2 Measurements. J. Geophys. Res. Atmos. 2020, 125, e2019JD032029. [Google Scholar] [CrossRef]
  7. Sadeghi, M.; Ebtehaj, A.; Guala, M.; Wang, J. Physical connection of sensible and ground heat flux. J. Hydrol. 2021, 602, 126687. [Google Scholar] [CrossRef]
  8. Gratani, L.; Catoni, R.; Puglielli, G.; Varone, L.; Crescente, M.F.; Sangiorgio, S.; Lucchetta, F. Carbon Dioxide (CO2) Sequestration and Air Temperature Amelioration Provided by Urban Parks in Rome. Energy Procedia 2016, 101, 408–415. [Google Scholar] [CrossRef]
  9. Vaz Monteiro, M.; Doick, K.J.; Handley, P.; Peace, A. The impact of greenspace size on the extent of local nocturnal air temperature cooling in London. Urban For. Urban Green. 2016, 16, 160–169. [Google Scholar] [CrossRef]
  10. Aram, F.; Higueras-García, E.; Solgi, E.; Mansournia, S. Urban green space cooling effect in cities. Heliyon 2019, 5, e01339. [Google Scholar] [CrossRef]
  11. Zhang, Y.; Meng, W.; Yun, H.; Xu, W.; Hu, B.; He, M.; Zhang, L. Is urban green space a carbon sink or source?—A case study of China based on LCA method. Environ. Impact Assess. Rev. 2022, 94, 106766. [Google Scholar] [CrossRef]
  12. Huang, H.; Jia, J.; Chen, D.; Liu, S. Evolution of spatial network structure for land-use carbon emissions and carbon balance zoning in Jiangxi Province: A social network analysis perspective. Ecol. Indic. 2024, 158, 111508. [Google Scholar] [CrossRef]
  13. Miyawaki, A. Restoration of living environment based on vegetation ecology: Theory and practice. Ecol. Res. 2004, 19, 83–90. [Google Scholar] [CrossRef]
  14. Chan, K.; Wood, R. The seasonal cycle of planetary boundary layer depth determined using COSMIC radio occultation data: Seasonal Cycle Of Pbl Depth. J. Geophys. Res. Atmos. 2013, 118, 12–422. [Google Scholar] [CrossRef]
  15. Kotthaus, S.; Bravo-Aranda, J.A.; Collaud Coen, M.; Guerrero-Rascado, J.L.; Costa, M.J.; Cimini, D.; Haeffelin, M. Atmospheric boundary layer height from ground-based remote sensing: A review of capabilities and limitations. Atmos. Meas. Tech. 2023, 16, 433–479. [Google Scholar] [CrossRef]
  16. Yang, L.; Noormets, A. Standardized flux seasonality metrics: A companion dataset for FLUXNET annual product. Earth Syst. Sci. Data 2020, 13, 1461–1475. [Google Scholar] [CrossRef]
  17. Vulova, S.; Meier, F.; Rocha, A.D.; Quanz, J.; Nouri, H.; Kleinschmit, B. Modeling urban evapotranspiration using remote sensing, flux footprints, and artificial intelligence. Sci. Total Environ. 2021, 786, 147293. [Google Scholar] [CrossRef]
  18. Kljun, N.; Calanca, P.; Rotach, M.W.; Schmid, H.P. A simple two-dimensional parameterization for Flux Footprint Prediction (FFP). Geosci. Model. Dev. 2015, 8, 3695–3713. [Google Scholar] [CrossRef]
  19. Stewart, I.D.; Oke, T.R. Local climate zones for urban temperature studies. Bull. Am. Meteorol. Soc. 2012, 93, 1879–1900. [Google Scholar] [CrossRef]
  20. Wang, S.; Zhu, G.; Xia, D.; Ma, J.; Han, T.; Ma, T.; Shang, S. The characteristics of evapotranspiration and crop coefficients of an irrigated vineyard in arid Northwest China. Agric. Water Manag. 2019, 212, 388–398. [Google Scholar] [CrossRef]
  21. Lion, M.; Kosugi, Y.; Takanashi, S.; Noguchi, S.; Itoh, M.; Katsuyama, M.; Shamsuddin, S.A. Evapotranspiration and water source of a tropical rainforest in peninsular Malaysia. Hydrol. Processes. 2017, 31, 4338–4353. [Google Scholar] [CrossRef] [PubMed]
  22. Ding, R.; Kang, S.; Du, T.; Hao, X.; Tong, L. Modeling crop water use in an irrigated maize cropland using a biophysical process-based model. J. Hydrol. 2015, 529, 276–286. [Google Scholar] [CrossRef]
  23. Karna, Y.; Penman, T.; Aponte, C.; Bennett, L. Assessing Legacy Effects of Wildfires on the Crown Structure of Fire-Tolerant Eucalypt Trees Using Airborne LiDAR Data. Remote Sens. 2019, 11, 2433. [Google Scholar] [CrossRef]
  24. Chrysoulakis, N.; Grimmond, S.; Feigenwinter, C.; Lindberg, F.; Gastellu-Etchegorry, J.-P.; Marconcini, M.; Parlow, E. Urban energy exchanges monitoring from space. Sci. Rep. 2018, 8, 11498. [Google Scholar] [CrossRef] [PubMed]
  25. Spronken-Smith, R.A.; Oke, T.R.; Lowry, W.P. Advection and the surface energy balance across an irrigated urban park. Int. J. Climatol. 2000, 20, 1033–1047. [Google Scholar] [CrossRef]
  26. Pau, S.; Detto, M.; Kim, Y.; Still, C.J. Tropical forest temperature thresholds for gross primary productivity. Ecosphere 2018, 9, e02311. [Google Scholar] [CrossRef]
  27. Skelhorn, C.; Lindley, S.; Levermore, G. The impact of vegetation types on air and surface temperatures in a temperate city: A fine scale assessment in Manchester, UK. Landsc. Urban Plan. 2014, 121, 129–140. [Google Scholar] [CrossRef]
  28. Park, J.; Kim, J.-H.; Lee, D.K.; Park, C.Y.; Jeong, S.G. The influence of small green space type and structure at the street level on urban heat island mitigation. Urban For. Urban Green. 2017, 21, 203–212. [Google Scholar] [CrossRef]
  29. Ueyama, M.; Ando, T. Cooling effect of an urban park by enhanced heat transport efficiency. J. Agric. Meteorol. 2020, 76, 148–153. [Google Scholar] [CrossRef]
  30. Maskulrath, P.; Bualert, S.; Szymanski, W.W.; Choomanee, P.; Chunkao, K.; Pattamapitoon, T.; Fungkeit, Y. Assessment of urban green areas towards changing surface energy balance fluxes in tropical study sites, Central Thailand. Environ. Chall. 2023, 11, 100715. [Google Scholar] [CrossRef]
  31. Oke, T.; Mills, G.; Christen, A.; Voogt, J. Urban Climates; Cambridge University Press: Cambridge, UK, 2017. [Google Scholar]
  32. Song, Y.; Song, X.; Shao, G. Effects of Green Space Patterns on Urban Thermal Environment at Multiple Spatial–Temporal Scales. Sustainability 2020, 12, 6850. [Google Scholar] [CrossRef]
  33. Wang, K.Y.; Kellomäki, S.; Zha, T.-S.; Peltola, H. Component carbon fluxes and their contribution to ecosystem carbon exchange in a pine forest: An assessment based on eddy covariance measurements and an integrated model. Tree Physiol. 2004, 24, 19–34. [Google Scholar] [CrossRef]
  34. Kim, J.; Hwang, T.; Schaaf, C.L.; Kljun, N.; Munger, J.W. Seasonal variation of source contributions to eddy-covariance CO2 measurements in a mixed hardwood-conifer forest. Agric. For. Meteorol. 2018, 253-254, 71–83. [Google Scholar] [CrossRef]
  35. Qubaja, R.; Yang, F.; Amer, M.; Tatarinov, F.; Yakir, D. Ecophysiology of an urban citrus orchard. Urban For. Urban Green. 2021, 65, 127361. [Google Scholar] [CrossRef]
  36. Zhao, D.; Cai, J.; Xu, Y.; Liu, Y.; Yao, M. Carbon sinks in urban public green spaces under carbon neutrality: A bibliometric analysis and systematic literature review. Urban For. Urban Green. 2023, 86, 217–229. [Google Scholar] [CrossRef]
  37. Wang, X.; Guo, Z.; Guo, X.; Wang, X. The Relative Importance of Succession, Stand Age and Stand Factors on Carbon Allocation of Korean Pine Forests in the Northern Mt. Xiaoxing’anling, China. Forests 2020, 11, 512. [Google Scholar] [CrossRef]
  38. Rodda, S.R.; Thumaty, K.C.; Jha, C.S.; Dadhwal, V.K. Seasonal Variations of Carbon Dioxide, Water Vapor and Energy Fluxes in Tropical Indian Mangroves. Forests 2016, 7, 35. [Google Scholar] [CrossRef]
  39. Cernusak, L.A.; Winter, K.; Dalling, J.W.; Holtum, J.A.M.; Jaramillo, C.; Körner, C.; Wright, S.J. Tropical forest responses to increasing atmospheric CO2: Current knowledge and opportunities for future research. Funct. Plant Biol. 2013, 40, 531–551. [Google Scholar] [CrossRef] [PubMed]
  40. Körner, C.; Asshoff, R.; Bignucolo, O.; Hättenschwiler, S.; Keel, S.G.; Peláez-Riedl, S.; Zotz, G. Carbon flux and growth in mature deciduous forest trees exposed to elevated CO2. Science 2005, 309, 1360–1362. [Google Scholar] [CrossRef]
  41. Matthews, B.; Schume, H. Tall tower eddy covariance measurements of CO2 fluxes in Vienna, Austria. Atmos. Environ. 2022, 274, 118941. [Google Scholar] [CrossRef]
  42. Desai, A.R.; Bolstad, P.V.; Cook, B.D.; Davis, K.J.; Carey, E.V. Comparing net ecosystem exchange of carbon dioxide between an old-growth and mature forest in the upper Midwest, USA. Agric. For. Meteorol. 2005, 128, 33–55. [Google Scholar] [CrossRef]
  43. Welp, L.R.; Randerson, J.T.; Liu, H.P. The sensitivity of carbon fluxes to spring warming and summer drought depends on plant functional type in boreal forest ecosystems. Agric. For. Meteorol. 2007, 147, 172–185. [Google Scholar] [CrossRef]
  44. Vázquez-Lule, A.; Vargas, R. Biophysical drivers of net ecosystem and methane exchange across phenological phases in a tidal salt marsh. Agric. For. Meteorol. 2021, 300, 1–14. [Google Scholar] [CrossRef]
  45. Kordowski, K.; Kuttler, W. Carbon dioxide fluxes over an urban park area. Atmos. Environ. 2010, 44, 2722–2730. [Google Scholar] [CrossRef]
  46. Weissert, L.F.; Salmond, J.A.; Turnbull, J.C.; Schwendenmann, L. Temporal variability in the sources and fluxes of CO2 in a residential area in an evergreen subtropical city. Atmos. Environ. 2016, 143, 164–176. [Google Scholar] [CrossRef]
  47. Song, T.; Wang, Y.; Sun, Y. Estimation of carbon dioxide flux and source partitioning over Beijing, China. J. Environ. Sci. 2013, 25, 2429–2434. [Google Scholar] [CrossRef]
Figure 1. Normalized Difference Vegetation Index (NDVI) image generated from Landsat 8 cloud-free composite images.
Urbansci 09 00153 g001
Figure 2. Results obtained from the flux footprint prediction in meters over the Deep Forest, with the coverage area of The Forestias shown depending on the time of the year: (a) December 2021; (b) October 2022; (c) February 2023; (d) September 2023.
Urbansci 09 00153 g002
Figure 3. Surface energy balance fluxes in the Deep Forest, The Forestias.
Urbansci 09 00153 g003
Figure 4. Surface energy relationship in the Deep Forest, The Forestias.
Urbansci 09 00153 g004
Figure 5. CO2 flux changes in the Deep Forest, The Forestias.
Urbansci 09 00153 g005
Figure 6. CO2 flux and photosynthetic photon flux density in the Deep Forest, The Forestias.
Urbansci 09 00153 g006
Table 1. Equipment used in the study and their measured parameters.
Instrument ModelData CollectedUnit
3D Sonic anemometerSensible heat fluxW m−2
Latent heat fluxW m−2
Wind speed and directionm s−1 and degrees
Infrared analyzer (IRGASON)CO2 densitymg m−3
H2O densityg m−3
CO2 and H2O eddy 3D movementmg m−2 s−1
SQ110 PAR sensorPhotosynthesis active radiationmmol m−2 s−1
NR01
4-way net radiometer
Short-wave radiation upward and downwardW m−2
Long-wave radiation upward and downwardW m−2
TemperatureK
Temperature probeAmbient temperature°C
Soil heat fluxGround heat fluxW m−2
Soil humidity and temperatureSoil humiditydS m−1
Temperature°C
Other metrological measurementsFriction velocitym s−1
Ambient pressurekPa
Table 2. Seasonal measurement periods in the Deep Forest.
Data Acquisition Time (Duration in Days)Season
(1) December 2021 (14)Dry
(2) October 2022 (14)Wet
(3) February 2023 (14)Dry
(4) September 2023 (14)Wet
Table 3. Deep Forest growth measurements.
ParameterUnitYearDifference
202120222023
DensityNumber of trees per square meter (tree/m2)2.272.101.73−0.54
(decreased)
HeightCentimeter (cm)60.28141.99310.0+249.72
(increased)
DBH/RCMCentimeter (cm)0.761.552.68+1.92
(increased)
Disclaimer/Publisher’s Note: The statements, opinions and data contained in all publications are solely those of the individual author(s) and contributor(s) and not of MDPI and/or the editor(s). MDPI and/or the editor(s) disclaim responsibility for any injury to people or property resulting from any ideas, methods, instructions or products referred to in the content.

