Article

Road Safety Improvement and Sustainable Urban Mobility: Identification and Prioritization of Factors and Policies Through a Multi-Criteria Approach

by
Konstantina Anastasiadou
* and
Fotini Kehagia
School of Civil Engineering, Faculty of Engineering, Aristotle University of Thessaloniki, 54124 Thessaloniki, Greece
*
Author to whom correspondence should be addressed.
Urban Sci. 2025, 9(4), 93; https://doi.org/10.3390/urbansci9040093
Submission received: 24 January 2025 / Revised: 9 March 2025 / Accepted: 20 March 2025 / Published: 24 March 2025
(This article belongs to the Special Issue Sustainable Transportation and Urban Environments-Public Health)

Abstract

:
Despite the significant progress in the last few decades, road safety improvement still constitutes an imperative global need. Especially in urban areas, the improvement of road safety is an even more complicated and multi-factor problem. Every minute, a human life is lost in an urban road network in the world. Given that almost all road accidents are preventable, more effective planning toward improving road safety, as a structural element of sustainable urban mobility, is imperative. The aim of the present research is to provide decision support analysts and policy-makers with a decision-support tool that identifies and prioritizes the factors undermining road safety in an urban area, with a view to developing effective policies. For this purpose, a comprehensive inventory of factors that may undermine road safety in an urban area, as well as an inventory of relevant measures and policies, is provided, based on an international literature review. The most important factors and, subsequently, the most effective measures and policies are identified and prioritized through a multi-criteria approach (modified Delphi–analytical hierarchy process (AHP)–technique for order preference by similarity to ideal solution (TOPSIS)). The Greek urban road networks, starting from the second largest city in Greece (Thessaloniki), are selected as a case study. Problems related to limited resources not allowing for systematic surveillance and policing, making arbitrary decisions instead of adopting a scientific decision-aiding methodology, education and mentality issues, infrastructure planning and maintenance, cooperation and coordination between different authorities, and laxity of penalties are highlighted as the most important factors, based on which four sets of measures and policies are identified and prioritized.

1. Introduction

During the last few decades, the notion of sustainable mobility has “overwhelmed” the scientific community, as well as citizens’ everyday life, through research projects, information campaigns, events and other relevant initiatives taking place at the local, national, European and global levels. Road safety constitutes a fundamental component of sustainable mobility and, obviously, an urban road network that is not safe is not sustainable. According to the UN Sustainable Development Goals (SDGs), in particular “SDG 11.2: Make cities and human settlements inclusive, safe, resilient and sustainable”, safety is a crucial factor for a city to be livable, while making road networks safe, especially for pedestrians and cyclists, apart from saving lives, encourages sustainable modes of transport [1]. Despite the fact that during the COVID-19 pandemic period road accidents were reduced in most cities in the world due to the decrease in vehicles circulating on the roads [2,3], every minute, a human life is lost in an urban road network somewhere in the world [1].
As concerns the European Union (EU), despite the fact that the EU roads are the safest in the world [4], 20,400 people lost their lives in road crashes across the EU in 2023 [5]. Every year, excluding the COVID-19 pandemic period, about 25,000 fatalities and over 135,000 serious injuries are recorded on EU roads [3]. The inclusion of road safety as a fundamental component of the development and implementation of sustainable urban mobility plans (SUMPs) is considered of high importance [6]. According to relevant surveys [6,7], road safety is regarded as a serious problem for 3/4 of European citizens, while the highest percentage of pedestrian (70%), cyclist (57%) and moped (54%) fatalities on EU roads is recorded in urban areas [8].
Road accidents result in a death and injury toll, as well as in material damage, which should no longer be accepted. In this direction, the EU’s Vision Zero strategy aims at eliminating road fatalities by 2050, with an intermediate target of halving road fatalities and serious injuries by 2030 compared to 2019 numbers, a target also adopted by the UN General Assembly in the context of the “Decade of Action for Road Safety 2021–2030” [9,10,11]. The excellent performance in terms of road safety of European cities such as Helsinki and Oslo demonstrates that the EU’s Vision Zero is realistic [1,10].
Given that road safety is the result of the interaction of various factors, multi-criteria analysis (MCA) methods seem to be ideal for the effective management of the problem, especially in urban networks where the complexity degree is higher [12]. Thus, decision-support systems, which integrate MCA methods, emerge as a key tool for the optimum allocation of financial resources (limited in most cases) toward improving road safety in urban networks [12]. MCA outweighs other traditional methods for such purposes for the reasons presented in Section 2.2.
The aim of the present research is to provide decision-support analysts and policy-makers with a decision-support tool that identifies and prioritizes the factors undermining road safety in a specific urban area, with a view to developing effective policies through a multi-criteria analysis approach, taking into account the particularities and special needs of the study area. For this purpose, a comprehensive inventory of factors undermining road safety in urban areas, as well as an inventory of relevant measures and policies, is provided, based on an international literature review. The most important factors are selected and prioritized, and subsequently, the most effective measures and policies for the improvement of road safety are also selected and ranked through a multi-criteria decision-aiding methodology, combining a modified Delphi with analytical hierarchy process (AHP) and technique for order preference by similarity to ideal solution (TOPSIS).
The Greek urban road networks, starting from the city of Thessaloniki, are selected as a case study for the application of the proposed methodology. This selection is due to the relatively low performance of Greece (compared with other EU countries) in terms of road safety, especially in urban areas, as documented in Section 3.1, in combination with the fact that Greece (especially the two largest cities of Athens and Thessaloniki) constitutes a major tourist destination, widening—in that way—the scope of the problem.
It is worth mentioning that the methodology applied in the present research can be applied for the elimination of road fatalities in any country (after relevant adaptation), for both urban and non-urban networks.
This research work is structured as follows. The proposed methodology, as well as a comprehensive inventory of the most important factors undermining road safety in urban areas, is presented in Section 2. In Section 3, the road safety level in the Greek urban networks to which the proposed methodology is applied (starting from Thessaloniki) is identified, with an inventory of suggested measures and policies also included in the same section. In Section 4, a discussion of the results is presented, while the most important conclusions can be found in Section 5.

2. Materials and Methods

2.1. Literature Review of Selected MCA Methods in the Transport Sector and in the Field of Road Safety

MCA methods are gaining more and more ground in the international literature for the reasons mentioned in Section 2.3. In particular, the AHP (analytic hierarchy process) [13], TOPSIS (technique for order preference by similarity to ideal solution) [14], VIKOR (vIseKriterijumska optimizacija i kompromisno resenje) [15], ELECTRE (élimination et choix traduisant la réalité) “family” [16] and PROMETHEE (preference ranking organization method for enrichment evaluations) “family” [17] are the most commonly applied MCA methods in the transport sector [18,19].
The aforementioned methods have been applied for road safety improvement purposes in certain cases. For example, in [12], the most dangerous sections in terms of road safety are prioritized in the urban network of Villacidro (Italy), applying ELECTRE III and Concordance Analysis, as well as VIKOR and TOPSIS. In [20], the most vulnerable in terms of road safety rural roads in an Indian area are prioritized using the AHP, fuzzy AHP and simple additive weightage (SAW) methods in order to adopt road safety measures. In [21], a combination of MCA methods, namely modified digital logic (MDL), AHP, TOPSIS, VIKOR, emerging network to reduce Orwellian potency yield (ENTROPY) and Copeland methods are adopted to prioritize dangerous points on roads in an Iranian province. In [22], road accident factors are prioritized in relation to mastery of traffic signs in the city of Manila, Philippines, using AHP. In [23], road safety hazardous locations are ranked using the AHP. In [24], an AHP-BMW (best worst method) is adopted to rank the most significant driver behavior factors related to road safety. In [25], a Pythagorean fuzzy AHP model is adopted for the assessment and prioritization of critical driver behavior factors in Budapest, Hungary. An entropy TOPSIS–road safety risk model is proposed and applied for the evaluation of road safety risk, based on a composite road safety risk index, in [26]. In [27], safety factors related to hazardous road locations in Egypt are prioritized through a fuzzy AHP-TOPSIS model. In [28], an interval-valued intuitionistic fuzzy VIKOR model is adopted for the evaluation of urban road safety in China. In [29], a MCA model combining the coefficient of variation PROMETHEE II method, joint singular value decomposition and semi-discrete decomposition (JSS) is adopted for the identification of the progress of EU countries in the field of road safety. In [30], an AHP–matter element analysis method is applied for the traffic safety evaluation of downstream intersections of urban expressway exits in China. In [31], ELECTRE III is applied for the ranking, in terms of road safety, of ten sections of a motorway in Sardinia, Italy, in order to allocate the insufficient financial resources in the most effective way, giving priority to the most critical motorway sections. The evaluation of the road safety level in eleven countries in Southeast Asia is realized through an MCA model, integrating criteria importance through inter-criteria correlation (CRITIC), ELECTRE and fuzzy C-Means (FCM), in [32].

2.2. Inventory of Factors Undermining Road Safety in Urban Areas Based on a Literature Review

The in-depth comprehension of a problem constitutes a prerequisite for its efficient management. Thus, the identification of the most important factors undermining road safety in an urban area is of extremely high importance for the development of appropriate measures and policies toward improving road safety. For this reason, an inventory of the main factors leading to road accidents in urban areas is formulated (Table 1), based on an international literature review, as well as on incidents recorded by journalists [2,6,9,12,33,34,35,36,37,38,39,40,41,42,43,44,45,46,47,48,49,50,51,52,53,54,55,56,57,58]. It should be noted that not all the factors have been directly derived from the literature review (certain factors have been suggested by the authors, after careful study of the nature of road accidents taking place in urban road networks, as recorded by journalists, while others have been indirectly derived by relevant publications).
Obviously, despite having a common base to a large extent, the factors undermining road safety may differ from country to country and from one urban area to another, either in terms of qualitative data or in terms of factor weights. Consequently, the inventory in Table 1 is expected to be different in each case and can serve as a basis to form a unique list for each urban area, with certain factors being removed and others probably being added.

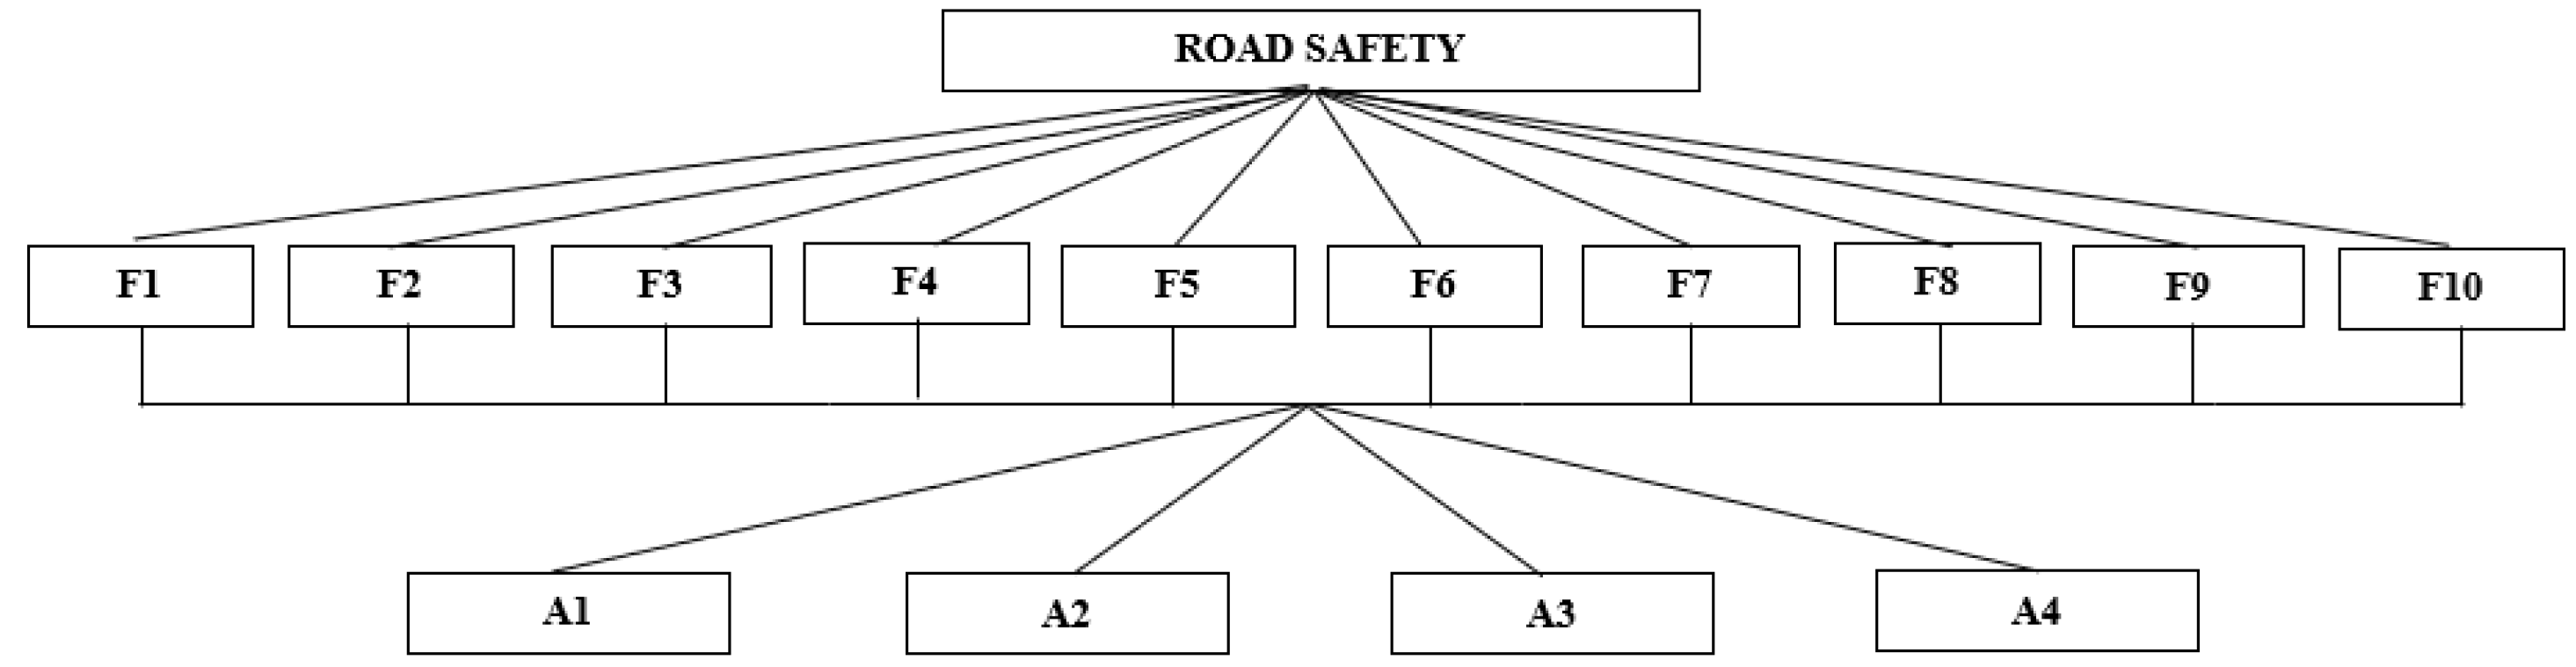
2.3. Proposed Methodology

Given that road safety is the result of the interaction of various factors, multi-criteria analysis (MCA) methods seem to be ideal for the effective management of the problem, especially in urban road networks, where the complexity degree is higher [12]. Thus, decision-support systems, which integrate MCA methods, emerge as a key tool for the optimum allocation of financial resources (limited in most cases) toward improving road safety in urban networks [12]. MCA methods outweigh other traditional methods for transport project evaluation, such as cost–benefit analysis (CBA) and cost-effectiveness analysis (CEA), as both qualitative/intangible (e.g., visual intrusion, travel comfort, etc.) and quantitative/tangible parameters can be included in the analysis, without translation into monetary units, something that may even raise ethical questions in certain cases [59,60], while they offer the opportunity to include in the analysis the opinions of experts and stakeholders [18,19,59,60,61,62,63]. The main disadvantage of MCA methods is the subjectivity related to the extraction of the factor weights or the alternatives performance/effectiveness in the case that the evaluation of the compared elements is realized, e.g., only by the decision-support analyst and/or the decision-maker [18]. For this reason, the opinion of a group of experts shall be integrated into the analysis to minimize subjectivity [18].
There are many MCA methods; however, the most commonly applied ones in the transport sector are AHP, TOPSIS, VIKOR, PROMETHEE and ELECTRE, as already mentioned in Section 2.1. Despite the fact that MCA methods, especially the aforementioned ones, have been widely applied in the transport sector, and the field of road safety in certain cases (as documented in Section 2.1), this is the first time that an MCA model consisting of a modified Delphi combined with AHP and TOPSIS is applied for the improvement of road safety in an urban area through the identification and prioritization of the most important factors, and, consequently, the most effective measures and policies.
The proposed methodology combines AHP [13] and TOPSIS [14] with a modified Delphi approach. A brief presentation of AHP, Delphi and TOPSIS is given in Appendix A, Appendix B and Appendix C, respectively. As regards the modified Delphi (as proposed in [18]), which is applied in order to identify the most significant factors undermining road safety in the study area, the main advantage, compared to a traditional Delphi (Appendix B), is that the completion of the process is possible even from the first round, consuming less time and resources [46]. In the context of the modified Delphi, the list of the identified factors for the study area is delivered to a group of experts who are asked to select the 10 most important ones (in their opinion), as well as to add any other factor that should have been included in the list. Those factors selected by at least a specific percentage (e.g., 50%) are considered to be the most important ones and are then prioritized through AHP pair-wise comparisons. Concerning the two MCA methods (AHP and TOPSIS) involved in the process, there are over 100 MCA methods [19,64]; thus, other MCA methods could also have been selected for application. AHP and TOPSIS are selected in this research work as they are among the most commonly applied ones in the transport sector [18,19]. Given that there is no perfect method, each one is characterized by advantages and disadvantages, making the combination of MCA methods a common practice in the relevant literature [64]. AHP (Appendix A) is relatively simple to understand and to apply, offering better comprehension of the decision problem due to its decomposition into its components (through the hierarchy structure), reflecting the relevant significance of each element, allowing for the participation of a group of experts in the analysis, as well as for checking the consistency of the participants’ answers in the pair-wise comparison process through the relevant consistency ratio (CR) (Appendix A) [18,64,65,66,67]. TOPSIS is characterized by the fewest rank reversal problems compared to the other MCA methods, such as AHP [64,68]. However, TOPSIS does not provide a process for the extraction of the relevant importance or effectiveness of the decision problem’s structural elements, nor a process such as the AHP hierarchy structure allowing for the in-depth comprehension of the problem [64,68]. For the above-mentioned reasons, AHP and TOPSIS “complete” each other in the present research work. Namely, AHP is applied for the thorough understanding of the problem (clearly defining the overall objective, the factors leading to road accidents and the alternatives/measures and policies), for the extraction of the relevant importance of the factors, as well as for the alternatives’ performance/effectiveness with regard to each factor, and for the relevant consistency control of the experts’ judgments, while TOPSIS is applied for the overall ranking of the alternatives (measures and policies).
In particular, after the definition of the study area (Step 1), the selection of experts (Step 2) and the formulation of the factor inventory (Step 3) follow. After having adapted the factor inventory (Table 1) to the study area, a modified Delphi (Step 4) is applied for the identification of the most important factors undermining road safety in the area. The AHP is then applied for the prioritization of the factors identified as the most important ones through the execution of pair-wise comparisons (Step 5). Subsequently, based on the prioritization of the most important factors, sets of alternatives (measures and policies) are identified (Step 6) based on an international literature review and careful study of the urban area (as in Section 3.2.5 of this research work). The modified Delphi may also, optionally, be used for the finalization of the list of alternatives and for the identification of the most important ones (Step 7). Alternatively, and this version is also adopted in the case study included in this research work, all the alternatives identified by the decision-support analyst(s) can be proposed for implementation after having been categorized into relevant sets, which can then be prioritized based on TOPSIS. The evaluation of each alternative with regard to each factor (in terms of effectiveness) can be realized either through pair-wise comparisons or by directly attributing a rate to each alternative. However, the execution of AHP pair-wise comparisons is proposed for the extraction of the performance/effectiveness of each alternative with regard to each factor (Step 8). It is preferred to, e.g., an absolute 1 to 10 rating, as it seems to be easier for someone to answer if an option is preferable (and to what extent) compared to another option rather than having to independently rate each option on a scale [18,64]. The extracted results are, therefore, normalized and can be directly used as input data for the application of TOPSIS, without requiring normalization, as would happen if they were extracted through an absolute 1 to 10 rating. Finally, TOPSIS is applied for the overall ranking of the alternatives (Step 9).
As regards the AHP hierarchy structure (Appendix A) for a decision problem such as that defined in Section 3.2 of this research work, it is shown in Figure 1. The overall goal (road safety) is placed at the top, the 10 factors (in place of criteria) undermining road safety (F1–F10) are placed at the lower level, while the alternatives/sets of measures and policies (A1–A4) are at the lowest level. Moreover, the experts participating in the process are represented by Ei (i = 1, 2, …, k, where k the number of experts participating in the process).
The main steps of the proposed methodology are summarized as follows:
  • Step 1: Definition of the study area and identification and description of traffic conditions and problems related to road safety.
  • Step 2: Selection of experts in the field of transport, and especially in the fields of road safety and sustainable urban mobility, for the application of the modified Delphi (Step 4), as well as for the execution of the required pair-wise comparisons (Step 5). It is recommended that such procedures be executed anonymously by the experts (only the analyst knows who has answered what), so that all the participants are treated in an equal way, without being influenced by others, ensuring, at the same time, openness and honesty [18,69,70,71].
  • Step 3: Creation of an inventory of factors affecting road safety in the study area, based on an international literature review, as well as study of recent road accidents having taken place in the area. Table 1 of the present research work can be used as a “pool” for this task.
  • Step 4: Application of a modified Delphi, as proposed in [18], in order to finalize the factors list and to identify the most significant ones for the area under study. The main advantage of the modified Delphi, compared to a traditional Delphi (Appendix B), is that the completion of the process is possible even from the first round, consuming less time and resources [46]. In the context of the modified Delphi, the list of factors formulated in Step 3 is delivered to a group of experts who are asked to select the 10 most important ones (in their opinion), as well as to add any other factor that should have been included in the list. Those factors selected by at least a specific percentage (e.g., 50%) are considered to be the most important ones and are prioritized as described in Step 5 (AHP pair-wise comparisons).
  • Step 5: Execution of pair-wise comparisons (by a group of experts) between the most important road safety factors for the specific area, as identified in Step 4, in order to extract the relevant weights (AHP priority vector (Appendix A)) of these factors.
  • Step 6: Creation of a list with measures and policies (alternatives) for the targeted management of the most important factors affecting road safety in the study area, based on an international literature review and best practices adopted in other areas all over the world. The inventory of measures and policies included in Section 3.2.5 of the present research work can be used as a “pool” for this task.
  • Step 7: Application of a modified Delphi in order to finalize the alternatives list and identify the most significant ones for the study area. The Delphi application in this step is optional, as the list of alternatives can be finalized by the decision-support analysts (on the condition that they are experts in transport sector) and/or in cooperation with transport engineers.
  • Step 8: Execution of pair-wise comparisons between the alternatives (measures and policies) identified in Step 7 in order to extract the relevant AHP priority vectors (Appendix A) expressing the performance/effectiveness of each alternative with regard to each factor. The pair-wise comparisons in this step can be executed by the decision-support analysts (on the condition that they are experts in transport sector) and/or in cooperation with transport engineers.
  • Step 9: Application of TOPSIS (Appendix C) for the overall ranking of the alternatives.
It is noted that each urban area differs from another and is characterized by special requirements regarding the effective management of sustainable mobility problems, including road safety problems. It is therefore suggested that the proposed methodology is applied to a specific urban area (e.g., a municipality or a metropolitan area), aiming at identifying and prioritizing relevant road safety factors and policies. Moreover, apart from urban road networks, the proposed methodology can also be applied for the reduction—and almost elimination at a long-term level—of road accidents in national road networks, in any country, after the necessary adaptation of the inventories of factors and measures and policies.

3. The Greek Urban Networks as a Case Study

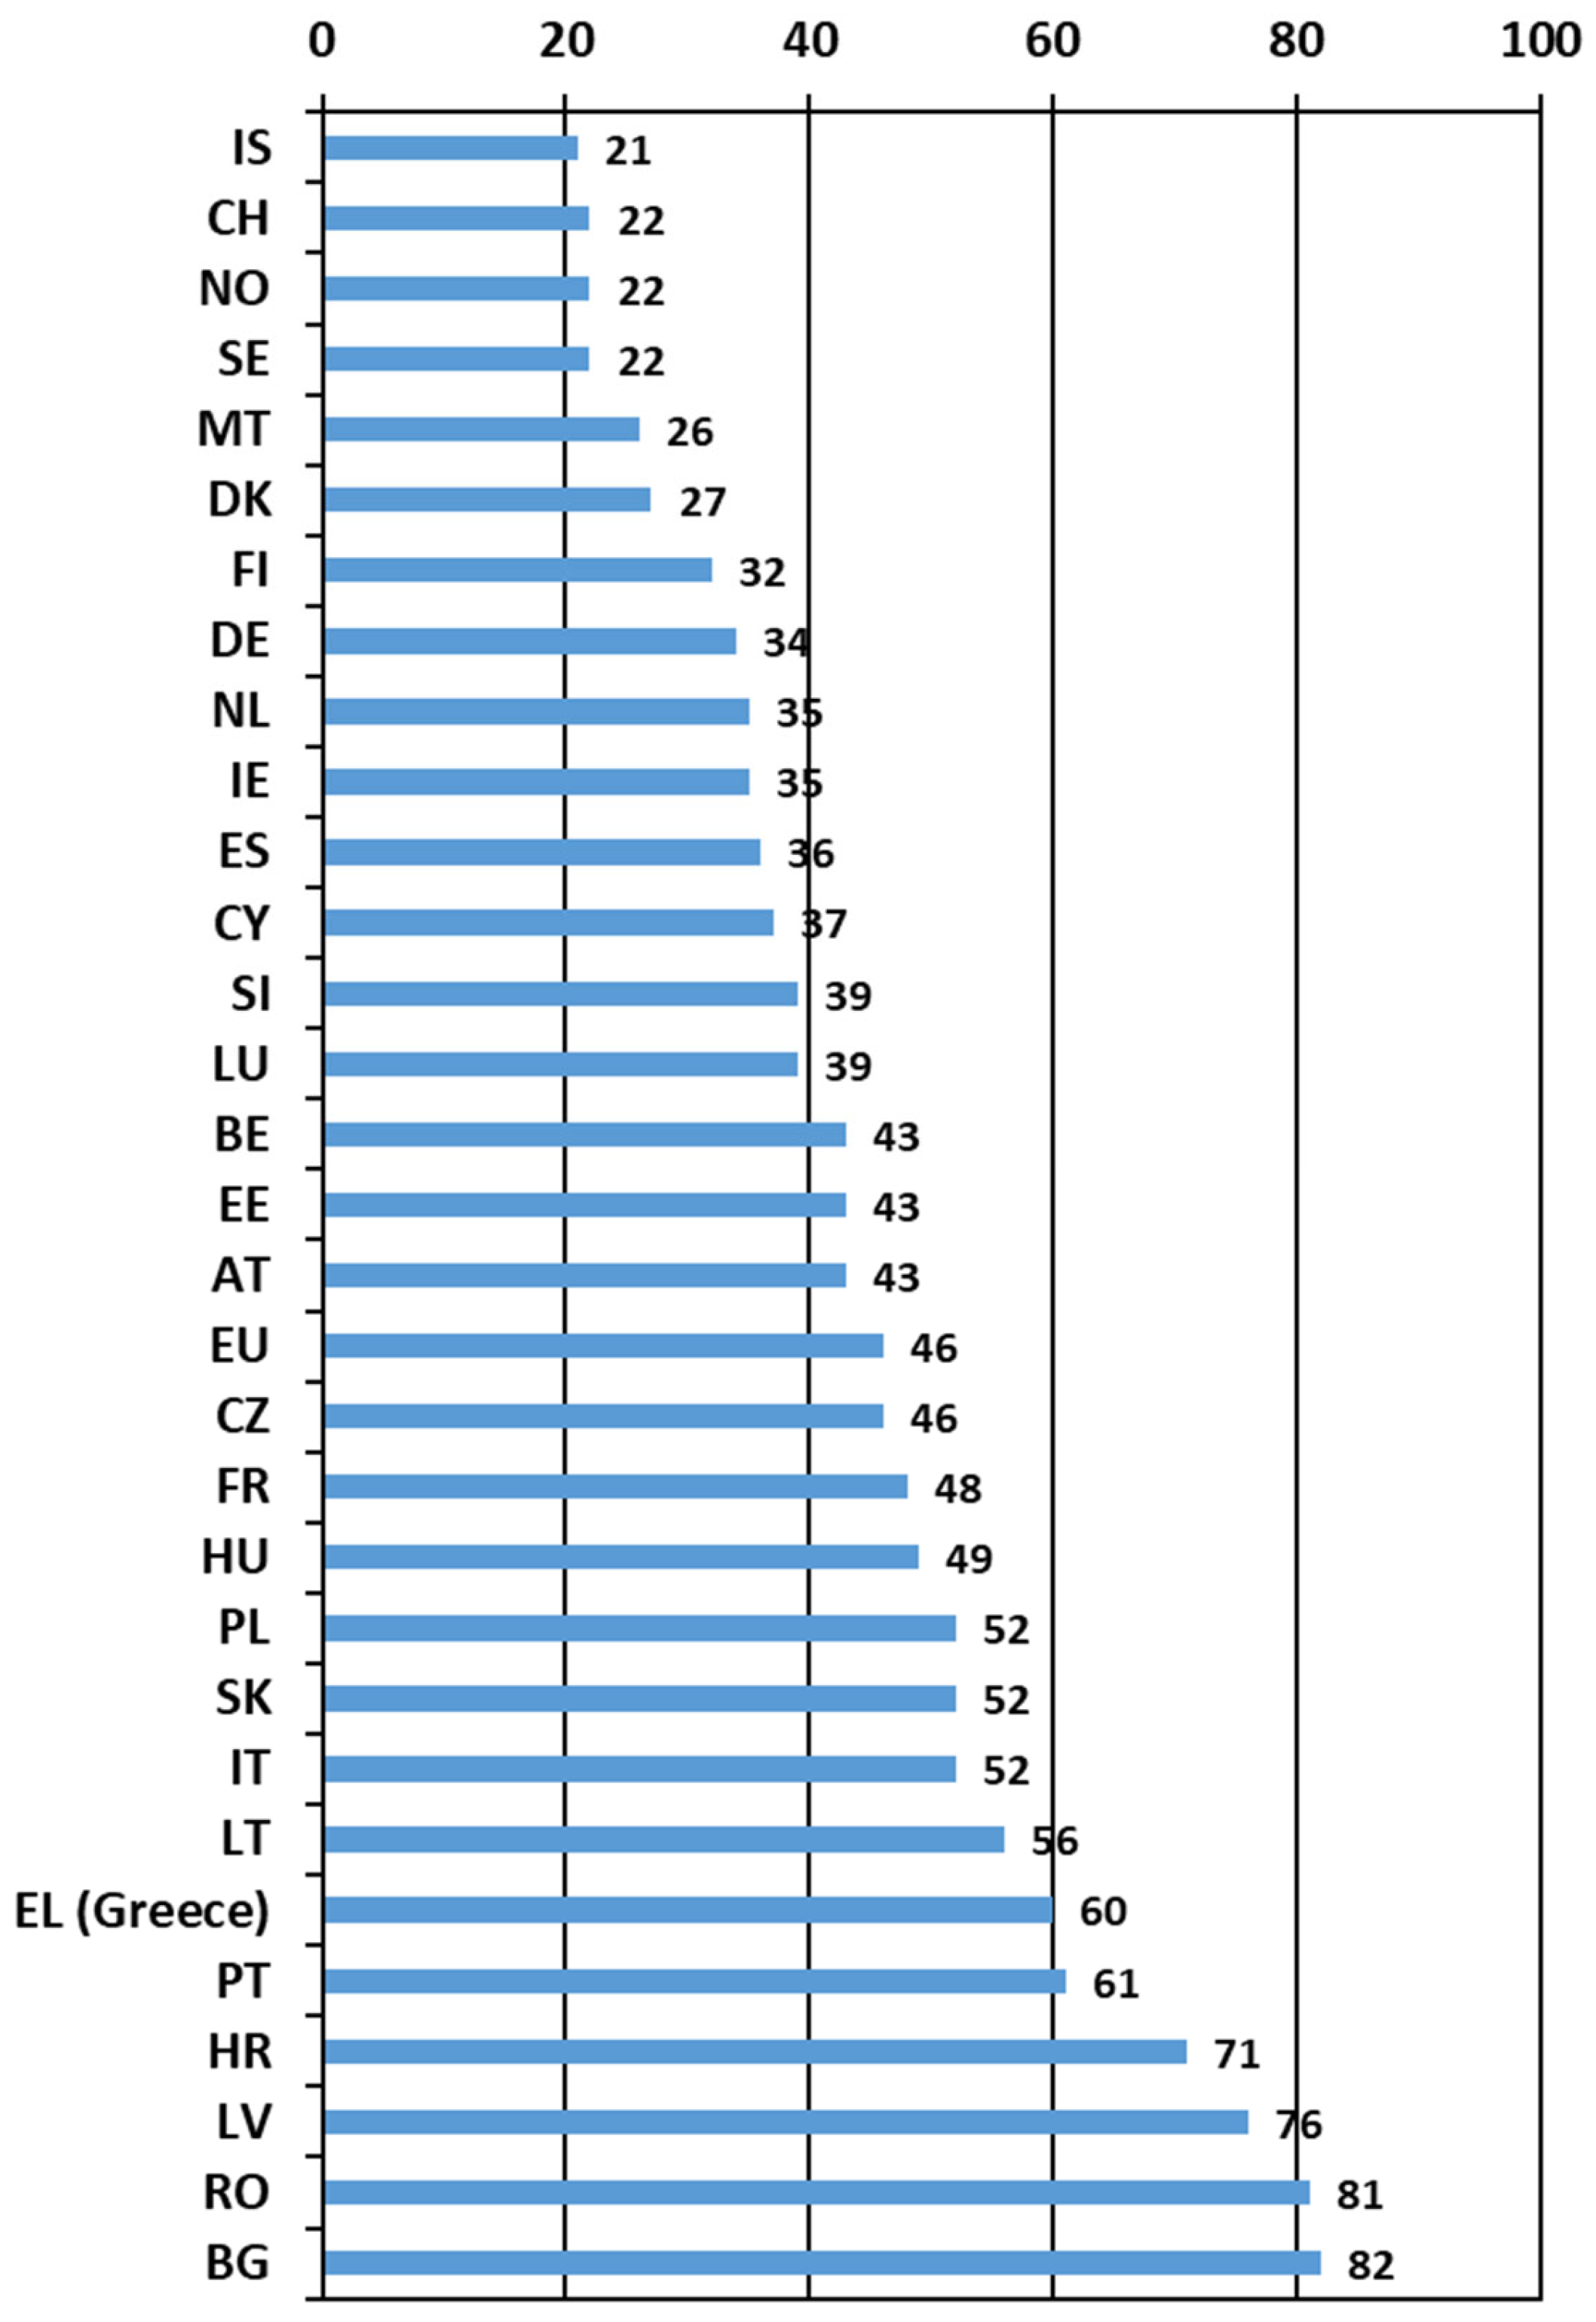
3.1. Road Safety Level in Greek Urban Road Networks

Despite the considerable improvement in the field of road safety in previous years, a worrisome increase in road accidents—even worse, road fatalities—is observed in Greek road networks, and even more in urban areas. Road accidents have been increased in Greece in 2023 compared to 2022, placing Greece (EL) in the sixth worst position in the EU (after Bulgaria, Romania, Latvia, Croatia, Portugal) in terms of road fatalities per million inhabitants [72], as shown in Figure 2 (preliminary data 2023). According to preliminary data of the Hellenic Statistical Authority [73,74], this increase is translated into 621 road fatalities, 657 serious injuries and 12,644 injuries.
In 2022 (available data), 50% of road fatalities in Greece concerned urban roads, a percentage that differs from the 38% EU corresponding average, as shown in Figure 3, including the fatalities by road type and country for the last available year [8]. It should be noted that, in Figure 3, the shares for countries with less than 10 fatalities have been omitted, and Liechtenstein has been omitted due to the extremely low number of total fatalities. As can be concluded from Figure 3, Greece is ranked in the fifth worst position in terms of fatalities in urban road networks in the EU, where Cyprus (68%), Romania (62%), Portugal (54%) Croatia (53%) and Greece (50%) are characterized by the highest percentage of road fatalities in EU urban networks, while Norway (22%), Ireland (23%), Finland (25%), Spain (27%) and Luxemburg (28%) by the lowest ones.
According to the results of a survey carried out in 2024 and related to the road safety perception in 32 European cities, the citizens of Rome and Athens seem to be the most dissatisfied in Europe with the road safety measures being implemented in their cities, contrary to London and Helsinki, which are characterized by the most satisfied citizens as regards road safety measures being implemented in their cities [3]. Moreover, Rome and Athens are characterized by the highest percentage of citizens believing that the quality of the roads creates dangerous traffic situations in their city, contrary to Vienna, which is characterized by the lowest corresponding percentage [3]. The aforementioned findings are indicative of the size of the road safety problems characterizing the capital of Greece compared to other European capitals, while the situation is analogous in Greek urban networks, in general, as already mentioned and confirmed by the combination of the findings depicted in Figure 1 and Figure 2. For this reason, in combination with the fact that Greece (especially the two largest cities of Athens and Thessaloniki) constitutes a major tourist destination, widening—in that way—the scope of the problem, the Greek urban road networks, starting from the city of Thessaloniki, are selected as a case study for the application of the proposed methodology.
It is worth mentioning that the Greek National Road Safety Strategic Plan (2021–2030) constitutes a relatively recent attempt to improve road safety in Greece [9,75]. Following the same philosophy as the EU’s “Vision Zero strategy” [10] and the UN General Assembly’s “Decade of Action for Road Safety 2021–2030” [11], it aims at eliminating road fatalities by 2050, with an intermediate target of halving road fatalities and serious injuries by 2030 compared to 2019 numbers [9,75]. However, despite the fact that the National Road Safety Strategic Plan (2021–2030) was presented in 2021, no measures have been implemented in practice up to now, while the Road Traffic Code is expected to be revised in 2025. As regards particularly urban areas, the following are proposed in the Greek National Road Safety Strategic Plan (2021–2030), without further details [9]:
  • Creation of zones of 30 km/h in all urban areas
  • Creation of roundabouts
  • Redesign of intersections
  • Widening of sidewalks
  • Traffic-calming measures
  • Speed limit of 20 km/h out of schools
  • Upgrading of pedestrian crossings
  • Creation of infrastructure for bicycles and scooters
  • Upgrading of road pavement, safety barriers, signaling, lighting, vegetation maintenance
As evidenced by the aforementioned data, it is important to apply the methodology included in this research work to all Greek urban areas in order to improve road safety, while it is important to start from Athens and Thessaloniki, which are the largest Greek cities, constituting major tourist destinations for tourists from all over the world. The derived results could be capitalized and integrated into the ambitious vision of “zero accidents in Greek urban road networks”, translated into reducing road accidents and eliminating fatalities, at the short- and medium-term levels, and almost totally eliminating road accidents in Greek urban networks, at the long-term level.

3.2. Analysis and Results

3.2.1. Definition of the Decision Problem and the Area Under Study

Thessaloniki, the second largest city in Greece, a major tourist destination, with a population in the metropolitan area that exceeds 1,000,000, is selected as the area to which the methodology will be first applied. Indicatively, as more recent data are not yet (January 2025) available, it is mentioned that only in the first 5 months of 2024, 145 road accidents involving pedestrians were recorded in Thessaloniki, while in the first 5 months of 2023, that number was equal to 86 (+66%) [55]. The area has been recently “wounded” by extremely shocking road accidents with fatalities and serious injuries, including students, children, pregnant women and elderly. For these reasons, Thessaloniki is selected as the first Greek city for the application of the proposed methodology.

3.2.2. Selection of Experts for the Identification and Prioritization of Road Safety Factors

A number of 8–15 experts is recommended for such procedures [18,69]. Fifteen experts for the final list of the factors and ten experts for the pair-wise comparison of the most important factors were selected and participated in each stage, as described in Section 2.2. Professors, researchers and private sector professionals were selected based on their studies, experience and active engagement (research projects, publications, etc.) with road safety and sustainable urban mobility. At the same time, the experts should have a good knowledge of the area under study. Moreover, in alignment with the anonymity requirement, as defined in Section 2.3 (Step 2 of the proposed methodology), the commitment to safeguarding participant identity, fostering a sense of trust and credibility, was explicitly mentioned in the questionnaire delivery process, which—in the present research—was carried out by e-mail. For the application of the modified Delphi, as well as for the execution of the pair-wise comparisons, as described in Section 2.3, experts from the following institutions and companies were “recruited”: Aristotle University of Thessaloniki, National Technical University of Athens, University of Thessaly, University of Western Attica, Hellenic Institute of Transport (Centre for Research and Technology-Hellas), Thessaloniki Transport Authority S.A.

3.2.3. Identification of the Most Important Factors Undermining Road Safety in Thessaloniki

Applying a modified Delphi process, as described in Step 4 of Section 2.3., the list of the most important factors to be prioritized through the AHP pair-wise comparisons was extracted, with the participation of a group of 15 experts, for the urban area of Thessaloniki. Namely, the inventory of the most common factors leading to road accidents in urban areas, as included in Table 1 (based on a comprehensive literature review and careful study of the road safety conditions in Greek urban networks), was delivered to a group of 15 experts (selected as referred to in Section 3.2.2), asking them to select the 10 most important ones (in their opinion), as well as to add any other factor that should have been included in the list. The survey was carried out between 30 August and 12 October 2024 for the urban area of Thessaloniki. Those factors selected by at least 50% of the experts were considered to be the most important ones, thus constituting the final list, on the basis of which appropriate measures and policies were subsequently evaluated and prioritized. In the context of the execution of Delphi in this research work, no other factors were added by the experts as being more important than the ones already included in the list. The process was, therefore, completed in the first round, with 10 factors being selected by at least 50% of the experts for the urban area of Thessaloniki, as shown in Table 2, along with the corresponding selection percentage.
The first factor was selected by 86.7% of the experts, the second and third by 80%, the fourth by 73.3%, the next four factors by 66.7%, and the last ones by 60% and 53.3%, respectively. The ten factors highlighted as the most important ones through the Delphi process were prioritized according to the AHP, following the steps of the methodology described in Section 2.3.

3.2.4. Prioritization of the Factors Undermining Road Safety in Thessaloniki

In order to extract the weights of the 10 factors included in the final list, pair-wise comparisons were executed between the ten factors by a group of 10 experts in terms of the importance for the achievement of the overall goal, according to the Saaty’s 9-point scale [13], as shown in Table 3. An indicative part of these pair-wise comparisons executed by each expert of the group is shown in Table 4.
The “aggregation of individual judgments method” [18,69,76] was applied for the aggregation of the experts’ judgments, while the AHP consistency ratio CR (Appendix A) was used for the control of the consistency of the judgments. The judgments of the experts and the corresponding geometric mean (for n elements x1, x2, …, xn, geometric factor equals x 1 × x 2 × x n n ) calculated in each case are included in Table 5. Concerning the values shown in Table 5, extracted through the pair-wise comparisons of the factors, the value selected by each expert was introduced into the analysis when the value on the left was selected by the expert in the questionnaire an indicative part of what is shown in Table 6, while the reverse of the selected value was introduced into the analysis when the value on the right was selected by the expert.
An AHP pair-wise comparison matrix for the factors was formulated using the geometric mean values shown in Table 5, and it is shown in Table 6. The normalized comparison matrix was calculated on the basis of Table 6 and according to Appendix A, and it is shown in Table 7, along with the priority vector (Equation (A2)) (factors weights) and the respective consistency control (Appendix A, CR < 0.10).
According to the calculated priority vector for the factors, as shown in Table 7, the ranking of the factors undermining road safety in the urban area of Thessaloniki, in descending order, is shown in Table 8.

3.2.5. Identification of Alternatives (Measures and Policies) for the Improvement of Road Safety

On the basis of the most important factors leading to an increased number of road accidents in Thessaloniki compared to other EU cities, four alternatives to be evaluated were defined by the analysts through a literature review and careful study of the examined area and the relevant incidents. It should be noted that not all the measures and policies have been directly derived from the literature review (certain measures and policies have been suggested by the authors, after careful study of the study area, the existing conditions and taking into account the mentality of the residents, while others have indirectly been derived by relevant publications). The alternatives consist of four sets of measures and policies, as shown in Table 9 [6,9,33,34,39,44,45,49,50,51,54,56,58,77,78,79,80,81,82,83,84,85,86,87,88].

3.2.6. Evaluation of Alternatives (Measures and Policies) with Regard to Each Factor

Exactly the same process followed for the prioritization of the factors (as described in Section 3.2.4) is followed for the prioritization of the alternatives (measures and policies) for the improvement of road safety. This time, the alternatives are compared in pairs with regard to each factor, in terms of the effectiveness, using again Saaty’s 9-level scale [13], as shown in Table 10. These comparisons could be executed by a group of experts, but in the present work, they are executed by the authors. An indicative part of the executed pair-wise comparisons is shown in Table 11.
Following exactly the same steps as described in Section 3.2.4 for the factors, the four sets of measures and policies (alternatives) are prioritized. For this purpose, the AHP is applied for the extraction of the priority vectors of the alternatives with regard to each factor (expressing the effectiveness of each alternative with regard to each factor) through pair-wise comparisons of the alternatives with regard to each factor, based on Table 10 and Table 11. By analogy with Table 5 and Table 6, referring to the prioritization of the factors (Section 3.2.4), Table A2 (Appendix D) includes the values attributed by the authors to the alternatives, in the context of the pair-wise comparisons, with regard to each factor, while Table A3 (Appendix D) shows the comparison matrix of the alternatives with regard to each factor. Finally, the normalized comparison matrix of the alternatives, the corresponding priority vector, as well as the consistency control, in each case, are shown in Table 12.

3.2.7. Final Ranking of the Alternatives (Measures and Policies) for the Improvement of Road Safety

The priority vectors of the alternatives (measures and policies) calculated in Section 3.2.6, as derived through the pair-wise comparisons, are shown in Table 13. These priority vectors represent the effectiveness of the alternatives with regard to each factor and are used as input data for the formulation of the decision matrix of TOPSIS, as applied for the overall ranking of the alternatives. Given that the elements of the priority vectors are already normalized, the data can be directly used for the application of TOPSIS, without requiring any further normalization, as would happen, for example, in the case of deriving the effectiveness of the alternatives through an absolute 1 to 10 rating.
The weighted normalized decision matrix for TOPSIS, as shown in Table 14, is then calculated, based on Table 13 and according to Equation (A7), using the factor weights (W) in Table 7.
It is noted that all the factors are regarded as benefit functions due to the way the questions were formed (asking which one is more effective than the other), as shown in Table 11. Thus, the values of A+ and A are calculated according to Equations (A8) and (A9), as follows:
A+ = {0.0782 0.1160 0.0997 0.1303 0.0962 0.1093 0.0891 0.0851 0.1132 0.2548}
A = {0.0078 0.0086 0.0082 0.0109 0.0077 0.0121 0.0104 0.0083 0.0162 0.0231}
The values of Si+, Si and ci+ are then calculated, according to Equations (A10), (A11) and (A12), respectively, and shown in Table 15, with the ranking of the alternatives (measures and policies) based on the ci+ values shown in Table 15, as well.
According to Table 15, the four sets of alternatives (consisting of the measures and policies defined in Table 9) for the improvement of road safety in the urban area of Thessaloniki are prioritized as shown in Table 16.

4. Discussion

As shown in Table 8, according to the experts, the most important factor undermining road safety in the urban area of Thessaloniki is related to the failure to carry out systematic and adequate controls in urban road networks for the detection of any infringement due to limited resources, with an impressively high weight equal to 37.47%, by far from the second one (weight = 20.41%). The prominence of this factor related to inadequate surveillance and policing seems to be in full accordance with the results derived from a recent study [89], which, after confirming the remarkably low performance of Greece in terms of road safety compared with other EU States, suggests that the situation could be improved via stricter legislation and policing. At the same time, “fragmented” and almost arbitrary decision-making (by the authorities in charge) regarding road safety improvement, without adopting a scientific, knowledge-based decision-aiding methodology, ranks second (weight = 20.41%). This result highlights the existing gap in decision-making regarding road safety improvement in Thessaloniki, where the decisions are made almost arbitrarily. In other words, this result stresses the need to implement a scientific decision-aiding methodology (e.g., that proposed in this research work) in order to develop and implement effective measures and policies toward improving road safety on the basis of the most important identified factors. The inappropriate driving behavior of passenger and freight vehicle users, especially characterized by high speed (weight = 20.04%), as well as of cyclists, motorcyclists and electric scooter users (weight = 17.71%) are found in the next two ranking positions. The laxity of the imposed penalties for road traffic offences, especially in case of systematic reoccurrence (weight = 16.17%), ranks fifth. The lack or inappropriate design of infrastructure for pedestrians, bicycles, scooters, etc., creating a higher risk environment for them, especially for people with disabilities or reduced mobility (e.g., elderly, people with children, prams, etc.) (weight = 15.78%), ranks sixth. The lack of cooperation and coordination between local, regional, and national authorities (either at the same or across different administrative levels) regarding decision-making (weight = 14.86%) follows. The failure to educate and inform citizens about road safety (even starting from the kindergarten) (weight = 14.57%) is found in the next ranking position. The illegal/inappropriate behavior of certain road network users toward others (e.g., illegal parking at junctions, on sidewalks, pedestrian areas, etc.), hindering both pedestrian and vehicle movement, as well as the visibility at junctions (weight = 14.34%) follows. As regards the aforementioned factor, it should be mentioned that, in Greek urban areas, there are illegally parked vehicles at every junction, despite the relevant prohibition according to the Greek Road Traffic Code, resulting in the reduction of other motorists’ and pedestrians’ visibility and, therefore, increasing the risk of accidents. Inadequate or inappropriate road infrastructure maintenance (potholes, cracked pavement, invisible signage because of untrimmed trees, signaling malfunctions, vandalized signs, insufficient lighting, faded pedestrian crossings, etc.) (weight = 11.63%) ranks last.
On the basis of the above-mentioned factors highlighted by the experts as the most important ones for the urban area of Thessaloniki, four sets of measures and policies (alternatives) for the improvement of road safety in a targeted way are identified (as shown in Table 9) and prioritized (as shown in Table 16). According to the extracted results, ensuring the availability of the necessary resources for systematic controls in urban road networks (controls by means of both physical presence of policemen and technological equipment, such as cameras) is highlighted as the most effective alternative. Appropriate planning, design and management of infrastructure on behalf of each municipality of the urban area under study (speed humps, flexible posts at junctions, reduced speed limit, infrastructure maintenance, prevention of illegal parking, decision support analysts engagement etc.) ranks second. Improvement of the regulatory and legal framework (factors related to the process of educating trainee drivers, acquiring and renewing a driving license, facilitating the cooperation between different authorities, as well as to the penalties imposed for road traffic offences, etc.) ranks third. Taking initiatives related to education, awareness-raising and social responsibility (road safety lessons at school, motivation of private sector companies to contribute to road safety improvement, media engagement, etc.) is found in the last ranking position. As already mentioned, the specific measures and policies included in each one of the prioritized above-mentioned four sets are shown in Table 9. It should also be noted that all the measures and policies shall be implemented; however, the alternatives are prioritized in terms of the effectiveness with regard to the most important identified factors, especially given the restricted availability of financial resources for road safety improvement in Greece.

5. Conclusions

The aim of the present research is to provide decision-support analysts and policy-makers with a decision-support tool that identifies and prioritizes the factors undermining road safety in a specific urban area, with a view to developing effective policies through a multi-criteria analysis approach, taking into account the particularities and special needs of the study area. For this purpose, a comprehensive inventory of the factors undermining road safety in urban areas, as well as an inventory of relevant measures and policies, is provided, based on an international literature review. A modified Delphi-AHP-TOPSIS model is proposed for the identification and prioritization of the most important factors and policies for the improvement of road safety in urban areas. The Greek urban networks, characterized by major road safety problems, especially compared with other EU states’ urban networks, are selected as a case study. The application of the proposed methodology starts from the urban area of Thessaloniki, the second largest city in Greece and a major tourist destination, which suffers a lot from road accidents.
As thoroughly discussed in Section 4, stricter surveillance and policing in urban road networks, adoption of a scientific decision-aiding methodology instead of arbitrary decision-making for the development and implementation of road safety measures and policies, effective cooperation and coordination between charging authorities, awareness raising initiatives, and appropriate infrastructure planning, design and management emerge as the most important practical implications for the urban area of Thessaloniki. Analogous results to those thoroughly discussed in Section 4 (both at the factor and, consequently, the measures and policies levels) are expected from the implementation of the proposed methodology in all Greek urban areas, which are characterized by almost the same problems. Thus, the implementation in, at least, the largest ones is suggested, so that an integrated road safety plan can be developed and applied to all the Greek urban areas within the framework of road safety improvement in a holistic way. It should be mentioned, though, that equally as important as the research per se is the dissemination of the results and conclusions to all stakeholders, especially to policy-makers and decision-makers (ministries, municipalities, etc.) engaged with road safety improvement. For this purpose, a relevant communication of the results shall be scheduled, with a view to practical implementation in the study area, as well as to launching the basis for the application of the proposed methodology to all Greek urban areas characterized by significant road safety problems, as documented in Section 3.1. Under the vision of “zero accidents in Greek urban road networks”, the effective cooperation between academics, researchers, politicians, public authorities and other stakeholders is considered crucial for the drastic reduction—and almost elimination at long-term level—of road accidents in Greek urban areas.
The modified Delphi-AHP-TOPSIS model proposed in this research work for road safety improvement in urban areas allows for the identification and prioritization of the most important factors undermining road safety and, subsequently, of the most effective measures and policies, taking into account any particularities of the study area. In combination with the provided inventories of factors and measures and policies, which can be used as “pools” in case of implementing the methodology to any urban area, this constitutes an important decision-support tool for transport planners, decision-support analysts and policy-makers. The proposed methodology could also be applied for road safety improvement in national road networks, either in Greece or in other countries (with all the necessary adaptations of the inventories of factors and measures and policies).
Apart from the advantages referred to in Section 2.3 regarding the engaged methods, the proposed methodology can be adapted to any urban area, taking into account any special conditions and particularities, allowing for the integration of experts’ opinions into the analysis, as well as for the inclusion of relevant international literature data. The added value of the applied methodology is the ability to serve the purpose of the EU’s Vision Zero strategy, also adopted by the UN General Assembly, through the identification and prioritization of the most important factors and, therefore, the development of effective measures and policies for the improvement of road safety in any urban area. The prioritization of factors is crucial for the development of targeted solutions, while the prioritization of measures and policies is of high significance, particularly in the case of limited financial resources. Moreover, a group of experts participates in the crucial phases of the identification and prioritization of factors, aiming at minimizing the subjectivity related to the evaluation of the elements in the context of an MCA, which might be realized only by the decision-support analyst and/or the decision-maker. These two phases are of extremely high importance, as the in-depth comprehension of a problem and its “roots” constitutes the “A to Z” for its effective management, with the proposed measures and policies being formulated so as to deal with the most important factors in an absolutely targeted way. Furthermore, the decision-support analyst can easily identify any experts’ judgments “generating” inconsistency in the pair-wise comparison phase and, in case it is considered necessary, ask those “responsible” for the inconsistency if they would like to reconsider their answers. The decision-support analysts and/or policy-makers and decision-makers (municipalities, ministries, etc.) will be able to easily apply the proposed methodology in practice, toward improving road safety in any urban area, using as a basis the inventories of factors and measures and policies provided in this research work.
The main limitation of the proposed methodology is related to the difficulty in executing pair-wise comparisons in the case of a high number of compared in pairs elements. As regards future research, the application of other MCA methods (e.g., VIKOR) is suggested for validation purposes. Finally, software creation, including as a database for the inventory of potential factors undermining road safety in an urban area (Table 1), as well as the inventory of measures and policies (Table 9), is also recommended as a future prospect, aiming at further facilitating the application of the proposed methodology in practice.

Author Contributions

Conceptualization, K.A.; methodology, K.A.; formal analysis, K.A.; investigation, K.A.; resources, K.A. and F.K.; data curation, K.A.; writing—original draft preparation, K.A.; writing—review and editing, K.A. and F.K.; visualization, K.A. and F.K.; supervision, F.K.; project administration, F.K., funding acquisition, K.A. All authors have read and agreed to the published version of the manuscript.

Funding

This research was funded by the Research Committee of the Aristotle University of Thessaloniki (Νο. 50186).

Data Availability Statement

Data are contained within the article.

Conflicts of Interest

The authors declare no conflicts of interest. The funders had no role in the design of the study; in the collection, analyses, or interpretation of data; in the writing of the manuscript; or in the decision to publish the results.

Appendix A. Brief Presentation of the Analytic Hierarchy Process (AHP), Delphi Method and Technique for Order Preference by Similarity to Ideal Solution (TOPSIS)

In the context of the analytic hierarchy process (AHP) [13], the hierarchy structure of the decision problem is formed, with the overall goal placed on the top, the criteria at the lower lever and the alternatives at the lowest level. The pair-wise comparison of the criteria and the alternatives follows, based on a 1–9 scale. In both cases, a pair-wise comparison matrix, Equation (A1), is derived (n is the number of the elements of the same hierarchy level). The entry αij = wi/wj represents the relative importance/preference of the element i over the element j, when compared with regard to each element of the higher level, while wi and wj are the weight/preference coefficients of the elements i and j, respectively, with αij = 1/αji and αii = wi/wi = 1.
A = a 11 a 12 a 1 n a 21 a 22 a 2 n a n 1 a n 2 a n n
Dividing each element by the sum of the elements in the same column leads to the formulation of the normalized pair-wise comparison matrix.
Then, the priority vector W = (w1, w2, …, wn)T for each hierarchy level is calculated through Equation (A2), with λmax being the principal eigenvalue of matrix A of Equation (A1).
( A λ max ) × W = 0
The inevitable inconsistencies are included in the analysis, calculating the consistency ratio (CR) according to Equation (A3):
C R = C I / R I
In Equation (A3), RI is the random consistency index, given in Table A1 for n compared elements, while CI is the consistency index, calculated according to Equation (A4):
C I = λ m a x n n 1
Table A1. RI values for n elements compared in pairs.
n12345678910
RI0.000.000.580.901.121.241.321.411.451.49
The consistency ratio (CR) must be equal to or lower than 0.10. In case the CR is higher than 0.10, the re-examination of the problem and the re-consideration of the values of the decision matrix are necessary.

Appendix B. Brief Presentation of the Delphi Method

As regards the Delphi method, a group of people (e.g., experts or stakeholders) are asked to express their opinions on a subject through an iterative survey process, which is anonymous and might be executed in many rounds, at least two [71]. The judgments recorded in the first round of a common Delphi process (which usually includes qualitative data) are synthesized and delivered back to the group of respondents, aiming, e.g., at the evaluation of the concerned elements through a rating system (e.g., Likert scale), until consensus is achieved or until a predefined number of rounds is completed [90].

Appendix C. Brief Presentation of the Technique for Order Preference by Similarity to Ideal Solution (TOPSIS)

For the application of the technique for order preference by similarity to ideal solution (TOPSIS) [14], a decision matrix, Equation (A5), is formulated (n criteria and m alternatives), with the element xij expressing the performance of the alternative Ai in terms of the criterion Cj, where i = 1, 2,…, m and j = 1,2, …, n.
C 1 C 2 C n D = A 1 A 2 A m x 11 x 12 x 1 n x 21 x 22 x 2 n x m 1 x m 2 x m n
The decision matrix D is then normalized using any normalization technique. For example, using the vector normalization technique, the elements rij of the normalized decision matrix are calculated according to Equation (A6):
r i j = x i j i = 1 m x i j 2 ,
Then, the weighted normalized matrix is calculated, with its vij elements being calculated according to Equation (A7):
v i j = w j · r i j
where wj the weight of the criterion Cj (where j = 1, 2, …, n) and Σwj = 1.
In the next step, the ideal (A+) and negative-ideal (A) solutions are calculated according to Equation (A8) and Equation (A9), respectively:
A + = { ( max i v i j   |   j J ) , min i v i j   |   j J )   |   i = 1 ,   2 ,   ,   m } = { v 1 + ,   v 2 + ,   ,   v j + , ,   v n + }
A = { ( min i v i j   |   j J ) , max i v i j   |   j J )   |   i = 1 ,   2 ,   ,   m } = { v 1 ,   v 2 ,   ,   v j , ,   v n } ,
where J = {j = 1, 2, , n, with j referring to benefit criteria} and J′ = {j = 1, 2, , n, with j referring to cost criteria}.
The “Euclidian distance method” is then applied for the calculation of the distance of each alternative from the ideal solution (Si+) and the distance of each alternative from the negative-ideal solution (Si), according to Equation (A10) and Equation (A11), respectively.
S i + = i = 1 m ( v i j v i + ) 2 ,   where   i = 1 ,   2 ,   ,   m .
S i = i = 1 m ( v i j v i ) 2 ,   where   i = 1 ,   2 ,   ,   m .
For the final ranking of the alternatives, the relative closeness ci+ to the ideal solution is calculated, according to Equation (A12):
c i +   =   S i ( S i + + S i ) ,   where   0 c i + 1   for   i = 1 ,   2 ,   ,   m   ( c i + = 1   if   A i = A +   and   c i + = 0   if   A i = A )
The highest ci+ value corresponds to the best alternative.

Appendix D. Attributed Values for the Compared in Pairs Alternatives and the Comparison Matrix of the Alternatives, with Regard to Each Factor

Table A2. Attributed values for the compared in pairs alternatives, with regard to each factor.
F1: AlternativesAttributed ValuesDecimal Form
A1 vs. A21/70.1429
A1 vs. A31/40.2500
A1 vs. A41/50.2000
A2 vs. A344.0000
A2 vs. A433.0000
A3 vs. A41/20.5000
F2: AlternativesAttributed ValuesDecimal Form
A1 vs. A21/90.1111
A1 vs. A31/70.1429
A1 vs. A41/50.2000
A2 vs. A333.0000
A2 vs. A455.0000
A3 vs. A422.0000
F3: AlternativesAttributed ValuesDecimal Form
A1 vs. A21/90.1111
A1 vs. A31/50.2000
A1 vs. A41/20.5000
A2 vs. A344.0000
A2 vs. A488.0000
A3 vs. A444.0000
F4: AlternativesAttributed ValuesDecimal Form
A1 vs. A288.0000
A1 vs. A355.0000
A1 vs. A477.0000
A2 vs. A31/40.2500
A2 vs. A41/30.3333
A3 vs. A422.0000
F5: AlternativesAttributed ValuesDecimal Form
A1 vs. A21/90.1111
A1 vs. A31/40.2500
A1 vs. A41/30.3333
A2 vs. A355.0000
A2 vs. A466.0000
A3 vs. A422.0000
F6: AlternativesAttributed ValuesDecimal Form
A1 vs. A211.0000
A1 vs. A311.0000
A1 vs. A41/90.1111
A2 vs. A311.0000
A2 vs. A41/90.1111
A3 vs. A41/90.1111
F7: AlternativesAttributed ValuesDecimal Form
A1 vs. A277.0000
A1 vs. A322.0000
A1 vs. A444.0000
A2 vs. A31/50.2000
A2 vs. A41/30.3333
A3 vs. A433.0000
F8: AlternativesAttributed ValuesDecimal Form
A1 vs. A21/90.1111
A1 vs. A311.0000
A1 vs. A41/20.5000
A2 vs. A399.0000
A2 vs. A488.0000
A3 vs. A41/20.5000
F9: AlternativesAttributed ValuesDecimal Form
A1 vs. A211.0000
A1 vs. A31/70.1429
A1 vs. A411.0000
A2 vs. A31/70.1429
A2 vs. A411.0000
A3 vs. A477.0000
F10: AlternativesAttributed ValuesDecimal Form
A1 vs. A266.0000
A1 vs. A399.0000
A1 vs. A499.0000
A2 vs. A344.0000
A2 vs. A444.0000
A3 vs. A411.0000
Table A3. Comparison matrix of the alternatives, with regard to each factor.
F1A1A2A3A4
A11.00000.14290.25000.2000
A27.00001.00004.00003.0000
A34.00000.25001.00000.5000
A45.00000.33332.00001.0000
F2A1A2A3A4
A11.00000.11110.14290.2000
A29.00001.00003.00005.0000
A37.00000.33331.00002.0000
A45.00000.20000.50001.0000
F3A1A2A3A4
A11.00000.11110.20000.5000
A29.00001.00004.00008.0000
A35.00000.25001.00004.0000
A42.00000.12500.25001.0000
F4A1A2A3A4
A11.00008.00005.00007.0000
A20.12501.00000.25000.3333
A30.20004.00001.00002.0000
A40.14293.00000.50001.0000
F5A1A2A3A4
A11.00000.11110.25000.3333
A29.00001.00005.00006.0000
A34.00000.20001.00002.0000
A43.00000.16670.50001.0000
F6A1A2A3A4
A11.00001.00001.00000.1111
A21.00001.00001.00000.1111
A31.00001.00001.00000.1111
A49.00009.00009.00001.0000
F7A1A2A3A4
A11.00007.00002.00004.0000
A20.14291.00000.20000.3333
A30.50005.00001.00003.0000
A40.25003.00000.33331.0000
F8A1A2A3A4
A11.00000.11111.00000.5000
A29.00001.00009.00008.0000
A31.00000.11111.00000.5000
A42.00000.12502.00001.0000
F9A1A2A3A4
A11.00001.00000.14291.0000
A21.00001.00000.14291.0000
A37.00007.00001.00007.0000
A41.00001.00000.14291.0000
F10A1A2A3A4
A11.00006.00009.00009.0000
A20.16671.00004.00004.0000
A30.11110.25001.00001.0000
A40.11110.25001.00001.0000

References

  1. International Transport Forum. Monitoring Progress in Urban Road Safety 2022 Update. Safer City Streets. 2022. Available online: https://www.itf-oecd.org/sites/default/files/docs/monitoring-progress-urban-road-safety-2022.pdf (accessed on 24 August 2023).
  2. Mittal, V.; Lim, E. Patterns and Analysis of Traffic Accidents in New York City between 2013 and 2023. Urban Sci. 2024, 8, 166. [Google Scholar] [CrossRef]
  3. Cyclomedia. The Urban Road Safety Index: The Road Safety Perception in 32 European Cities. Edition 2024. 2024. Available online: https://www.cyclomedia.com/sites/default/files/2024-09/Urban%20Road%20Safety%20Index%202024.pdf (accessed on 25 December 2024).
  4. European Commission. Saving Lives: Boosting Car Safety in the EU. 2016. Available online: https://eur-lex.europa.eu/legal-content/EN/TXT/PDF/?uri=CELEX:52016DC0787 (accessed on 23 December 2024).
  5. EC Mobility and Transport Website. 20,400 Lives Lost in EU Road Crashes Last Year, 10 October 2024. 2024. Available online: https://transport.ec.europa.eu/news-events/news/20400-lives-lost-eu-road-crashes-last-year-2024-10-10_en (accessed on 19 December 2024).
  6. European Transport Safety Council. Safer Roads, Safer Cities: How to Improve Urban Road Safety in the EU. 2019. Available online: https://etsc.eu/wp-content/uploads/PIN-FLASH-37-FINAL.pdf (accessed on 23 December 2024).
  7. European Commission. Attitudes of Europeans Towards Urban Mobility. 2013. Available online: https://europa.eu/eurobarometer/surveys/detail/1110 (accessed on 23 December 2024).
  8. European Commission. Annual Statistical Report on Road Safety in the EU, 2024. European Road Safety Observatory. Brussels, European Commission, Directorate General for Transport. 2024. Available online: https://road-safety.transport.ec.europa.eu/document/download/b30e9840-4c22-4056-9dab-0231a98e7356_en?filename=ERSOnext_AnnualReport_20240229.pdf (accessed on 19 December 2024).
  9. NRSO NTUA Website. National Road Safety Strategic Plan, Greece 2030. 2022. Available online: https://www.nrso.ntua.gr/nrss2030/wp-content/uploads/2022/10/NationalRoadSafetyStrategicPlan.pdf (accessed on 23 December 2024).
  10. European Commission. EU Road Safety Policy Framework 2021–2030: Next Steps Towards ‘Vision Zero’. 2020. Available online: https://op.europa.eu/en/publication-detail/-/publication/d7ee4b58-4bc5-11ea-8aa5-01aa75ed71a1 (accessed on 24 August 2023).
  11. United Nations. Safe Roads for a Sustainable World. 2023. Available online: https://unece.org/sites/default/files/2023-11/2321576_E_ECE_MISC_2023_14_Rev.1_WEB.pdf (accessed on 25 December 2024).
  12. Fancello, G.; Carta, M.; Fadda, P. Road intersections ranking for road safety improvement: Comparative analysis of multi-criteria decision making methods. Transp. Policy 2019, 80, 188–196. [Google Scholar] [CrossRef]
  13. Saaty, T.L. The Analytic Hierarchy Process; McGraw-Hill: New York, NY, USA, 1980. [Google Scholar]
  14. Hwang, C.L.; Yoon, K. Multiple Attribute Decision Making; Lecture Notes in Economics and Mathematical Systems 186; Springer: New York, NY, USA, 1981; ISBN 978-3-642-48318-9. [Google Scholar]
  15. Opricovic, S.; Tzeng, G.H. Compromise solution by MCDM methods: A comparative analysis of VIKOR and TOPSIS. Eur. J. Oper.Res. 2004, 156, 445–455. [Google Scholar] [CrossRef]
  16. Roy, B. The outranking approach and the foundations of ELECTRE methods. Theory Decis. 1991, 31, 49–73. [Google Scholar] [CrossRef]
  17. Brans, J.P.; Mareschal, B.; Vincke, P. PROMETHEE: A new family of outranking methods in multicriteria analysis. Oper. Res. 1984, 84, 477–490. [Google Scholar]
  18. Anastasiadou, K. Sustainable Mobility Driven Prioritization of New Vehicle Technologies, Based on a New Decision-Aiding Methodology. Sustainability 2021, 13, 4760. [Google Scholar] [CrossRef]
  19. Macharis, C.; Bernardini, A. Reviewing the use of Multi-Criteria Decision Analysis for the evaluation of transport projects: Time for a multi-actor approach. Transp. Policy 2015, 37, 177–186. [Google Scholar] [CrossRef]
  20. Kanuganti, S.; Agarwala, R.; Dutta, B.; Bhanegaonkar, P.N.; Singh, A.P.; Sarkar, A.K. Road safety analysis using multi criteria approach: A case study in India. Transp. Res. Procedia 2017, 25, 4649–4661. [Google Scholar] [CrossRef]
  21. Beheshtinia, M.A.; Sayadinia, S.; Bargebid, H. Identifying the factors affecting road accidents and providing multi-criteria hybrid decision-making methods for ranking hazardous points. Int. J. Transp. Eng. 2021, 9, 439–458. [Google Scholar] [CrossRef]
  22. Fernandez, J.J.; Paringit, M.C.; Salvador, J.R.; Lucero, P.I.; Galupino, J.G. Driver’s Road Accident Factor Prioritization using AHP in Relation to Mastery of Traffic Signs in the City of Manila. Transp. Res. Procedia 2020, 48, 1316–1324. [Google Scholar] [CrossRef]
  23. Agarwal, P.K.; Patil, P.K.; Mehar, R. A Methodology for Ranking Road Safety Hazardous Locations Using Analytical Hierarchy Process. Procedia—Soc. Behav. Sci. 2013, 104, 1030–1037. [Google Scholar] [CrossRef]
  24. Moslem, S.; Farooq, D.; Ghorbanzadeh, O.; Blaschke, T. Application of the AHP-BWM Model for Evaluating Driver Behavior Factors Related to Road Safety: A Case Study for Budapest. Symmetry 2020, 12, 243. [Google Scholar] [CrossRef]
  25. Farooq, D.; Moslem, S. Estimating Driver Behavior Measures Related to Traffic Safety by Investigating 2-Dimensional Uncertain Linguistic Data—A Pythagorean Fuzzy Analytic Hierarchy Process Approach. Sustainability 2022, 14, 1881. [Google Scholar] [CrossRef]
  26. Chen, F.; Wang, J.; Deng, Y. Road safety risk evaluation by means of improved entropy TOPSIS–RSR. Saf. Sci. 2015, 79, 39–54. [Google Scholar] [CrossRef]
  27. Gamal, Y.A.S.; Mamdouh, E.; Wahaballa, A.M.; Elshaer, R.; Hemdan, S. Evaluation of Road Safety Hazard Factors in Egypt Using Fuzzy Analytical Hierarchy Order of Preference by Similarity to Ideal Solution Process. Sustainability 2024, 16, 9993. [Google Scholar] [CrossRef]
  28. Tian, Z.; Zhang, S. Application of Multi-attribute Group Decision-making Methods in Urban Road Traffic Safety Evaluation with Interval-valued Intuitionistic Fuzzy Information. J. Intell. Fuzzy Syst. Appl. Eng. Technol. 2021, 40, 5337–5346. [Google Scholar] [CrossRef]
  29. Zu, J.; Peng, Z.; Chen, F. Overseeing road safety progress using CV-PROMETHEE II-JSS: A case study in the EU context. Expert Syst. Appl. 2022, 195, 116623. [Google Scholar] [CrossRef]
  30. Feng, T.; Liu, Y.; Chen, C.; Liu, K.; Huang, C. Traffic Safety Evaluation of Downstream Intersections on Urban Expressways Based on Analytical Hierarchy Process–Matter-Element Method. Sustainability 2024, 16, 6887. [Google Scholar] [CrossRef]
  31. Fancello, G.; Carta, M.; Fadda, P. A Decision Support System Based on Electre III for Safety Analysis in a Suburban Road Network. Transp. Res. Procedia 2014, 3, 175–184. [Google Scholar] [CrossRef]
  32. Chen, F.; Zhu, Y.; Zu, J.; Lyu, J.; Yang, J. Appraising road safety attainment by CRITIC-ELECTRE-FCM: A policymaking support for Southeast Asia. Transp. Policy 2022, 122, 104–118. [Google Scholar] [CrossRef]
  33. European Commission. Country Profile Greece. Road Safety Observatory. Brussels, European Commission, Directorate General for Transport. 8 February 2024. 2023. Available online: https://road-safety.transport.ec.europa.eu/system/files/2024-01/erso-country-overview-2024-greece.pdf (accessed on 25 December 2024).
  34. Tsianos, A. Road Safety… It Concerns Us All. 2024. Available online: https://www.ses.gr/wp-content/uploads/2024/03/TSIANOS-THANASIS-_ODIKI-ASFALEIA_19.03.2024.pdf (accessed on 24 December 2024).
  35. Wigan Council Website. Obstructive Parking. 2025. Available online: https://www.wigan.gov.uk/Resident/Parking-Roads-Travel/Parking/Problem-parking/Obstructive-parking.aspx (accessed on 4 March 2025).
  36. Galanis, A.; Botzoris, G.N.; Eliou, N. Pedestrian road safety in relation to urban road type and traffic flow. Transp. Res. Procedia 2017, 24, 220–227. [Google Scholar] [CrossRef]
  37. Mpogas, K.; Kopelias, P.; Mitropoulos, L.; Kepaptsoglou, K. Road Safety in urban areas in Greece during economy downturn. A before–after comparison. Transp. Res. Procedia 2017, 24, 228–234. [Google Scholar] [CrossRef]
  38. Adanu, E.K.; Jones, S.; Abhay, L.; Rahman, M. Examining the who, what, and how of risky driving related crashes in residential areas. J. Urban Mobil. 2022, 2, 100024. [Google Scholar] [CrossRef]
  39. Lu, Q.L.; Qurashi, M.; Antoniou, C. Simulation-based policy analysis: The case of urban speed limits. Transp. Res. Part A Policy Pract. 2023, 175, 103754. [Google Scholar] [CrossRef]
  40. Papantoniou, P.; Papadimitriou, E.; Yannis, G. Review of driving performance parameters critical for distracted driving research. Transp. Res. Procedia 2017, 25, 1796–1805. [Google Scholar] [CrossRef]
  41. Jauregui-Fung, F.; Kenworthy, J.; Almaaroufi, S.; Pulido-Castro, N.; Pereira, S.; Golda-Pongratz, K. Anatomy of an Informal Transit City: Mobility Analysis of the Metropolitan Area of Lima. Urban Sci. 2019, 3, 67. [Google Scholar] [CrossRef]
  42. Damaskou, E.; Karagiotas, I.; Perpinia, M.; Kehagia, F. Assessment of Drivers’ Perception of Quality of Service on Urban Roundabouts. In Data Analytics: Paving the Way to Sustainable Urban Mobility. Proceedings of the 4th Conference on Sustainable Urban Mobility (CSUM2018), Skiathos Island, Greece, 24–25 May 2018; Nathanail, E., Karakikes, I., Eds.; Advances in Intelligent Systems and Computing, Volume 879; Springer: Cham, Switzerland, 2019. [Google Scholar] [CrossRef]
  43. Basbas, S.; Campisi, T.; Canale, A.; Nikiforiadis, A.; Gruden, C. Pedestrian level of service assessment in an area close to an under-construction metro line in Thessaloniki, Greece. Transp. Res. Procedia 2020, 45, 95–102. [Google Scholar] [CrossRef]
  44. Martinelli, V.; Ventura, R.; Bonera, M.; Barabino, B.; Maternini, G. Effects of urban road environment on vehicular speed. Evidence from Brescia (Italy). Transp. Res. Procedia 2022, 60, 592–599. [Google Scholar] [CrossRef]
  45. Iaveris Website. 2021. Available online: https://www.iaveris.gr/safety-first/371-ethniko-sxedio-drasis-5-enotites (accessed on 23 December 2024).
  46. Anastasiadou, K.; Gavanas, N.; Pyrgidis, C.; Pitsiava-Latinopoulou, M. Identifying and Prioritizing Sustainable Urban Mobility Barriers through a Modified Delphi-AHP Approach. Sustainability 2021, 13, 10386. [Google Scholar] [CrossRef]
  47. Papantoniou, P.; Yannis, G.; Vlachogianni, E. Are driving errors and driving performance correlated? A dual structural equation model. Adv. Transp. Stud. 2021, 53, 37–50. [Google Scholar]
  48. Sohail, A.; Cheema, M.A.; Ali, M.E.; Toosi, A.N.; Rakha, H.A. Data-driven approaches for road safety: A comprehensive systematic literature review. Saf. Sci. 2023, 158, 105949. [Google Scholar] [CrossRef]
  49. Gressai, M.; Varga, B.; Tettamanti, T.; Varga, I. Investigating the impacts of urban speed limit reduction through microscopic traffic simulation. Commun. Transp. Res. 2021, 1, 100018. [Google Scholar] [CrossRef]
  50. Gonzalo-Orden, H.; Arce, M.R.; Unamunzaga, A.L.; Aponte, N.; Pérez-Acebo, H. Why is necessary to reduce the speed in urban areas to 30 Km/h? Transp. Res. Procedia 2021, 58, 209–216. [Google Scholar] [CrossRef]
  51. Sosik-Filipiak, K.; Osypchuk, O. Identification of Solutions for Vulnerable Road Users Safety in Urban Transport Systems: Grounded Theory Research. Sustainability 2023, 15, 10568. [Google Scholar] [CrossRef]
  52. Kehagia, F.K.; Braziotis, C.; Kopelias, P. Road safety audit findings on two-lane road: Case study in Greece. Int. J. Transp. Dev. Integr. 2022, 6, 333–346. [Google Scholar] [CrossRef]
  53. Navarro, B.; Miranda-Moreno, L.; Saunier, N.; Labbe, A.; Fu, T. Do stop-signs improve the safety for all road users? A before-after study of stop-controlled intersections using video-based trajectories and surrogate measures of safety. Accid. Anal. Prev. 2022, 167, 106563. [Google Scholar] [CrossRef]
  54. Qu, X.; Xiao, X.; Zhu, X.; Wu, H.; Gong, J.; Li, D. 6Ds-HLM: Hierarchical models of road traffic crash influencing factor analysis considering the urban built environment of intersection visibility. Int. J. Appl. Earth Obs. Geoinf. 2023, 123, 103472. [Google Scholar] [CrossRef]
  55. Kathimerini Website. Thessaloniki: 66% More Road Accidents Involving Pedestrians. 2024. Available online: https://www.kathimerini.gr/society/reportaz/563216647/thessaloniki-66-perissotera-trochaia-me-thymata-pezoys/ (accessed on 25 December 2024).
  56. Distefano, N.; Leonardi, S.; Litrico, A. Analysis of Driving Behavior of Micromobility Vehicle Users at Mini-Roundabouts. Appl. Sci. 2024, 14, 11944. [Google Scholar] [CrossRef]
  57. Hamim, O.F.; Ukkusuri, S.V. Towards safer streets: A framework for unveiling pedestrians’ perceived road safety using street view imagery. Accid. Anal. Prev. 2024, 195, 107400. [Google Scholar] [CrossRef]
  58. Szagała, P.; Brzeziński, A.; Dybicz, T.; Olszewski, P.; Osińska, B. Problems with Implementation of Sustainable Urban Mobility in Selected Polish Cities. Sustainability 2024, 16, 11003. [Google Scholar] [CrossRef]
  59. Beria, P.; Maltese, I.; Mariotti, I. Multi-criteria versus Cost Benefit Analysis: A comparative perspective in the assessment of sustainable mobility. Eur. Transp. Res. Rev. 2012, 4, 137–152. [Google Scholar] [CrossRef]
  60. van Wee, B. How suitable is CBA for the ex-ante evaluation of transport projects and policies? A discussion from the perspective of ethics. Transp. Policy 2012, 19, 1–7. [Google Scholar] [CrossRef]
  61. Damart, S.; Roy, B. The uses of cost–benefit analysis in public transportation decision-making in France. Transp. Policy 2009, 16, 200–212. [Google Scholar] [CrossRef]
  62. Browne, D.; Ryan, L. Comparative analysis of evaluation techniques for transport policies. Environ. Impact Assess. Rev. 2011, 31, 226–233. [Google Scholar] [CrossRef]
  63. Zak, J.; Kruszynski, M. Application of AHP and ELECTRE III/IV methods to multiple level, multiple criteria evaluation of urban transportation projects. Transp. Res. Procedia 2015, 10, 820–830. [Google Scholar] [CrossRef]
  64. Anastasiadou, K.; Gavanas, N. Enhancing urban public space through appropriate sustainable mobility policies. A multi-criteria analysis approach. Land Use Policy 2023, 132, 106765. [Google Scholar] [CrossRef]
  65. Basbas, S.; Makridakis, C.M. A Review of the Contribution of Multi-Criteria Analysis to the Evaluation Process of Transportation Projects. Int. J. Sustain. Dev. Plan. 2007, 2, 387–407. [Google Scholar] [CrossRef]
  66. Tsamboulas, D.A. A tool for prioritizing multinational transport infrastructure investments. Transp. Policy 2007, 14, 11–26. [Google Scholar] [CrossRef]
  67. Turcksin, L.; Bernardini, A.; Macharis, C. A combined AHP-PROMETHEE approach for selecting the most appropriate policy scenario to stimulate a clean vehicle fleet. Procedia Soc. Behav. Sci. 2011, 20, 954–965. [Google Scholar]
  68. Shih, H.S.; Shyur, H.-J.; Lee, S.E. An extension of TOPSIS for group decision making. Math. Comput. Model. 2007, 45, 801–813. [Google Scholar]
  69. Curiel-Esparza, J.; Mazario-Diez, J.L.; Canto-Perello, J.; Martin-Utrillas, M. Prioritization by consensus of enhancements for sustainable mobility in urban areas. Environ. Sci. Policy 2016, 55, 248–257. [Google Scholar]
  70. Esmaeilpoorarabi, N.; Yigitcanlar, T.; Guaralda, M.; Kamruzzaman, M. Evaluating place quality in innovation districts: A Delphic hierarchy process approach. Land Use Policy 2018, 76, 471–486. [Google Scholar] [CrossRef]
  71. de Loë, R.C.; Melnychuk, N.; Murray, D.; Plummer, R. Advancing the State of Policy Delphi Practice: A Systematic Review Evaluating Methodological Evolution, Innovation, and Opportunities. Technol. Forecast. Soc. Change 2016, 104, 78–88. [Google Scholar]
  72. EC Mobility and TRANSPORT Website. 2024. Available online: https://transport.ec.europa.eu/background/road-safety-statistics-2023_en (accessed on 19 December 2024).
  73. Hellenic Statistical Authority Website. 2024. Available online: https://www.statistics.gr/documents/20181/37ca6fd3-5324-32af-bcf8-7a914f8f2ac8 (accessed on 19 December 2024).
  74. Athens Transport Website. 2024. Available online: https://www.athenstransport.com/2024/03/troxaia-atyximata-2023/ (accessed on 19 December 2024).
  75. Folla, K. The Greek National Road Safety Plan 2021–2030. 2023. Available online: https://unece.org/sites/default/files/2024-01/SIII_Greek%20RSS_KF.pdf (accessed on 23 December 2024).
  76. Forman, E.; Peniwati, K. Aggregating individual judgments and priorities with the Analytic Hierarchy Process. Eur. J. Oper. Res. 1998, 108, 165–169. [Google Scholar]
  77. European Commission. Road safety thematic report – Personal Mobility Devices. European Road Safety Observatory. Brussels, European Commission, Directorate General for Transport. 2024. Available online: https://road-safety.transport.ec.europa.eu/document/download/6ed38dab-eb7c-42e0-a4a7-06bdd20677ec_en?filename=ERSO-TR-PersonalMobilityDevices-20241217.pdf (accessed on 7 January 2025).
  78. Distefano, N.; Leonardi, S. Evaluation of the Effectiveness of Traffic Calming Measures by SPEIR Methodology: Framework and Case Studies. Sustainability 2022, 14, 7325. [Google Scholar] [CrossRef]
  79. Kehagia, F.; Anagnostopoulos, A. Evaluating roundabouts safety performance based on vehicle trajectory analysis through UAVs. In Proceedings of the FERSI Conference, Hague, The Netherlands, 6–7 October 2022; Available online: https://fersi.org/wp-content/uploads/2022/10/Fotini-Kehagia-Apostolos-Anagnostopoulos.pdf (accessed on 23 December 2024).
  80. Fan, M.; Hedayati Marzbali, M.; Abdullah, A.; Maghsoodi Tilaki, M.J. Using a Space Syntax Approach to Enhance Pedestrians’ Accessibility and Safety in the Historic City of George Town, Penang. Urban Sci. 2024, 8, 6. [Google Scholar] [CrossRef]
  81. Tumminello, M.L.; Macioszek, E.; Granà, A.; Giuffrè, T. Evaluating Traffic-Calming-Based Urban Road Design Solutions Featuring Cooperative Driving Technologies in Energy Efficiency Transition for Smart Cities. Energies 2023, 16, 7325. [Google Scholar] [CrossRef]
  82. Vatavali, F.; Gareiou, Z.; Kehagia, F.; Zervas, E. Impact of COVID-19 on Urban Everyday Life in Greece. Perceptions, Experiences and Practices of the Active Population. Sustainability 2020, 12, 9410. [Google Scholar] [CrossRef]
  83. Bokolo, A.J. Inclusive and Safe Mobility Needs of Senior Citizens: Implications for Age-Friendly Cities and Communities. Urban Sci. 2023, 7, 103. [Google Scholar] [CrossRef]
  84. Al-Marafi, M.N.; Alhadidi, T.I.; Alhawamdeh, M.; Jaber, A. Enhancing Road Safety Strategies through Applying Combined Treatments for Different Crash Severity. Urban Sci. 2024, 8, 109. [Google Scholar] [CrossRef]
  85. Richmond, S.A.; Buchan, C.; Pitt, T.M.; Medeiros, A.; Pike, I.; Hagel, B.E.; Rothman, L.; Macarthur, C.; Macpherson, A.K. The effectiveness of built environment interventions embedded in road safety policies in urban municipalities in Canada: An environmental scan and scoping review. J. Transp. Health 2022, 27, 101494. [Google Scholar] [CrossRef]
  86. Han, S.; Kim, H.W.; Leigh, J.-H. Improvement of road safety management systems of local governments in Korea after evaluating related indicators. Accid. Anal. Prev. 2023, 193, 107325. [Google Scholar] [CrossRef] [PubMed]
  87. Swami, M.; Pathak, C.; Swami, S.; Jeihani, M. Promoting Sustainable Mobility: A Walkability Analysis for School Zone Safety. Sustainability 2024, 16, 9118. [Google Scholar] [CrossRef]
  88. Tomoda, M.; Uno, H.; Hashimoto, S.; Yoshiki, S.; Ujihara, T. Analysis on the impact of traffic safety measures on children’s gaze behavior and their safety awareness at residential road intersections in Japan. Saf. Sci. 2022, 150, 105706. [Google Scholar] [CrossRef]
  89. Parallaximag Website. Greece Is Bringing Up the Rear in Terms of Road Safety, Despite the High Fines, According to Relevant Research. 2025. Available online: https://parallaximag.gr/epikairotita/greece/oyragos-stin-odiki-asfaleia-i-ellada-para-ta-ypsila-prostima-symfona-me-nea-ereyna (accessed on 4 March 2025).
  90. Diamond, I.R.; Grant, R.C.; Feldman, B.M.; Pencharz, P.B.; Ling, S.C.; Moore, A.M.; Wales, P.W. Defining consensus: A systematic review recommends methodologic criteria for reporting of Delphi studies. J. Clin. Epidemiol. 2014, 67, 401–409. [Google Scholar] [PubMed]
Figure 1. AHP hierarchy structure of a decision problem related to road safety improvement, with 10 factors (in place of criteria) and 4 alternatives.
Urbansci 09 00093 g001
Figure 2. Road fatalities per million inhabitants by EU country (2023), based on data from [72].
Urbansci 09 00093 g002
Figure 3. Fatalities by road type and country (last available year), based on data from [8].
Urbansci 09 00093 g003
Table 1. Inventory of the most common factors leading to road accidents in urban areas.
CategoryFactors
Financial/economic (factors related to budget constraints)
  • Insufficient funding for the development of road safety plans [34]
  • Insufficient funding for the implementation of measures and policies for road safety improvement [34]
  • Insufficient motivation (e.g., subsidies) and/or restricted citizen affordability for the replacement of old vehicles with new ones [2,33,34,50]
  • Insufficient motivation (e.g., subsidies) and/or restricted citizen affordability for vehicle maintenance [34]
  • Failure to carry out systematic and adequate controls in urban road networks for the efficient traffic and parking management and for the detection of any infringement due to limited resources (financial, technological, human) (mainly regarded as financial/economic) [34]
Technological (factors related to infrastructure design, management, maintenance, technological equipment, etc.)
  • Lack or inappropriate design of infrastructure for pedestrians, bicycles, scooters, etc., creating a higher risk environment for them, especially for people with disabilities or reduced mobility (e.g., elderly, people with children, prams, etc.) [2,9,33,34,36,37,41,43,50,51,55,56,57,58]
  • Lack or ineffective design and management of public transport infrastructure and networks, as well as insufficient maintenance, resulting in malfunctions of public transport means when in motion [33,41,51]
  • Inadequate or inappropriate road infrastructure maintenance (potholes, cracked pavement, invisible signage because of untrimmed trees, signaling malfunctions, vandalized signs, insufficient lighting, faded pedestrian crossings, etc.) [9,12,36,42,48,52,54]
Organizational (factors related to organization and bureaucracy)
  • High complexity of bureaucratic processes and significant subsequent delays in planning and implementing measures and policies for road safety improvement [34,46]
  • Lack of cooperation and coordination between local, regional, and national authorities (either at the same or across different administrative levels) regarding decision-making [34,46,51]
  • Lack of constructive dialogue and participatory processes toward compromising different stakeholders’ interests [34,46]
  • Failure to educate and inform citizens about road safety (even starting from the kindergarten) [42,45,50]
Knowledge-based (factors related to employees’ expertise, data availability, etc.)
  • Lack of qualified and experienced staff in public sector authorities and organizations, as well as failure to capitalize on external contractors with expertise in road safety sector [46]
  • Low maturity level of existing proposals, studies, etc. [46]
Social and cultural (factors related to behavioral aspects, education and mentality)
  • Illegal/inappropriate behavior of certain road network users toward others (e.g., illegal parking at junctions, on sidewalks, pedestrian areas, etc.), hindering both pedestrian and vehicle movement, as well as the visibility at junctions (for example, in Greek urban areas, there are illegally parked vehicles at every junction, despite the relevant prohibition according to the Road Traffic Code) [34,35,42,47,51,55]
  • Inappropriate driving behavior of passenger and freight vehicle users, especially characterized by high speed [33,34,38,39,44,47,48,49,50,52,53,55,57]
  • Frequent distraction during driving because of extensive mobile phone use [33,34,40,47,57]
  • Inappropriate driving behavior of cyclists, motorcyclists and electric scooter users [33,38,48,51,57]
  • Inappropriate pedestrian behavior (street crossing away from pedestrian crossings, when the red light for pedestrians is on, etc.) [36,48,51,55]
  • Difficulty (e.g., due to indifference) for citizens and other stakeholders to participate in relevant processes and public consultation (e.g., through platforms, fora etc.) [34,46]
Legal and institutional (factors related to administration, rules, law, etc.)
  • Laxity of imposed penalties for road traffic offences, especially in the case of systematic reoccurrence [45]
  • Insufficient or unreliable procedure of driving license renewal procedure by elderly (without any substantial examination of their ability to drive)
  • Cancellation of implemented fines for violations of road traffic code, after interventions of, e.g., politicians, resulting in impunity and, therefore, failure of the violators to comply with road traffic code in the future
  • Insufficient regulatory and legal framework regarding the compulsory provision of parking places in new buildings, “reinforcing” illegal parking, thus reducing visibility at junctions (because of illegal parked vehicles) and further undermining road safety [42,46]
  • Inadequate legal framework for micromobility (e.g., electric scooters) and the co-existence with other transport modes in urban road networks [33,56]
  • Ineffective logistics management (first and last mile), negatively affecting traffic conditions and thus road safety [6,46,51]
Political (factors related to politics)
  • “Fragmented” and almost arbitrary decision-making (by the authorities in charge) regarding road safety improvement, without adopting a scientific, knowledge-based decision-aiding methodology that integrates all parameters, for both planning and implementation of effective measures and policies [46]
  • Inadequate time for local authorities (e.g., mayors) to implement road safety plans due to possible short term of office (because of possible shift, depending on the elections result) [46]
Temporary factors (factors of temporary nature)
  • Negative impacts on mobility conditions during the construction phase of transport projects (e.g., metro or flyover in Thessaloniki) [43,46]
Particularities of the study area (factors related to special characteristics of the study area)
  • High number of stray dogs circulating at urban road networks, causing road accidents
  • Illegal “work” (illegal street car window cleaners) or beggary in areas with traffic lights, even at junctions with high traffic volume
  • Driver fatigue (phycological and/or physical) in large urban areas, because of traffic congestion and traffic jams [2,42,47,48,57]
Table 2. The most important factors leading to road accidents in the urban area of Thessaloniki, as identified through the Delphi process.
FactorsDelphi Selection Percentage (%)
F1: Illegal/inappropriate behavior of certain road network users toward others (e.g., illegal parking at junctions, on sidewalks, pedestrian areas, etc.), hindering both pedestrian and vehicle movement, as well as the visibility at junctions (in Greek urban areas, there are illegally parked vehicles at every junction, despite the relevant prohibition according to the Road Traffic Code)86.7%
F2: “Fragmented” and almost arbitrary decision-making (by the authorities in charge) regarding road safety improvement, without adopting a scientific, knowledge-based decision-aiding methodology that integrates all the parameters, for both planning and implementation of effective measures and policies80%
F3: Lack or inappropriate design of infrastructure for pedestrians, bicycles, scooters, etc., creating a dangerous environment for them, especially for people with disabilities or reduced mobility (e.g., elderly, people with children, prams, etc.)80%
F4: Inappropriate driving behavior of passenger and freight vehicle users, especially characterized by high speed73.3%
F5: Lack of cooperation and coordination between local, regional, and national authorities (either at the same or across different administrative levels) regarding decision-making66.7
F6: Failure to educate and inform citizens about road safety (even starting from the kindergarten) 66.7
F7: Inappropriate driving behavior of cyclists, motorcyclists and electric scooter users66.7
F8: Inadequate or inappropriate road infrastructure maintenance (potholes, cracked pavement, invisible signage because of untrimmed trees, signaling malfunctions, vandalized signs, insufficient lighting, faded pedestrian crossings, etc.)66.7
F9: Laxity of imposed penalties for road traffic offences, especially in the case of systematic reoccurrence60%
F10: Failure to carry out systematic and adequate controls in urban road networks for the efficient traffic and parking management and for the detection of any infringement due to limited resources (financial, technological, human)53.3%
Table 3. Saaty’s 9-point scale in terms of the importance of the compared elements.
Intensity of ImportanceDefinition
1Equivalent importance of the two factors
3Moderate importance of the one over the other
5Strong importance of the one over the other
7Very strong importance of the one over the other
9Extreme importance of the one over the other
2, 4, 6, 8Intermediate values between the aforementioned ones
Table 4. Pair-wise comparisons of the factors.
The Factor on the Left Is More Important than the One on the Right (Select the Intensity of Relative Importance)Equivalent Importance of the Two FactorsThe Factor on the Right Is More Important than the One on the Left (Select the Intensity of Relative Importance)
F198765432123456789F2
Table 5. Experts’ judgments and calculated geometric mean values of the pair-wise comparisons of the factors.
Factors/
Experts
E1E2E3E4E5E6E7E8E9E10Geometric
Mean
F1 vs. F21/51/771/91/821/5941/30.6978
F1 vs. F31/21/441/71/723711/30.8503
F1 vs. F41/51/31/311/611/41/7510.5433
F1 vs. F51/51/381/7321/4781/31.0652
F1 vs. F61/81371/761/471/410.9987
F1 vs. F71/311/31521/91/9110.6995
F1 vs. F81551721/5651/71.6085
F1 vs. F91/71/8811/711991/30.9515
F1 vs. F101/81/81/611/811/991/51/70.3808
F2 vs. F3431/322171/21/311.2762
F2 vs. F4141/7831/221/91/231.0713
F2 vs. F514227121/2411.6632
F2 vs. F61/461/392421/21/531.2918
F2 vs. F7361/68811/31/91/331.1776
F2 vs. F8491/289111/331/41.6189
F2 vs. F91/31/31821/251511.2949
F2 vs. F101/41/31/9811/21/411/91/40.5022
F3 vs. F41/421/6521/21/51/8430.8409
F3 vs. F51/3231711/511/710.9265
F3 vs. F61/761/29241/511/431.1362
F3 vs. F71/241/55811/91/9130.9573
F3 vs. F82825911/61/21/41/41.1828
F3 vs. F91/71/43511/21/42710.9946
F3 vs. F101/81/41/951/21/21/921/51/40.4368
F4 vs. F51151/51/81/21931/30.9532
F4 vs. F61/33351/25191/711.3812
F4 vs. F7431181/241/3411.5874
F4 vs. F8665191/21/2811/61.6893
F4 vs. F91/21/6411/214931/31.1610
F4 vs. F101/31/61/511/311/591/91/60.4724
F5 vs. F61/431/391/84111/830.9306
F5 vs. F7331/651/211/41/91/530.7937
F5 vs. F8571/25411/21/21/31/41.1801
F5 vs. F91/31/5151/81/242210.9125
F5 vs. F101/41/51/951/91/21/521/91/40.4007
F6 vs. F7611/31/581/41/41/9410.8173
F6 vs. F88521/591/41/21/271/61.2165
F6 vs. F921/831/511/73291/30.9237
F6 vs. F1011/81/81/51/21/71/521/21/60.3738
F7 vs. F83541314741/61.9673
F7 vs. F91/41/8611/81/26981/31.0446
F7 vs. F101/51/81/411/91/2191/61/60.4587
F8 vs. F91/71/9211/81/24231/40.6913
F8 vs. F101/81/91/911/91/21/421/910.3602
F9 vs. F101/311/811/211/911/91/40.4474
Table 6. Pair-wise comparison matrix for the factors.
F1F2F3F4F5F6F7F8F9F10
F11.00000.69780.85030.54331.06520.99870.69951.60850.95150.3808
F21.43301.00001.27621.07131.66321.29181.17761.61891.29490.5022
F31.17600.78361.00000.84090.92651.13620.95731.18280.99460.4368
F41.84060.93341.18921.00000.95321.38121.58741.68931.16100.4724
F50.93880.60131.07931.04911.00000.93060.79371.18010.91250.4007
F61.00130.77410.88010.72401.07461.00000.81731.21650.92370.3738
F71.42960.84921.04460.63001.25991.22351.00001.96731.04460.4587
F80.62170.61770.84540.59200.84740.82210.50831.00000.69130.3602
F91.05090.77231.00540.86131.09591.08260.95731.44661.00000.4474
F102.62601.99132.28942.11692.49552.67532.18002.77662.23521.0000
Table 7. Normalized pair-wise comparison matrix, priority vector and consistency control (CR < 0.10) for the factors.
F1F2F3F4F5F6F7F8F9F10Priority
Vector (W)
F10.13530.14570.13550.10390.15940.14820.11590.18930.15250.14840.1434
F20.19390.20880.20340.20490.24890.19170.19520.19050.20760.19570.2041
F30.15910.16360.15940.16080.13860.16860.15870.13920.15940.17020.1578
F40.24910.19490.18950.19130.14260.20500.26310.19880.18610.18400.2004
F50.12700.12550.17200.20060.14960.13810.13160.13890.14630.15610.1486
F60.13550.16160.14030.13850.16080.14840.13550.14320.14810.14560.1457
F70.19350.17730.16650.12050.18850.18160.16580.23160.16740.17870.1771
F80.08410.12900.13470.11320.12680.12200.08430.11770.11080.14030.1163
F90.14220.16120.16020.16470.16400.16070.15870.17030.16030.17430.1617
F100.35540.41570.36480.40490.37340.39700.36140.32680.35830.38960.3747
λmax = 10.0772, CI = 0.0086, CR = 0.0058 < 0.10 ✓
Table 8. Ranking of the factors undermining road safety in the urban area of Thessaloniki, in descending order, in terms of the relevant importance.
FactorsWeight
Failure to carry out systematic and adequate controls in urban road networks for the efficient traffic and parking management and for the detection of any infringement, due to limited resources—F100.3747
“Fragmented” and almost arbitrary decision-making (by the authorities in charge) for road safety improvement, without adopting a scientific, knowledge-based decision-aiding methodology that integrates all the parameters, for both planning and implementation of effective measures and policies—F20.2041
Inappropriate driving behavior of passenger and freight vehicle users, especially characterized by high speed—F40.2004
Inappropriate driving behavior of cyclists, motorcyclists and electric scooter users—F70.1771
Laxity of imposed penalties for road traffic offences, especially in the case of systematic reoccurrence—F90.1617
Lack or inappropriate design of infrastructure for pedestrians, bicycles, scooters, etc., creating a higher risk environment for them, especially for people with disabilities or reduced mobility (e.g., elderly, people with children, prams, etc.)—F30.1578
Lack of cooperation and coordination between local, regional, and national authorities (either at the same or across different administrative levels) regarding decision-making—F50.1486
Failure to educate and inform citizens about road safety (even starting from the kindergarten)—F60.1457
Illegal/inappropriate behavior of certain road network users toward others (e.g., illegal parking at junctions, on sidewalks, pedestrian areas, etc.), hindering both pedestrian and vehicle movement, as well as the visibility at junctions (in Greek urban areas, there are illegally parked vehicles at every junction, despite the relevant prohibition according to the Road Traffic Code)—F10.1434
Inadequate or inappropriate road infrastructure maintenance (potholes, cracked pavement, invisible signage because of untrimmed trees, signaling malfunctions, vandalized signs, insufficient lighting, faded pedestrian crossings, etc.)—F80.1163
Table 9. Alternatives (sets of measures and policies) for the improvement of road safety in urban areas (adapted to the urban area of Thessaloniki).
Alternatives (Sets of Measures and Policies)Measures and Policies
A1: Ensuring the availability of the necessary resources for systematic controls in urban road networks (controls by means of both physical presence of policemen and technological equipment, such as cameras)
  • Installation of cameras for road traffic offences, and electronic issuance of fines. The installation will be realized, as a priority, in areas with schools, parks, sports centers, etc. The obtained money will be invested in the installation of cameras in other areas of the urban road network, until it is fully covered. At the same time, there should be no possibility of illegally deleting the imposed fines, because of, e.g., politicians’ interventions, due to the automatic registration in General Secretariat for Information Systems and Digital Governance [33,34,45,58,85]
  • Recruitment of policemen for the execution of more systematic controls for road traffic offences in urban road networks, with a physical presence
A2: Appropriate planning, design and management of infrastructure on behalf of each municipality of the urban area under study (speed humps, flexible traffic posts at junctions, reduced speed limit, infrastructure maintenance, prevention of illegal parking, etc.)
  • Compulsory installation of flexible traffic posts at junctions, so that the visibility is not hindered because of illegally parked vehicles
  • Compulsory installation of speed humps in areas, with schools, parks, sports centers, etc., given the relevant technical preconditions are met [6,44,85]
  • Compulsory definition (within a specified time limit) of zones with reduced speed limit from 50 km/h to 30 km/h. Especially in areas with schools, parks and sports centers, the speed limit should be reduced to 20 km/h [6,9,34,39,45,49,50,58,78,81]
  • Improvement of road signs (vertical road signs and road marking) in urban road networks, with thorough the study of each area, as well as systematic and improved maintenance of road infrastructure, with immediate restoration of potholes, pavement cracks, replacement of destroyed road signs, trimming of trees, renewal of pedestrian crossings color etc. [9,50,51,54,79,83,84]
  • Effective management of traffic congestion in large cities through appropriate decision-making, based on scientific decision-aiding methods, with strict prohibition, in practice, of illegal moving and parking (junctions, sidewalks, etc.), with the recruitment of a sufficient number of municipal policemen, etc. This way, driver fatigue (which contributes to a high number of road accidents), as well as visibility hindrance at junctions because of illegal parking, will be further reduced [80]
  • Appropriate design and planning of infrastructure for pedestrians, cyclists and electric scooter users, with adequate green light lasting for pedestrians, creation and/or widening of sidewalks, etc. [6,50,51,56,58,80,82,83]
  • Mandatory recruitment of transport planners and/or decision support analysts by municipal authorities, based on scientific expertise and knowledge.
  • Integration of road safety into sustainable urban mobility plans (SUMPs), with mandatory participation of experts in the field of road safety in the preparation and implementation phases of SUMPs [6,45]
A3: Improvement of the regulatory and legal framework (factors related to the process of educating trainee drivers, acquiring and renewing a driving license, facilitating the cooperation between different authorities, as well as to the penalties imposed to those violating the Road Traffic Code, etc.)
  • Stricter penalties for road traffic offences and further implementation of education measures, so that society can be efficiently protected (e.g., compulsory education of appropriate driving behavior, examination by a psychiatrist in case of repeated and systematic dangerous driving, withdrawal of the driving license and of the registration certificate of the vehicle for a longer time (compared to present application) and/or until the education is completed, etc.) [50]
  • Inclusion of bicycles and electric scooters in the Road Traffic Code in a more efficient manner. Mandatory education for users of bicycles and electric scooters, mandatory use of protective equipment, registration plates and insurance for bicycles and electric scooters, and strict penalties for road traffic offences (violation of red light, illegal moving on sidewalks, driving the wrong way on a one-say street, etc.) [77]
  • Stricter driving license renewal process for the elderly
  • Legal and regulatory provisions to facilitate the coordination and cooperation between local, regional and national authorities [6,81,86]
A4: Taking initiatives related to education, awareness-raising and social responsibility (road safety lessons at school, motivation of private sector companies to contribute to road safety improvement, involvement of media, etc.)
  • Integration of road safety into the national school curriculum and involvement of parents in relevant education programs (from kindergarten to senior high school) [45,88]
  • Encouragement of private sector companies (e.g., through tax deductions and allowances) toward improving road safety in urban areas (e.g., studies, release and installation of relevant equipment, such as cameras, restoration of potholes etc. in form of donations)
  • Awareness-raising initiatives, in cooperation with the media (e.g., information campaigns free of charge, mandatory reference to the road accidents of the last 24 h, on an everyday basis, after the news, etc.) [50,77,87]
Table 10. Saaty’s 9-point scale, in terms of the effectiveness, for the compared alternatives.
Intensity of EffectivenessDefinition
1Indifference of effectiveness
3Moderate effectiveness relation
5Strong effectiveness relation
7Very strong effectiveness relation
9Absolute effectiveness relation
2, 4, 6, 8Intermediate values between the two adjacent judgments
Table 11. Pair-wise comparison of the alternatives, with regard to each factor (indicative part).
With Regard to Factor «F1»
The Alternative on the Left Is More Effective than the One on the Right (Select the Degree of Relative Effectiveness)Indifference of EffectivenessThe Alternative on the Right Is More Effective than the One on the Left (Select the Degree of Relative Effectiveness)
A198765432123456789A2
A198765432123456789A3
A198765432123456789A4
A298765432123456789A3
A298765432123456789A4
A398765432123456789A4
Table 12. Normalized pair-wise comparison matrix of the alternatives, priority vector and consistency control, with regard to each factor.
F1A1A2A3A4Priority
Vector (W)
A10.05880.08280.03450.04260.0547
A20.41180.57930.55170.63830.5453
A30.23530.14480.13790.10640.1561
A40.29410.19310.27590.21280.2440
λmax = 4.1488, CI = 0.0496, CR = 0.0551 < 0.10 ✓
F2A1A2A3A4Priority
Vector (W)
A10.04550.06760.03080.02440.0420
A20.40910.60810.64620.60980.5683
A30.31820.20270.21540.24390.2450
A40.22730.12160.10770.12200.1446
λmax = 4.1832, CI = 0.0611, CR = 0.0679 < 0.10 ✓
F3A1A2A3A4Priority
Vector (W)
A10.05880.07480.03670.03700.0518
A20.52940.67290.73390.59260.6322
A30.29410.16820.18350.29630.2355
A40.11760.08410.04590.07410.0804
λmax = 4.1901, CI = 0.0634, CR = 0.0704 < 0.10 ✓
F4A1A2A3A4Priority
Vector (W)
A10.68130.50000.74070.67740.6499
A20.08520.06250.03700.03230.0542
A30.13630.25000.14810.19350.1820
A40.09730.18750.07410.09680.1139
λmax = 4.2273, CI = 0.0758, CR = 0.0842 < 0.10 ✓
F5A1A2A3A4Priority
Vector (W)
A10.05880.07520.03700.03570.0517
A20.52940.67670.74070.64290.6474
A30.23530.13530.14810.21430.1833
A40.17650.11280.07410.10710.1176
λmax = 4.1703, CI = 0.0568, CR = 0.0631 < 0.10 ✓
F6A1A2A3A4Priority
Vector (W)
A10.08330.08330.08330.08330.0833
A20.08330.08330.08330.08330.0833
A30.08330.08330.08330.08330.0833
A40.75000.75000.75000.75000.7500
λmax = 4.0000, CI = 0.0000, CR = 0.0000 < 0.10 ✓
F7A1A2A3A4Priority
Vector (W)
A10.52830.43750.56600.48000.5030
A20.07550.06250.05660.04000.0586
A30.26420.31250.28300.36000.3049
A40.13210.18750.09430.12000.1335
λmax = 4.0800, CI = 0.0267, CR = 0.0296 < 0.10 ✓
F8A1A2A3A4Priority
Vector (W)
A10.07690.08250.07690.05000.0716
A20.69230.74230.69230.80000.7317
A30.07690.08250.07690.05000.0716
A40.15380.09280.15380.10000.1251
λmax = 4.0981, CI = 0.0327, CR = 0.0363 < 0.10 ✓
F9A1A2A3A4Priority
Vector (W)
A10.10000.10000.10000.10000.1000
A20.10000.10000.10000.10000.1000
A30.70000.70000.70000.70000.7000
A40.10000.10000.10000.10000.1000
λmax = 4.0000, CI = 0.0000, CR = 0.0000 < 0.10 ✓
F10A1A2A3A4Priority
Vector (W)
A10.72000.80000.60000.60000.6800
A20.12000.13330.26670.26670.1967
A30.08000.03330.06670.06670.0617
A40.08000.03330.06670.06670.0617
λmax = 4.2694, CI = 0.0898, CR = 0.0998 < 0.10 ✓
Table 13. Decision matrix for the application of TOPSIS for the overall ranking of the alternatives.
F1F2F3F4F5F6F7F8F9F10
A10.05470.04200.05180.64990.05170.08330.50300.07160.10000.6800
A20.54530.56830.63220.05420.64740.08330.05860.73170.10000.1967
A30.15610.24500.23550.18200.18330.08330.30490.07160.70000.0617
A40.24400.14460.08040.11390.11760.75000.13350.12510.10000.0617
Table 14. Weighted normalized decision matrix for TOPSIS.
F1F2F3F4F5F6F7F8F9F10
A10.00780.00860.00820.13030.00770.01210.08910.00830.01620.2548
A20.07820.11600.09970.01090.09620.01210.01040.08510.01620.0737
A30.02240.05000.03720.03650.02720.01210.05400.00830.11320.0231
A40.03500.02950.01270.02280.01750.10930.02360.01460.01620.0231
Table 15. Si+, Si and ci+ values and overall ranking of the alternatives.
Si+Sici+Ranking
A10.23970.27230.53181
A20.26850.20290.43042
A30.30850.12290.28503
A40.32710.10530.24354
Table 16. Ranking of the four sets of alternatives (consisting of the measures and policies defined in Table 9).
AlternativesRanking
Ensuring the availability of the necessary resources for systematic controls in urban road networks (controls by means of both physical presence of policemen and technological equipment, such as cameras)1
Appropriate planning, design and management of infrastructure on behalf of each municipality of the urban area under study (speed humps, flexible traffic posts at junctions, reduced speed limit, infrastructure maintenance, prevention of illegal parking, etc.)2
Improvement of the regulatory and legal framework (factors related to the process of educating trainee drivers, acquiring and renewing a driving license, facilitating the cooperation between different authorities, as well as to the penalties imposed to those violating the Road Traffic Code, etc.)3
Taking initiatives related to education, awareness-raising and social responsibility (road safety lessons at school, motivation of private sector companies to contribute to road safety improvement, involvement of media, etc.)4
Disclaimer/Publisher’s Note: The statements, opinions and data contained in all publications are solely those of the individual author(s) and contributor(s) and not of MDPI and/or the editor(s). MDPI and/or the editor(s) disclaim responsibility for any injury to people or property resulting from any ideas, methods, instructions or products referred to in the content.

