Article

Validating Pedestrian Infrastructure Data: How Well Do Street-View Imagery Audits Compare to Government Field Data?

1
Department of Civil, Materials, and Environmental Engineering, University of Illinois Chicago, Chicago, IL 60607, USA
2
College of Applied Health Sciences, University of Illinois Chicago, Chicago, IL 60608, USA
3
Paul G. Allen School of Computer Science & Engineering, University of Washington, Seattle, WA 98195, USA
*
Authors to whom correspondence should be addressed.
Urban Sci. 2025, 9(4), 130; https://doi.org/10.3390/urbansci9040130
Submission received: 4 February 2025 / Revised: 4 April 2025 / Accepted: 14 April 2025 / Published: 17 April 2025

Abstract

:
Data on pedestrian infrastructure is essential for improving the mobility environment and for planning efficiency. Although governmental agencies are responsible for capturing data on pedestrian infrastructure mostly by field audits, most have not completed such audits. In recent years, virtual auditing based on street view imagery (SVI), specifically through geo-crowdsourcing platforms, offers a more inclusive approach to pedestrian movement planning, but concerns about the quality and reliability of opensource geospatial data pose barriers to use by governments. Limited research has compared opensource data in relation to traditional government approaches. In this study, we compare pedestrian infrastructure data from an opensource virtual sidewalk audit platform (Project Sidewalk) with government data. We focus on neighborhoods with diverse walkability and income levels in the city of Seattle, Washington and in DuPage County, Illinois. Our analysis shows that Project Sidewalk data can be a reliable alternative to government data for most pedestrian infrastructure features. The agreement for different features ranges from 75% for pedestrian signals to complete agreement (100%) for missing sidewalks. However, variations in measuring the severity of barriers challenges dataset comparisons.

1. Introduction

Pedestrian infrastructure is the initial context of how people move around. Low-quality infrastructure leads to higher pedestrian crash rates [1,2]. Especially for people with disabilities (PwDs), pedestrian infrastructure provides critical access to employment and education opportunities, public transportation, and community resources [3,4,5,6,7]. While pedestrian infrastructure can support greater mobility and improved life quality for PwDs, inadequate, low-quality infrastructure can make getting around difficult, dangerous, or even impossible [8,9,10,11]. PwDs face significant barriers to mobility due to inadequate pedestrian infrastructure such as broken sidewalks, missing curb cuts (or curb ramps), and crossing signals with no sound. These barriers are a persistent challenge that limits PwDs’ access to transportation [8,10], and they may expose people to unsafe situations (e.g., having to wheel their wheelchair in the street) [9,11]. Built environment barriers not only limit PwDs’ mobility but also impede their daily activities [6,7,12] and community participation and can lead to social and economic exclusion and isolation [3,5,13,14].
In the United States, requirements for removing barriers under the Americans with Disabilities Act (ADA) have prompted cities to improve pedestrian infrastructure accessibility. Still, these efforts are hindered by the lack of data on the location and condition of pedestrian infrastructure [6]. This lack of data hinders planning, prioritization, and transparency. Despite the ADA’s mandate for inclusive and universal accessibility for all, cities continue to struggle with pedestrian infrastructure barriers over 33 years later, often initiating significant sidewalk renovations only in response to civil rights litigation [15]. Indeed, a recent study by Eisenberg et al. [3] found that only 13 percent of 401 government entities had published ADA transition plans, with just 7 meeting minimum ADA criteria. That study also found that, on average, 65% of curb ramps and 50% of sidewalks were inaccessible. Jackson [16] pointed out that the inaccessible modern built environment results from inadequate planning practices. Existing methods for documenting access fall short for disabled individuals due to the lack of data on the accessibility and quality of pedestrian infrastructure [6,17].
There are limited available data on accessibility in most U.S. cities [18], and this data gap prevents disabled travelers’ needs from being considered as a part of U.S. transportation planning [6]. The responsibility for gathering data on urban accessibility is often placed on governments. However, a recent study by Deitz et al. [18] examining 178 U.S. cities found only about 60% of these cities had open data portals, and information about sidewalks was included in only 34% of these datasets. Accessibility information, such as crosswalks (19%), sidewalk condition (18%), curb ramps (17%), or audible cross controls (7%), was even less common. Insufficient data about pedestrian infrastructure not only hinders an individual’s safe navigation but also carries implications for legislative enforcement and the political power of the ADA [18]. Lack of publicly available data on infrastructure for pedestrians has also limited the depth and breadth of pedestrian environment equity research [19]. The limited data available in the majority of cities prompts questions about how these data can be collected quickly, who should collect these data, what expertise and perspectives are necessary, how PwDs can be involved in these processes, and how sustainable different collection approaches are [4].
Municipal governments employ a number of approaches to collect pedestrian infrastructure accessibility data, the most common approach being on-the-ground auditing. However, this traditional data collection approach can be time- and resource-intensive, meaning that many municipalities choose not to conduct such audits at all, or they fail to do so on a regular enough basis to have an updated dataset [18]. Recently, crowdsourcing through virtual auditing based on street view imagery (SVI) [20], satellite/aerial imagery [21], or LiDAR (Light Detection and Ranging) [19] has been presented as a possible alternative that addresses the time and resources constraints of traditional data collection methods. Proponents of such approaches also highlight how crowdsourcing provides an avenue for PwDs to be involved in how the data are collected and in the interpretation of the data for planning and prioritization [22].
Significant challenges to the greater use and adoption of crowdsourced data include a lack of standards and low-quality or missing data [23,24,25,26]. Data validation and quality control are crucial to addressing legitimacy concerns yet may involve complex and demanding procedures. The diversity in contributors’ expertise, dedication, and equipment quality, and the potential for anonymous false reporting, all contribute to data quality concerns [24,27]. The dynamic nature of crowdsourced data, compounded by the emergence of new information types not found in authoritative databases, makes it challenging to define clear, application-specific quality criteria [24]. The lack of standardized quality criteria and methodologies for crowdsourcing further adds to the complexity, necessitating tailored quality assessment frameworks for new kinds of crowdsourced data, such as street-level imagery [24]. A limited body of research has examined “data trusts” [28] or the validity of opensource geospatial data (i.e., the degree to which data align with authoritative geospatial datasets) and has primarily focused on the accessibility of non-sidewalk transportation features (transit stations, parking spaces) [29] or on comparing OpenStreetMap (OSM) against authoritative dataset data for land use/cover [30,31] and roads [32,33].
We are unaware of any published literature that has compared data from geo-crowdsourced applications and government data, which can help to better understand the utility of crowdsourced geospatial data and further legitimize its use for planning purposes (official and unofficial) in the United States and across the globe.
In this paper, we address this research gap by comparing sidewalk accessibility data collected through the Project Sidewalk crowdsourcing tool (https://projectsidewalk.org, accessed on 13 April 2025) with an official survey dataset collected by two local government agencies representing diverse urban environments. We were interested in better understanding (1) how virtually audited pedestrian infrastructure data align with government data (reference data) across a diverse sample of neighborhoods and (2) how the agreement between the two sources of data varies across different feature types (e.g., sidewalk quality, curb ramps, crosswalks, etc.). We outline the relevant literature on sidewalk accessibility data, describe the current gaps in the related literature that our study investigates, explain the data and methodology employed, share our results, and discuss our findings and implications for practice and policy.

2. Background

In this section, we present related work and describe it in three subsections to highlight the research gap. First, we discuss auditing pedestrian infrastructure, emphasizing the limitations of traditional in-field audits and how virtual audits, particularly those utilizing SVI, offer a more efficient alternative for collecting data on pedestrian infrastructure. Second, we explore crowdsourcing and citizen-based data collection, focusing on the rise of citizen-generated geographic information (VGI) and how it reshapes traditional data collection methods by involving the public in urban data gathering, with an emphasis on pedestrian infrastructure data. Finally, we review the Project Sidewalk tool, an opensource crowdsourcing platform used to audit pedestrian infrastructure, and discuss its features and the need for validation through comparison with official government data. Each section aims to highlight the existing research gaps, particularly in comparing crowdsourced data with government-collected data, which is essential for legitimizing crowdsourcing as a reliable tool for improving pedestrian accessibility.

2.1. Auditing Pedestrian Infrastructure

Cities employ various methods for collecting information related to pedestrian infrastructure accessibility, including in-field data collection, outsourcing to external firms, and conducting virtual audits. Conducting in-the-field data collection demands substantial resources, primarily attributed to on-site observers whose time represents a significant cost [6,18,19]. Expenses encompass survey equipment, travel, transportation between audit locations, and lodging. Additionally, adverse local conditions like traffic safety issues, high crime, air pollution, and inclement weather can impede in-field data collection [34,35]. Due to its resource-intensive nature, an on-the-ground audit is seldom repeated, resulting in infrequently updated data. These limitations have sparked a growing interest in “virtual audits” based on SVI. With SVI covering half the world’s population [36] and Google Street View (GSV) capturing over 10 million miles of streetscape [37], SVI provides an extensive data source for urban analytics [38]. Notably, the utilization of SVI as a reliable and less-expensive method for conducting pedestrian infrastructure audits has been studied in research across a variety of disciplines (e.g., public health, transportation, etc.) [39]. Conducting virtual audits based on GSV proved to be quicker compared with in-person audits [40]. Aghaabbasi et al. [34], in a comprehensive review of eight studies, found that virtual audits reduced the total staff auditing time by 14% in 63% of the cases. Lastly, the time machine feature of GSV helps with tracking improvements in sidewalk infrastructure (e.g., [41]) and allows for easily repeating audits, which offers long-term advantages to cities in terms of cost reduction compared with in-person audits.
Several studies have focused on validating GSV-based virtual audits of sidewalk features in comparison with in-person audits conducted by research assistants and using the same audit tool [42,43,44]. These comparison studies have repeatedly demonstrated that virtual audits are a reliable and efficient method with strong inter-rater reliability [43]. Several studies have focused on validating a public health walkability tool called Microscale Audit of Pedestrian Streetscapes (MAPS-mini) [45], which is used to audit street micro-level features, with trained observers and generally found high reliability of online audits compared with field audits [35,46,47,48] with the objective of studying the impact of the walking environment on physical activity. Yet, they also demonstrated that the degree of agreement depends on the type of features [35,44,46,48,49,50,51]. Some studies also mentioned that the raters’ familiarity with the area could influence agreement level [47,52].
Recent advancements in artificial intelligence (AI), computer vision, machine learning, deep learning methods, and remote sensing technologies such as mobile LiDAR and satellite imagery data, have facilitated the development of automatic auditing for sidewalks [53,54,55,56,57], crosswalks [54,58,59], curb ramps [60,61], sidewalk materials [62], and surface deficiencies [9]. However, few studies have compared virtual, audited data with official government data. Recently, Deitz [60] used machine learning models to predict the location of curb ramps and compared the results of these models with government (official) data across nine cities in the United States. The random forest model was 88% accurate in classifying ramp locations. While advances in generating data using such models hold promise, there is a gap in the literature not only for comparing data sources in terms of location but also in terms of quality (hereafter, severity).

2.2. Crowdsourcing and Citizen-Based Data Collection

One approach to increase the feasibility of virtual auditing of the pedestrian infrastructure conditions at a city scale is geo-crowdsourcing projects that rely on user-generated data. Crowdsourcing and citizen-based spatial data collection are reshaping traditional data collection [63]. Traditionally dominated by experts, this field now sees a surge of citizen involvement owing to accessible online mapping tools, high-resolution imagery, and GPS-enabled devices. This shift has led to a wealth of citizen-generated data and a blurring of the lines between data producers and consumers, with citizens now actively involved in both roles [64]. One of the most successful and widely cited examples of this is OSM, referred to in the geographic literature as “Volunteered Geographic Information” (VGI), a term originally coined by Goodchild [65], which includes geospatial data such as geotags or coordinates [66]. Numerous other terms, such as “Public Participation in Geographic Information Systems” (PPGIS) [67,68], have been proposed to describe similar phenomena [69]. This movement extends beyond mapping to include various forms of citizen participation in scientific research [70], often under the umbrella of “citizen science” and crowdsourcing [64]. These developments reflect a broader democratization of data collection and analysis, where public involvement enriches the field.
VGI, as a form of user-generated data, represents the growing phenomenon of ordinary citizens actively contributing to the creation of geographic information. It involves the use of various tools to generate, compile, and share geospatial data that individuals voluntarily provide [24]. In this context, the term “geographical citizen science” is introduced as a scientific activity wherein the public (e.g., not just people with credentials) voluntarily participate in creating, collecting, assembling, monitoring, analyzing, and disseminating location-based data for a scientific project [71]. Crowdsourcing geospatial data involves a data acquisition process through the contributions of large, varied groups of individuals, many of whom may not have professional training [24,72]. Crowdsourcing offers the potential to enhance the time, cost efficiency, and community involvement in assessing pedestrian infrastructure accessibility. By harnessing the collective experiences of individuals, crowdsourcing can provide a dynamic and real-time understanding of accessibility challenges. Despite the diversity in focus and characteristics, all VGI approaches emphasize the value of “non-authoritative” data sources [24] that involve the public in some way.
Previous studies have used crowdsourcing or VGI for urban data collection, including OSM [73], mobile Pervasive Accessibility Social Sensing (mPASS) [74], Madrid Systematic Pedestrian and Cycling Environment Scan (M-SPACES) [75], Wheelmap (Wheelmap.org) [76], and Mapillary (www.mapillary.com) [77,78,79]. The 311 systems [80] and SeeClickFix.com [81] are platforms that enable citizen participation in reporting non-emergency issues, including problems related to sidewalk accessibility. However, these platforms do not enable remote, virtual inquiries and have not demonstrated the ability to collect data on accessible pedestrian infrastructure on a scalable basis [82].
Researchers have pointed out the limitations and challenges of using VGI-based crowdsourced data, such as data quality, accuracy, precision, bias [24,83], privacy, legal and ethical issues [84], data interpretation, training and education, non-participation of certain groups [24], arbitrary format of data [85], challenges in sustaining data collection efforts [24], a lack of mechanisms for providing feedback to open data producers [86], and the inadequacy of tools for effectively utilizing open data [86].
Concerns about the reliability of data collected through VGI and the existing power dynamics and inequalities across different levels of jurisdiction can lead to resistance within governmental organizations [25]. Stakeholders worry that the collected data might not withstand scrutiny regarding its quality and accuracy, raising concerns about its reliability in official contexts [87]. It is, therefore, critical to examine how well VGI data compare with official government data.

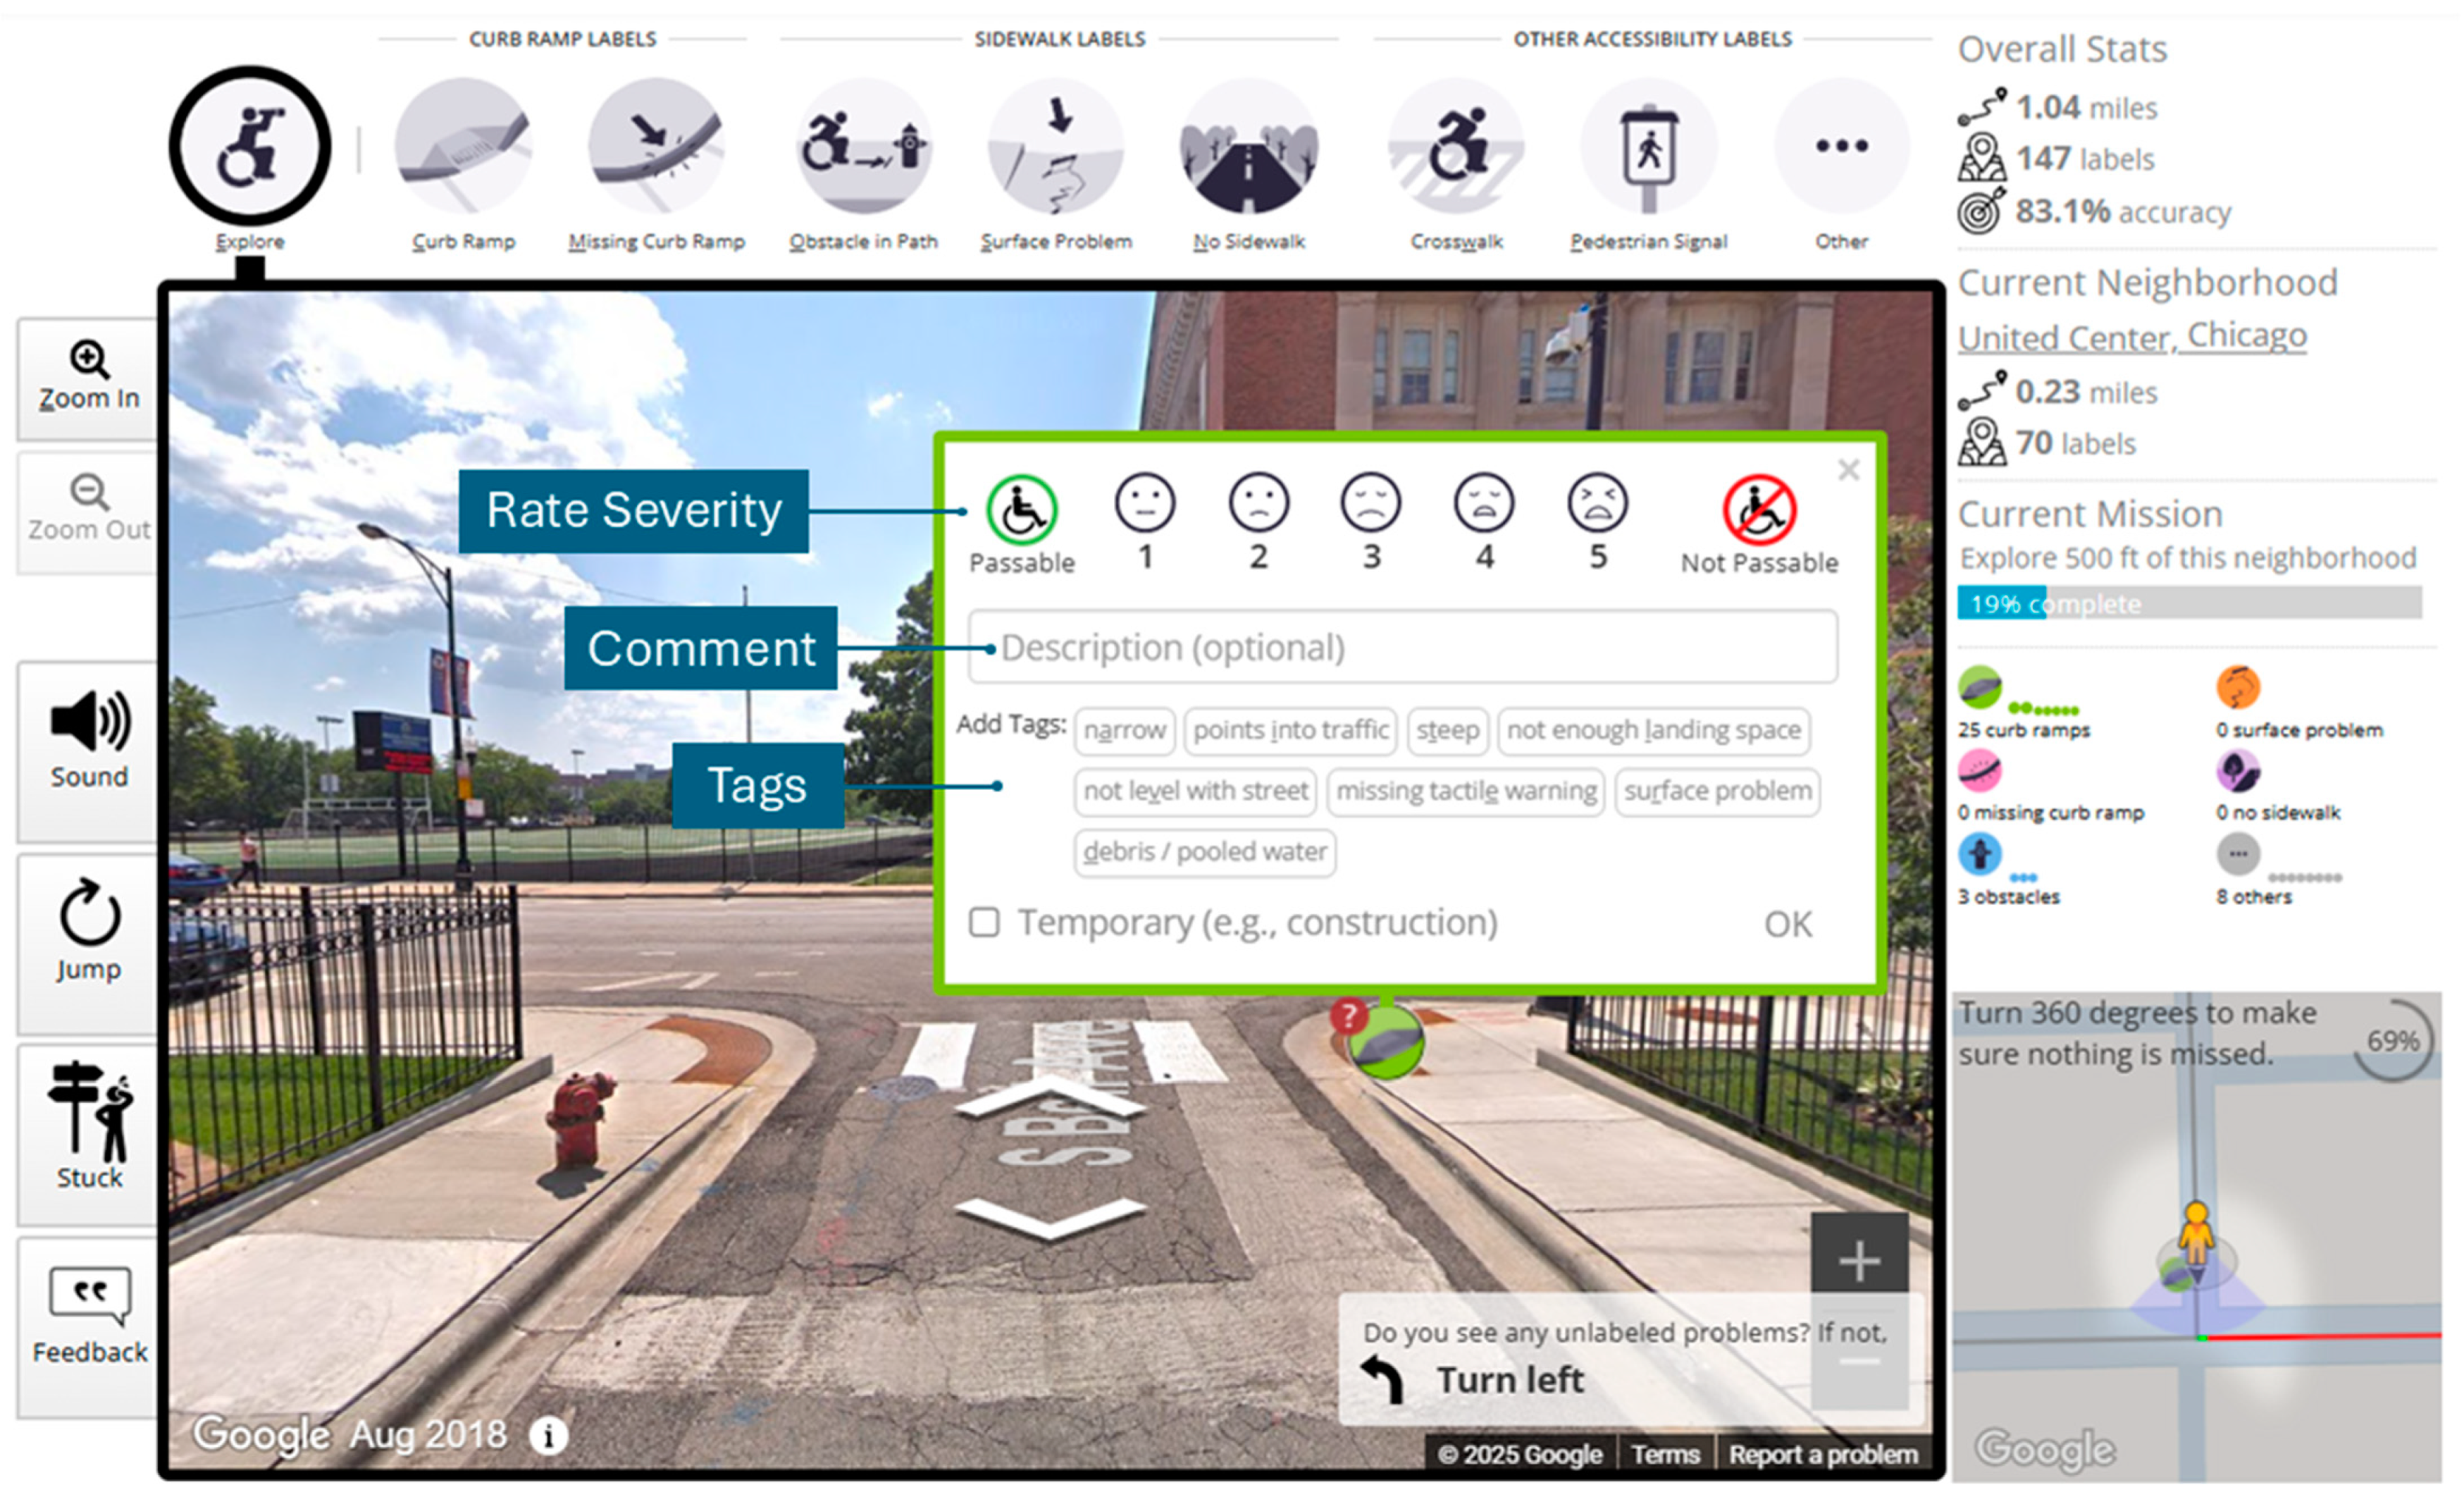
2.3. Project Sidewalk Tool

Project Sidewalk (www.projectsidewalk.org) is an opensource crowdsourcing tool that allows users to remotely label and assess sidewalk accessibility by virtually moving GSV imagery of city streets [20], serving the dual purposes of assessing ADA compliance and ensuring safe routing [18]. Project Sidewalk operates as a citizen-science-based toolkit that is open to both public users and trained volunteers. Users are asked to identify, label, and rate sidewalk accessibility features and problems on a scale, selecting the appropriate descriptive tags or writing in additional comments (Figure 1, Figure 2 and Figure 3). Users also validate other users’ labels based on the accuracy of the label type used (Figure 4). This process helps with quality control, identifying incorrectly used labels to avoid incorporating these data points in auditing results [88].
Project Sidewalk’s labeling ontology is based on standards [89] for accessible pedestrian infrastructure. Labeling involves a three-step process that starts with categorizing an element based on its type or nature. It encompasses 5 main types of labels along with 35 specific tags to provide detailed information about sidewalk accessibility. The primary label categories include curb ramps, missing curb ramps, obstacles on the sidewalk, surface issues, and completely missing sidewalks (see Figure 2).
The next step involves rating the element’s severity, which assesses its impact on overall accessibility (see Figure 3). The final step requires selecting descriptive tags that apply to the element, providing further detail about the specific issues or characteristics observed. Labels may also feature an optional descriptive text and one or more tags relevant to the specific issue identified, such as “bumpy”, “cracks”, and “narrow” for surface problems. Additionally, all labels carry extra metadata, which includes the date of the image capture, the time the label was added, validation details, and the geographical coordinates (latitude and longitude) of the labeled spot.
Quality control in crowdsourcing projects can be split into two types: preventive techniques [90] and post hoc detections [91]. Project Sidewalk employs both approaches: an interactive tutorial to train crowdworkers as their “first mission” and post hoc validation where crowdworkers “vote” on the correctness of other users’ labels [92]. Previous evaluations of Project Sidewalk showed strong accuracy of ratings through validations as well as high inter-rater reliability between research staff members of 0.56–0.86 for Fleiss’ Kappa score [82]. Recent accuracy statistics for Project Sidewalk, including these validation efforts, can be found on the Project Sidewalk live stats page [93]. However, Project Sidewalk has not been validated in comparison with official government data. This need for validation was discussed as a key need by a multi-stakeholder group of participants who participated in exploratory workshops to build trust in the data from city officials as well as PwDs [87,94].

3. Methods and Data

3.1. Study Context

In this comparison study, we focused on two regions—Seattle, Washington and DuPage County, Illinois. We selected these regions because they enable an investigation into different urban contexts and forms that exist between the Seattle and Chicago areas and because of existing partnerships between the research team and regional planning agencies in these areas. In the case of Seattle, we accessed the data from the open government data (OGD) portal [95] and for DuPage, we received the data through a data-sharing agreement. Also, we utilized data shared from Cook County, Illinois, during the initial round of auditing to establish inter-rater reliability (IRR). However, because that dataset included only curb ramps, we used DuPage County data for the second and third rounds of IRR auditing and for the comparison between Project Sidewalk data and government data.

3.2. Sampling—Comparison Area Selection

We used a purposeful sampling approach to select sub-areas within Seattle and DuPage County that reflected a diversity of socio-economic status and urban form. Median Household Income (MHI) data were accessed through Esri, which develops geospatial resources using the most recently published American Community Survey (ACS) data. The MHI dataset used in this study contained data from the 2018 ACS 5-Year Estimates. The Environmental Protection Agency (EPA) Walkability Index data were accessed through the EPA’s Smart Location Database [96]. We selected 18 Census Block Groups within Seattle and DuPage (9 samples in each case) that reflected low, medium, and high MHI and walkability, and which had at least 30 data points from the local government datasets. We selected the study areas based on income tiers from a 2018 Pew Research Center study [97] and the EPA Walkability Index Score scale [96]. The income tiers categorized regions as Low Income (below USD 40,100), Middle Income (USD 40,100–USD 120,400), and High Income (above USD 120,400). Within DuPage County, there were no areas in the low-income category.
The EPA Walkability Index Score scale contains four tiers. Given that the study examined urban regions, the first tier (“Least Walkable”) was not included in the selection criteria, as it primarily is attributed to rural areas. The walkability scale ranged from Below Average Walkable (5.76–10.5) to Above Average Walkable (10.51–15.25) to Most Walkable (15.26–20) (Table 1). For each category, we randomly selected block groups. Moreover, we considered geographic distribution when identifying study regions. Using data on recent sidewalk updates in Seattle, we selected areas that were not upgraded to attempt to avoid temporal mismatches with the GSV data.

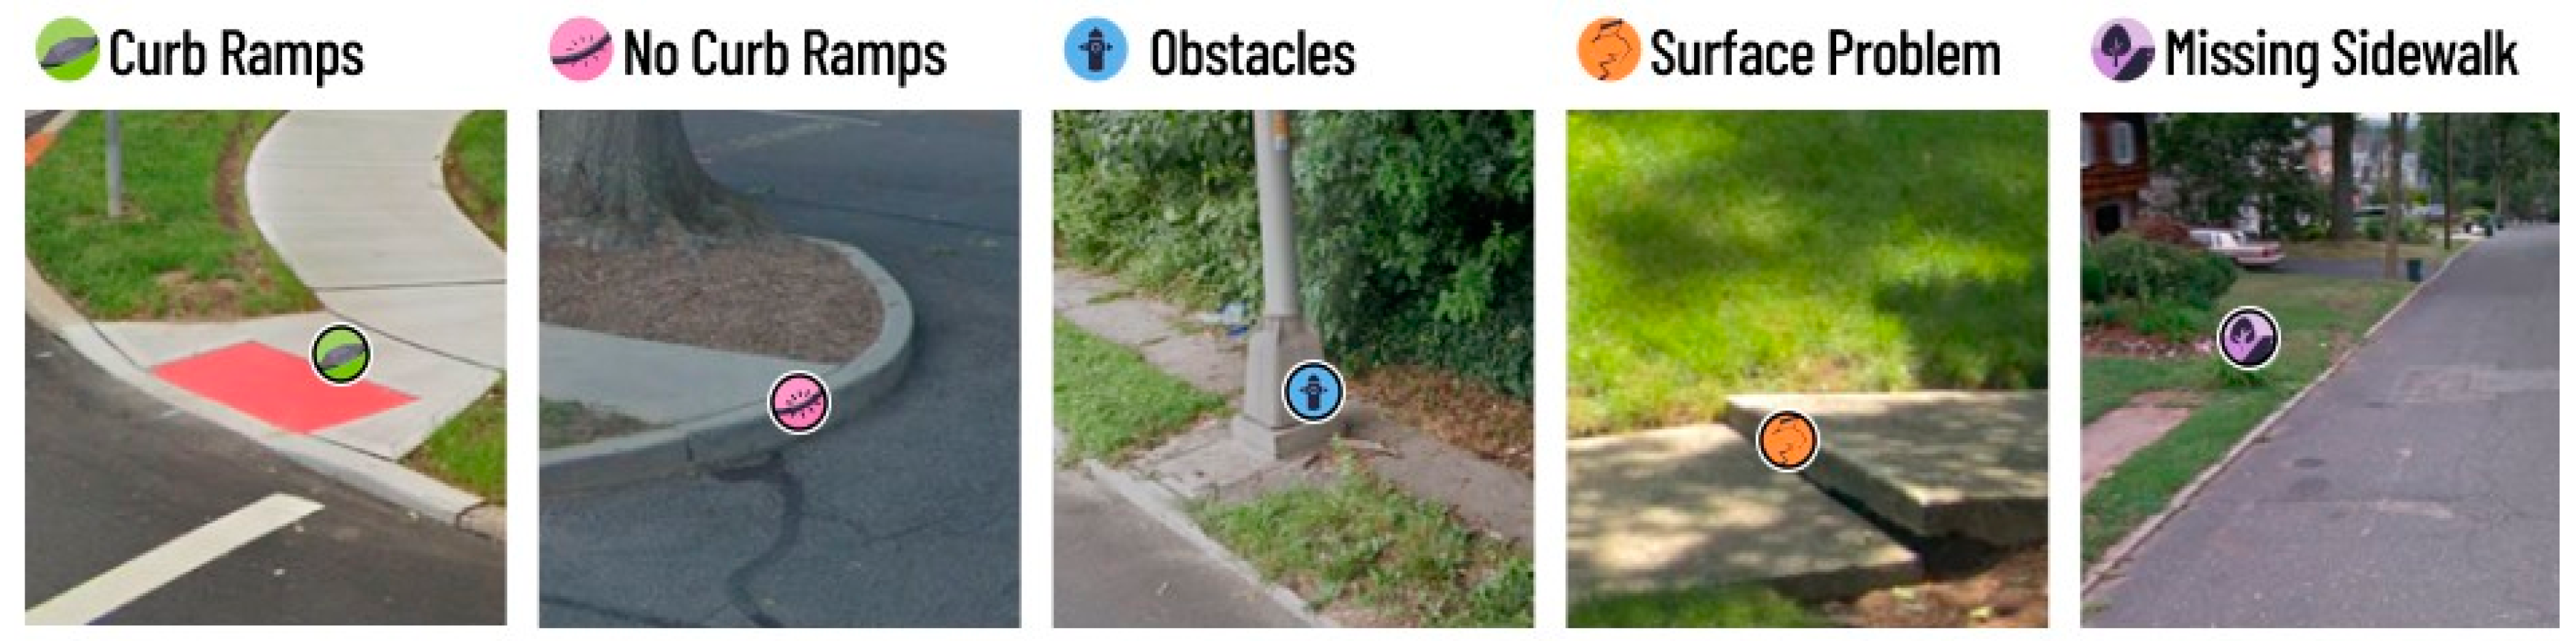
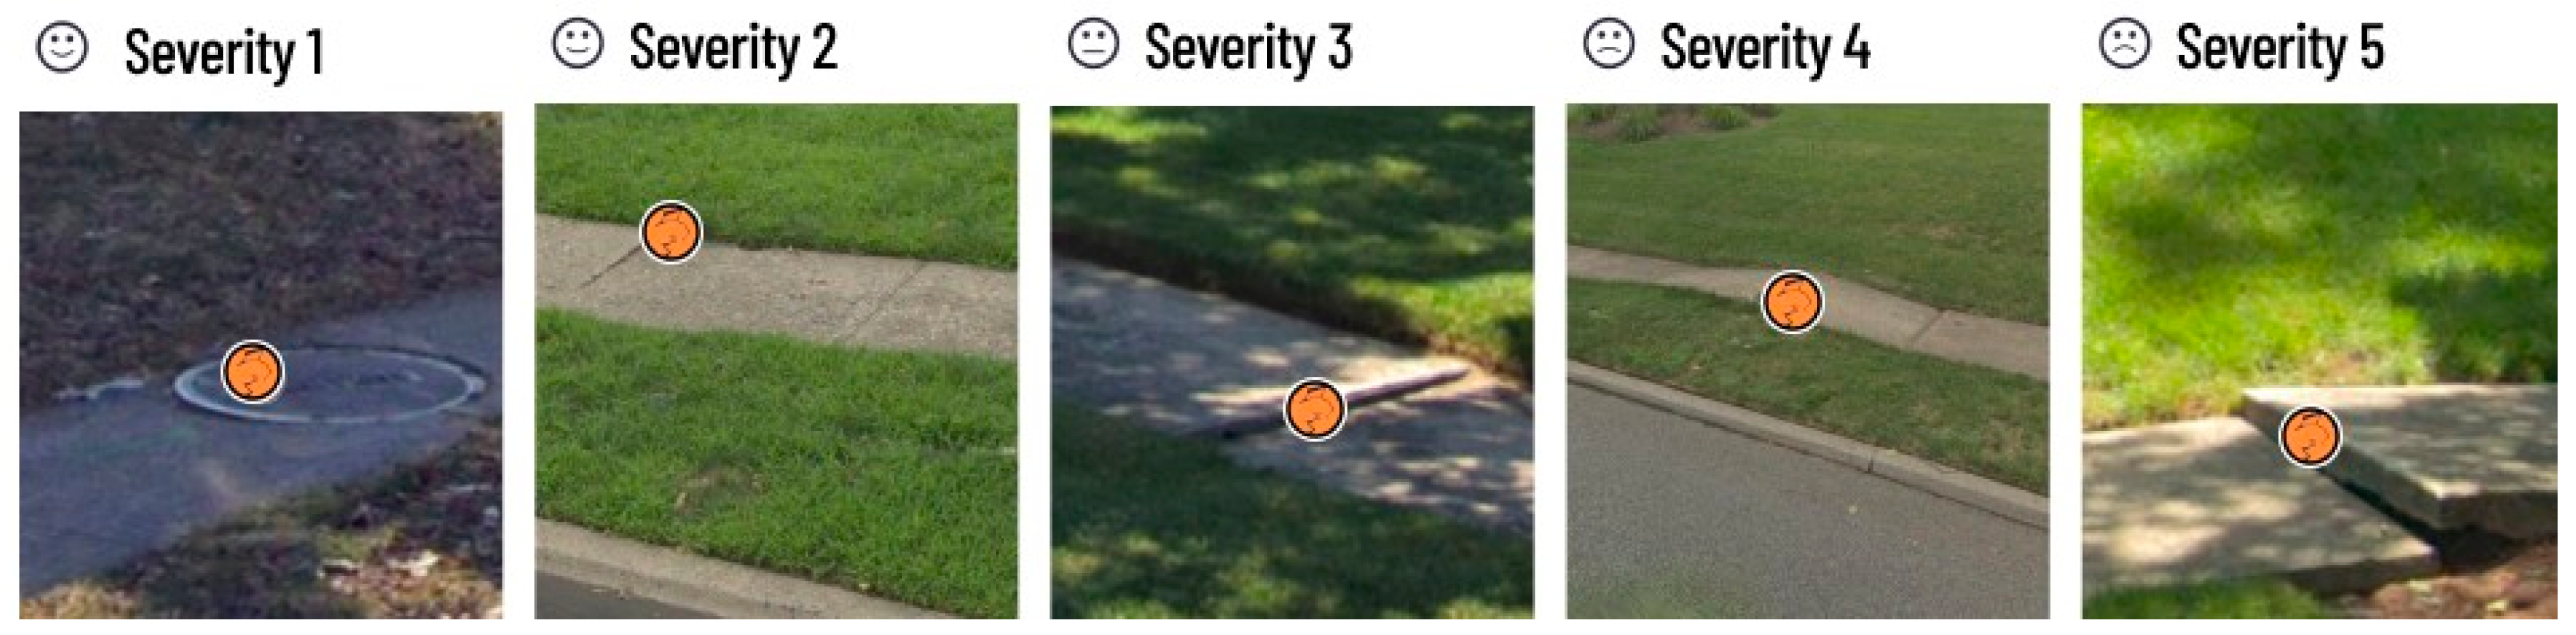
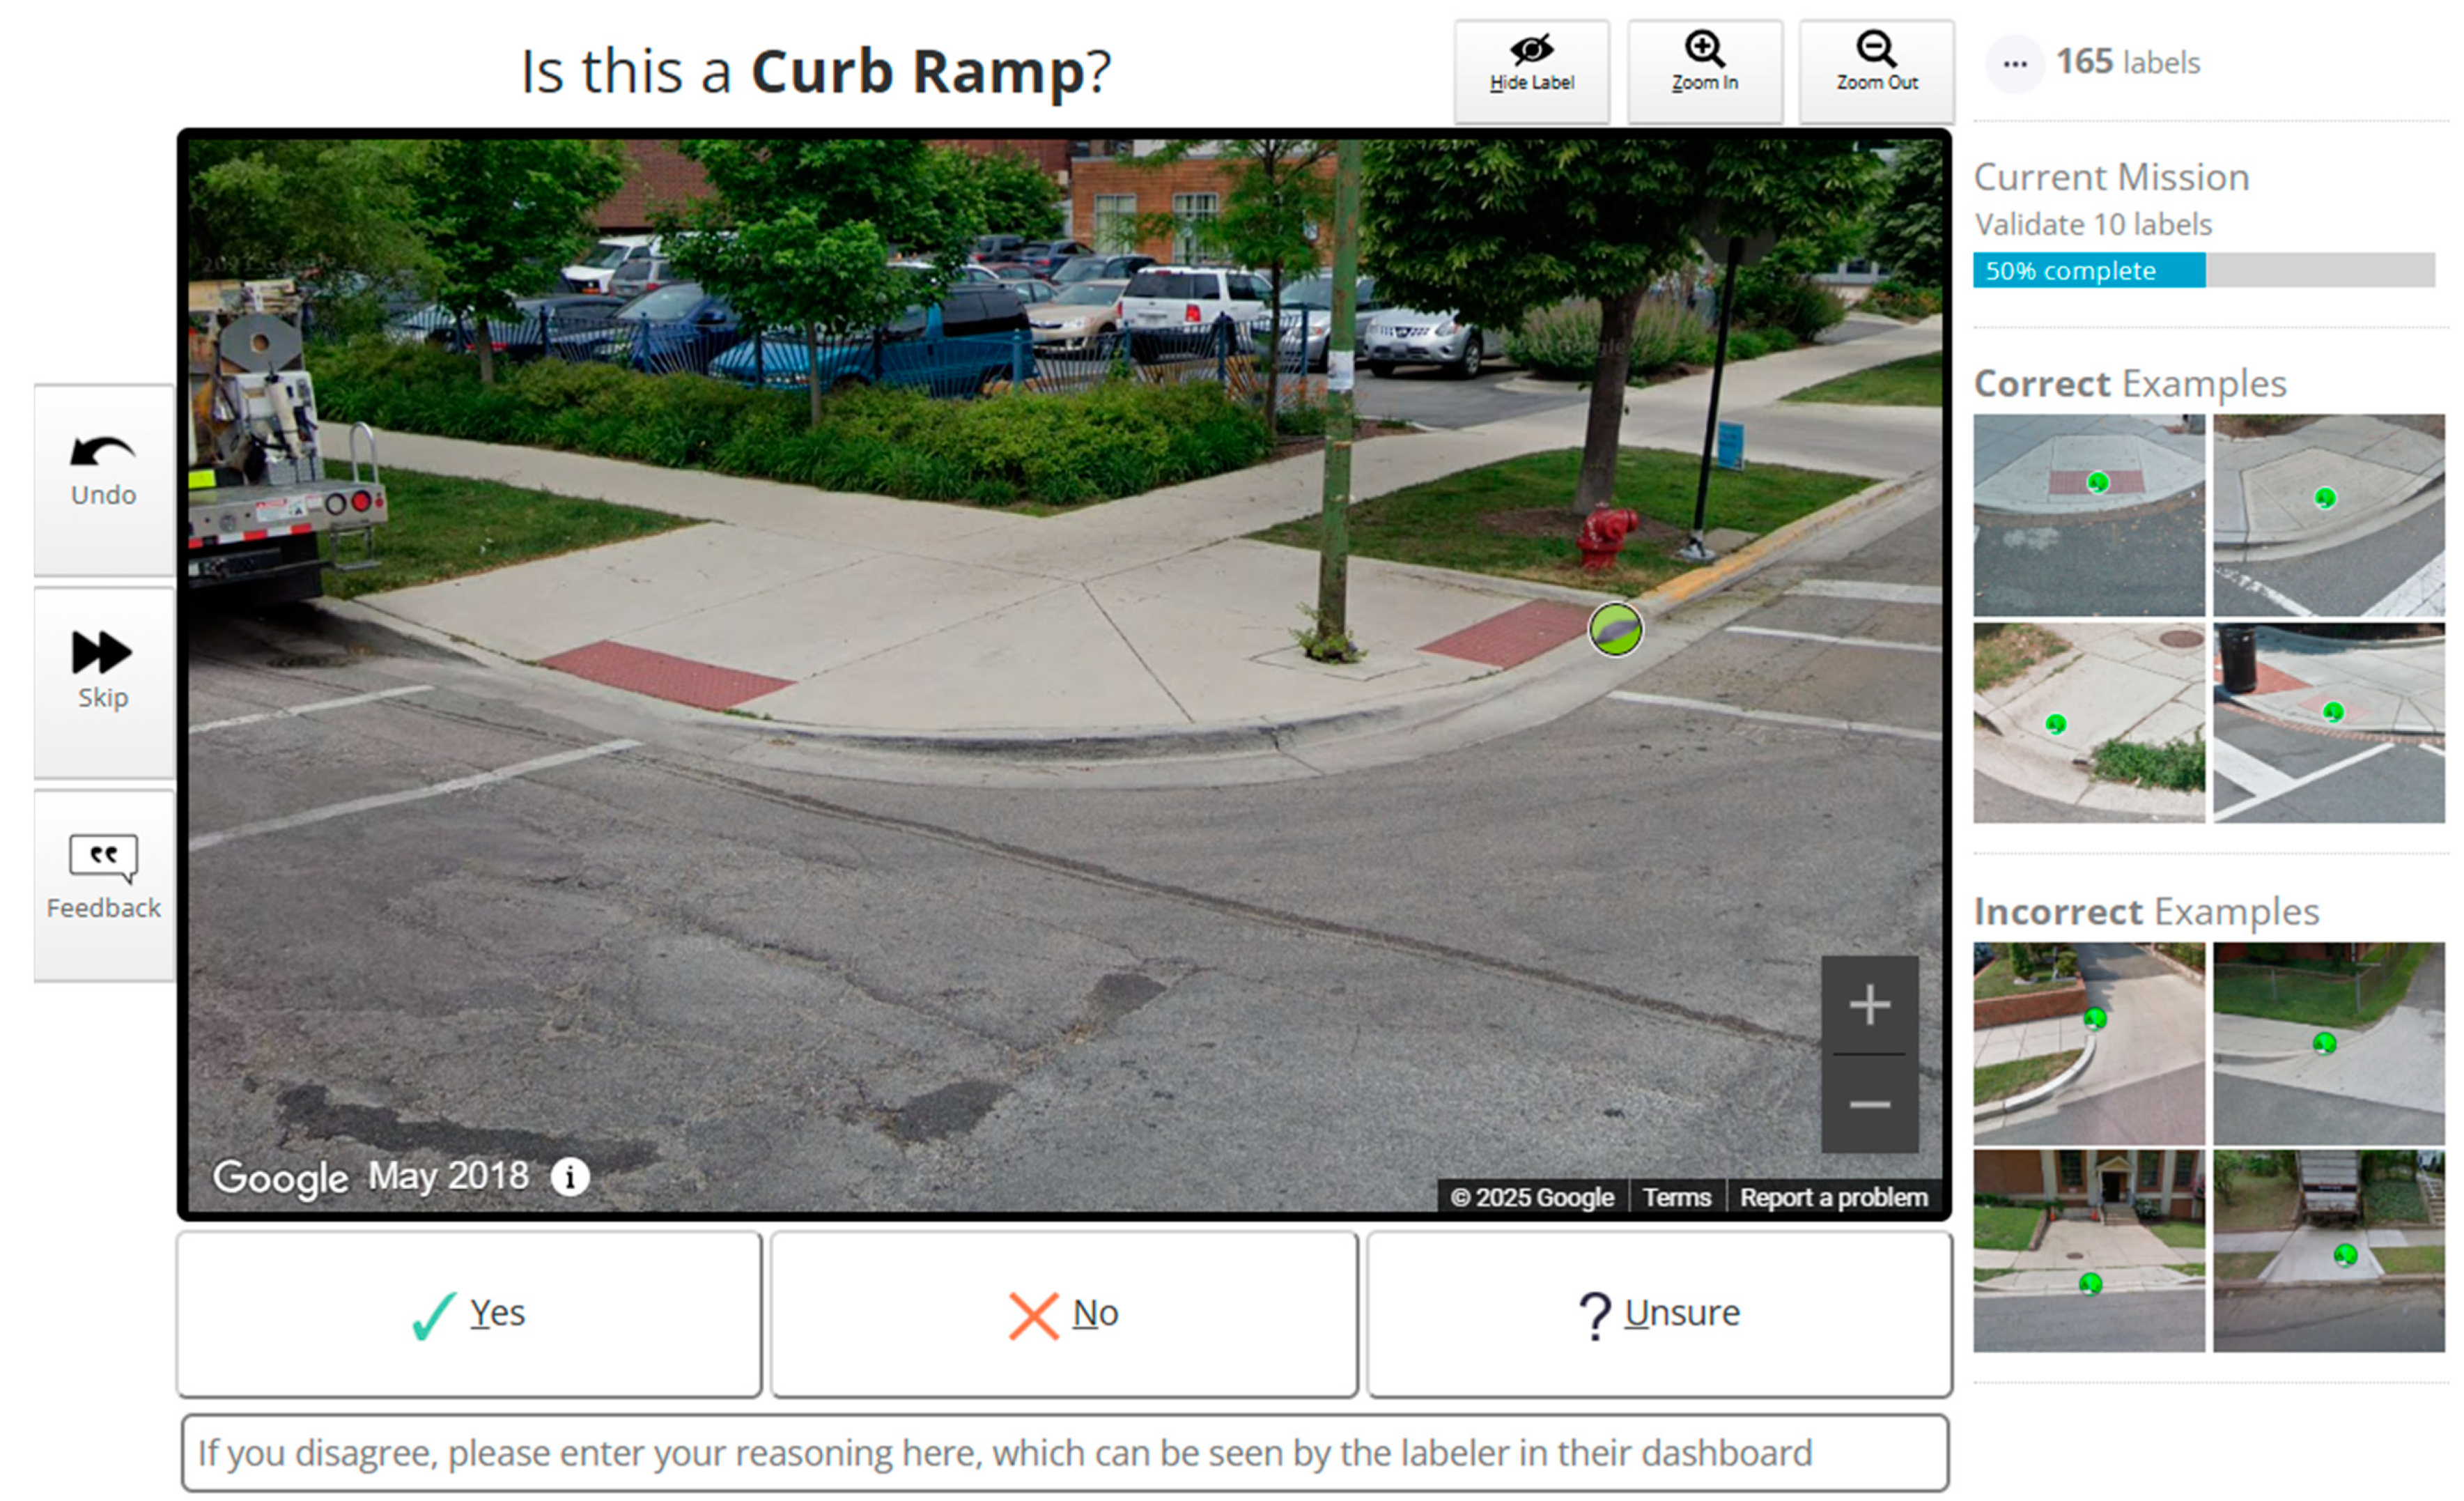
3.3. Rater Auditing Process

To establish inter-rater reliability, two research associates collected data on the same set of routes via Project Sidewalk. One rater was the lead engineer for Project Sidewalk and has been auditing for six years. The other rater has a master’s degree in urban planning and was extensively trained on using the tool. To develop a consistent approach to rating, these two raters reviewed a sample of roadways and audited the pedestrian infrastructure in Project Sidewalk. The raters used an existing labeling guide as a starting point for consistent guidance on rating. The raters went through three rounds of auditing routes.
We calculated inter-rater reliability statistics using Krippendorff’s Alpha [98]. Specifically, we first divided streets into segments of 10 m (approx. 30 feet), corresponding to the visibility range within each GSV panorama. To prevent instances where two labels were counting the same issue in two street segments, we clustered the raters’ labels based on the label type and distance. The clustering algorithm and distance threshold were adopted from a previous Project Sidewalk study [20]. We then assigned the cluster centroids to the nearest street segment, ensuring that all labels within a cluster were analyzed as part of the same street segment. Finally, we constructed agreement tables for each label type, where rows represent street segments and columns represent each rater’s labels.
Table 2 shows the results of the inter-rater reliability between the two raters in each round. Krippendorff’s Alpha (α) quantifies data reliability by measuring the ratio of observed disagreement among raters to the disagreement expected by chance, highlighting how much of the data variance is attributable to the actual phenomena under study rather than inconsistencies among the evaluators. Krippendorff [98] proposed an ideal reliability level of α = 1.000, and it is recommended to rely only on variables with α reliabilities of 0.800 or higher, considering variables with reliabilities between α = 0.667 and α = 0.800 for drawing tentative conclusions.
Looking at the total statistics, curb ramps, crosswalks, and pedestrian signals achieved high levels of agreement (α ≥ 0.8), and missing curb ramps and no sidewalks achieved acceptable levels of agreement (α ≥ 0.67). Sidewalk problems that combined surface problems (e.g., broken concrete, height difference, uneven, brick/cobblestone) and obstacles (e.g., fire hydrant, pole, parked scooter, vegetation) were the most difficult to reach agreement on but reached an acceptable level of agreement after the third round of auditing.
After each round, the two raters discussed disagreements in order to identify where additional guidance on rating was needed that could improve inter-rater reliability. Reasons for disagreement included one rater missing or not seeing; the difference in opinion of what labels to use for certain features (i.e., whether vegetation overgrowth is a surface problem or an obstacle); GSV imagery updating between audits; and inconsistency in their approaches to labeling features that continued along multiple segments of the mission route (i.e., missing sidewalks, narrow sidewalks, surface problems, construction). Agreement was achieved by developing a consensus on auditing technique and minimum requirements for labeling a feature. Consensus was determined by considering best practices for data collection, reviewing Access Board standards, and conferring with the research team. Notes were integrated into an updated labeling guide to help ensure higher reliability in future auditing.

4. Analysis and Results

4.1. Data Comparison Preprocessing

The Project Sidewalk data for all features were recorded as a point layer, but the official data from the two local governments were not in a consistent format for each label; some were in the form of geospatial data and others as non-geocoded files, such as those of street intersections. In some areas, modifications to the pedestrian infrastructure had been made after the audit by the government (date mentioned in the data record), such as the removal of a highway or the addition of pedestrian infrastructure. We flagged these changes (temporal consistency) during our comparison process using the time machine feature of GSV. To address these issues, we developed a process for data preparation/recoding. A detailed description of the process for each feature is provided below.

4.1.1. Curb Ramp

For the city of Seattle, curb ramps had point feature topology. To compare the Project Sidewalk data with the official data, we performed a spatial join, connecting each curb ramp point label from Project Sidewalk (N = 206) with the closest point in the government’s dataset and vice versa (Figure 5). After that, we addressed Project Sidewalk points without a matching point in the government data or vice versa. Due to temporal mismatches and updates not reflected in the government’s geospatial data (Figure 6), we excluded eight points from the comparison analysis.
To compare the quality (severity) of curb ramps we needed to align the severity scales of the two data sources. The Project Sidewalk dataset categorizes severity into a 5-point scale, ranging from 1 (good condition or passable) to 5 (poor condition or impassable). The Seattle dataset classifies curb ramp conditions into three categories: good, somewhat bad, and bad. To align these datasets, we recorded Project Sidewalk labels with severity 1 as good, severities 2 and 3 as fair, and severities 4 and 5 as poor.
In DuPage, there were 287 curb ramp features labeled in the Project Sidewalk data. However, the government data included only data on main intersections. Consequently, we excluded 194 points from the analysis, leaving 93 pairs of point data for comparison. We followed the same data preparation process for DuPage as we did for Seattle. We similarly had to recode Project Sidewalk severity scale to fit the DuPage severity scale by recoding severity 1 as good, severity 2 asas fair, and severities 3, 4, and 5 as poor.

4.1.2. Sidewalk Condition

In order to compare data on sidewalk conditions, we compared 431 surface problem and obstacle labels from Project Sidewalk (point geometry) with segment level data for Seattle (line geometry). We calculated the count of each Project Sidewalk label at each severity level for each sidewalk segment (N = 87). In the Seattle data, the sidewalk condition of a segment was initially classified into five categories, ranging from excellent to very poor. However, for a more effective comparison, we reclassified them into three categories: no barriers, some barriers, and many barriers. Similarly, we converted the data from Project Sidewalk into three categories, using the criterion that if there was at least one label with a severity of 4 or 5, or if the number of labels with severity 3 exceeded 5, the sidewalk segment was classified as a sidewalk with “many barriers”. We considered segments as “no barriers” that had no problem labels. The rest of the severities were designated as “some barriers”.
In the DuPage area, there were 298 Project Sidewalk labels, of which 25 fell outside the regions of the government’s previous audit, and, therefore, we excluded them from our comparison. Since the government’s audit was conducted at the segment level (distance between two main intersections), we aggregated the audit frequency from Project Sidewalk at this same segment level before comparing. The DuPage government audited the condition of sidewalks in 2017 and 2018, categorizing them from poor to good across five classes. We reclassified these into three classes: “Poor” and “Poor to Fair” were combined into “many barriers”; “Fair” and “Fair to Good” were grouped as “some barriers”; and “Good” was defined as “no barrier”. For Project Sidewalk labels, we followed the same procedure that was applied in Seattle.

4.1.3. No Sidewalk

Similar to sidewalk condition, the absence of a sidewalk was represented as a line layer for the government data for Seattle, but in the Project Sidewalk data, there are point features for the No Sidewalk label. Therefore, we conducted a comparison such that if the entire segment specified by the government as the absence of a sidewalk was covered by the points in the Project Sidewalk data, we considered it a complete agreement for lacking a sidewalk for that segment.
In DuPage, the data about whether each street has a sidewalk or not were recorded in such a way that they were limited to the segment of the street (the distance between two intersections of the main street), and it was labeled as “PARTIAL”, indicating that a part of the street does not have a sidewalk. By matching the two based on their positions, we considered it an agreement if the “PARTIAL” label of a sidewalk segment in the government data aligned with at least some Project Sidewalk no sidewalk labels.

4.1.4. Crosswalk

For Seattle, both the government data and Project Sidewalk data geographically represented crosswalks as a point layer. Therefore, we spatially joined the data of the Sidewalk project to the government data. For the comparison of crosswalk severity, the analysis involved aligning the classification systems of the two datasets. In the Seattle data, crosswalk conditions are categorized into three classes: good, fair, and poor. We reclassified the Project Sidewalk data into the government’s 3-point scale, where a severity of 1 was defined as “Good”, severities of 2 and 3 were combined and labeled as “Fair”, and severities of 4 and 5 were grouped together and classified as “Poor”. No data were available from the DuPage government for crosswalks.

4.1.5. Pedestrian Signal

In the official data of Seattle, the presence of a pedestrian signal was available as a point layer, where each point represented an intersection with a pedestrian signal. In the Project Sidewalk data, there was one point in the layer for every corner of intersections with a pedestrian signal. Out of the total 27 surveyed points in Project Sidewalk, we excluded 7 points from the analysis due to extensive changes in the pedestrian infrastructure in recent years. Ultimately, there were five intersections remaining for analysis. No severity score was available for analysis in the Project Sidewalk or government data.

4.2. Analysis Comparing Project Sidewalk and Government Data

In Table 3, we present the level of agreement between Project Sidewalk data and government data. As discussed earlier, we assessed this agreement in two ways: one regarding the spatial alignment of Project Sidewalk labels with government data and the other concerning the severity of each label in both datasets.
The percentage of agreement for the presence of features varied. The highest agreement was observed for the no sidewalk label (100%), while the lowest agreement was associated with the label pedestrian signal (75%). The extent of agreement may depend on the topology differences between data sources. For instance, in the case of obstacles and surface problems, the disagreement might come from how the data are reported differently (like points versus lines). In contrast, comparing the No Sidewalk label is relatively straightforward.
Another factor contributing to the discrepancy between the datasets is the classification of some curb ramps in the government data as “shared”, indicating their usability for pedestrian movement in any direction (Figure 7). Conversely, the Project Sidewalk data, with a focus on accessibility for all pedestrians, particularly those with disabilities, recognized curb ramps for only one direction, treating the opposite direction as lacking a curb ramp. This divergence in data interpretation arises from the differing audit procedures of the two sources.
The agreement percentage for severity scores varied substantially and was generally lower than that for the presence of features. For example, there was a high agreement on the presence of obstacles and surface problems in Seattle (90.8%), but the agreement on their severity was slightly lower (81.6%). In DuPage, there was a perfect agreement on the presence of obstacles and surface problems (100%), but the agreement on severity dropped significantly, to 46.1%. This indicates that while identifying pedestrian infrastructure features might be straightforward, assessing their severity varies significantly between the datasets. The Project Sidewalk raters were more conservative with their ratings and rated infrastructure features as more problematic than auditors in the government data. The average severity in PS data was 1.47, compared with 1.34 in the city data.

5. Discussion and Future Work

In this study, we compared data from a crowdsourcing platform with data collected from official government audits of pedestrian infrastructure accessibility, consistent with previous research showing the high reliability of online audits compared with traditional field audits. Similar to prior efforts that compared field audits—mostly conducted by research assistant teams—with virtual audits [35,42,43,44,45,46,47,48], our results revealed a high level of agreement for the presence of pedestrian infrastructure features. Our findings also showed that the degree of agreement varies depending on the type of features being audited, as found in previous research [35,44,46,48,49,50,51]. In contrast to previous research showing that positional accuracy of features is a challenge in geo-crowdsourced databases [99,100], our results demonstrated a high level of positional accuracy between virtually audited and in-person government data. The percentage of agreement was 75% or higher for detecting the locations of features. Yet, the results for positional accuracy seem consistent with previous studies using virtual audits to compare derived versus government data by trained individuals [42] or through automated processes [60].
While we might assume that official government data are a “gold-standard” of quality, our study identified several issues with treating it as such. Notably, we found some parts of the government data to be outdated, not to cover all features of the pedestrian infrastructure, or not to be collected throughout the study area. These issues compounded the complexity and time required for comparison. For instance, we identified an issue in the government data that when a part of the sidewalk segment was missing, it was still classified as a full sidewalk, whereas Project Sidewalk data would note the gap in that sidewalk as a missing sidewalk.
Yet, evaluating the quality of the features becomes more challenging, as perceptions of quality differ between individual viewpoints. Our results showed that the percentage of agreement varied for the severity of pedestrian infrastructure issues. This also aligns with previous studies comparing virtual audits with on-site audits, which have found much lower agreement percentages for qualitative subjects, such as graffiti and upkeep [47], versus more objectively measurable features like the presence of curb ramps. This discrepancy highlights the subjective nature of severity assessments for both government and street-view audits and suggests a need for clearer guidelines or criteria to improve evaluation consistency. It also suggests the need for more granular reporting of the characteristics of features so that instead of a severity score (as is provided by local governments and Project Sidewalk), specific feature attributes can be compared, such as having a tactile strip on curb ramps. Interestingly, the severity rating from Project Sidewalk raters was, on average, higher (i.e., more problematic) than for government data. This is important because it suggests that crowdsourced data would not have an issue with missing problematic features or downplaying severity. In other words, cities using Project Sidewalk could have confidence that they would know about all the severe problems. While it could lead to possible misclassification of problems as being more severe, the ADA requires all infrastructure to be accessible and meet minimum guidelines. Therefore, even small problems are important to identify, and in the overall identification process, false negatives are more important to minimize vs. false positives. Cities also vary substantially in how they prioritize improvements [3], so severity is one factor among many that is used in making such decisions, reducing the impact of slight misclassifications.
One reason for the lower percentage of agreement on severity can be attributed to the temporal mismatch between Project Sidewalk data and government data. In the case of Seattle, the government’s data are not as up to date regarding the quality as the GSV data, which show more recent conditions of features. The quality of these pedestrian infrastructure features may have declined compared with the time of the government’s audit, or conversely, in some locations in DuPage, where the government improved the pedestrian infrastructure after the last available GSV, there was also a discrepancy.
The lack of standardized criteria among local governments for auditing pedestrian infrastructure brings into question, what is the gold standard? Even among the two government agencies in this study, there were substantial differences. The lack of integration of standardized measurement, particularly concerning the data type for each feature, not only imposes significant constraints on long-term planning for improving pedestrian infrastructure but also hinders the implementation of general policies based on best practices from other cities [101]. Standardized open data can establish a consistent data structure [102] and be used for both traditional and SVI-based audit efforts [103]. While the data used in this study were collected from trained raters, the data structure and inputs would be the same if they were crowdsourced. Our process and findings on inter-rater reliability suggest the need for training as part of crowdsourcing onboarding. Geo-crowdsourced data democratizes the data collection process and can significantly enhance the comprehensiveness and granularity of datasets relevant to pedestrian infrastructure projects. Moreover, the inclusive nature of crowdsourced open data can bridge the gap between official records and the actual needs and experiences of the community, thereby enabling more community-centered urban planning initiatives [22].
The use of AI with crowdsourcing projects may change the workflow of pedestrian accessibility data collection. Our team is working on developing machine learning methods [92,104] to enhance the accuracy and scalability of these audits. However, the “citizen science” toolkit remains an important consideration, especially in capturing qualitative aspects that AI-based methods may struggle to address. AI approaches, while promising, have limitations in interpreting subjective features, such as the severity of infrastructure barriers, which require human judgment and contextual understanding. Thus, integrating human and AI citizen science tools continues to be essential [105], ensuring that the qualitative nuances of pedestrian accessibility are not overlooked.

6. Conclusions

The lack of comprehensive data on pedestrian infrastructure accessibility presents a critical challenge for cities in addressing pedestrian infrastructure barriers. Crowdsourcing tools such as Project Sidewalk can be a scalable solution, but the validation of such data is needed. Our results show high agreement between the virtual audit data from Project Sidewalk and official government data collected in person for the presence of various feature types, but varying agreement for the severity of pedestrian infrastructure issues.
We identified several important challenges to making “apples-to-apples” comparisons between Project Sidewalk and government data, including location mismatches, differences in geospatial topology, differing criteria used in evaluating pedestrian infrastructure conditions, and inaccuracies in the reference data. This study demonstrates that Project Sidewalk data can be a reliable alternative to traditional data collection processes, but it also reveals challenges related to a lack of standardized formats for auditing the severity of pedestrian infrastructure issues. Future work is needed to standardize data collection for sidewalk accessibility so that geo-crowdsourcing can be a viable alternative or addition to traditional in-person audits. Such efforts could accelerate infrastructure improvements and enhance environmentally and socially sustainable mobility among PwDs.

Author Contributions

Conceptualization, Y.E. and J.E.F.; methodology, Y.E., J.E.F., S.A., D.S., C.L., and M.S.; software, S.A., D.S., and M.S.; formal analysis, S.A. and C.L.; investigation, S.A., D.S., and M.S.; data curation, D.S. and M.S.; writing—original draft preparation, S.A., D.S., and Y.E.; writing—review and editing, Y.E., D.S., J.E.F., C.L., and M.S.; visualization, S.A., D.S., and M.S.; supervision, Y.E. and J.E.F.; project administration, Y.E. and J.E.F.; funding acquisition, Y.E. and J.E.F. All authors have read and agreed to the published version of the manuscript.

Funding

This research was funded by the National Science Foundation (NSF) as part of the Smart and Connected Communities program [award #2125087, 2021].

Data Availability Statement

The raw data supporting the conclusions of this article will be made available by the authors on request.

Acknowledgments

Thank you to our Co-PIs on the project—Delphine Labbé, Joy Hammel, and Judy Shanley—and our partners at Access Living, AIM Center for Independent Living, Chicago Metropolitan Agency for Planning, Metropolitan Mayors Caucus, Metropolitan Planning Council, Progress Center for Independent Living, and the Regional Transportation Authority, who motivated such a study.

Conflicts of Interest

The authors declare no conflicts of interest.

Abbreviations

The following abbreviations are used in this manuscript:
ACSAmerican Community Survey
ADAAmericans with Disabilities Act
AIArtificial intelligence
EPAEnvironmental Protection Agency
GPSGlobal Positioning System
GSVGoogle Street View
IRRInter-rater reliability
LiDARLight Detection and Ranging
MHIMedian Household Income
OGDOpen government data
OSMOpenStreetMap
PPGISPublic Participation in Geographic Information Systems
PwDsPeople with disabilities
SVIStreet view imagery
VGIVolunteered Geographic Information

References

  1. Dadashova, B.; Park, E.S.; Mousavi, S.M.; Dai, B.; Sanders, R. Assessment of Inequity in Bicyclist Crashes Using Bivariate Bayesian Copulas. J. Saf. Res. 2022, 82, 221–232. [Google Scholar] [CrossRef] [PubMed]
  2. McAndrews, C.; Beyer, K.; Guse, C.; Layde, P. Linking Transportation and Population Health to Reduce Racial and Ethnic Disparities in Transportation Injury: Implications for Practice and Policy. Int. J. Sustain. Transp. 2017, 11, 197–205. [Google Scholar] [CrossRef]
  3. Eisenberg, Y.; Heider, A.; Gould, R.; Jones, R. Are Communities in the United States Planning for Pedestrians with Disabilities? Findings from a Systematic Evaluation of Local Government Barrier Removal Plans. Cities 2020, 102, 102720. [Google Scholar] [CrossRef]
  4. Froehlich, J.E.; Eisenberg, Y.; Hosseini, M.; Miranda, F.; Adams, M.; Caspi, A.; Dieterich, H.; Feldner, H.; Gonzalez, A.; De Gyves, C.; et al. The Future of Urban Accessibility for People with Disabilities: Data Collection, Analytics, Policy, and Tools. In ASSETS 2022—Proceedings of the 24th International ACM SIGACCESS Conference on Computers and Accessibility in Proceedings of the 24th International ACM SIGACCESS Conference on Computers and Accessibility, New York, NY, USA, 22 October 2022; Association for Computing Machinery: New York, NY, USA, 2022; pp. 1–8. [Google Scholar]
  5. Lee, E.H.; Jeong, J. Accessible Taxi Routing Strategy Based on Travel Behavior of People with Disabilities Incorporating Vehicle Routing Problem and Gaussian Mixture Model. Travel Behav. Soc. 2024, 34, 100687. [Google Scholar] [CrossRef]
  6. Levine, K.; Karner, A. Approaching Accessibility: Four Opportunities to Address the Needs of Disabled People in Transportation Planning in the United States. Transp. Policy 2023, 131, 66–74. [Google Scholar] [CrossRef]
  7. Soliz, A.; Carvalho, T.; Sarmiento-Casas, C.; Sánchez-Rodríguez, J.; El-Geneidy, A. Scaling up Active Transportation across North America: A Comparative Content Analysis of Policies through a Social Equity Framework. Transp. Res. Part A Policy Pract. 2023, 176, 103788. [Google Scholar] [CrossRef]
  8. Hwang, J. A Factor Analysis for Identifying People with Disabilities’ Mobility Issues in Built Environments. Transp. Res. Part F Traffic Psychol. Behav. 2022, 88, 122–131. [Google Scholar] [CrossRef]
  9. Jiang, Y.; Han, S.; Li, D.; Bai, Y.; Wang, M. Automatic Concrete Sidewalk Deficiency Detection and Mapping with Deep Learning. Expert Syst. Appl. 2022, 207, 117980. [Google Scholar] [CrossRef]
  10. Park, K.; Esfahani, H.N.; Novack, V.L.; Sheen, J.; Hadayeghi, H.; Song, Z.; Christensen, K. Impacts of Disability on Daily Travel Behaviour: A Systematic Review. Transp. Rev. 2023, 43, 178–203. [Google Scholar] [CrossRef]
  11. Schwartz, N.; Buliung, R.; Daniel, A.; Rothman, L. Disability and Pedestrian Road Traffic Injury: A Scoping Review. Health Place 2022, 77, 102896. [Google Scholar] [CrossRef]
  12. Eisenberg, Y.; Hofstra, A.; Berquist, S.; Gould, R.; Jones, R. Barrier-Removal Plans and Pedestrian Infrastructure Equity for People with Disabilities. Transp. Res. Part D Transp. Environ. 2022, 109, 103356. [Google Scholar] [CrossRef]
  13. Clarke, P.; Ailshire, J.A.; Bader, M.; Morenoff, J.D.; House, J.S. Mobility Disability and the Urban Built Environment. Am. J. Epidemiol. 2008, 168, 506–513. [Google Scholar] [CrossRef] [PubMed]
  14. Henly, M.; Brucker, D.L. Transportation Patterns Demonstrate Inequalities in Community Participation for Working-Age Americans with Disabilities. Transp. Res. Part A Policy Pract. 2019, 130, 93–106. [Google Scholar] [CrossRef]
  15. Project Civic Action Information and Technical Assistance on the Americans with Disabilities Act. Available online: https://archive.ada.gov/civicac.htm (accessed on 28 October 2023).
  16. Jackson, M.A. Models of Disability and Human Rights: Informing the Improvement of Built Environment Accessibility for People with Disability at Neighborhood Scale? Laws 2018, 7, 10. [Google Scholar] [CrossRef]
  17. Ai, C.; Tsai, Y. Automated Sidewalk Assessment Method for Americans with Disabilities Act Compliance Using Three-Dimensional Mobile Lidar. Transp. Res. Rec. 2016, 2542, 25–32. [Google Scholar] [CrossRef]
  18. Deitz, S.; Lobben, A.; Alferez, A. Squeaky Wheels: Missing Data, Disability, and Power in the Smart City. Big Data Soc. 2021, 8, 20539517211047735. [Google Scholar] [CrossRef]
  19. Rhoads, D.; Rames, C.; Solé-Ribalta, A.; González, M.C.; Szell, M.; Borge-Holthoefer, J. Sidewalk Networks: Review and Outlook. Comput. Environ. Urban Syst. 2023, 106, 102031. [Google Scholar] [CrossRef]
  20. Saha, M.; Saugstad, M.; Maddali, H.T.; Zeng, A.; Holland, R.; Bower, S.; Dash, A.; Chen, S.; Li, A.; Hara, K.; et al. Project Sidewalk: A Web-Based Crowdsourcing Tool for Collecting Sidewalk Accessibility Data At Scale. In CHI ‘19: Proceedings of the 2019 CHI Conference on Human Factors in Computing Systems, Proceedings of the 2019 CHI Conference on Human Factors in Computing Systems, New York, NY, USA, 2 May 2019; Association for Computing Machinery: New York, NY, USA, 2019; pp. 1–14. [Google Scholar]
  21. Hosseini, M.; Saugstad, M.; Miranda, F.; Sevtsuk, A.; Silva, C.T.; Froehlich, J.E. Towards Global-Scale Crowd+AI Techniques to Map and Assess Sidewalks for People with Disabilities. arXiv 2022, arXiv:2206.13677. [Google Scholar]
  22. Hamraie, A. Mapping Access: Digital Humanities, Disability Justice, and Sociospatial Practice. Am. Q. 2018, 70, 455–482. [Google Scholar] [CrossRef]
  23. Basiri, A.; Haklay, M.; Foody, G.; Mooney, P. Crowdsourced Geospatial Data Quality: Challenges and Future Directions. Int. J. Geogr. Inf. Sci. 2019, 33, 1588–1593. [Google Scholar] [CrossRef]
  24. Huang, X.; Wang, S.; Yang, D.; Hu, T.; Chen, M.; Zhang, M.; Zhang, G.; Biljecki, F.; Lu, T.; Zou, L.; et al. Crowdsourcing Geospatial Data for Earth and Human Observations: A Review. J. Remote Sens. 2024, 4, 0105. [Google Scholar] [CrossRef]
  25. Khan, Z.T.; Johnson, P.A. Citizen and Government Co-Production of Data: Analyzing the Challenges to Government Adoption of VGI. Can. Geogr. Géographies Can. 2020, 64, 374–387. [Google Scholar] [CrossRef]
  26. Lanza, G.; Pucci, P.; Carboni, L. Measuring Accessibility by Proximity for an Inclusive City. Cities 2023, 143, 104581. [Google Scholar] [CrossRef]
  27. Fonte, C.C.; Antoniou, V.; Bastin, L.; Estima, J.; Arsanjani, J.J.; Bayas, J.-C.L.; See, L.; Vatseva, R. Assessing VGI Data Quality. In Mapping and the Citizen Sensor; Fonte, C.C., Antoniou, V., See, L., Foody, G., Fritz, S., Mooney, P., Olteanu-Raimond, A.-M., Eds.; Ubiquity Press: London, UK, 2017; pp. 137–164. ISBN 978-1-911529-16-3. [Google Scholar]
  28. Radosevic, N.; Duckham, M.; Saiedur Rahaman, M.; Ho, S.; Williams, K.; Hashem, T.; Tao, Y. Spatial Data Trusts: An Emerging Governance Framework for Sharing Spatial Data. Int. J. Digit. Earth 2023, 16, 1607–1639. [Google Scholar] [CrossRef]
  29. Mirri, S.; Prandi, C.; Salomoni, P.; Callegati, F.; Campi, A. On Combining Crowdsourcing, Sensing and Open Data for an Accessible Smart City. In Proceedings of the 2014 Eighth International Conference on Next Generation Mobile Apps, Services and Technologies, Oxford, UK, 10–12 September 2014; pp. 294–299. [Google Scholar]
  30. Dorn, H.; Törnros, T.; Zipf, A. Quality Evaluation of VGI Using Authoritative Data—A Comparison with Land Use Data in Southern Germany. ISPRS Int. J. Geo Inf. 2015, 4, 1657–1671. [Google Scholar] [CrossRef]
  31. Koukoletsos, T.; Haklay, M.; Ellul, C. Assessing Data Completeness of VGI through an Automated Matching Procedure for Linear Data. Trans. GIS 2012, 16, 477–498. [Google Scholar] [CrossRef]
  32. Brovelli, M.A.; Minghini, M.; Molinari, M.; Mooney, P. Towards an Automated Comparison of OpenStreetMap with Authoritative Road Datasets. Trans. GIS 2017, 21, 191–206. [Google Scholar] [CrossRef]
  33. Haklay, M. How Good Is Volunteered Geographical Information? A Comparative Study of OpenStreetMap and Ordnance Survey Datasets. Environ. Plan. B Plan. Des. 2010, 37, 682–703. [Google Scholar] [CrossRef]
  34. Aghaabbasi, M.; Moeinaddini, M.; Shah, M.Z.; Asadi-Shekari, Z. Addressing Issues in the Use of Google Tools for Assessing Pedestrian Built Environments. J. Transp. Geogr. 2018, 73, 185–198. [Google Scholar] [CrossRef]
  35. Fox, E.H.; Chapman, J.E.; Moland, A.M.; Alfonsin, N.E.; Frank, L.D.; Sallis, J.F.; Conway, T.L.; Cain, K.L.; Geremia, C.; Cerin, E.; et al. International Evaluation of the Microscale Audit of Pedestrian Streetscapes (MAPS) Global Instrument: Comparative Assessment between Local and Remote Online Observers. Int. J. Behav. Nutr. Phys. Act. 2021, 18, 84. [Google Scholar] [CrossRef]
  36. Goel, R.; Garcia, L.M.T.; Goodman, A.; Johnson, R.; Aldred, R.; Murugesan, M.; Brage, S.; Bhalla, K.; Woodcock, J. Estimating City-Level Travel Patterns Using Street Imagery: A Case Study of Using Google Street View in Britain. PLoS ONE 2018, 13, e0196521. [Google Scholar] [CrossRef]
  37. Google Google Maps 101: How Imagery Powers Our Map. Available online: https://blog.google/products/maps/google-maps-101-how-imagery-powers-our-map/ (accessed on 30 August 2023).
  38. Hou, Y.; Quintana, M.; Khomiakov, M.; Yap, W.; Ouyang, J.; Ito, K.; Wang, Z.; Zhao, T.; Biljecki, F. Global Streetscapes—A Comprehensive Dataset of 10 Million Street-Level Images across 688 Cities for Urban Science and Analytics. ISPRS J. Photogramm. Remote Sens. 2024, 215, 216–238. [Google Scholar] [CrossRef]
  39. Biljecki, F.; Ito, K. Street View Imagery in Urban Analytics and GIS: A Review. Landsc. Urban Plan. 2021, 215, 104217. [Google Scholar] [CrossRef]
  40. Badland, H.M.; Opit, S.; Witten, K.; Kearns, R.A.; Mavoa, S. Can Virtual Streetscape Audits Reliably Replace Physical Streetscape Audits? J. Urban Health 2010, 87, 1007–1016. [Google Scholar] [CrossRef]
  41. Sharif, A.; Gopal, P.; Saugstad, M.; Bhatt, S.; Fok, R.; Weld, G.; Asher Mankoff Dey, K.; Froehlich, J.E. Experimental Crowd+AI Approaches to Track Accessibility Features in Sidewalk Intersections Over Time. In Proceedings of the 23rd International ACM SIGACCESS Conference on Computers and Accessibility, ACM Virtual Event, 17 October 2021; pp. 1–5. [Google Scholar]
  42. Hanibuchi, T.; Nakaya, T.; Inoue, S. Virtual Audits of Streetscapes by Crowdworkers. Health Place 2019, 59, 102203. [Google Scholar] [CrossRef]
  43. Pliakas, T.; Hawkesworth, S.; Silverwood, R.J.; Nanchahal, K.; Grundy, C.; Armstrong, B.; Casas, J.P.; Morris, R.W.; Wilkinson, P.; Lock, K. Optimising Measurement of Health-Related Characteristics of the Built Environment: Comparing Data Collected by Foot-Based Street Audits, Virtual Street Audits and Routine Secondary Data Sources. Health Place 2017, 43, 75–84. [Google Scholar] [CrossRef] [PubMed]
  44. Bromm, K.N.; Lang, I.-M.; Twardzik, E.E.; Antonakos, C.L.; Dubowitz, T.; Colabianchi, N. Virtual Audits of the Urban Streetscape: Comparing the Inter-Rater Reliability of GigaPan® to Google Street View. Int. J. Health Geogr. 2020, 19, 31. [Google Scholar] [CrossRef]
  45. Cain, K.L.; Gavand, K.A.; Conway, T.L.; Geremia, C.M.; Millstein, R.A.; Frank, L.D.; Saelens, B.E.; Adams, M.A.; Glanz, K.; King, A.C.; et al. Developing and Validating an Abbreviated Version of the Microscale Audit for Pedestrian Streetscapes (MAPS-Abbreviated). J. Transp. Health 2017, 5, 84–96. [Google Scholar] [CrossRef]
  46. Cain, K.L.; Geremia, C.M.; Conway, T.L.; Frank, L.D.; Chapman, J.E.; Fox, E.H.; Timperio, A.; Veitch, J.; Van Dyck, D.; Verhoeven, H.; et al. Development and Reliability of a Streetscape Observation Instrument for International Use: MAPS-Global. Int. J. Behav. Nutr. Phys. Act. 2018, 15, 19. [Google Scholar] [CrossRef]
  47. Phillips, C.B.; Engelberg, J.K.; Geremia, C.M.; Zhu, W.; Kurka, J.M.; Cain, K.L.; Sallis, J.F.; Conway, T.L.; Adams, M.A. Online versus In-Person Comparison of Microscale Audit of Pedestrian Streetscapes (MAPS) Assessments: Reliability of Alternate Methods. Int. J. Health Geogr. 2017, 16, 27. [Google Scholar] [CrossRef]
  48. Queralt, A.; Molina-García, J.; Terrón-Pérez, M.; Cerin, E.; Barnett, A.; Timperio, A.; Veitch, J.; Reis, R.; Silva, A.A.P.; Ghekiere, A.; et al. Reliability of Streetscape Audits Comparing On-street and Online Observations: MAPS-Global in 5 Countries. Int. J. Health Geogr. 2021, 20, 6. [Google Scholar] [CrossRef] [PubMed]
  49. Bartzokas-Tsiompras, A.; Bakogiannis, E.; Nikitas, A. Global Microscale Walkability Ratings and Rankings: A Novel Composite Indicator for 59 European City Centres. J. Transp. Geogr. 2023, 111, 103645. [Google Scholar] [CrossRef]
  50. Kurka, J.M.; Adams, M.A.; Geremia, C.; Zhu, W.; Cain, K.L.; Conway, T.L.; Sallis, J.F. Comparison of Field and Online Observations for Measuring Land Uses Using the Microscale Audit of Pedestrian Streetscapes (MAPS). J. Transp. Health 2016, 3, 278–286. [Google Scholar] [CrossRef]
  51. Vanwolleghem, G.; Ghekiere, A.; Cardon, G.; De Bourdeaudhuij, I.; D’Haese, S.; Geremia, C.M.; Lenoir, M.; Sallis, J.F.; Verhoeven, H.; Van Dyck, D. Using an Audit Tool (MAPS Global) to Assess the Characteristics of the Physical Environment Related to Walking for Transport in Youth: Reliability of Belgian Data. Int. J. Health Geogr. 2016, 15, 41. [Google Scholar] [CrossRef] [PubMed]
  52. Zhu, W.; Sun, Y.; Kurka, J.; Geremia, C.; Engelberg, J.K.; Cain, K.; Conway, T.; Sallis, J.F.; Hooker, S.P.; Adams, M.A. Reliability between Online Raters with Varying Familiarities of a Region: Microscale Audit of Pedestrian Streetscapes (MAPS). Landsc. Urban Plan. 2017, 167, 240–248. [Google Scholar] [CrossRef] [PubMed]
  53. Hamim, O.F.; Kancharla, S.R.; Ukkusuri, S.V. Mapping Sidewalks on a Neighborhood Scale from Street View Images. Environ. Plan. B Urban Anal. City Sci. 2024, 51, 823–838. [Google Scholar] [CrossRef]
  54. Hosseini, M.; Sevtsuk, A.; Miranda, F.; Cesar, R.M.; Silva, C.T. Mapping the Walk: A Scalable Computer Vision Approach for Generating Sidewalk Network Datasets from Aerial Imagery. Comput. Environ. Urban Syst. 2023, 101, 101950. [Google Scholar] [CrossRef]
  55. Hou, Q.; Ai, C. A Network-Level Sidewalk Inventory Method Using Mobile LiDAR and Deep Learning. Transp. Res. Part C Emerg. Technol. 2020, 119, 102772. [Google Scholar] [CrossRef]
  56. Ning, H.; Li, Z.; Wang, C.; Hodgson, M.E.; Huang, X.; Li, X. Converting Street View Images to Land Cover Maps for Metric Mapping: A Case Study on Sidewalk Network Extraction for the Wheelchair Users. Comput. Environ. Urban Syst. 2022, 95, 101808. [Google Scholar] [CrossRef]
  57. Ning, H.; Ye, X.; Chen, Z.; Liu, T.; Cao, T. Sidewalk Extraction Using Aerial and Street View Images. Environ. Plan. B Urban Anal. City Sci. 2022, 49, 7–22. [Google Scholar] [CrossRef]
  58. Li, M.; Sheng, H.; Irvin, J.; Chung, H.; Ying, A.; Sun, T.; Ng, A.Y.; Rodriguez, D.A. Marked Crosswalks in US Transit-Oriented Station Areas, 2007–2020: A Computer Vision Approach Using Street View Imagery. Environ. Plan. B Urban Anal. City Sci. 2023, 50, 350–369. [Google Scholar] [CrossRef]
  59. Moran, M.E. Where the Crosswalk Ends: Mapping Crosswalk Coverage via Satellite Imagery in San Francisco. Environ. Plan. B Urban Anal. City Sci. 2022, 49, 2250–2266. [Google Scholar] [CrossRef]
  60. Deitz, S. Outlier Bias: AI Classification of Curb Ramps, Outliers, and Context. Big Data Soc. 2023, 10, 20539517231203669. [Google Scholar] [CrossRef]
  61. Hara, K.; Sun, J.; Moore, R.; Jacobs, D.; Froehlich, J. Tohme: Detecting Curb Ramps in Google Street View Using Crowdsourcing, Computer Vision, and Machine Learning. In UIST ‘14: Proceedings of the 27th Annual ACM Symposium on User Interface Software and Technology, Proceedings of the 27th annual ACM Symposium on User Interface Software and Technology, New York, NY, USA, 5 October 2014; Association for Computing Machinery: New York, NY, USA, 2014; pp. 189–204. [Google Scholar]
  62. Hosseini, M.; Miranda, F.; Lin, J.; Silva, C.T. CitySurfaces: City-Scale Semantic Segmentation of Sidewalk Materials. Sustain. Cities Soc. 2022, 79, 103630. [Google Scholar] [CrossRef]
  63. Huang, X.; Wang, S.; Lu, T.; Liu, Y.; Serrano-Estrada, L. Crowdsourced Geospatial Data Is Reshaping Urban Sciences. Int. J. Appl. Earth Obs. Geoinf. 2024, 127, 103687. [Google Scholar] [CrossRef]
  64. See, L.; Estima, J.; Pődör, A.; Arsanjani, J.J.; Bayas, J.-C.L.; Vatseva, R. Sources of VGI for Mapping. In Mapping and the Citizen Sensor; See, L., Foody, G., Fritz, S., Mooney, P., Olteanu-Raimond, A.-M., Fonte, C.C., Antoniou, V., Eds.; Ubiquity Press: London, UK, 2017; pp. 13–36. ISBN 978-1-911529-16-3. [Google Scholar]
  65. Goodchild, M.F. Citizens as Sensors: The World of Volunteered Geography. GeoJournal 2007, 69, 211–221. [Google Scholar] [CrossRef]
  66. Granell, C.; Ostermann, F.O. Beyond Data Collection: Objectives and Methods of Research Using VGI and Geo-Social Media for Disaster Management. Comput. Environ. Urban Syst. 2016, 59, 231–243. [Google Scholar] [CrossRef]
  67. Mukherjee, F. Public Participatory GIS. Geogr. Compass 2015, 9, 384–394. [Google Scholar] [CrossRef]
  68. Tulloch, D. Public Participation GIS (PPGIS). In Encyclopedia of Geographic Information Science; SAGE Publications, Inc.: Thousand Oaks, CA, USA, 2008; pp. 352–354. [Google Scholar]
  69. Verplanke, J.; McCall, M.K.; Uberhuaga, C.; Rambaldi, G.; Haklay, M. A Shared Perspective for PGIS and VGI. Cartogr. J. 2016, 53, 308–317. [Google Scholar] [CrossRef]
  70. Ceccaroni, L.; Piera, J. Analyzing the Role of Citizen Science in Modern Research; Advances in Knowledge Acquisition, Transfer, and Management (AKATM) Book Series; Information Science Reference: Hershey, PA, USA, 2017; ISBN 978-1-5225-0962-2. [Google Scholar]
  71. Haklay, M. Citizen Science and Volunteered Geographic Information: Overview and Typology of Participation. In Crowdsourcing Geographic Knowledge: Volunteered Geographic Information (VGI) in Theory and Practice; Sui, D., Elwood, S., Goodchild, M., Eds.; Springer: Dordrecht, The Netherlands, 2013; pp. 105–122. ISBN 978-94-007-4587-2. [Google Scholar]
  72. Heipke, C. Crowdsourcing Geospatial Data. ISPRS J. Photogramm. Remote Sens. 2010, 65, 550–557. [Google Scholar] [CrossRef]
  73. Ferster, C.; Fischer, J.; Manaugh, K.; Nelson, T.; Winters, M. Using OpenStreetMap to Inventory Bicycle Infrastructure: A Comparison with Open Data from Cities. Int. J. Sustain. Transp. 2020, 14, 64–73. [Google Scholar] [CrossRef]
  74. Prandi, C.; Salomoni, P.; Mirri, S. mPASS: Integrating People Sensing and Crowdsourcing to Map Urban Accessibility. In Proceedings of the 2014 IEEE 11th Consumer Communications and Networking Conference (CCNC), Las Vegas, NV, USA, 10–13 January 2014; pp. 591–595. [Google Scholar]
  75. Gullón, P.; Badland, H.M.; Alfayate, S.; Bilal, U.; Escobar, F.; Cebrecos, A.; Diez, J.; Franco, M. Assessing Walking and Cycling Environments in the Streets of Madrid: Comparing On-Field and Virtual Audits. J. Urban Health 2015, 92, 923–939. [Google Scholar] [CrossRef] [PubMed]
  76. Mobasheri, A.; Deister, J.; Dieterich, H. Wheelmap: The Wheelchair Accessibility Crowdsourcing Platform. Open Geospat. Data Softw. Stand. 2017, 2, 27. [Google Scholar] [CrossRef]
  77. Ding, X.; Fan, H.; Gong, J. Towards Generating Network of Bikeways from Mapillary Data. Comput. Environ. Urban Syst. 2021, 88, 101632. [Google Scholar] [CrossRef]
  78. Mahabir, R.; Schuchard, R.; Crooks, A.; Croitoru, A.; Stefanidis, A. Crowdsourcing Street View Imagery: A Comparison of Mapillary and OpenStreetCam. ISPRS Int. J. Geo. Inf. 2020, 9, 341. [Google Scholar] [CrossRef]
  79. Danish, M.; Labib, S.M.; Ricker, B.; Helbich, M. A Citizen Science Toolkit to Collect Human Perceptions of Urban Environments Using Open Street View Images. Comput. Environ. Urban Syst. 2025, 116, 102207. [Google Scholar] [CrossRef]
  80. Xu, L.; Kwan, M.-P.; McLafferty, S.; Wang, S. Predicting Demand for 311 Non-Emergency Municipal Services: An Adaptive Space-Time Kernel Approach. Appl. Geogr. 2017, 89, 133–141. [Google Scholar] [CrossRef]
  81. Schiff, K.J. Does Collective Citizen Input Impact Government Service Provision? Evidence from SeeClickFix Requests. Public Adm. Rev. 2025, 85, 32–45. [Google Scholar] [CrossRef]
  82. Hara, K.; Le, V.; Froehlich, J. Combining Crowdsourcing and Google Street View to Identify Street-Level Accessibility Problems. In CHI ‘13: Proceedings of the SIGCHI Conference on Human Factors in Computing Systems, Proceedings of the SIGCHI Conference on Human Factors in Computing Systems, Paris, France, 27 April 2013; ACM: Paris, France, 2013; pp. 631–640. [Google Scholar]
  83. Senaratne, H.; Mobasheri, A.; Ali, A.L.; Capineri, C.; Haklay, M. A Review of Volunteered Geographic Information Quality Assessment Methods. Int. J. Geogr. Inf. Sci. 2017, 31, 139–167. [Google Scholar] [CrossRef]
  84. Blatt, A.J. Data Privacy and Ethical Uses of Volunteered Geographic Information. In Health, Science, and Place: A New Model; Blatt, A.J., Ed.; Geotechnologies and the Environment; Springer International Publishing: Cham, Switzerland, 2015; pp. 49–59. ISBN 978-3-319-12003-4. [Google Scholar]
  85. Janssen, M.; Charalabidis, Y.; Zuiderwijk, A. Benefits, Adoption Barriers and Myths of Open Data and Open Government. Inf. Syst. Manag. 2012, 29, 258–268. [Google Scholar] [CrossRef]
  86. Zuiderwijk, A.; Janssen, M. Barriers and Development Directions for the Publication and Usage of Open Data: A Socio-Technical View. In Open Government: Opportunities and Challenges for Public Governance; Gascó-Hernández, M., Ed.; Public Administration and Information Technology; Springer: New York, NY, USA, 2014; pp. 115–135. ISBN 978-1-4614-9563-5. [Google Scholar]
  87. Labbé, D.; Eisenberg, Y.; Snyder, D.; Shanley, J.; Hammel, J.M.; Froehlich, J.E. Multiple-Stakeholder Perspectives on Accessibility Data and the Use of Socio-Technical Tools to Improve Sidewalk Accessibility. Disabilities 2023, 3, 621–638. [Google Scholar] [CrossRef]
  88. Weld, G.; Jang, E.; Li, A.; Zeng, A.; Heimerl, K.; Froehlich, J.E. Deep Learning for Automatically Detecting Sidewalk Accessibility Problems Using Streetscape Imagery. In ASSETS ‘19: Proceedings of the 21st International ACM SIGACCESS Conference on Computers and Accessibility, Proceedings of the 21st International ACM SIGACCESS Conference on Computers and Accessibility, New York, NY, USA, 24 October 2019; Association for Computing Machinery: New York, NY, USA, 2019; pp. 196–209. [Google Scholar]
  89. U.S. Department of Justice 2010 ADA Standards for Accessible Design. Available online: https://www.ada.gov/law-and-regs/design-standards/2010-stds/ (accessed on 4 May 2023).
  90. Difallah, D.E.; Demartini, G.; Cudré-Mauroux, P. Pick-a-Crowd: Tell Me What You Like, and I’ll Tell You What to Do. In WWW ‘13 Companion: Proceedings of the 22nd International Conference on World Wide Web, Proceedings of the 22nd International Conference on World Wide Web, New York, NY, USA, 13 May 2013; Association for Computing Machinery: New York, NY, USA, 2013; pp. 367–374. [Google Scholar]
  91. Hansen, D.L.; Schone, P.J.; Corey, D.; Reid, M.; Gehring, J. Quality Control Mechanisms for Crowdsourcing: Peer Review, Arbitration, & Expertise at Familysearch Indexing. In CSCW ‘13: Proceedings of the 2013 Conference on Computer Supported Cooperative Work Companion, Proceedings of the 2013 Conference on Computer Supported Cooperative Work, New York, NY, USA, 23 February 2013; Association for Computing Machinery: New York, NY, USA, 2013; pp. 649–660. [Google Scholar]
  92. Li, C.; Zhang, Z.; Saugstad, M.; Safranchik, E.; Kulkarni, C.; Huang, X.; Patel, S.; Iyer, V.; Althoff, T.; Froehlich, J.E. LabelAId: Just-in-Time AI Interventions for Improving Human Labeling Quality and Domain Knowledge in Crowdsourcing Systems. In CHI ‘24: Proceedings of the 2024 CHI Conference on Human Factors in Computing Systems, Proceedings of the CHI Conference on Human Factors in Computing Systems, New York, NY, USA, 11 May 2024; Association for Computing Machinery: New York, NY, USA, 2024; pp. 1–21. [Google Scholar]
  93. Froehlich, J.E. Live Project Sidewalk Stats. Available online: https://observablehq.com/@jonfroehlich/live-project-sidewalk-stats (accessed on 1 April 2025).
  94. Saha, M.; Chauhan, D.; Patil, S.; Kangas, R.; Heer, J.; Froehlich, J.E. Urban Accessibility as a Socio-Political Problem: A Multi-Stakeholder Analysis. Proc. ACM Hum. Comput. Interact. 2021, 4, 1–26. [Google Scholar] [CrossRef]
  95. City of Seattle Seattle City GIS Open Data: Transportation Datasets. Available online: https://data-seattlecitygis.opendata.arcgis.com/search?tags=transportation (accessed on 1 August 2023).
  96. EPA. Smart Location Mapping. U.S. Environmental Protection Agency. 2023. Available online: https://www.epa.gov/smartgrowth/smart-location-mapping (accessed on 8 November 2023).
  97. Pew Research Center. Trends in Income and Wealth Inequality. Pew Research Center’s Social & Demographic Trends Project 2020; Pew Research Center: Washington, DC, USA, 2020. [Google Scholar]
  98. Krippendorff, K. Content Analysis: An Introduction to Its Methodology, 4th ed.; SAGE Publications, Inc.: Thousand Oaks, CA, USA, 2018; ISBN 978-1-5063-9566-1. [Google Scholar]
  99. Foody, G.; Long, G.; Schultz, M.; Olteanu-Raimond, A.-M. Assuring the Quality of VGI on Land Use and Land Cover: Experiences and Learnings from the LandSense Project. Geo-Spat. Inf. Sci. 2024, 27, 16–37. [Google Scholar] [CrossRef]
  100. Rice, R.M.; Aburizaiza, A.O.; Rice, M.T.; Qin, H. Position Validation in Crowdsourced Accessibility Mapping. Cartographica 2016, 51, 55–66. [Google Scholar] [CrossRef]
  101. Bolten, N.; Amini, A.; Hao, Y.; Ravichandran, V.; Stephens, A.; Caspi, A. Urban Sidewalks: Visualization and Routing for Individuals with Limited Mobility. In Proceedings of the 1st International ACM SIGSPATIAL Workshop on Smart Cities and Urban Analytics, Seatle, WA, USA, 3 November 2015; pp. 122–125. [Google Scholar]
  102. NC-BPAID National Collaboration on Bike, Pedestrian, and Accessibility Infrastructure Data. Available online: https://github.com/dotbts/BPA (accessed on 15 December 2024).
  103. Dai, S.; Li, Y.; Stein, A.; Yang, S.; Jia, P. Street View Imagery-Based Built Environment Auditing Tools: A Systematic Review. Int. J. Geogr. Inf. Sci. 2024, 38, 1136–1157. [Google Scholar] [CrossRef]
  104. Liu, X.; Wu, K.; Kulkarni, M.; Saugstad, M.; Rapo, P.A.; Freiburger, J.; Hosseini, M.; Li, C.; Froehlich, J.E. Towards Fine-Grained Sidewalk Accessibility Assessment with Deep Learning: Initial Benchmarks and an Open Dataset. In Proceedings of the Proceedings of the 26th International ACM SIGACCESS Conference on Computers and Accessibility, Association for Computing Machinery, New York, NY, USA, 27 October 2024; pp. 1–12. [Google Scholar]
  105. Ponti, M.; Seredko, A. Human-Machine-Learning Integration and Task Allocation in Citizen Science. Humanit. Soc. Sci. Commun. 2022, 9, 1–15. [Google Scholar] [CrossRef]
Figure 1. Project Sidewalk labeling interface.
Urbansci 09 00130 g001
Figure 2. Project Sidewalk label types.
Urbansci 09 00130 g002
Figure 3. Examples of Project Sidewalk severity ratings for surface problems. Severity 5 is the most severe, indicating a scenario impassable by wheelchair users.
Urbansci 09 00130 g003
Figure 4. Project Sidewalk validation interface.
Urbansci 09 00130 g004
Figure 5. A sample illustrating the positional accuracy of features in the Project Sidewalk data with government data for curb ramp labels.
Urbansci 09 00130 g005
Figure 6. An example of modifications made in Seattle where an elevated highway was removed.
Urbansci 09 00130 g006
Figure 7. An example of a curb ramp in Seattle that is classified as shared (serving both directions of the pedestrian movement) in the government data.
Urbansci 09 00130 g007
Table 1. Distribution of study sample areas by Median Household Income and Walkability Score.
Walkability Score 1Median Household Income 2
Low
USD 40,100 or Less
Medium
USD 40,100–USD 120,400
High
USD 120,400 or More
Low (5.76–10.5)132
Medium (10.51–15.25)132
High (15.26–20)132
1 The data source for the walkability score was the EPA Walkability Index; 2 the data on the Median Household Income came from the 2018 American Community Survey, 5-Year Estimates.
Table 2. Inter-rater reliability (Krippendorff’s alpha value).
Label TypeRound OneRound TwoRound Three
SeattleCook/DuPageTotalSeattleDuPageTotalSeattleDuPageTotal
Curb Ramps0.8270.9270.8880.9390.9340.937N/AN/AN/A
Missing Curb Ramps0.875N/AN/A0.7410.6660.749N/AN/AN/A
Surface Problems/Obstacles0.4400.5650.5230.5280.5980.5820.6610.7010.694
No Sidewalk0.6830.6630.6900.8780.7340.785N/AN/AN/A
Crosswalk0.8530.9460.9100.9410.9220.931N/AN/AN/A
Pedestrian Signal0.4540.8180.6970.5410.9900.835N/AN/AN/A
Table 3. Agreement rates between Project Sidewalk and government data.
Label TypeSeattleDuPage
N *% Agreement Presence% Agreement SeverityN% Agreement
Presence
% Agreement Severity
Curb Ramp19389.963.89393.520.8
Obstacles and Surface Problems431 i90.881.6273100 ii46.1
No Sidewalk23898.7n/a178100n/a
Crosswalk4481.881.1n/an/an/a
Pedestrian Signal2075n/an/an/an/a
Note: * number of paired clusters; i number of sidewalk segments: 87; ii number of sidewalk segments: 13.
Disclaimer/Publisher’s Note: The statements, opinions and data contained in all publications are solely those of the individual author(s) and contributor(s) and not of MDPI and/or the editor(s). MDPI and/or the editor(s) disclaim responsibility for any injury to people or property resulting from any ideas, methods, instructions or products referred to in the content.

