Article

Development Coordination of Chinese Megacities Using the Node–Place–Value Model: A Case Study of Changsha

School of Architecture and Design, Beijing Jiaotong University, Beijing 100044, China
*
Author to whom correspondence should be addressed.
Urban Sci. 2025, 9(4), 121; https://doi.org/10.3390/urbansci9040121
Submission received: 16 December 2024 / Revised: 18 February 2025 / Accepted: 21 February 2025 / Published: 14 April 2025

Abstract

With the acceleration of urbanization, urban regeneration has become a critical strategy for megacities to address spatial fragmentation and inefficient resource allocation. However, the mismatch between transportation nodes and land development potential remains a key barrier to sustainable urban renewal. This research takes the urban renewal areas in Changsha as a typical case. Based on the “Node–Place–Value” (NPV) model, a multi-dimensional evaluation system was constructed. Through multiple empirical analysis methods such as spatial data analysis, field research, and economic indicator evaluation, this study deeply explores how this evaluation system provides a theoretical and data basis for detailed planning and further provides guidance for meeting the needs of urban renewal. Through the empirical analysis of the urban renewal areas in Changsha, this study quantifies the matching relationship among transportation nodes, land use, and economic value and reveals the current imbalance issues of these elements in the areas. For example, there is a common mismatch between the functions of transportation nodes and the potential of land development. Specifically, the land use in transportation hub areas fails to fully utilize their transportation advantages, resulting in the waste of transportation resources and low economic benefits. The results reveal significant imbalances in the following areas: Transportation–Land Mismatch: High-accessibility areas (e.g., Martyrs’ Park and Railway Station ) exhibit underdeveloped land use and low economic conversion efficiency. Peripheral Lag: Remote areas (e.g., Wang Xin and Sunshine 100 ) lack both transportation infrastructure and land development potential, leading to resource waste. Value Dimension Impact: The added “value” dimension highlights thatareas with cultural assets (e.g., Martyrs’ Park) achieve higher comprehensive scores despite spatial constraints. The findings of this study not only provide a scientific basis for urban renewal in Changsha but also offer crucial theoretical support and practical references for other megacities in China to address similar issues and achieve sustainable development.

1. Introduction

In the past few decades, China’s rapid urbanization process has driven the rapid expansion of large and medium-sized cities. Meanwhile, it has also brought a series of problems such as scarce land resources, over-burdened infrastructure, and insufficient spatial utilization efficiency. To address these challenges, urban renewal has gradually become a core means of optimizing urban spatial layout, improving land-use efficiency, and enhancing economic vitality. Urban renewal not only helps to improve the urban environment and infrastructure but also promotes industrial restructuring and economic transformation. It plays a crucial strategic role, especially in the sustainable development of megacities.
As a typical megacity in Central China, Changsha faces the dual pressures of rapid expansion and tight resources. Its “district-based promotion” strategy, through renewal plans for each district, aims to promote the efficient integration of resources within the region and drive the balanced and sustainable development of the entire city. This renewal model is highly representative in China. It not only provides important practical references for policymakers but also offers valuable cases for academic research on urban renewal.
At the theoretical level, this study introduces the “Node–Place–Value” (NPV) model to systematically evaluate the dynamic coordination among transportation nodes, land-use functions, and economic value. The NPV model is an extension of the “Node–Place” (NP) model proposed by Bertolini [1], which was initially used to analyze the compatibility between the accessibility of transportation nodes and the surrounding land functions. With further research, the NP model has been gradually applied to fields such as urban planning, land management, and real-estate development. However, its static compatibility analysis has limitations in the complex context of urban renewal as it cannot fully assess the impact of regional economic and social values. Therefore, this study incorporates the “value” dimension into the NP model, constructing the NPV model to more comprehensively reflect and analyze the interactions among transportation, land, and economic resources in urban renewalareas. This provides empirical support for scientifically informed urban renewal planning.
This study focuses on Chinese megacities. The core question is as follows: How does one achieve the coordinated development of transportation nodes, land functions, and economic values through the NPV model during the renewal process of megacities? Taking Changsha as a typical case, we hypothesize that the added “value” dimension will enable the NPV model to more effectively evaluate the resource matching situation and reveal the development potential and imbalances of different areas. By analyzing the empirical data of nine typical renewal areas in Changsha, it is expected that the NPV model can provide data support for the renewal decisions of megacities, optimize resource allocation, enhance the functional coordination of areas, and further provide a scientific basis for formulating sustainable urban renewal strategies for other megacities in China.

2. Related Work

2.1. Study of the NP Model

The node–place model (Figure 1), proposed by Bertolini [1], suggests that the higher the accessibility of a regional transport node, the higher the value of the place function. The enhancement of place function will increase transport demand, which in turn will drive infrastructure development. The NP model assesses regional synergy through the relationship between node performance and place performance [2].
After combing through the references at home and abroad and referring to the research results of domestic scholars, some scholars tend to take a global and interdisciplinary approach in dealing with the problems related to megacity development, covering urban planning, economy, society, and environment, and focusing on empirical research; some other scholars focus on quantitative analysis, and the focus of the research tends to be on the topics such as economic growth and urban scale expansion. Other scholars focus on quantitative analyses, often concentrating on topics such as economic growth and urban expansion. For example, some researchers have explored this issue in depth in Shenzhen and applied the extended node–place model. Their study reveals the significant coordination between land use and transport in Shenzhen, points out that this coordination varies among different regions, and proposes urban development strategies that adapt to the characteristics of different regions [3]. Some research teams have adopted the index system of NP model for quantitative research. For Guangzhou City, the researchers used the node–place model to explore the interrelationship between the layout of the urban transport network and the spatial structure, which provided quantitative reference data for local transport and urban planning [4] Later, the limitations of the NP model were optimized and not only limited to public transport hub areas; many scholars derived or specialized various applications of the node–place model, which was also widely used in urban planning, land-use planning, transport planning, real estate and other fields, and the number of empirical studies grew rapidly [5,6]. In a study in Beijing, researchers extended the model and optimized the indicator system by taking into account the local situation, thus analyzing the evolutionary trend and future development of urban space and providing strong decision-making support for urban planning and construction in Beijing. In a case study in Shanghai, the researchers conducted a comprehensive analysis of urban spatial quality and residents’ quality of life by adding these new indicators, which provided new insights for urban planning and construction.
In particular, the work of van der Krabben and van Rooden [7] (of Buck Consultant International (Figure 2), who explored in depth the application of this model to the valuation of property markets [8], was the first time that the node–place model was applied in the field of property development and is a pioneering attempt. Their study focused on how to predict changes in (office) property values by improving accessibility. The study assesses the accessibility of an area by analyzing road and rail connections, train frequency, and airport proximity and assesses the node value accordingly. Place value is then measured through market rents and existing and potential property conditions. It was expected that the study would result in a decrease in its impact on place value as node value increases, however, the results of the study showed that the model was unable to accurately predict changes in property values as a result of improved transport connectivity [7]. However, as Debrezion Andom pointed out in his 2006 study, although the Barker International Consultants study provided some valuable insights, there were some limitations in predicting the impact of improved accessibility on property values [9,10]. He argued that the impact of raising node values decreases as place values increase, which could lead to a reduction in the reliability of the model in predicting property values. However, he also emphasized that the results of this study are very encouraging for continuing to engage in new research based on a larger database. His study provides us with more ideas and directions for improvement, which will help us to better understand and apply the node–place model [8,9].
In conclusion, although there are differences in the theoretical focus and research methodology of megacity development between domestic and foreign studies, these differences also provide rich insights for this study. Combining international perspectives and local practices to promote innovation in theory and methodology has become an important direction for this study. Since the specific conditions of each country and city are different, the application of the node–place model needs to be adjusted and optimized according to the specific conditions [10,11]. Through the analysis, domestic research can draw on the diversity of data and the comprehensive application of the mindset of foreign countries, which can provide richer and more accurate information for the multidimensional analysis of megacity development, in order to promote the improvement of the overall coordination of the city. Therefore, this study suggests enhancing the integration and analysis capabilities of domestic and foreign data resources, especially the application of big data.

2.2. Extensions to the NP Model

In recent years, some studies have also made innovative improvements to the indicator system of the original NP model by adding a third dimension while retaining the original NP model, especially in the area of land value and real estate. Lund [12] found that residential property values near transport nodes are usually enhanced by introducing the real-estate market impact dimension, which is closely related to the accessibility of transport and the attractiveness of the region [10]. Some scholars have explored the enhancement of the node-place model for better understanding of urban spatial development. Debrezion, Pels and Rietveld [9] explored the enhancement of the value of residential and commercial properties in the neighborhood by railway stations, put forward the necessity of adding a land value enhancement dimension in the NP model, and found that transport nodes can significantly enhance the market value of the land in the neighborhood, which promotes the development of the regional economy. McDonald and Osuji [13] analyzed the impact of expected transport improvements on residential land values by introducing the interactive dimension of land use and house prices, and the results showed that transport improvements are expected to lead to an early increase in the value of surrounding residential land, reflecting the market’s expected response to future convenience [13]. Cervero and Duncan [14] investigated the impact of proximity to railways on the value of residential and commercial property markets and proposed the idea of adding the dimension of commercial property value in the NP model, and the study showed that not only does the value of residential property increase in areas close to railways, but the market attractiveness of commercial property is also significantly enhanced [14]. Bowes and Ihlanfeldt [15] explored the long-term impact of transport nodes on changes in the value of surrounding land through a time-series analysis, and the study showed that the existence and development has a long-term and continuous impact on the surrounding land value [15].
Thus, through the principle of NP model, the text tries to introduce the dimension of “value”, including economic value, social value, and cultural value, which enriches the value connotation of the above literature and improves the diversity and wholeness of the research indicators. The value dimension can be regarded as an extension of the node and place dimensions, and this study believes that it is also an important indicator for evaluating the overall coordinated development of the region. Therefore, the node–place–value model is formed.

3. Research Methodology

This study utilizes a wide range of data sources encompassing the three dimensions of transportation nodes, land-use functions, and economic and social value to support the comprehensive analysis enabled by the “Node–Place–Value” (NPV) model. The specific data sources are as follows:

3.1. Data Sources

1.
Transportation Node Data
Transportation node data are used to assess the distribution, connectivity, and traffic flow of major transportation hubs within theareas. The data sources include the following:
Real-time Traffic Flow Data: Dynamic information on daily passenger flows and peak traffic periods at metro stations and bus hubs is obtained through platforms such as Baidu Maps, providing insights into the intensity of transportation node usage [12,16].
Transportation Planning Reports: The latest transportation planning reports published by Changsha’s transportation authorities offer detailed information on metro lines, bus networks, and the layout of transportation hubs, aiding in understanding the connectivity of transportation nodes with surrounding areas [10,17].
Gaode Map POI Data: Point-of-interest (POI) data from Gaode Maps provide geographic locations and coverage radii of transportation nodes, supporting spatial analyses of the compatibility between transportation nodes and surrounding land functions [16,17].
2.
Land-Use Function Data
Land-use data are essential for analyzing land-use types, functional diversity, and other attributes within theareas. The data sources include the following:
Urban Planning Documents and Construction Bureau Data: Urban planning documents released by the Changsha Housing and Urban–Rural Development Bureau detail land-use zoning and specific purposes (e.g., commercial, residential, industrial, and public services) within theareas.
GIS and AI Technologies: Spatial analyses conducted using ArcGIS software measure building density, green coverage ratios, and land development intensity. Additionally, big data and AI technologies capture dynamic changes in land use, enhancing data accuracy [17].
POI Data: Data from Gaode Maps provide distributions of commercial, residential, and public service facilities within theareas, including schools, hospitals, and shopping centers, supporting analyses of functional diversity and service facilities [17].
3.
Economic and Social Value Data
Economic and social value data measure the market, social, and cultural value of theareas. The data sources include the following:
Real-Estate Market Data: Market prices and rental levels of commercial and residential properties within theareas are gathered from the CRIC database and second-hand housing websites, quantifying theareas’ real-estate economic value [14].
Social Survey Questionnaires: A total of 100 questionnaires were designed and distributed via the Wenjuanxing platform to collect evaluations from residents and visitors, providing a quantitative basis for social value analysis.
Tourist Perception Data: Field surveys were conducted to collect tourists’ evaluations of theareas, including satisfaction with cultural atmosphere, environment, and service levels, further quantifying social and cultural value.
Cultural Value Data: Big data analyses on platforms such as Xiaohongshu and Tencent Weibo capture public perceptions and recognition of theareas, quantifying cultural value.
By integrating these multi-dimensional data sources, this study establishes a robust data foundation for the application of the NPV model. This enables a comprehensive evaluation of resource allocation and coordination across differentareas in Changsha, providing empirical support for scientifically informed urban renewal planning.

3.2. NPV Model Construction

The NPV model integrates the function of transport nodes (Node), the function of place (Place), and the economic value (Value) and evaluates the match between transport nodes and land development through quantitative indicators. The Node function evaluates the accessibility and serviceability of the transport hub, the Place function evaluates the diversity and density of the land development, and the Economic Value evaluates the economic vitality of the region through the real-estate price and GDP growth rate [18].

3.3. Calculation of Indicator Weights

This study determined the weights of each indicator using the Analytic Hierarchy Process (AHP). The yaahp software was employed to construct a hierarchical structure model of the indicators, and the relative weight of each indicator was calculated using expert pairwise comparison scoring. Based on the results of the expert questionnaire, the weight of node functions was 40%, while place functions and economic value each accounted for 30%. These weights provide the foundation for subsequent calculations in the NPV model, ensuring the scientific validity and objectivity of the analysis results [19].
During the operation of the yaahp software, the study invited five experts to participate in the scoring process. These experts included professors and associate professors from relevant academic fields, senior technical personnel from government departments, and senior professionals holding leadership positions in urban planning consulting firms. They possess extensive experience and professional knowledge in urban planning and regional development in Changsha. The experts not only have an in-depth understanding of the urban development status and resource allocation characteristics of Changsha’s key areas but also have rich experience in participating in urban renewal projects. They have systematic knowledge of regional function optimization, land use, and economic vitality enhancement.
In the weight determination process, the yaahp software required each expert to perform pairwise comparisons of the relative importance of different indicators and input numerical values to enable consistency checks. The experts’ scores were based on their familiarity with differentareas in Changsha, particularly regarding the distribution of transportation nodes, land functions, and regional economic potential. Furthermore, the experts’ deep understanding of the fundamental principles of urban renewal, technical methodologies, and their implementation in Changsha ensured the rationality and scientific validity of the weight determination process. The final weight calculation results represent the weighted average of multiple expert opinions, reflecting the relative importance of each indicator in this study.

4. Empirical Analysis

4.1. Case Background

Changsha is a typical and important megacity in China. In the “Special Plan for Urban Renewal (2021–2035)”, the Changsha Municipal Government has proposed the “district-based promotion” strategy [20]. That is, through the implementation of renewal plans by districts, it aims to achieve the coordinated development of transportation, land, and economic resources [21]. In this plan, 32 key areas will be renewed by districts. The core areas focus on historical and cultural protection and function enhancement, while the peripheral areas undertake the task of relieving the functions of the core area. They strive to achieve a balance between work and living and the integration of industry and city by improving infrastructure and public services [14].
This study selected nine representative renewalareas within Changsha, reflecting the diverse development statuses under the policy framework and highlighting the imbalance in the “node-place” functions across differentareas. For instance, while the Martyrs’ Park area and Railway Station area have well-developed transportation nodes, their land development is insufficient, and transportation resources are underutilized, resulting in unfulfilled economic potential. On the other hand, areas like Wang Xin and Sunshine 100, located in relatively remote areas, lag in the development of transportation and land resources. These imbalances illustrate the impact of policy directions on the development of differentareas [22].
Using the “Node–Place–Value” (NPV) model, this study analyzed these areas, revealing that some areas exhibit strong transportation node functions but underutilized land and economic potential. These findings provide valuable references for optimizing urban renewal strategies and support the necessity of coordinated development of transportation, land, and economic resources under policy guidance.

4.2. Constructs of the NPV Model Evaluation System

The NPV model provides a scientific tool for evaluating the coordination between the functions and values of transport nodes and places in the planning and implementation of urban regeneration areas in Changsha [14]. By comprehensively evaluating the nodes, places, and their functional values, the model helps planners to more precisely judge the urban renewal potential and priority of different areas. In the specific calculation, the model integrates the data of different districts, such as the accessibility of transport nodes and the functional diversity of places and their economic value through normalization. In order to ensure that the indicators are comparable among different districts, the model introduces the normalized entropy value and the Herfindahl–Hirschman Index (HHI) to measure the functional mix and the diversity of the economic structure of each district [13,14,15,23,24]. Qin’s work on economic marketization and coordinated development plays a critical role in understanding the relationship between regional economies and urban development [25]. Lu’s application of the Node-Place-Value model demonstrates how the evaluation of coordination between transportation nodes and urban development is crucial in formulating urban renewal strategies [26].These calculations effectively improve the accuracy of the model, enabling it to provide a reliable assessment basis and optimization suggestions for urban renewal projects in Changsha.

4.2.1. NPV Modeling

In order to deeply analyze the overall situation of urban renewal areas in Changsha and provide a scientific basis for the NPV model, this study conducts a comprehensive analysis of the selection and construction of each factor. The following is a detailed description and extended exploration of each dimension and its specific sub-indicators.

4.2.2. Construction of Node Model Indicators

The node dimension focuses on the functionality of the transport system and its role in driving urban regeneration, covering public transport, vehicular transport, and slow-moving transport [27,28]. These indicators allow for an assessment of the role of transport hubs in contributing to the economic vitality of an area and their accessibility [29,30,31].
1.
Public Transport (Metro and Bus):
  • The Number of Interchange Lines: The number of lines that can be interchanged within a metro station is an important indicator of a transport hub. The more interchange lines, the stronger the hub role of the transport node, the wider the range of services, and the promotion of urban function agglomeration.
  • Service Power: The operational efficiency of a station is measured by the interval between metro or bus departures [32,33]. The shorter the departure interval, the greater the service power, indicating that the transport node is better able to meet passenger demand.
  • The Convenience of Connection: The ease of transport interchange is measured by assessing the number of other public transport stops within 800 meters of the station. The higher the accessibility, the greater the radiation effect of the transport node on the surrounding area.
  • Accessibility: A measure of the efficiency of the entire transport network by measuring the average time it takes to travel from one site to another [32]. Higher accessibility means that regions are more connected to each other, facilitating the smooth flow of people and economic activity.
  • The Number of Stations: The number of bus stops in a region directly reflects the density of the transport network and the breadth of its services. The more stations there are, the better the public transport coverage and the more favorable it is for regional development.
2.
Car Traffic:
  • The Number of Charging Piles: This indicator is used to assess the degree of improvement of the infrastructure for new energy vehicles. With the popularity of new energy vehicles, the number of charging piles has become an important symbol of the modernization of the transport system.
  • Accessibility: The ease of vehicular traffic is assessed by measuring the average time it takes for the furthest end of the region’s main roads to reach the center. This indicator reflects the accessibility of the region and helps to judge the contribution of vehicular traffic to economic activity.
  • Serviceability: Traffic efficiency is assessed by the number of traffic lights. The number of traffic lights has a direct impact on the smoothness of traffic flow, which in turn affects the economic activity of the region.
  • The Number of Car Parks: The number of car parks reflects the capacity of the area to serve motor vehicles. A high number of car parks indicates that the area has a good transport infrastructure, which is conducive to attracting more traffic.
3.
Slow-moving Traffic:
  • Walkway Width: The width of the walkway is a key factor in the quality of the slow-moving pedestrian system. The greater the width, the greater the comfort and safety for pedestrians, and the greater the overall livability of the area.
  • The Integrity of the Pedestrian System: Trail connectivity has a direct impact on the quality of the area’s slow-moving pedestrian system. A complete pedestrian system not only enhances the traveling experience for residents but also supports greater traffic flow for commercial activities in the area.
  • Safety: The safety of slow-moving traffic is measured by the number of mechanized non-separationareas. The more strips there are, the safer it is to walk and ride, contributing to a livable living environment.

4.2.3. Construction of Place Modeling Indicators

The Place Dimension reveals the degree of economic, residential, and commercial clustering and development and utilization in the area by assessing the degree of functional clustering, land development, and diverse mix in the area [32].
4.
Functional Aggregation:
  • The Number of Corporate Enterprise Points: The economic vitality of the area is assessed by measuring the number of enterprises in the area. The greater the number of firms, the more vibrant the economic activity in the area, which contributes to economic development.
  • The Number of Residential Sites: The number of residential buildings directly reflects the residential function of the neighborhood and indicates whether the area has a good living environment.
  • The Density of Commercial Services: The commercial activity of the neighborhood is assessed through the density of improved commercial and amenity services. The concentration of commercial services is one of the core indicators for assessing the attractiveness and economic vitality of a neighborhood.
5.
Site Development:
  • Building Coverage Ratio: The ratio of the building footprint to the area of the area reflects the efficiency of the development and utilization of the land in the area. High coverage means that land resources are fully utilized but at the same time attention needs to be paid to the balance of greening and open space.
  • Green Space Density: The ratio of the area of parks and other green spaces to the total area of the district is a key indicator of the ecological quality of the area. The greener space there is, the higher the quality of the environment and the comfort of living will be enhanced accordingly.
  • Building Height: The efficiency of space utilization in an area is assessed by measuring the average height of buildings. Taller buildings often mean higher floor area ratios and more efficient land use.
6.
Diverse Mix:
  • Industry Mix: Measures the diversity of economic activities in the region through the share of POIs classified by different economic sectors. The more diverse the economic activities, the more dynamic the regional development.
  • Land-Use Mix: The proportion of different types of land use reflects the diversity of land use in the area and shows whether the area has the potential for integrated development of commercial, residential, green space, and other functions.

4.2.4. Construction of Value Modeling Indicators

  • The construction of the value dimension mainly includes three parts: economic value, social value, and cultural value. Through these indicators, the economic growth potential, social service level, and cultural resource richness of the area can be assessed.
7.
Economic Values:
  • Regional Economic Performance: GDP growth rates are used to measure the economic development of a region, reflecting its economic dynamism and development potential.
  • Real-Estate Prices: The average price of second-hand residential properties reflects the activity of the property market and the residential attractiveness of the area.
  • Industry Growth Rate: The average growth rate of the primary, secondary, and tertiary industries measures the degree of the optimization of the industrial structure and is an important indicator of the diversity of the regional economy.
8.
Social Values:
  • Resident Satisfaction: A questionnaire survey of resident satisfaction with the district can directly reflect the comprehensive performance of the district in terms of living environment, service facilities, and other aspects.
  • Tourist Reputation: The cultural tourism resources of the area and its attractiveness are assessed through satisfaction surveys of tourists.
9.
Cultural Values:
  • Hot Discussions Related to Regional Culture: Analyzing online discussions to measure the region’s cultural influence and public attention to cultural resources.
  • The Number of Cultural Facilities: The number of cultural facilities directly reflects the richness of cultural resources and the development potential of the neighborhood.
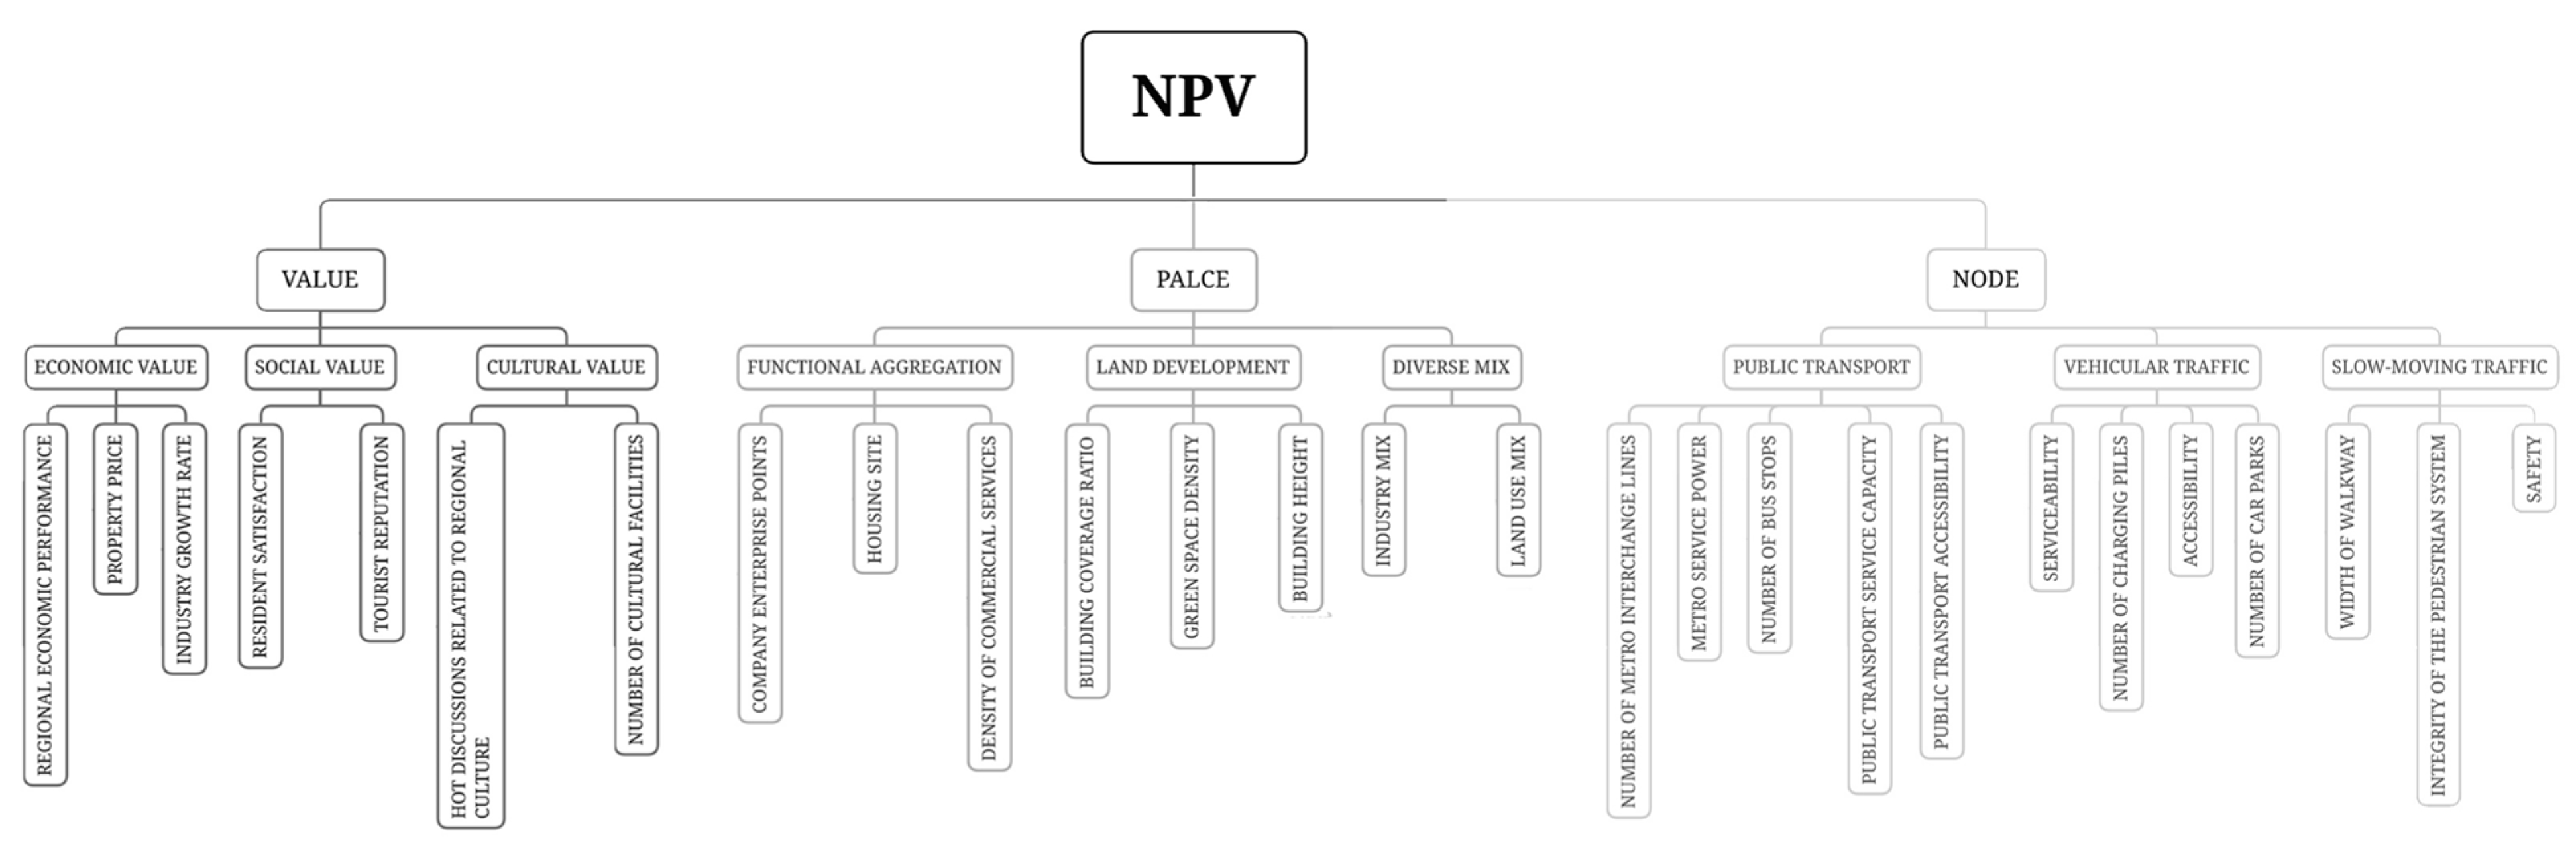
  • This study provides a scientific evaluation system for the comprehensive analysis of Changsha’s urban regeneration areas by systematically constructing and evaluating multiple sub-indicators under the three dimensions of “node–place–value”. By analyzing the node functions, place development and economic, social and cultural values of different transport hubs, the model is able to accurately capture the potentials and challenges of each district in urban regeneration. The indicator design of this system not only ensures the accuracy and operability of the data but also provides strong decision support for future urban regeneration in Changsha.

4.3. Data Collation and Weighting Based on Hierarchical Analysis

4.3.1. Constructing the Hierarchical Structure Model

Using AHP software, the hierarchical structure is first constructed based on the NPV model of this study (Figure 3). The “NPV model” is set as the target layer, representing the overall goal of the coordinated development of transportation nodes, land use, and economic value in urban renewal. “Node”, “Place”, and “Value” are taken as the criterion layer, respectively, reflecting the key elements in aspects such as transportation hubs, land development, and regional economic vitality. Then, the indicators are further subdivided. For example, under the “Node” criterion layer, “Public Transportation”, “Vehicular Traffic”, and “Pedestrian and Bicycle Traffic” are set as the sub-criterion layers. The “Public Transportation” sub-criterion layer is further subdivided into specific indicators such as “Number of Metro Transfer Lines” and “Metro Service Capacity” as the alternative layer. By analogy, similar subdivisions are carried out for the “Place” and “Value” criterion layers to construct a complete hierarchical structure model, laying the foundation for subsequent weight calculations.

4.3.2. Expert Scoring and Data Input

Five experts with rich experience in the field of urban planning were invited, including professors of relevant disciplines in universities, senior technical staff in government departments, and senior professionals in urban planning consulting companies. Based on their in-depth understanding of the urban renewal areas in Changsha, these experts conducted pairwise comparisons and scored the relative importance of the indicators at each level in the yaahp software. For example, regarding the relative importance of “Public Transportation”, “Vehicular Traffic”, and “Pedestrian and Bicycle Traffic” under the “Node” criterion layer, the experts input values in the software interface according to the 1–9 scale method. Here, 1 indicates that two indicators are equally important, 9 indicates that the former is extremely more important than the latter, and the intermediate values represent different degrees of importance differences. In this way, the data input was completed.

4.3.3. Consistency Test

The software automatically conducts consistency tests based on the data input by experts. If the consistency ratio (CR) of the judgment matrix is less than 0.1, the judgment matrix is considered to have acceptable consistency. If the CR is greater than 0.1, the judgment matrix needs to be adjusted. In this study, for example, some judgment matrices showed inconsistent situations (the total number of judgment matrices that needed to be corrected was 29). The software processed them through methods such as the minimum change algorithm (automatically correcting 17 matrices) and the maximum improvement direction algorithm (correcting a small number of elements in 8 matrices) to ensure that the comparisons between levels and elements were logical and guarantee the scientific nature of the weight calculation results (Table 1).

4.3.4. Weight Calculation and Table Generation

After passing the consistency test, the software calculates the weights of each indicator using a specific algorithm. Taking the “NPV model” as an example, the calculated weights of “Node”, “Place”, and “Value” are 0.4444, 0.4444, and 0.1111, respectively. Similar calculations are also carried out for each sub-criterion layer and alternative layer. For instance, the weight of “Public Transportation” under the “Node” criterion layer is 0.2926, and the weight of the “Number of Metro Transfer Lines” it contains is 0.1907, and so on. The software organizes these weight results into detailed tables to clearly display the weight values of each indicator in different hierarchical structures (Table 2, Table 3, Table 4, Table 5, Table 6, Table 7, Table 8, Table 9, Table 10, Table 11, Table 12, Table 13, Table 14, Table 15, Table 16 and Table 17).
Ordering of factor layer weights (Table 6, Table 7, Table 8, Table 9, Table 10, Table 11, Table 12, Table 13 and Table 14).

4.4. Model Deepening and Optimization

In this part, the relevant factors of the basic data are firstly calculated, including the degree of industrial mix, the degree of land-use mix, the growth rate of GDP, the average growth rate of one, two, and three industries, and so on. The calculation of these factors provides basic data support for the model analysis and ensures the accuracy and reliability of the data through scientific calculation methods.
After completing the calculation of the basic data mentioned above, I normalized these data in order to unify the results of the analysis and to ensure that the indicators were compared within the same scale. The purpose of normalization is to adjust the data of different scales to the interval between 0 and 1 so that the factors can be compared and analyzed under the same evaluation system. This process ensures that data from different units and scales are comparable, which helps the model to make more accurate and comprehensive assessment at different levels. The normalization process not only improves the consistency of the data but also provides a clear basis for subsequent analysis.
After the normalization process, the results provided accurate data support for the model calculation, and the comprehensive scores of each region were reasonably presented under the same evaluation system. Combining the normalized data and the weighting coefficients calculated by the hierarchical analysis method, the weighted scores of each factor in the overall evaluation were finally obtained. These weighted scores comprehensively reflect the importance of each factor in the overall evaluation and help to further identify the strengths and weaknesses of each region.
Finally, these data are summarized in the following table, which is used to present the final scores for each factor and its contribution to the overall evaluation, providing a basis for subsequent model analysis and optimization.
In this part, the relevant factors of the basic data were firstly calculated, including the degree of industrial mix, the degree of land-use mix, the growth rate of GDP, and the average growth rate of primary, secondary, and tertiary industries. After completing the calculation of the above basic data, these data are normalized in order to unify the analysis results and ensure that the indicators are compared within the same magnitude. Through normalization, the data with different scales are adjusted to the interval between 0 and 1 so that the factors can be analyzed and compared under the same evaluation system. The final normalized results provide accurate data support for the subsequent model calculations. The resulting table shows the composite score of each region according to the normalized indicators, which is used for subsequent model analysis and optimization.
Finally, the combination of normalized data and weighted coefficients calculated using the stratified analysis method resulted in the final score for each factor in the overall evaluation, as summarized in Supplementary Materials.

4.5. Characterization

4.5.1. Characterization Based on Node Values

Highest ratings: Martyrs’ Park Area (3.0572) and Railway Station Area (2.9841).
Lowest ratings: Wang Xin Area (0.120422) and Sunshine 100 Area (0.154682).
In the assessment of nodal value, the areas with the highest scores are Martyrs’ Park Area (3.0572) and Railway Station Area (2.9841), while the areas with the lowest scores are Wang Xin Area (0.120422) and Sunshine 100 Area (0.154682). From the analysis, it can be seen that the areas with higher node value scores, such as Martyrs’ Park Area and Railway Station Area, are usually located in the city’s transport hubs, with good transport accessibility and interchange convenience. These areas not only undertake important transport functions but also play a key role in the overall vibrancy of the city as a distribution center for business and services. On the contrary, districts with lower scores, such as Wang Xin and Sunshine 100 Area, may lack effective nodal functions due to deficiencies in the transport network. These areas may need to be strengthened in terms of transport facilities and interchange convenience, which affects the overall performance of the nodal function.

4.5.2. Characterization Based on Place Value

Highest ratings: Martyrs’ Park Area (4.242226) and China Tobacco Yatang Area (3.010282).
Lowest ratings: Wang Xin Area (0.080000) and Sunshine 100 Area (0.158834).
In the assessment of place value, Martyrs’ Park Area (4.242226) and China Tobacco Yatang Area (3.010282) scored the highest, while Wang Xin Area (0.080000) and Sunshine 100 Area (0.158834) scored the lowest. The higher scoring districts, such as Martyrs’ Park Area and China Tobacco Yatang Area, show that these districts have superior place conditions, such as abundant public facilities, favorable living environments, and a high level of place service functions. These areas not only provide residents with a high-quality living environment but also have significant advantages in promoting regional economic development and attracting investment. In contrast, the lower-scoring districts, such as Wang Xin and Sunshine 100, have large gaps in the provision of public facilities and the degree of improvement of the place environment, which affects the overall performance of their place functions.

4.5.3. Value-Based Profiling

Highest rating: Martyrs’ Park Area (4.504909) and Railway Station Area (3.599741).
Lowest ratings: Sunshine 100 Area (0.029684) and Wang Xin Area (0.032875).
From a value perspective, Martyrs’ Park Area (4.504909) and Railway Station Area (3.599741) scored the highest, while Sunshine 100 Area (0.029684) and Wang Xin Area (0.032875) scored the lowest. The higher-scoring districts are usually located in the core economic or commercial centers of the city, with high land-use efficiency and strong levels of economic activity, such as the Martyrs’ Park and Railway Station districts, which have high economic values, active property markets, and significant potential for land and property appreciation. On the contrary, the lower-scoring Sunshine 100 Area and Wang Xin Area may be due to their remote location, low economic activities, and inefficient land use, resulting in their poor performance on the economic and social value dimensions.
In the comprehensive evaluation, four of the more typical districts were selected for analysis, combining the three dimensions of node, place, and value:
The Martyrs’ Park Area has the most outstanding performance, leading in all three aspects of accessibility, place function, and economic vitality and is one of the best-coordinated areas. This means that Martyrs’ Park Area is not only the historical, cultural, and commercial center of the city but also one of the key launching pads for future urban regeneration, with great potential for development.
While the railway station area excels in terms of its nodal and economic values, it is slightly deficient in terms of place functions. The area needs to further optimize its public service facilities and amenities in the future to enhance its competitiveness in terms of living environment and the quality of life.
The China Tobacco Yattang Area performs better in terms of place and economic value, showing the area’s combined strengths in public services and industrial economy, but the node function is relatively weak. To make the development of the area more balanced, the node connectivity and overall transport accessibility of the area can be enhanced in the future by improving the transport infrastructure.
The Wang Xin and Sunshine 100 districts scored low on all three dimensions, and their overall performance is weak. Inadequate transport facilities, the lack of public services, and lagging economic vitality have led to obvious shortcomings in the urban renewal of these areas. In future planning, priority should be given to infrastructure development and the introduction of industries in order to enhance the comprehensive competitiveness and coordinated development of these areas.
Through the in-depth analysis of these four typical districts, the urban renewal process in Changsha can more accurately identify the strengths and weaknesses of each district and make targeted improvements and optimizations in conjunction with the NPV model to ultimately achieve more balanced regional development.

5. Discussion

5.1. Conclusions

This study closely focuses on the crucial topic of the coordinated development of Chinese megacities. Based on the “Node–Place–Value” (NPV) model, it conducts in-depth and systematic research by taking the urban renewal areas in Changsha as a case.
At the research design level, the selection of the urban renewal areas in Changsha as a case study is of great significance. As a typical megacity in the central region of China, the problems encountered in Changsha’s urban renewal process are highly representative among similar cities. An in-depth analysis of Changsha can accurately reveal the actual situation of megacities in the coordinated development of transportation nodes, land use, and economic value, thus providing valuable experience and reference for other megacities. The research question is precisely focused on how to achieve the coordinated development of transportation nodes, land functions, and economic value with the help of the NPV model during the urban renewal process of megacities. This question closely revolves around the core needs of urban renewal, faces up to the practical problems such as the irrational allocation of transportation and land resources, and is committed to providing practical solutions for urban renewal practices. The research hypothesis is to add a “value” dimension to the NP model, aiming to enable the NPV model to more effectively evaluate the resource matching situation and deeply reveal the development potential and imbalances of different areas. This hypothesis is not only based on an in-depth theoretical analysis of the interrelationships of multiple urban development factors but also fully refers to the research results of predecessors in related fields, with a solid foundation of rationality and feasibility.
The research method is a major highlight of this study. The multi-dimensional data collection method lays a solid data foundation for the entire research. The research covers data from three dimensions: transportation nodes, land-use functions, and economic and social values. The data sources are extensive and rich, including real-time traffic flow data, transportation planning reports, urban planning documents, real-estate market data, and other information. These data not only ensure the comprehensiveness and accuracy of the research but also provide rich and valuable information support for the specific implementation plans and planning of urban renewal. For example, real-time traffic flow data allow planners to grasp the actual usage intensity of transportation nodes in real time, providing a strong basis for the precise optimization of transportation facilities. The land-use zoning information in urban planning documents can directly provide clear guidance for the scientific adjustment of land-use planning.
When determining the weights of each indicator, this study uses the Analytic Hierarchy Process (AHP) and invites five industry authorities, including professors of relevant disciplines in universities, senior technical personnel in government departments, and senior professionals in urban planning consulting companies, to participate in the scoring. Relying on their profound professional knowledge and rich practical experience, these experts fully consider the actual situation of each area in Changsha. After strict consistency tests, the weights of node functions, place functions, and economic values are finally determined to be 40%, 30%, and 30%, respectively. This rigorous process of determining weights not only guarantees the scientificity and objectivity of the research results but also has significant importance in the planning and application of urban renewal. In actual planning scenarios, based on these weights, planners can clearly define the importance of different elements in urban renewal. For example, when resources are limited, resources can be preferentially allocated to optimize the functions of transportation nodes or enhance the place functions that have a greater impact on urban renewal, achieving efficient resource utilization.
Through the empirical analysis of the urban renewal areas in Changsha, this study reveals the mismatch between the high accessibility of transportation nodes and economic value. Taking the Martyrs’ Park area and the Railway Station area as examples, although their transportation nodes are mature, the degree of land development is insufficient, resulting in the failure to effectively transform transportation resources into economic advantages and making it difficult to fully exert economic benefits. This phenomenon fully indicates that some transportation-developed areas have obvious shortcomings in resource integration and economic function activation and urgently need to optimize urban renewal strategies to enhance the overall coordination and economic benefits of the region.
Compared with existing research, this study innovatively expands the NP model by adding an economic “value” dimension to construct the NPV model. Lund [12]’s research mainly focuses on the impact of transportation nodes on the value of adjacent residential real estate, being limited to the economic effects of a single residential function and failing to comprehensively consider the diversity of land functions and the overall resource allocation situation. Vander Krabben and van Rooden [7] from Buck Consultant International attempted to analyze the long-term impact of transportation nodes on the real-estate market. However, due to the limitations of data and the singularity of the analysis dimension, they failed to fully reveal the complex interaction relationship between nodes and places. This study, with the help of a more extensive dataset and the newly added “value” dimension, successfully makes up for these deficiencies. It can accurately evaluate the comprehensive effects of transportation nodes, land functions, and economic vitality, clearly reveal the interrelationships among the three in the areas of Changsha, and provide a scientific and reliable basis for formulating renewal strategies according to local conditions.
In summary, this study has developed an innovative method for evaluating the renewal potential of megacity areas with the help of the NPV model, which further deepens the understanding of the relationships among transportation nodes, land functions, and economic values. Zhang discusses the strategic importance of regional harmony in urban development, emphasizing the need for coordinated paths to ensure balanced growth [29]. The research findings not only have significant guiding implications for urban renewal in Changsha but also provide favorable theoretical support and practical references for other megacities in China to address similar issues during the urban renewal process, achieve rational resource allocation, and pursue sustainable development. It effectively fills the analytical gap in this area within the current urban renewal field and lays a solid foundation for the future application of the NPV model with broader data support.

5.2. Inadequate Research

Firstly, the case analysis in this study is limited to Changsha City and lacks a comparison of different types and sizes of cities, failing to fully reveal the applicability of the node–place–value model in different cities. Therefore, future research should expand the case coverage to include multi-city and multi-stage empirical analyses to enhance the breadth and applicability of the findings.
Second, the quantitative criteria of some of the model factors are relatively simple and fail to adequately reflect the complex urban dynamics. Future research can improve the accuracy and usefulness of the model by introducing more dynamic factors and interactions between factors.

5.3. Outlook

With the acceleration of urbanization and the continuous strengthening of the functions of megacities, the coordination problems in the urban renewal of Chinese megacities will become more prominent. In the future, detailed planning that caters to the needs of urban renewal will be a crucial means of optimizing urban development paths and promoting the rational utilization of spatial resources. Detailed planning not only inherits the macro-goals of the overall urban planning but also directly guides the specific implementation of renewal areas, ensuring the coordination among transportation nodes, land use, and economic values, and achieving more sustainable urban development.
Future research should focus on optimizing the “Node–Place–Value” (NPV) model to better meet the renewal needs of megacities. This optimization can not only help improve land-use efficiency and enhance regional sustainability but also support economic development and the coordination of urban functions. With the continuous progress of technologies such as intelligent transportation and big data, detailed planning should be more flexible and real time to adapt to the rapidly changing urban environment. By integrating these emerging technologies, future urban renewal planning will be more scientific and accurate, providing dynamic support for optimizing the layout of transportation nodes and land-use patterns.
At the practical level, the applicability and promotion of the NPV model will be important directions for future work. Especially in cities at different development stages and with different regional characteristics, applying and verifying the effectiveness of the NPV model will provide diverse theoretical support for urban renewal. Refining the renewal strategies for different areas can enable detailed planning to better respond to the specific requirements of different cities in terms of functional layout, industrial development, and ecological protection, ensuring the sustainability and adaptability of planning measures. Looking at the development of globalization and regional integration, with the expansion of urban agglomerations and metropolitan areas, detailed planning will also play a key role in cross-regional coordinated development, providing broader theoretical support for urban renewal and regional cooperation.
Currently, with the rapid development of artificial intelligence technology and the continuous improvement of big-data analysis capabilities, the NPV model faces unprecedented development opportunities. By leveraging advanced artificial-intelligence algorithms, it is possible to more efficiently mine and analyze vast amounts of urban data and accurately identify the dynamic change patterns of traffic flow, the potential optimization directions of land use, and the growth trends of economic value. This can provide the NPV model with richer and more accurate data inputs, thus optimizing the model’s evaluation results. The advancement of digital technology has also made the urban renewal planning process more visual and intelligent. Planners can use cutting-edge technologies such as digital twins to intuitively simulate the changes in traffic, land use, and economic values under different renewal plans and quickly adjust planning strategies based on the evaluation results of the NPV model to make more scientific and reasonable decisions.

Supplementary Materials

The following supporting information can be downloaded at: https://www.mdpi.com/article/10.3390/urbansci9040121/s1.

Author Contributions

Conceptualization, K.Z. and Y.Z.; methodology, K.Z.; software, K.Z.; validation, K.Z., Y.Z. and W.C.; formal analysis, K.Z.; investigation, K.Z.; resources, K.Z.; data curation, W.C.; writing—original draft preparation, K.Z.; writing—review and editing, K.Z.; visualization, K.Z.; supervision, Y.Z.; project administration, Y.Z.; funding acquisition, Y.Z. All authors have read and agreed to the published version of the manuscript.

Funding

This research received no external funding.

Data Availability Statement

The data was collected under a research agreement that restricts its external sharing, thus it’s unavailable for public access.

Conflicts of Interest

The authors declare no conflict of interest.

References

  1. Bertolini, L. Spatial development patterns and public transport: The application of an analytical model in the Netherlands. Plan. Pract. Res. 1999, 14, 199–210. [Google Scholar] [CrossRef]
  2. Shao, T.Y.; Qian, C.Y. Synergistic Effect Evaluation of Rail Transit Stations Areas—Taking Central Rail Transit Stations in Nanjing as an Example. Transp. Technol. 2022, 11, 331–337. [Google Scholar]
  3. Yang, J.Y. Research on the Coordinated Relationship Between Land Use and Transportation in Shenzhen Based on Node-Place Model; Shenzhen University: Shenzhen, China, 2019. [Google Scholar]
  4. The State Council Notice on Adjusting the Standards for Urban Scale Classification; State Council: Beijing, China, 2014. (In Chinese)
  5. Zhang, Z.J.; Gao, S.X.; Chen, Y.; Xiao, Z.; Deng, J.; Xu, Q. Evaluation of urban rail transit TOD based on enhanced node-place model. Transp. Res. 2022, 8, 143–153. [Google Scholar]
  6. School of Urban Planning and Design, Peking University. Development and Research Progress of Urban Renewal Practices in China; School of Urban Planning and Design, Peking University: Beijing, China, 2022; Available online: https://plc.pku.edu.cn/info/1137/2160.htm (accessed on 15 January 2024).
  7. van der Krabben, E.; van Rooden, R. Application of the Node-Place Model in Real Estate Market Value Assessment; Buck Consultant International: Tokyo, Japan, 2003. [Google Scholar]
  8. Wang, C.F.; Sun, Y.M.; Zhang, C.Y.; Huang, Y.Q.; Li, M.Z. Node-Place Concept-Based Rail Transit Station Area Planning and Design. Planners 2014, 30, 30–34. [Google Scholar]
  9. Debrezion, G. Critique of the Node-Place Model’s Application in Real Estate Valuation. J. Urban Econ. 2006, 42, 371–385. [Google Scholar]
  10. Debrezion, G.; Pels, E.; Rietveld, P. The impact of railway stations on residential and commercial property value: A node-place model approach. Transp. Res. Part A Policy Pract. 2007, 41, 21–34. [Google Scholar]
  11. Sun, B.D.; Jin, X.X.; Lin, J. China’s New Pattern of Urbanization Toward Coordinated Development of Large, Medium and Small Cities: Evolution and Determinants of City Size Distribution Since 1952. Geogr. Res. 2019, 38, 75–84. [Google Scholar]
  12. Lund, H. The impact of transit stations on residential property values: A node-place perspective. J. Urban Econ. 2006, 60, 25–40. [Google Scholar]
  13. McDonald, J.F.; Osuji, C.I. The effect of anticipated transportation improvement on residential land values. Reg. Sci. Urban Econ. 1995, 25, 261–278. [Google Scholar] [CrossRef]
  14. Cervero, R.; Duncan, M. Benefits of proximity to rail on housing markets: Experiences in Santa Clara County. J. Public Transp. 2002, 5, 1–18. [Google Scholar] [CrossRef]
  15. Bowes, D.R.; Ihlanfeldt, K.R. Identifying the impacts of rail transit stations on residential property values. J. Urban Econ. 2001, 50, 1–25. [Google Scholar] [CrossRef]
  16. Peek, G.J.; Bertolini, L.; De Jonge, H. Gaining Insight in the Development Potential of Station Areas: A Decade of Node-Place Modeling in the Netherlands. Urban Plan. Int. 2011, 26, 63–71. [Google Scholar]
  17. Yang, X.; Yu, Y.; Zhou, R. Research Progress of the Node-place Model Abroad and Its Enlightenments: Applications, Extensions and Systematic Development. Urban Plan. Int. 2024. [Google Scholar] [CrossRef]
  18. Lu, L. Application of the Node-Place-Value Model in Assessing Urban Development Coordination. J. Urban Plan. Dev. 2019, 25, 45–58. [Google Scholar]
  19. Hou, X.; Zhang, W.X.; Lyu, G.W.; Hu, Z.D. Study on the Influence of Regional Development around Station of HST: Taking Beijing South Station as an Example. Urban Dev. Res. 2012, 19, 41–46. [Google Scholar]
  20. Changsha Urban Renewal Special Plan; Changsha Municipal People’s Government: Changsha, China, 2022. (In Chinese)
  21. Yin, R.K. Case Study Research and Applications: Design and Methods; Sage Publications: London, UK, 2018. [Google Scholar]
  22. Yao, S.M.; Li, G.Y.; Yan, Y.; Chen, S.; Chen, Z.-G. Study on Innovation Models of Balanced Development of Metropolis in China. Hum. Geogr. 2012, 27, 48–53. [Google Scholar]
  23. Hong, H.; Xiao, J.C. From Territorial Division of Labor Theory to Regional Coordinated Development: A Theoretical Review. China Econ. Trade Guide 2019, 148–149. Available online: https://kns.cnki.net/kcms2/article/abstract?v=_dzes7vZToMf5HeDRP8juGscQ_HL857vHcucarBrV4-VVQz1pHheXhQ6Oti76V2w-_mK8iNq1ckCSrWpnT_rgCtEbg9u4UdBvnIi8XY4J4K8ZKdE7f5KktmBlBBERrkvtICAjl7VMdCpgrqjfL0wx6FIKPw_HOWk9dHwwXZl0_coJ2gcY9lQwQ==&uniplatform=NZKPT&language=CHS (accessed on 15 December 2024).
  24. Chen, D.S. Regional Economics; Henan People’s Publishing House: Zhengzhou, China, 1993. [Google Scholar]
  25. Qin, C.L. On Economic Marketization and Coordinated Development of Regional Economies. Econ. Rev. J. 1998, 7–11. [Google Scholar] [CrossRef]
  26. Three Dimensional Rubik’s Cube Model for TOD Type Classification: Comparative Analysis of Five Major Cities in China; China Academy of Urban Planning and Design: Beijing, China, 2021.
  27. Ren, L.J.; Yun, Y.X.; Quan, H.Y. Study on Classification and Characteristics of Urban Rail Transit Stations Based on Node-Place Model: Empirical Analysis and Lessons from Singapore. Urban Plan. Int. 2016, 31, 109–116. [Google Scholar]
  28. Chen, X.; Lin, L. The node-place analysis on the “hubtropolis” urban form: The case of Shanghai Hongqiao air-rail hub. Habitat Int. 2015, 49, 445–453. [Google Scholar] [CrossRef]
  29. Chorus, P.; Bertolini, L. An application of the node-place model to explore the spatial development dynamics of station areas in Tokyo. J. Transp. Land Use 2011, 4, 45–58. [Google Scholar]
  30. Kim, H.; Sultana, S.; Weber, J. A geographic assessment of the economic development impact of Korean high-speed rail stations. Transp. Policy 2017, 66, 127–137. [Google Scholar] [CrossRef]
  31. Wang, C.F.; Zhou, J.Y. Spatial Coupling Model and Empirical Study of Metro Stations in Old City Based on “Node-Place”: A Case Study of Guangzhou. Mod. Urban Res. 2021, 80–87, 111. [Google Scholar]
  32. Yang, Z.M.; Yang, L.C.; Cui, X.; Guo, Y.Y.; Gao, Y.B. Evaluation of Coordination in Central Metro Station Areas of Chengdu. Planners 2020, 36, 67–74. [Google Scholar]
  33. Zhuang, Y.; Zhang, L. Exploring synergistic effect in metro station areas: A case study of Shanghai, China. Int. J. High-Rise Build. 2016, 5, 105–115. [Google Scholar] [CrossRef]
Figure 1. Node–place modeling (Source: Bertolini, 1999 1).
Urbansci 09 00121 g001
Figure 2. Schematic diagram of 9 urban renewal areas in Changsha City (self-drawn by the author).
Urbansci 09 00121 g002
Figure 3. Generated by the author using AHP software (XMind 8).
Urbansci 09 00121 g003
Table 1. Judgement matrix inspection report overview.
Judgement Matrix Inspection Report Overview
CategoryContentScore
1. Judgement matrix statisticsTotal number of judgement matrices to be corrected:29
The number of invalid judgement matrices that may be corrected:4
2. Judgement matrix classification statisticsThe minimum change algorithm can be corrected automatically:17
The maximum improvement direction algorithm fixes a few elements:8
Minimum correction algorithm correction failed:0
The maximum improvement direction algorithm has more correction elements:4
Maximum improvement direction algorithm correction failed:0
3. Expert statisticsTotal number of experts whose data need to be corrected:5
Total number of experts for whom the possibility of invalid data correction exists:3
Note: Only data for which there is a possibility of invalid corrections or failed corrections will appear in the detailed data reported.
Table 2. NPV model consistency ratio: 0.0000; weight on “NPV model”: 1.0000; λmax: 3.0000.
NPV ModelFig. Values (Ethical, Cultural, etc.)EstablishmentsNodalWi
Fig. values (ethical, cultural, etc.)11/41/40.1111
Establishments4110.4444
Nodal4110.4444
Table 3. Value consistency ratio: 0.0000; weight on “NPV model”: 0.1111; λmax: 3.0000.
Fig. Values (Ethical, Cultural, etc.)Economic ValueSocial ValueCultural ValueWi
Economic value1110.3333
Social value1110.3333
Cultural value1110.3333
Table 4. Node consistency ratio: 0.0989; weight on “NPV model”: 0.4444; λmax: 3.1029.
NodalPublic TransportVehicular TrafficSlow-Moving TrafficWi
Public transport10.35293.83340.2926
Vehicular traffic2.833414.16660.6024
Slow-moving traffic0.26090.240010.1050
Table 5. Place proportion of consistency: 0.0176; weight on “NPV model”: 0.4444; λmax: 3.0183.
EstablishmentsFunctional AggregationLand DevelopmentHybridizationWi
Functional aggregation111/20.2402
Land development111/30.2098
Hybridization2310.5499
Table 6. Slow-moving traffic consistency ratio: 0.0987; weight on “NPV model”: 0.0467; λmax: 3.1026.
Slow-Moving TrafficSafetyWidth of WalkwayIntegrity of the Pedestrian SystemWi
Safety14.55593.44410.6414
Width of walkway0.219510.29040.1023
Integrity of the pedestrian system0.29043.444110.2562
Table 7. Vehicular traffic consistency ratio: 0.0077; weight on “NPV model”: 0.2677; λmax: 4.0206.
Vehicular TrafficServiceabilityNumber of Charging PilesAccessibilityNumber of Car ParksWi
Serviceability13110.3050
Number of charging piles1/311/31/20.1131
Accessibility13110.3050
Number of car parks12110.2769
Table 8. Public transport consistency ratio: 0.0546; weight on NPV model: 0.1300; λmax: 6.3440.
Public TransportNumber of Metro Interchange LinesMetro Service ForceEasy Access to the MetroNumber of Bus StopsPublic Transport Service CapacityPublic Transport AccessibilityWi
Number of metro interchange lines111/22220.1907
Metro Service Force111/22220.1907
Easy access to the metro2212220.2723
Number of bus stops1/21/21/211/31/30.0779
Public transport service capacity1/21/21/2311/20.1189
Public transport accessibility1/21/21/23210.1494
Table 9. Multivariate mixture consistency ratio: 0.0000; weight on “NPV model”: 0.2444; λmax: 2.0000.
HybridizationIndustry MixSite MixWi
Industry mix110.5000
Site mix110.5000
Table 10. Site development consistency ratio: 0.0516; weight to NPV model: 0.0933; λmax: 3.0536.
Land DevelopmentBuilding CoverageGreen Space DensityBuilding HeightWi
Building coverage11/51/50.0887
Green space density5120.5591
Building height51/210.3522
Table 11. Functional aggregation consistency ratio: 0.0986; weight on “NPV model”: 0.1068; λmax: 3.1025.
Functional AggregationCompany Enterprise PointHousing SiteDensity of Shopping ServicesWi
Company Enterprise Point10.35320.23990.1137
Housing site2.831510.26100.2341
Density of shopping services4.16853.831510.6521
Table 12. Cultural value consistency ratio: 0.0000; weight on NPV model: 0.0370; λmax: 2.0000.
Cultural ValueFrequency of Hot Topics Related to Regional CultureNumber of Cultural FacilitiesWi
Frequency of hot topics related to regional culture130.7500
Number of cultural facilities1/310.2500
Table 13. Social value consistency ratio: 0.0000; weight on NPV model: 0.0370; λmax: 2.0000.
Cultural ValueFrequency of Hot Topics Related to Regional CultureNumber of Cultural FacilitiesWi
Frequency of hot topics related to regional culture130.7500
Number of cultural facilities1/310.2500
Table 14. Economic value consistency ratio: 0.0000; weight on “NPV model”: 0.0370; λmax: 3.0000.
Economic ValueRegional Economic SituationProperty PriceIndustrial Growth RateWi
Regional economic situation1310.4286
Property price1/311/30.1429
Industrial growth rate1310.4286
Table 15. The ranked weights of elements in the alternative layer for the decision-making objective.
OptionsWeights
Site mix0.1222
Industry mix0.1222
Accessibility0.0817
Serviceability0.0817
Number of car parks0.0741
Density of shopping services0.0696
Green space density0.0521
Convenience of metro connection0.0354
Building height0.0328
Number of charging piles0.0303
Safety0.0299
Residents’ satisfaction0.0278
Frequency of hot topics related to regional culture0.0278
Housing site0.0250
Number of metro interchange lines0.0248
Metro Service Force0.0248
Public transport accessibility0.0194
Industrial growth rate0.0159
Regional economic situation0.0159
Public transport service capacity0.0155
Company Enterprise Point0.0121
Integrity of the pedestrian system0.0120
Number of bus stops0.0101
Number of cultural facilities0.0093
Tourist reputation0.0093
Building coverage0.0083
Property price0.0053
Width of walkway0.0048
Table 16. Ranking weights of elements in the 1st criterion level for decision objectives; percentage of combinatorial consistency: 0.0518.
Elements of the Normative LevelWeights
Nodal0.4444
Establishments0.4444
Fig. Values (ethical, cultural, etc.)0.1111
Table 17. Ranking weights of elements in the 2nd criterion level for decision objectives; percentage of combinatorial consistency: 0.0385.
Elements of the Normative LevelWeights
Vehicular traffic0.2677
Hybridization0.2444
Public transport0.1300
Functional aggregation0.1068
Land development0.0933
Slow-moving traffic0.0467
Economic value0.0370
Social value0.0370
Cultural value0.0370
Disclaimer/Publisher’s Note: The statements, opinions and data contained in all publications are solely those of the individual author(s) and contributor(s) and not of MDPI and/or the editor(s). MDPI and/or the editor(s) disclaim responsibility for any injury to people or property resulting from any ideas, methods, instructions or products referred to in the content.

