Article

Kazakhstan’s Infrastructure Programs and Urban Sustainability Analysis of Astana

by
Zauresh Atakhanova
* and
Marzhan Baigaliyeva
School of Mining and Geosciences, Nazarbayev University, Astana 010000, Kazakhstan
*
Author to whom correspondence should be addressed.
Urban Sci. 2025, 9(4), 100; https://doi.org/10.3390/urbansci9040100
Submission received: 19 February 2025 / Revised: 21 March 2025 / Accepted: 25 March 2025 / Published: 27 March 2025
(This article belongs to the Special Issue Sustainable Urbanization, Regional Planning and Development)

Abstract

:
Astana, Kazakhstan’s capital city since 1997, gained from substantial public investment, achieving relatively low poverty, high income, and broad access to social services. Implementation of the state infrastructure programs, which were aligned with China’s 2013 Belt and Road Initiative, allowed Astana to become a transport hub, attract people, and improve housing conditions. However, our analysis indicates that Astana’s construction boom resulted in intensive use of financial and natural resources. Moreover, the loss of green and blue lands, accelerated during the implementation of the state infrastructure programs, raises concerns about the environmental impacts of infrastructure spending. As a result, our study highlights the importance of further research and broader stakeholder engagement for bringing Astana’s development path into closer alignment with the principles of sustainability. Specifically, Astana’s stakeholders should adhere to best practices of urban ecosystem preservation, managing sprawl, and efficient use of resources. Finally, integrating green and blue infrastructure in setting targets, allocating funding, and monitoring, improving, and reporting on traditional infrastructure initiatives becomes increasingly important for sustainable urban development.

1. Introduction

Infrastructure represents a complex socio-technical system, consisting of physical capital that supports human capabilities by way of enabling access to critical services, participation in the economy, and widening markets [1]. Physical infrastructure is the backbone of transport, communication, energy, water, and waste management systems that are key for achieving sustainable development goals, in particular, SDG 9 Industry, Innovation and Infrastructure. Infrastructure supports sustainable development as it contributes to the creation of jobs and business opportunities, improving access to education and healthcare, increasing connectivity and innovation. Infrastructure is crucial for reducing poverty and inequality: access to modern energy sources reduces indoor pollution, water and waste management provide access to safe drinking water, while electricity is important for education and the use of digital technology [2]. In addition, urban infrastructure facilitates agglomeration of people and economic activity and increases productivity, thereby contributing to SDG 11 Sustainable Cities and Communities. By concentrating activity, urbanization and urban infrastructure may reduce human impact on ecosystems outside the cities. Integration of green and blue infrastructure is an important element of urban revitalization and enhancing the resilience of urban areas to climate change-related hazards [3,4]. At the same time, construction of infrastructure may affect habitats and culturally significant sites, and lead to excessive use of natural resources. Poorly planned infrastructure may lock in behaviors that result in a long-term increase in carbon emissions, air pollution, and contamination of soil and water. Infrastructure investment may lead to increased indebtedness of developing nations, may be wasteful, or support vanity projects. Therefore, the impact of infrastructure on sustainable development is not straightforward and is context-specific. Analysis of such impacts is complicated by their multi-faceted nature and the resulting need for interdisciplinary approaches. Furthermore, challenges of such research include methodological issues such as reverse causality, lack of counterfactuals, and limited data. Yet, such research is important for reducing the chances of locking in unsustainable patterns of development due to the long-lasting nature of infrastructure capital. In addition, both industrialized nations and developing countries are expected to invest around USD 94 trillion into creating new infrastructure and replacing outdated infrastructure. Kazakhstan is one such rapidly developing country that has considerable infrastructure needs that are related to its size and patterns of its development. Its current investment is $208 × 109, similar to the $212 × 109 level observed in Chile. However, the estimated investment need of Kazakhstan is $292 × 109 (compared to $264 × 109 in Chile) [5]. In other words, Kazakhstan has been and will continue investing significant funds into its infrastructure. In this light, it is important to deliberate on whether such investment helps Kazakhstan to secure its path to sustainable development or locks in unsustainable patterns of growth.
The largest land-locked country, Kazakhstan is located in the center of Eurasia and is the ninth largest country by area. It was part of the Soviet Union until 1991, when it became an independent country. Abundant natural resources and large revenues from oil exports allowed Kazakhstan to reach the status of an upper-middle income country by 2015. During the transition period, Kazakhstan has undergone profound socio-economic transformation, which was accompanied by rapid changes in its urban development. Although urbanization rates changed slowly from 56.3% in 1990 to 58.2% in 2023, some towns in Kazakhstan shrank due to the loss of their Soviet-time industrial base, while others expanded due to the rapid development of services and the market economy. Since 1929, Kazakhstan’s capital has been located in Almaty, at the extreme south point of the country. This changed in 1997 when the government decided to move the capital to a more northern location. The motivation was to provide a stimulus for economic development in the north, increase the reach and relevance of the national government in this region, and address concerns over the geographic integrity of the country and its borders [6]. A town specializing in grain processing and agricultural logistics was chosen to be the seat of the new capital, Astana. Unlike Almaty, enclosed by mountains and prone to earthquakes, Astana and its surroundings of endless grasslands seemed to offer unencumbered opportunities for urban growth. In 2001, a team of Kisho Kurokawa, a famous Japanese architect, developed Astana’s Master Plan, which emphasized principles of symbiosis and metabolism as key features of the city of the 21st century [7]. Symbiosis implied mutually beneficial relations between various cultures, the past and the present, the urban and the rural, pedestrians and automobiles, and taking advantage of the amenities offered by the Yesil River and green spaces. The metabolism principle implied a land use plan that allowed for future expansion, recycling of waste and water, and a buffer Green Belt to promote water retention and wind protection. By the time of the adoption of Astana’s Master Plan, Kazakhstan started receiving returns on its prior investment in oil and gas production and transportation [8]. The resulting growth in government revenues from petroleum exports as well as donations from the extractive industries allowed Kazakhstan’s government to provide significant funding for massive construction of the new capital, including multiple government buildings, the airport, a large indoor cycling track, a soccer stadium, an ice-skating arena, and a hockey stadium [6]. To accelerate Astana’s economic development, the government established special economic zones with firms, specializing in transport equipment, construction materials, finance, and high-tech companies. Furthermore, a major event that shaped the city was EXPO-2017. Preparation for this high-profile international event involved the building of a convention center and associated grounds, a new railway terminal, a new airport terminal, and the launch of the construction of the Light Rail Transit system [9]. In the year of the EXPO, Astana’s fixed capital investment amounted to USD 3 billion, exceeding multi-year allocations of some of Kazakhstan’s state infrastructure programs.
These national infrastructure programs began in 2015 as a response to the slowing down of economic growth in Kazakhstan from 8% annually during 2000–2013 to 2.4% thereafter, which was related to declining export revenues from falling commodity prices. These programs were the key components of the economic stimulus package that Kazakhstan’s government designed with the goal of developing Kazakhstan’s transport and urban infrastructure and enhancing opportunities for domestic economic activities [10,11].
Specifically, the Nurly Zhol (‘bright path’) state infrastructure program was designed to address the highly uneven regional development of the country, where most population resided in the south, while labor shortage existed in the north. In addition, economic activity was highly concentrated in oil-producing western regions, as well as the cities of Astana in the country’s center and of Almaty in the south. Furthermore, population migration to the latter due to limited job opportunities in rural areas led to high unemployment and rising pressure on Almaty city social services. As a result, Nurly Zhol aimed at creating a unified national market, involving five macro regions based around hub-cities. These hub cities (Astana, Almaty, Aktobe, Shymkent, and Oskemen) would act as centers of economic activity and concentrate capital, human resources, and technologies. Growth of the hub cities would require development of transport, energy, and housing infrastructure. This was expected to create demand for equipment and materials and stimulate manufacturing. To facilitate economic activity, the program involved public financing for small and medium-sized enterprises, especially those in the manufacturing industry. This was expected to preserve existing jobs and create new ones, while establishing foundations for economic prosperity and sustainable long-term growth.
Nurly Zhol envisaged the development of the domestic transport infrastructure alongside international transport corridors and multimodal freight systems. Due to its central location, Astana was given a key role in facilitating links between all macroregions and serving as the national and international transport hub. Improvement to the transport system was essential for Kazakhstan’s growth due to its large territory and low population density (7 persons per km2). In addition, earning transit revenues from China–Europe trade was important for reducing Kazakhstan’s dependence on oil exports. In other words, transportation represented an alternative source of revenue, jobs, and balanced regional development.
Since Kazakhstan had a strategic interest in improving connectivity and integration, it supported China’s Belt and Road Initiate (BRI) announced in 2013 (See Appendix A). The large-scale domestic investment within the Nurly Zhol program and synergies with the BRI gave a significant impetus to Kazakhstan’s infrastructure development. Of all regions of Kazakhstan, the city of Astana was the main beneficiary of increased railway freight transit, producing 16% of the country’s value of transport and warehousing services. In addition, the volume of railway freight transported via Astana grew at 9% per year as opposed to the 1% national growth rate. As a result, in a short time, Astana became a key node on the Eurasian Land Bridge, a BRI transit corridor (See Figure 1, Appendix A).
Figure 1. Astana, Kazakhstan, and key railroads along the Silk Road Economic Belt. Shapefile of existing and new railways is based on [12]. Map lines delineate study areas and do not necessarily depict accepted national boundaries.
Urbansci 09 00100 g001
While the Nurly Zhol infrastructure program targeted transport networks, the focus of Nurly Zher (‘bright land’) programs shifted to urban development. The main goal of this program was increasing access to housing from the average per capita housing area of 21 m2 in 2015 to 26 m2 in 2025 by stimulating residential construction. In addition, the Nurly Zher program aimed to improve water supply and district heating systems, as well as renovation of existing housing stock. Again, Astana was the main beneficiary of such programs: while accounting for 4.6% of the country’s population it received 10.5% of the countrywide investment in fixed capital. Overall, the two state infrastructure programs utilized savings from accumulated oil export revenues as well as external funding and included the following expenses:
  • Nurly Zhol: financing large-scale transport projects and formation of regional hub cities (2015–2019, USD 9 billion budget); support of municipal infrastructure, local roads, mobility, and productivity (2020–2025, USD 12.8 billion budget).
  • Nurly Zher: subsidies for mortgage lending; subsidies for construction by individuals, cooperatives, and private developers, and construction of rental housing for the socially vulnerable (2017–2019, USD 2.3 billion budget); development of municipal infrastructure including central heating, water supply and sanitation; institutional and regulatory reforms; and increasing housing area by 20.7 million m2 per year (2020–2025, USD 12.6 billion budget).
Such accelerated infrastructure expansion may lead to multiple economic and social benefits. However, it may increase pollution, land degradation, and loss of habitat, especially in countries with weak environmental governance [13,14]. Previous studies of Astana’s key performance indicators suggested that urban and spatial planning, access to quality housing for all, access to quality urban data, solid waste management, and public building sustainability represent priority areas for improvement of Kazakhstan’s capital city [15,16]. However, while analysis of land use changes in Astana is emerging [17,18,19], there remains limited understanding of how Astana’s growth affected the environment and how such changes compared to other regions of the country, as well as international comparators. Therefore, our research contributes to filling this literature gap as an in-depth multi-dimensional analysis of a city, strongly influenced by rapid expansion and public infrastructure programs. We use both the official socio-economic data and open-source remote-sensing data to analyze the swift development of Kazakhstan’s capital city from the sustainability point of view. As we study the outcomes of Astana’s growth in the economic, socio-cultural, and environmental dimensions, we find that since 2000, Astana led other regions in Kazakhstan in tackling poverty and income inequality, while improving access to housing, healthcare, education services, and cultural amenities. However, our study demonstrates that two decades of massive investment and quadrupling of Astana’s population came at a cost of very intensive use of financial and natural resources. Furthermore, our finding of a drastic reduction in its green and blue lands implies that Astana’s development veered off the sustainability path, which was at the core of its Master Plan adopted at the turn of the century. Thus, the main contribution of our study is in providing scientific justification for policies promoting compactness and connectedness of urban areas in Kazakhstan while supporting further improvement in living standards for all. These findings on Astana are relevant for many cities in Kazakhstan as other studies revealed a number of similar pressing challenges in urban life. They include low population density, low availability of green space, uneven access to basic urban services (drinking water, sanitation, and heating), air pollution, underdeveloped network infrastructures (public transit and internet), the gender income gap, and limited urban data availability [20,21]. Finally, our research contributes to raising stakeholders’ awareness on the extent of urban sprawl and challenges of urban renewal. These topics resulted in many studies of cities in other parts of the world, but their relevance and scope in the former Soviet Union remain under-researched. Specifically, a study by the World Bank found that urban sprawl and falling population densities featured in both expanding and declining urban centers of Eastern Europe and Central Asia [22]. Furthermore, a study of ten cities in the former Soviet Union (Almaty, Baku, Kiev, Minsk, Moscow, Riga, St. Petersburg, Tashkent, Tbilisi, and Yerevan) demonstrated that their area increased by 1.6% per year on average during 1990–2015 [23]. In contrast, we find that urban areas in Astana increased by 3% and 8% per year during 2000–2014 and 2014–2022, respectively. Thus, our finding of unprecedented urban expansion in this region underscores challenges to its sustainable growth. Finally, our study highlights the need for incorporating green and blue infrastructure into the traditional infrastructure projects that may be implemented in the future in Kazakhstan and the wider region.

2. Materials and Methods

2.1. Sustainability Framework for Analyzing Urban Development

Infrastructure is categorized into transport, energy, communication, or economic types; it may be linear (e.g., power line) or nodal (hydropower plant). Infrastructure creates networks whose benefits increase with the number of users [2]. This is best illustrated in the context of urban settlements. Agglomeration effects of cities result in higher productivity and incomes due to concentration of economic activity and improved access to public services. The goal of investing in infrastructure is to increase connectivity, boost productivity, and promote development. A subsequent rise in trade creates new types of production, technology transfer, and increased income. However, the resulting economic growth is associated with unequal opportunities, depleted natural resources, and environmental degradation. Therefore, sustainable development requires that satisfying the needs of the current generation does not result in diminished opportunities for future generations for satisfying their own needs [24]. Thus, sustainability calls for maintaining balance between environmental, socio-cultural, and economic aspects of development [25]. This approach is consistent with the three pillars of sustainable development, as well as the concept of the triple bottom line (TBL): economic prosperity, environmental quality, and social equity [26]. These sustainability pillars form the basis of the Sustainable Development Goals (SDGs), adopted by the United Nations Organization. Specifically, SDG11 underscores that cities and human settlements should be inclusive, safe, resilient, and sustainable.
The application of the three pillars concept to urban sustainability analysis has taken different forms [27]. Commonly used methods of urban sustainability analysis are indicator (index-oriented) frameworks and sustainability rating systems [28]. Other approaches include principle-based frameworks, spatial analysis and urban form, multi-criteria decision-making, urban metabolism, eco-efficiency assessment, impact assessment, asset-based frameworks, and urban carrying capacity [29]. We adopt both the indicator-based framework and spatial analysis [30]. For the former, we select a range of indicators that are reported by Kazakhstan’s official data sources. This approach has the advantage of offering evidence-based assessment. However, the disadvantage is the risk of handpicking indicators or limited coverage offered by them. As a result, when selecting indicators, our main criteria were their relevance to SDGs or sustainability pillars and commonality of their usage in previous research. In addition, a key requirement for indicator selection was the availability of annual data over a sufficiently long period. This was important for evaluation of the same set of performance indicators prior to and during the implementation of the infrastructure programs. Based on these criteria, we propose analyzing three groups of indicators.
First, to assess economic activity in the capital city, we analyze changes in income using Gross Regional Product (GRP). We adjust monetary values for inflation using 2010 as a base year and report such values in Tenge (KZT), Kazakhstan’s currency. In addition, we consider changes in population, investment, housing prices, housing area, and number of vehicles. Second, to capture changes in socio-cultural outcomes, we analyze data on poverty, income inequality, public safety, access to education, healthcare, and cultural amenities. Third, we evaluate the use of natural resources including energy production, air pollution, water use, and the quarrying of minerals. The source of these data is the National Statistics Bureau of Kazakhstan [31].
Our sustainability pillars analysis focuses on two periods, 2000–2013 and 2014–2022. The first period corresponds to initial years after Astana became the national capital and the years of the oil boom. The second period captures the slowing down of economic growth, state infrastructure programs, and the COVID-19 pandemic. Finally, we compare each indicator for Astana to the one for the entire country and Almaty city using a per capita basis. However, we execute care in comparing such values due to the differences in the economic structures of the city vs. the country. Specifically, industry (mostly extractive industries) and services both account for 45% of national output. In contrast, services (public administration, healthcare, education, and transportation) account for 82% of economic activity in Astana (85% in Almaty), while industries (mostly construction and utilities) produce the remaining output of the city. This distinction is important because use of natural resources is much more intensive in industry than in services [32]. This implies that per capita resource intensity in Astana city should be much lower than at the country level and similar to that of Almaty city.

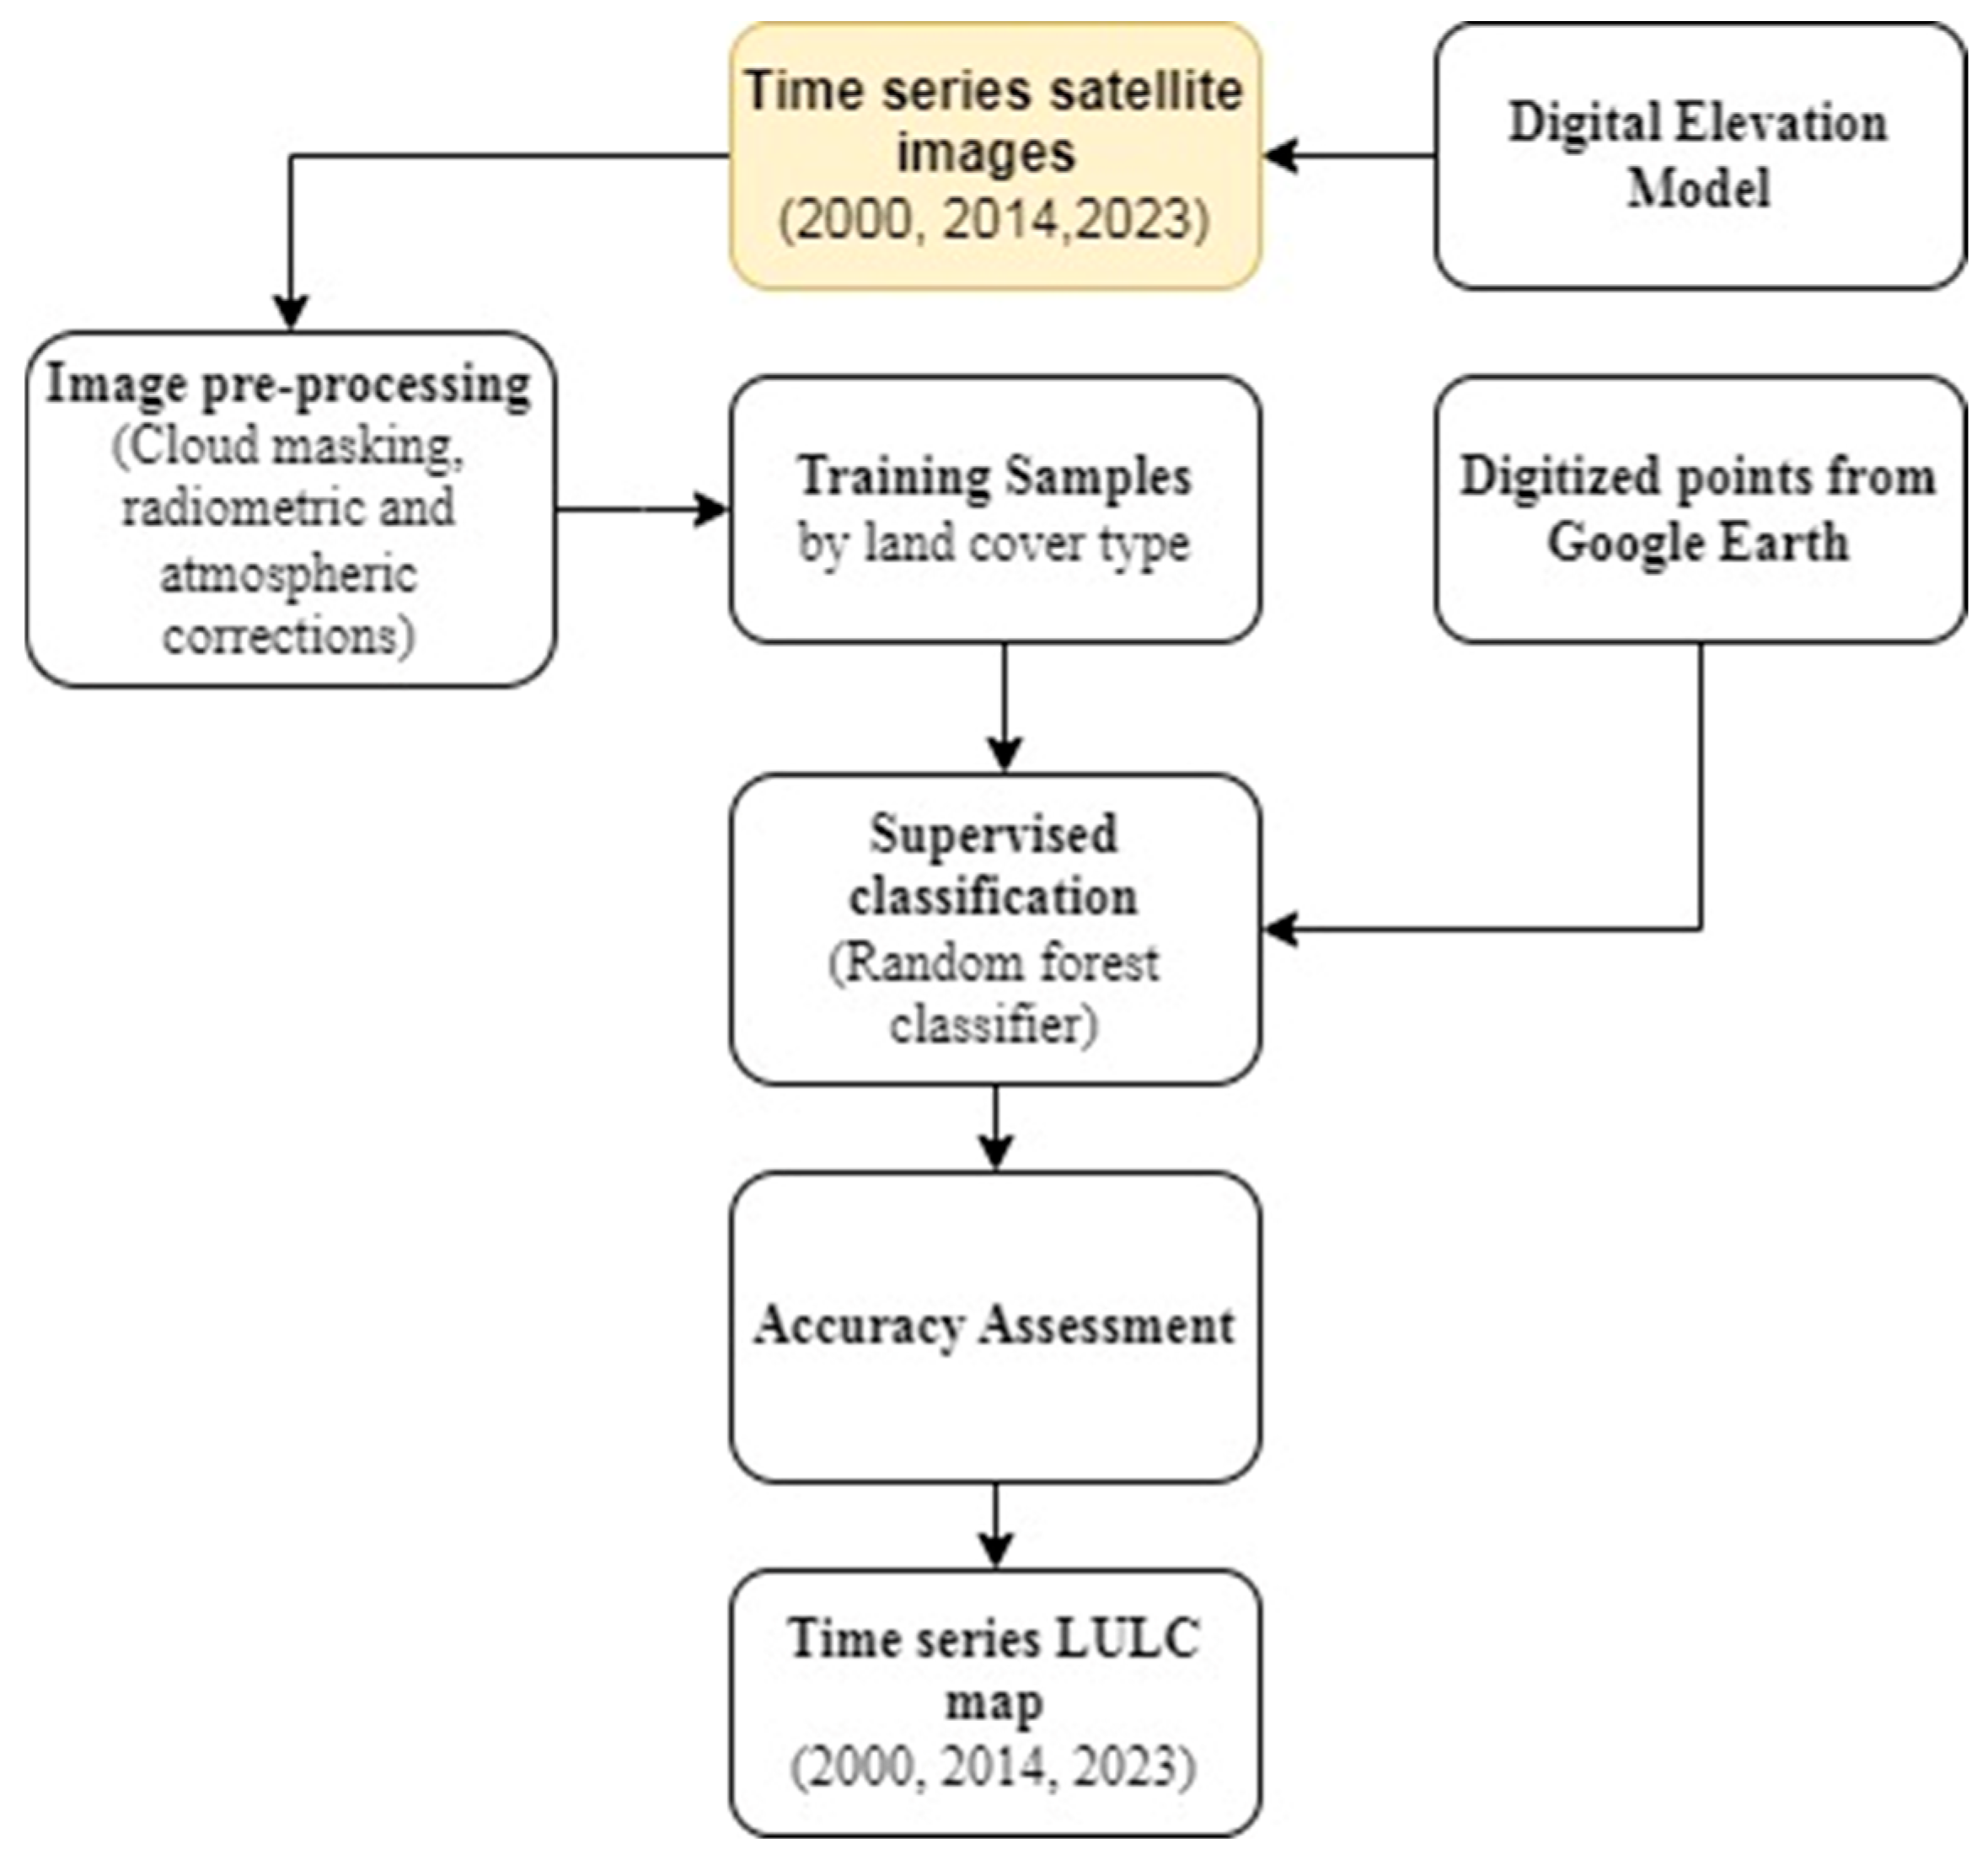
2.2. Spatio-Temporal Analysis

The impacts of infrastructure projects on the environment may be analyzed using the concept of Earth systems [33]. Earth systems include atmosphere, hydrosphere, geosphere, and biosphere [34]. Human activity disrupts their natural processes and compromises their ability to restore equilibrium. Such effects may be direct (e.g., from altering river systems and exacerbating water stress), indirect (e.g., due to new settlements), and cumulative (due to interaction of multiple direct and indirect effects). For instance, a Special Economic Zone (SEZ) is an example of economic infrastructure that facilitates production using financial incentives and concentrates economic activity within a region. A SEZ may affect the atmosphere due to air pollution and noise, hydrosphere due to drainage-flooding risks, pollution and sediments in runoff, the geosphere due to soil erosion and pollution, the biosphere due to habitat loss, and fragmentation due to land cover change and urbanization [34].
To complement our study of Astana’s environmental outcomes, we focus on analyzing the impact of urban development on the geosphere. Specifically, we study changes in land use and land cover (LULC) using open-source remote sensing data. LULC analysis is one of the most commonly used indicators of Earth surface changes [35,36] and is widely applied to assess factors influencing the hydrological cycle, energy balance, carbon dynamics, and ecosystem services [37,38]. Remote sensing-based LULC analysis has been widely used to evaluate and monitor urban changes, assess the impacts of land use and rapid urbanization, and examine their environmental effects [39,40]. Sentinel and Landsat products, with their high-to-medium spatial and temporal resolutions, serve as suitable data sources for extracting data on urban dynamics and monitoring changes over time [41,42].
To conduct LULC analysis, we obtain Astana city boundaries as of 2022 from Humanitarian Data Exchange (https://data.humdata.org/dataset/ accessed on 1 October 2024). Then, we use Sentinel-2 and Landsat-7 and 8 satellite data to conduct LULC mapping. Sentinel-2 Multi-Spectral Instrument data, along with surface reflectance data from Landsat-7 and 8, provide open access to medium-resolution imagery. We have accessed these data via the Google Earth Engine (GEE) platform (https://earthengine.google.com/ accessed on 1 October 2024) and selected imagery from June to July for 2000, 2014, and 2023, as these periods correspond to the growing season in Astana. All selected images had cloud cover of less than 5% (See Table 1).
Next, we apply machine-learning algorithms within the GEE platform. The Classifier package on the GEE platform enables supervised classification using traditional machine learning algorithms, including CART, Random Forest (RF), and Support Vector Machine. Both the CART and RF classifiers are widely used in LULC classification, offering high accuracy, robust handling of noise, and feature selection [43]. The CART classifier, in particular, effectively captures the complexity and diversity of land cover in urban settings [44]. Therefore, we utilize the CART classifier for LULC analysis based on the extracted training samples, as it is well suited for urbanized areas in Astana. Our model was developed based on the steps outlined in Figure 2. LULC changes were performed in GEE, while the areal changes in LULC types were assessed in ArcMap 10.7.1.
To conduct land cover analysis, we apply the classification system developed by Anderson et al. [45]:
  • Water: water bodies, including rivers, lakes, wetlands, and artificial reservoirs.
  • Wetland: marshes, mudflats, swamps situated on the shallow margins of bays, lakes, ponds, streams, rivers, and manmade reservoirs.
  • Vegetation: dense green vegetation, including deciduous, evergreen, and mixed forests.
  • Grassland: shrubs, rangelands, cropland and pastures, and sparse vegetation.
  • Urban: built-up environment, roads, industrial and commercial complexes.
  • Barren land: soil, sand, rocks, dried-up lakebeds, mines, pits, and transitional areas (vegetation clearing for agriculture, wetland drainage for development, temporary exposure of land due to planned construction activities).
To perform accurate assessment, we evaluated the results of the LULC classification using Google Earth, with 150 randomly generated points in ArcMap 10.7.1, and an assessment matrix that incorporates user classification and a reference image. We conduct Kappa analysis and calculate the overall accuracy, estimated as follows:
O v e r a l l   a c c u r a c y = N u m b e r   o f   c o r r e c t   p o i n t s T o t a l   n u m b e r   o f   p o i n t s
Kappa analysis is a discrete multivariate technique used in accuracy assessments [46] that calculates the Khat statistic, an estimate of kappa, to quantify the level of agreement or accuracy [47]. The Kappa analysis is determined as follows:
K = N i = 1 r x i i i = 1 r ( x i + X x + 1 ) N 2 i = 1 r ( x i i X x + 1 )
Next, we compare obtained values of LULC classification to indicators from Astana’s Master Plan [7]. The Master Plan envisaged that urban greenery (parks, boulevards, green spaces along the riverside, etc.) would reach 6.81 km2 in 2020, or 9.9 m2 per person (based on the projection of population growth of 3% per year). In addition, the plan envisaged that the buffer belt would reach 168 km2 or 242 m2 per person by 2020. Finally, we analyze changes in broader land use types [48]:
  • Blue infrastructure: water bodies and their functions in ecosystems, i.e., our LULC types of water and wetlands;
  • Green infrastructure: green spaces that enhance ecosystem services and climate resilience, i.e., our LULC types of vegetation and grassland;
  • Gray infrastructure: engineered structures that support connectivity and multi-functionality, i.e., our LULC types of urban and barren land.

3. Results

3.1. Sustainability Pillars of Astana’s Development
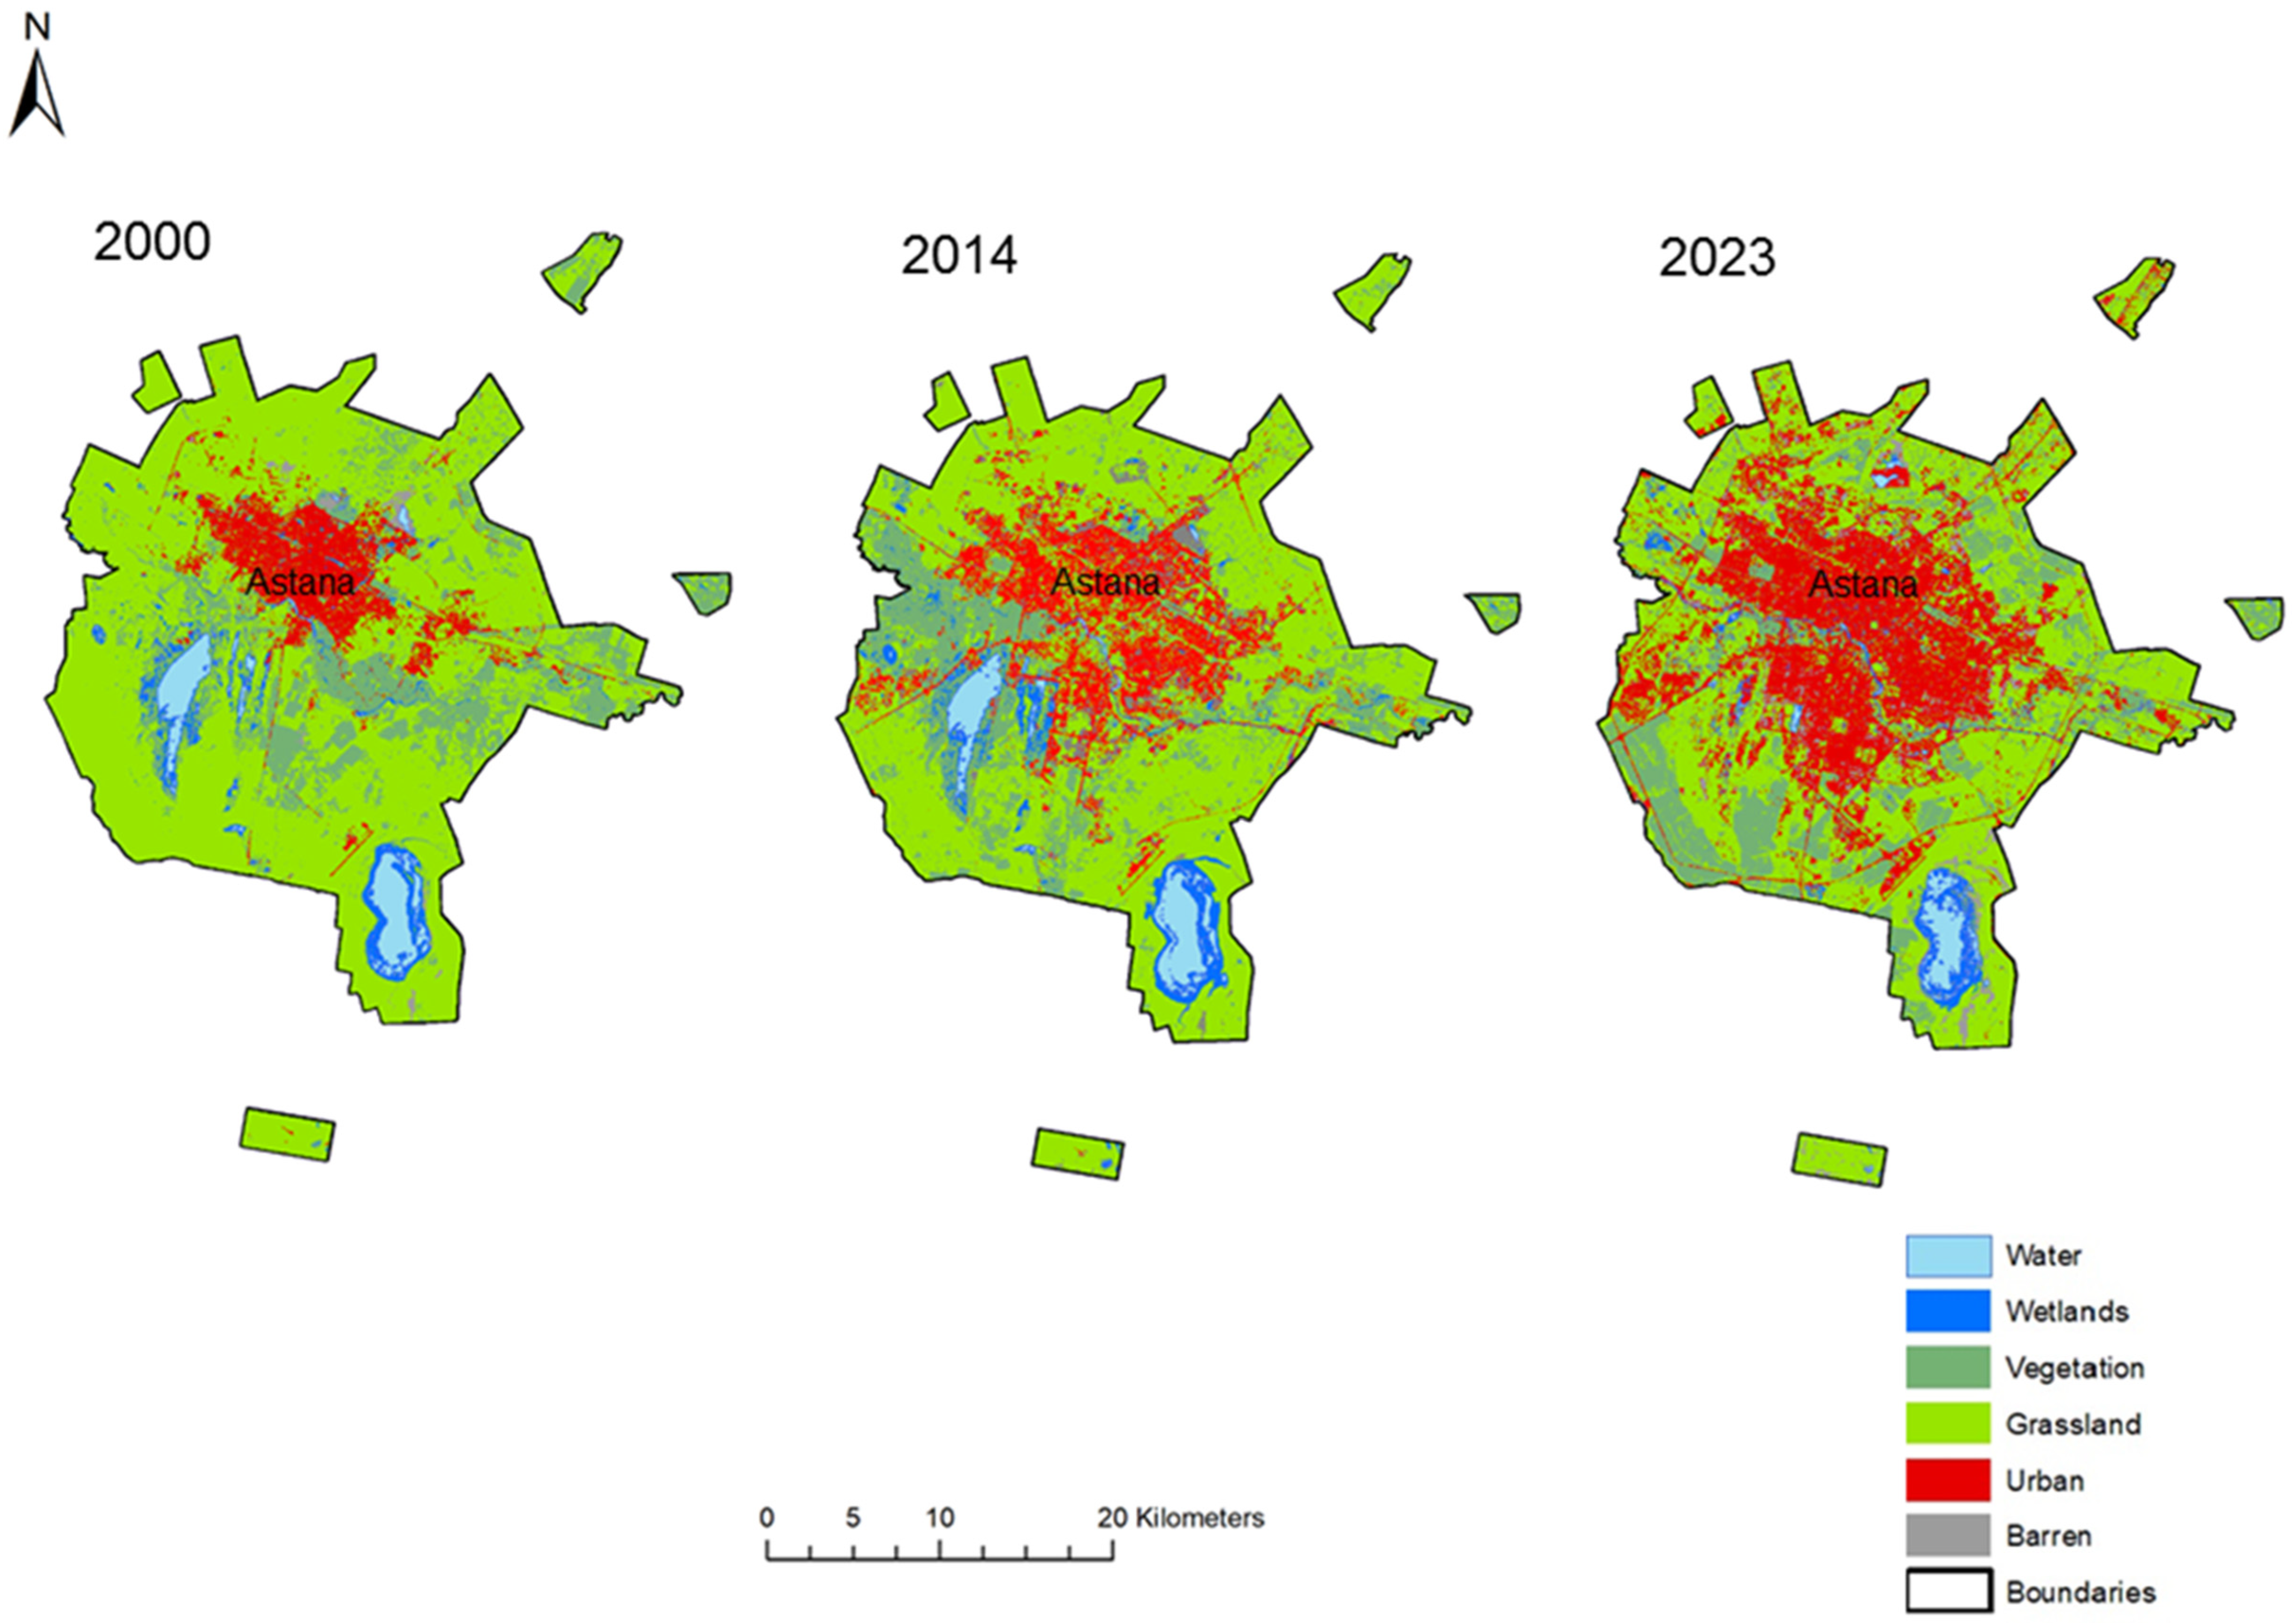
Kazakhstan’s economic growth is closely correlated with construction activity (See Figure 3). Starting from the early 2000s, residential construction surged both at the national level and in the capital city. However, differences in the magnitudes of per capita construction investment were astounding; in Astana, investment levels exceeded the national average by a factor of 12 and 4.5 in 2000 and 2022, respectively. In fact, the value of construction in Astana accounted for a third of all economic activity in the city in some years. Moreover, note that 45% of all investment in Astana was publicly funded. The constantly growing construction activity allowed Astana residents to quickly close the initial gap in housing availability and achieve 20% greater housing area per capita, compared to the national average. Shortage of housing in the new capital was especially striking around 2000 when rental prices in Astana represented over 250% of the national average (See Table 2). A major cause of the shortage was a large inflow of population, which grew at 5.6% per year in Astana vs. the 1.2% national 2000–2022 growth rate. We also note that the massive construction activity in Astana was associated with a rapid increase in the number of heavy vehicles, especially during the 2000s.
After 2010, income growth decelerated as international prices of commodities exported by Kazakhstan declined. Although Astana’s per capita GRP reversed its upward trend after 2014, it is currently 40% higher than the average for the entire country. Even though growth in rental prices slowed down considerably after 2014, current Astana’s rental prices are 50% higher than on average in the country. Such high rental prices in Astana reflect the high income of its residents who have consistently enjoyed a greater number of cars per person than in other parts of the country. Overall, most indicators of Astana’s economic activity exceeded the national levels in absolute terms or in growth rates (such cases are marked by bold font in Table 2). Furthermore, notwithstanding the overall tendency for slowing down, Astana’s population and per capita housing area continued growing at very high rates throughout the two decades of our analysis. In addition, despite the decline of Astana’s GRP in the later years, residential construction continued growing at over 10% per year. Finally, comparison of the two largest cities indicates that around the year 2000, Almaty had the highest level of economic prosperity in Kazakhstan. However, by 2022, most economic indicators of the two cities leveled out.
Next, analysis of socio-cultural performance (Table 3) suggests that poverty was relatively low in Astana, which contrasted the widespread poverty elsewhere in the country during the 1990s to early 2000s. Similarly, from the point of view of income inequality, Astana compared favorably to most other parts of Kazakhstan. Healthcare services and health outcomes in Astana initially lagged behind the rest of the country but improved over the years. Public safety in Astana in terms of injuries improved but declined in terms of crime rates. Access to school-level education in Astana compared favorably to other regions. However, the latter made more progress in providing early childhood and preschool programs. A comparison of the two major cities suggests that Astana has considerably lower levels of poverty and income inequality, and better access to public schools and hospitals than Almaty. At the same time, cultural amenities (e.g., library use, music performances) and access to preschool programs continue to be higher in Almaty than in Astana.
Now, we turn to the analysis of natural resource use that accompanied the rapid expansion of economic activity in Astana (See Table 4). Extensive construction activity required large volumes of materials, commonly sourced from local quarries. The quantity of rock mined around Astana represented only 2% of the national level in 2000 and reached 11% by 2022, growing at 6.6% per year. Furthermore, production of non-metallic mineral products (concrete, bricks, plaster, etc.) in Astana exceeded the national average by a factor of 3.3 and 2.6 in 2000 and 2021, respectively. Electricity production kept at the pace of population increase both in the capital and countrywide. Differences in their levels reflect the dissimilar output structures as industry accounts for 45% of output of the entire country vs. 18% in Astana. Next, per capita district heat production in Astana was higher than on average in the country, which may be related to its northerly location and cold climate. As we consider drinking water supply, we note that per capita water supply in Astana was 30–70% higher than on average in the country, but not as high as in Almaty. Furthermore, forestry services in Astana represented 2–2.5 times more than the national average. The latter fact implies a considerable difference since Astana’s area represents only 0.03% of the territory of Kazakhstan. Finally, although air pollution from point sources decreased both at the country level and, in particular, in Astana, growth of solid waste in the capital city significantly outpaced the increase in its population. In fact, Astana’s residents generated twice as much communal waste per capita compared to the national average. This finding presents a serious concern because the nation-wide household solid waste recycling rate in Kazakhstan is at most 15%, and Kazakhstan is among the bottom 5% of countries according to the Environmental Performance Index for recycling [49]. In summary, during the last two decades, Astana experienced an economic and construction boom, which required extensive use of resources. Most of Astana’s resources were used at above-national levels, in particular, minerals, municipal waste, and forestry services. A comparison of environmental indicators of the two cities suggests that, except for water and electricity, per capita use of other resources in Astana exceeds those of Almaty. This provides additional evidence of the excessive resource intensity of Astana’s development.

3.2. Land Impacts

Astana is located in an arid steppe zone and cold continental climate. The city occupies 797 km2 and has an average wind speed of 4.6 m/s, mean annual precipitation of 347 mm, and mean annual temperature of 4.3 °C. Temperatures during 2000–2023 ranged between an average low of −15 °C in January and an average high of 21 °C in July. There are multiple fresh and salt-water lakes around Astana. A designated UNESCO heritage site, Korgalzhyn State Nature Reserve, “wetlands of outstanding importance for migratory birds, including globally threatened species” [50], is 160 km southwest of the capital. Similarly, the wetland areas in Astana used to support over 300 species of terrestrial invertebrates, 164 bird species, and 98 plant species [51,52,53].
Figure 4 provides an overview of the extent of each LULC category in the year 2000 (soon after Astana became a capital city), 2014 (before the beginning of Nurly Zhol and Nurly Zher infrastructure programs), and 2023 (referring to the most recent summer-time data as 2024 observations are problematic due to the unprecedented floods in northern Kazakhstan and Russia’s southwestern Siberia). Accuracy assessment of the 2023 LULC map resulted in an overall accuracy of 89% (Equation (1)) and a kappa coefficient of 0.87 (Equation (2)). According to Cohen’s [54] kappa statistics criteria, an agreement is considered ‘almost perfect’ when the coefficient is larger than 0.81.
Our classifications indicate that, in 2000, green infrastructure predominated, covering over 84% of the total area (Table 5). By 2014, gray infrastructure increased from 9% to 17% of the total area, while displacing the grasslands. By 2023, gray infrastructure reached over 30% of the total area and displaced both green and blue infrastructure. Figure 4 illustrates the distribution of urban areas in 2000, which were primarily concentrated in the northern region. By 2014, urban expansion shifted southward, replacing previously blue and green infrastructure. A comparison of 2014 and 2023 reveals an accelerated growth rate of urban areas, accompanied by a significant reduction in wetlands located in the south. When we interpret our findings in the context of population growth, it becomes evident that the rate of contraction of per capita green infrastructure remained relatively constant throughout the study period, whereas the reduction in per-capita blue infrastructure accelerated during the later period.
Let us now compare these findings to the objectives outlined in the 2001 Master Plan. Our results indicate that the vegetation area in Astana remained unchanged between 2000 and 2023 at 144 km2. This number is close to the 148 km2 area of the Green Belt reported by city authorities in 2021. However, both values fall short of the Master Plan’s targets for the total and per capita areas of the Green Belt. Furthermore, as demonstrated in Table 3, the Green Belt forestation project incurred disproportionately high expenditures on forestry services. Additionally, the Master Plan did not anticipate the development of the southwestern part of the city, where built-up areas have displaced a significant wetland body (see Figure 4).

4. Discussion

Revenue from oil exports and state infrastructure programs enabled Astana to attract population and investment. In addition, location along the BRI corridor allowed the capital city to diversify its sources of income and earn revenues from transport and warehousing. Per capita residential construction investment in Astana grew at over 10% per year for two decades, making housing more accessible and affordable. However, our results suggest that the state-funded housing and other urban infrastructure investment created few economic opportunities in the city as its per capita income declined during 2014–2022. Although, it is possible that the positive impact of the state programs was outweighed by the effects of the lockdown during the COVID-19 pandemic. Furthermore, the construction boom resulted in the very intensive use of resources and rapid changes in land use–land cover. A significant loss of vegetation occurred along the Yesil River and its southern outreaches (See Figure 4). Although extensive forestation activities on the city edges means the total vegetated area remain unchanged, they required 2–2.5 times more in terms of forestry expenditures per capita in Astana, as compared to the national average (See Table 3). The most troubling consequence of urban expansion in Astana was the near disappearance of the large wetland body in the southwestern direction from the city center. Such wetlands are important for flood control, biodiversity preservation, carbon sequestration, and recreation [55]. This loss of blue and green lands will likely contribute to the pattern of rising temperatures within Astana’s dense districts compared to the nearby settlements [56,57]. The area of disappearing wetlands corresponds to the Taldykol lakes [58]. Starting from 2012, the Association for the Conservation of Biodiversity of Kazakhstan and the UK Royal Society for the Protection of Birds collected evidence on the biodiversity significance of Taldykol lakes [59]. Moreover, scientists carried out a cost–benefit analysis demonstrating that ecosystem benefits from the Taldykol lakes significantly outweighed their cost [60]. However, despite the intention to create an eco-park around the Taldykol, drainage of the lake started in 2020, followed by residential and road construction. Lack of public engagement by the city authorities and limited transparency of the decision-making on the Taldykol development resulted in numerous public protests of Astana’s residents and environmental activists [61].
Let us compare a 300% increase in built-up areas in Astana between 2000 and 2023 to evidence from similar spatio-temporal studies of other rapidly growing cities. Singh et al. [62] analyzed urban expansion in Delhi, India, where built-up areas increased by 197% between 1989 and 2020. Similarly, Baga et al. [63] reported comparable LULC dynamics in Karachi, Pakistan, with urban areas expanding by 159% from 1990 to 2020. In contrast, Ding et al. [64] documented urbanization trends in major Chinese cities between 1990 and 2015, where built-up areas expanded by an average of 33%. Notably, during the same period, vegetation cover in Chinese cities increased by 37% due to government initiatives aimed at enhancing urban ecosystem functionality and supporting the growing population. In both Delhi and Karachi, the initial contraction of green areas was partially mitigated through reforestation, afforestation, and the establishment of biodiversity parks. This comparison of our results to international evidence allows us to conclude that the growth of built-up areas in Astana was significantly higher compared to other rapidly expanding cities.
In general, international experience suggests that large-scale public funding of residential construction is prone to corruption, often leading to low quality housing and inefficient resource use [65,66,67]. Such research on the effectiveness and efficiency of Kazakhstan’s housing construction programs is scarce. However, there is evidence that these programs mostly benefited Kazakhstan’s construction companies and banks [68]. In addition, analysis of patterns of construction within the Nurly Zher program revealed that most new residential building were located on the edges of cities and towns, where critical service facilities (schools, recreation facilities, pharmacies, and public transportation lines) were at least 1 km away [69]. This is indicative of urban sprawl, which is known to have considerable environmental and social impacts, including degradation of local ecosystems, increased fuel consumption, air pollution, higher public service costs, and greater time lost to traffic congestion [70]. Such sprawl can be managed by promoting urban compactness and densification [71]. Our results from Table 4 suggest that population density within gray infrastructure remained relatively constant in Astana. However, Figure 4 suggests that urban areas became less compact and more scattered on their edges, encroaching on Astana’s green and blue infrastructure.
As global warming and urbanization intensify, green infrastructure is increasing being integrated to mitigate associated pressures, offering diverse environmental and cultural benefits, while contributing to climate change adaptation and mitigation [72]. Designed to replicate natural hydrological processes, blue infrastructure has emerged as an effective strategy for improving sustainability in urban environments [73]. Bellezoni et al. [74] showed that blue and green infrastructure provides multiple functions for urban environments, including improved food production, water management, and energy efficiency. It also reduces urban heat island effects, and strengthens resilience to environmental challenges, supporting sustainability and quality of life. Iungman et al. [75] studied the impact of urban heat islands on all-cause mortality for adults in 93 European cities during summer 2015. They concluded that increasing tree coverage to 30% could reduce temperatures by an average of 0.4 °C and potentially prevent 2.6 premature deaths, accounting for 1.8% of all summer deaths. Therefore, as Astana continuous to develop and urbanize, integrating green and blue infrastructure could enhance resilience and mitigate the impacts of extreme weather events, including heat waves, floods, and droughts. Future climate projections indicate increasing variability in water availability, with extended droughts alternating with periods of intensified precipitation in Central Asia, which is particular vulnerable to these impacts [76,77]. These changes pose significant challenges for urban sustainability in Kazakhstan, particularly in regions like Astana, where urbanization is accelerating. Climate change may further amplify the negative effects of urbanization, including rising surface temperatures and increased flooding [78].

5. Conclusions

Urbanization presents both opportunities and challenges for sustainable development [79]. In Kazakhstan, official forecasts anticipate a rise in the urbanization rate from 58% in 2023 to 70% in 2050, when 37% of the country’s population will be concentrated in the three largest cities [80]. Investment from state infrastructure programs and the convenient location along a BRI transport corridor allowed Astana to attract a larger population and expand construction. However, two decades of double-digit growth of fixed capital investment required very intensive use of natural resources. Although income and investment increased even more rapidly at the national level, Astana’s construction boom consumed natural resources at intensities that far exceeded the national averages. In addition, we find that rapid expansion of the city’s gray areas, which tripled in size between 2000 and 2023, caused a reduction in green and blue lands by 30% and 23%, respectively. Artificial forestation allowed Astana to offset the loss in vegetation due to the expansion of built-up areas, albeit at a significant financial expense. As a result, our analysis finds that resource efficiency (an element of metabolism) and taking advantage of natural amenities (an element of symbiosis), outlined by Astana’s original Master Plan, were especially difficult to implement.
What are the limitations of our analysis and recommendations for future research? Our study employed a method based on the GEE cloud platform to accurately assess LULC changes in Astana using historical Landsat and Sentinel data. While the results demonstrated high overall accuracy (89%) and kappa coefficient (0.87), there remains significant potential for further improvements. Among challenges encountered was the misclassification of barren areas, which were often identified as water during the accuracy assessment. This issue may be attributed to the presence of swallow wetlands in Astana. These wetlands, primarily fed by snowmelt and rainfall, experience fluctuating water levels due to low summer precipitation. Our results showed that urban expansion has been occurring in reclaimed areas of these wetlands, where backfilling is still in progress. This process leads to gradual transformation of wetlands into barren areas, which are subsequently converted into urban areas. Misclassification of barren areas is a common issue in many studies [81,82], especially in areas with increased anthropogenic activity [83]. This challenge can be addressed by utilizing spectral indices, including the normalized difference built-up index (NDBI) and the normalized difference tillage index (NDTI) for accurate assessment of barren areas, as well as the modified normalized difference water index (MNDWI) for water areas [41,84]. Additionally, pan-sharpening has been suggested as a method to enhance the medium spatial resolution of Landsat data [82]. For future studies, the outcomes of LULC classification can be compared with the global land cover map at 10 m resolution available in GEE, specifically the ESA WorldCover 10 m v100, which is available for 2020 and later.
Furthermore, our findings from the sustainability pillars analysis are based on limited socio-economic city-level data. Thus, future research should re-evaluate the outcomes of Astana’s growth when more such data become available. In addition, our study finds evidence of modest return on investment in Kazakhstan’s state infrastructure programs, for example, income levels declined in the capital city despite receiving disproportionate funding. Therefore, the long-term impact of these state programs should be re-evaluated by future research as well. Looking forward, continuation of intensive use of Astana’s natural resources for its rapid development may be difficult to sustain in the future. Specifically, drastically decreasing blue lands in Astana may contribute to rising urban temperature, reduced capacities for natural flood control, loss of biodiversity, and diminished opportunities for recreation. The city’s stakeholders should balance the impacts of prior speedy urban transformation by preserving the remaining green and blue lands. There is an urgent need to research and implement best practices in managing urban sprawl in Kazakhstan and the efficient use of its resources. Astana’s stakeholders should promote urban compactness and connectivity, while prioritizing ecosystem preservation. Local authorities should play a key role in encouraging learning and dialog between city planners, academic institutions, construction companies, and utilities. Our findings from Astana’s case study provide insight into managing its growth, as well as challenges of sustainable urbanization in Kazakhstan and the wider region. Our contribution is in highlighting to the policymakers the importance of maintaining balance between the three pillars of development and the broadening perception of infrastructure. A key policy implication of our research is that including green and blue infrastructure into setting targets, allocating resources, and monitoring, improving, and reporting on traditional infrastructure initiatives is becoming increasingly important for sustainable urban development.

Author Contributions

Conceptualization, Z.A. and M.B.; methodology, Z.A. and M.B.; software, M.B.; validation, Z.A. and M.B.; formal analysis, Z.A. and M.B.; investigation, Z.A.; resources, M.B.; data curation, M.B.; writing—original draft preparation, Z.A. and M.B.; writing—review and editing, Z.A.; visualization, M.B. All authors have read and agreed to the published version of the manuscript.

Funding

This research received no external funding.

Data Availability Statement

The original data presented in the study are openly available in Google Earth Engine at https://earthengine.google.com/ and Kazakhstan Bureau of National Statistics at https://stat.gov.kz/en/.

Conflicts of Interest

The authors declare no conflicts of interest.

Abbreviations

The following abbreviations are used in this manuscript:
BRIBelt and Road Initiative
GRPGross Regional Product
KZTKazakhstan tenge
SDGSustainable Development Goals

Appendix A

Kazakhstan’s Infrastructure Projects and China’s BRI

China’s leadership announced the Belt and Road Initiative (BRI) in 2013 in Astana, Kazakhstan, and had a vision of improved connectivity and economic integration. This involved investment in transport (rail, roads, and ports) and related infrastructure (power and ICT), as well as policy coordination [85]. China’s BRI aligned well with Kazakhstan’s plans: in 2014, prices for crude oil, the main source of Kazakhstan’s export revenue, collapsed and an economic stimulus package was under consideration. By that time, Kazakhstan’s leadership had already contemplated reviving the ancient Silk Road and becoming “the largest business and transit hub of the Central Asian region as well as a unique bridge between Europe and Asia” [86]. This plan matched the BRI’s goal of developing land corridors, including the Eurasian Land Bridge railway (ELB), which connected China and Europe via Kazakhstan. In fact, of the five proposed BRI routes crossing Central Asia, three would go through Kazakhstan: China–Germany, China–Turkey, and China–Iran transport corridors. Prior to the BRI, slow customs clearance and border delays impeded international trade flows via Kazakhstan. In addition, Kazakhstan’s integration into the international transport system had been constrained by the limited networks and resources of the neighboring countries. Although Kazakhstan did not use much of direct BRI financing from China, it benefited from such financing provided to its neighboring countries and the resulting improvement in their transport systems.
Overall, BRI projects were expected to lead to a reduction in Kazakhstan’s average shipment time by 8% and trading costs by 4% [87]. This would provide an additional boost to the ELB, which offered travel time of 16 days vs. 36–40 days by sea [88]. The ELB started operating in the early 1990s and provided a faster and more reliable cargo delivery by railway compared to sea transport [89,90]. By providing financing and stimulating trade facilitation, the BRI spurred development of logistic services along the ELB and cooperation between national railway companies [90]. In support of the BRI, Kazakhstan invested in improving cross-border and internal rail infrastructure. Kazakhstan’s projects included construction of multimodal terminals at the China–Kazakhstan border crossing, Aktau port on the Caspian Sea, and railroads connecting central regions to western Kazakhstan and railroads connecting Kazakhstan’s western regions to Iran via Turkmenistan [90]. China and Kazakhstan governments coordinated infrastructure program design and implementation due to the acknowledged complementarity of such projects [86]. This allowed China to strengthen its position as the largest user of Kazakhstan’s transit services: China’s share in Kazakhstan’s transit traffic was 56% in 2013 and reached 68% in 2023. During the BRI period, China’s shipments to Kazakhstan increased by 17%, while its shipments via Kazakhstan to other countries increased by 340%. At the same time, the overall volume of transit from all destinations via Kazakhstan more than doubled. The average annual distance of freight railway services grew from 177 billion km during 2000–2010 to 269 billion km per year during 2010–2023. Consequently, Kazakhstan’s export share in service trade (import + export) increased from 27% during 2000–2013 to 40% during 2014–2021, mostly due to the 12% annual real growth of transport export. Transport export, of which 80% was in the form of freight, accounted for 53% of the value of these service exports.

References

  1. Thacker, S.; Adshead, D.; Fay, M.; Hallegatte, S.; Harvey, M.; Meller, H.; O’Regan, N.; Rozenberg, J.; Watkins, G.; Hall, J.W. Infrastructure for sustainable development. Nat. Sustain. 2019, 2, 324–331. [Google Scholar] [CrossRef]
  2. Fay, V.; Toman, M. Infrastructure and Sustainable Development. In Postcrisis Growth and Development: A Development Agenda for the G-20; Fardoust, S., Kim, Y., Sepulveda, C., Eds.; World Bank: Washington, DC, USA, 2011. [Google Scholar]
  3. Larrea, V.; Pelaez, F.; Esenarro, D. Design of a Green Corridor and the Revitalization of the Huatanay River, City of Cuzco, Peru—2024. Urban Sci. 2024, 8, 185. [Google Scholar] [CrossRef]
  4. Atchison, J. Green and Blue Infrastructure in Darwin; Carbon Economies and the Social and Cultural Dimensions of Valuing Urban Mangroves in Australia. Urban Sci. 2019, 3, 86. [Google Scholar] [CrossRef]
  5. Infrastructure Outlook. Forecasting Infrastructure Needs and Gaps. 2025. Available online: https://outlook.gihub.org/ (accessed on 8 March 2025).
  6. Schatz, E. What capital cities say about state and nation building. Natl. Ethn. Politics 2004, 9, 111–140. [Google Scholar]
  7. Final Report: The Study on the Master Plan for the Development of the City of Astana in the Republic of Kazakhstan; Japan International Cooperation Agency (JICA): Tokyo, Japan, 2001. Available online: https://openjicareport.jica.go.jp/pdf/11652708_01.pdf (accessed on 1 August 2024).
  8. Atakhanova, Z. Kazakhstan’s oil boom, diversification strategies, and the service sector. Miner. Econ. 2021, 34, 399–409. [Google Scholar]
  9. Junussova, M. Cities and Local Governments in Central Asia; Routledge: New York, NY, USA, 2020. [Google Scholar]
  10. Kazakhstan Government. Nurly Zhol State Infrastructure Program. 2015. Available online: https://adilet.zan.kz/rus/docs/U1500001030 (accessed on 15 January 2025).
  11. Salimova-Tekay, J. Infrastructure Financing in Kazakhstan; United Nations Economic and Social Commission for Asia and the Pacific: Bangkok, Thailand, 2022; Available online: https://repository.unescap.org/handle/20.500.12870/4340?locale-attribute=es (accessed on 30 November 2024).
  12. Man, C.Y.; Palmer, D.A. Geo-Mapping Databases of the Belt and Road Initiative. 2022. Figshare Collection. Available online: https://figshare.com/collections/Geo-mapping_databases_of_the_Belt_and_Road_Initiative/6076193 (accessed on 1 November 2024).
  13. Ascensão, F.; Fahrig, L.; Clevenger, A.P. Environmental challenges for the Belt and Road Initiative. Nat. Sustain. 2018, 1, 206–209. [Google Scholar]
  14. Butters, C.; Cheshmehzangi, A.; Bakhshoodeh, R. Sustainable Construction: The Embodied Carbon Impact of Infrastructures and Landscaping. Urban Sci. 2024, 8, 76. [Google Scholar] [CrossRef]
  15. United Nations Economic Commission for Europe. Smart Sustainable Cities Profile: Nur-Sultan, Kazakhstan. 2021. Available online: https://www.un-ilibrary.org/content/books/9789210056335 (accessed on 10 December 2024).
  16. Amirgaliyev, B.; Kuchanskyi, O.; Andrashko, Y.; Yedilkhan, D. A Dynamic Model of Profit Maximization for Carsharing Services: Astana, Republic of Kazakhstan. Urban Sci. 2023, 7, 74. [Google Scholar] [CrossRef]
  17. Alipbeki, O.; Alipbekova, C.; Sterenharz, A.; Toleubekova, Z.; Aliyev, M.; Mineyev, M.; Amangaliyev, K. A Spatiotemporal Assessment of Land Use and Land Cover Changes in Peri-Urban Areas: A Case Study of Arshaly District, Kazakhstan. Sustainability 2019, 12, 1556. [Google Scholar] [CrossRef]
  18. Ilyassova, A.; Kantakumar, L.N.; Boyd, D. Urban growth analysis and simulations using cellular automata and geo-informatics: Comparison between Almaty and Astana in Kazakhstan. Geocarto Int. 2021, 36, 520–539. [Google Scholar] [CrossRef]
  19. Saginov, K.; Berdenov, Z.; Inkarova, Z.; Kakimzhanov, Y.; Mendybayev, E.; Ramazanova, N.; Assylbekov, K.; Safarov, R.; Fomin, I. Comparative Analysis of the Infrastructure of the City of Astana with a Sociological Survey of the Mental Well-Being of Citizens in the Context of the Sustainable Development of the Urban Agglomeration. Sustainability 2024, 16, 8623. [Google Scholar] [CrossRef]
  20. Kazakhstan Human Development Report. Urbanization as an Accelerator of Inclusive and Sustainable Development; United Nations Development Program: New York, NY, USA, 2019; Available online: https://hdr.undp.org/system/files/documents/nhdr2019kaz.pdf (accessed on 25 January 2025).
  21. Khamit, A.; Utarbayeva, N.; Shumakova, G.; Makhambetov, M.; Abdullina, A.; Sergeyeva, A. Assessment of the State of the Landscaping System in the City of Aktobe, the Republic of Kazakhstan, under Conditions of Man-Made Load Using Remote Sensing. Urban Sci. 2024, 8, 34. [Google Scholar] [CrossRef]
  22. Cadavid, P.R.; Cineas, G.; Quintero, L.E.; Zhukova, S. Cities in Eastern Europe and Central Asia. A Story of Urban Growth and Decline; World Bank Group: Washington, DC, USA, 2017; Available online: https://documents1.worldbank.org/curated/en/319131510892209158/pdf/AUS12288-REVISED-PUBLIC-ECABRIEFALLWEB.pdf (accessed on 15 March 2025).
  23. Paghosyan, A. Quantifying urban growth in 10 post-Soviet cities using Landsat data and machine learning. J. Remote Sens. 2018, 39, 8688–8702. [Google Scholar] [CrossRef]
  24. United Nations Brundtland Commission. Report of the World Commission on Environment and Development: Our Common Future. 1987. Available online: http://www.un-documents.net/our-common-future.pdf (accessed on 10 January 2025).
  25. Purvis, B.; Mao, Y.; Robinson, D. Three pillars of sustainability: In search of conceptual origins. Sustain. Sci. 2019, 14, 681–695. [Google Scholar] [CrossRef]
  26. Elkington, J. Accounting for the triple bottom line. Meas. Bus.Excell. 1998, 2, 18–22. [Google Scholar] [CrossRef]
  27. Gibson, R.B. Beyond the pillars: Sustainability assessment as a framework for effective integration of social, economic and ecological considerations in significant decision-making. J. Environ. Assess. Policy Manag. 2006, 8, 259–280. [Google Scholar] [CrossRef]
  28. Cohen, M.A. Systematic Review of Urban Sustainability Assessment Literature. Sustainability 2017, 9, 2048. [Google Scholar] [CrossRef]
  29. Kaur, H.; Garg, P. Urban sustainability assessment tools: A review. J. Clean. Prod. 2019, 210, 146–158. [Google Scholar] [CrossRef]
  30. Halla, P.; Merino-Saum, A. Conceptual frameworks in indicator-based assessments of urban sustainability-An analysis of 67 initiatives. Sustain. Dev. 2002, 30, 1056–1071. [Google Scholar] [CrossRef]
  31. National Statistics Bureau of Kazakhstan. Regions of Kazakhstan. 2023. Available online: https://stat.gov.kz/en/ (accessed on 25 May 2024).
  32. Howie, P.; Atakhanova, Z. Heterogeneous labor and structural change in low- and middle-income, resource-dependent countries. Econ. Change Restruct. 2020, 53, 297–332. [Google Scholar] [CrossRef]
  33. Steffen, W.; Sanderson, R.A.; Tyson, P.D.; Jäger, J.; Matson, P.A.; Moore, B., III; Oldfield, F.; Richardson, K.; Schellnhuber, H.-J.; Turner, B.L.; et al. Global Change and the Earth System: A Planet under Pressure, 1st ed.; Springer: Berlin, Germany, 2004; p. 32. [Google Scholar]
  34. Canepa, E.; Builtjes, P.J.H. Thoughts on Earth System Modeling: From global to regional scale. Earth Sci. Rev. 2017, 171, 456–462. [Google Scholar] [CrossRef]
  35. Baigaliyeva, M.; Mount, N.; Gosling, S.N.; McGowan, S. Unravelling long-term impact of water abstraction and climate change on endorheic lakes: A case study of Shortandy Lake in Central Asia. PLoS ONE 2024, 19, e0305721. [Google Scholar] [CrossRef] [PubMed]
  36. Ramzan, M.; Saqib, Z.A.; Hussain, E.; Khan, J.A.; Nazir, A.; Dasti, M.Y.S.; Ali, S.; Niazi, N.K. Remote Sensing-Based Prediction of Temporal Changes in Land Surface Temperature and Land Use-Land Cover (LULC) in Urban Environments. Land 2022, 11, 1610. [Google Scholar] [CrossRef]
  37. Tayebi, M.; Fim Rosas, J.T.; Mendes, W.D.S.; Poppiel, R.R.; Ostovari, Y.; Ruiz, L.F.C.; dos Santos, N.V.; Cerri, C.E.P.; Silva, S.H.G.; Curi, N.; et al. Drivers of Organic Carbon Stocks in Different LULC History and along Soil Depth for a 30 Years Image Time Series. Remote Sens. 2021, 13, 2223. [Google Scholar] [CrossRef]
  38. Lahon, D.; Sahariah, D.; Debnath, J.; Nath, N.; Meraj, G.; Kumar, P.; Hashimoto, S.; Farooq, M. Assessment of Ecosystem Service Value in Response to LULC Changes Using Geospatial Techniques: A Case Study in the Merbil Wetland of the Brahmaputra Valley, Assam, India. ISPRS Int. J. Geo Inf. 2023, 12, 165. [Google Scholar] [CrossRef]
  39. Amini, S.; Saber, M.; Rabiei-Dastjerdi, H.; Homayouni, S. Urban Land Use and Land Cover Change Analysis Using Random Forest Classification of Landsat Time Series. Remote Sens. 2022, 14, 2654. [Google Scholar] [CrossRef]
  40. Zhang, T.; Su, J.; Xu, Z.; Luo, Y.; Li, J. Sentinel-2 Satellite Imagery for Urban Land Cover Classification by Optimized Random Forest Classifier. Appl. Sci. 2021, 11, 543. [Google Scholar] [CrossRef]
  41. Nasiri, V.; Deljouei, A.; Moradi, F.; Sadeghi, S.M.M.; Borz, S.A. Land Use and Land Cover Mapping Using Sentinel-2, Landsat-8 Satellite Images, and Google Earth Engine: A Comparison of Two Composition Methods. Remote Sens. 2022, 14, 1977. [Google Scholar] [CrossRef]
  42. You, H.; Tang, X.; Deng, W.; Song, H.; Wang, Y.; Chen, J. A Study on the Difference of LULC Classification Results Based on Landsat 8 and Landsat 9 Data. Sustainability 2022, 14, 13730. [Google Scholar] [CrossRef]
  43. Shelestov, A.; Lavreniuk, M.; Kussul, N.; Novikov, A.; Skakun, S. Exploring Google Earth Engine platform for big data processing: Classification of multi-temporal satellite imagery for crop mapping. Front. Earth Sci. 2017, 5, 232994. [Google Scholar] [CrossRef]
  44. Pan, X.; Wang, Z.; Gao, Y.; Dang, X.; Han, Y. Detailed and automated classification of land use/land cover using machine learning algorithms in Google Earth Engine. Geocarto Int. 2021, 37, 5415–5432. [Google Scholar] [CrossRef]
  45. Anderson, J.R.; Hardy, E.E.; Roach, J.T.; Witmer, R.E. A Land Use and Land Cover Classification System for Use with Remote Sensor Data; US Government Printing Office: Washington, DC, USA, 1976; p. 964.
  46. Jensen, J. Introductory Digital Image Processing: A Remote Sensing Perspective, 4th ed.; Pearson: Upper Saddle River, NJ, USA, 2015; p. 656. [Google Scholar]
  47. Congalton, R.G. Remote sensing and geographic information system data integration: Error sources and research issues. Photogramm Eng. Remote Sens. 1991, 57, 677–687. [Google Scholar]
  48. Valente de Macedo, L.S.; Picavet, M.E.B.; Puppim de Oliveira, J.A.; Shih, W.-Y. Urban green and blue infrastructure: A critical analysis of research on developing countries. J. Clean. Prod. 2022, 313, 127898. [Google Scholar] [CrossRef]
  49. Egov. Public Services and Online Information. Information on Waste Reduction, Recycling, and Reuse. 2023. Available online: https://egov.kz/cms/en/articles/ecology/waste_reduction_recycling_and_reuse (accessed on 1 December 2024).
  50. United Nations Educational, Scientific and Cultural Organisation (UNESCO). Saryraka-Steppe and Lakes of Northern Kazakhstan. UNESCO World Heritage Convention. 2024. Available online: https://whc.unesco.org/en/list/1102 (accessed on 10 November 2024).
  51. Bragina, T.M.; Bragin, E.A. The Most Important Wetlands of North Kazakhstan (Kostanai Oblast and West Part of North-Kazakhstan Oblast); WWF Russia Nature Conservation Publication Series 5; WWF Russia Nature Conservation Publication: Almaty, Kazakhstan, 2000. [Google Scholar]
  52. IUCN CEM. IUCN Commission on Ecosystem Management Annual Report; IUCN: Gland, Switzerland, 2023; Available online: https://www.iucnrle.org/rle-citation (accessed on 13 November 2024).
  53. Kovshar, A.F. The Key Wetlands of the North Kazakhstan; WWF Brochure in English and Russian: Almaty, Kazakhstan, 2000. [Google Scholar]
  54. Cohen, J. A coefficient of agreement for nominal scales. Educ. Psychol. Meas. 1960, 20, 37–46. [Google Scholar] [CrossRef]
  55. Razzaghi, A.S. To What Extent Have Nature-Based Solutions Mitigated Flood Loss at a Regional Scale in the Philadelphia Metropolitan Area? Urban Sci. 2023, 7, 122. [Google Scholar] [CrossRef]
  56. Berlessova, A.A.; Konstantinov, P.I. Local climate zones in the city of Nur-Sultan (Kazakhstan) and their connections with urban heat island and thermal comfort. IOT Conf. Ser. Earth Environ. Sci. 2020, 611, 012060. [Google Scholar] [CrossRef]
  57. Askar, A.; Abzhanov, N.; Wang, Y.; Zhao, Y.; Lei, J. Temperature variation urban heat island effect in Nur-Sultan during 1973 to 2015. Arid Land Geogr. 2021, 44, 316–326. [Google Scholar]
  58. Baigaliyeva, M.; Atakhanova, Z.; Kairat, A. Spatiotemporal Variations in Urban Wetlands in Kazakhstan: A Case of the Taldykol Lake System in Astana City. Sustainability 2024, 16, 7077. [Google Scholar] [CrossRef]
  59. Association for the Conservation of Biodiversity of Kazakhstan (ACBK). Taldykol Nat. Reserve 2022. Available online: https://www.acbk.kz/article/default/view?id=370 (accessed on 5 November 2024).
  60. Utepov, A.; Jumabayev, S.; Skakova, A.; Salmanova, R.; Kuandykov, A. The economic evaluation of water ecosystem services in urban planning in Nur Sultan, Kazakhstan. Public Policy Adm. 2021, 2, 205–219. [Google Scholar]
  61. O’Connor, S. Urban development and civic activism in Kazakhstan: Green space preservation in the shadow of spectacle. Cent. Asian Aff. 2023, 10, 52–72. [Google Scholar]
  62. Singh, B.; Venkatramanan, V.; Deshmukh, B. Monitoring of land use land cover dynamics and prediction of urban growth using Land Change Modeler in Delhi and its environs, India. Environ. Sci. Pollut. Res. 2022, 29, 71534–71554. [Google Scholar] [CrossRef]
  63. Baga, M.F.; Chen, F.; Lu, L.; Qureshi, S.; Tariq, A.; Wang, S.; Jing, L.; Hamza, S.; Li, Q. Monitoring and Modeling the Patterns and Trends of Urban Growth Using Urban Sprawl Matrix and CA-Markov Model: A Case Study of Karachi, Pakistan. Land 2021, 10, 700. [Google Scholar] [CrossRef]
  64. Ding, Q.; Pan, T.; Lin, T.; Zhang, C. Urban land-cover changes in major cities in China from 1990 to 2015. Int. J. Environ. Res. Public Health 2022, 19, 16079. [Google Scholar] [CrossRef] [PubMed]
  65. Buckley, R.M.; Kalarickal, J. Housing policy in developing countries: Conjectures and refutations. World Bank Res. Obs. 2005, 20, 233–257. [Google Scholar]
  66. Karaman, O. Urban renewal in Istanbul: Reconfiguring spaces, robotic lives. Int. J. Urban Reg. Res. 2012, 37, 715–733. [Google Scholar] [CrossRef]
  67. Kenny, C. Construction, Corruption, and Developing Countrie. World Bank Policy Research Working Paper No. 4227. 2007. Available online: https://papers.ssrn.com/sol3/papers.cfm?abstract_id=996954 (accessed on 18 March 2025).
  68. Temirkhanov, M. Affordable Housing Policy in Kazakhstan: New Approaches are Required. Halyk Research. 2024. Available online: https://halykfinance.kz/download/files/analytics/Halyk_Finance_-_Reformirovanie_zhilischnoy_politiki_yanv_2024.pdf (accessed on 15 March 2025).
  69. Forbes Kazakhstan. Why Housing Funded by Nuly Zher Program does not Meet the Standards? 2019. Available online: https://forbes.kz/articles/pochemu_jile_vozvodimoe_po_gosprogramme_nrlyi_jer_ne_sootvetstvuet_standartam (accessed on 15 March 2025).
  70. Steurer, M.; Bayr, C. Measuring urban sprawl using land use data. Land Use Policy 2020, 97, 104799. [Google Scholar]
  71. Ustaoglu, E.; Williams, B. The Inter-Relationships of Territorial Quality of Life with Residential Expansion and Densification: A Case Study of Regions in EU Member Countries. Urban Sci. 2024, 8, 22. [Google Scholar] [CrossRef]
  72. Madrazo-Uribeetxebarria, E.; Antín, M.G.; Eguilegor, G.A.; Andrés-Doménech, I. Analysis of the hydraulic performance of permeable pavements on a layer-by-layer basis. Constr. Build. Mater. 2023, 387, 131587. [Google Scholar] [CrossRef]
  73. Wade, R.; Charlesworth, S. Multiple benefits from surface water management-SUDS. CLEAN Soil Air Water 2014, 42, 109. [Google Scholar] [CrossRef]
  74. Bellezoni, R.A.; Meng, F.; He, P.; Seto, K.C. Understanding and conceptualizing how urban green and blue infrastructure affects the food, water, and energy nexus: A synthesis of the literature. J. Clean. Prod. 2021, 289, 125825. [Google Scholar]
  75. Iungman, T.; Cirach, M.; Marando, F.; Barboza, E.P.; Khomenko, S.; Masselot, P.; Quijal-Zamorano, M.; Mueller, N.; Gasparrini, A.; Urquiza, J.; et al. Cooling cities through urban green infrastructure: A health impact assessment of European cities. Lancet 2023, 401, 577–589. [Google Scholar] [PubMed]
  76. Wu, X.; Tang, W.; Chen, F.; Wang, S.; Bakhtiyorov, Z.; Liu, Y.; Guan, Y. Attribution and risk projections of hydrological drought over water-scarce Central Asia. Earth’s Future 2025, 13, e2024EF005243. [Google Scholar]
  77. Ma, X.; Zhu, J.; Yan, W.; Zhao, C. Projections of desertification trends in Central Asia under global warming scenarios. Sci. Total Environ. 2021, 781, 146777. [Google Scholar] [PubMed]
  78. Semadeni-Davies, A.; Hernebring, C.; Svensson, G.; Gustafsson, L.G. The impacts of climate change and urbanisation on drainage in Helsingborg, Sweden: Suburban stormwater. J. Hydrol. 2008, 350, 114–125. [Google Scholar]
  79. Seitz, W. Urbanization in Kazakhstan: Desirable cities, unaffordable housing, and the missing rental market. Int. J. Urban Sci. 2020, 25, 135–166. [Google Scholar]
  80. Enbek. Center of Development of Labor Resources. Demographic Forecast for 2023–2050. 2023. Available online: https://www.enbek.kz/ (accessed on 30 November 2024).
  81. Ali, K.; Johnson, B.A. Land-Use and Land-Cover Classification in Semi-Arid Areas from Medium-Resolution Remote-Sensing Imagery: A Deep Learning Approach. Sensors 2022, 22, 8750. [Google Scholar] [CrossRef]
  82. Theres, B.L.; Selvakumar, R. Comparison of landuse/landcover classifier for monitoring urban dynamics using spatially enhanced landsat dataset. Environ. Earth Sci. 2022, 81, 142. [Google Scholar]
  83. Kulithalai, S.S.P.; Deka, P.C. Spatio-temporal classification and prediction of land use and land cover change for the Vembanad Lake system, Kerala: A machine learning approach. Environ. Sci. Pollut. Res. 2022, 29, 86220–86236. [Google Scholar] [CrossRef]
  84. Ettehadi Osgouei, P.; Kaya, S.; Sertel, E.; Alganci, U. Separating Built-Up Areas from Bare Land in Mediterranean Cities Using Sentinel-2A Imagery. Remote Sens. 2019, 11, 345. [Google Scholar] [CrossRef]
  85. World Bank. South Caucasus and Central Asia: The Belt and Road Initiative. Kazakhstan Country Case Study. 2020. Available online: https://policycommons.net/artifacts/1268276/south-caucasus-and-central-asia-the-belt-and-road-initiative/1848027/ (accessed on 1 November 2024).
  86. Bitabarova, A.G. Unpacking Sino-Central Asian engagement along the New Silk Road: A case study of Kazakhstan. J. Contemp. East Asia Stud. 2018, 7, 149–173. [Google Scholar] [CrossRef]
  87. Baniya, S.; Rocha, N.; Ruta, M. Trade Effects of the New Silk Road: A Gravity Analysis; Policy Research Working Paper 8694; World Bank: Washington, DC, USA, 2019. [Google Scholar]
  88. Pomfret, R. The Eurasian Landbridge and China’s Belt and Road Initiative: Demand, supply of services and public policy. World Econ. 2019, 42, 1642–1653. [Google Scholar] [CrossRef]
  89. Otsuka, S. Central Asia’s Rail Network and the Eurasian Land Bridge. Jpn. Railw. Transp. Rev. 2001, 28, 42–49. Available online: https://www.ejrcf.or.jp/jrtr/jrtr28/pdf/f42_ots.pdf (accessed on 25 October 2024).
  90. Pomfret, R. The Eurasian Land Bridge: Linking regional value chains along the New Silk Road. Camb. J. Reg. Econ. Soc. 2019, 12, 45–56. [Google Scholar] [CrossRef]
Figure 2. Modeling steps.
Urbansci 09 00100 g002
Figure 3. Kazakhstan’s economic growth and construction activity.
Urbansci 09 00100 g003
Figure 4. LULC maps of Astana for selected years.
Urbansci 09 00100 g004
Table 1. Data sources of satellite imagery.
Image IDProductAcquisition DateBands
N
Resolution, mCloud Cover, %
LE07_154025_20000728Landsat 728 July 20007300
LE07_155024_20000905Landsat 728 July 20007300
LC08_154025_20140711Landsat 811 July 20149300
20230613T061631_20230613T061659_T42UXBSentinel 213 June 20231010–200.4
20230616T062631_20230616T063148_T42UXBSentinel 216 June 20231010–200.1
20230603T061631_20230603T062224_T42UXBSentinel 223 June 20231010–200.1
Table 2. Indicators of economic sustainability.
Indicator20002022Growth Rate,
% per Year
2000–20132014–2022
Population (1000 people)Kazakhstan14,90219,5031.01.6
Astana38112405.75.4
Almaty113020252.13.8
Wages (KZT per month)Kazakhstan34,533124,1438.64.1
Astana50,085146,5108.62.4
Almaty56,304141,5796.92.5
Gross Regional Product (KZT 1000 per person)Kazakhstan419208511.82.4
Astana909301812.3−2.4
Almaty1115380611.0−1.1
Investment in fixed capital (KZT 1000 per person)Kazakhstan2292622.90.8
Astana4605173.00.1
Almaty2423213.32.5
Value added of construction (percent of GRP)Kazakhstan5.25.31.9−1.3
Astana31.36.4−6.9−4.0
Almaty2.02.67.2−1.6
Public investment (percent of total investment in fixed capital)Kazakhstan10.415.6−1.6−1.2
Astana44.616.40.4−6.6
Almaty9.618.84.7−3.1
Investment in residential construction (KZT 1000 per person)Kazakhstan4.248.117.810.7
Astana51.2217.913.710.8
Almaty4.5133.830.510.6
Housing area (m2 per person)Kazakhstan16.120.81.70.7
Astana12.525.05.80.2
Almaty17.025.83.40.7
Rental housing prices (KZT 1000 per m2 per month)Kazakhstan0.51.55.111.9
Astana1.22.03.41.6
Almaty0.82.68.75.5
Light vehicles (per 1000 persons)Kazakhstan71.5200.510.9−1.8
Astana96.2231.911.8−3.3
Almaty146.3239.09.1−4.2
Heavy vehicles (per 1000 persons)Kazakhstan14.422.96.0−0.9
Astana12.8199.4−4.2
Almaty27.0170.5−2.5
Table 3. Indicators of socio-cultural sustainability.
Indicator20002022Growth Rate,
% per Year
2000–20132014–2022
Poverty rate (individuals with income below national poverty level, percent of total population)Kazakhstan46.75.2−19.79.3
Astana7.71.9−15.623.1
Almaty19.44.8−12.538.9
Income inequality (ratio of top 10% to bottom 10% income levels)Kazakhstan8.85.7−3.40.1
Astana7.34.5−3.81.6
Almaty6.07.20.04.5
Infant mortality (per 1000 live births)Kazakhstan19.67.7−4.5−4.3
Astana16.36.9−4.2−3.3
Almaty14.77.9−2.5−3.1
Access to healthcare services (hospital beds per 1000 people)Kazakhstan7.75.4−1.90.0
Astana6.66.42.41.9
Almaty9.56.0−3.0−2.1
Injuries (per 1000 people)Kazakhstan0.220.13−2.4−1.9
Astana0.320.10−1.3−6.5
Almaty0.210.09−3.7−1.2
Crime rate (crimes per 1000 people)Kazakhstan8.08.311.9−10.7
Astana7.412.729.1−14.0
Almaty12.913.714.8−12.4
Public school teachers (per 1000 people)Kazakhstan54510.0−0.1
Astana97980.1−1.9
Almaty77870.1−0.1
Early childhood and preschool programs (enrolled children as per cent of 0–6-year-olds in urban centers)Kazakhstan24.9514.11.5
Astana27.238.51.0−6.0
Almaty29.547.01.311.0
Library customers (users per 1000 people)Kazakhstan3.73.1−0.5−0.2
Astana5.71.1−0.6−16.0
Almaty5.43.8−1.511.6
Music performances (concerts per 1000 people)Kazakhstan2.85.21.428.7
Astana0.82.119.240.6
Almaty1.44.92.620.2
Movie theater visits (visitors per 1000 people)Kazakhstan5.22.2−11.635.3
Astana2.50.7−13.545.1
Almaty0.90.6−8.930.1
Table 4. Indicators of environmental sustainability.
Growth Rate, % per Year
Indicator200020222000–20132014–2022
Municipal solid waste (kg per person)Kazakhstan-196-1.5
Astana-242-5.4
Almaty-239-6.4
Air pollution, emissions from point sources (tons per person)Kazakhstan0.160.12−1.2−1.2
Astana0.120.05−2.8−6.1
Almaty0.010.021.02.3
Drinking water supply (m3 per person)Kazakhstan6663.8−0.30.3
Astana116.881.8−1.9−1.5
Almaty231124.3−3.0−2.0
Forestry services (KZT per person)Kazakhstan337.9331.53.80.1
Astana748.6930.510.2−2.5
Almaty-110.7 3.0
Electricity production (1000 kWh per person)Kazakhstan346560954.01.5
Astana34943294−0.72.0
Almaty415943992.14.0
Central heat production (Giga Calories per person)Kazakhstan4.45.12.2−1.4
Astana7.57.3−1.4−0.4
Almaty4.24.40.6−5.2
Non-metallic mineral products output (KZT 1000 per person)Kazakhstan2.621.819.33.4
Astana8.656.620.40.4
Almaty3.922.720.8−1.3
Table 5. Distribution of LULC types.
LULC Typeskm2% Change per Year
2000201420232000–20142014–2023
Water3334280.2−2.1
Wetland202691.9−11.1
Vegetation1441501440.3−0.5
Grassland529455374−1.1−2.1
Urban691092183.38
Barren5262712.50.4
Blue infrastructure per capita0.000140.000070.00003−4.4−10.4
Green infrastructure per capita0.001770.000740.00038−6.0−7.1
Gray infrastructure per capita0.000190.000170.00018−1.11.0
Disclaimer/Publisher’s Note: The statements, opinions and data contained in all publications are solely those of the individual author(s) and contributor(s) and not of MDPI and/or the editor(s). MDPI and/or the editor(s) disclaim responsibility for any injury to people or property resulting from any ideas, methods, instructions or products referred to in the content.

