1. Introduction
Over the past several years, particularly following the COVID-19 pandemic, the concept of “cyclability” (sometimes referred to as “bikeability”) has gained significant attention, especially in Europe, where the renewed interest in active mobility has brought it to the forefront of urban planning and sustainability discussions. Although definitions of the term vary across studies [
1,
2], we define cyclability here as the ability of a road, network, or environment to provide a safe, comfortable, and efficient cycling experience. Cyclability can be assessed both through objective factors—such as infrastructure quality and physical environment [
3]—and subjective factors, reflecting cyclists’ perceptions and feelings when riding [
4]. This latter dimension is often referred to as perceived cyclability.
Globally, cyclability has become a key focus in both research and public discourse, driven by growing awareness of environmental challenges and the recognition that active mobility offers practical solutions to these issues [
5,
6]. In contrast to this trend, Japan appears to be an outlier in this global movement. Of course, many studies are produced on various subjects specific to cycling, such as studies on cycling infrastructure [
7,
8], studies on user behaviour [
9,
10], or studies on safety (real or perceived) [
11,
12]. However, most of these studies adopt single-criteria or single-subject approaches, in opposition to studies carried out elsewhere in the world, where cyclability means that the approach is much more multi-criteria and, therefore, more comprehensive [
13].
This lack of research goes hand in hand with public policies on cycling that are of little benefit or not comprehensive for cyclists. We should note, for example, that cyclists in Japan have long been shunted from pavement to road, and reversely, with varying degrees of success. In response to a sharp increase in traffic accidents involving bicycles, especially in urban areas, a temporary measure was announced in 1970 allowing cyclists to ride on walkways in certain zones to reduce accidents. Given the effectiveness of the temporary measure and the growing demand from cyclists, the law was revised in 1978 to officially permit bicycles on sidewalks under specific conditions (such as for children, elderly people, and authorized sidewalks). In 1981, the law was further reinforced, allowing local authorities to install signage explicitly authorizing bicycles to use sidewalks, still to a certain extent. Due to the combined effects of trauma from bicycle accidents on the road and the rapid expansion of shared sidewalks, Japanese cyclists began to use pedestrian spaces extensively, even though the law still states that the road is the primary place for bicycles, except in specific cases. Thus, the vast majority of Japanese bicycle users now confined themselves to pavements, clearly separating cars from other road users. In recent years, Japanese authorities have made substantial efforts to reverse the trend and change cyclists’ habits, including increasingly restrictive and punitive laws, development of cycling lanes along roads (especially between 2008 and 2015), awareness campaigns, and more. Yet, these actions appear to have a very limited impact on cyclists’ behaviour, as the majority of them continue to use sidewalks [
14]. Some recent policies can even be described as very punitive for bicycle users, often singled out by policymakers as the main road safety hazard in Japan [
15]. For instance, Japan has again amended its laws governing the use of bicycles (effective 1 November, 2024), introducing stricter penalties for cyclists caught using mobile phones while riding (up to six months in prison or a fine of ¥100,000) and stricter penalties for cycling with a blood alcohol concentration of 0.15 milligrams or higher per litre of breath (now punishable by up to three years in prison or a fine of ¥500,000).
The contrast between research and public policy between Japan and the rest of the world is accompanied by a third alarming difference: While in many cities around the world the modal share of cycling and other light, non-polluting means of transport is increasing, particularly at the expense of the private car [
16,
17], in Japan, the modal share of cycling has been declining steadily for over 30 years [
18,
19,
20]. And while a number of studies have already been carried out on the positive contribution of a good cycling environment to the modal share of cyclists [
21], it seems reasonable to question the potential deficit in cyclability in Japan.
Despite these challenges, the Ministry of Land, Infrastructure, Transport and Tourism (MLIT) has recently sought to reposition cycling as a sustainable and viable mode of transportation by promoting the development of cycling infrastructure in urban areas [
22]. This initiative, if supported by logistics work, could improve cyclability. Yet in Japan, as we have seen, the topic of cyclability or perceived cyclability are hardly being studied by scientists and are covered even less by the media.
Consequently, and despite a concept that is almost virtually unknown to cyclists themselves, it is more important than ever to understand the aspirations, perceptions, desires, and needs of bicycle users in Japan. If the country aims to improve the cycling environment and address the issue of cyclability, comprehensive strategies and policies will be required in order to develop an efficient and well adapted cycling environment [
23,
24,
25], implying the need to deal with user’s perception and perceived cyclability.
Thus, we will try in this study to paint a picture of how Japanese cyclists feel about cyclability, using a national-scale questionnaire about cyclability and a unique database gathering the information about the cycling environments of 57 Japanese cities. The aim here is threefold. The first objective will be to understand what factors can influence the perceived cyclability of Japanese cyclists. The second objective will be to understand how the various internal components of cyclability (safety, comfort, efficiency, etc.) influence the way users feel. Finally, as this study is national in scope and therefore includes several cities, we will try to understand the influence of different urban environments on perceived cyclability.
3. Methodology
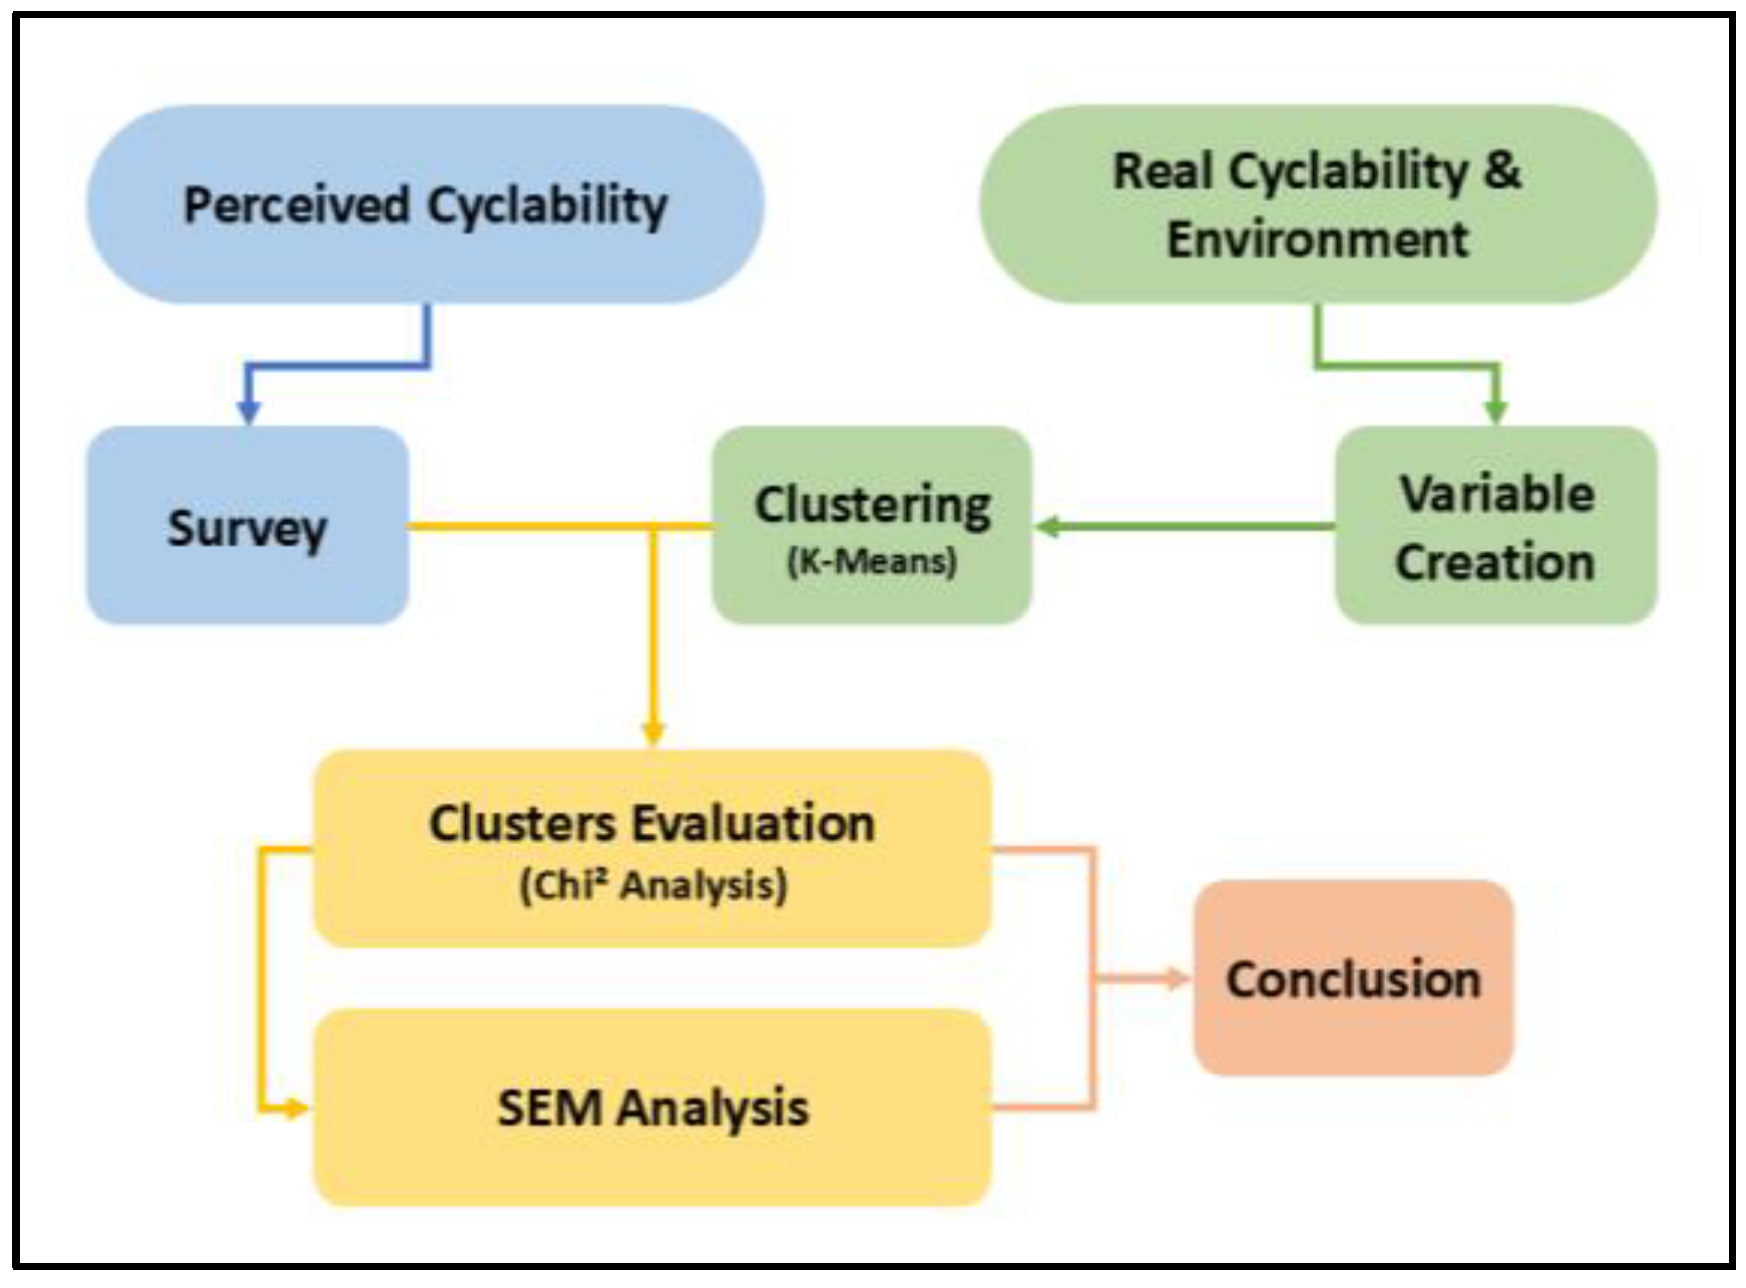
To answer the questions posed by this research, the general model of this study will, therefore, be based both on an online questionnaire to measure users’ perceived cyclability and its various components, and on objective data relating to the urban and natural cycling environment (
Figure 1).
3.1. Research Area
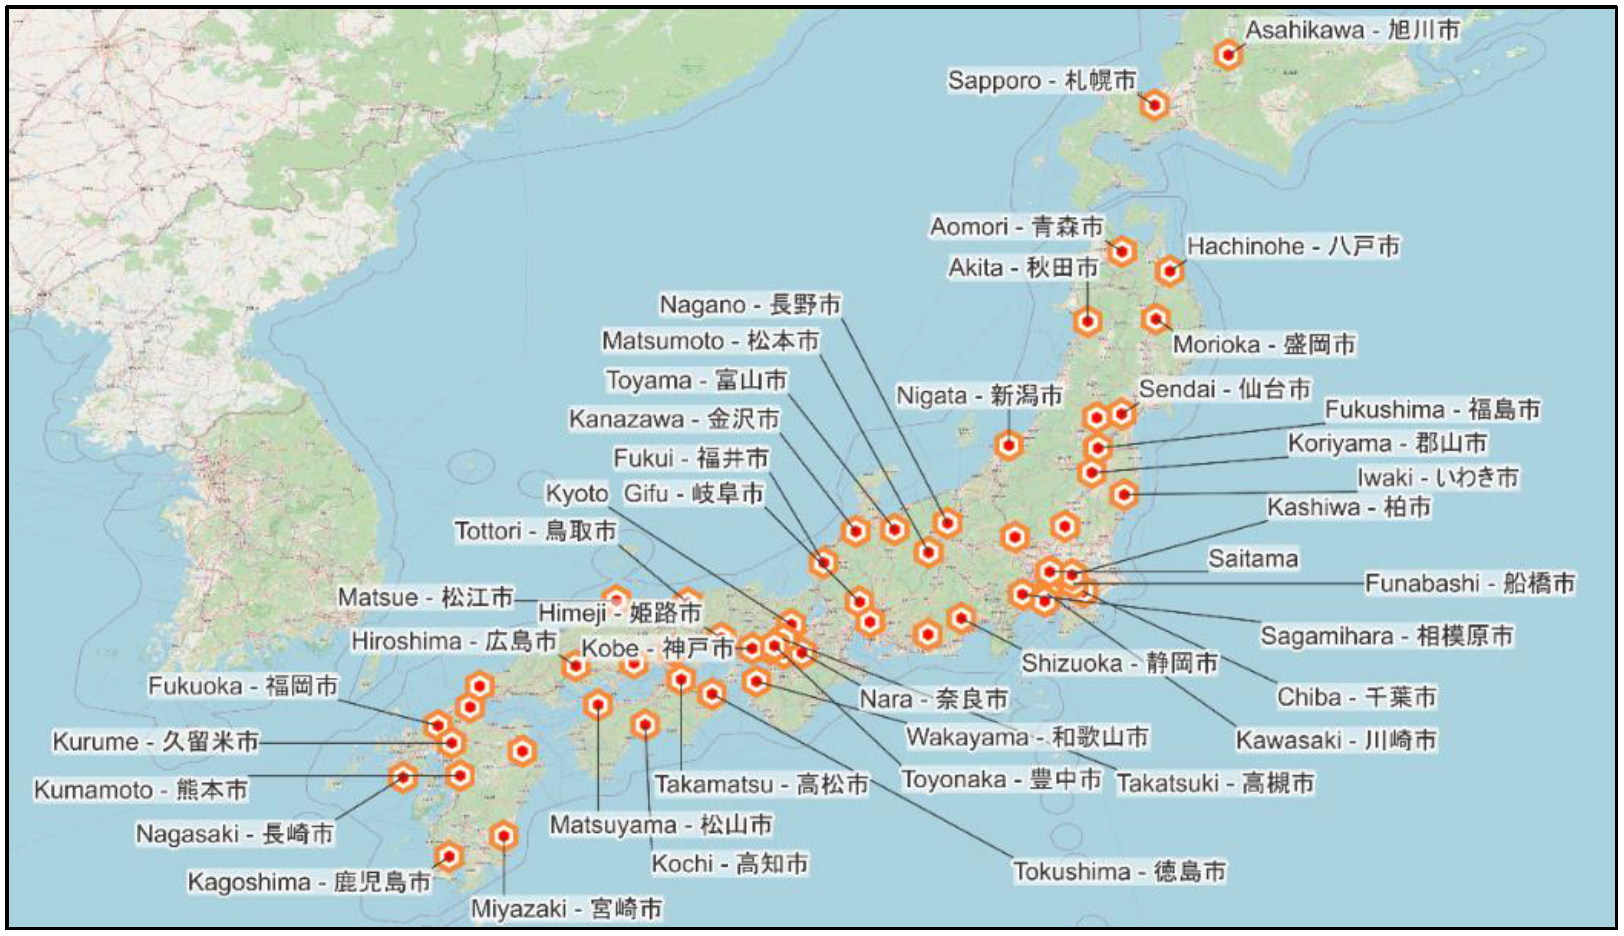
As shown in
Figure 2, the 56 cities studied including the 50 most populous Japanese cities, excluding Tokyo and Osaka, while covering the entirety of Japanese territory from the city of Kagoshima (south part of Kyushu) to cities in Hokkaido (the most northerly island) like Sapporo or Asahikawa. The two cities of Osaka and Tokyo are not included since their legislative shape makes it complex to obtain all the necessary data. For example, the city of Tokyo is divided into 23 independent districts, so the work involved in gathering the data would have been similar to that carried out for 23 separate cities. Also, the size of these two cities and their highly heterogeneous nature (precisely because of their districts) could have led to inconclusive or even false results in the analyses. In addition to that point, it is important to emphasize that a secondary aim of this article is to propose a study focusing on areas less often covered in scientific research than the cities of Tokyo or Osaka, which are often the focus of many studies.
3.2. Data Collection (Objective Cyclability Related)
A significant portion of the data used in this article is not available in the public domain, particularly the data related to cyclability, infrastructure, and policies implemented in the cities studied. As a result, extensive collaboration and data exchange took place with the towns and prefectures involved. Thirty-four cities provided data through a pre-prepared form sent to the departments responsible for mobility and/or the development of cycling infrastructure. Thirteen other cities provided open responses, sometimes including additional documents. However, some cities were unable to provide the necessary data or information. In such cases, considerable research, data collection, and verification were required, particularly with the prefectures. Consequently, certain data used in this study will not be shared with external parties.
3.3. Variables
Given that the vast majority of the literature reviewed for this article reports the existence of a positive correlation between the presence of cycling infrastructure and perceived cyclability, the first variables that we wanted to bring together for comparison with the questionnaire results relate to actual cyclability (
Table 1).
Variable “BI Density” (
BI for Bicycle Infrastructure) is therefore the ratio between the number of kilometres of cycle infrastructure deployed in 2022 and the number of parcels corresponding to the developed land (one parcel is always equal to 0.0102 Km
2) [
38]. We included here the three main types of cycle infrastructure in Japan: tracks, lanes, and shared pavements. The use of urban development data instead of simple area data means that the variables can be captured more accurately in their environment of use.
Also, given that our questionnaire includes two questions on the perception of policies put in place to improve the safety and comfort of cyclists, a variable has been created to score each city according to the number of related policies put in place. Then, the variable “Policy Score” is a simple sum of the number of policies deployed between 2000 and 2022, with a bonus point if a web page is specially dedicated to communicating about cycling facilities, and another bonus point if the city promotes the “Share the road” policy, which consists of using leaflets and posters to ask different road users (particularly car drivers) to take care when sharing the road.
Other data have also been prepared in an attempt to cluster cities and find links between the urban environment and the perception of cyclability. Among these, the variable “Population Density” is also based not on city areas but on the number of parcels of developed land. “Urbanization Indicator” corresponds to the ratio of the number of plots to the total area of the town.
Finally, the variable “Natural Environment” is the geometric mean of three separate variables: “Number of days with more than 1 mm of rain per year”, “Elevation”, and “Gap with Ideal Temperature”. The final result was standardized. The “Gap with Ideal Temperature” variable was obtained for each city by comparing their average annual temperature with the average of the 10 most cycling-active cities (in terms of modal share of cycling). Since the presence of both positive and negative temperature differences can introduce biases and distort the results of statistical analysis, we converted all temperature differences to absolute values, which effectively eliminates the sign component, retaining only the magnitude of the deviation, which is the primary interest here. The variable “Elevation” dedicated to slope, was produced by cross-referencing GIS network analysis tools with national topographic data [
39]. A total of 40 routes were simulated with “Valhalla routing engine” in each city from randomly created points in areas where the population density is greater than 400 hah/km
2. The data from each route was then coupled to the topographical profile to extract the cumulative slope gradients. Finally, an average of the results was calculated for each city.
Although not all variables were included in the final model based on the preliminary results obtained during the cluster creation process, each variable was considered for its potential influence on the measured responses. While the variables are presented here in their raw form, all variables were standardized for the analyses, ensuring that the mean (μ) is 0 and the variance (σ2) is 1.
3.4. Survey
The questionnaire has been designed to cover the four areas selected for rating perceived cyclability (infrastructure, policies, safety, accessibility) in addition to the overall cyclability rating. Three questions are also used to draw up a portrait of the respondent in terms of his or her cycling use and behaviour. A multiple-choice question concludes the questionnaire on users’ preferred solutions for improving cycle-friendliness. These responses will be used to provide a more complete interpretation of the model’s results.
The technical details of the questionnaire are as follows:
Online questionnaire
Platform name: qiqumo.jp
Started on 1 November 2024
Closed on 12 November 2024
Total number of respondents: 1750
Total number of usable entries: 481
Age range: 20–65 years old
Gender Ratio: 43% (F); 57% (M)
Total number of questions: 16
Pilot Group: 15 respondents.
The large difference between the total number of respondents and the number of usable responses is explained by the fact that if the respondent did not present themself as an individual who uses their bike for transportation, even sporadically, then they were redirected directly to a second part of the questionnaire aimed at understanding why they do not use the bike as a mode of transportation. This second part of the questionnaire will not be dealt with in this work. Another point that reduced the number of usable responses was the deletion of all samples for which the location given as a response did not correspond with the location recorded on the platform and given as additional data by the questionnaire service provider. These data are particularly important as it forms the basis of our analysis model, and it would be inadmissible to use samples whose geographical origin we were unsure of.
The choice of a 4-point scale is based on the aim of obtaining clear and easily interpretable results (
Table 2). In fact, after testing an initial version of the questionnaire with a pilot group, it was found that a 5-point scale led to a tendency for respondents to remain neutral in their answers, making it harder to capture nuanced responses. The 4-point scale is interpreted as follows (from the most negative to the most positive): −2; −1; 1; 2.
3.5. K-Means
One of the major challenges in this study was the heterogeneous distribution of data across the participating cities (n = 481). As a result, many cities had a limited number of samples or shared similar demographic and urban characteristics, which made a direct city-by-city comparison less robust. To overcome this problem, a clustering method was adopted to group cities according to their objective similarities. This clustering makes the following possible:
Increase sample size: By grouping similar cities together, each cluster contains a sufficient number of observations to enable statistically significant analyses;
Reduced noise: The heterogeneity of responses from very different cities has been minimized, ensuring that the analyses reflect general trends rather than local anomalies.
To validate the relevance of the clusters, Chi2 tests were performed between the clusters and participants’ individual responses for each question. Only combinations of variables maximizing the number of significant relationships (p < 0.05) were retained. The clustering offering the most significant relationships is retained for the whole model.
3.6. Clustering-Based Cyclability Assessment
For each cluster whose statistical significance would be validated by a Chi2 test, a scoring calculation was carried out to assess the differences in perceptions between respondents.
For each question
, the possible responses belonged to a discrete set:
. Each cluster
contained
respondents who provided response
for question
. The response value
was multiplied by the number of respondents
for each cluster
where
The weighted contributions for each response are summed for cluster
:
is the mean score for question in cluster ;
is the response value (−2; −1; 1; 2);
is the number of respondents for response ;
is the total number of respondents in cluster .
3.7. Structural Equation Modelling
The primary objective of this SEM analysis is to explore the relationships between various factors (infrastructures, safety, parking, and accessibility) and their influence on the perceived cyclability (Cycla) across different clusters. Additionally, a hierarchical latent model is employed in this analysis to capture both direct and indirect effects within the SEM structure. This approach allows us to model complex relationships where certain variables (e.g., infrastructure latent, safety) influence others both directly and through higher-order latent constructs. By structuring the model hierarchically, we ensure that the influence of individual indicators is appropriately channelled through intermediate latent variables, ultimately shaping the overall latent perception of cyclability (). This not only provides a clearer understanding of how each factor contributes but also enhances the model’s explanatory power by incorporating the nuances of these interdependent relationships.
The analysis used both observed variables and latent variables structured hierarchically.
In this framework, latent variables serve as unobservable constructs that represent broader underlying concepts not directly measured. For instance, the latent variable “Infrastructure Latent” () captures the overall quality of cycling infrastructure, integrating information from the observed indicators and . By using latent variables, we reduce measurement error and ensure that the model reflects the more abstract, comprehensive characteristics of each factor. This hierarchical approach allows us to assess not only the direct effects of each observed variable, but also their combined influence on the overall perception of cyclability ().
The mathematical structure of the model is as follows:
The overall cyclability latent was modelled as a second-order latent variable:
The final path to perceived cyclability (
Cycla) was modelled as
where
To account for cluster-specific variations, a multi-group SEM was conducted. This technique allowed testing whether the relationships among variables differed significantly across the four clusters. The multi-group analysis followed these steps:
Configural Invariance: The baseline model was first freely estimated for each cluster to ensure that the relationships were consistent in structure.
Metric Invariance: Factor loadings (λ) were constrained equally across groups to test whether the indicators measured the latent variables similarly.
Intercept Invariance: Intercepts of the observed variables were tested for equality to verify that the means of the observed variables were comparable across clusters.
The Chi-squared difference test was used to evaluate each level of invariance. Model fit was evaluated using the following indices:
Chi-squared test: A measure of overall model fit;
Root mean square error of approximation (RMSEA);
Comparative fit index (CFI) and Tucker–Lewis index (TLI);
Standardized root mean square residual (SRMR).
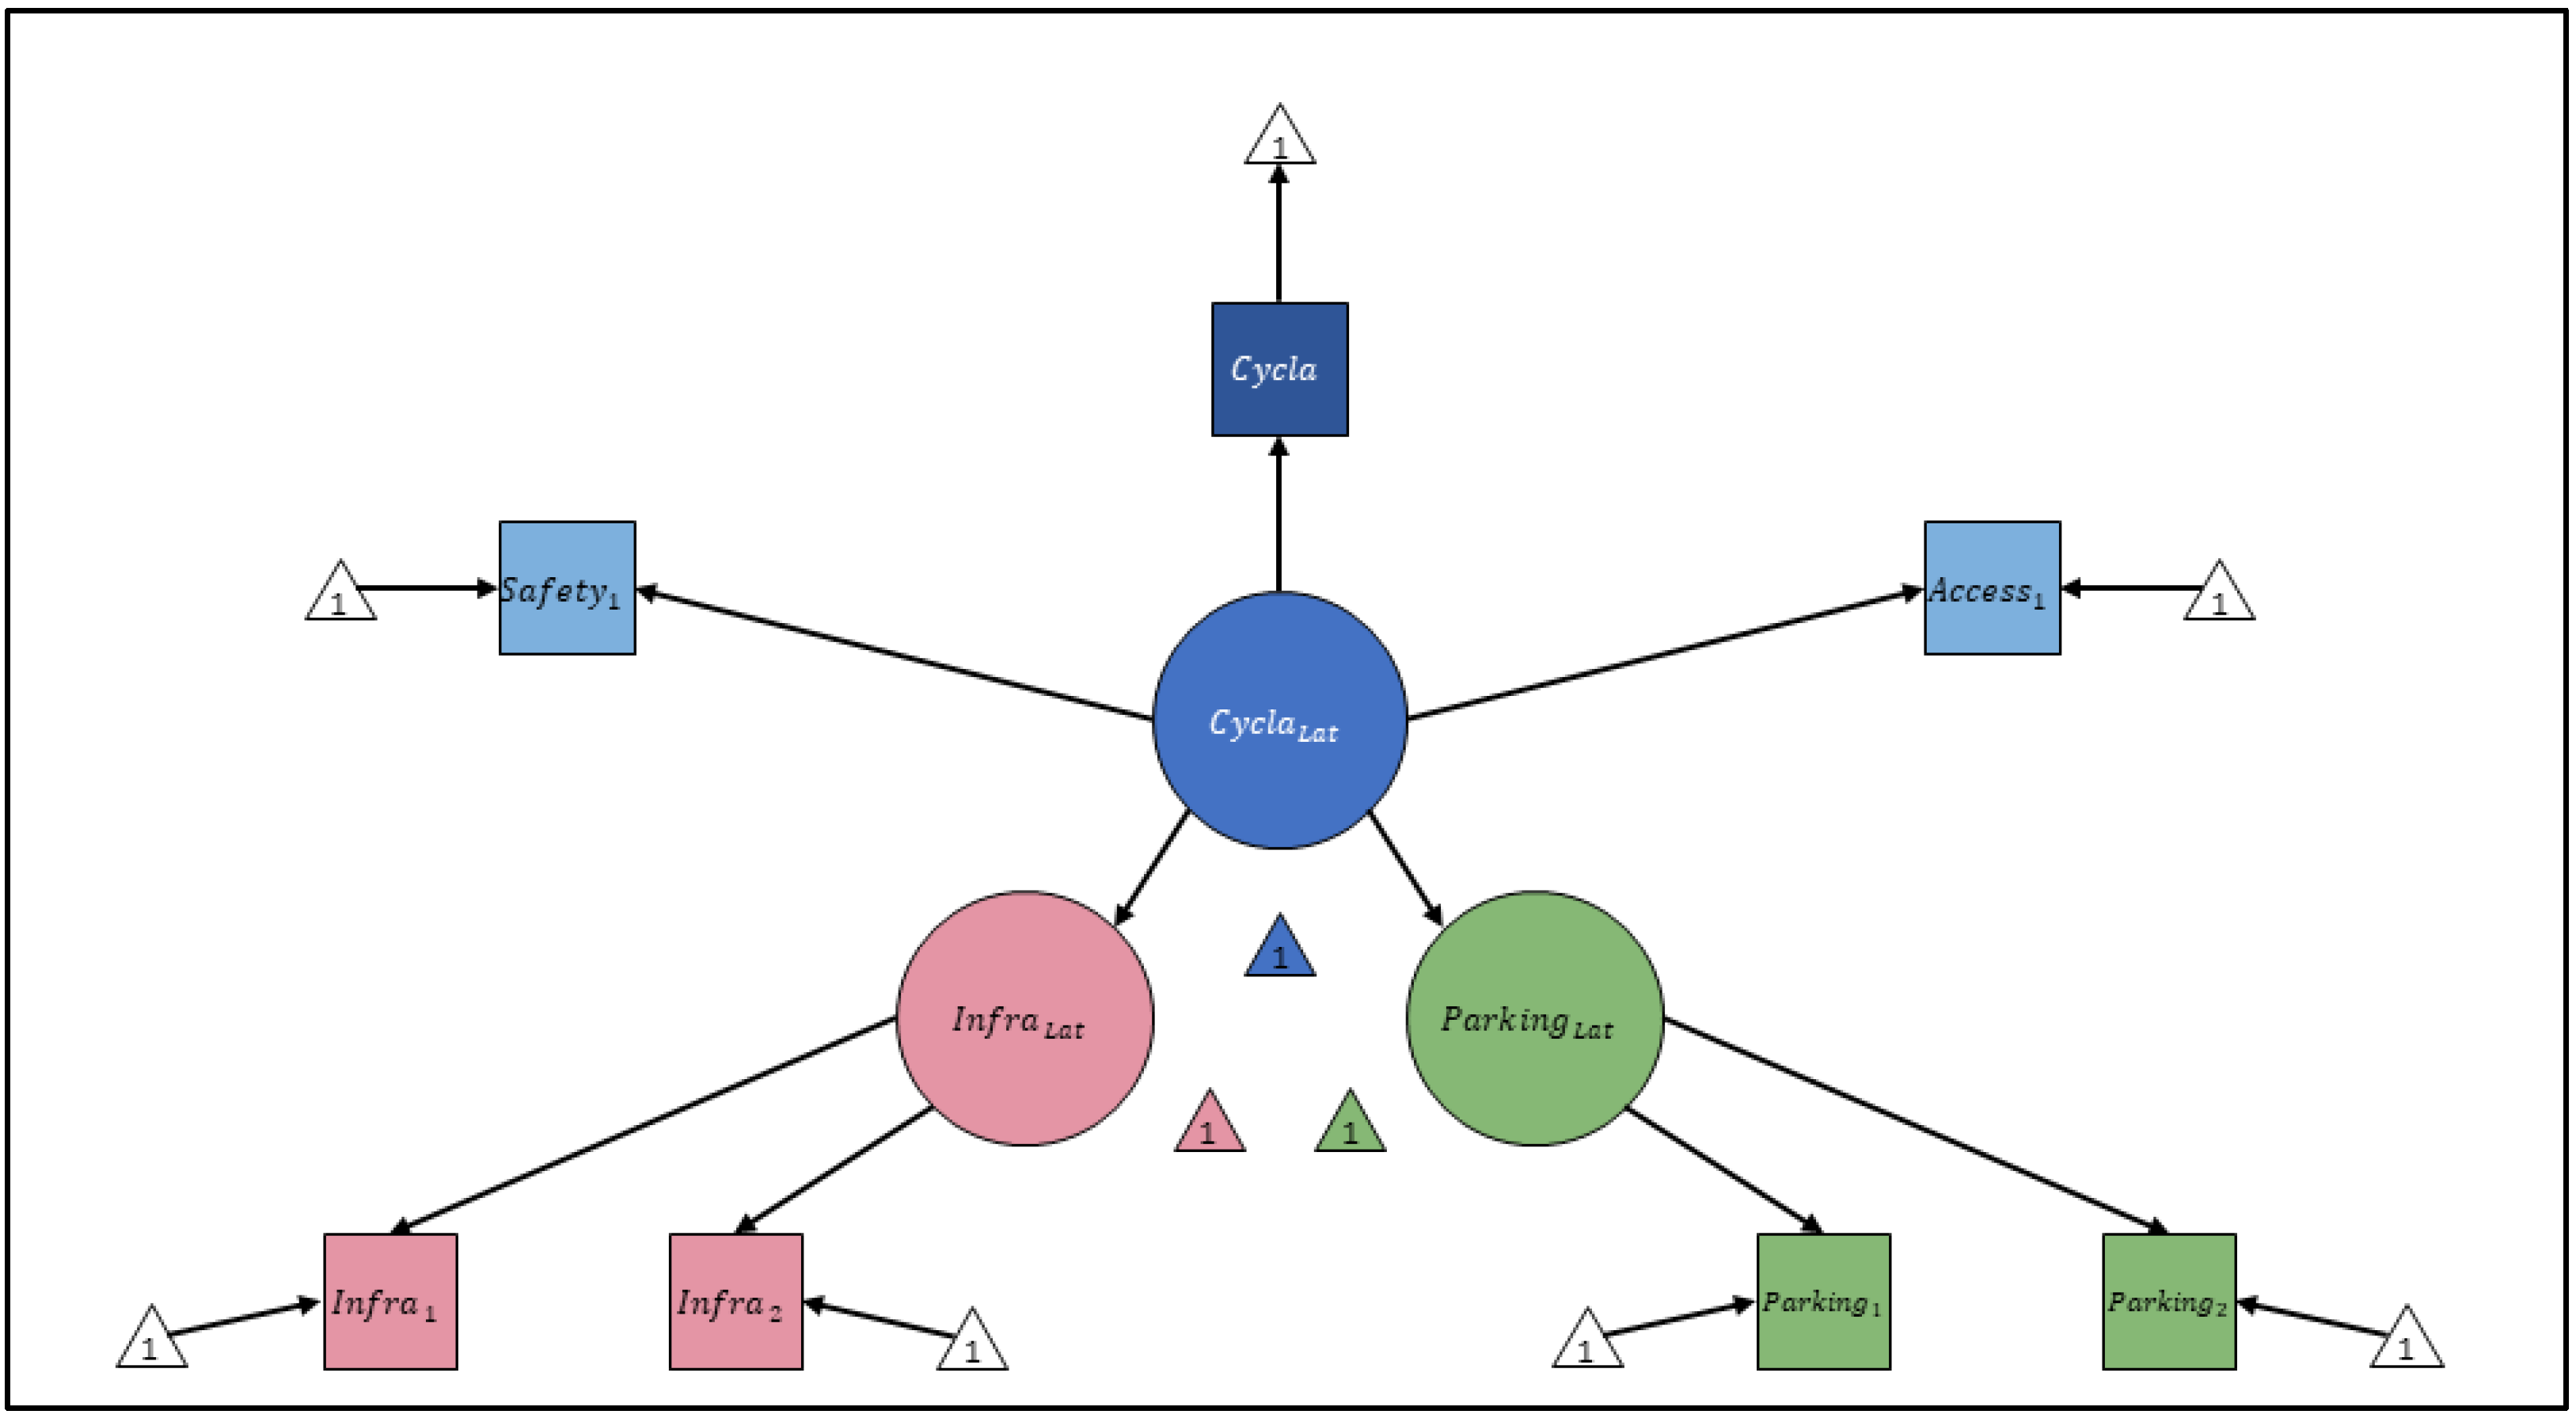
Finally, the theoretical model for hierarchical SEM is presented as showed in
Figure 3.
The squares represent observed variables, meaning these are directly measured in the survey. The circles represent latent variables, which are not directly observed but inferred from the measured indicators. The arrows in the figure represent causal relationships between variables. Single-headed arrows indicate the direction of influence, meaning one variable affects another. The small triangles with arrows pointing to variables represent error terms (or residuals) in the model. For observed variables, these account for the measurement error in survey responses. For latent variables, these represent unexplained variance in the structural relationships.
4. Results
4.1. Objective Cyclability-Related Clustering Results
Hundreds of clustering combinations, including variables relating to objective cyclability (cycling infrastructure, mileage, quality, policies, number of car parks, infrastructure density, etc.), have been tested during preliminary analysis. However, the results of this clustering in Chi2 tests were very poor and in the best cases, only three responses were validated by Chi2 analysis with a p value < 0.05. Some combinations of variables, including factors external to cyclability, had good results (more than five valid responses), but their interpretation because of very different variables became impossible and the number of samples per cluster (often very unbalanced) could induce significant bias. As an example, the combination of the ‘BI Density’ variable and another variable, which concerned the ratio of cycle paths to the city’s total cycle infrastructure, had only two responses that passed the Chi2 test, with results that were not very encouraging.
The first striking result of this preliminary analysis is, therefore, that the attributes and factors usually associated with an increase (even a relative one) in perceived cyclability, particularly in terms of safety and overall feeling, do not seem to affect respondents’ perceptions in our case.
4.2. Urban Environment-Related Clustering Results
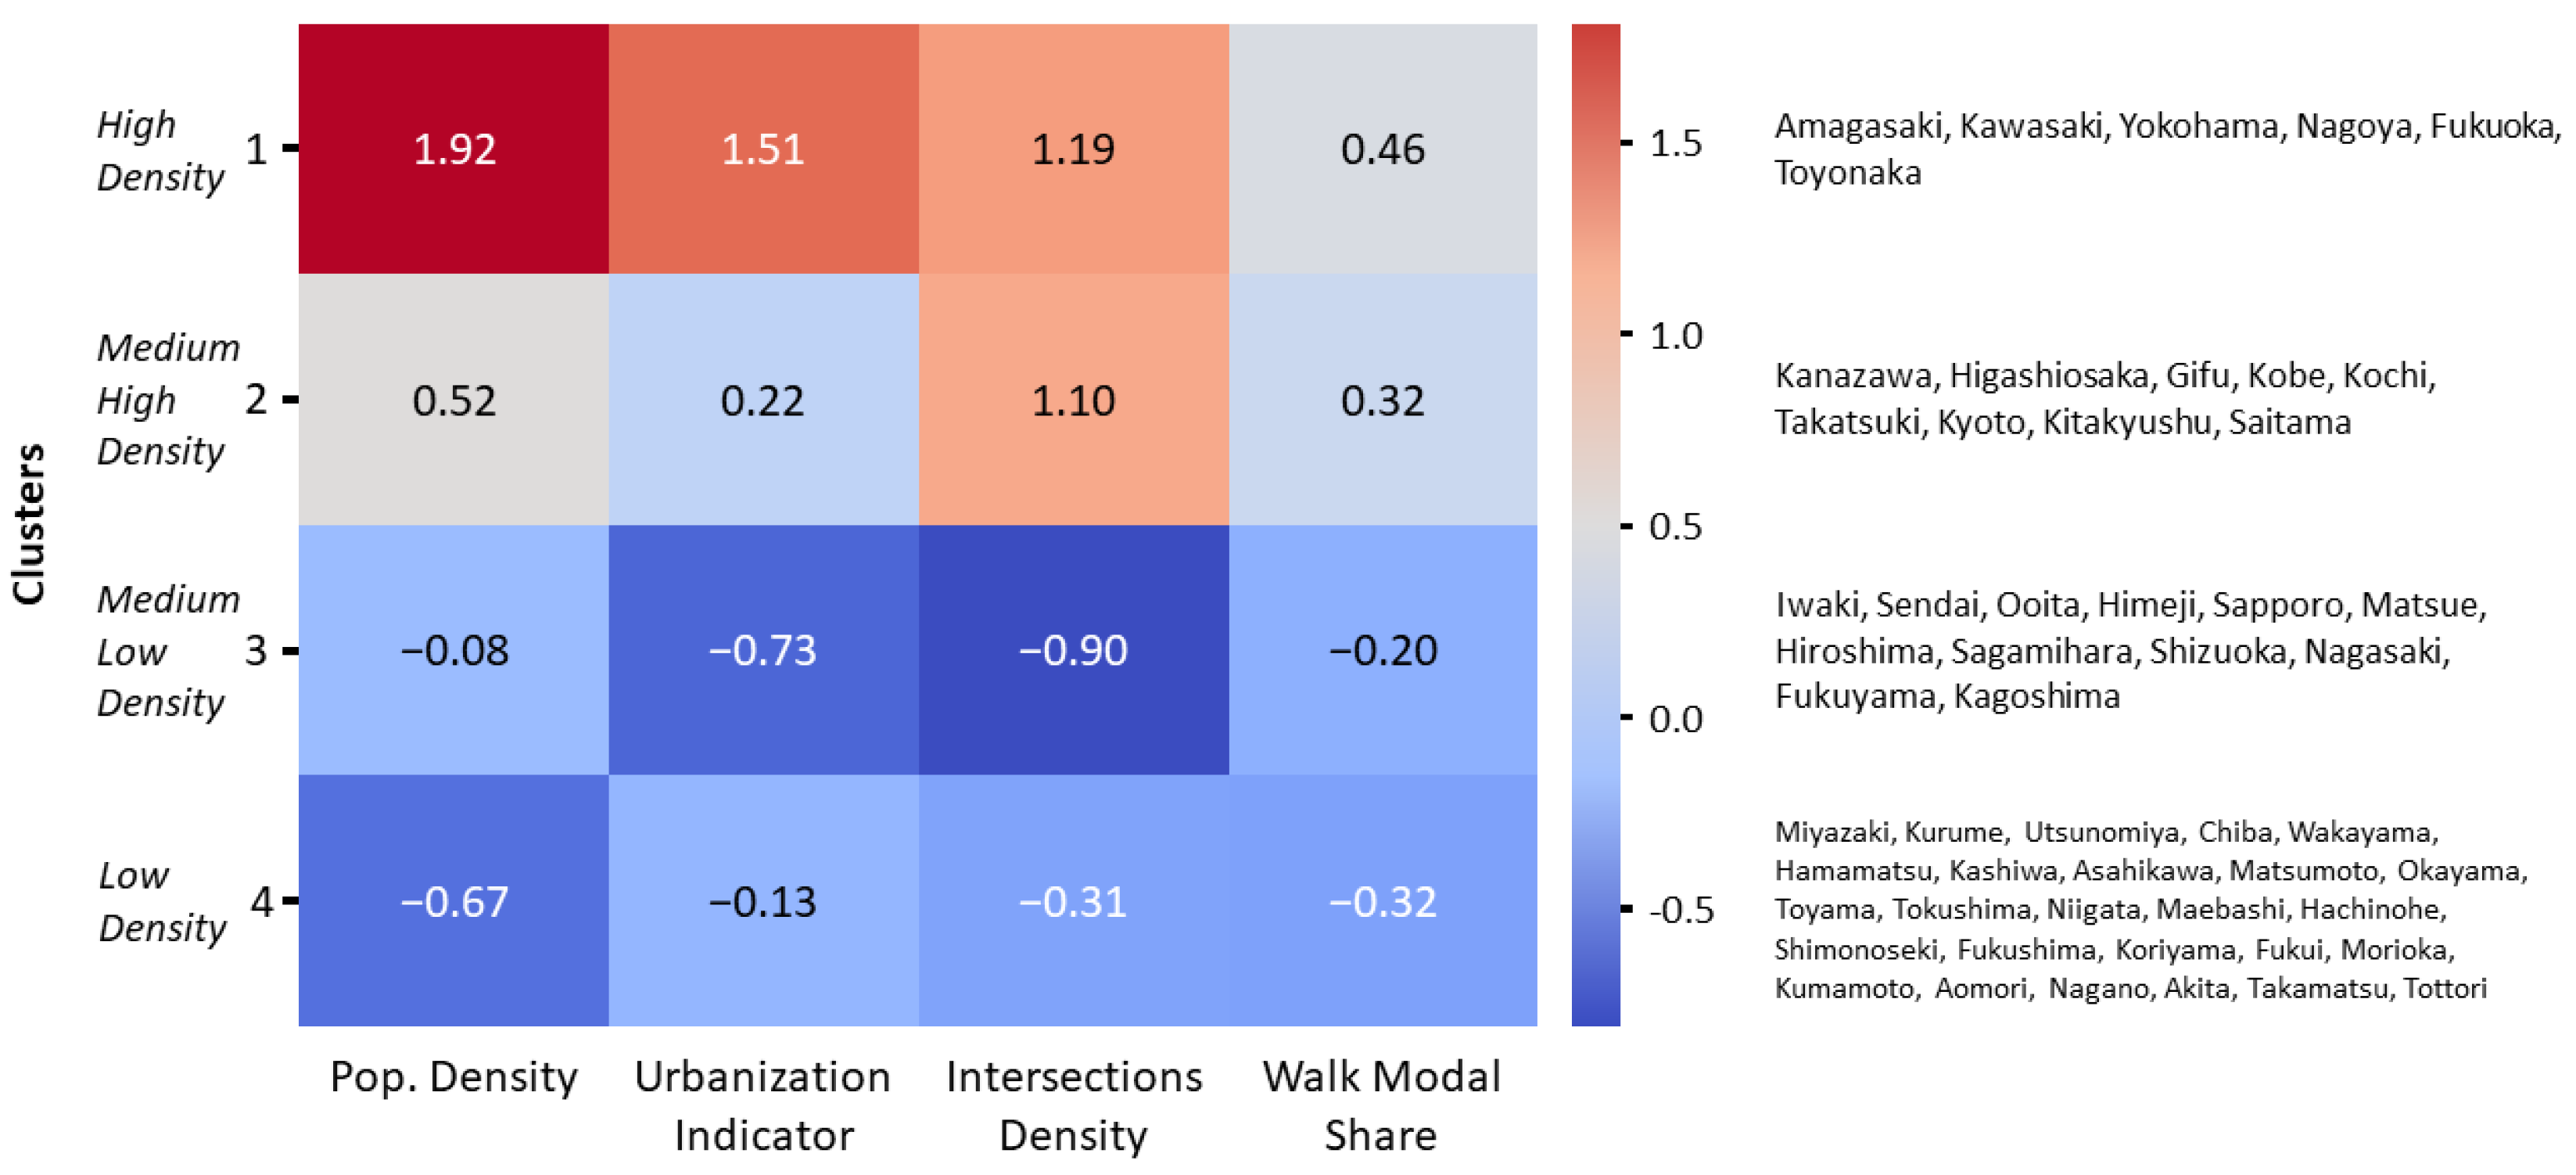
Clusters based on non-cyclability-related variables were more successful in our model. The most effective cluster, with the best Chi
2 scores and the highest number of valid questions, was composed of the variables “Population Density”, “Urbanization Indicator”, “Intersections Density”, and “Walk Modal Share” (
Figure 4). Cluster 1 brings together towns with very high population densities and intensively developed urban environments. Cluster 2 groups together cities with a population density that is considered to be “middle-high”, but with a high density of infrastructure. Cluster 3 is “middle-low”, with an intensive urban environment but a reasonably low average population density. Finally, cluster 4 has the lowest average population density and the lowest average modal share of walking (and by extension active mobility).
The age distribution across the clusters is quite satisfactory (
Table 3). However, the gender distribution shows substantial disparities among the four clusters. A Chi
2 analysis revealed that there was virtually no influence between these disparities and the respondents’ results.
This clustering therefore obtained particularly interesting results, with p values < 0.05 for 11 questions in the questionnaire and 3 composite questions (average of the Infra-, Parking-, and Policy-related questions). It is therefore this clustering that we used in our final model.
4.3. Infrastructures and Related Policies
The question concerning the comfort of the infrastructure seems to be much more evenly divided in the first three clusters, meaning a slightly negative general opinion, where the inhabitants of the least densely populated cities with the lowest modal share of active mobility (and therefore the highest modal share of the car) seem to be complaining about particularly unpleasant infrastructure (
Table 4). With regard to the perception of the quantity of cycling infrastructure and the policies linked to its development, an interesting pattern seems to emerge, placing the most populous and least populous clusters (clusters 1 and 4, respectively) on the same level, with both groups of respondents being very dissatisfied. This observation also highlights a noteworthy point: there seems to be no linear relationship between the density/development of a city and its inhabitants’ perception of cyclability.
4.4. Safety and Related Policies
The three variables relating to the perception of security and associated policies confirm the trends observed in the previous section, while amplifying certain differences (
Table 5). For the “
” question, which relates solely to safety, cluster 2 obtains the first positive average in the questionnaire, highlighting the relative safety of the cluster with high population density and yet an apparently more balanced living environment. Cluster 1 seems to be the most prone to obstacles on the cycling infrastructure, which makes sense given the urban context, which is very dense and where sharing the carriageway can be particularly complicated. Finally, the perception of political efforts is once again very low in all clusters, with clusters 1 and 4 again at the bottom.
4.5. Parking, Access, and Cyclability
Finally, the responses obtained for the last three questions after the Chi
2 test offer particularly interesting results, in line with the different urban contexts (
Table 6). Cluster 1, once again, seems to be suffering from its population density and the number of active mobility users, with a perception of parking provision that is extremely low, especially when compared with the other clusters. On the contrary, this urban context seems to be beneficial to the same cluster 1 in terms of perceived general accessibility, where it quite logically obtains the highest average. Cluster 4, however, is the only cluster to report a negative average for this question. As for the overall perceived cyclability, the average appears to be the most consistent, with the smallest standard deviation observed to date. Surprisingly, cluster 1 has the second-highest average for perceived cyclability, trailing only behind cluster 2. Cluster 3 ranks third, while cluster 4 has the lowest average, with a noticeable gap compared to the other clusters.
4.6. SEM Anlysis
Despite a high number of parameters (92), the model shows excellent performance (
Table 7). The overall model fit indices indicate an excellent fit with a Chi
2 p-value > 0.05 and high CFI/TLI values (>0.95). The RMSEA also shows an excellent score (>0.05). The final results of the analysis are shown in
Table 8,
Table 9,
Table 10 and
Table 11.
In all the clusters, the perception of the infrastructure seems to strongly influence the overall perception of cyclability. The case of cluster 1 is very interesting because, unlike in the other three clusters, the second most important factor (in all cases being security) shows a fairly large gap with the first—the two factors are neck and neck in cluster 1: (Std.all = 0.825) for and (Std.all = 0.821) for . Cluster 1 also saw its variable influenced very uniformly by the four factors, with a particularly high weighting for (Std.all = 0.714), reflecting a critical need for more specific infrastructure in this type of dense urban environment.
Another very interesting element is the overwhelming influence of the variable on in cluster 4 (Std.all = 0.982). This fact, coupled with the fact that the cluster received the worst average scores for the “”, “”, and “” questions, highlights a very strong and urgent demand for the quick development of dedicated cycling infrastructure.
Another interesting point is that the question of accessibility does not seem to be at the heart of the respondents’ primary expectations, as their influence on is generally fairly measured, except in the case of cluster 3, where (Std.all = 0.600). This could likely be explained by the fact that this cluster has the least dense infrastructure and road network, which may reflect a situation where users deplore the overall lack of accessibility, being unable to choose a mode of transport other than cycling. The people most affected include schoolchildren, young students, the elderly and, more generally, anyone who is not in a position to drive.
As far as the construction of latent variables is concerned, all the clusters seem to agree that the quantity of infrastructure is more important than its comfort . Similarly, when we look at the construction of the variable, the quantity of car parks seems to have a greater influence on users’ perceptions than their level of occupancy (and therefore their size).
Finally, in general, the parameter does not seem to fit coherently in some cases, with Std.all values greater than 1 and negative variances in clusters 0 and 2. The latent variable shows excellent results in the regression analysis in all clusters, with values always equal or greater than 0.7 and the p-value always equal to 0, confirming the consistency of our theoretical model.
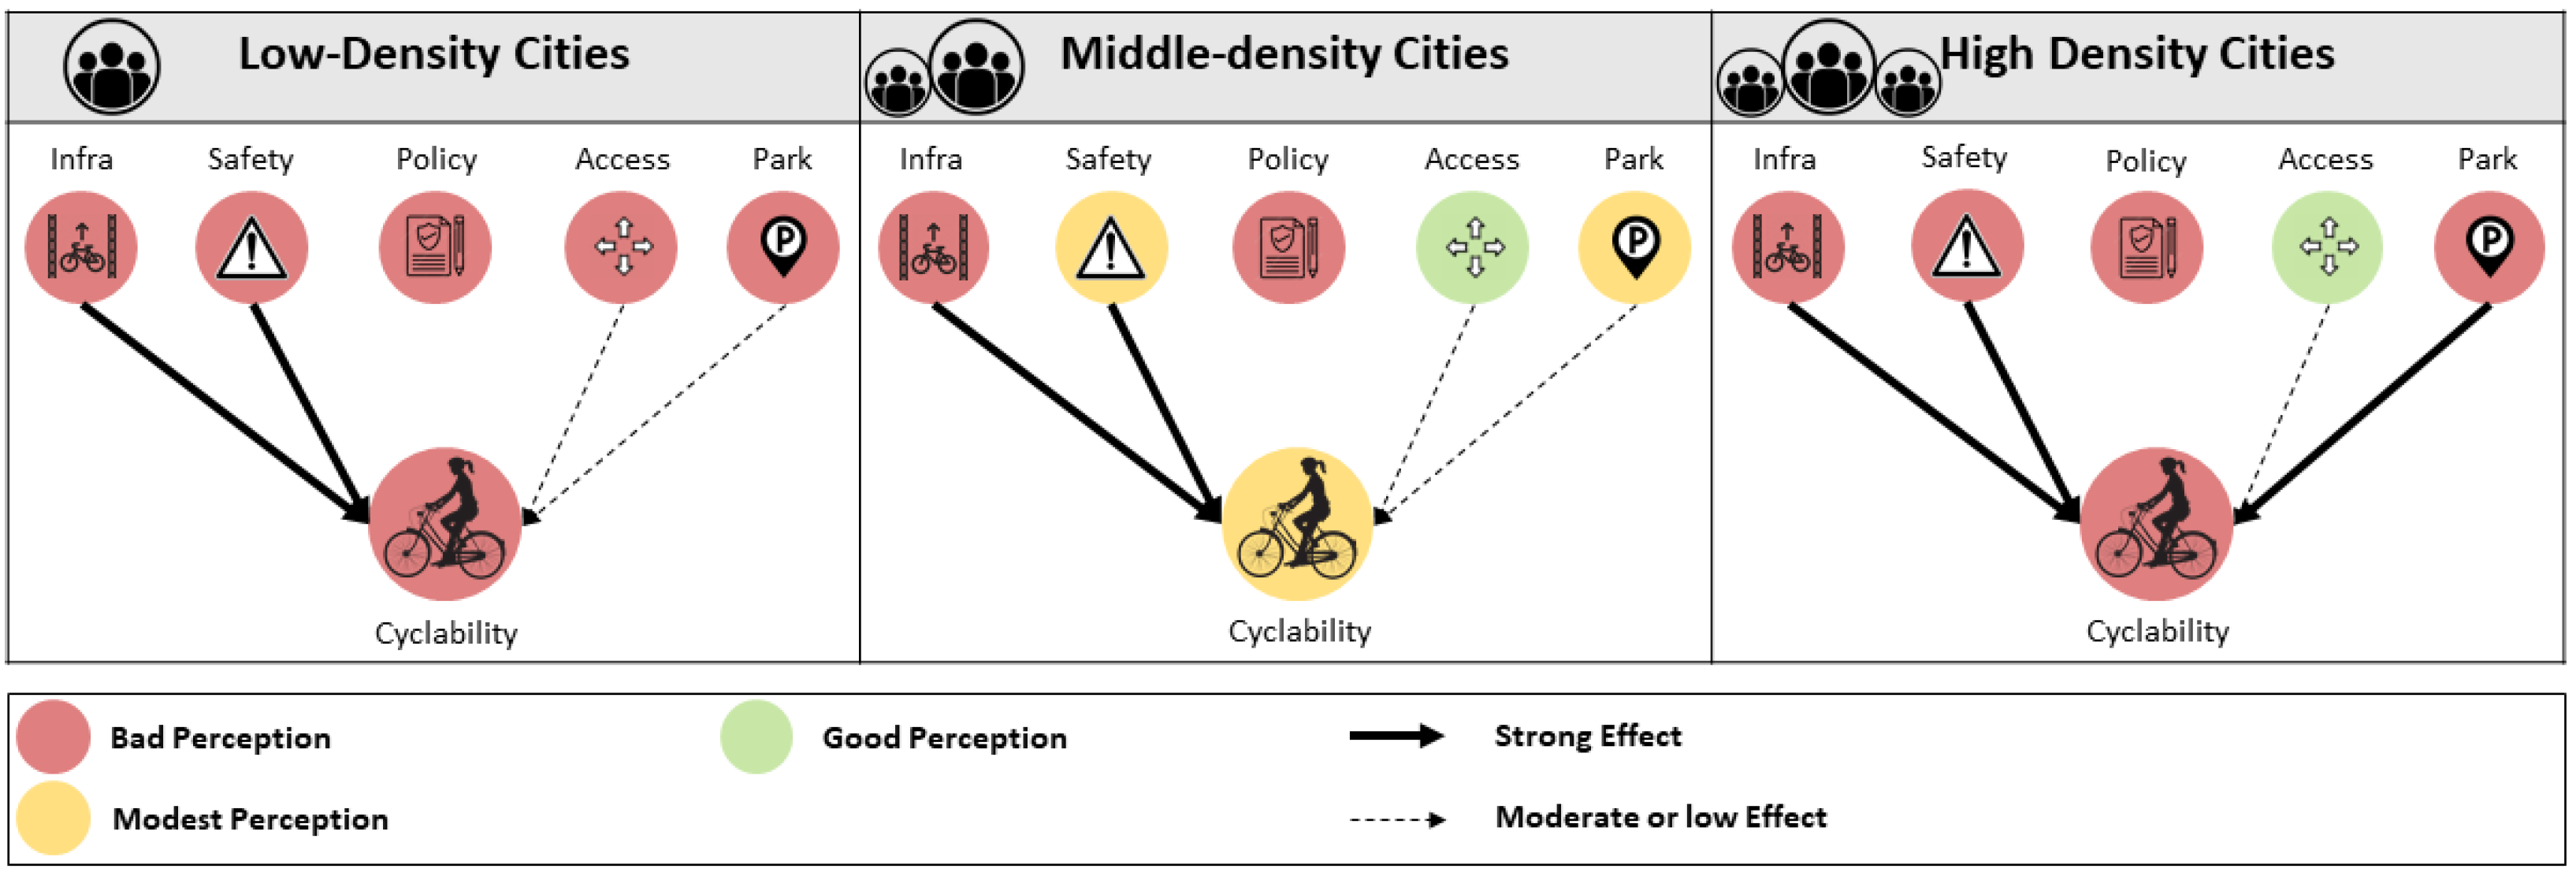
In general, middle-density cities seem to score better, which logically has a positive influence on the overall feeling of cyclability (
Figure 5). The differences in perception between the clusters are significant, and reflect different urban environments, with their own specificities and issues. While the influencing factors between high- and low-density cities (clusters 1 and 4, respectively) are totally different, leading to similar, very negative feelings, middle-density cities (clusters 2 and 3), on what could be described as a more “human scale”, with balanced indicators, seem to enjoy a much more favourable environment, apparently strongly influencing users’ feelings.
5. Discussion
A fundamental finding of this paper is that the perception of cyclability for the Japanese bicycle users seems in no way to be linked to the presence or absence of cycling infrastructure. Cities such as Saitama or Kyoto, with a much higher than average amount of infrastructure (in terms of total length), did not obtain particularly high scores. The failures of the Chi
2-score analyses based on clusters depending on infrastructure-related variables proved this point. Although the study scales vary, even huge differences in terms of cycling facilities do not seem to be perceived, or in any case, to play an important role in users’ perceptions, which seems to run counter to most studies on the subject [
21,
28,
29]. To continue with the first point, all the respondents, whatever the cluster, seem to be complaining about a lack of infrastructure, and even more importantly, a lack of policies to develop it. At a time when many Japanese cities are rushing to develop kilometres of cycle lanes, over and above the total length of the infrastructures (often simple lines called “
Yabane” at the side of the roads), the question arises as to the quality of the infrastructure within the city and the level of safety it offers users. Safer infrastructure, protecting cyclists from other road users with clear physical limitations, could contribute to the recognition of effort by cyclists and a general increase in perception factors.
It is also very interesting to see that users’ overall opinion of their condition as a user is negative. These data are difficult to put into context, as few studies in Japan focus on how cyclists feel about their environment, apart from research purely into the link between perception and road safety. Sometimes perceived as a threat to road safety [
40], sometimes omitted from studies that attempt to assess the quality of the very infrastructure they use, cyclists seem to have a very weak voice in the landscape of local cycle planning. The notes received in this research work and the scaled perceptions, therefore, demonstrate the urgent need for a much more proactive integration of cycle users into the planning process and, hence, an overall improvement in cyclability.
Furthermore, despite the large gap between the cycling infrastructures deployed and the perception of cyclability, the SEM analysis showed that infrastructure has a significant impact on overall cyclability perceptions. Although this may seem counterintuitive given the conclusions drawn so far, it gives us a last fundamental insight about the users’ perception of cyclability. Actual infrastructure does not influence the perception of cycle-friendliness, but in the respondents’ understanding, infrastructure is a key factor in the development of a pleasant cycling environment. This unique nuance is very important in that it might reflect a strong expectation on the part of users in terms of better infrastructure.
Finally, in general terms, whatever the type of urban environment, it seems clear that a more comprehensive approach is crucial if we are to achieve lasting improvements in the quality of the cycling environment. We proved that cyclists’ perception could vary drastically from one region to another, not because of the infrastructure, but because of a particular urban context. Responding to these specificities in the most comprehensive way possible involves decentralizing power and, therefore, delegating the MLIT to cities or at least to prefectures. And, while initial studies have recently shown that such local initiatives can have excellent effects on cyclists [
41], it is time for Japanese cities to take a greater interest in these issues. Dense conurbations need to focus on safer infrastructure and more and better accessible parking, medium-sized conurbations need to develop more cycle paths, and large, sparsely populated conurbations need to work on a range of issues to improve general accessibility and users’ feeling of safety.
6. Limitations
Although, in general terms, our study provides many new elements for reflection and new knowledge on the issue of cyclability in Japan, there are a number of limitations that are open to discussion. The average scores obtained in the least densely populated areas (in this case, cluster 4) may be due to the fact that users sometimes have no other choice than to use their bike for their daily commute, possibly making the simple act of commuting a miserable one and, thus, creating a negative cognitive bias on the perception of cyclability and its related factors. This feeling could also be multiplied by the modal share largely in favour of the car, possibly also leading to a feeling of lack of safety.
Another limitation, a more practical one this time, is the number of usable samples from our questionnaire. Although 481 samples make it possible to form four major clusters, the clusters themselves are also necessarily biassed due to the uniqueness of each territory and the potential weight of certain factors not taken into account in the analysis. For a future study, it would be interesting to focus on a much more limited number of cities, albeit with deliberately different characteristics relating to cyclability and the urban environment. An approach of this type could enable a more in-depth study of the factors influencing cyclability, while eliminating the margin of error naturally introduced by clustering.
In order to avoid multiplying the factors and weakening our model, this work paid very little attention to the question of user behaviour, and did not even introduce user behaviour as an explanatory variable. Although this is justified by the very aim of this work, which is to focus on factors external to cyclists, it would be very interesting and would undoubtedly provide many new avenues for reflection to use these parameters as adjustment variables or as explanatory factors.
Finally, there are certain limitations at the very heart of our model, with variables (such as those relating to the perception of bicycle parking) sometimes not adjusted in the correct way. This was also the case with the policy variables, which, in an initial theoretical model, should have fed a latent variable called “” but which, for a number of practical reasons and due to the failure to incorporate it properly into the model, could not be exploited in the SEM analysis. However, because of their contribution to the overall understanding of the subject, they were kept for the Chi2 analysis and the mean of the questions.
7. Conclusions
In carrying out the first study on perceived cyclability in Japan, we highlighted a number of key points relating to user aspirations and the weaknesses of infrastructure policies and patterns currently in place. While actual cycling infrastructure does not seem to have the slightest impact on user perceptions, expectations of it are extremely high, reflecting a need for dedicated, safe, and comprehensively deployed infrastructure. Also, although the results of the bicycle parking variable are sometimes inconclusive, it generally appears that more bicycle parking (and potentially more accessibility, both physically and financially) is also an important area for improvement.
More generally, we have also pointed out the limits of a centralized system in covering a subject as complex as cyclability, calling for greater decentralization and comprehension in future cycling development plans in Japan.
Finally, for future research, it would be interesting to look at the relationship between actual safety and perceived safety, using road accident data in particular. Since the results of our study show that safety has a strong influence on perceived cyclability, it could be particularly rewarding to explore this question further and to gain a better understanding of the factors related to safety perception.


