Article

Urban Mobility Choices of University Students: Insights into Satisfaction Levels and Preferences in the Thessaloniki Metropolitan Area

1
School of Rural and Surveying Engineering, Faculty of Engineering, Aristotle University of Thessaloniki, 541 24 Thessaloniki, Greece
2
Hellenic Institute of Transport (HIT/CERTH), 570 01 Thessaloniki, Greece
*
Author to whom correspondence should be addressed.
Urban Sci. 2025, 9(2), 44; https://doi.org/10.3390/urbansci9020044
Submission received: 17 January 2025 / Revised: 8 February 2025 / Accepted: 11 February 2025 / Published: 13 February 2025

Abstract

:
Assessing people’s satisfaction with diverse modes of transportation is complex yet crucial. This paper delves into the pivotal outcomes derived from analyzing survey data. The surveys, conducted at Aristotle University of Thessaloniki (AUTH), gauged student satisfaction with the available transport options in the Thessaloniki Metropolitan Area during 2021 and 2022, thus providing insights into trends in satisfaction levels, allowing for a deeper understanding of evolving mobility preferences. Through a comparative analysis of the data, we discerned attributes influencing participants’ transportation choices. Our research contributes to the literature by applying a standardized methodology using an algorithm developed by the European Commission; the satisfaction levels among university students for private car and public transport in those years were determined. Notably, the findings underscore that, despite a marginally higher usage of public transport, university students exhibit a greater satisfaction level with private car transportation. This implies a nuanced preference for private car usage among students, as opposed to a mere emphasis on the higher popularity of public transport within this demographic. The findings aim to provide transport operators and policymakers with valuable information in terms of ways to enhance sustainable urban mobility and improve public transport services.

1. Introduction

In 2021, the first questionnaire-based survey was conducted, aiming to collect data and through them calculate participants’ level of satisfaction regarding their mobility. The survey targeted students from Aristotle University of Thessaloniki (referred to as AUTH), which is situated in the central area of Thessaloniki, Greece. The results of this survey went public [1,2], and the experience gained by that process was used as the basis for repeating the survey in 2022. It must be mentioned at this point that the second questionnaire-based survey was conducted in the framework of a Diploma Thesis at the School of Rural and Surveying Engineering of AUTH [2]. Both surveys were conducted via the internet, using an online platform dedicated to this reason, provided by the university’s authorities.
The surveys were conducted with the objective of gathering data to assess the satisfaction levels related to the use of various transportation modes within the Thessaloniki Metropolitan Area. However, the authors determined that the focus of the comparative analysis would be on descriptive examinations pertaining to the utilization of private cars and public transport. The analyses were utilized alongside necessary assumptions and equations developed as part of the European Commission’s Urban Audit project [3] to estimate satisfaction levels. Section 2, “Literature Review”, briefly summarizes key references related to this study’s topic. Section 3, “Methodology”, describes the process of designing the questionnaire and measures taken to ensure the surveys’ reliability. Section 4, “Analysis and Results”, is divided into two parts: Section 4.1 presents a descriptive analysis, while Section 4.2 compares and contrasts the main findings regarding satisfaction levels for the two travel modes. In Section 5, “Discussion”, the paper addresses issues, explores potential solutions, and highlights procedural limitations. Finally, Section 6, “Conclusions”, provides an overview of the primary research findings.
Thanks to cooperation between the university administration and the authoring team, the survey was completed quickly and effectively while maintaining participant confidentiality. The methodology employed in the first questionnaire-based survey conducted in 2021 created a schedule that permits the survey to be repeated as often as necessary. This approach aims to gather critical data, develop data time series, and ultimately provide valuable insights for public transport operators, administrators, and policymakers across all levels.

2. Literature Review

Using keywords like “level of satisfaction”, “mobility of university students”, “wellbeing”, “questionnaire-based surveys”, and “quality-of-service (QOS)”, this literature study is based on online sources. Although there are many references on user satisfaction with transportation, our study concentrated on those that were relevant to college students.
This literature review clarified different aspects of our research, establishing the groundwork for the formulation of the questionnaire. For instance, Sukhov et al. [4] gave a thorough explanation of what is meant by “level of satisfaction” and went into depth about the approaches that transportation researchers have used in the past to evaluate travelers’ pleasure with their journeys. Additionally, a number of sources [5,6,7,8,9,10,11] analyze the procedures to be followed as well as the possible risks of an online questionnaire-based survey about university students’ mobility, if and how satisfied they are, and ways to improve it. Specifically, the choice was made to gather and examine Customer Satisfaction Indexes (CSIs), which were selected due to their ability to measure the caliber of services.
The following methods are known to be used to determine the degree of satisfaction among users of public transportation: The SERVQUAL model, which measures service quality [12], the European Customer Satisfaction Index (ECSI) model [13], the fuzzy clustering approach [14], the Pythagorean fuzzy MULTIMOORA method [15], multi-criteria analysis [16], the last kilometer bus satisfaction evaluation model [17], and the Parsimonious Analytic Hierarch Process [18]. The research team opted to use an algorithm developed during a survey conducted in cities within EU member states, as previously mentioned [3]. This strategy was selected in order to proactively address any possible concerns regarding the disparate definitions of service quality among various traveler types, which could arise when utilizing regression models [19].

3. Methodology

In recent years, numerous global surveys, similar to ours, have increasingly targeted university students, as well as a broader student population, and have been conducted worldwide, such as in Greece [2,20]; in Italy [21,22]; in Japan [23]; in Malaysia [24]; and in Croatia [25], as well as other regions [7,26,27,28,29].
The survey was sent to every university email address connected to AUTH, which is approximately 80,000 people, staff and students combined. The questionnaire that was employed was the same as the one used in the similar survey carried out in 2021. There are two separate sections to this questionnaire. First, a sociodemographic survey was designed to collect data, and the second one aimed to collect data on the preferences, behaviors, and perceived levels of satisfaction of users with respect to all modes of transportation available in the study area, which is the Thessaloniki Metropolitan Area (TMA) (see Figure 1). There are more than a million people living there, and the region is more than 1200 km2 [30].
The initial section of the survey included six (6) questions about the following: (a) gender; (b) age; (c) marital status; (d) monthly income; (e) education level; and (f) municipality of residence. According to Bouhouras et al. (2022) [2], there were eighteen (18) questions in the second portion. While questions i through viii asked users to provide simple answers, such as a “yes/no” response or a single number value, questions ix through xiv asked users to specify a value on a Likert scale (1–5) for various services associated with each available transit mode [31]. The questionnaire-based survey took place between 31 March 2022 and 18 April 2022.
To ensure a 5% margin of error at a significance level of α = 5%, a minimum sample size of 320 valid questionnaires was determined, following the guidelines set by Daniel [32] and Naing and Winn [33]. For the first survey (year 2021), there were 466 questionnaires, while for the second, the number was 437 (year 2022). Even though there was a slight decrease in the number of valid questionnaires (around 6%) in the second survey, the sample is considered solid. For the year 2022, the number of questionnaires that were ultimately analyzable was 316.
After accounting for the required assumptions, the satisfaction levels that AUTH students reported for both private and public transportation (in the roles of driver and passenger) were calculated. These equations were chosen above other approaches, such classical regression models, since they were created by the European Commission and were seen to be more appropriate for use in a nation like Greece.
The equations used were designed to calculate the perceived satisfaction of using public transport. However, the research team adapted the algorithm with appropriate assumptions and modifications to evaluate satisfaction for private car use, as described in Bouhouras et al.’s study [2]. The average satisfaction levels for traveling within the urban area under study, as reported through the surveys, were calculated using the algorithm’s equations [2]. These equations incorporated the following indices, each addressed through specific questions in the questionnaire: (a) affordability, (b) safety, (c) ease of accessibility, (d) frequency, and (e) reliability of public transport.
As noted on the above, adjustments and assumptions were required to align the algorithm’s indices with the corresponding questionnaire items. Furthermore, it was necessary to convert the 5-level Likert scale used in the questionnaire into the 4-level scale utilized by the algorithm (see Table 1). To achieve this alignment, the research team decided that neutral responses would be interpreted as relatively negative opinions (somewhat disagree and/or strongly disagree). As a result, neutral responses were combined with those indicating somewhat disagree, as described thoroughly in Bouhouras et al.’s study [2].

4. Analysis and Results

Two subsections make up the statistical analysis of the data collected in this section. In particular, Section 4.2 compares the results of the two polls (2021 and 2022), and Section 4.1 deals with the descriptive statistical analysis of the most recent (second) survey in 2022.

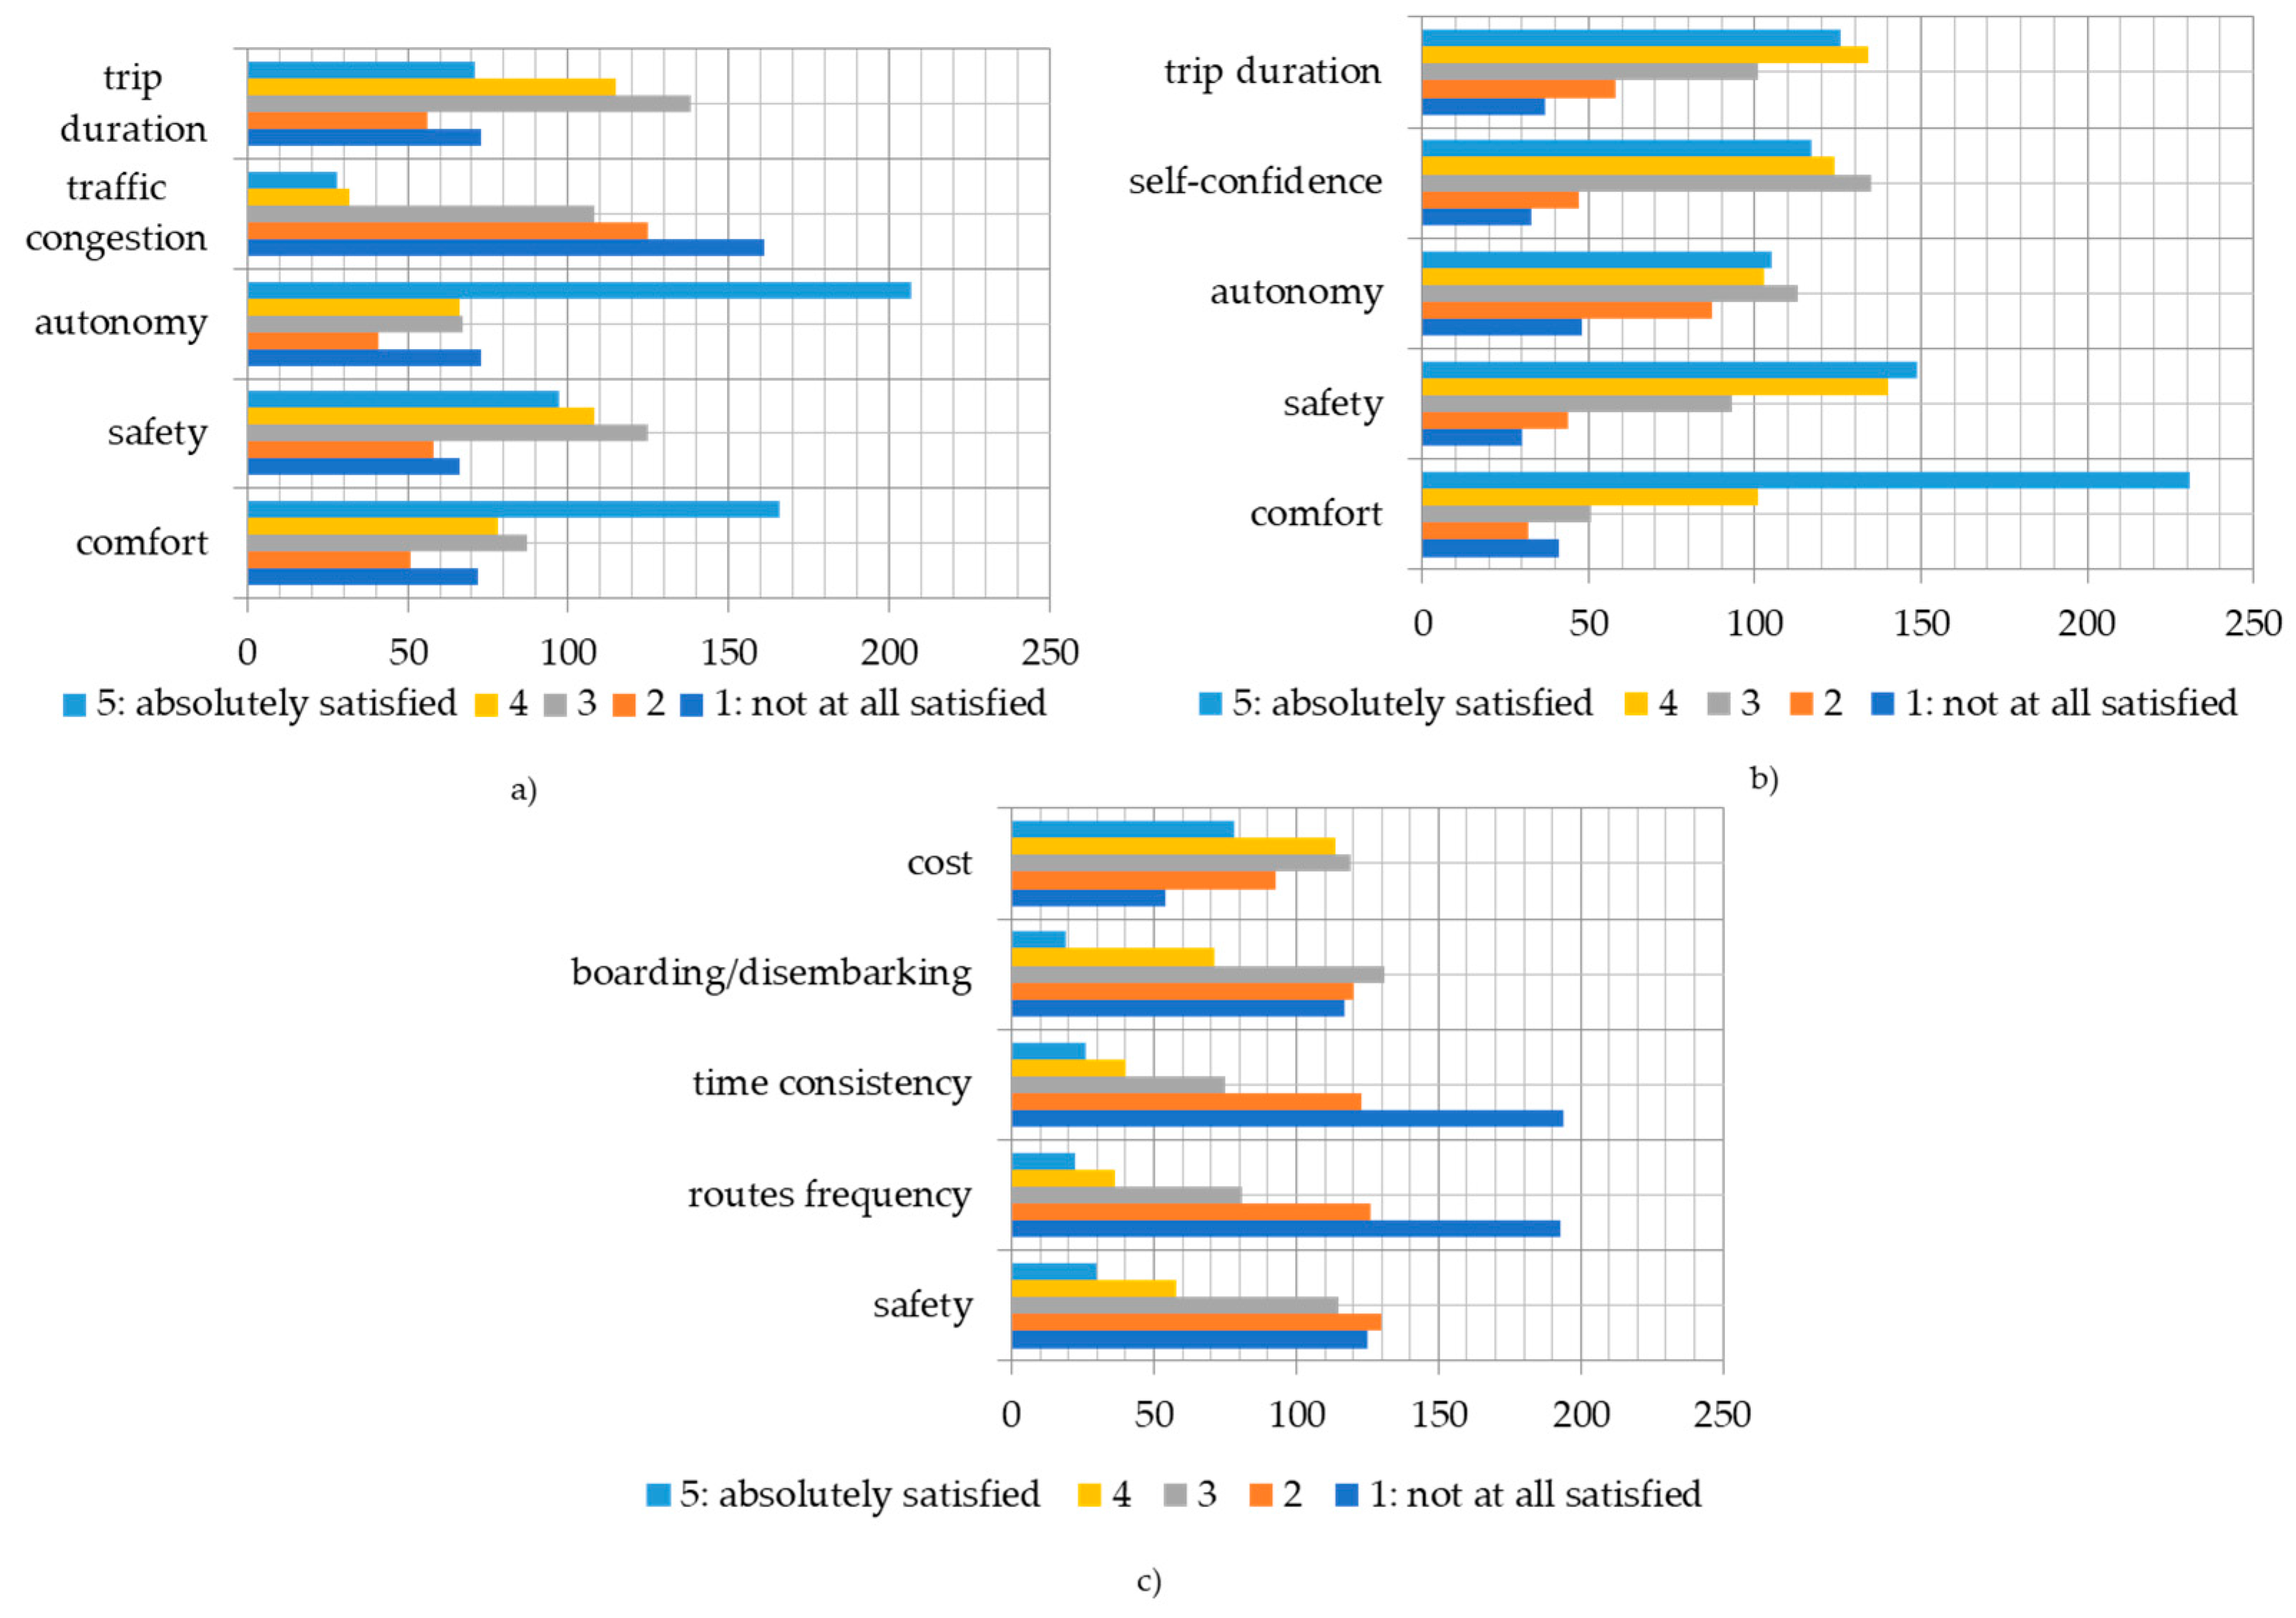
4.1. Descriptive Statistical Analysis

As mentioned above, the number of university students participating in the survey was 437. However, for many of the questions concerning mainly the attributes of their transport by public transport and private car, the number of questionnaires filled was equal to 316 (there were 121 non-fully filled questionnaires). Consequently, 316 questionnaires were included in the calculation of the satisfaction level.
Most of the sample consisted of women (57.2%). Over half of the sample (51.5%) concerned the youngest age group (18–24 years old), something which was highly expected due to the large number of undergraduates. Regarding monthly household income, all income classes were significantly represented in the sample; however, the lower income class (EUR 0–400) was the most popular (21.7%). Regarding ownership and usage of private cars, 43.9% of the sample responded affirmatively, while the respective percentage of bicycles was 24.5%.
Table 1 presents the frequency of usage of different transport modes in the Thessaloniki Metropolitan Area among university students. It is evident that walking is the predominant mode of transportation for students, followed by a significant use of public transport. In contrast, the percentage of respondents regularly using bicycles was notably low, accounting for less than 2% of the total.
University students were queried about their preferences regarding transportation modes, with a notable 21.7% expressing a desire to use bicycles more frequently, and a significant 15.6% expressing a preference for more frequent use of private cars.
Figure 2 displays how different Thessaloniki transportation options are rated. In general, people who drove and/or used private cars provided more favorable responses than those who used public transportation.
Private cars were perceived as highly comfortable, particularly by passengers, offering a substantial level of autonomy and flexibility, particularly for drivers. Nevertheless, drivers pointed out traffic congestion as a major disadvantage. On the other hand, public transport in Thessaloniki was rated poorly in various satisfaction indicators, such as punctuality, route frequency, boarding and alighting processes, and safety. This suggests that the quality of service provided by public transport is not at the desired level. However, the majority of participants expressed high satisfaction with the cost of public transport. However, regarding the transport mode which is used more frequently (Likert scale = 1 on the respective questions), public transport scored the highest percentage (27.0%), private car as a driver scored the second higher percentage (21.3%), and finally private car as a passenger scored a rather low percentage (8.2%). It could be estimated that university students do use public transport because they may not have another option (lack of owning a private car, lower cost than using a private car), despite identifying the negative performance of public transport.

4.2. Comparison of the Surveys’ Findings

The distribution of the sample regarding gender was almost identical between the two surveys. In 2021, 56.0% were females and 42.6% were males, while in 2022, 57.2% were females and 41.6% were males. In 2021’s survey, the distribution concerning the participants’ age was different than the one in 2022. The majority of the participants were again between 18 and 24 years old; however, their percentage was significantly increased in 2022’s survey (from 40.2% in 2021 to 51.5% in 2022). The distribution concerning private car ownership was slightly decreased in 2022’s survey compared to the previous year (from 47.0% in 2021 to 43.9% in 2022). On the other hand, the distribution concerning bicycle ownership was almost identical in both surveys (24.3% in 2021 and 24.5% in 2022).
Concerning the frequency of using the available transport modes during a week, the university students replied as follows: (a) the majority do not use a private car as their preferred transport mode (30.7% in 2021 compared to 35.5% in 2022); (b) the majority do not use a bicycle as their preferred transport mode (56.4% in 2021 compared to 55.8% in 2022); (c) the majority use public transport more than once per day (18.8% in 2021 compared to 22.0% in 2022); (d) the majority rarely use a taxi as their preferred transport mode (36.9% in 2021 compared to 36.4% in 2022); and finally the majority of students prefer to walk more than once per day in order to move (28.1% in 2021 compared to 31.1% in 2022). In both surveys, most of the university students replied that they wish to use bicycles more as their preferred transport mode and specifically in 2022, the respective percentage was slightly increased (20.2% in 2021 and 21.7% in 2022).
The analysis of the respective questions concerning the attributes of each transport mode revealed the following:
  • The percentage of university students being absolutely satisfied with the level of comfort provided by their private car when they use it as a driver increased in 2022 (26.3%) compared to 2021 (24.5%).
  • The percentage of university students being absolutely unsatisfied with the congestion phenomena with their private car as a driver is almost identical in both surveys: 27.2% in 2021 and 27.6% in 2022.
  • The percentage of university students being absolutely satisfied with the level of comfort provided by moving as a passenger with a private car slightly increased in 2022 (31.4%) compared to 2021 (30.7%).
  • The percentage of university students being absolutely unsatisfied with public transport’s frequency slightly decreased in 2022 (31.1%) compared to 2021 (32.1%).
  • The percentage of university students being absolutely unsatisfied with public transport’s travel time slightly increased in 2022 (32.5%) compared to 2021 (32.1%).
  • The percentage of university students being absolutely unsatisfied concerning their perceived level of safety and security while waiting at bus stops is identical in both surveys (23.9% in 2021 and 24.0% in 2022).
  • The same with the previous case occurs for the embarking/disembarking conditions. The percentage of university students being absolutely unsatisfied is almost identical in both surveys (25.0% in 2021 and 24.7% in 2022).

4.3. Level of Satisfaction Calculation

Table 2 displays the outcomes of this implementation for users of public transportation, whereas Table 3 and Table 4 provide the results for drivers and passengers of private vehicles, respectively.
Considering the provided scores, private cars emerge as the preferred mode of transportation for students at the Aristotle University of Thessaloniki compared to public transport. When comparing the results of Table 4 (survey for 2022) with the respective results of the survey the previous year (2021) (see Table 3), the university students’ level of satisfaction regarding public transport in the city is decreasing, while the level of satisfaction with private car usage (both as a driver and as a passenger) is increasing. Table 5 presents the respective scores for the two surveys (2021 and 2022) on the calculated level of satisfaction regarding public transport, private car drivers, and private car passengers.
The facts (a) that the university students for a second consecutive year rank public transport lower than private cars and (b) that for the year 2022 their level of satisfaction with using public transport is lower than 2021 (almost by 14%) are quite alarming. At the same time, private car’s level of satisfaction has increased by almost 8.0% as a driver and 12.0% as a passenger.

5. Discussion

This study reveals important insights into university students’ satisfaction with different transportation modes in the Thessaloniki Metropolitan Area. By analyzing survey data from 2021 and 2022, it was found that satisfaction with public transport services has consistently declined, whereas satisfaction with private cars, whether as drivers or passengers, has steadily increased. These patterns highlight both challenges and opportunities for policymakers striving to promote sustainable urban mobility.
The decline in public transport satisfaction is alarming, particularly given its role as a more sustainable mode of transport. Key factors contributing to dissatisfaction include reliability issues, infrequent services, and perceived safety concerns at bus stops. For instance, 32.5% of respondents in 2022 expressed dissatisfaction with public transport travel time, a slight increase from 2021. Such issues have likely reinforced negative perceptions among students, leading to a preference for private cars despite the economic and environmental costs. The dissatisfaction with public transport is consistent with previous studies that emphasize the critical role of service quality, particularly reliability and safety, in shaping user satisfaction. Addressing these issues requires targeted interventions, such as optimizing schedules, improving vehicle maintenance, and enhancing safety at bus stops through measures like better lighting and security monitoring.
The decline in satisfaction with public transport is concerning, especially given its importance as a sustainable mode of transport. Key factors behind this dissatisfaction include reliability issues, infrequent services, and perceived safety concerns at bus stops. For example, 32.5% of respondents in 2022 were dissatisfied with public transport travel time, a slight increase from 2021. These problems have likely exacerbated negative perceptions among students, leading to a preference for private cars despite their higher economic and environmental costs.
This dissatisfaction mirrors earlier studies’ findings, emphasizing the role of service quality, including reliability and safety, in user satisfaction. Addressing these issues necessitates targeted measures, such as optimizing schedules, improving vehicle maintenance, and enhancing safety at bus stops through better lighting and security monitoring.
Conversely, private cars have seen increased satisfaction levels among students, who perceive them as offering greater autonomy, comfort, and safety compared to public transport [34]. The 2022 survey shows that 31.4% of students were highly satisfied with the comfort of private cars as passengers, an increase from 30.7% in 2021. Similar results have been found by Henke et al. [35]. However, reliance on private vehicles leads to congestion and environmental degradation, posing challenges for urban sustainability.
The findings suggest that students’ preference for private cars is influenced by both negative experiences with public transport and the perceived benefits of private vehicles [36]. Policymakers must address this dual dynamic by enhancing public transport services while disincentivizing private car use through measures such as congestion charges or limiting parking availability near the university.
Walking and cycling remain underutilized among students, despite their potential as sustainable alternatives. The slight decline in cycling rates observed in 2022 may be attributed to inadequate infrastructure, such as a lack of safe cycling lanes and secure parking facilities. Improving these aspects could encourage more students to choose these modes, given their health and environmental benefits.
Interventions like redesigning pedestrian pathways and creating dedicated cycling lanes can significantly enhance accessibility and safety, encouraging more students to walk or cycle to the university. Additionally, promoting these modes through awareness campaigns and incentives, such as subsidized bicycle purchases, could further increase adoption.
The persistent preference for private cars over public transport and active modes highlights the need for a comprehensive approach to sustainable mobility. The upcoming launch of the metro system in Thessaloniki offers a critical opportunity to shift perceptions and usage patterns. By ensuring high-quality service, reliability, and integration with other modes, the metro could become a cornerstone for transforming urban mobility in the region.
Moreover, addressing systemic issues in public transport necessitates the continuous monitoring of user satisfaction and proactive measures to address emerging concerns. Annual surveys, such as the one conducted in this study, are invaluable for tracking trends and guiding policy decisions. Expanding these surveys to include all residents of the Thessaloniki Metropolitan Area could provide a more comprehensive understanding of mobility challenges and opportunities.
A comprehensive analysis of the collected data and calculated satisfaction levels indicates that university students are dissatisfied with public transport services. Consequently, they view private cars as a more favorable option. Despite being aware of the challenges associated with private car usage, such as delays, congestion, and a lack of guaranteed free parking spaces, students feel compelled to choose private cars for a more comfortable and less stressful transportation experience. The 2022 survey reveals that the issues identified in the 2021 survey persist, including concerns about in-vehicle conditions and the reliability of vehicle schedule. The importance of conducting this survey annually is justified by the potential for recorded data to serve as valuable inputs for decision-makers. These inputs can contribute to the implementation of measures or improvements aimed at addressing the identified issues and enhancing the overall transportation experience for university students [37].
  • Having a constant perception of university students’ perceptions on critical issues will allow them to redesign public transport routes and take measures to increase passengers’ safety, security, and comfort.
  • As university students continue to raise concerns in the 2022 survey regarding the perceived safety and security levels while waiting at public transport stops, measures should be taken to address this issue. These actions may include enhancements such as improved lighting to make the stops more comfortable, safer, and more secure.
  • Reallocating seats in public transportation to better suit the demands of students—both in terms of quantity and degree of safety and security—as well as taking steps to maintain the best possible state of the vehicles—such as clean, air-conditioned, and heated—are potential measures.
  • Redesigning the walking and cycling infrastructure will improve accessibility to AUTH’s campus amenities while putting the comfort, security, and safety of students first. To provide a successful connection between the school and the city, interventions are also required to optimize the networks for walking and bicycling.
  • Develop and regularly update AUTH’s Sustainable Mobility Plan considering student feedback on the quality of provided services [2]. The university authorities, although they do not directly control or affect public transport operations, certainly indirectly request better services officially for AUTH students [38].
  • If the survey is addressed to all Thessaloniki Metropolitan Area residents, all the above can be implemented in a more integrated and strategic level covering the entire area and, of course, residents’ and visitors’ needs.
This study has certain limitations that should be noted. The reliance on online surveys may have introduced a self-selection bias, possibly excluding students without regular internet access. Furthermore, the methodology for aligning the survey’s Likert scale with the European Commission’s algorithm required assumptions that might affect the results. Future research should explore alternative methods to validate these assumptions and their impact on satisfaction indices.
Moreover, the planned expansion of the survey to include broader populations and the integration of new transport modes, such as the metro, presents exciting opportunities for future studies and trip distance [39]. These efforts will be essential for developing a comprehensive understanding of urban mobility and guiding effective interventions.

6. Conclusions

This study underscores key trends in university students’ satisfaction with transportation modes in Thessaloniki, providing valuable insights for targeted interventions. The decline in public transport satisfaction from 2021 to 2022 highlights ongoing challenges in reliability, safety, and service quality. In contrast, private cars, despite their environmental and economic costs, are increasingly preferred due to perceived comfort and autonomy.
The key findings indicate significant dissatisfaction with public transport travel times, frequency, and safety, emphasizing the need for comprehensive service improvements. Students value the comfort, safety, and reliability of private cars, leading to higher satisfaction levels despite issues like congestion and limited parking. Walking and cycling remain underutilized, largely due to inadequate infrastructure, presenting opportunities for sustainable alternatives.
Recommendations include enhancing public transport by increasing service frequency and reliability, improving safety with better lighting and monitoring, and integrating the upcoming metro system. Promoting sustainable alternatives through dedicated cycling lanes, pedestrian pathways, incentives like subsidized bicycles, and awareness campaigns is essential. Policy measures such as congestion charges or limited parking near the university can potentially discourage private car use, while regular monitoring through annual surveys can be proven significant.
Expanding this study to include broader populations within Thessaloniki and integrating new transport modes like the metro will provide a more comprehensive understanding of urban mobility needs. Furthermore, close monitoring of the metro’s impact on transport patterns and refining survey methodologies will enhance future analyses.
Addressing these findings with strategic actions can significantly improve transportation satisfaction among university students, paving the way for more sustainable urban mobility in Thessaloniki.

Author Contributions

Conceptualization, E.B. and S.B.; methodology, E.B.; validation, E.B. and S.B.; formal analysis, T.D. and D.M.; writing—original draft preparation, E.B.; writing—review and editing, E.B. and S.B.; visualization, E.B.; supervision, S.B. All authors have read and agreed to the published version of the manuscript.

Funding

This research received no external funding.

Institutional Review Board Statement

This study was conducted in accordance with the Declaration of Helsinki and approved by the Institutional Ethics Committee of Aristotle University of Thessaloniki (protocol code 75074/2022 and date of approval 28 March 2022).

Informed Consent Statement

Informed consent was obtained from all subjects involved in this study.

Data Availability Statement

Data are contained within the article.

Conflicts of Interest

The authors declare no conflicts of interest.

References

  1. Dimos, T.; Mastoras, D. Calculation of the Satisfaction Index Concerning People Who Travel in the Agglomeration of Thessaloniki. achelor’s Thesis, School of Rural & Surveying Engineering, Aristotle University of Thessaloniki, Thessaloniki, Greece, 2022. [Google Scholar]
  2. Bouhouras, E.; Basbas, S.; Mintsis, G.; Taxiltaris, C.; Miltiadou, M.; Nikiforiadis, A.; Konstantinidou, M.; Mavropoulou, E. Level of Satisfaction among University Students Using Various Transport Modes. Sustainability 2022, 14, 4001. [Google Scholar] [CrossRef]
  3. European Commission Urban Audit. Available online: https://ec.europa.eu/regional_policy/policy/themes/urban-development/audit_en (accessed on 12 February 2025).
  4. Sukhov, A.; Lättman, K.; Olsson, L.E.; Friman, M.; Fujii, S. Assessing Travel Satisfaction in Public Transport: A Configurational Approach. Transp. Res. Part D Transp. Environ. 2021, 93, 102732. [Google Scholar] [CrossRef]
  5. Ribeiro, P.; Fonseca, F.; Meireles, T. Sustainable Mobility Patterns to University Campuses: Evaluation and Constraints. Case Stud. Transp. Policy 2020, 8, 639–647. [Google Scholar] [CrossRef]
  6. UNI EN 13816; Transportation—Logistics and Services—Public Passenger Transport—Service Quality Definition Targeting and Measurement. CEN: Brussels, Belgium, 2002.
  7. Shaaban, K.; Kim, I. The Influence of Bus Service Satisfaction on University Students’ Mode Choice. J. Adv. Transp. 2016, 50, 935–948. [Google Scholar] [CrossRef]
  8. Susilo, Y.O.; Cats, O. Exploring Key Determinants of Travel Satisfaction for Multi-Modal Trips by Different Traveler Groups. Transp. Res. Part A Policy Pract. 2014, 67, 366–380. [Google Scholar] [CrossRef]
  9. Minelgaite, A.; Dagiliute, R.; Lionikiene, G. The Usage of Public Transport and Impact of Satisfaction in the European Union. Sustainability 2020, 12, 9154. [Google Scholar] [CrossRef]
  10. Saif, M.A.; Zefreh, M.M.; Torok, A. Public Transport Accessibility: A Literature Review. Period. Polytech. Transp. Eng. 2018, 47, 36–43. [Google Scholar] [CrossRef]
  11. Silveira, T.; Romano, C.A.; Gadda, T. Public Transport Usage among University Students: What to Expect Based on Customer Satisfaction Survey (CSS) Analysis. Transportes 2020, 28, 32–45. [Google Scholar] [CrossRef]
  12. Parasuraman, A.P.; Zeithaml, V.A.; Berry, L.L. SERVQUAL: A Multiple-Item Scale for Measuring Consumer Perceptions of Service Quality. J. Retail. 1988, 64, 12–40. [Google Scholar]
  13. Thomaz, P.S.; Nogueira, C.; Da Costa Coelho, L.; Volkmer De Azambuja, A.M.; Dias De Mattos, V.L. Satisfaction with Public Transport: The Case of a University Access. Int. J. Eng. Res. Appl. 2016, 6, 1–6. [Google Scholar]
  14. Stankovic, M.; Gladovic, P.; Popovic, V. Determining the Importance of the Criteria of Traffic Accessibility Using Fuzzy AHP and Rough AHP Method. Decis. Mak. Appl. Manag. Eng. 2019, 2, 86–104. [Google Scholar] [CrossRef]
  15. Ruisong, Y.; Junxiang, C. Satisfaction Evaluation of the “Last Kilometer” on Public Transport System in Shanghai. Traffic Transp. 2012, 3, 6–8. [Google Scholar]
  16. Inturri, G.; Giuffrida, N.; Le Pira, M.; Fazio, M.; Ignaccolo, M. Linking Public Transport User Satisfaction with Service Accessibility for Sustainable Mobility Planning. ISPRS Int. J. Geo-Inf. 2021, 10, 235. [Google Scholar] [CrossRef]
  17. Rovaha. Available online: https://www.van-haaften.nl/customer-satisfaction/customer-satisfaction-models/61-the-european-customer-satisfaction-index (accessed on 17 November 2021).
  18. Duleba, S.; Moslem, S. User Satisfaction Survey on Public Transport by a New PHAP Based Model. Appl. Sci. 2021, 11, 10256. [Google Scholar] [CrossRef]
  19. De Oña, J.; Estévez, E.; De Oña, R. Perception of Public Transport Quality of Service among Regular Private Vehicle Users in Madrid, Spain. Transp. Res. Rec. 2020, 2674, 213–224. [Google Scholar] [CrossRef]
  20. Pitsiava-Latinopoulou, M.; Basbas, S.; Gavanas, N. Implementation of Alternative Transport Networks in University Campuses: The Case of Aristotle University of Thessaloniki, Greece. Int. J. Sustain. High. Educ. 2013, 48, 310–323. [Google Scholar] [CrossRef]
  21. Cappelletti, G.M.; Grilli, L.; Russo, C.; Santoro, D. Sustainable Mobility in Universities: The Case of the University of Foggia (Italy). Environments 2021, 8, 57. [Google Scholar] [CrossRef]
  22. Cirrincione, L.; Di Dio, S.; Peri, G.; Scaccianoce, G.; Schillaci, D.; Rizzo, G. A Win-Win Scheme for Improving the Environmental Sustainability of University Commuters’ Mobility and Getting Environmental Credits. Energies 2022, 15, 396. [Google Scholar] [CrossRef]
  23. Bakdur, A.; Masui, F.; Ptaszynski, M. Predicting Increase in Demand for Public Buses in University Students Daily Life Needs: Case Study Based on a City in Japan. Sustainability 2021, 13, 5137. [Google Scholar] [CrossRef]
  24. Hashim, G.R.; Mohamad, S.; Haron, S.; Hassan, F.; Hassan, N.; Kasa, A. Student Satisfaction with the Campus Bus Service at UiTM Sham Alam Malaysia. In Proceedings of the 2013 IEEE Business Engineering and Industrial Applications Colloquium (BEIAC), Langkawi, Malaysia, 7–9 April 2013; pp. 723–727. [Google Scholar] [CrossRef]
  25. Trcek, B.; Mesarec, B. Pathways to Alternative Transport Mode Choices among University Students and Staff—Commuting to the University of Maribor since 2010. Sustainability 2022, 14, 11336. [Google Scholar] [CrossRef]
  26. Monteiro, M.M.; De Abreu e Silva, J.; Ingvardson, J.B.; Nielsen, O.A.; Pinho De Sousa, J. Public Transport Use and Satisfaction by International Students and Researchers. Sustainability 2021, 13, 8417. [Google Scholar] [CrossRef]
  27. Stojic, D.; Ciric, Z.; Sedlak, O.; Horvat, A.M. Students’ Views on Public Transport: Satisfaction and Emission. Sustainability 2020, 12, 8470. [Google Scholar] [CrossRef]
  28. Yusof, Z.; Misiran, M.; Pei, L.P.; Tian, H.T. Factors Affecting Student’s Satisfaction towards Bus Services in University. Res. J. Appl. Sci. Eng. Technol. 2014, 8, 817–820. [Google Scholar] [CrossRef]
  29. Cruz, O.A.P.; Perez, R.P. Satisfaction with Public Transportation Service among University Students. RIDE Rev. Iberoam. Investig. Desarro. Educ. 2022, 12, 1004. [Google Scholar]
  30. Wikipedia. Thessaloniki Metropolitan Area. Available online: https://en.wikipedia.org/wiki/Thessaloniki_metropolitan_area_CC_BY-SA_3.0 (accessed on 25 February 2022).
  31. Eboli, L.; Mazzulla, G. A New Customer Satisfaction Index for Evaluating Transit Service Quality. J. Public Transp. 2009, 12, 21–37. [Google Scholar] [CrossRef]
  32. Daniel, W.W. Biostatistics: A Foundation for Analysis in the Health Sciences, 7th ed.; John Wiley & Sons Inc.: Hoboken, NJ, USA, 1999. [Google Scholar]
  33. Naing, L.; Winn, T.; Rusli, B.N. Practical Issues in Calculating the Sample Size for Prevalence Studies. Arch. Orofac. Sci. 2006, 1, 9–14. [Google Scholar]
  34. Nadimi, N.; Zamzam, A.; Litman, T. University Bus Services: Responding to Students’ Travel Demands? Sustainability 2023, 15, 8921. [Google Scholar] [CrossRef]
  35. Henke, I.; Carteni, A.; Errico, A.; Cecere, M.; Di Francesco, L. Mobility Habits Surveys: A Real Case Application For University Students In Italy. Int. J. Adv. Res. Eng. Technol. 2020, 11, 321–332. [Google Scholar]
  36. Ismael, K.; Duleba, S. An Integrated Ordered Probit Model for Evaluating University Commuters’ Satisfaction with Public Transport. Urban Sci. 2023, 7, 83. [Google Scholar] [CrossRef]
  37. Taran, A.M. Evaluating the level of the shuttle service quality at Al al-Bayt university campus using the SERVQUAL model. Int. J. Sustain. Dev. Plan. 2022, 17, 1905–1915. [Google Scholar] [CrossRef]
  38. Peker, R.; Yardim, M.S.; Akalin, K.B. Factors Influencing Transportation Mode Preferences for Educational Trips Among Dormitory Resident University Students in Kütahya, Türkiye. Sustainability 2024, 16, 9660. [Google Scholar] [CrossRef]
  39. Matas-Monroy, J.M.; Martin, J.C.; Roman, C. An importance-performance analysis of public transport to the university campus based on best-worst scaling. Res. Transp. Econ. 2025, 109, 101519. [Google Scholar] [CrossRef]
Figure 1. Thessaloniki Metropolitan Area map [30].
Urbansci 09 00044 g001
Figure 2. Satisfaction indicators for (a) private car (as a driver); (b) private car (as a passenger); and (c) public transport (axis x-number of replies; different colored bars reflect the replies described on the abovementioned Likert scale).
Urbansci 09 00044 g002
Table 1. Frequency of using transport modes for the year 2022.
FrequencyPrivate Car
(As a Driver)
Private Car
(As a Passenger)
Public TransportBicycleWalking
>1 day11.2%3.2%22.0%1.1%31.1%
1/day9.2%3.0%5.5%0.5%14.0%
2–3/week5.9%12.4%12.4%3.0%18.3%
1/week3.4%10.3%4.3%1.1%2.7%
Rarely6.9%27.6%13.5%10.5%5.1%
Never/not answered63.4%43.5%42.3%83.8%28.8%
Table 2. Satisfaction level for public transport users calculated for the year 2022.
IndicatorAspectSurveyed
Persons (j)
DK/NAStrongly
Agree (h)
Strongly Agree (h)Somewhat
Disagree (h)
Strongly
Disagree (h)
Satisfaction with public transportAffordable3169495614755
Safe81925159105
Access81828154108
Frequent82126125136
Reliable82323120142
Indicator value 2.5
Table 3. Satisfaction level for private car drivers calculated for the year 2022.
IndicatorAspectSurveyed
Persons (j)
DK/NAStrongly
Agree (h)
Strongly Agree (h)Somewhat
Disagree (h)
Strongly
Disagree (h)
Satisfaction with private car driversAffordable3160115659541
Safe1708412536
Access4145596839
Frequent6367415347
Reliable62928132121
Indicator value 4.2
Table 4. Calculated level of satisfaction for private car passengers for the year 2022.
IndicatorAspectSurveyed
Persons (j)
DK/NAStrongly
Agree (h)
Strongly Agree (h)Somewhat
Disagree (h)
Strongly
Disagree (h)
Satisfaction with private car passengersAffordable3168137696834
Safe7838911126
Access7695914635
Frequent8757313127
Reliable7736412943
Indicator value 4.7
Table 5. Comparative analysis of the calculated level of satisfaction for private car passengers.
Survey 2021Survey 2022
Satisfaction with public transport2.92.5
Satisfaction with private car drivers3.94.2
Satisfaction with private car passengers4.24.7
Disclaimer/Publisher’s Note: The statements, opinions and data contained in all publications are solely those of the individual author(s) and contributor(s) and not of MDPI and/or the editor(s). MDPI and/or the editor(s) disclaim responsibility for any injury to people or property resulting from any ideas, methods, instructions or products referred to in the content.

