Article

Green Corridor Along the Chili River as an Ecosystem-Based Strategy for Social Connectivity and Ecological Resilience in Arequipa, Arequipa, Peru, 2025

by
Doris Esenarro
1,2,
Luz Karelly Montenegro
1,
Christian Medina
1,
Jesica Vilchez Cairo
1,2,*,
Alberto Israel Legua Terry
3,
Maria Veliz Garagatti
3,
Geoffrey Wigberto Salas Delgado
4 and
Mónica María Escate Lira
5
1
Faculty of Architecture and Urbanism, Ricardo Palma University (URP), Santiago de Surco, Lima 15039, Peru
2
Research Laboratory for Formative Investigation and Architectural Innovation (LABIFIARQ), Ricardo Palma University (URP), Santiago de Surco, Lima 15039, Peru
3
Faculty of Geographical, Environmental and Ecotourism Engineering (FIGAE), Federico Villareal National University (UNFV), Cercado de Lima, Lima 15082, Peru
4
Postgraduate University School (EUPG), Federico Villarreal National University (UNFV), Cercado de Lima, Lima 15001, Peru
5
School of Civil Engineering, Ricardo Palma University (URP), Santiago de Surco, Lima 15039, Peru
*
Author to whom correspondence should be addressed.
Urban Sci. 2025, 9(11), 488; https://doi.org/10.3390/urbansci9110488
Submission received: 6 October 2025 / Revised: 10 November 2025 / Accepted: 12 November 2025 / Published: 18 November 2025

Abstract

In recent decades, accelerated urban growth in Arequipa has led to the loss of more than 40% of riparian vegetation and increased ecological fragmentation in the Chili River valley. This transformation has degraded water quality and limited equitable access to green and public spaces. Therefore, this research aims to design a Green Corridor along the Chili River as an ecosystem-based strategy to enhance social connectivity and ecological resilience in Arequipa, Peru. The methodology combined an extensive literature review, a comparative analysis of international case studies, and a territorial diagnosis supported by geospatial and climatic data. The process is supported by digital tools such as Google Earth Pro 2025, AutoCAD 2024, SketchUp Pro 2023, and solar simulations with Ladybug-Grasshopper, complemented by data from SENAMHI, SINIA, and the Solar Atlas of Peru. The results propose a resilient green corridor integrating passive and active sustainability strategies, including 40 photovoltaic panels, 44 solar luminaires, biodigesters producing between 90 and 150 kWh per month, and phytotechnologies capable of absorbing 75,225 kg of CO2 annually, based on WHO conversion factors adapted to high-altitude conditions. The proposal employs eco-efficient materials such as reforested eucalyptus wood and volcanic sillar, creating recreational and productive spaces that promote social cohesion and circular economy. In conclusion, this study demonstrates the potential of ecosystem-based design to regenerate arid urban riverbanks, harmonizing environmental sustainability, social inclusion, and cultural identity. Thus, the Chili River corridor is consolidated as a replicable model of green-blue infrastructure for Andean cities, aligned with Sustainable Development Goals 6, 7, 11, 12, 13, and 15.

1. Introduction

According to the Global Human Settlement Layer (GHSL) and UN-Habitat, global urban expansion has followed a consistent growth trend, with an average annual increase of 2 to 3 percent in urbanized land since the beginning of the twenty-first century. Each year, approximately 35,000 to 50,000 square kilometers of new urban areas are added. Between 2000 and 2020, the global urban footprint expanded by nearly 50 percent, driven by population growth and the rising demand for housing, infrastructure, and services. If this trend continues, cities are projected to double their current urbanized area of around 2 million square kilometers by 2050, further intensifying their environmental footprint. This scenario highlights the urgent need for sustainable urban planning to mitigate ecological and social impacts [1].
At the same time, climate change has increased pressure on urban systems, leading to a sustained rise in global temperatures and greater variability in precipitation patterns. In Peru, for instance, average temperatures have increased by 0.2 °C per decade between 1965 and 2021, with differentiated effects depending on altitude and climatic zone, illustrating the vulnerability of coastal and semi-arid regions to extreme events [2]. Globally, these transformations manifest differently across regions: cities in temperate climates face prolonged heat waves and reduced thermal comfort, while tropical and semi-arid cities must cope with water scarcity, intense solar radiation, and marked daily temperature variations. This climatic diversity calls for adaptive planning approaches and green infrastructure solutions tailored to specific environmental contexts [3,4,5].
Urban green infrastructure has emerged as an integrated strategy to enhance environmental resilience and sustainability. It is defined as an interconnected network of natural and semi-natural spaces that includes parks, corridors, green roofs and walls, urban trees, rain gardens, and constructed wetlands, which provide essential ecosystem services such as thermal regulation, air purification, carbon sequestration, and stormwater management [3,4,6]. Beyond ecological benefits, these spaces contribute to social cohesion, psychological well-being, and urban equity by offering opportunities for recreation, interaction, and inclusion [7,8,9,10]. A review of 195 scientific studies demonstrates that well-planned green infrastructure enhances ecological connectivity, resilience to extreme weather events, and equity in access to nature, generating environmental, social, and economic benefits that support the transition toward sustainable cities [6].
Within urban green infrastructure, green corridors play a key role in reconnecting fragmented green spaces by facilitating species movement, ecosystem service exchange, and sustainable human mobility [3]. When integrated into the broader network of green infrastructure, green corridors act as structural links that connect parks, gardens, wetlands, and urban nature reserves, promoting landscape continuity and reducing ecological fragmentation caused by rapid urbanization. They also serve important social and cultural roles by providing safe routes for pedestrians and cyclists, improving air quality, and creating accessible public spaces that strengthen community well-being [4]. The planned inclusion of green corridors in sustainable urban development policies has been widely supported by research demonstrating their effectiveness in preserving biodiversity and improving climate adaptation [11].
Green corridors not only perform a vital ecological function by connecting fragmented urban habitats, but also serve as multifunctional public spaces that foster social connectivity, quality of life, and emotional well-being. As noted by Frances Kuo, accessible natural environments encourage walking, exercise, relaxation, and social interaction. Psychological evidence associates exposure to such environments with stress reduction and improved cognitive restoration [7]. Moreover, the visual perception of well-designed green corridors has been linked to feelings of safety, belonging, and urban satisfaction [8]. Recent studies confirm that both accessibility and perceived quality of these spaces positively influence frequency of use and subjective well-being, underscoring the importance of integrating green corridors into urban planning to promote healthier and more livable cities. These findings support the theoretical framework of environmental restoration, confirming that exposure to urban green environments such as green corridors provides measurable mental health and well-being benefits [9].
Informal social encounters in public spaces help urban residents disconnect from daily routines, reduce stress, and strengthen personal resilience. Green spaces have been shown to contribute to social cohesion, as illustrated in Figure 1A, by encouraging outdoor activity and providing opportunities for interaction and community engagement. Numerous studies have analyzed how the physical characteristics of green spaces influence social cohesion. For instance, the presence of trees has a greater potential to promote the use of shared spaces and facilitate positive informal social interactions among visitors compared to areas without vegetation or those affected by urban disorder, as shown in Figure 1B [10,11].
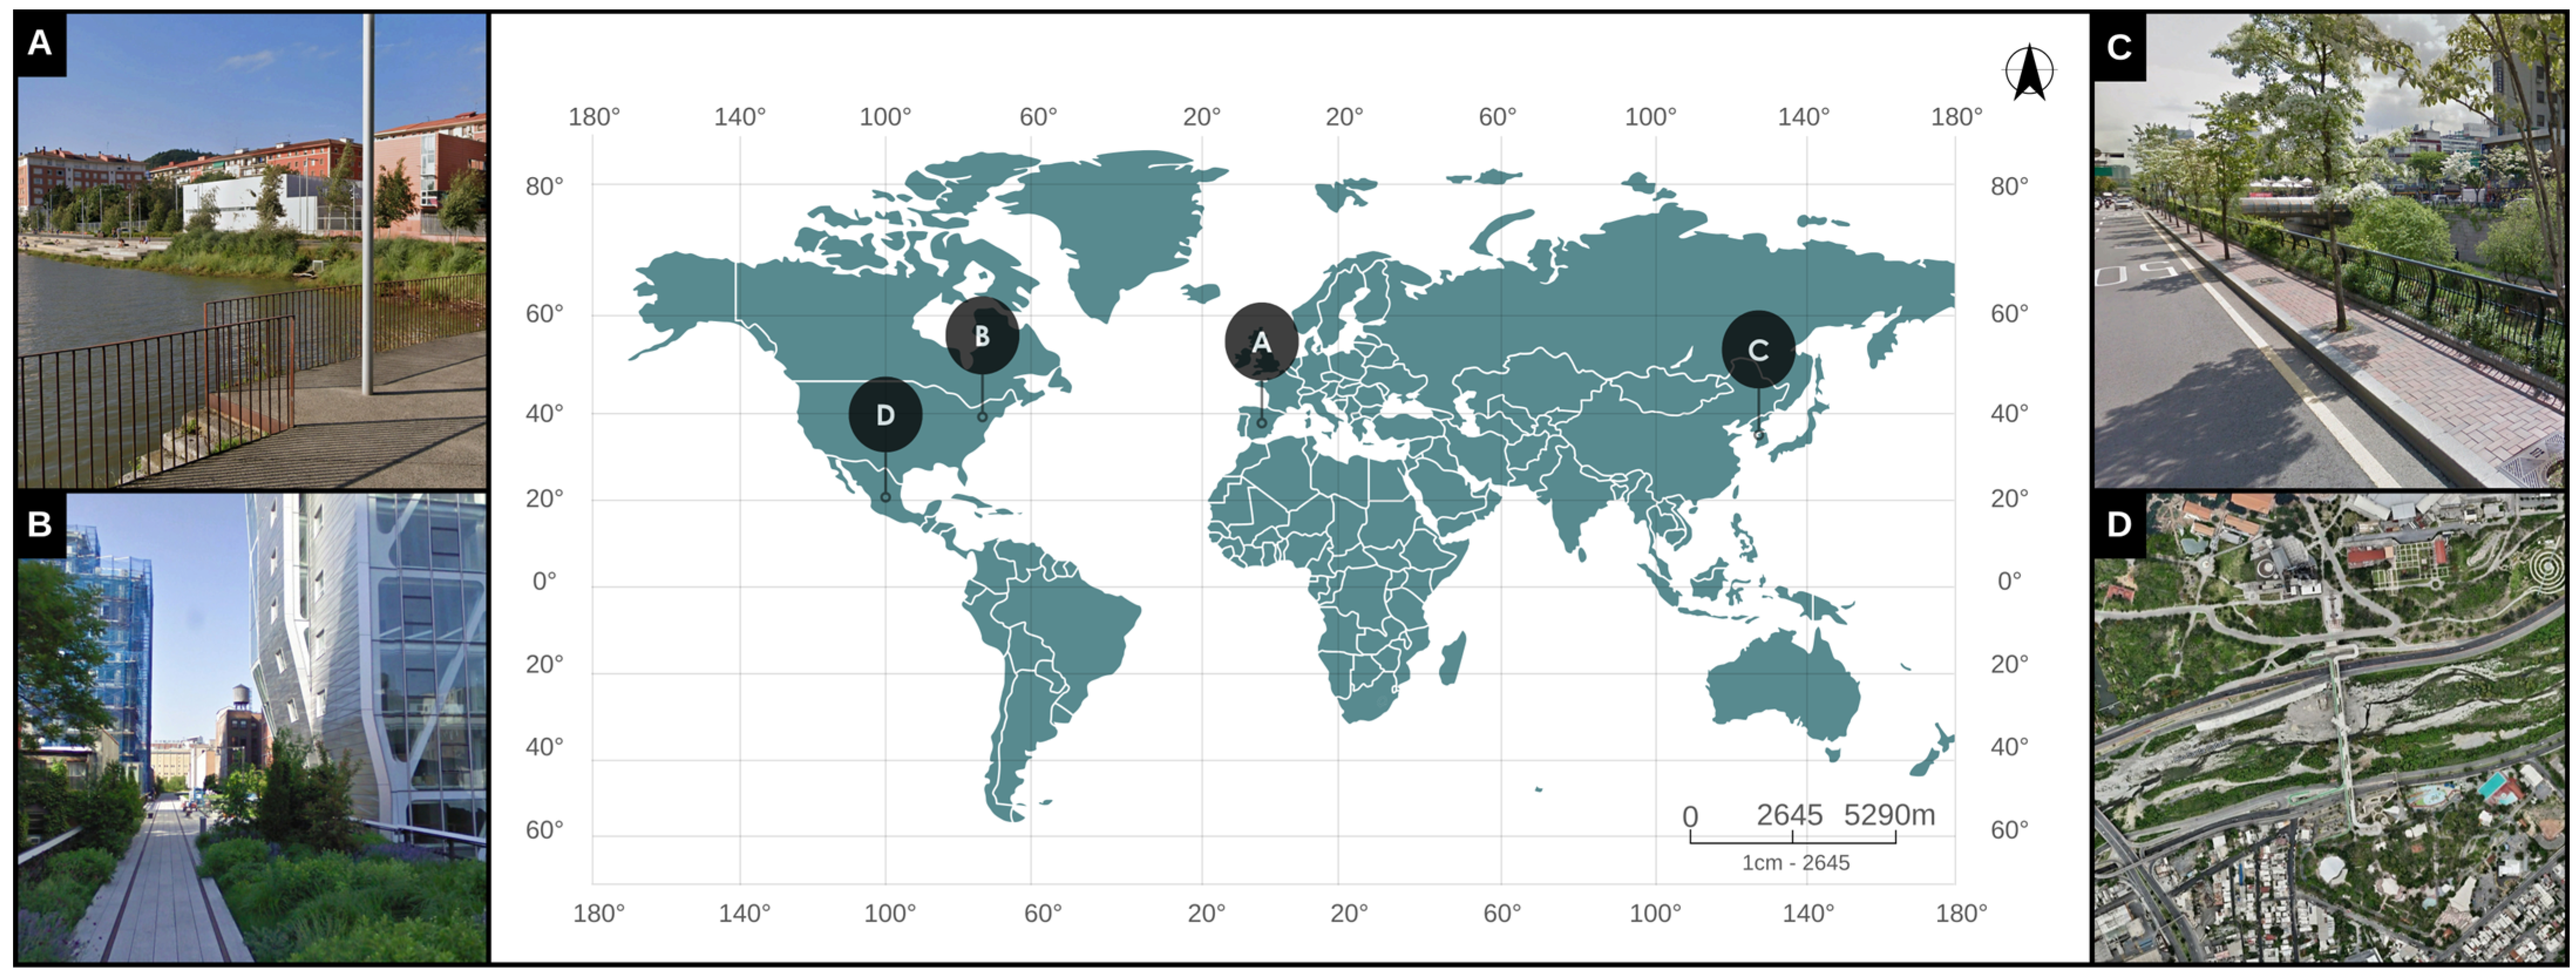
The comparative analysis of international green corridor projects reveals diverse strategies for integrating ecological performance, public space quality, and socioeconomic regeneration. In Bilbao, Spain, the Fluvial Park of the Ribera de Deusto, shown in Figure 2A, reconnected 3.5 km of riverbank along the Nervión Estuary and integrated 2700 m2 of photovoltaic paving for self-sufficient lighting [14]. During the 2016 heat wave, thermal simulations in the nearby Zorrotzaurre peninsula showed that vegetated areas remained up to 5 °C cooler than compact urban sectors [15], demonstrating how continuous vegetation and reflective materials mitigate heat and improve outdoor comfort.
In New York City, the High Line, shown in Figure 2B, transformed a 2.33 km elevated railway into 2.3 ha of green public space hosting more than 500 plant species. Between 2011 and 2016, property values within a 0.5 km radius increased by 50.6%, and employment in creative industries rose by 38% [16]. This case highlights how the adaptive reuse of obsolete infrastructure can generate economic, cultural, and environmental value through inclusive design.
In Seoul, the restoration of Cheonggyecheon, shown in Figure 2C, replaced a 5.84 km elevated highway with an open urban stream between 40 and 60 m wide. Monitoring data recorded a 35% reduction in fine particulate matter, temperature drops of 3–6 °C, and noise reductions of 3–7 decibels, significantly improving comfort and air quality. Annual visitation exceeds 60 million people [17], confirming how urban river restoration can enhance health, biodiversity, and social interaction.
In the semi-arid cities of Hermosillo and Mexicali in northern Mexico, hybrid green corridors combining stormwater channels with native mesquite and parkinsonia trees increased public space use by 37%, reduced surface temperatures by 1.8 °C, and improved neighborhood safety perception by 22% [18]. These results demonstrate the adaptability of drought-tolerant vegetation and shading strategies under arid conditions. Complementary studies across Latin American cities have shown that riverfront restoration through green infrastructure can generate average surface temperature reductions between 2 °C and 4 °C, while significantly increasing vegetation cover and ecological connectivity [19]. In semi-arid Andean contexts, similar interventions have reduced air and water pollution levels by 20–30% by integrating riparian vegetation and natural urban drainage systems [20]. Overall, these references demonstrate quantifiable benefits, including temperature reductions of 3–6 °C, air pollution decreases of approximately 35%, increases in public use between 30% and 40%, and property value gains exceeding 40%. These measurable parameters establish a performance-based framework for the design of green corridors in arid, high-radiation, or topographically complex urban environments.
Figure 2. International green corridors: (A) Fluvial Park of the Ribera de Deusto, image source: Google Maps © Google, 2025 [21]; (B) High Line, image source: Google Maps © Google, 2025 [22]; (C) Cheonggyecheon, Seoul, image source: Google Maps © Google, 2025 [23]; and (D) Puente Verde, Hermosillo Mexico, image source: Google Maps © Google, 2025 [24]. Figure created by the authors using Adobe Photoshop 2024.
Urbansci 09 00488 g002
Today, more than half of the world’s population currently resides in urban areas, and this proportion is projected to reach nearly 70% by 2050. This sustained growth is particularly evident in rapidly developing regions such as Latin America, Africa, and Asia, where urban expansion often outpaces planning capacity and the provision of essential services. This scenario underscores the urgent need to invest in the efficient management of natural resources, green infrastructure, and systems for waste treatment and recovery [25,26]. The Sustainable Development Goal 11 seeks to make cities and communities inclusive, safe, resilient, and sustainable by ensuring universal access to adequate housing, basic services, and affordable and secure transportation, with particular attention to vulnerable populations. It also promotes the reduction in urban environmental impacts, the creation of green areas and inclusive public spaces, the implementation of sustainable urban planning, and the improvement of living conditions in informal settlements [27].
The Sustainable Development Goal 7 focuses on ensuring access to affordable, reliable, sustainable, and modern energy for all, improving quality of life while promoting policies for electrification, energy efficiency, renewable investment, innovation, and regulatory frameworks that foster a low-emission economy [28]. Similarly, the Sustainable Development Goal 6 aims to achieve universal access to safe drinking water and sanitation through the sustainable management of water resources, wastewater treatment, and ecosystem protection, emphasizing the need for institutional capacity and coordinated governance to guarantee its fulfillment [29].
At the global level, the urban population has grown rapidly, and more than half of humanity now resides in cities. However, the pace of urbanization varies significantly among countries and continents, as illustrated in Figure 3. Latin America, which includes South America, Mexico, Central America, and the Caribbean Islands, has experienced substantial urban growth over the past six decades, reaching more than 651 million inhabitants in 2020 [30,31,32].
One of the most concerning issues associated with rapid and informal urbanization is the increase in air pollution. Highly urbanized cities such as São Paulo, Santiago, Buenos Aires, and Bogotá have recorded elevated levels of CO2 emissions [33]. In 2018, Brazil and Mexico together accounted for 2.7 percent of global CO2 emissions, equivalent to approximately 905 million tons. Although Colombia and Peru generate lower emissions than these two regional powers, both countries have doubled their CO2 output over the past decade, as shown in Figure 4 [32].
Urban green areas have traditionally been conceived primarily for esthetic and recreational purposes and are often designed to host a limited set of plant species. In parallel, fluvial ecosystems have experienced historical degradation caused by urban expansion, industrial development, and deforestation. Pollutants accumulate in water bodies due to industrial discharges, agricultural pesticide use, wastewater inflows, and eutrophication processes, leading to a severe decline in ecological quality [34].
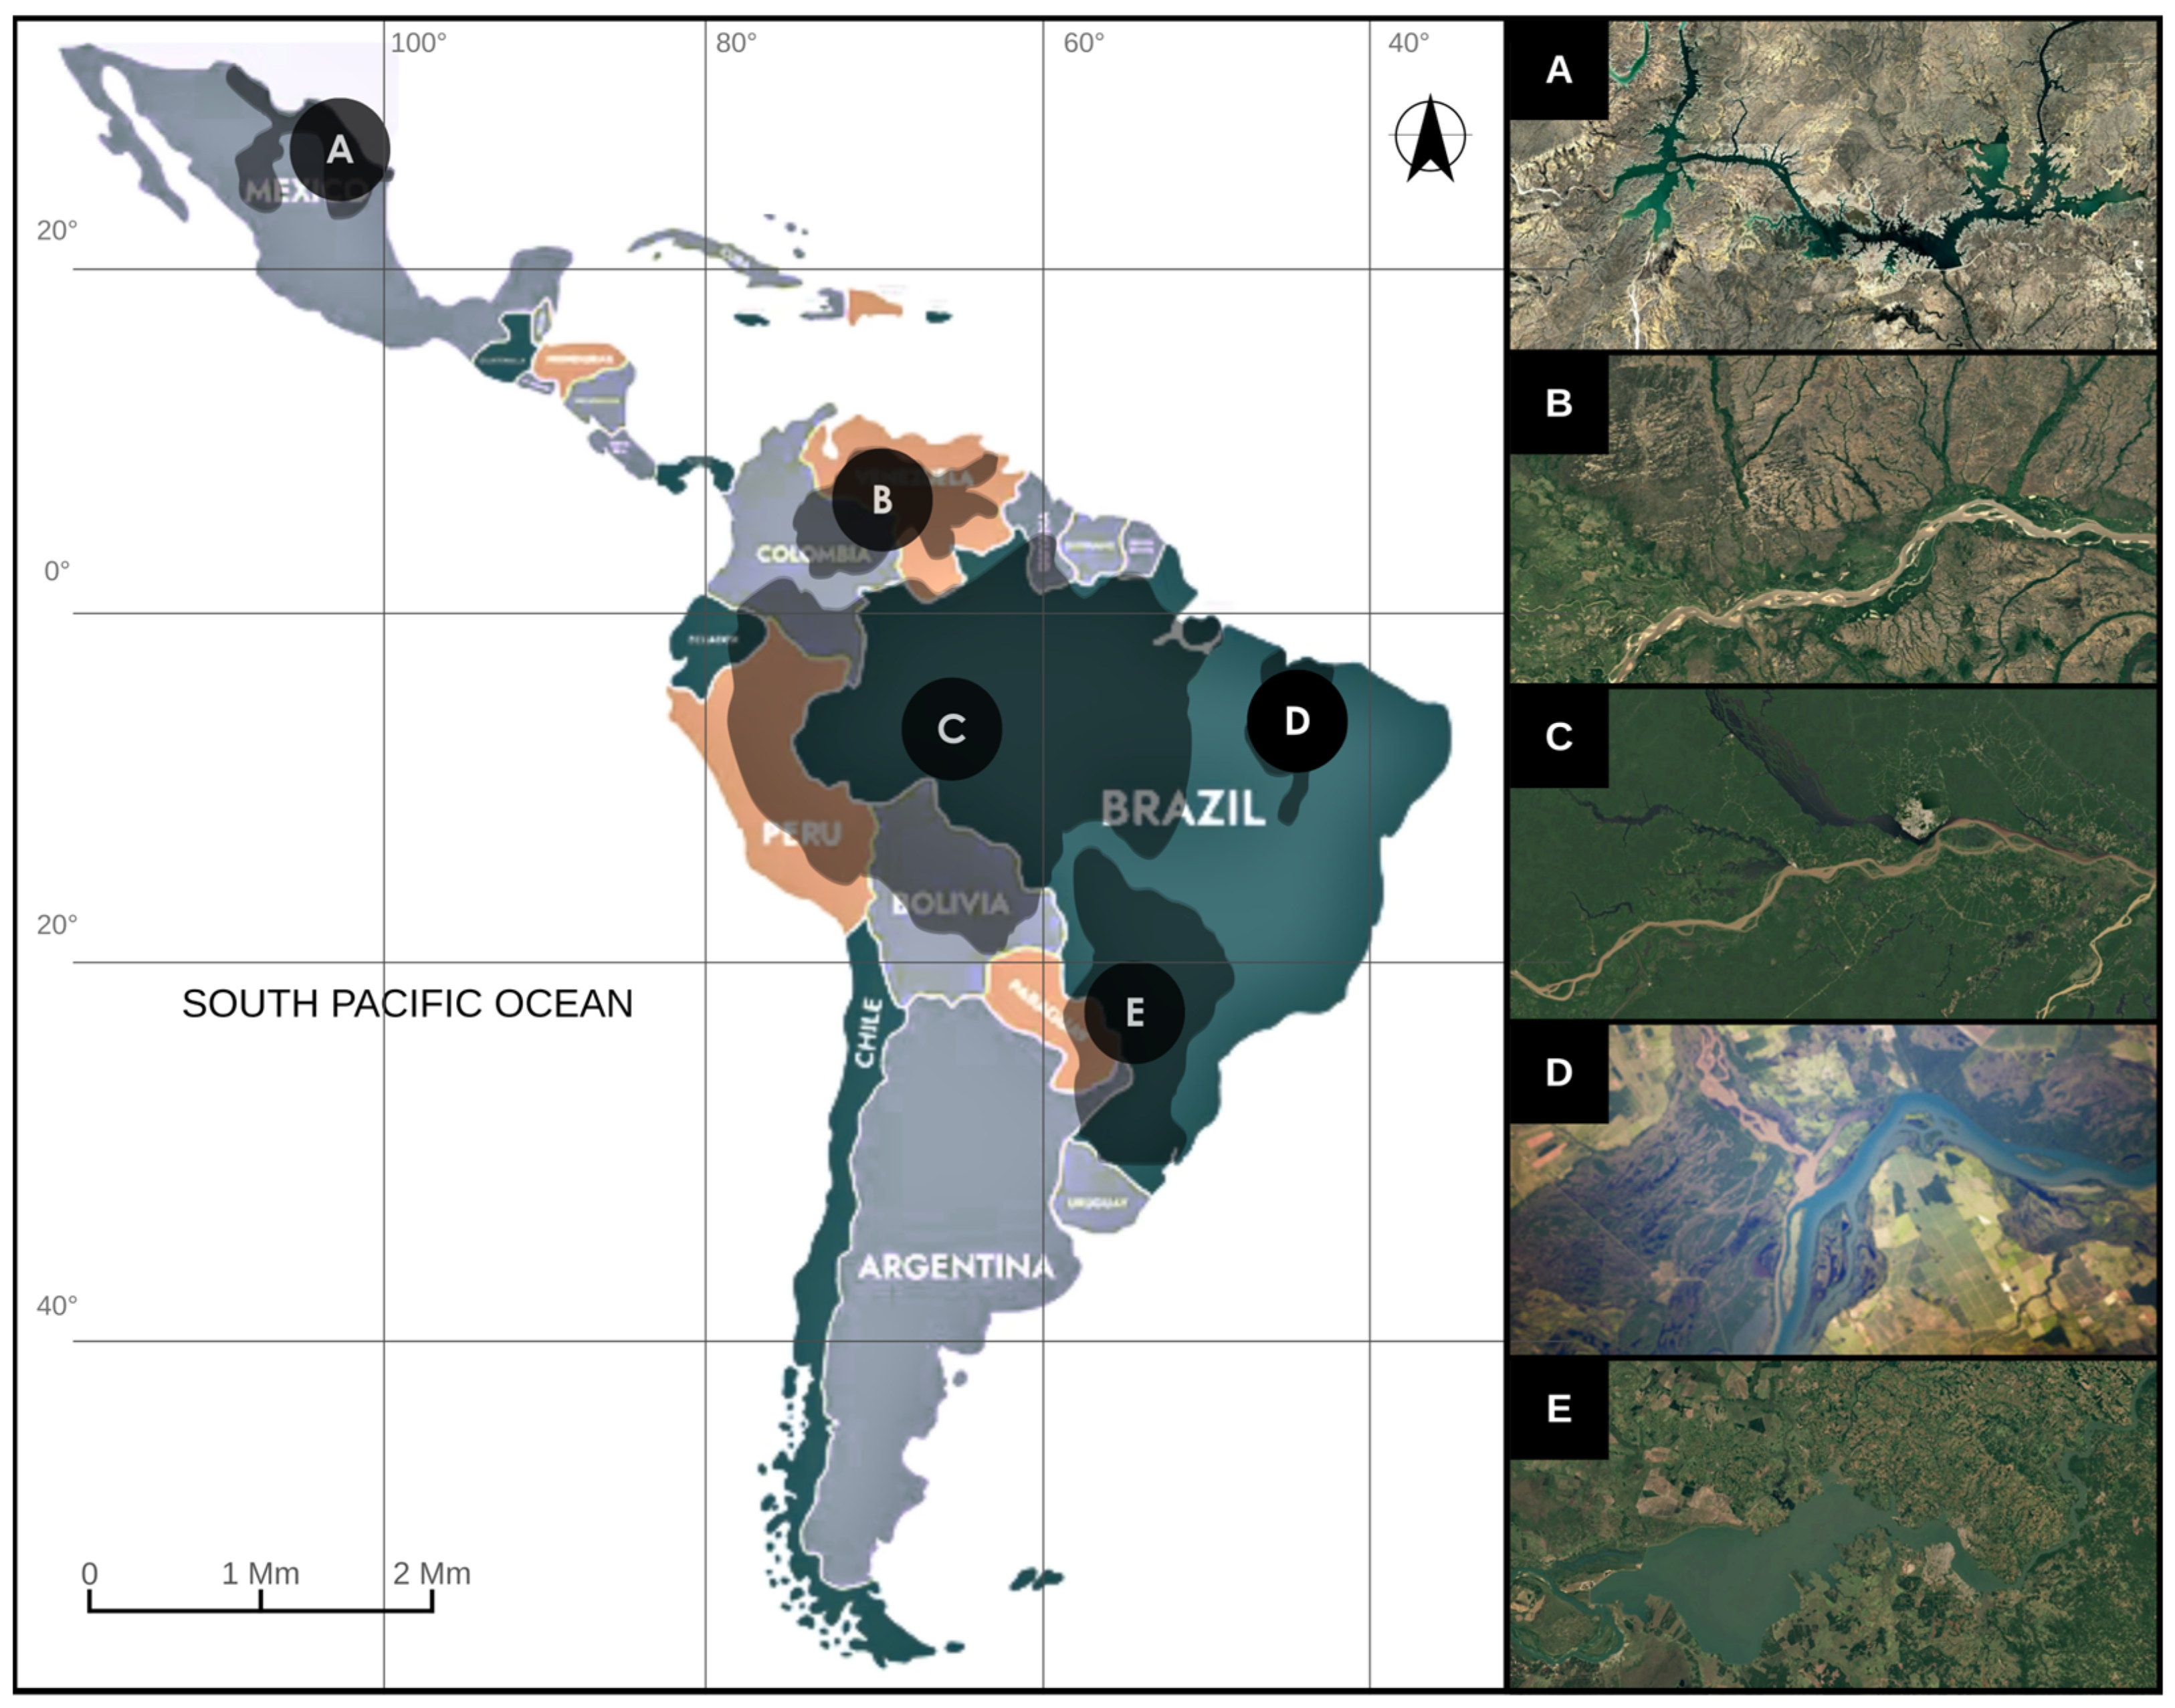
In Latin America, the condition of urban rivers is particularly critical due to rapid urbanization and inadequate water resource management planning. In rural areas, approximately 25 million people are exposed to contaminated waters originating from urban environments. The region’s largest deltas receive inflows from heavily polluted rivers: the Bravo River shown in Figure 5A, the Orinoco River in Figure 5B, the Amazon River in Figure 5C, the Paranaíba River in Figure 5D, and the Paraná River in Figure 5E. Similarly, the Mapocho River in Santiago de Chile and the Rímac River in Peru face severe contamination and ecological degradation, which affect both ecosystems and public health [35].
The growing urbanization in Peru has led to the implementation of urban green corridors as a strategy to improve quality of life in cities. These spaces not only enhance the visual and spatial character of urban areas but also provide significant environmental and social benefits. According to the National Institute of Statistics and Informatics (INEI), in 2023 the Peruvian population reached 33.7 million inhabitants, and projections estimate that by 2050 it will increase to 39.3 million. In particular, Arequipa is home to 1.3 million residents, with 75.3 percent concentrated in the province of Arequipa. This demographic growth intensifies the need for green spaces capable of mitigating the effects of climate change, improving air quality, and providing recreational and social areas for the population [41,42].
The implementation of green corridors in Peru has become an urgent need in response to the accelerated process of urbanization and its associated environmental, social, and health impacts. In cities such as Lima, Arequipa, and Trujillo, the concentration of population, air pollution, scarcity of high-quality public spaces, and loss of urban biodiversity reveal the absence of an integrated ecological infrastructure [43]. Recent evidence from Peruvian cities reinforces this argument. In Lima, the Metropolitan Development Plan (PLANMET 2040) identifies measurable benefits of urban green infrastructure, including localized temperature reductions of 2 to 3 °C, improved stormwater control, and greater microclimatic comfort within pilot corridors and riverbank restoration zones [44]. In Cusco, field research conducted in urban parks across the Huatanay valley reported average microclimatic cooling effects of approximately 2.5 °C and higher thermal comfort indices during the dry season [45].
The implementation of green corridors in Arequipa directly responds to the city’s urban and ecological challenges. As the second-largest metropolis in Peru, with more than one million inhabitants and contributing 5.5 percent of the national GDP, Arequipa has experienced disorganized urban expansion and a fragmented growth pattern driven by land speculation and informal settlements. This process has disrupted the ecological and urban continuity of its natural systems, particularly the Chili River, which constitutes the city’s main hydrological and landscape axis. In this context, green corridors emerge as key infrastructure to reconnect the city with nature, reduce landscape fragmentation, promote non-motorized mobility, and mitigate pollution [5,46].
According to the Regional Plan for Urban Reforestation and Afforestation of Arequipa, the city provides only 5.2 m2 of green space per inhabitant, considerably below the World Health Organization (WHO) recommendation of 9–10 m2 and the 15 m2 threshold advised for arid cities to ensure adequate thermal comfort [47]. The Chili River, which extends approximately 17 km through the metropolitan area, currently receives untreated domestic and industrial effluents. Recent monitoring and academic studies have reported chromium (Cr) concentrations of up to 0.34 mg/L and lead (Pb) levels near 0.12 mg/L, exceeding Peru’s Environmental Quality Standards (ECA) for Category 3 waters, which establish limits of 0.1 mg/L and 0.05 mg/L, respectively. Biochemical oxygen demand (BOD5) values range between 35 and 40 mg/L, confirming a high organic load and chronic contamination of the fluvial ecosystem [48]. These quantitative indicators highlight the urgent need to restore the Chili River through green infrastructure that integrates natural treatment systems, enhances environmental quality, and strengthens ecological connectivity across the valley.
Recognizing the complex topography of Arequipa and the orthogonal grid interrupted by informal settlements with steep slopes and a lack of spatial continuity, which hinder conventional interventions, the proposal introduces corridors that respect the existing terrain morphology and connect existing green areas through adaptive landscape strategies. The approach prioritizes avoiding large-scale expropriations while integrating informal sectors through participatory and sustainable solutions. In this way, ecological infrastructure operates as an urban–environmental connector that improves quality of life and restores the relationship between the city and its natural surroundings.
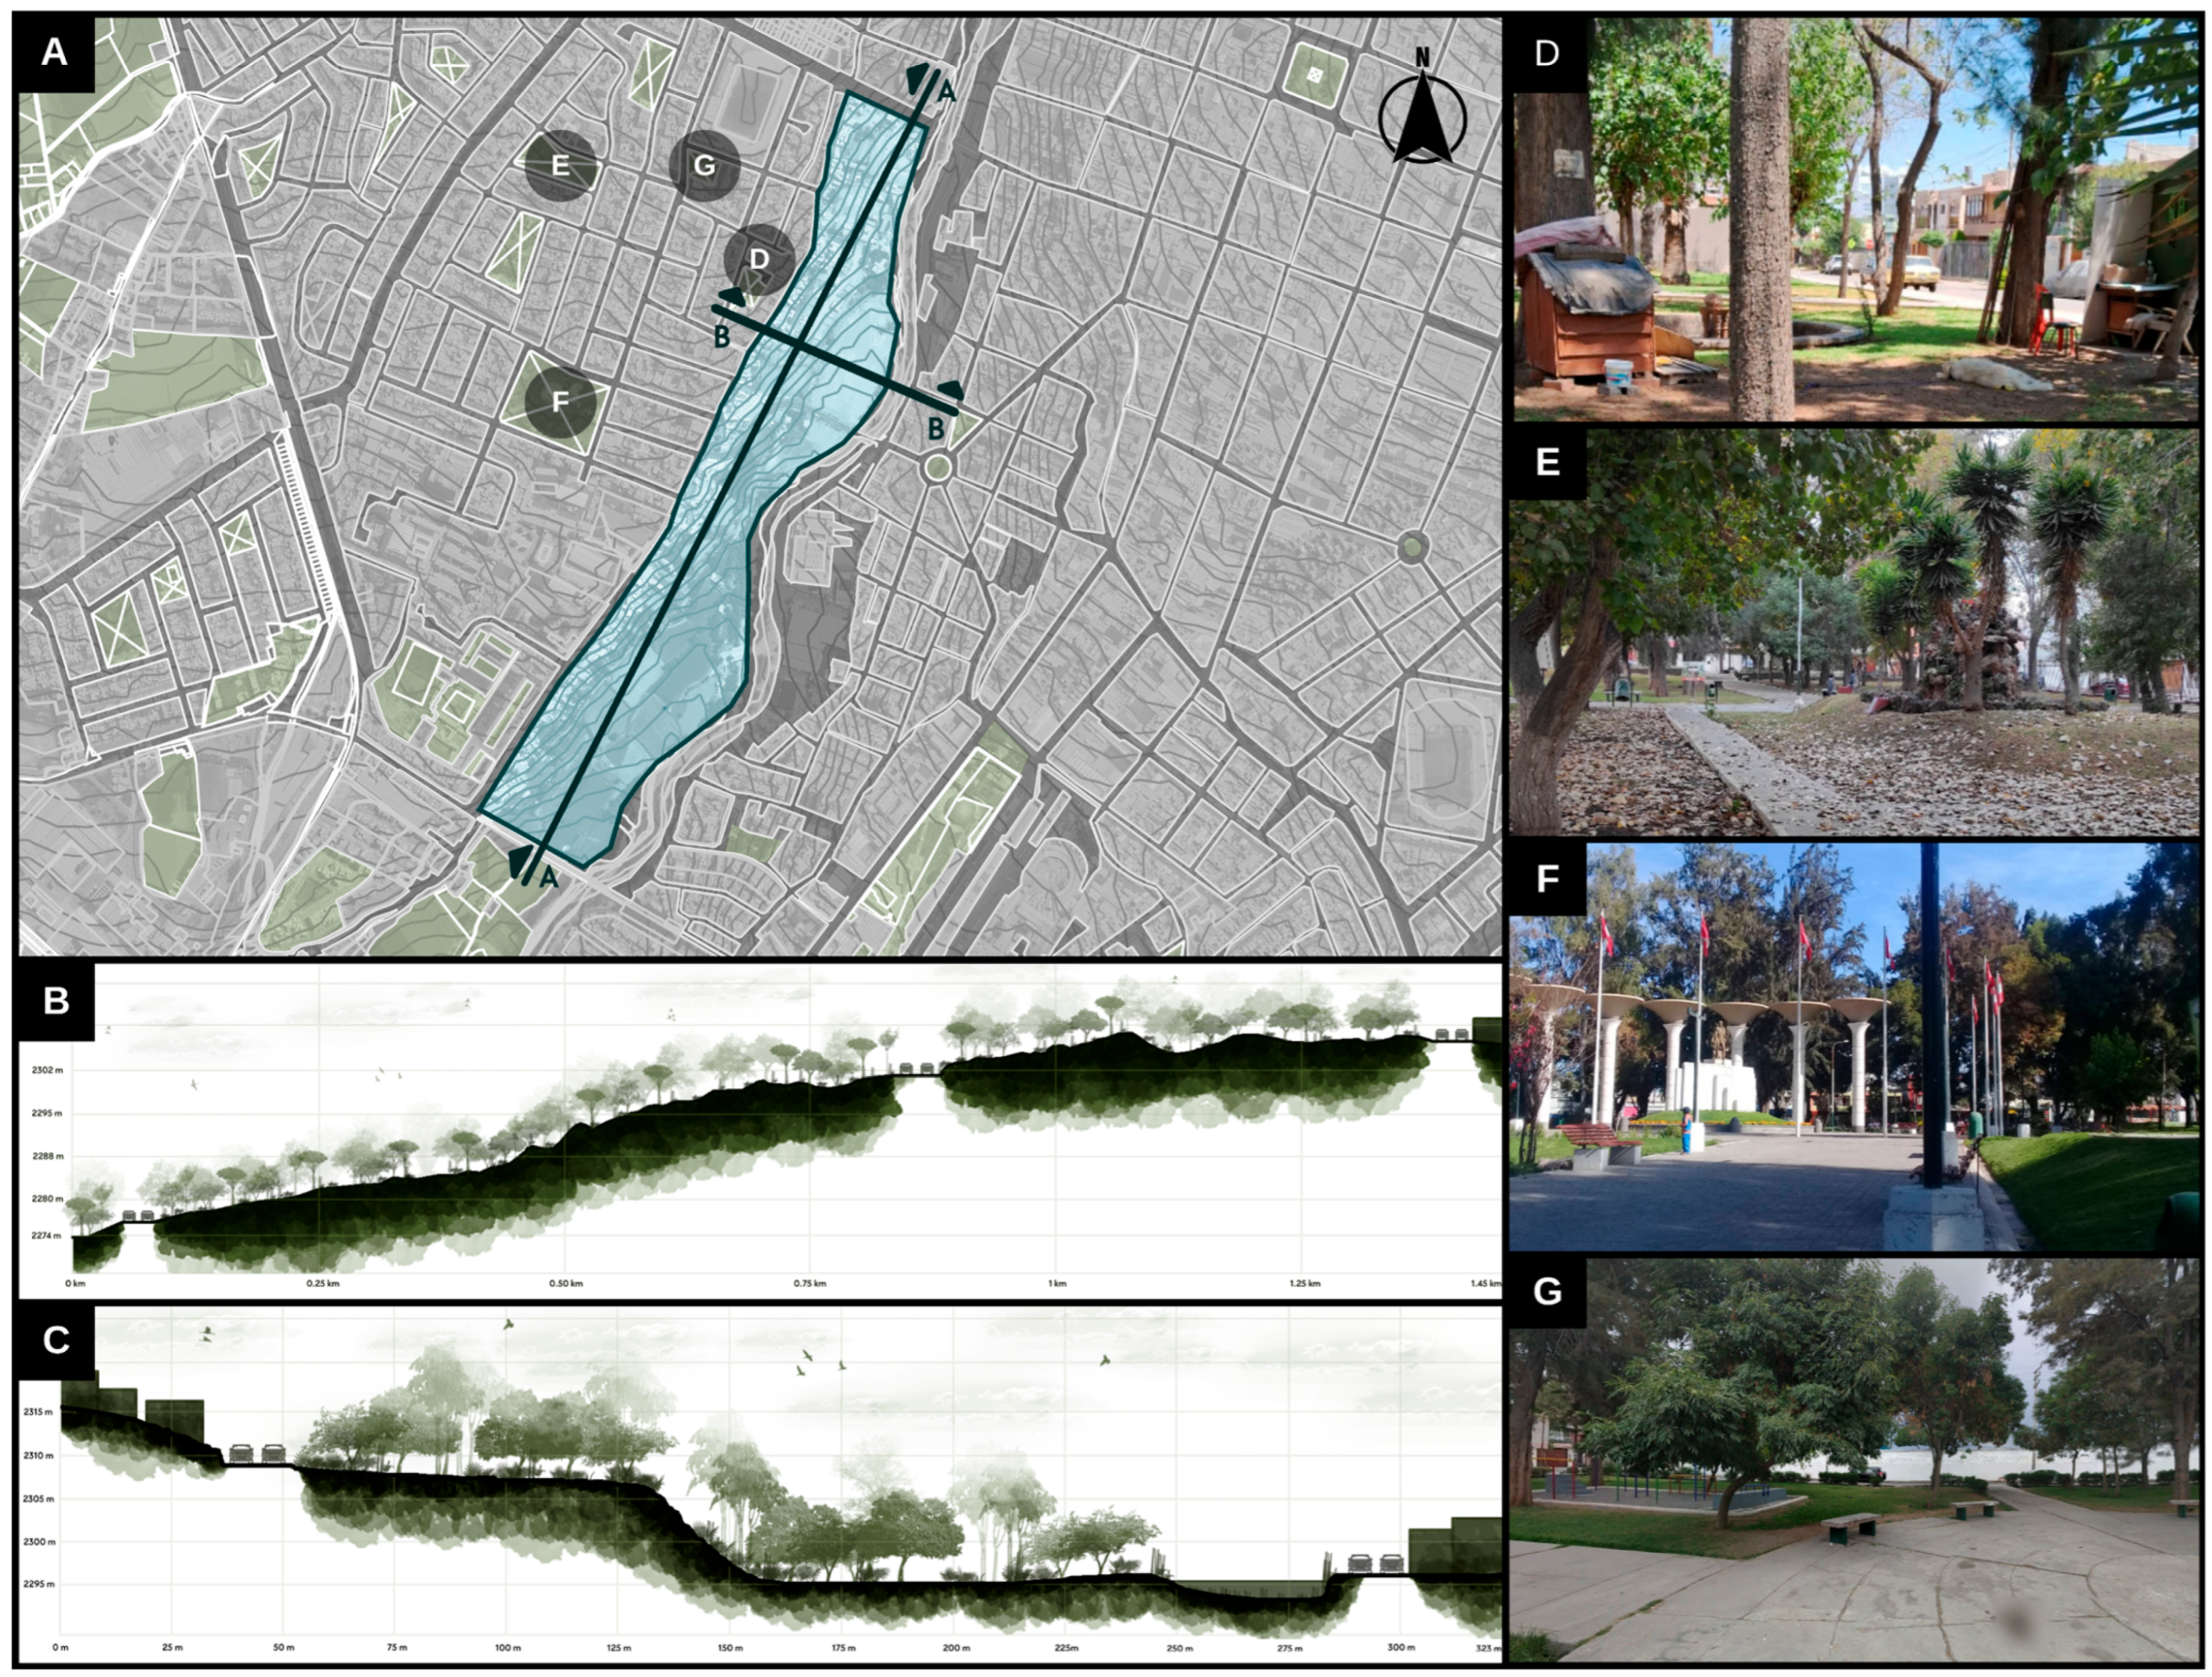
Two main soil types are identified in the study area. Type S1 soils are characterized by low seismic amplification and are classified as Zone I under the Peruvian Standard E.030. Type S2 soils present higher seismic amplification and correspond to Zone II, as shown in Figure 6A. In the district of Arequipa, where the architectural proposal is located, a level variation of 28 m is recorded along the main axis, as illustrated in Figure 6B, and approximately 20 m along the transverse axis, as shown in Figure 6C. Likewise, there is a limited number of recreational public spaces in the sector, such as Los Angeles Park as shown in Figure 6D, Parque del Maestro as shown in Figure 6E, Parque Libertad de Expresión as shown in Figure 6F, and Simón Rodríguez Park as shown in Figure 6G.
The contamination of the Chili River in Arequipa originates mainly from the direct discharge of untreated domestic and industrial wastewater. This situation is exacerbated by the accumulation of solid waste along the river channel and its banks, as well as by agricultural runoff carrying agrochemicals from the valley, all of which deteriorate water quality and damage the ecosystem. An additional risk arises from the discharge of heavy metals by industries located in the Río Seco Industrial Park, including chromium from the Añashuayco ravine, a tributary of the Chili River, which poses a significant threat to public health [53,54].
This leads to the following research question: to what extent can the design of a green corridor along the Chili River be consolidated as an ecosystem-based strategy to strengthen social connectivity and ecological resilience in the city of Arequipa? Therefore, this research aims to analyze and propose a green corridor along the Chili River in Arequipa as an integrated strategy that combines renewable energy generation, water phytoremediation, and multifunctional public space in order to promote urban sustainability and the restoration of the fluvial landscape.

State of the Art

  • Ecosystem Services
Ecosystem services are the multiple benefits that humans derive from natural systems, including climate regulation, air purification, carbon sequestration, and opportunities for recreation and mental well-being [6]. In urban contexts, these services play a crucial role in maintaining ecological balance and improving quality of life by linking natural processes with urban performance indicators such as resilience, livability, and public health [1].
  • Urban Planning
Urban planning is the discipline responsible for organizing the physical, social, and functional structure of cities by integrating land use, transportation, and public services to achieve efficient and equitable development [4]. Contemporary approaches emphasize sustainability and compactness, promoting nature-based solutions, low-carbon mobility, and inclusive public spaces aligned with Sustainable Development Goal 11: Sustainable Cities and Communities [26].
  • Ecological Resilience
Ecological resilience refers to the ability of ecosystems to absorb disturbances and reorganize while maintaining their essential structure, functions, and feedbacks [3]. In urban contexts, resilience implies the capacity of cities to adapt to climate-related impacts such as flooding or heat waves through the integration of green infrastructure networks and nature-based solutions that foster biodiversity and social stability [42].
  • Social Connectivity
Social connectivity encompasses the relationships and interactions that promote inclusion, cooperation, and a shared sense of identity among citizens [10]. Public green spaces and ecological corridors strengthen this connectivity by providing safe and accessible areas that encourage community participation, social cohesion, and psychological well-being [9].
  • Sustainable Urbanism
Sustainable urbanism integrates ecological, social, and economic perspectives to create compact, resource-efficient, and inclusive cities [1]. It promotes the coexistence of human activity and nature through renewable energy systems, active mobility, and green corridors that support biodiversity, cultural identity, and environmental balance [32].
  • Eco-Friendly Materials
Eco-friendly materials are those whose production and use minimize environmental impact through renewable resources, low embodied energy, and recyclability [55]. In architectural and urban design, their implementation, such as the use of engineered timber systems in sustainable buildings, reduces carbon emissions and promotes climate-responsive construction practices [56].

2. Materials and Methods

2.1. Methodological Framework

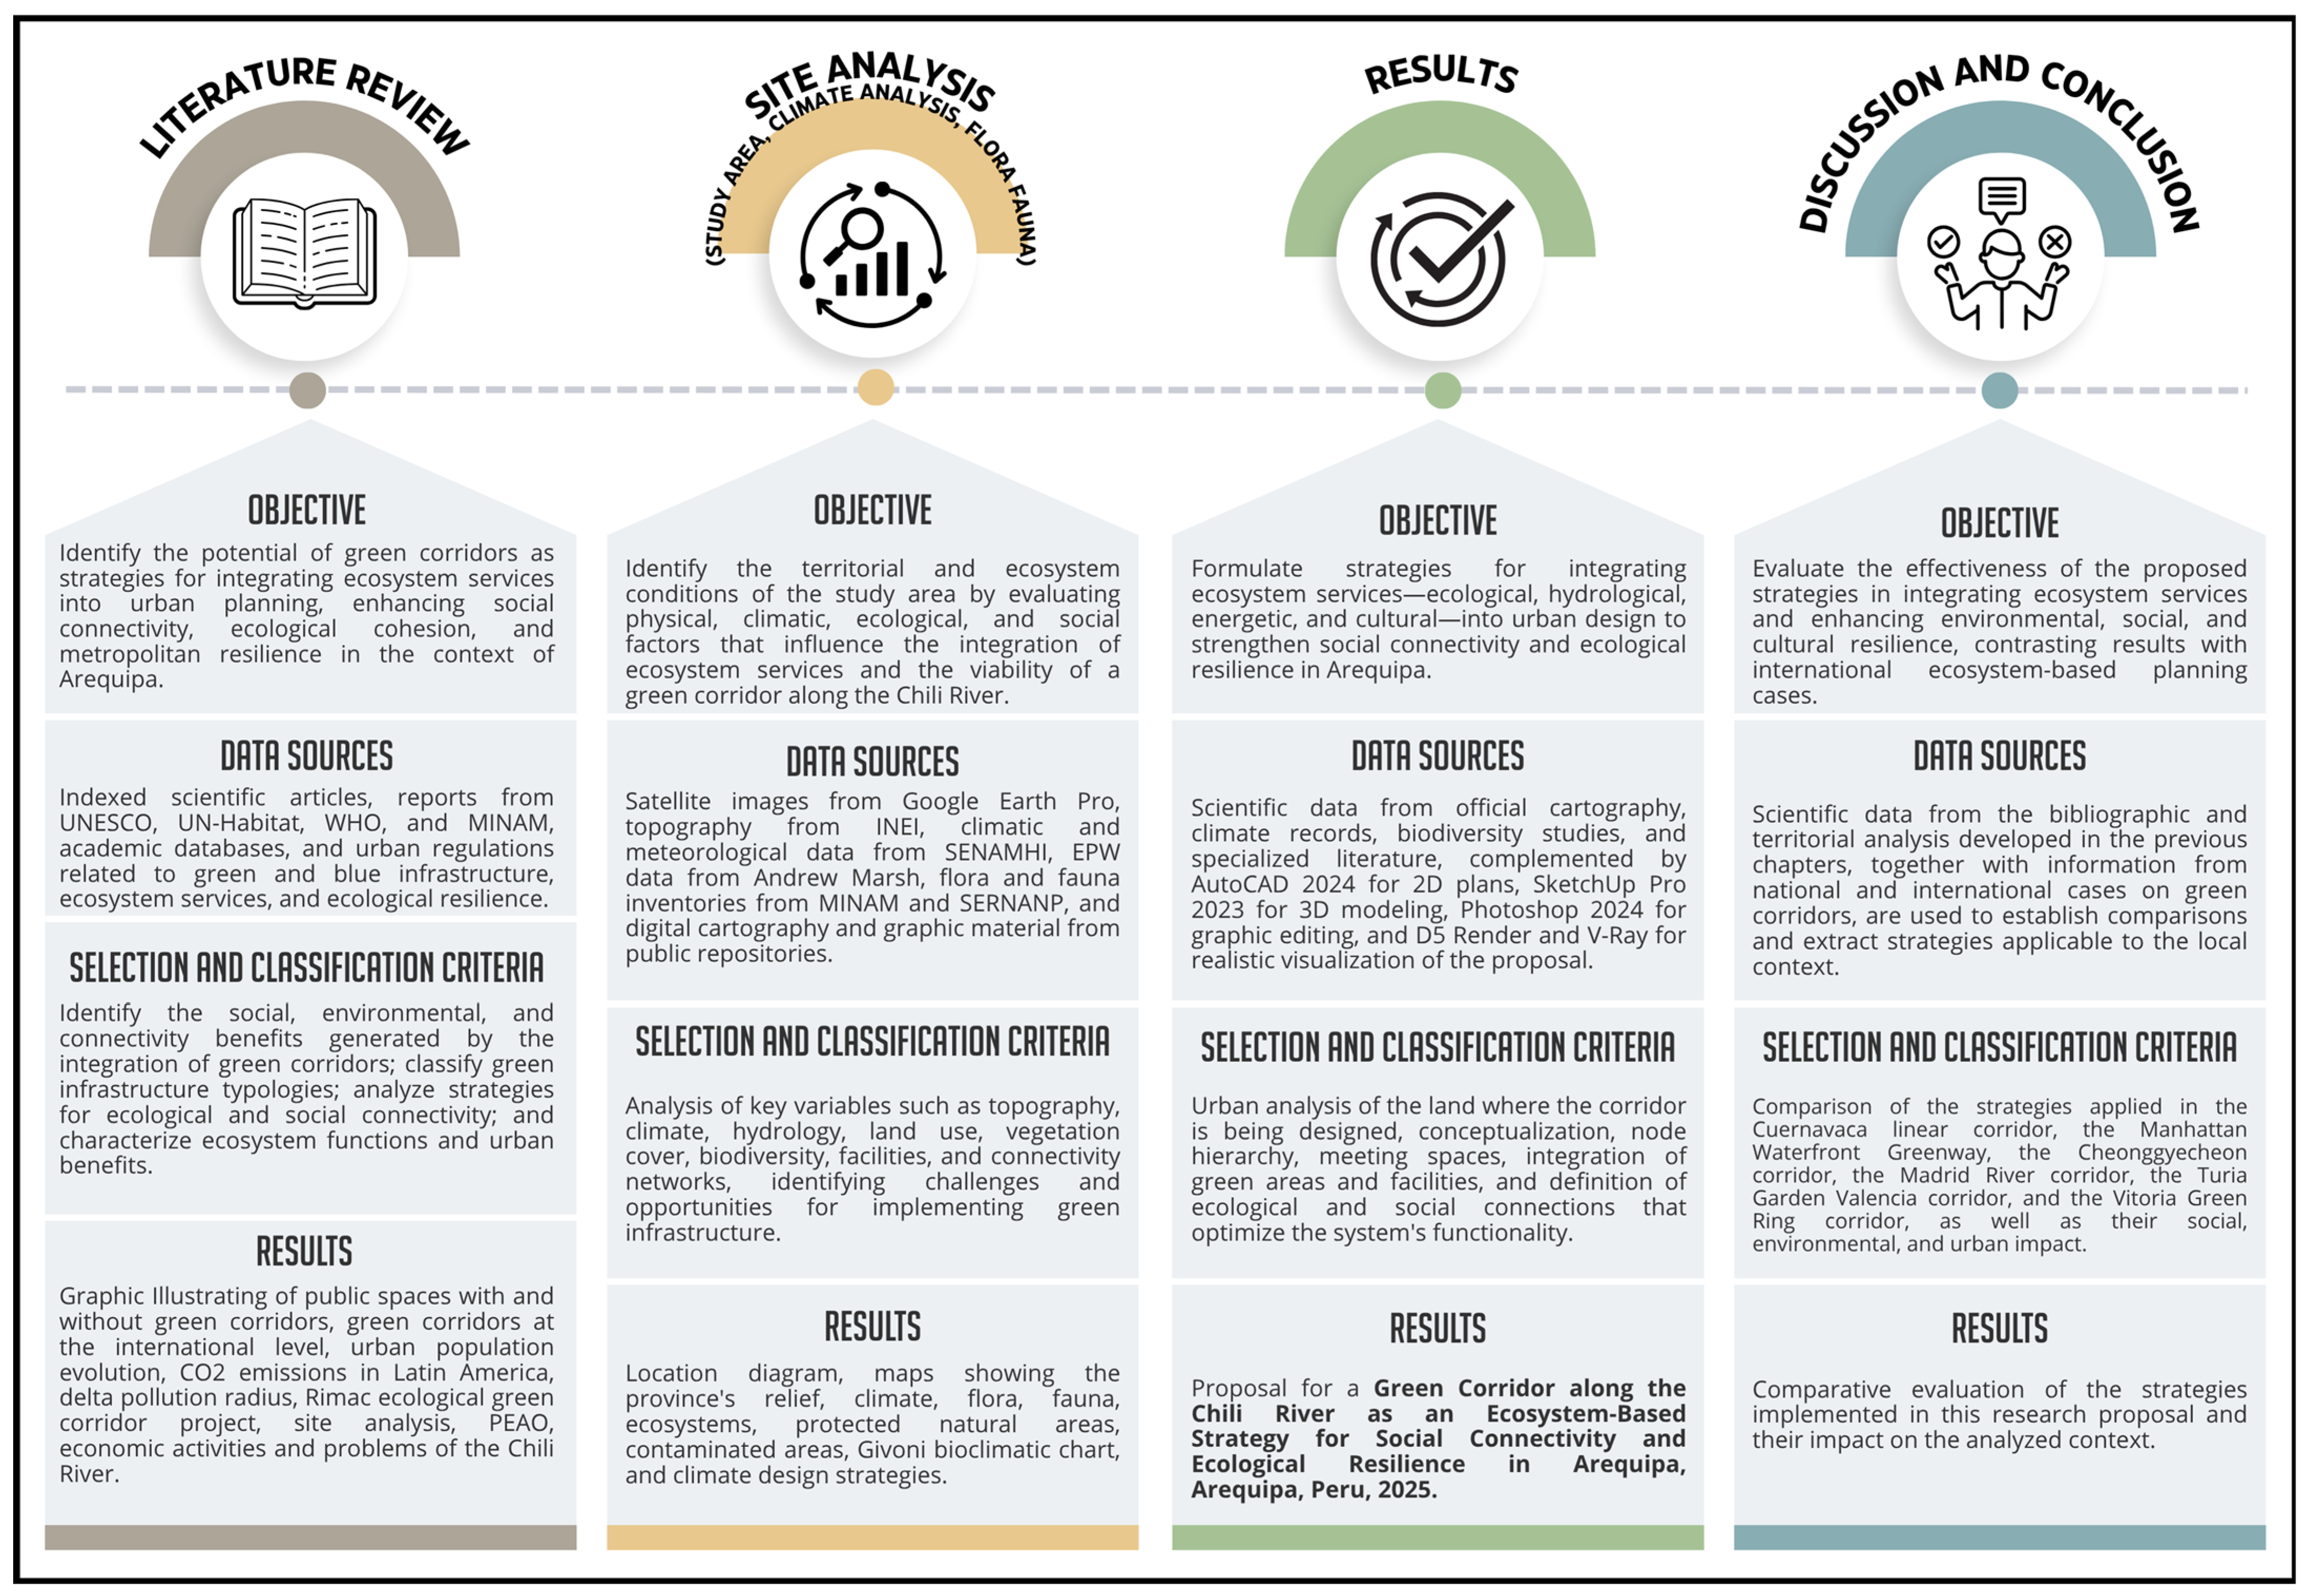
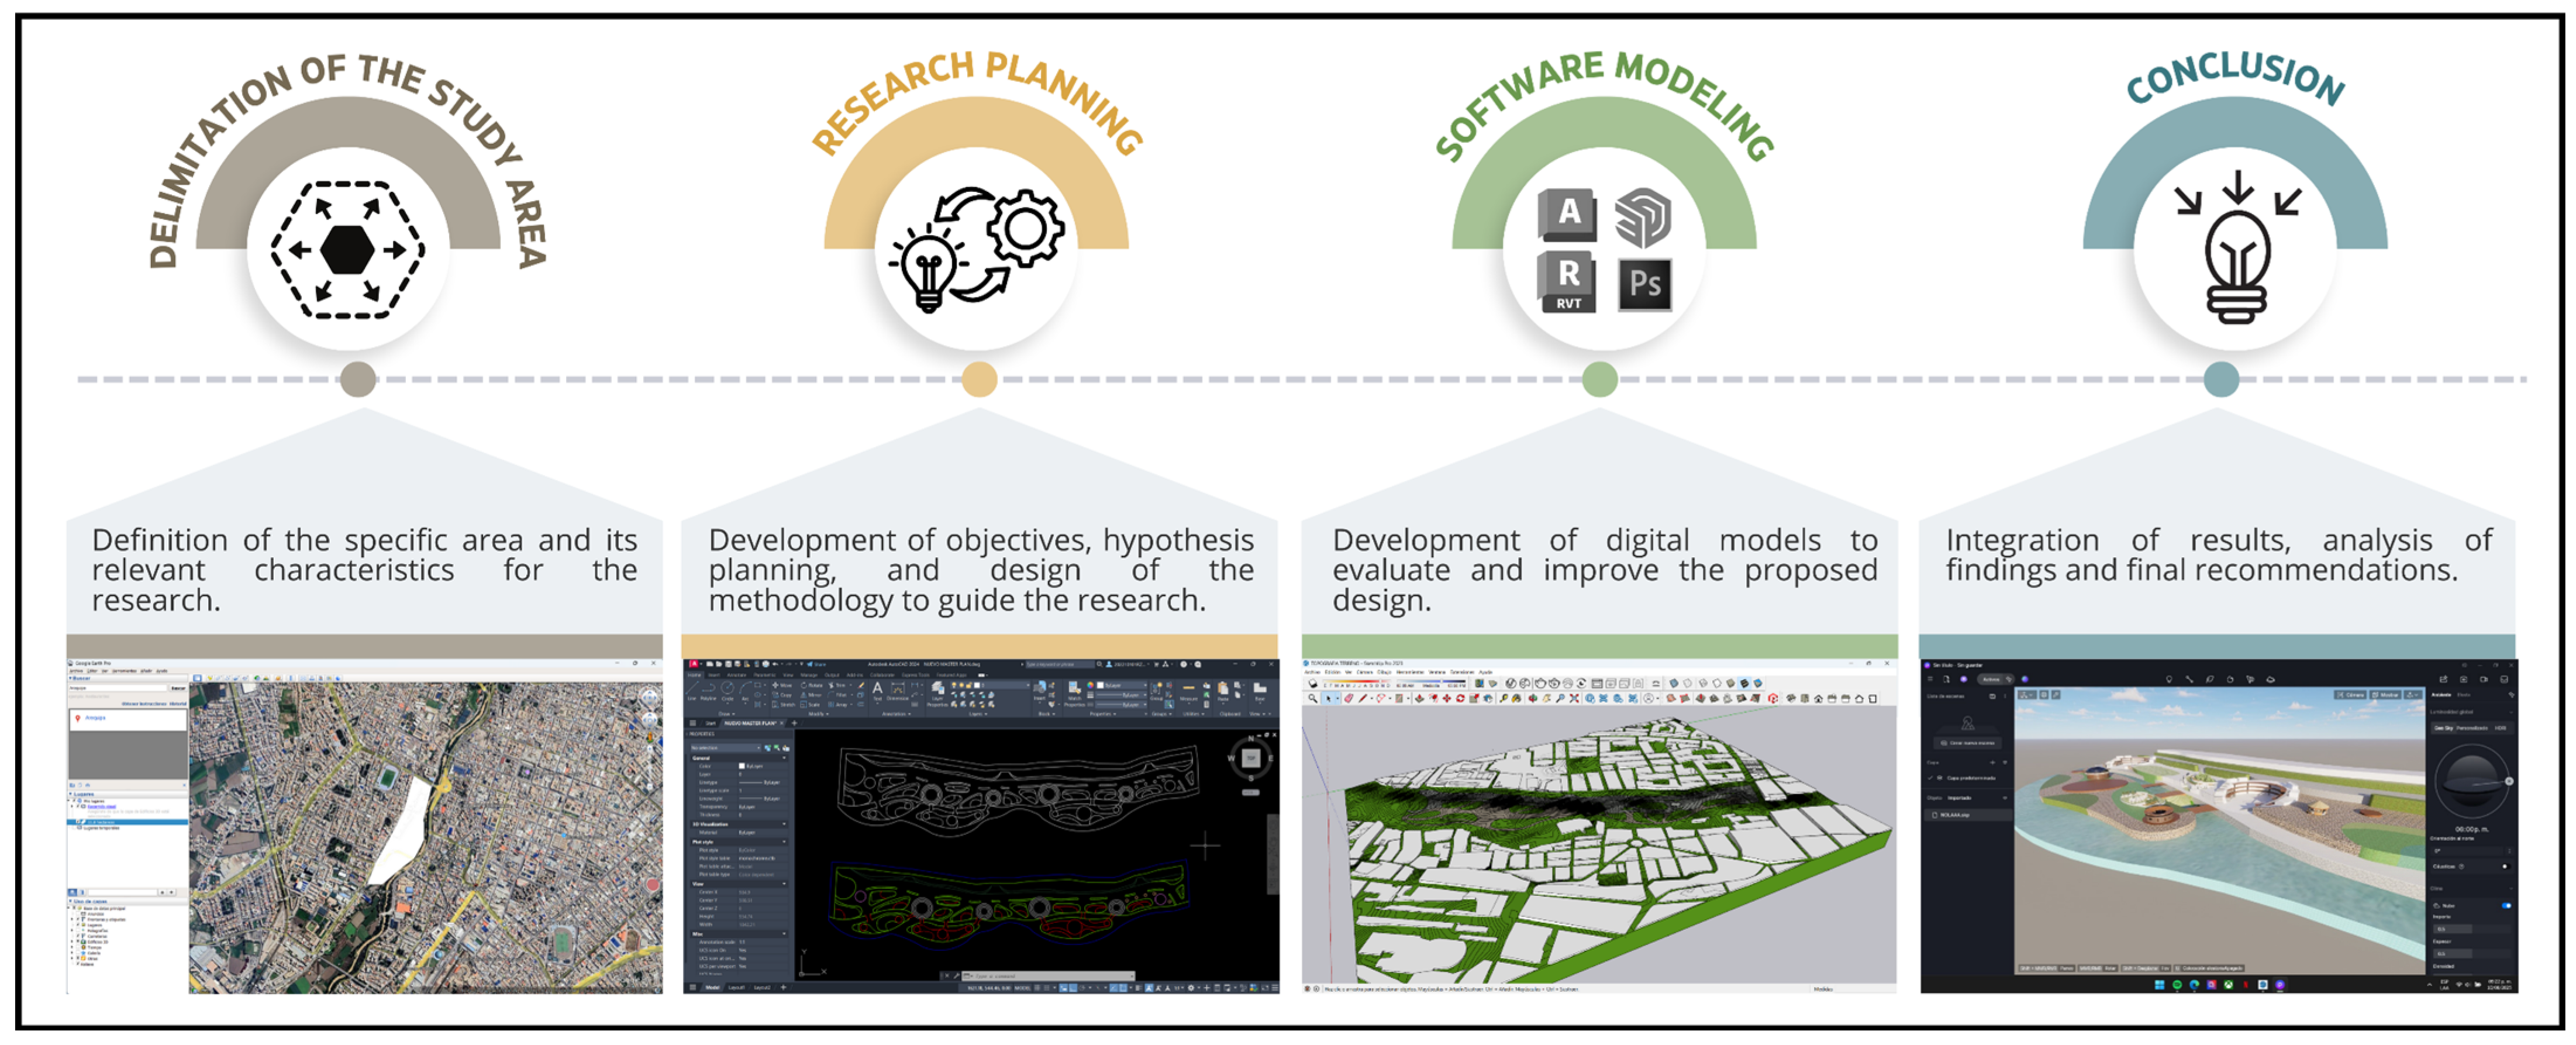
The methodological structure of this research is organized into four analytical phases that combine qualitative interpretation with quantitative validation. In the first phase, a conceptual framework was developed, integrating the principles of ecosystem services, nature-based solutions, and urban resilience as the foundations of the design process. The second phase involved a multiscalar diagnosis of the Chili River through geospatial analysis, field surveys, and an assessment of both ecological and social connectivity. In the third phase, design strategies for the green corridor were formulated, focusing on phytoremediation, energy efficiency, and the integration of multifunctional public spaces. Finally, the fourth phase consisted of a comparative validation of the results against international references, as illustrated in Figure 7.

2.2. Methodological Process

2.2.1. Literature Review

In the initial phase, information was gathered to contextualize the environmental, urban, and spatial dimensions of green corridors as strategies to integrate ecosystem services, nature-based solutions, and social connectivity in Arequipa. Academic publications and technical reports from 2013 to 2025 were reviewed using Scopus, Google Scholar, and repositories from UN-Habitat, the World Health Organization, and ECLAC, ensuring that all sources were peer-reviewed and institutionally validated.
The state-of-the-art review established the conceptual framework on ecosystem thinking, green infrastructure, and sustainable urbanism, which provided the theoretical basis for the analysis developed in this section. It also made it possible to identify international experiences with green corridors and their ecological, social, and urban impacts. The evidence was organized according to the four categories of ecosystem services: provisioning, regulating, supporting, and cultural, to understand their contribution to environmental balance and urban quality of life.

2.2.2. Study Area, Climate Analysis, Flora, and Fauna

During the second phase, this study focused on the physical and environmental characteristics of the intervention area in Arequipa, identifying its main limitations and opportunities to integrate ecosystem services through a green corridor. Climatic, geospatial, and ecological data were collected to guide the development of sustainable design strategies.
Study Area: A detailed site analysis was conducted within the district and province of Arequipa, Peru, in order to define the project’s area of intervention. The study area was delineated along the Chili River corridor using Google Earth Pro 2025 and the official cartography of the National Institute of Statistics and Informatics (INEI). These tools allowed the exploration of the terrain, the measurement of specific areas, and the determination of precise coordinates to achieve a comprehensive understanding of the context. The geospatial analysis, based on the interpretation of satellite imagery, enabled the identification of vegetation cover, existing infrastructures, and the main current and potential ecosystem services, including carbon sequestration, ecological connectivity, and urban recreation spaces.
Climate Analysis: Additionally, climatological data were analyzed to address essential aspects such as temperature, wind, relative humidity, solar radiation, and precipitation. This process was used to develop the Givoni bioclimatic chart, which facilitated the implementation of sustainable design strategies aimed at minimizing environmental impact. The following procedure was followed to obtain the data:
  • Annual climatic data were extracted from the Solar Energy Atlas of Peru (SENAMHI), from which the average solar radiation (kWh/m2) of the study area was obtained.
  • The Weblakes software was used as a modeling tool to analyze atmospheric dispersion and determine the predominant wind direction and speed (%) in the intervention area.
  • Annual data for the year 2021 were collected from SINIA, providing monthly and annual precipitation values (mm).
  • Records from the Regional Strategy and Action Plan for Biological Diversity of Arequipa (2016–2021) were incorporated, which included variations in average, maximum, and minimum temperatures (°C).
  • Data from SENAMHI corresponding to the period 2020–2024 from the Arequipa–La Pampilla station were used. These data achieved a correlation coefficient higher than 0.95, validating the consistency of the previous information and providing accurate relative humidity data (%).
  • All the collected data were processed through comparative statistical analysis to identify representative climatic patterns of the area.
  • Finally, interpretive charts were developed to summarize the parameters of solar radiation, wind, precipitation, temperature, and relative humidity, supporting bioclimatic and energy design decisions for the green corridor.
Design Strategies: Based on the climate analysis, a Givoni bioclimatic chart was created in AutoCAD 2024 using temperature and relative humidity parameters. This tool helped identify comfort zones and define passive design strategies appropriate to Arequipa’s semi-arid context. The recommendations derived from Cuaderno 14 guided the optimization of orientation, solar control, natural ventilation, and thermal comfort in open spaces and facilities along the corridor. The application of these strategies contributed to an efficient and adaptable design, improving habitability, reducing energy demand, and strengthening the environmental integration of the project.
Environmental Analysis of Flora and Fauna: This analysis made it possible to identify the biodiversity and ecological conditions of the Chili River corridor, guiding the design toward ecosystem restoration and the strengthening of biological connectivity. This study provided the basis for selecting native species adapted to Arequipa’s arid climate and for defining conservation and reforestation zones within the project, ensuring that the green infrastructure would integrate harmoniously with the natural environment while promoting sustainability and environmental resilience.
In flora, this research was based on official sources from SINIA, SENAMHI and the Regional Strategy for Biological Diversity of Arequipa (2016–2021), complemented by satellite observations and field verifications that confirmed the reliability of the data. Native and arid-adapted species were identified, including Schinus molle, Jarava ichu, Tagetes minuta, and Puya raimondii, selected for their resistance to solar radiation, low water requirements (100–600 mm/year), and high carbon capture capacity (0.01–1.2 kg CO2/m2/year). This information guided the vegetation selection for the corridor, promoting water efficiency and environmental resilience across the landscape.
Finally, in fauna, this study used records from SINIA and from the Salinas and Aguada Blanca National Reserve, which made it possible to identify representative species of the high-Andean and inter-Andean ecosystems, such as the vicuña, the Andean condor, the puma, the taruca, and the Andean fox. Based on their mobility patterns and ecological requirements, corridor widths ranging from 300 to 3000 m were calculated according to the needs of each species. These results were used to define the connectivity zones and ensure the functional continuity of habitats within the design of the Chili River green corridor.

2.2.3. Results

The third phase of this research focused on applying the urban, environmental, and social criteria defined in the previous stages, with the objective of structuring a resilient and multifunctional green corridor along the Chili River. In the first stage, the boundaries of the study area and its urban context were established using Google Earth Pro 2025 and the official cartography of the National Institute of Statistics and Informatics (INEI), considering variables such as valley morphology, building density, accessibility, and the relationship with public spaces. In the second stage, sectors with the greatest potential to reconnect ecological and social networks were identified, establishing strategic intervention nodes linked to plazas, facilities, and environmental restoration areas.
In the third stage, the master plan and zoning of the green corridor were developed, integrating cultural, educational, and productive spaces articulated with the topography and natural landscape. The carbon absorption capacity of the projected green areas was estimated, and strategies for energy self-sufficiency and sustainable water management were incorporated, including photovoltaic systems, biodigesters, and community gardens. Social components were also integrated into plazas, pedestrian paths, and community modules, ensuring that the proposal responded to local cultural dynamics and strengthened social cohesion around the river landscape.
Finally, in the fourth stage, technical plans were developed in AutoCAD 2024 and three-dimensional models were created in SketchUp Pro 2023, complemented with visualizations in V-Ray 2022, D5 Render 2.1, and Adobe Photoshop 2024. These representations allowed for the analysis of the relationship between the proposal, the topography, and the built environment, as shown in Figure 8.
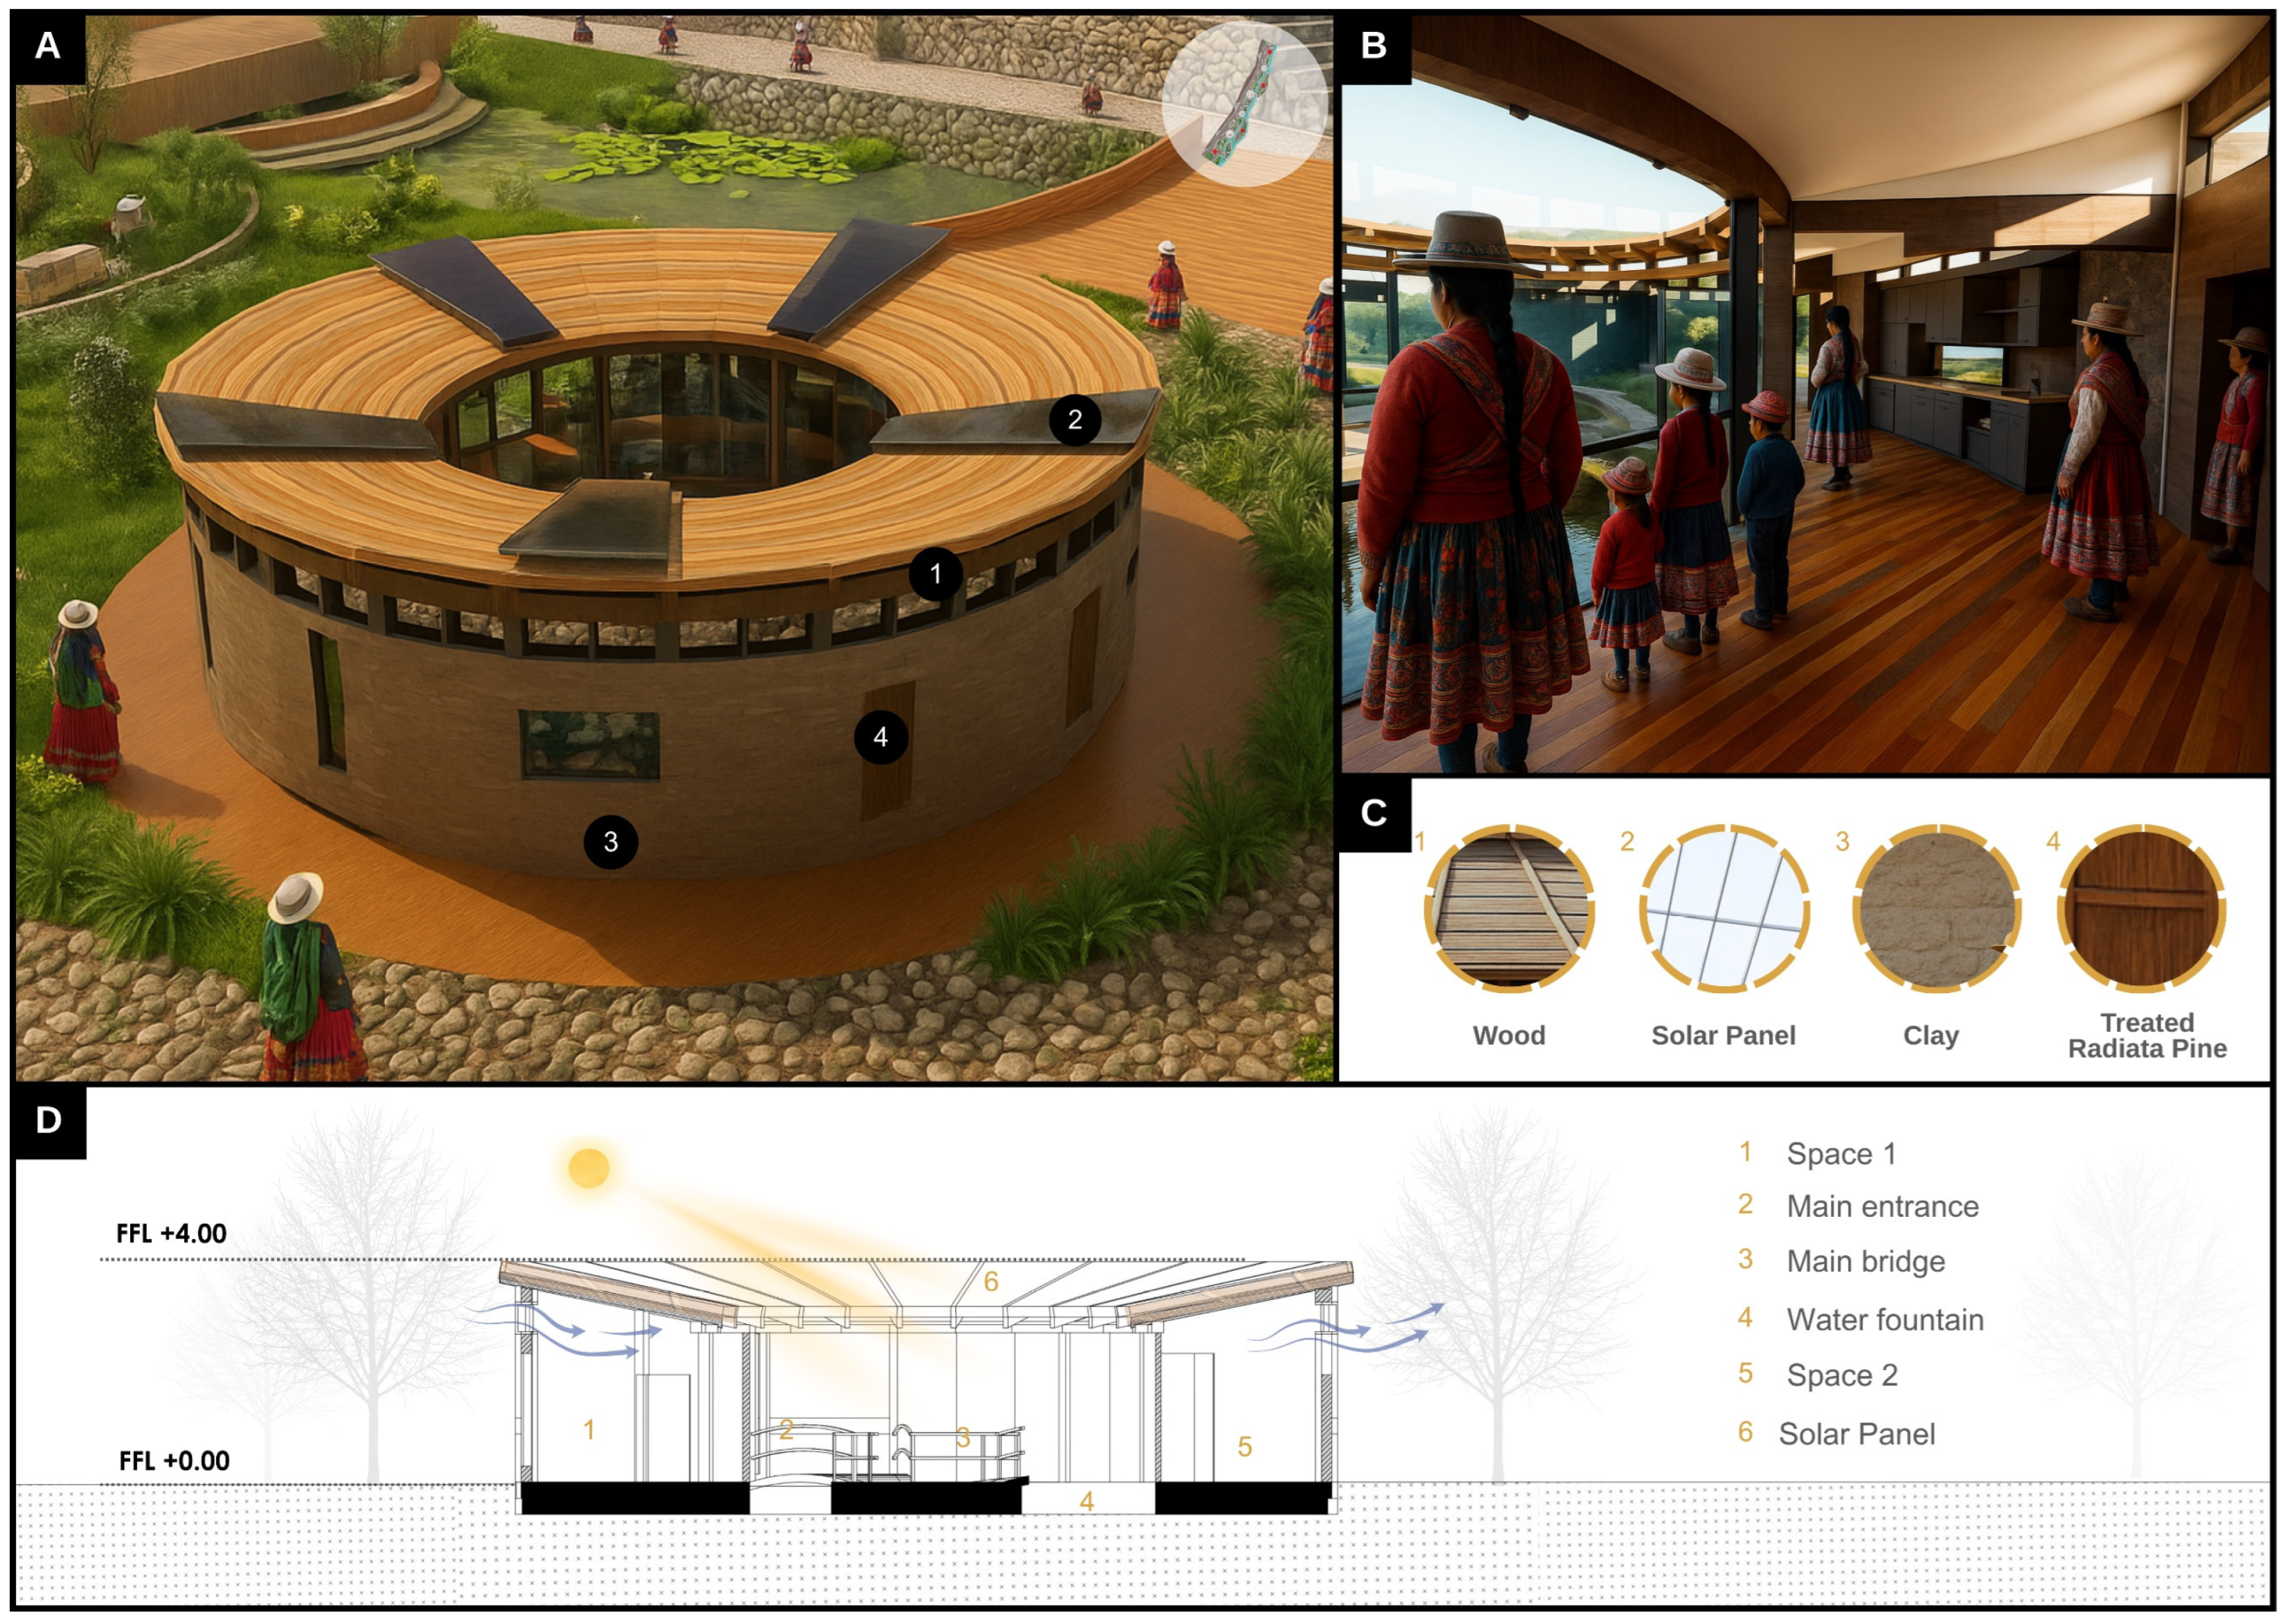
In addition, to accurately determine the energy performance of the photovoltaic system, a simulation was carried out in Ladybug for Grasshopper (Rhinoceros 8) using a validated EPW climate file for the city of Arequipa. The model was applied to one of the representative facilities of the corridor, specifically the workshop modules, in order to analyze the solar path and the annual distribution of incident radiation on the building. Figure 9A shows the solar analysis performed on the facility, illustrating the incidence and behavior of solar radiation on its envelope, while Figure 9B depicts the optimal arrangement and tilt of the photovoltaic panels according to solar orientation and local radiation conditions. The results of the analysis made it possible to define ideal installation parameters, recommending inclinations between 12° and 17° with an orientation toward true north, consistent with Arequipa’s latitude and with values established by specialized studies that determine an optimal fixed annual tilt angle of 16.6° to maximize solar radiation capture [57].
Furthermore, the calculation of monthly energy generation by the solar panels was determined using the following expression:
𝐸 = 𝑃(kW) × 𝑅(kWh/m2/day) × ηp × days
In this formula, E represents the total energy produced in kilowatt-hours (kWh) during the analysis period. P is the nominal power of the solar panel in kilowatts (kW), which indicates its maximum capacity under standard test conditions. R corresponds to the average daily solar radiation in kWh/m2/day, meaning the amount of solar energy received per unit of surface area. ηp expresses the photovoltaic system efficiency, in percentage, indicating the proportion of radiation converted into usable electrical energy. Finally, days refers to the number of operational days of the system. The multiplication of these factors makes it possible to estimate the total electrical energy that the panels can generate within a given period [58].
To ensure the reliability of the system against environmental variations and real-world losses, such as those caused by temperature, dust accumulation, module degradation, or seasonal decreases in irradiance, a safety margin of 20% was applied.
This adjustment is expressed through the following equation:
Eadjusted = Ecalculated × (1 + M)
In this relationship, Eadjusted represents the corrected annual energy (kWh/year), Ealculated is the annual energy derived from the irradiance and efficiency of the modules (kWh/year), and M corresponds to the 20% safety margin. This procedure ensures the stability of the photovoltaic system’s energy performance under real operating conditions [59].

2.2.4. Discussion and Conclusions

Finally, in the fourth stage, a comparative analysis was conducted between the project findings and previous references, contrasting the strategies applied in Arequipa with both international and national experiences. Projects such as the Linear Railway Park of Cuernavaca, the Manhattan Waterfront Greenway, and Cheonggyecheon demonstrate how obsolete infrastructures can be transformed into sustainable public spaces. Cases such as the green corridors of Hermosillo–Mexicali and, in Spain, Madrid Río, the Turia Garden, and the Green Belt of Vitoria illustrate successful models of renaturalization and integrated urban planning.
These references guided the sustainability, inclusion, and resilience criteria of the Chili River Green Corridor, adapting ecological connectivity, active mobility, and landscape restoration strategies to the semi-arid and high-altitude context of Arequipa. In this way, the discussion consolidates the proposal as an ecosystem-based strategy that translates global knowledge into a local framework, strengthening the city’s social and environmental integration.

2.3. Study Area

The province of Arequipa is one of the eight provinces that make up the Department of Arequipa, located in the southern region of Peru, as shown in Figure 10A. This province contains the city of Arequipa, which, in addition to being the provincial capital, is one of the country’s main urban centers due to its historical, economic, and cultural importance [60].
Geographically, the Department of Arequipa, shown in Figure 10B, borders the districts of Yanahuara and Alto Selva Alegre to the north; Paucarpata, Jacobo Hunter, and José Luis Bustamante y Rivero to the south; Miraflores and Mariano Melgar to the east; and Sachaca to the west. It is located at an average altitude of 2337 m above sea level, in a transitional zone between the highlands and the coast, which gives it a predominantly temperate and dry climate, with an annual average temperature of approximately 16 °C. The province of Arequipa, shown in Figure 10C, has an approximate area of 7.8 km2, corresponding mainly to the metropolitan urban zone. This relatively small area contrasts with its high population density and level of urbanization [61].

2.4. Climate Analysis

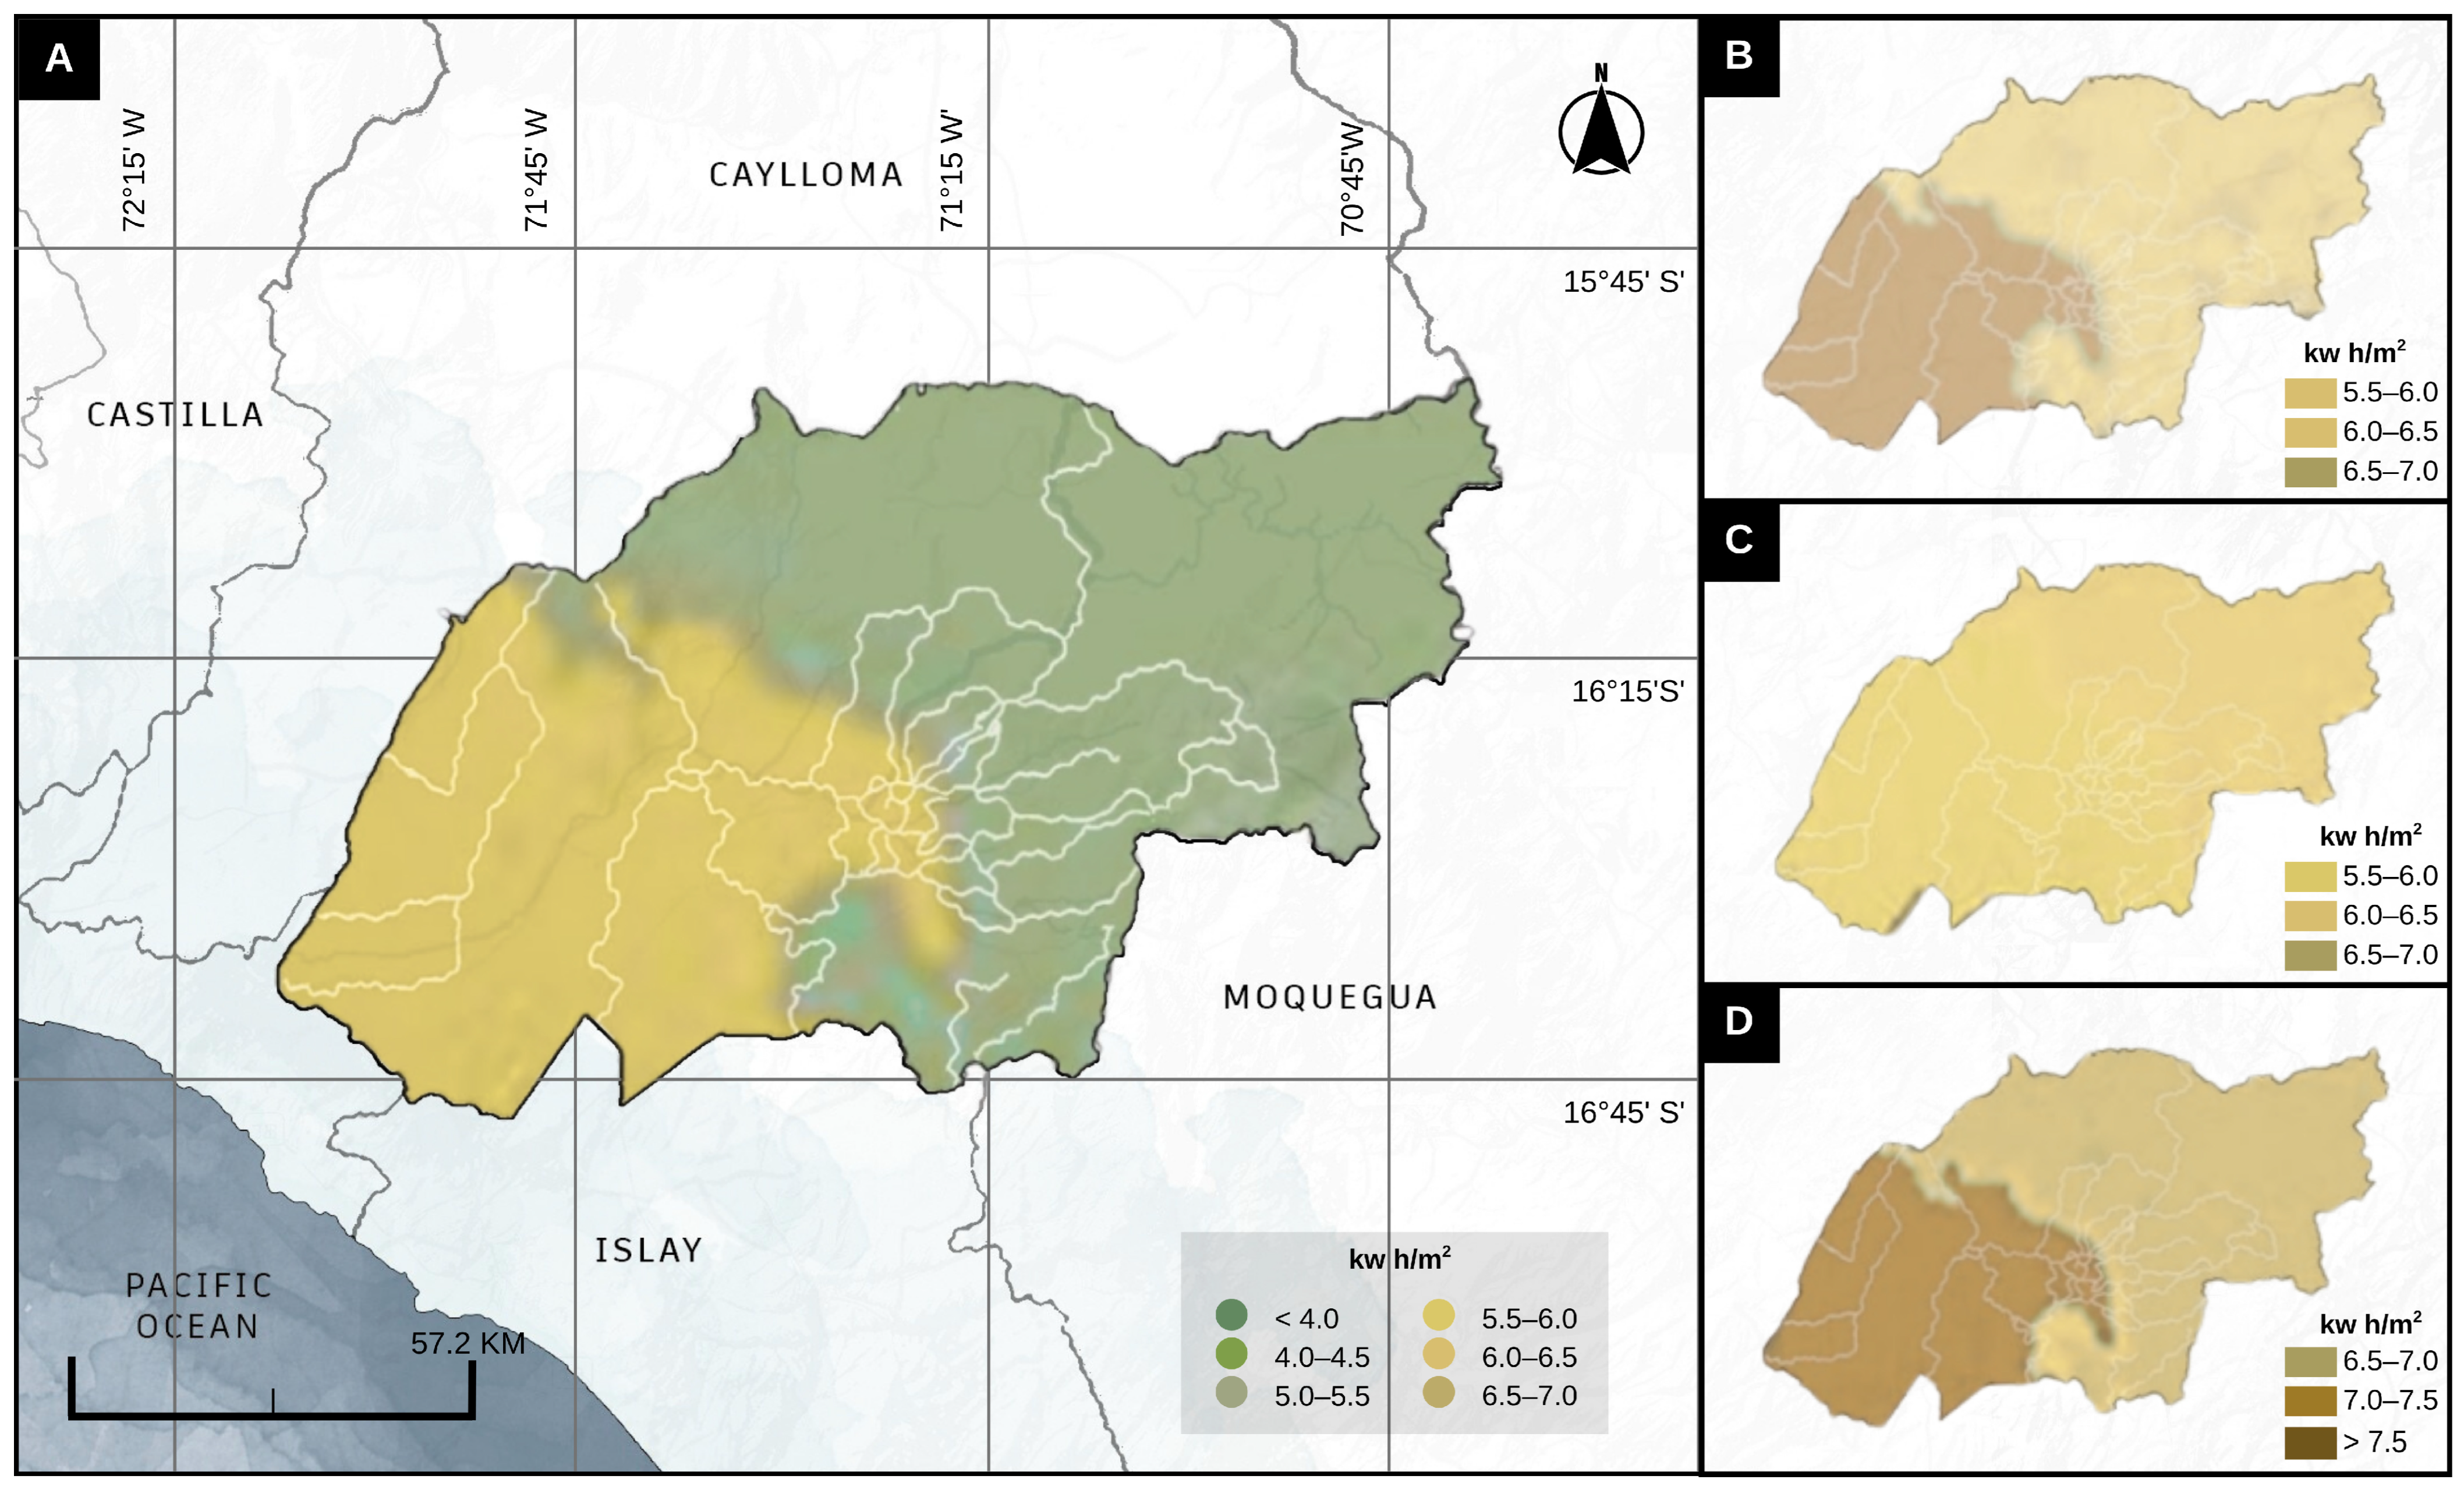
Throughout the year, Arequipa presents significant variations in solar radiation that influence bioclimatic design. During the spring equinox, shown in Figure 11A, the average radiation ranges between 5 and 5.5 kWh/m2. In the autumn equinox, shown in Figure 11B, radiation fluctuates between 5.5 and 7.5 kWh/m2, reaching its maximum in the district of Arequipa (7–7.5 kWh/m2). In the summer solstice, shown in Figure 11C, radiation is moderate (4–6 kWh/m2), while in the winter solstice, shown in Figure 11D, it increases to values above 7.5 kWh/m2. The duration of daylight also varies; during the equinoxes there are approximately 12 h of sunlight, while in the summer solstice it reaches up to 13 h and 6 min, and in the winter solstice, only 11 h and 9 min. These conditions of high solar radiation encourage the use of photovoltaic energy on roofs and open spaces, while also requiring passive solar control solutions, such as roofs, pergolas, lattices, and overhangs. Moreover, the design seeks to balance energy capture and indoor thermal comfort through the north–south orientation of building masses and the use of low-carbon materials, such as stone and gravel [62].
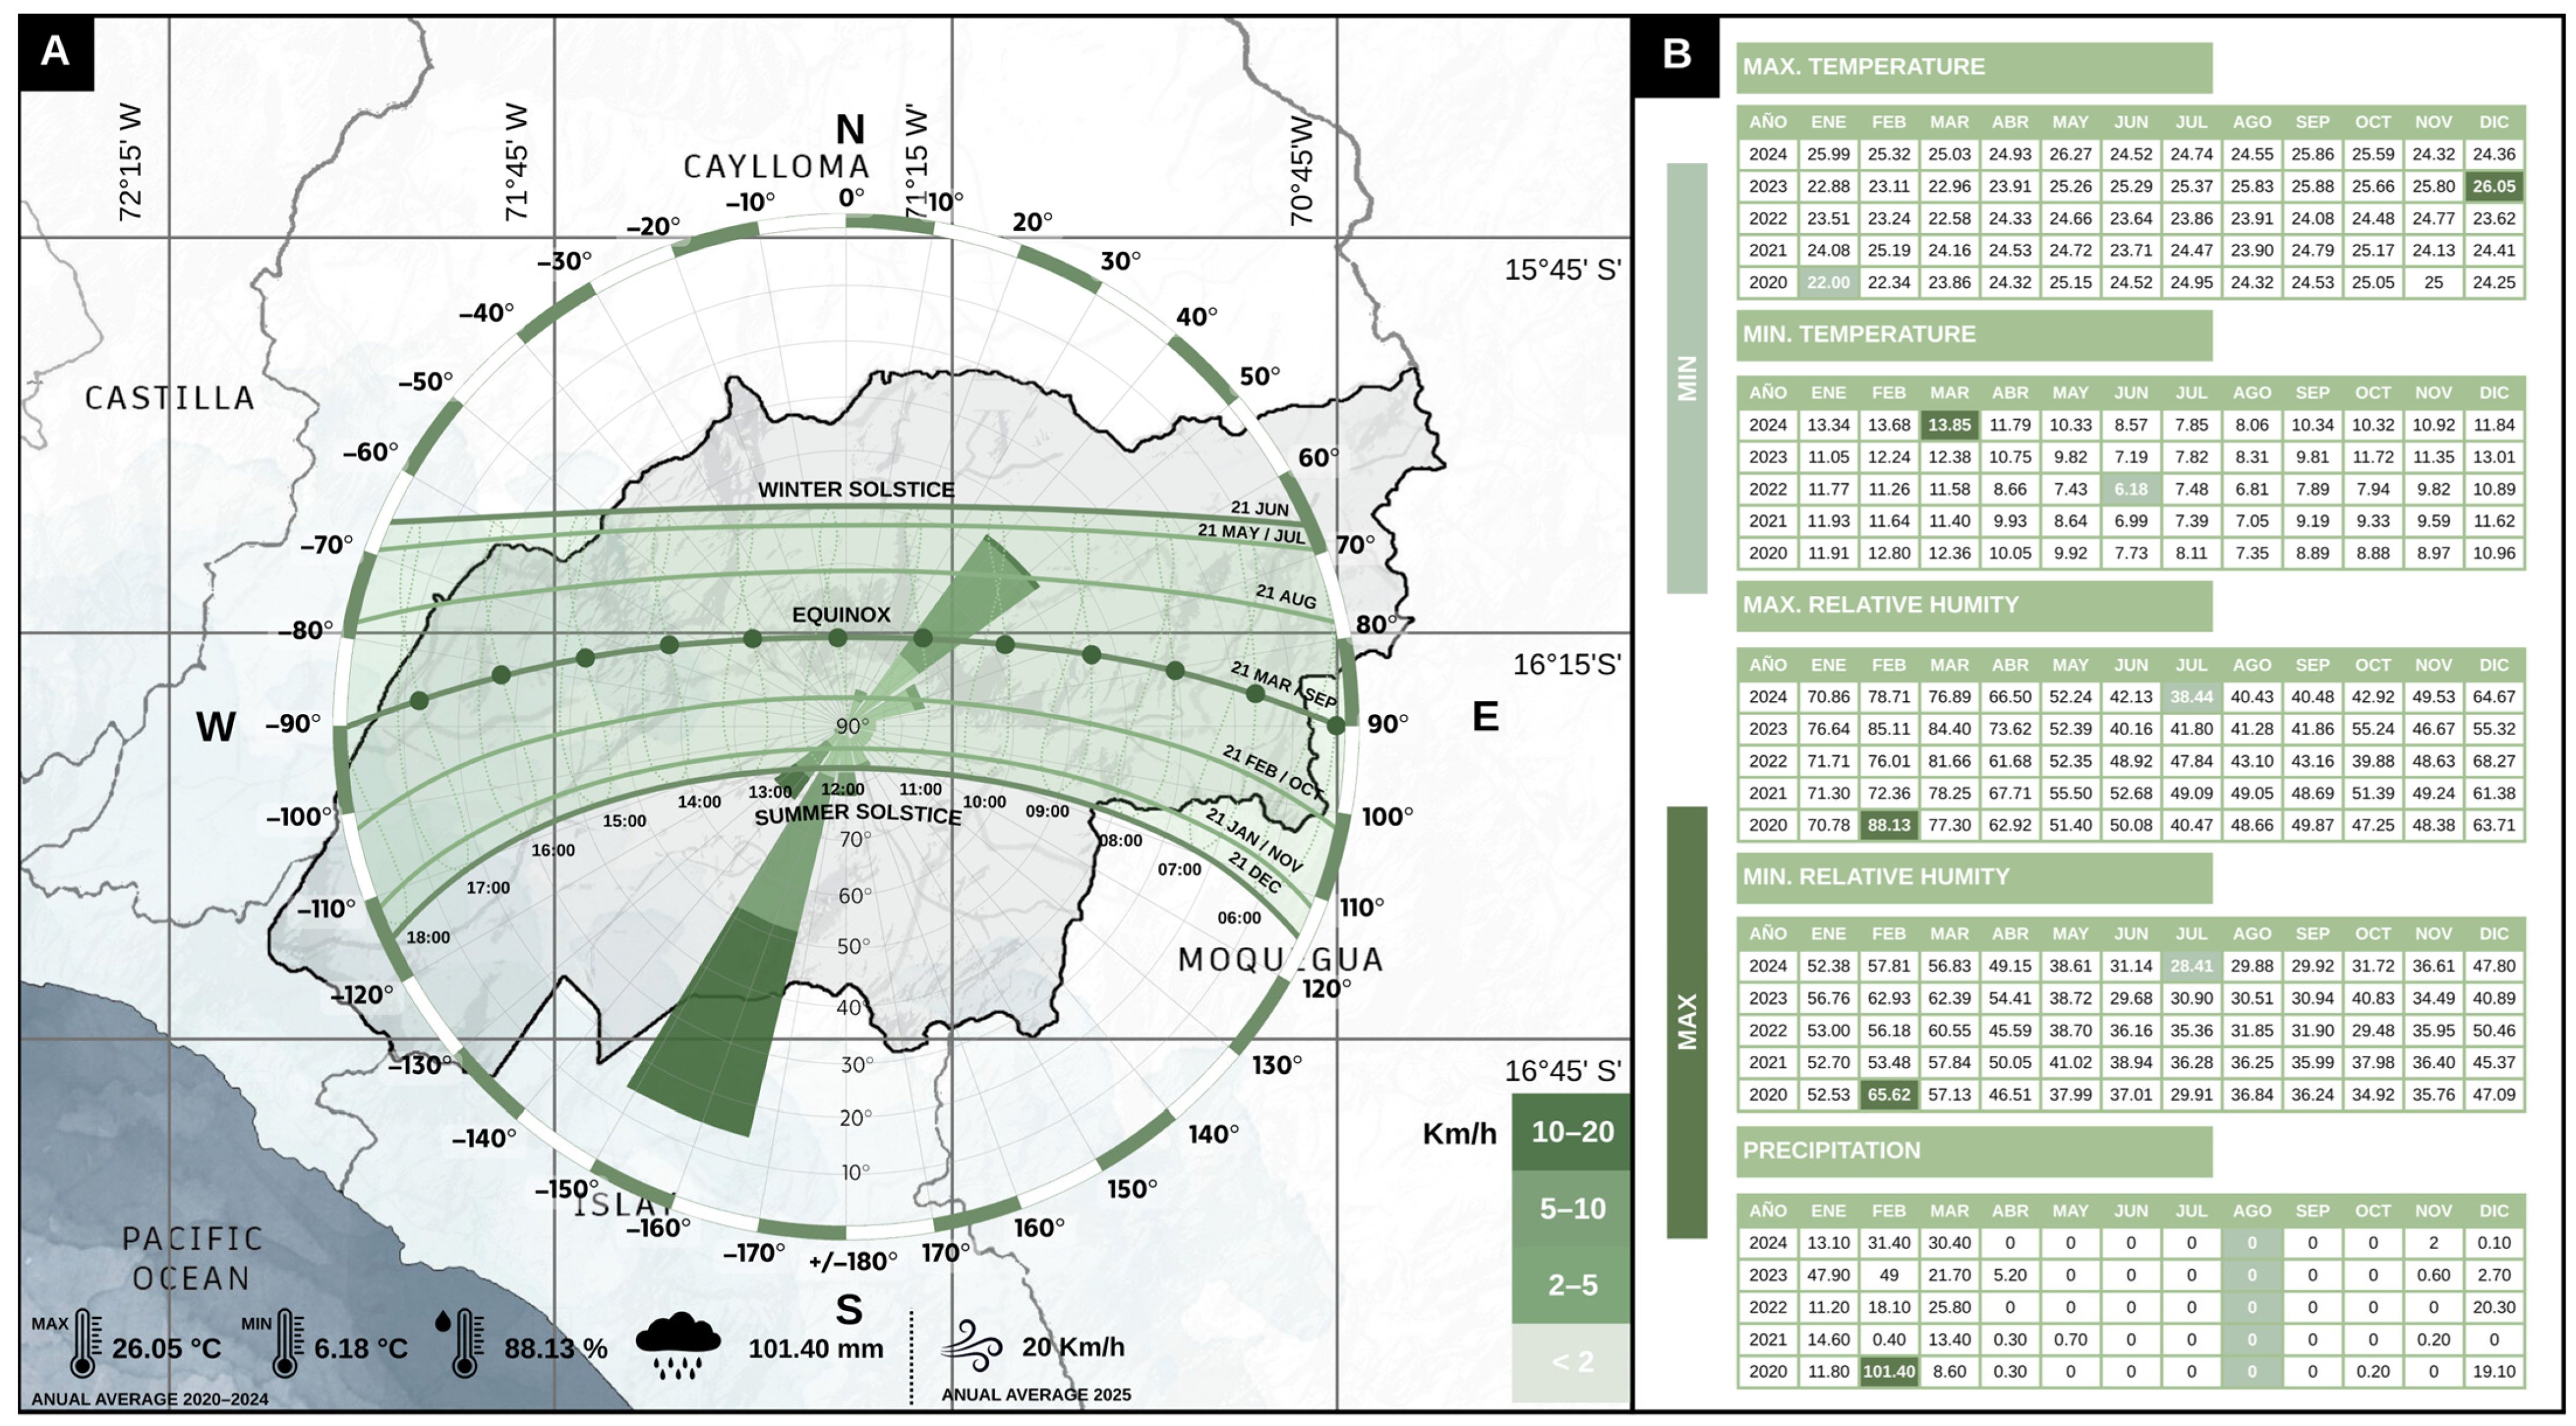
In Arequipa, the wind rose shows a predominance of southerly and southwesterly winds, especially in the afternoons, influenced by the Pacific Ocean and the coastal-Andean geography, as shown in Figure 12A [63]. Along with the solar study, it confirms high solar radiation throughout the year, with paths near the zenith during warm months and low angles in winter. These data guide decisions on site placement, natural ventilation, and passive use of solar energy [64]. Topography also modulates wind seasonality: from April to October, winds mainly come from the north (peaking at 52% in June), while from October to April, they come from the south, with January standing out at 57% [65]. This wind analysis determines the orientation of the architectural complex and its openings, promoting natural cross-ventilation from the southwest. Vegetation barriers and low walls are incorporated to reduce the impact of direct gusts and to channel airflow toward high-radiation areas, thereby reducing the need for mechanical cooling.
Regarding precipitation, Arequipa experiences marked seasonality, as shown in Figure 12B. The wet season occurs mainly between January and March, with a greater than 6% probability of recording at least one wet day. February is the rainiest month, averaging three days with precipitation exceeding 1 mm. In contrast, the dry period lasts for about ten months, from March to January, with October being the driest month, averaging zero days with rain. Throughout the year, the predominant form of precipitation is rain, reaching its highest probability (13%) also in February [66,67].
Given the prolonged dry season, the project prioritizes rainwater harvesting during the wet months through collection surfaces connected to underground reservoirs, complemented by drip irrigation systems for urban gardens. This strategy reduces pressure on the potable water network and enhances landscape resilience in the face of water scarcity [66].
Temperature in the department of Arequipa varies with altitude, but in the coastal zone and the capital city, the climate is temperate and dry, as shown in Figure 12B. Maximum temperatures typically range between 22 °C and 25 °C during the day, with an average daily solar radiation of 8.2 kWh/m2, while minimum temperatures can drop to 8 °C or lower at dawn, especially during winter months. In high Andean areas, thermal differences are more pronounced, with sunny days and cold nights, occasionally dropping below zero. This daily thermal amplitude is a distinctive feature of Arequipa’s climate [66,67].
As for relative humidity, values are high between January and March (averaging 77%) and peak in February (81%), as shown in Figure 12B, while the driest period extends from May to October, averaging 41% with a minimum of 35% in August. These arid and high-radiation conditions directly influence the design and management of urban bio-gardens. Based on precipitation and temperature records from the past five years, a water balance was developed and adapted to local conditions [67].

2.5. Desing Strategies

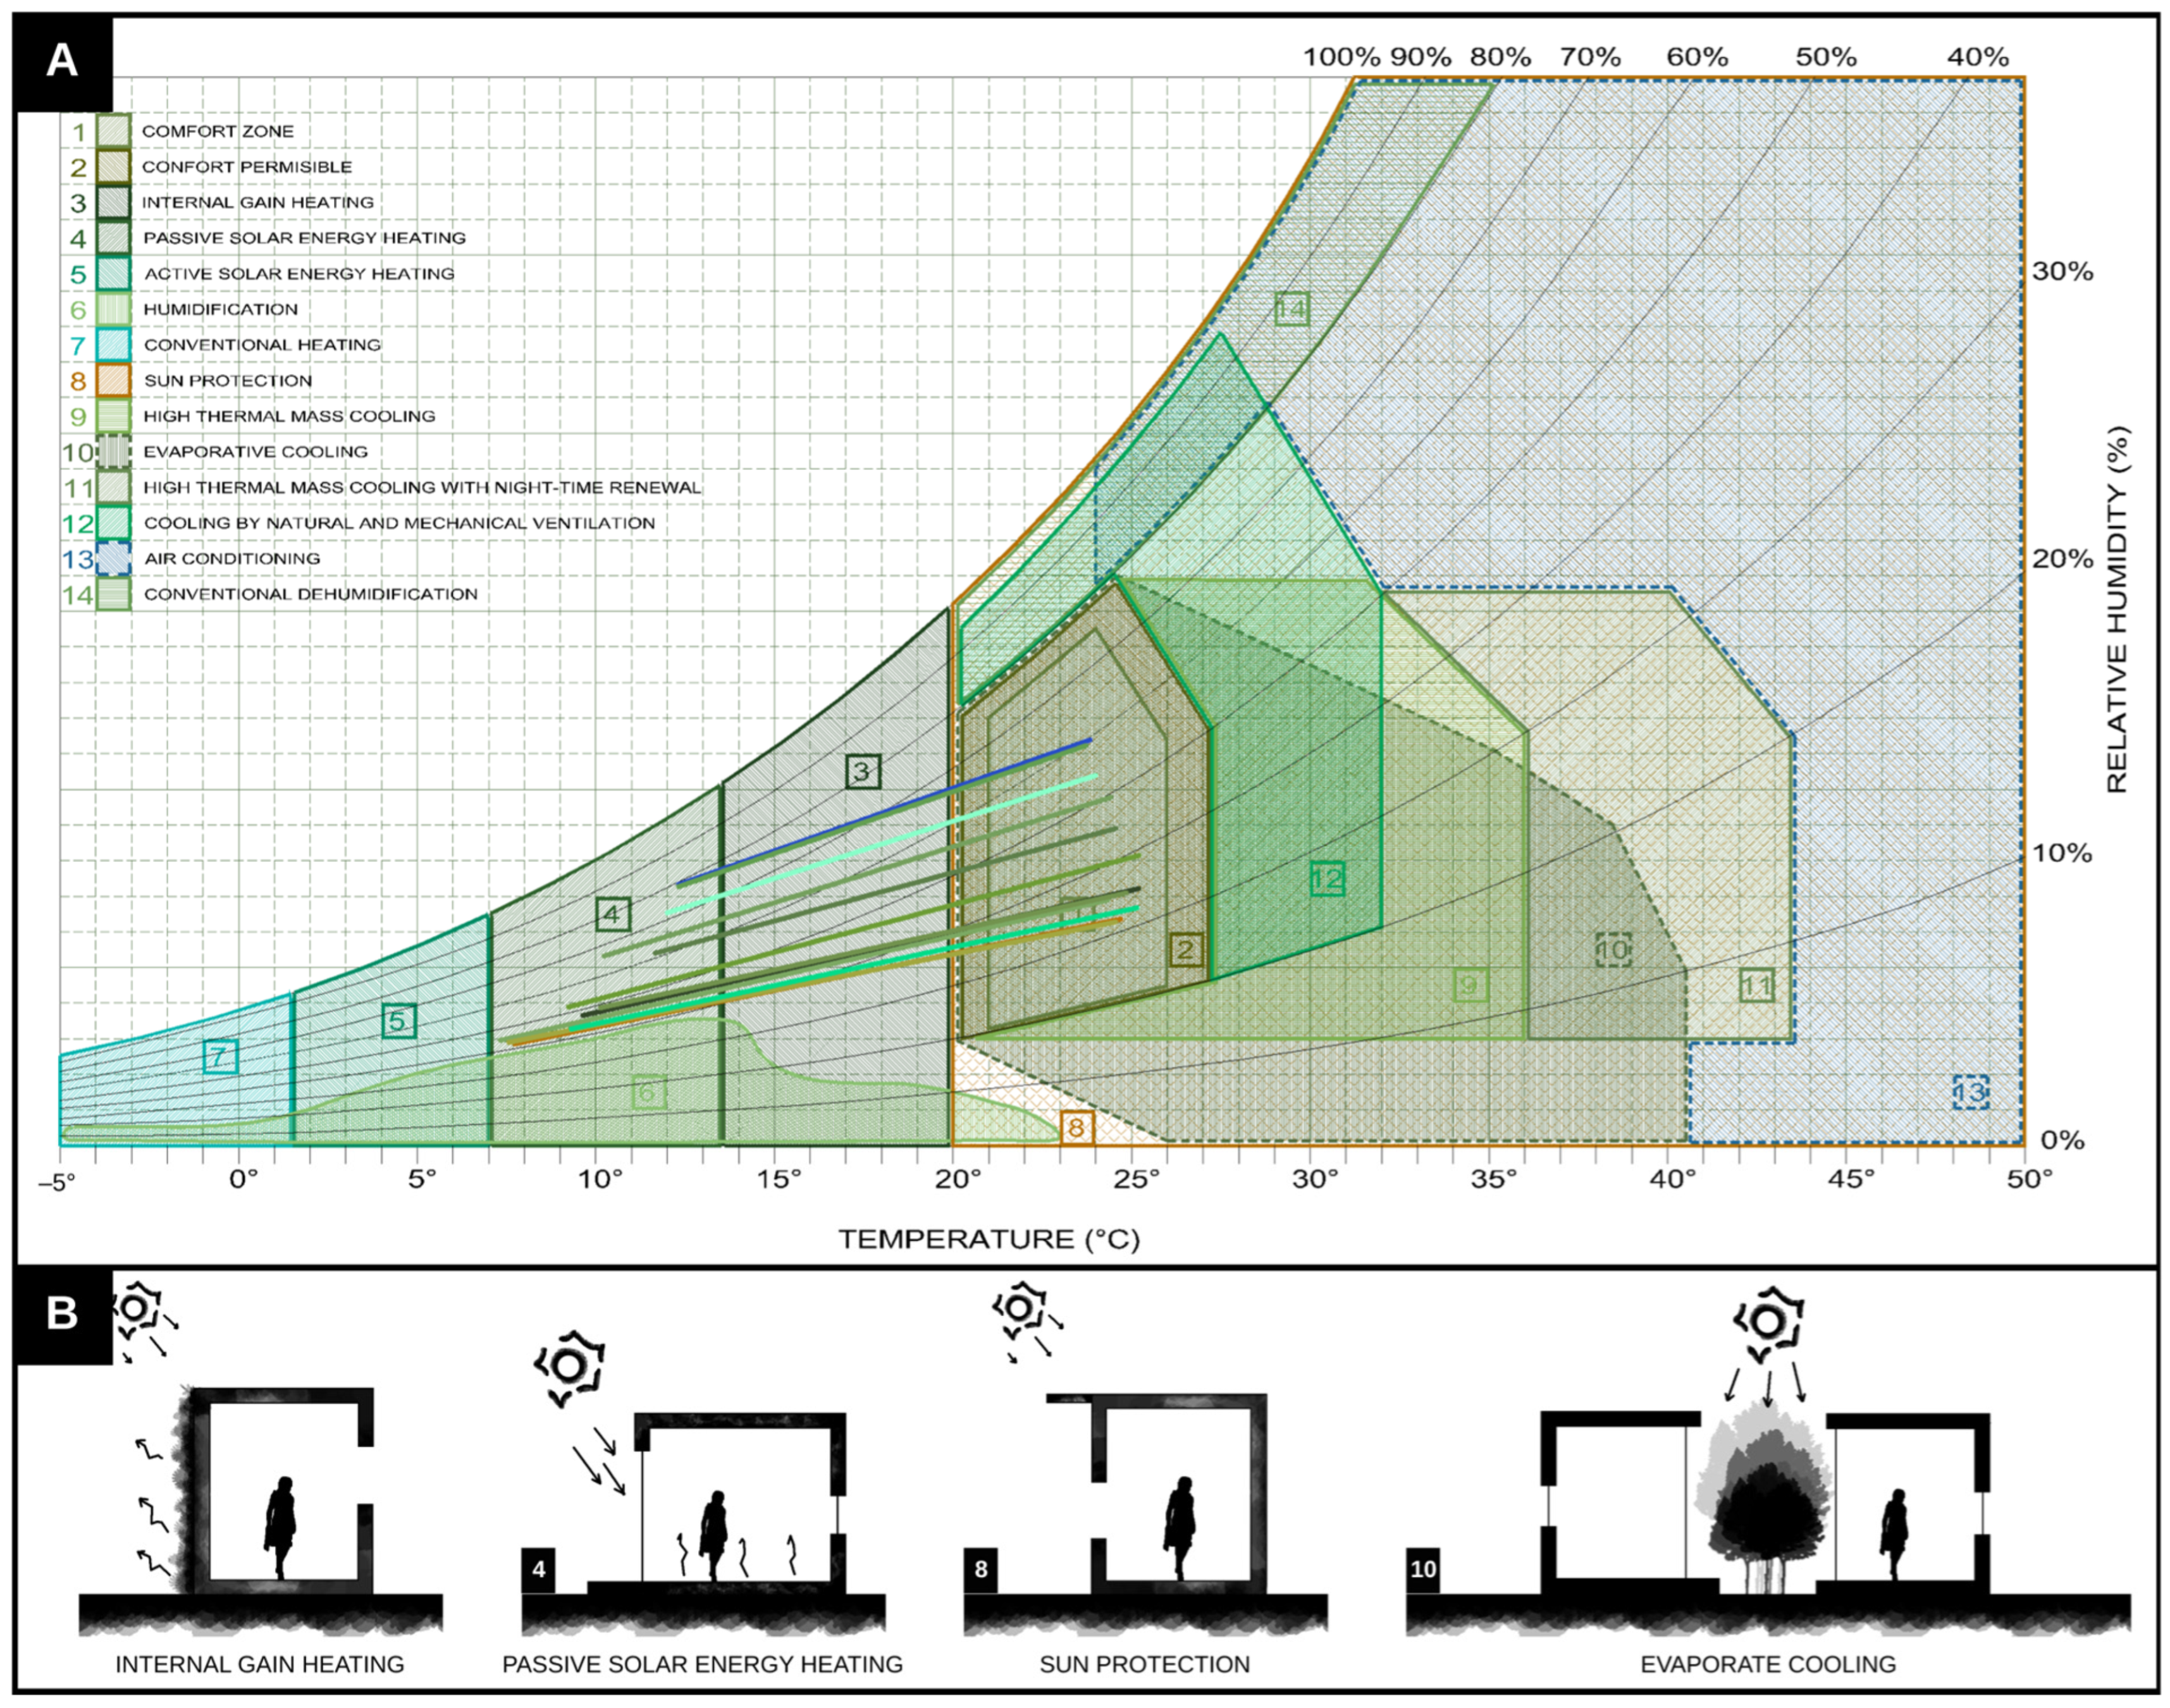
The temperate and dry climate of Arequipa, characterized by warm days, cool nights, and low relative humidity, requires design strategies that address the pronounced daily thermal oscillation and the scarcity of rainfall. As shown in the psychrometric diagrams in Figure 13A and the bioclimatic design recommendations presented in Figure 13B, it is essential to maximize solar gain during the day, incorporate thermal mass in construction materials to store and release heat as needed, and promote natural ventilation to cool spaces during warm hours. In addition, it is recommended to protect interiors from direct solar radiation through shading and to control wind exposure to prevent heat loss during the night. These measures operationalize nature-based and low-energy strategies that enhance regulating ecosystem services at the public-space and building scale [68].

2.6. Environmental, Flora, and Fauna Analysis

2.6.1. Flora

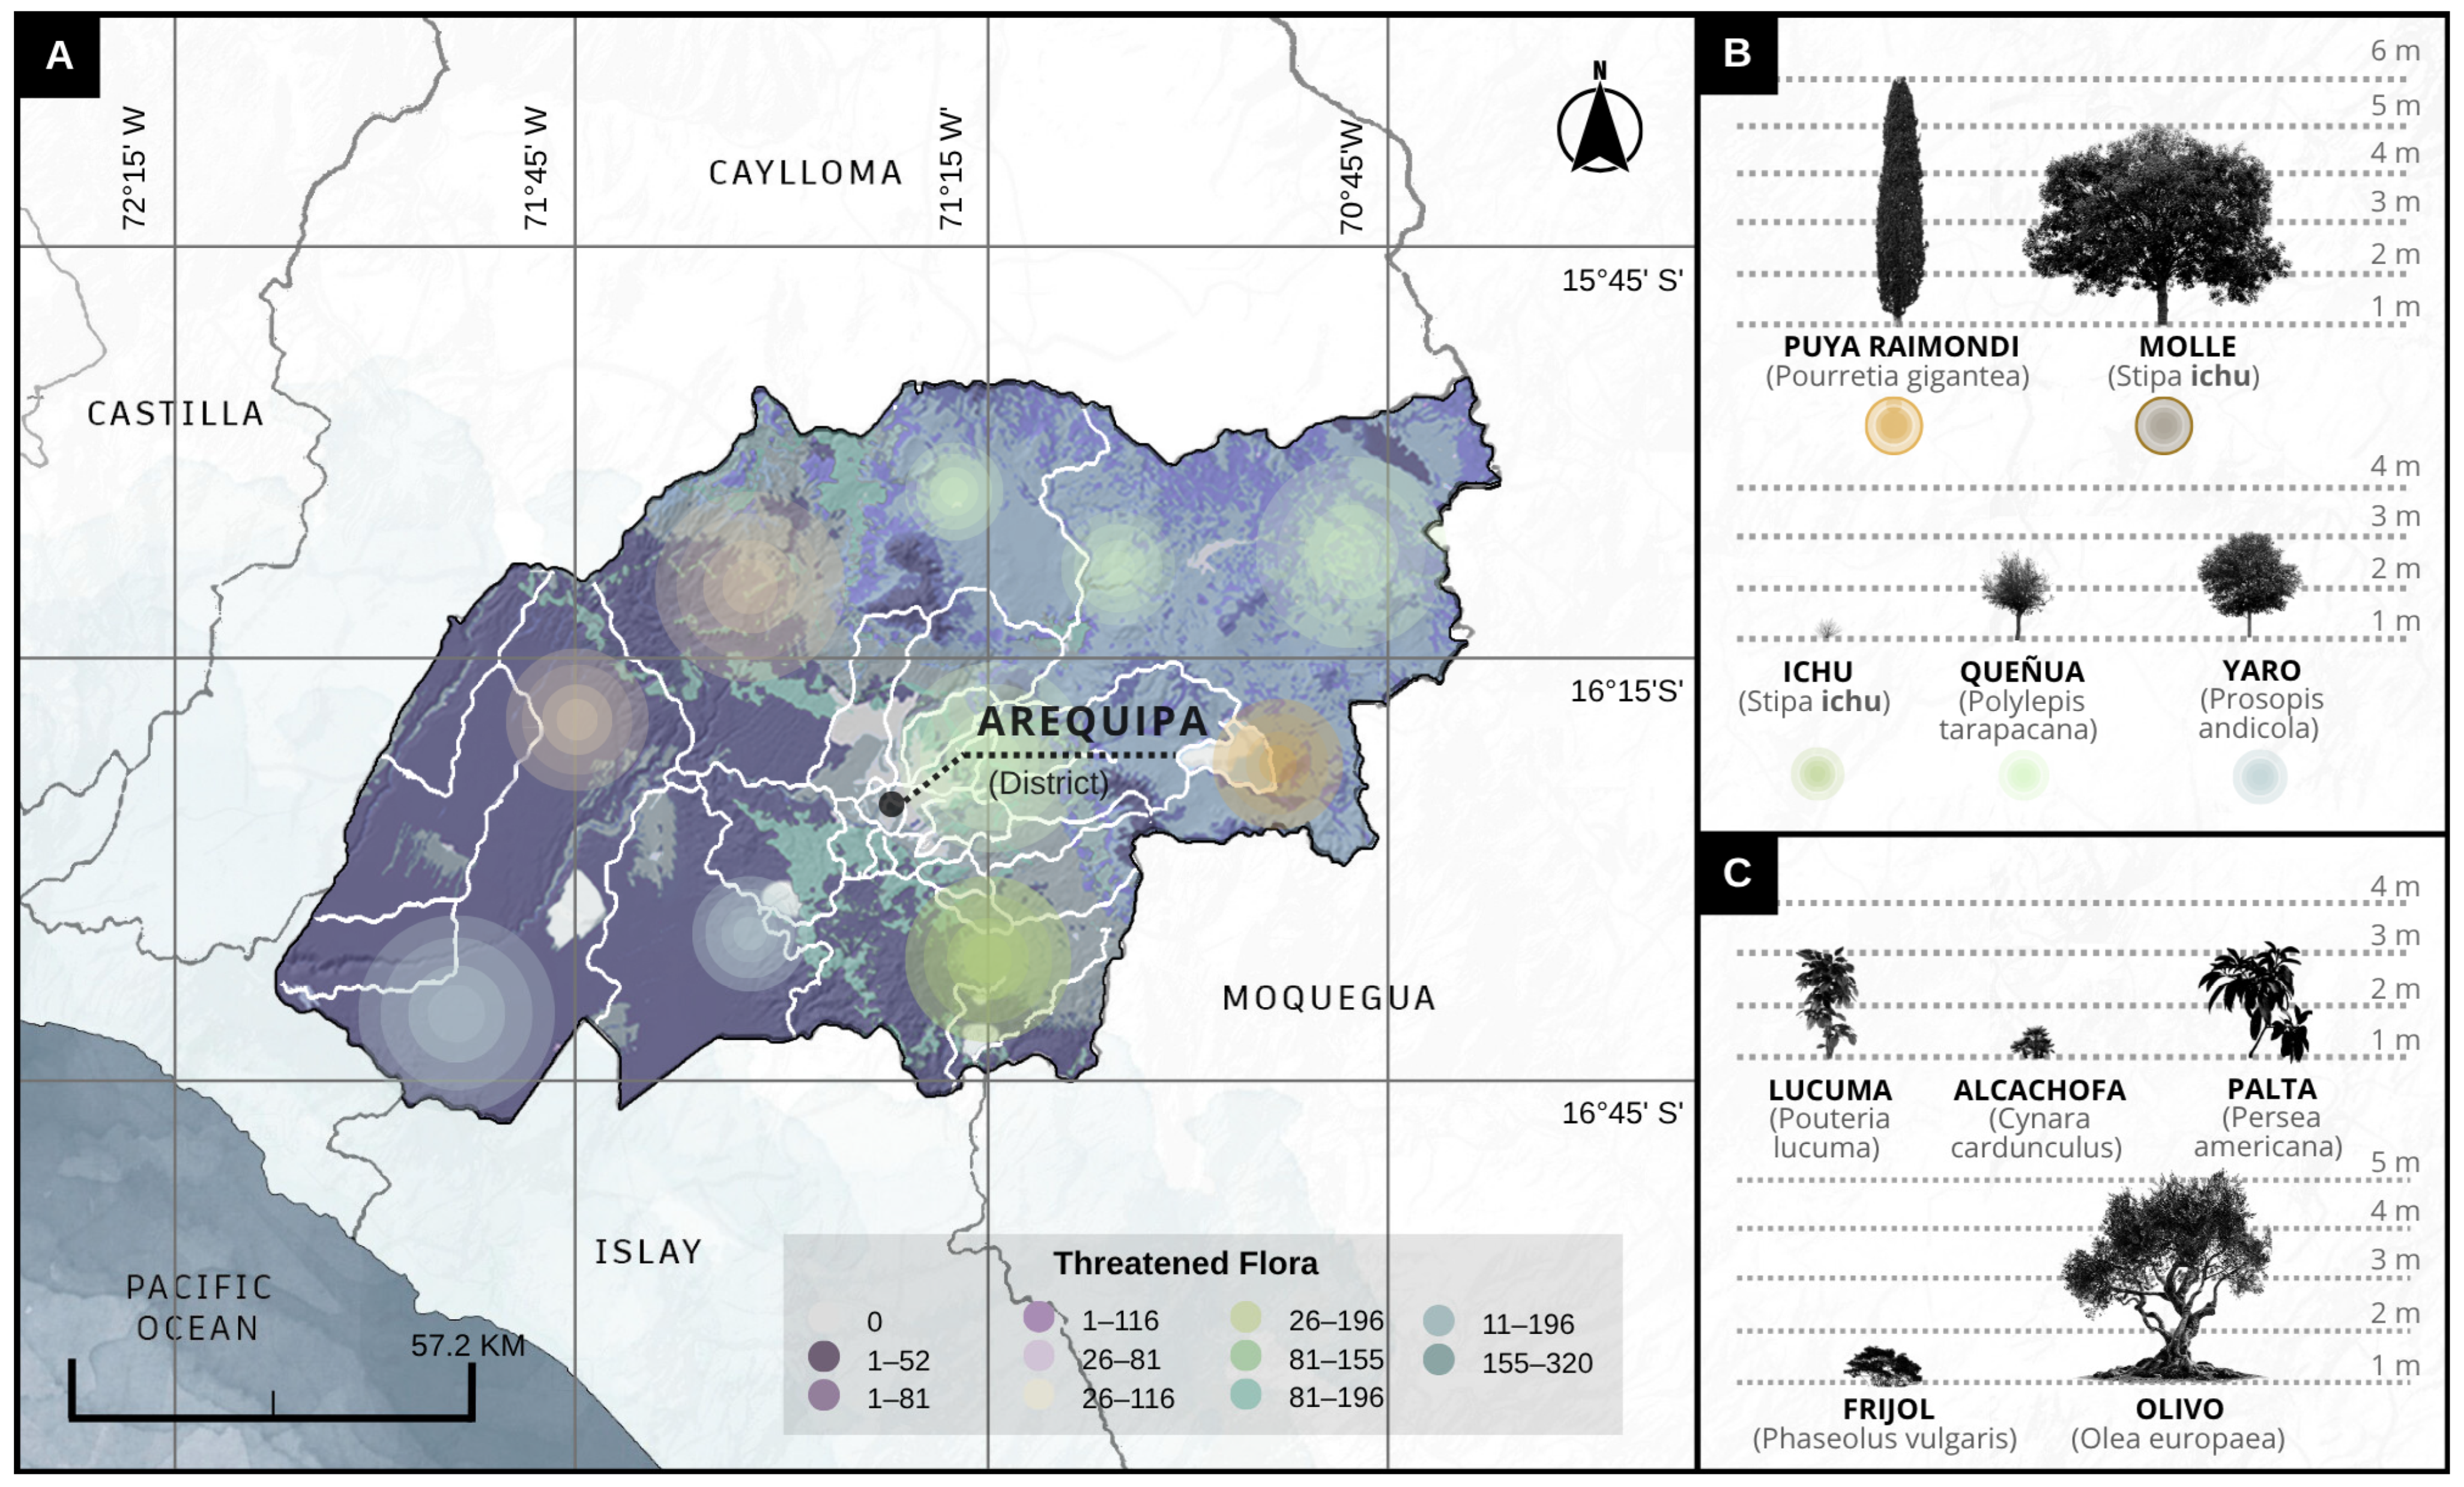
The province of Arequipa hosts a remarkable diversity of flora, as shown in Figure 14A, resulting from the combination of high-Andean and inter-Andean valley ecosystems. Among the most representative native species, illustrated in Figure 14B, are ichu (Jarava ichu), a resilient grass that covers the Andean highlands, and queñua (Polylepis incana), an emblematic tree that forms forests in elevated zones and contributes to water conservation. Alongside them, Puya raimondii stands out for its imposing size and ecological importance, while yaro (Tagetes minuta), also known as huacatay, is an aromatic herb used both in cooking and traditional medicine [69,70].
In the inter-Andean valleys, as shown in Figure 14C, lucuma (Pouteria lucuma) and avocado (Persea americana) are highly valued Andean fruit trees, appreciated for their flavor and nutritional contribution, while common bean (Phaseolus vulgaris) remains a traditional crop essential to the local diet. The artichoke (Cynara scolymus), although an introduced species, has adapted successfully and is valued for its culinary and medicinal properties [70].
Additionally, in the riparian zones and wetlands associated with the Chili River, the presence of totora (Schoenoplectus californicus subsp. tatora) stands out an aquatic species of great ecological and cultural relevance in Arequipa. Its root system contributes to sediment stabilization and the natural purification of water, while its high pollution tolerance (80–90%) and carbon sequestration capacity (up to 1.2 kg CO2·m−2·yr−1) make it a key component for phytoremediation and microclimatic regulation within the proposed green corridor. Moreover, totora holds significant sociocultural value, having been historically used by local communities for crafts, reed boats, and traditional roofing, reinforcing the connection between nature and culture in Arequipa’s territory [71,72].
The distribution of flora in the Arequipa region is strongly influenced by its altitudinal and climatic diversity. In the coastal zone, species adapted to arid climates and saline soils prevail, such as cacti and xerophytic shrubs. As elevation increases toward the inter-Andean valleys, agricultural crops and riparian vegetation appear, while in the high-Andean zones, cold-resistant native flora such as ichu, yareta, and Puya raimondii predominate. In protected areas, such as the Salinas and Aguada Blanca National Reserve, there is a high diversity of plant species representative of high-Andean ecosystems. This geographic variability allows for the wide expansion of both endemic and adapted species, making Arequipa a region of great floristic richness distributed throughout its territory [73,74].
The selection of plant species was based on environmental performance criteria aimed at ensuring their adaptation to Arequipa’s arid and high solar radiation context, as well as their contribution to the ecological functionality of the green corridor. Native or naturalized species were prioritized for their high tolerance to air pollution, low water requirements (below 700 mm/year), and significant carbon sequestration capacity, which are key factors for the sustainability of the landscape system.
Each species was assessed according to its hydric range, carbon capture efficiency, and response to the extreme thermal conditions of the urban environment. Collectively, the selected species show pollution tolerance levels between 30% and 90%, carbon sequestration rates ranging from 0.01 to 1.2 kg CO2·m−2·yr−1, and average monthly water consumption below 3000 L/1000 m2, demonstrating their feasibility under local climatic constraints.
As shown in Table 1, Schinus molle, a structural tree species, stands out for its high pollution resistance (>70%), low water demand (250–600 mm/year), and elevated carbon capture capacity (up to 1.2 kg CO2·m−2·yr−1), also contributing to soil stabilization and shade generation. Jarava ichu, a high-Andean grass, features low water demand (200–400 mm/year) and proven erosion control efficiency, making it essential for slopes and edges. Tagetes minuta, with moderate water requirements (500–700 mm/year), plays a pollinator and phytosanitary role, acting as a natural biological barrier and adding visual diversity to the landscape.
Meanwhile, Puya raimondii, an emblematic Andean species, combines high climatic adaptability (300–500 mm/year) with ecological and cultural significance, reinforcing the connection between landscape and local identity. Finally, Schoenoplectus californicus subsp. tatora, a wetland species with pollution tolerance exceeding 80% and high phytoremediation capacity, is used in the humid areas of the corridor to promote water purification and microclimatic regulation.

2.6.2. Fauna

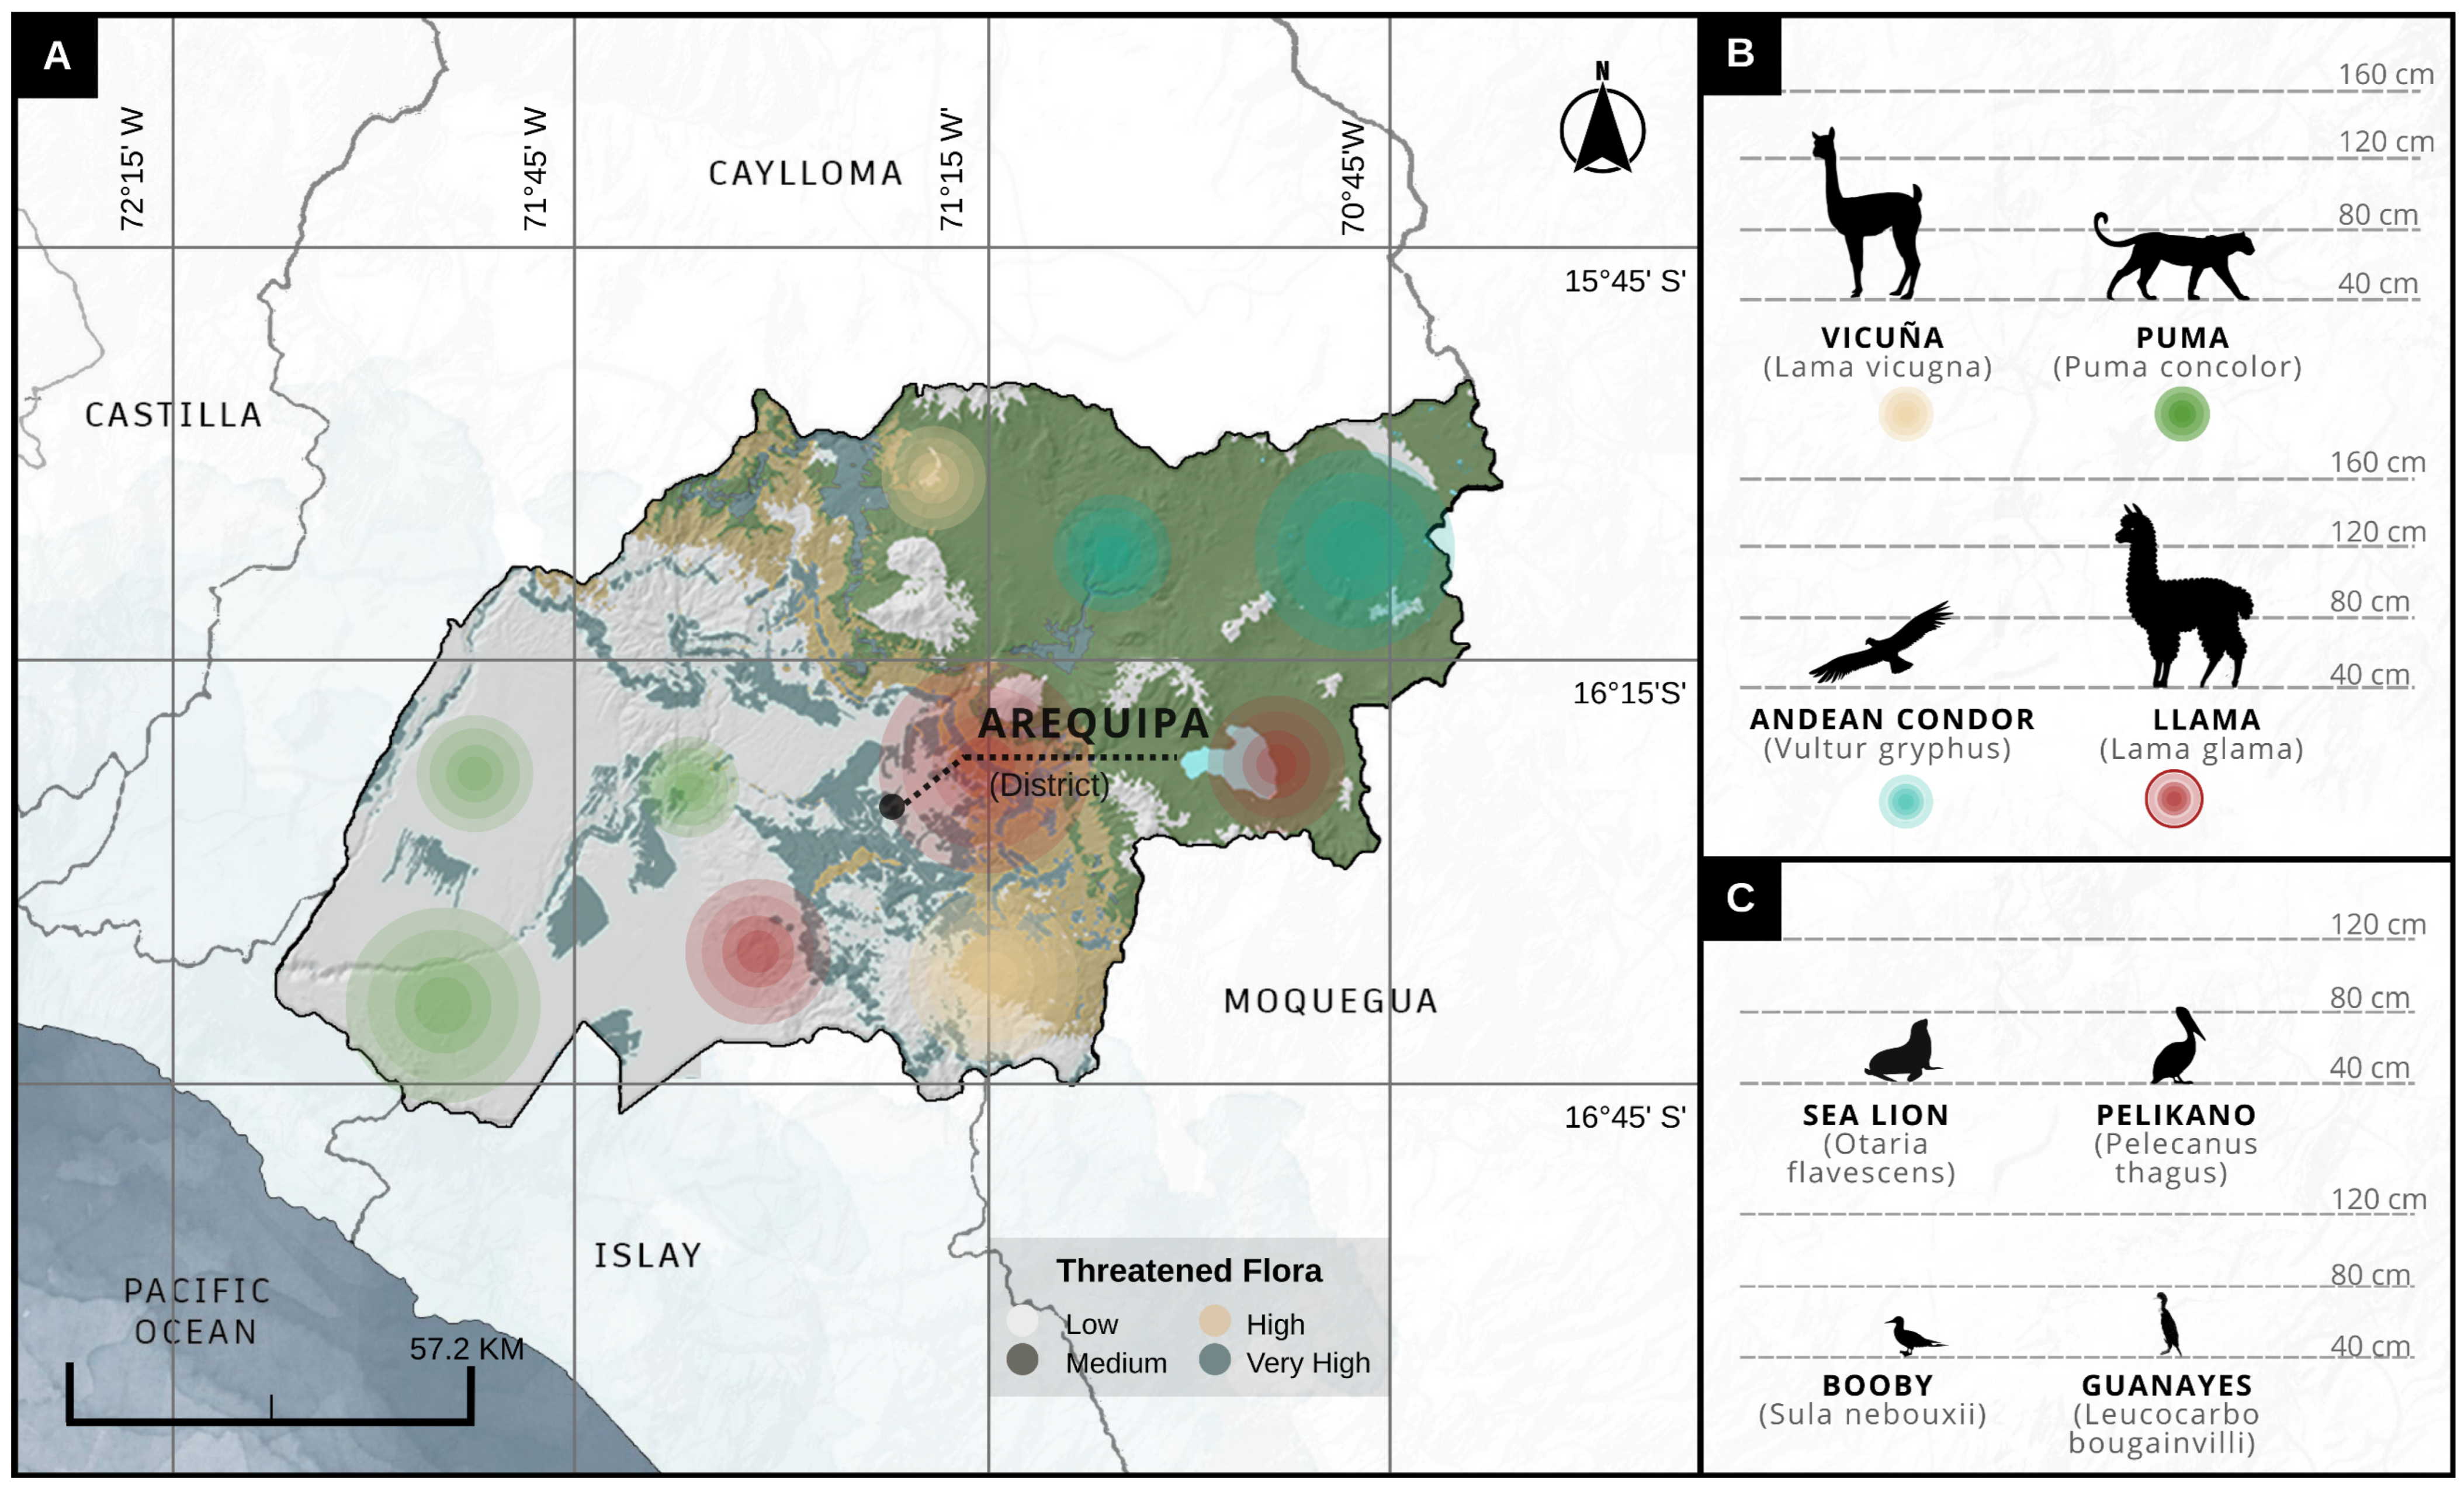
The fauna of the province of Arequipa is diverse and well adapted to its varied ecosystems, as shown in Figure 15A. In the high-Andean zones, illustrated in Figure 15B, the vicuña stands out, a camelid species protected in reserves such as Salinas and Aguada Blanca, alongside the Andean condor, which soars over the skies of the Colca Canyon. The puma acts as a key predator in mountain ecosystems, while the llama and the taruca, a deer classified as a critically endangered species, reflect the richness of Andean fauna [90].
In the coastal areas, shown in Figure 15C, sea lions and marine birds, such as the Peruvian pelican, booby, and guanay cormorant, thrive thanks to the influence of the Humboldt Current. Species such as the viscacha inhabit rocky terrains, and the Andean fox plays an essential ecological role as a rodent controller. This biodiversity, which includes more than 300 species of birds and mammals adapted to deserts, mountains, and wetlands, positions Arequipa as a unique biological corridor [91]. Consequently, the design of the green corridor aims to maintain habitat connectivity and reduce pressure on key species as part of its ecosystem service objectives.
Therefore, the design of the proposed corridor integrates the movement requirements of key wildlife species, identified through habitat suitability models for species such as the vicuña, Andean condor, puma, taruca, and Andean fox. The corridor widths and vegetation structures were determined to support the documented movement patterns and ecological needs of each species, ensuring functional continuity between high-Andean, inter-Andean, and coastal ecosystems.
As summarized in Table 2, the Andean condor and puma require the widest movement corridors, ranging from 1000 to 3000 m, characterized by open areas with native vegetation and rugged topography. In contrast, species such as the vicuña and taruca can maintain connectivity through narrower strips of high-Andean grasslands and shrublands, between 500 and 1500 m wide. The Andean fox, being more adaptable, uses rocky terrains and shrublands within corridors of 300 to 1000 m. Meanwhile, marine species such as the sea lion depend on protected coastal habitats with extensive sandy or rocky zones, rather than vegetated corridors, highlighting the diversity of ecological strategies incorporated into the corridor’s design.

3. Results

3.1. Project Location

The project is located in the district of Arequipa, at an approximate altitude of 2300 m above sea level, in an area adjacent to the Chili River (16°24′16″ S, 71°32′43″ W). Figure 16A illustrates the relationship between the intervention site, the hydrological system, and the existing treatment plant, allowing an understanding of the critical point where pollutant discharge begins and how the project integrates with the sanitation infrastructure of the metropolitan area of Arequipa.
Meanwhile, Figure 16B shows the location of the proposed green corridor, which incorporates natural phytoremediation strategies through the inclusion of plant species with a high capacity for pollutant absorption and transformation. This corridor functions as an ecological extension of the treatment system, promoting the progressive purification of water and the landscape regeneration of the surrounding environment [93].
Likewise, the Chili River exhibits a high level of pollution as a result of waste generated by urban expansion and industrial discharges. Recent evaluations have reported lead concentrations around 0.12 mg/L, exceeding the Peruvian Environmental Quality Standards for surface waters (0.05 mg/L). Mercury is present in trace concentrations, generally below 0.01 mg/L in sediments, while nitrate levels, derived from agricultural runoff and domestic sources, contribute significantly to the eutrophication of the aquatic system.
As shown in Table 3, the main contaminants identified in the Chili River, along with their concentrations, additional observations, and proposed phytoremediation measures, highlight the need for a comprehensive approach to the environmental recovery of the basin. Following the identification of the pollution source node, a wastewater treatment plant is proposed as a structural measure to mitigate environmental impacts and preserve the ecological health of the Chili River.

3.2. Urban Analysis

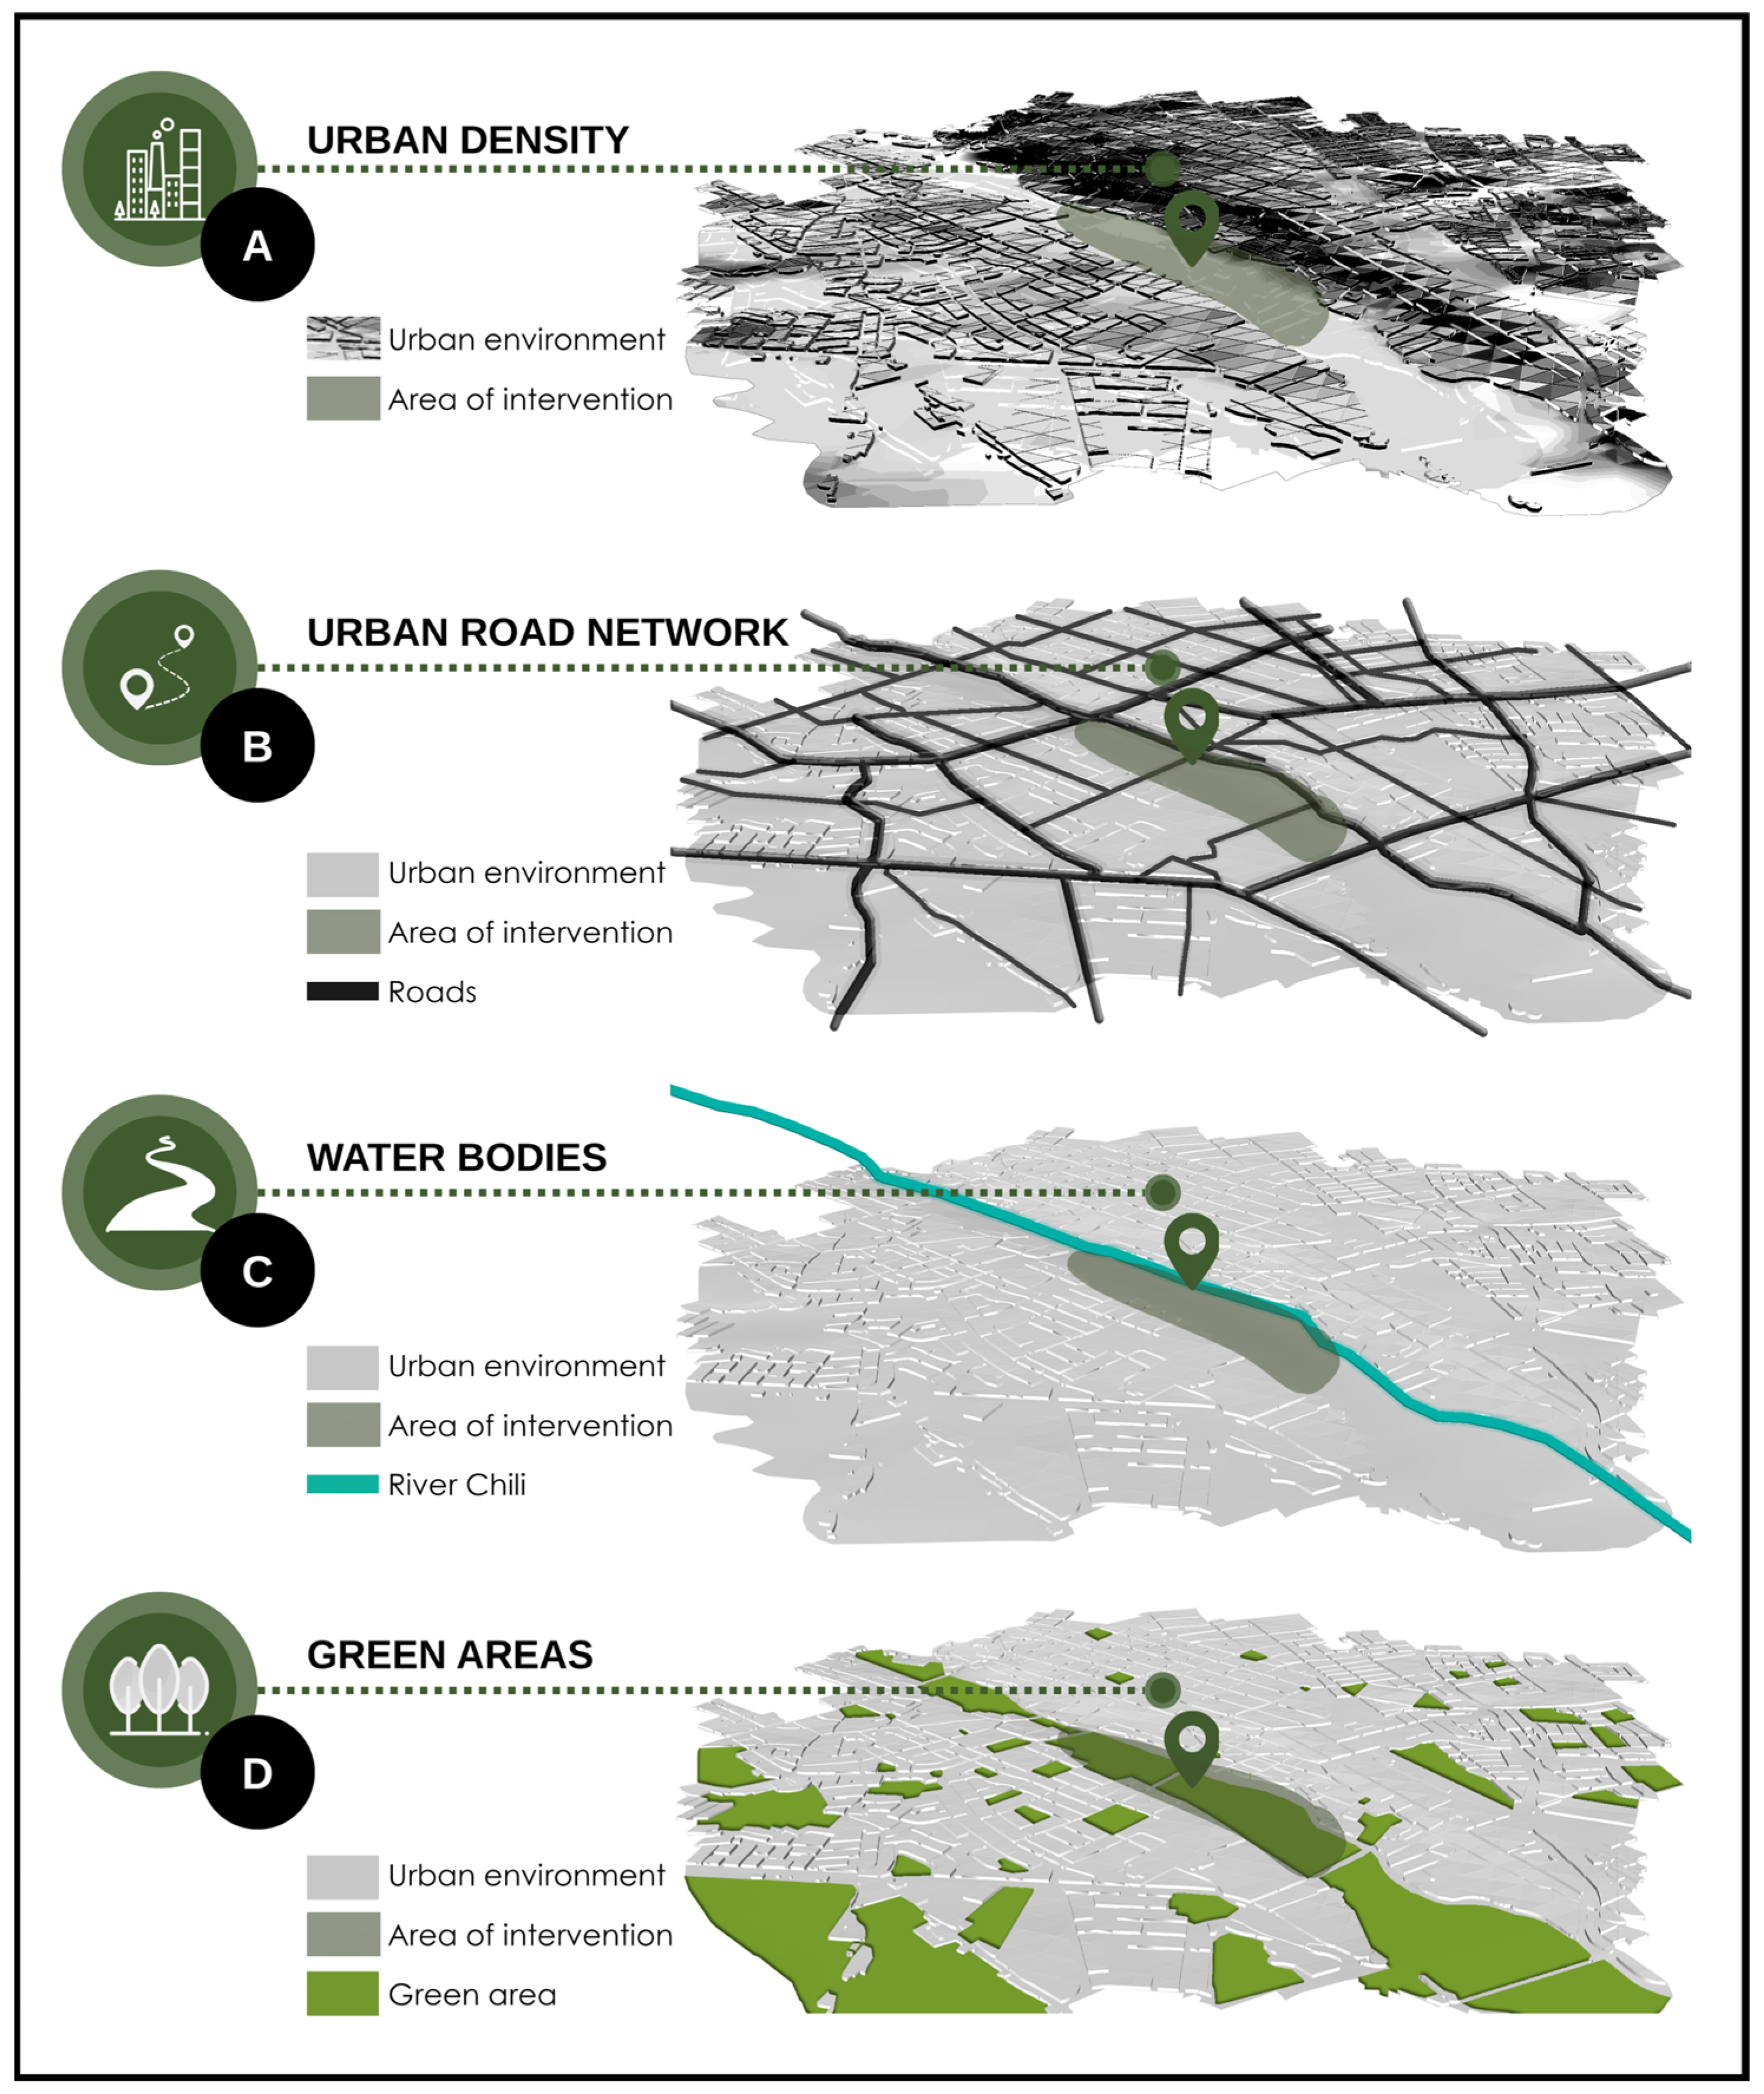
The urban analysis of Arequipa identified four key indicators for the project’s location, integrating both the physical conditions of the territory and its social, ecological, and cultural dynamics.
The first indicator refers to the urban density along the Chili River, which creates a sort of “virtual wall” that interrupts the continuity of the urban fabric, as shown in Figure 17A. This concentration of buildings, resulting from uncoordinated urban growth, not only limits ecological and visual connectivity with the river but also reflects a social and symbolic segmentation between sectors on either bank. In this context, the selected area is conceived as a point of urban reconciliation, where the proposed green corridor seeks to restore the population’s relationship with the river and reclaim its value as a public space connecting both shores.
The second indicator corresponds to the urban road network, which exhibits a degree of structural fragmentation, as shown in Figure 17B. The mobility network is predominantly oriented parallel to the river, with limited cross connections, generating functional and social discontinuities. This diagnosis highlights the need to reconfigure the road system so that the green corridor operates as an articulating axis, connecting the hydrological system with residential and productive areas. In this way, the project promotes more sustainable and equitable mobility, enhancing accessibility and social integration within the study area.
The third component of analysis is the Chili River itself, illustrated in Figure 17C, which constitutes a structuring element of the urban landscape and a symbol of Arequipa’s collective identity. However, the degradation of its banks and the pollution of its waters have eroded both its ecological and cultural roles. The project therefore seeks to revalue the river as a vital axis of the territory, restoring its environmental function and recovering its symbolic dimension through renaturalization strategies and social appropriation of the riverine space.
Finally, the fourth indicator relates to the distribution of urban green areas, which are currently dispersed and functionally disconnected, as shown in Figure 17D. This fragmentation limits their ecological capacity and social usability. In response, the proposal envisions a continuous green infrastructure network, concentrated mainly along the central strip adjacent to the Chili River, aimed at structuring public space, improving microclimatic conditions, and consolidating an integrated socio-ecological system that strengthens the relationship between the community and its natural environment.
In summary, the urban analysis of Arequipa reveals a territory characterized by the coexistence of ecological potentials and urban tensions resulting from historical processes of unequal expansion. The simultaneous interpretation of these environmental, social, and cultural dimensions allows the green corridor to be conceived not only as a landscape intervention but also as a territorial regeneration strategy, aimed at reconstructing collective identity and urban resilience through the reconnection of the city with its river.

3.3. Conceptualization

The design of the green corridor is based on technical strategies suitable for the semi-arid and high-Andean context of Arequipa, aiming to maximize ecological and social resilience in the territory. In this regard, integration with the urban hydrological system is prioritized through three parallel strips along the Chili River. First, a riparian ecological strip incorporates phytogardens designed for the natural purification of water; second, a central green corridor functions as a sustainable mobility axis, connecting pedestrian and cycling routes; and finally, a transformation strip houses workshops and a biogas plant, representing the active energy of the territory.
Additionally, the orientation and layout of the complex respond to a comprehensive climatic analysis, considering intense solar radiation, thermal variations, wind patterns, and local topography. These variables allow for the optimization of natural ventilation and passive energy capture, reducing the need for mechanical climate control. Likewise, local materials with high thermal inertia are employed, alongside efficient irrigation and rainwater harvesting systems and drought-tolerant native plant species, forming a self-sufficient green infrastructure that is symbiotic with its environmental and social surroundings.
Beyond its technical dimension, the project establishes a deep connection with local cultural heritage through the reinterpretation of the Chili River myth. According to tradition, the river originates from the tears of the impossible love between the Misti and Chachani volcanoes, guardians of the Arequipa valley. Based on this ancestral narrative, the project conceptualizes a “vital flow between volcanoes,” in which the Chili River becomes the articulating axis of space and a symbol of balance between nature and culture.
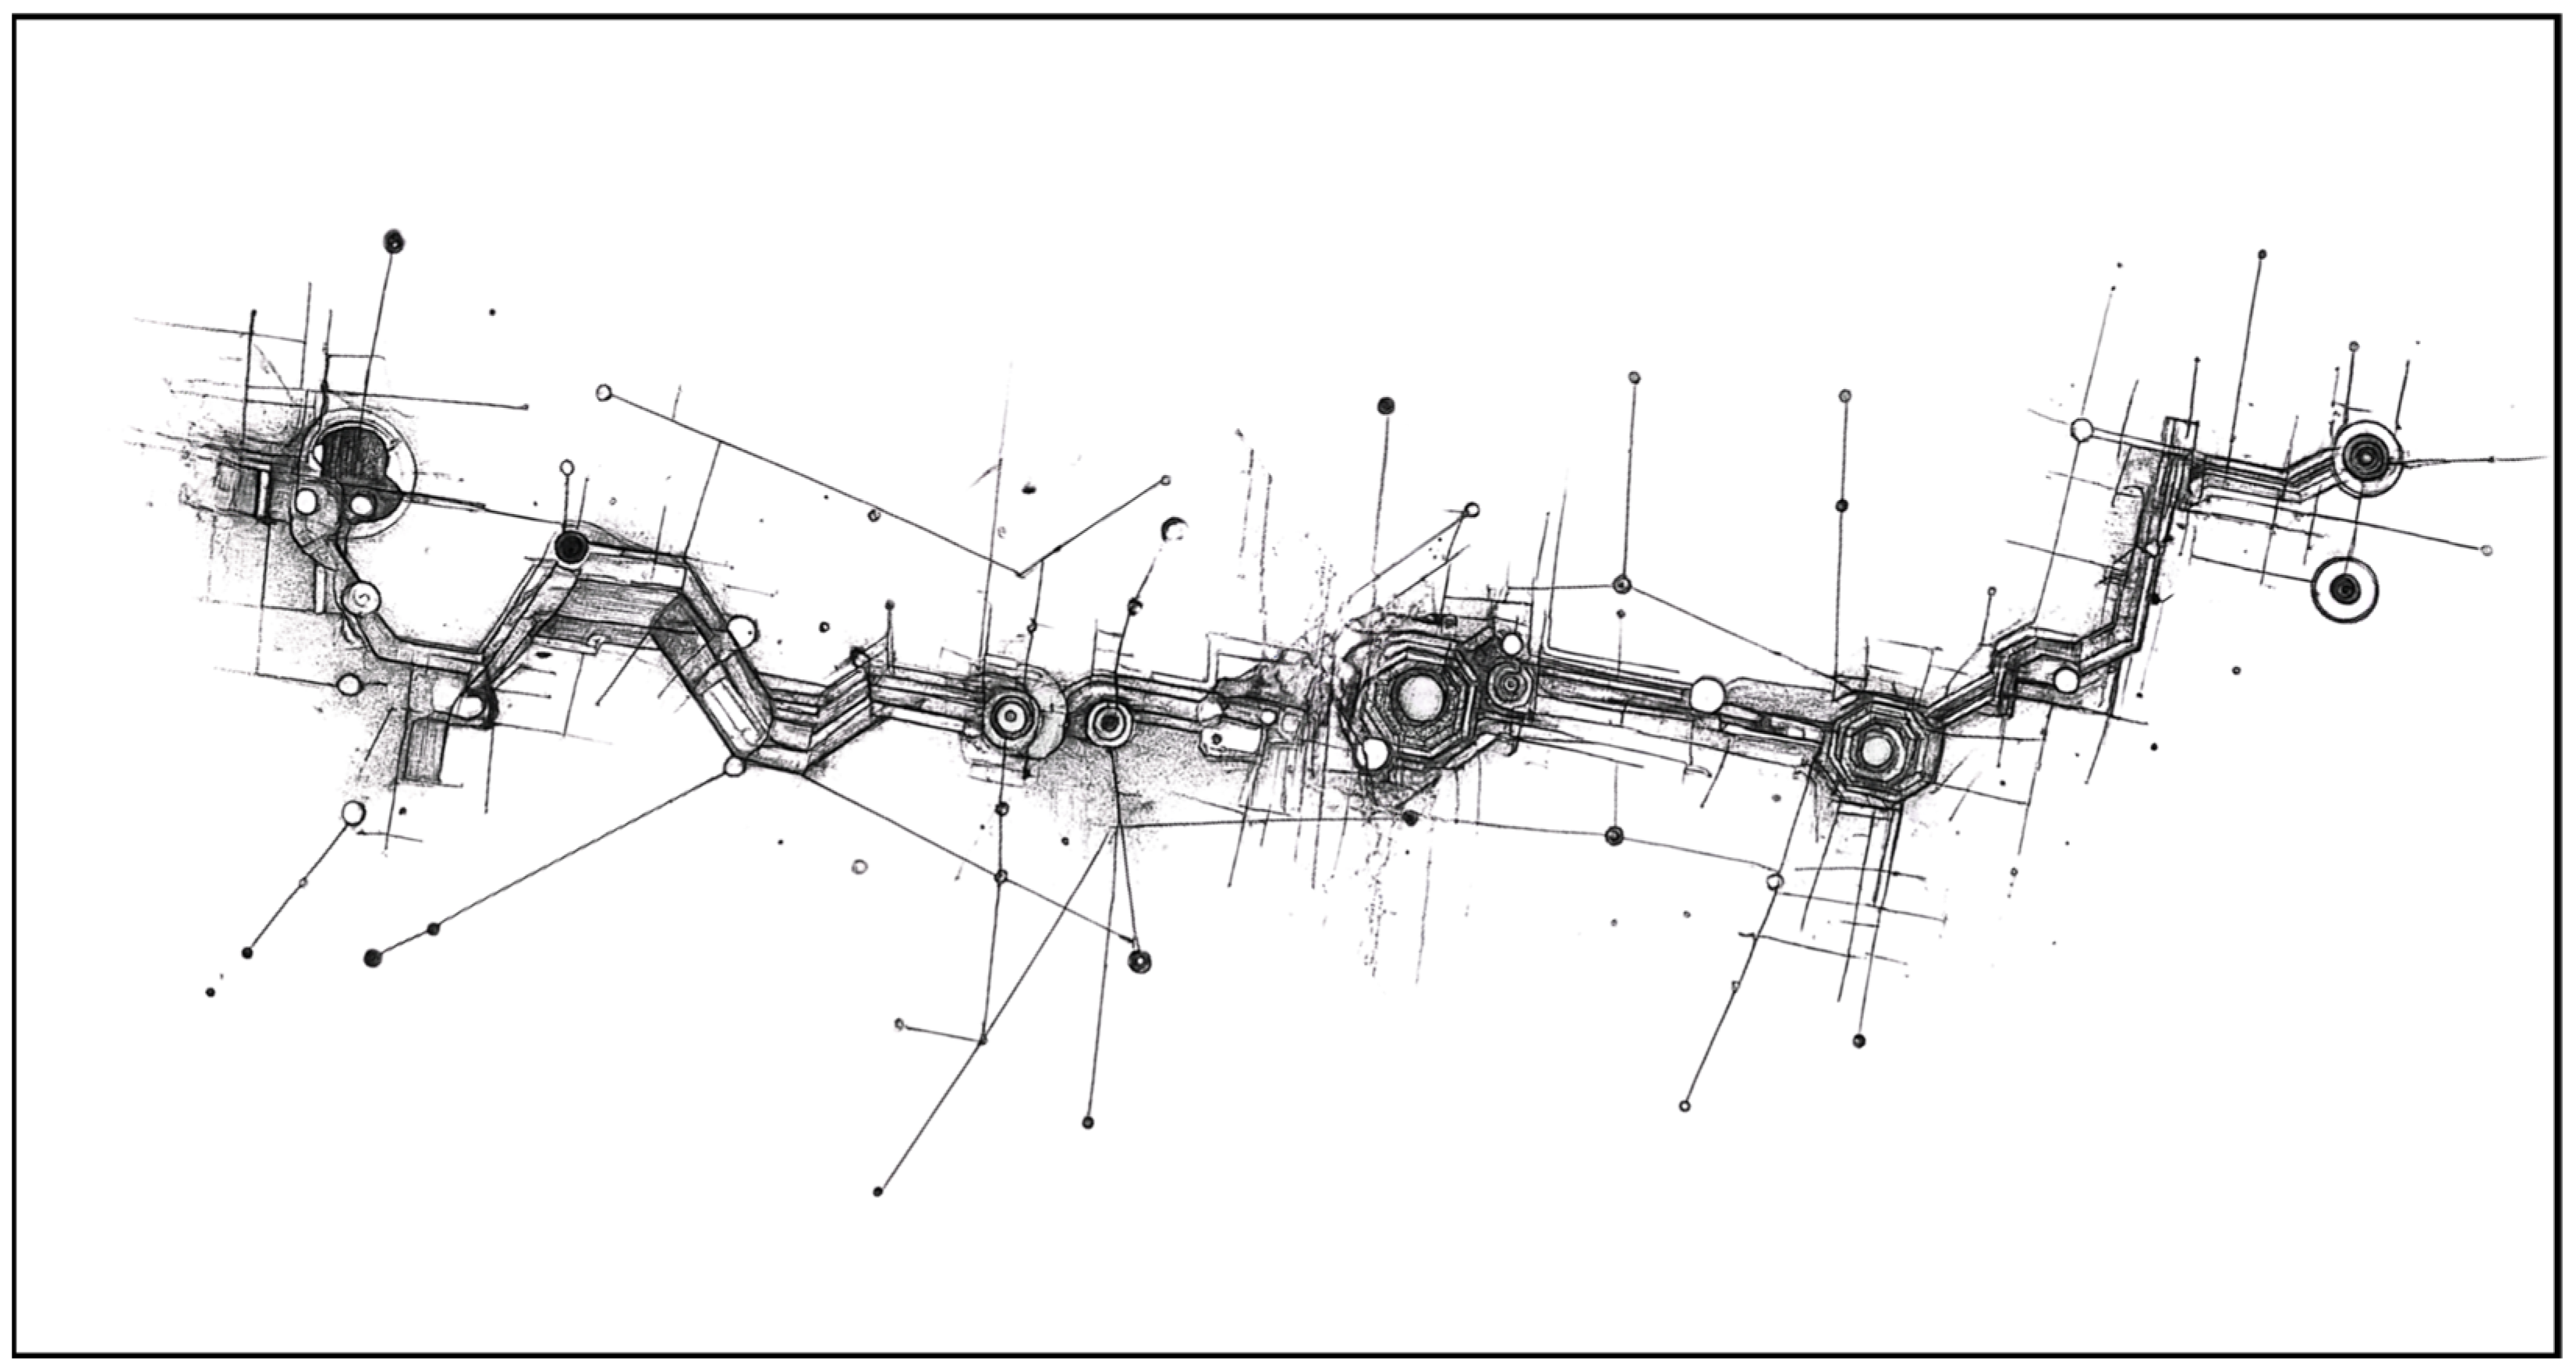
As illustrated in Figure 18, this concept is realized in the spatial organization of the corridor, structured in three parallel strips along the Chili River that translate the myth into a tangible territorial proposal. The ecological strip represents the flow of water and purification, with organic-shaped phytogardens evoking the current and ecosystem regeneration. The central green corridor functions as a symbolic channel and sustainable mobility axis, integrating pedestrian and cycling paths with public areas and native vegetation. The transformation strip, located farther from the river, concentrates productive spaces such as community workshops and a biogas plant, expressed through modular and tectonic geometries that allude to the inner energy of the volcanic territory.
In coherence with this concept, the architecture is conceived as an extension of the landscape, combining fluid and modular forms according to use: organic forms represent the flow of water and purification; open modular forms symbolize the collective and dynamic energy of the community; and compact semi-buried forms express the transformative force of the volcanic subsoil.
In summary, the project fuses technical rigor with an emotional and territorial narrative, achieving an integral proposal that articulates myth, nature, and sustainability. Thus, the green corridor not only responds to environmental and urban criteria, but also reinterprets the territory from a cultural perspective, strengthening local identity and promoting a symbiotic relationship between humans and their environment.

3.4. Master Plan and Zoning

The project sets out to create a social and cultural axis that revitalizes the identity of Arequipa, transforming an area marked by urban disorder into a dynamic, integrated, and comfortable space. The proposal seeks to articulate local culture through the recovery of traditional practices such as dance and gastronomy, while conserving and revaluing the native flora and fauna of the area. This approach materializes in a structural axis that connects various facilities complementary to the Chili River, generating an active link between the natural environment and urban dynamics.
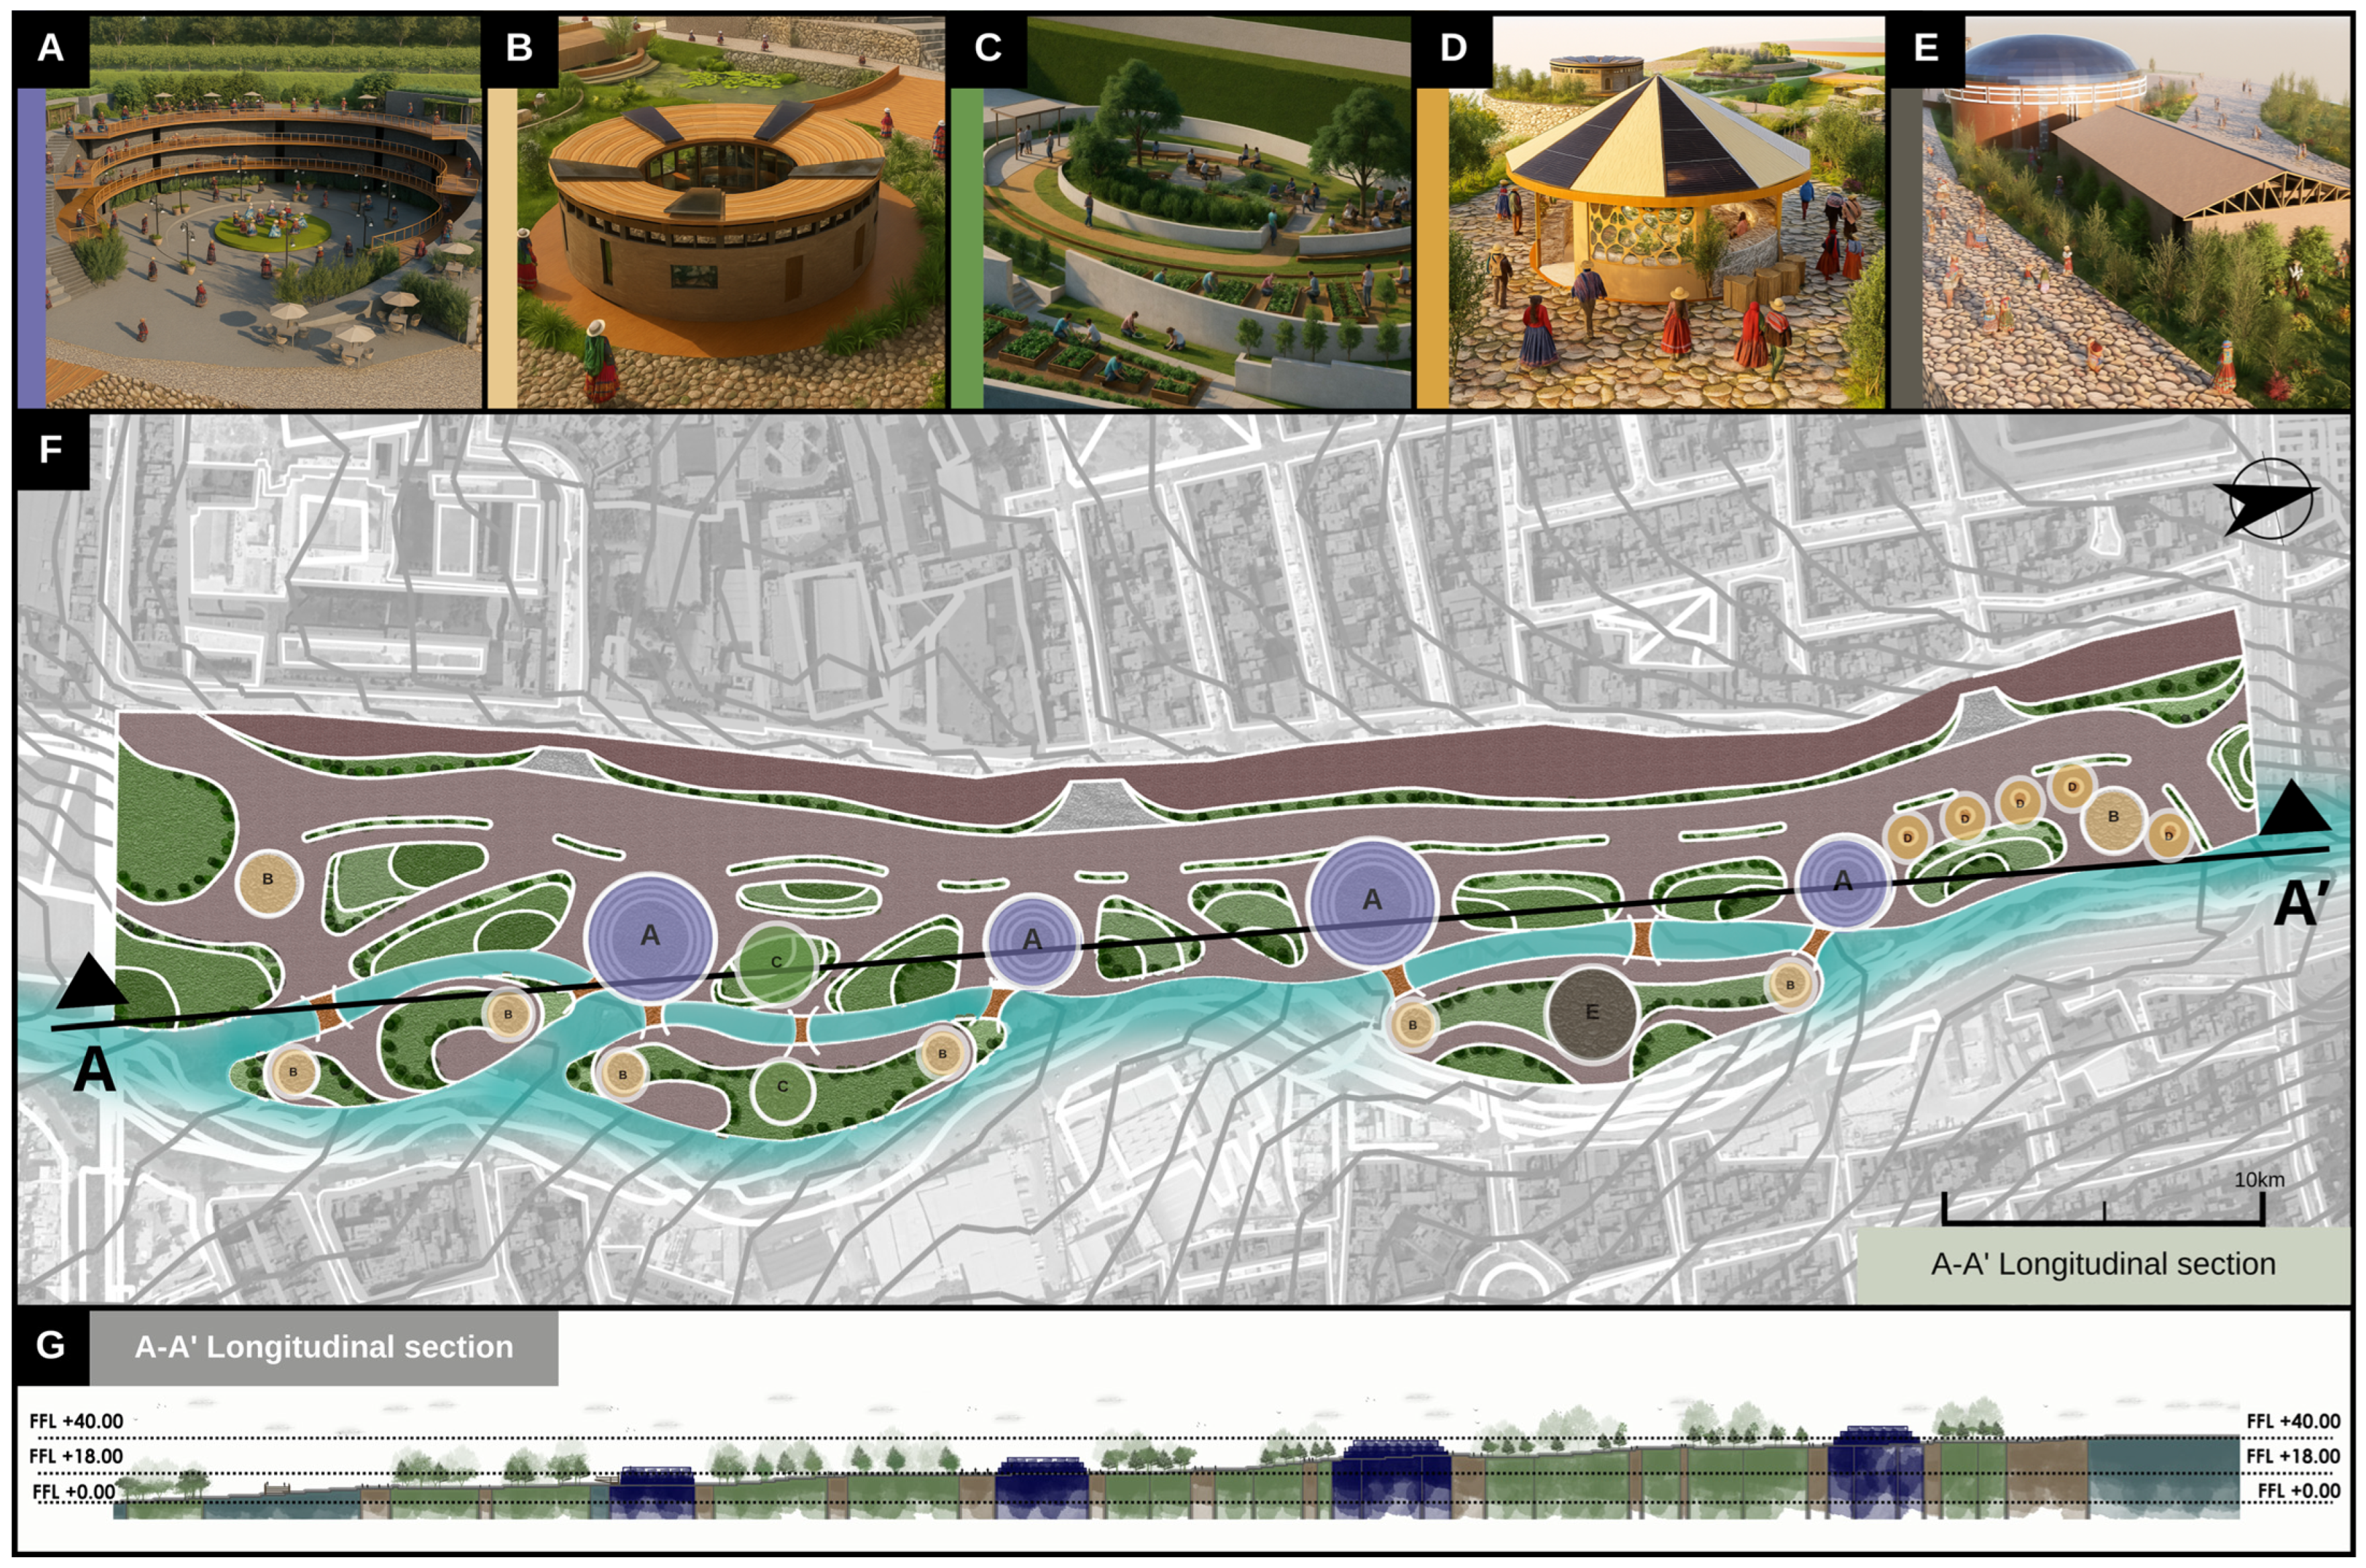
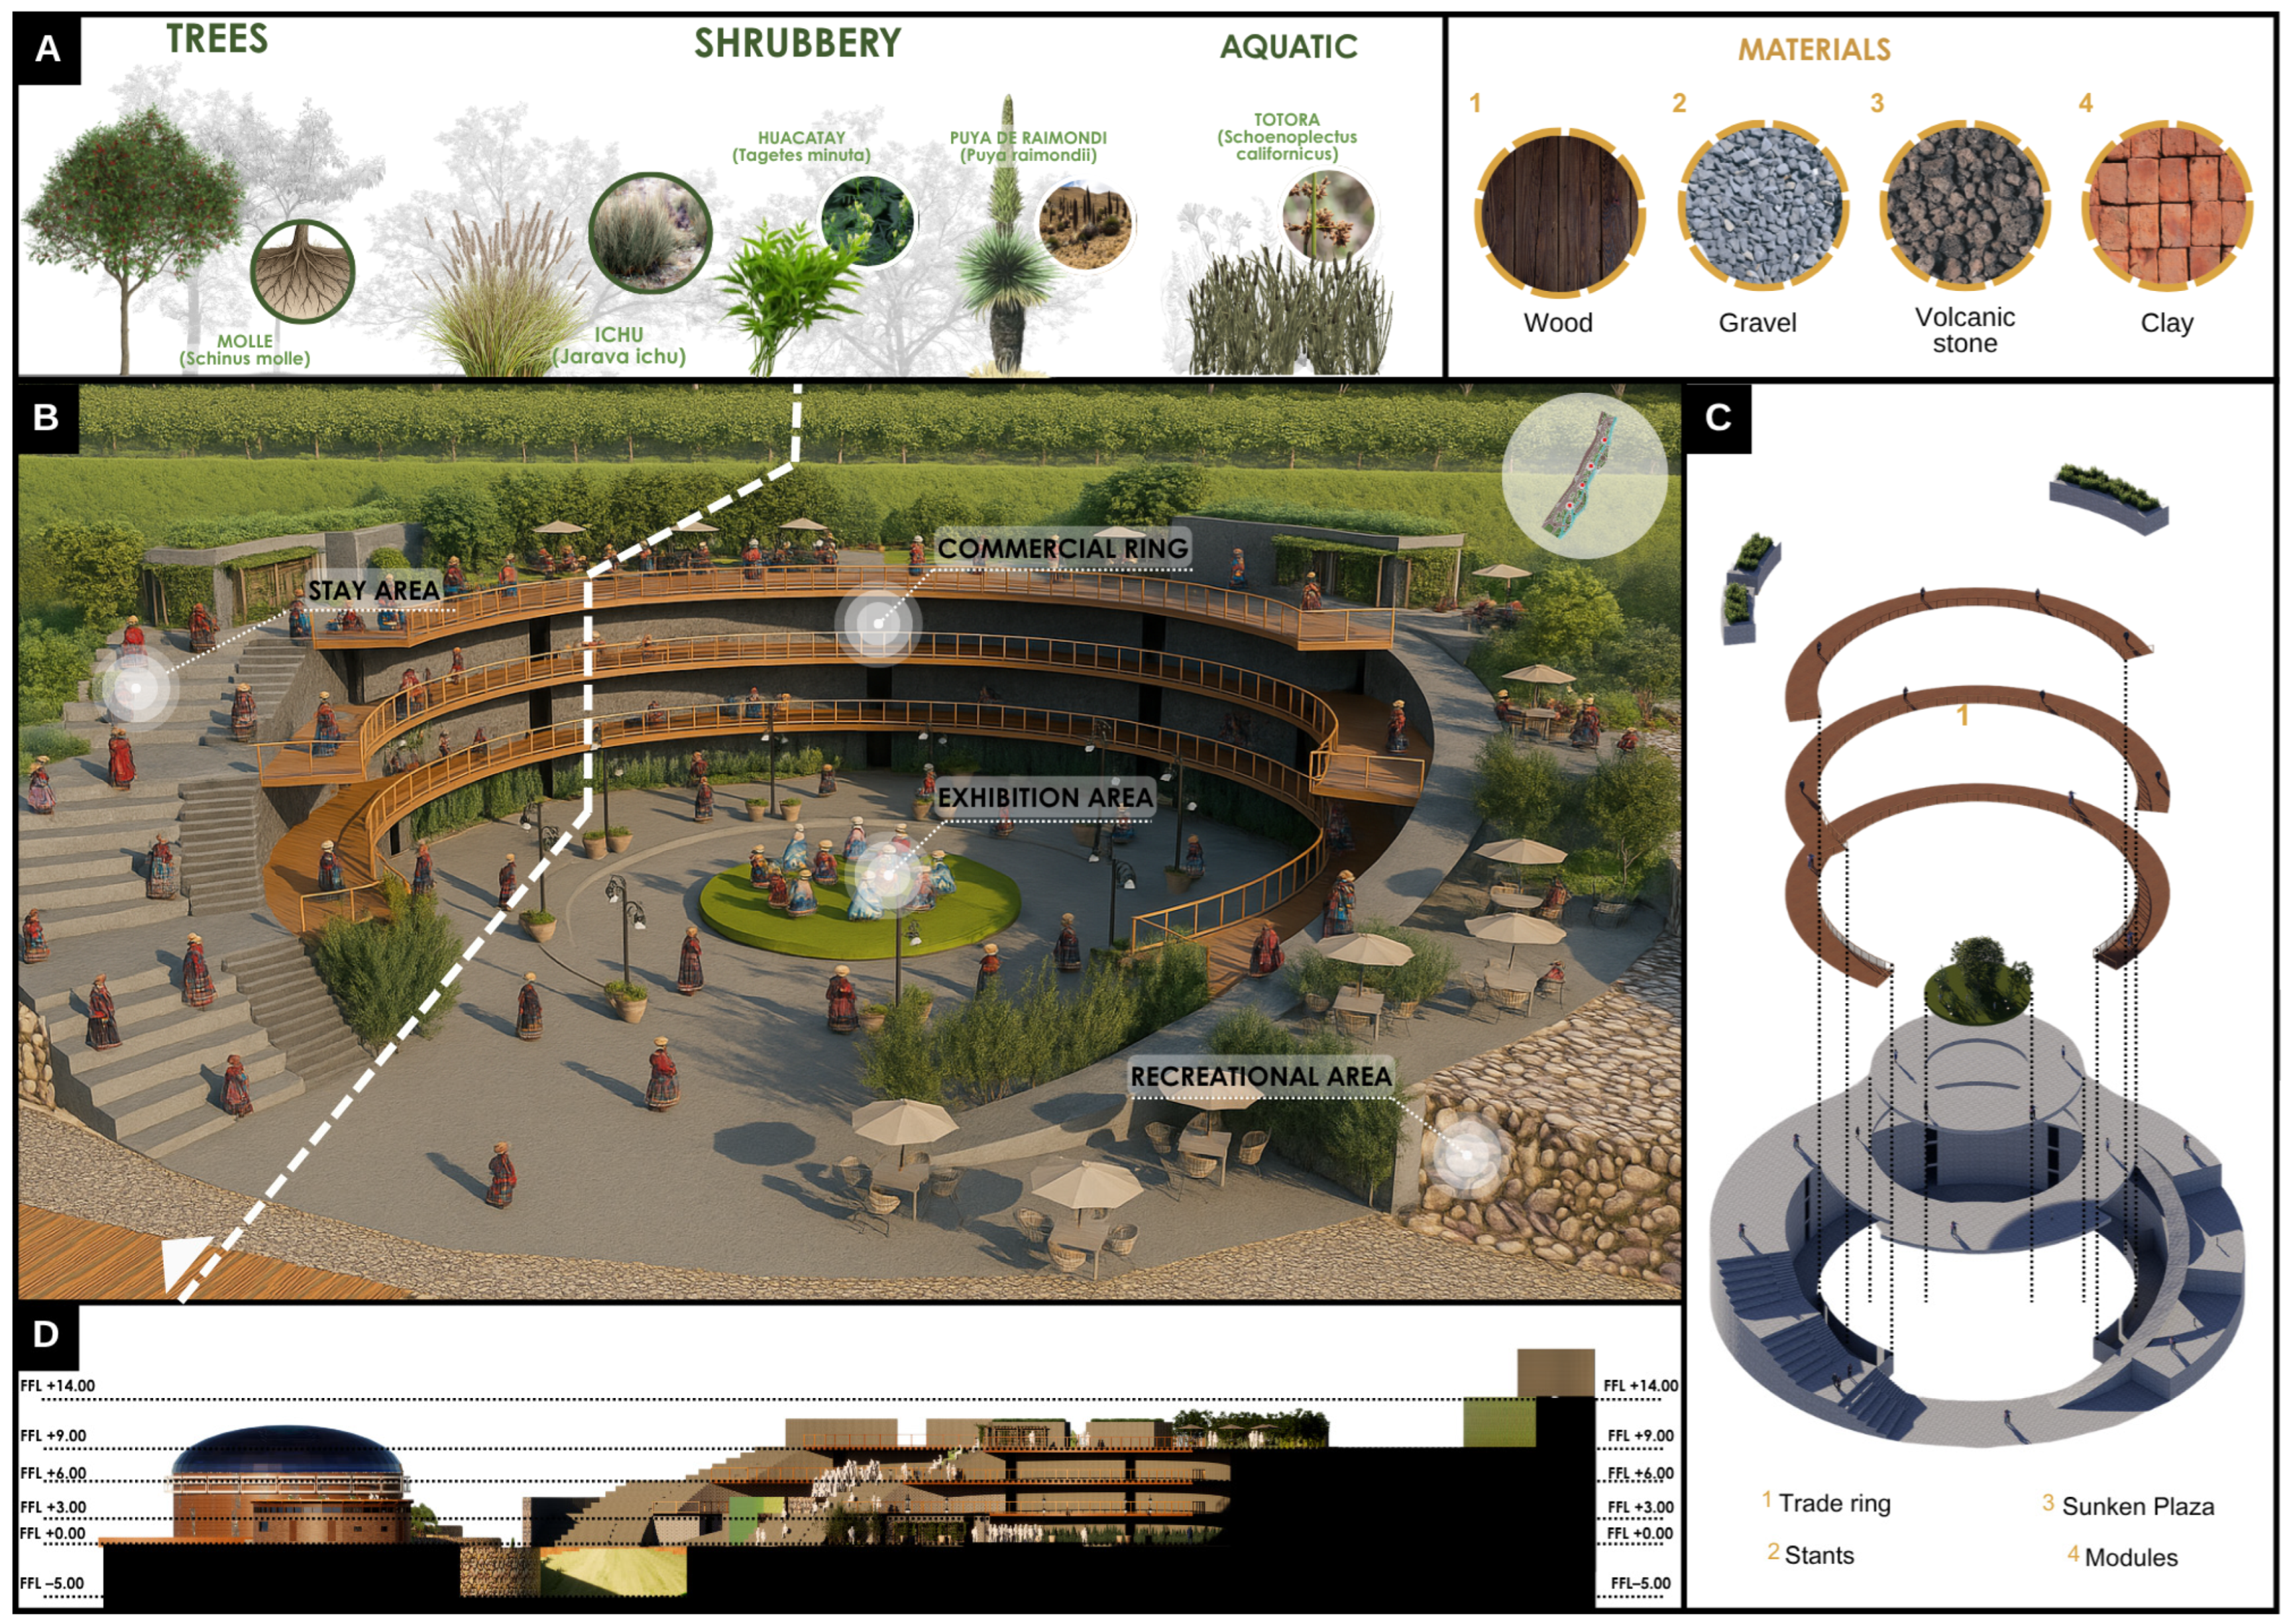
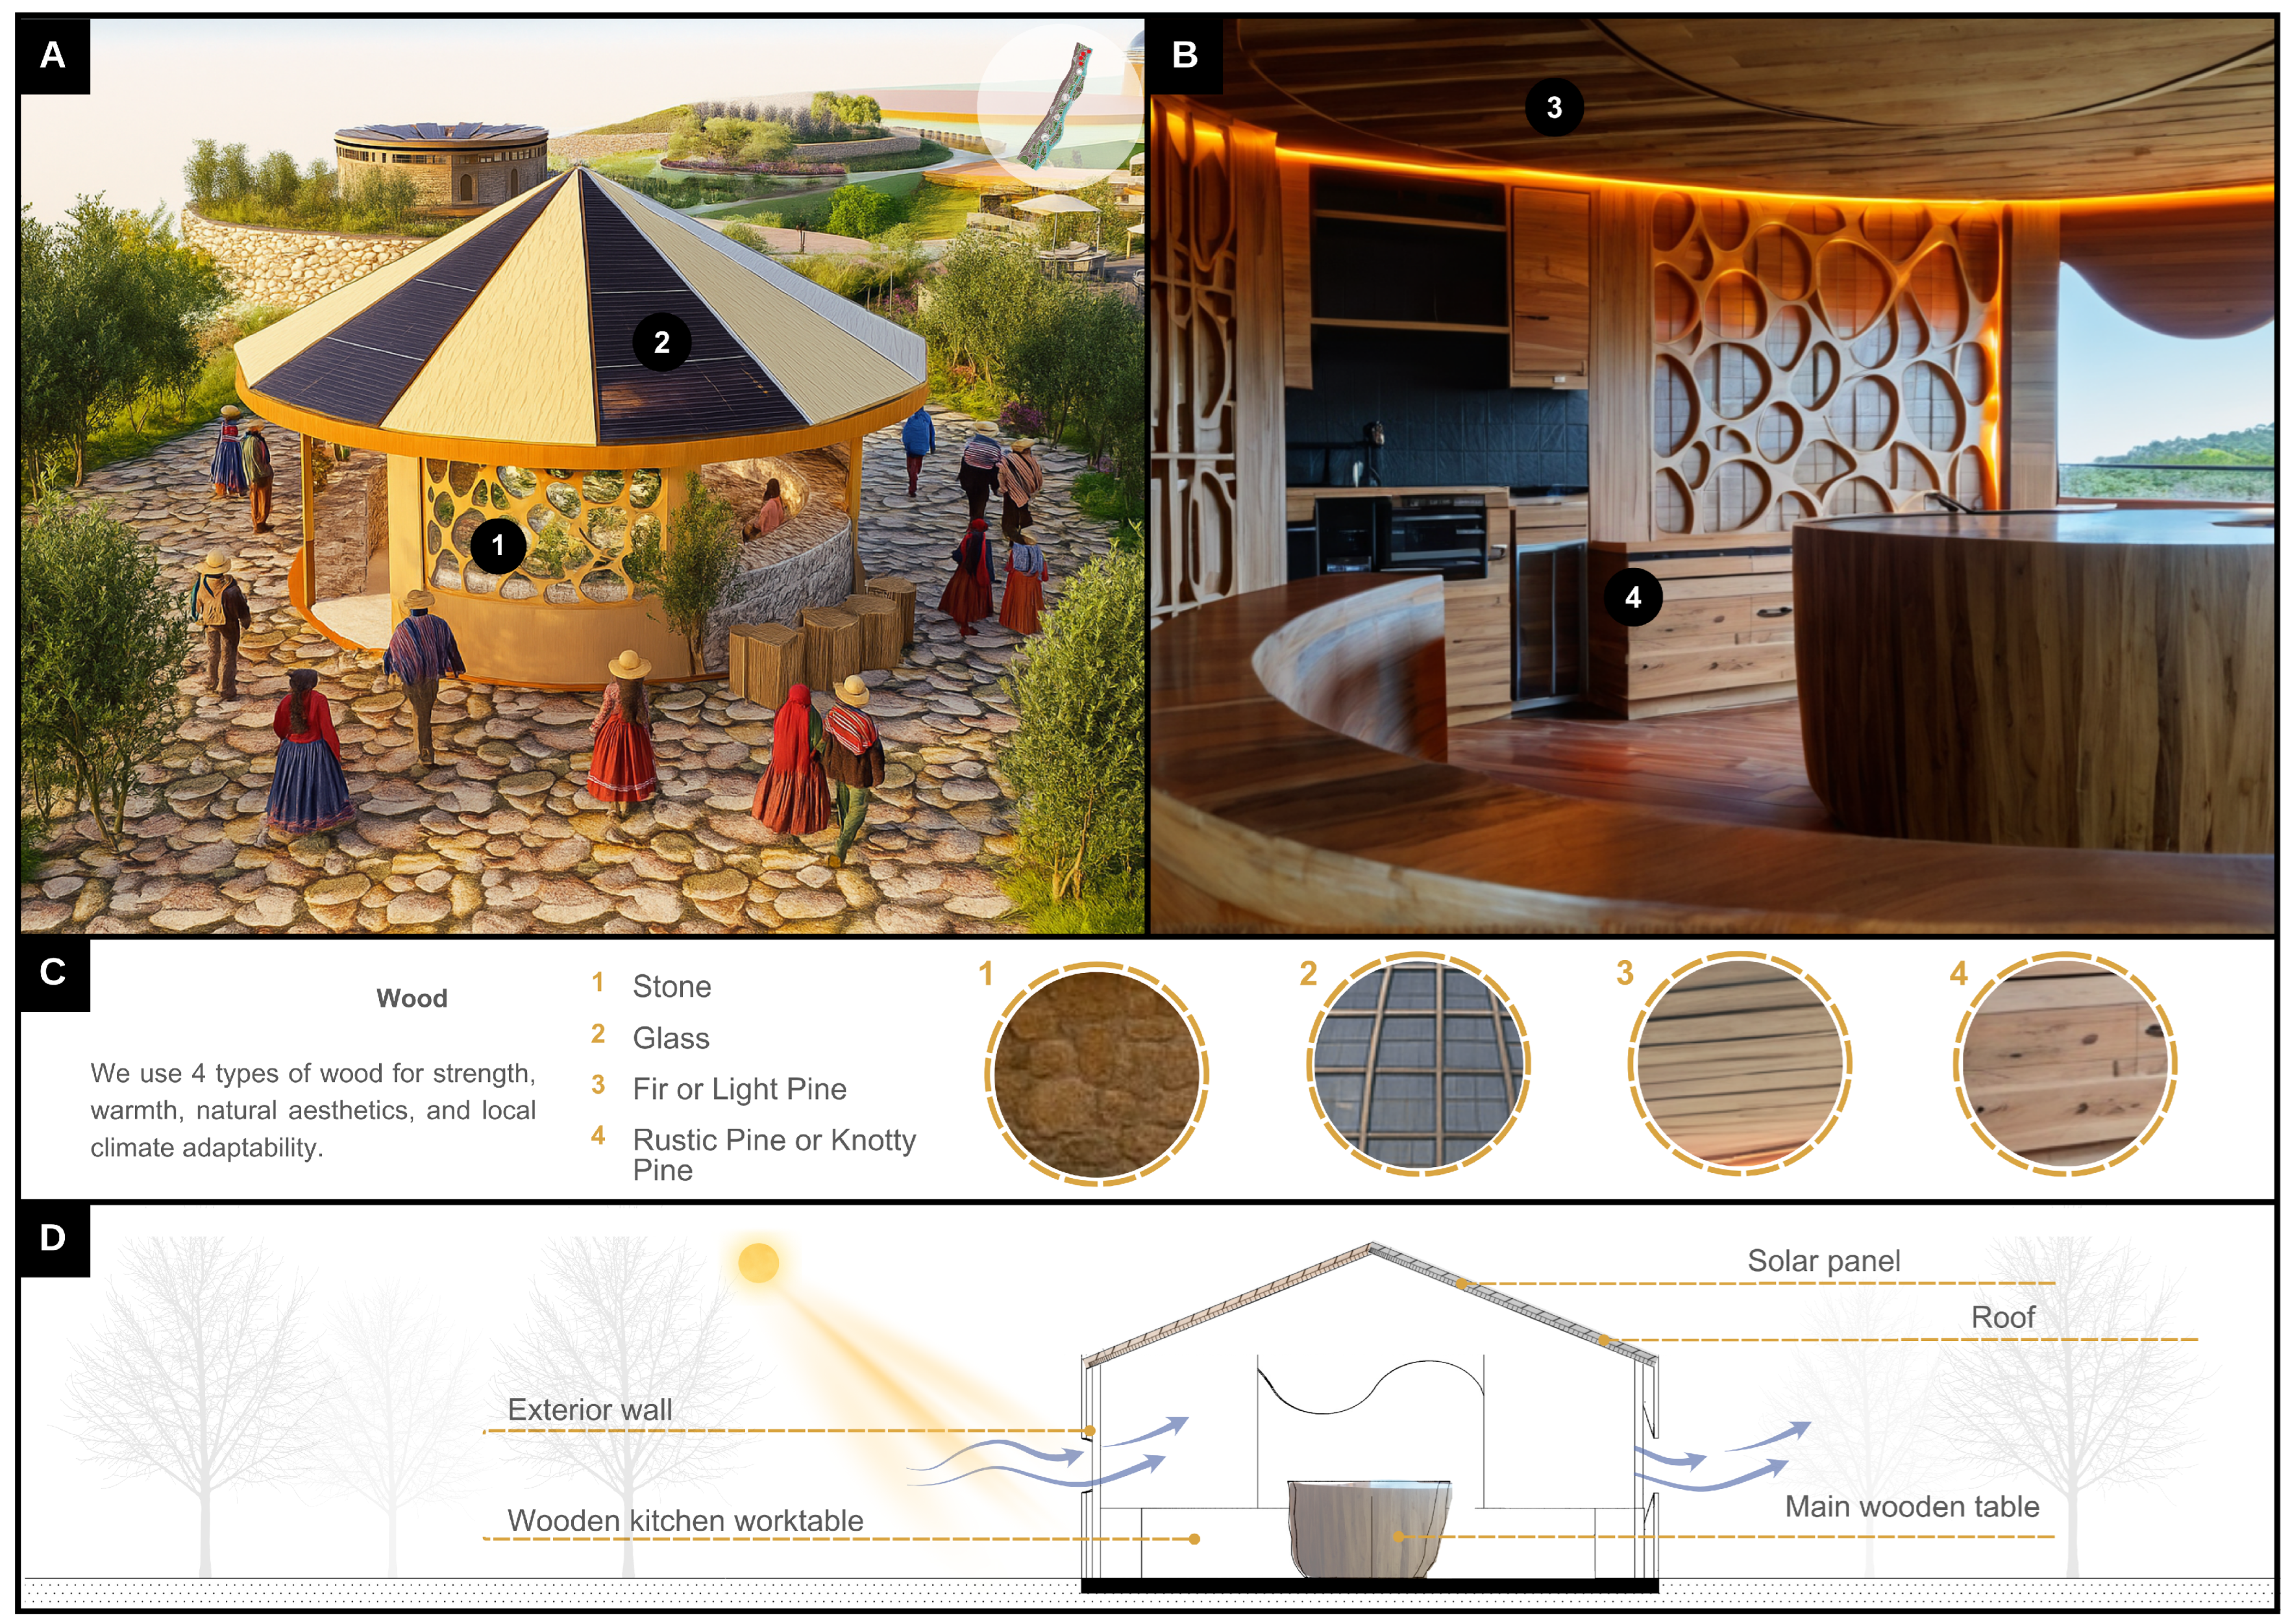
The broken topography, with a slope descending from northwest to southeast, is strategically leveraged to create 4 sunken plazas, as shown in Figure 19A, which connect the different levels of the terrain while simultaneously offering cultural and commercial spaces. Likewise, 8 workshop modules, visible in Figure 19B, are designed for innovation, research, and community participation, becoming flexible and versatile spaces for diverse activities. Each module is equipped with 5 photovoltaic panels, totaling 40 solar panels, which contribute to the project’s energy self-sufficiency.
To strengthen local gastronomic identity, bio-gardens with native species and a phytodepuration zone are incorporated to promote urban agriculture and water recycling, as illustrated in Figure 19C. Similarly, the design integrates 5 fair modules distributed in strategic locations, shown in Figure 19D, that promote local gastronomy and artisanal production. Complementarily, a guinea pig farm is projected with an organic waste bio-management system, including 1 biodigester and 1 biofertilizer unit, as seen in Figure 19E, which not only supplies part of the gastronomic activity but also promotes the project’s sustainability through the production of biogas and biofertilizers.
In line with this vision, the project incorporates local materials such as eucalyptus wood and volcanic sillar. Eucalyptus, widely available in the region due to its use in reforestation and rapid growth, is proposed as a low-cost and sustainable solution, provided it is responsibly managed, contributing to SDGs 11, 12, 13, and 15 by fostering sustainable cities, responsible production, climate action, and terrestrial ecosystem care. Meanwhile, sillar, the white volcanic stone characteristic of Arequipa’s architecture, is extracted from local quarries, reducing transport impacts and reinforcing the city’s cultural identity. Its versatility for walls, pavements, and urban furniture directly relates to SDGs 9, 11, 12, and 13, by promoting resilient infrastructures, community identity, and carbon emission reduction. Both materials not only engage in dialog with tradition and landscape but also consolidate a sustainable approach consistent with the vision of the green corridor [97].
All these elements are coherently organized and interrelated in the general layout of the Master Plan, presented in Figure 19F, and are spatially detailed in the section of the Master Plan, shown in Figure 19G, where the interaction between the different areas and their harmony with the natural environment of the Chili River are made evident.
The Chili River is actively integrated into the project through the creation of lagoons and controlled diversions, which expand its ecological presence within the urban territory. In this way, the riverbed not only maintains its hydrological function but also reinforces its role as a natural and landscape axis of the city, linking the built environment with the riverine landscape.
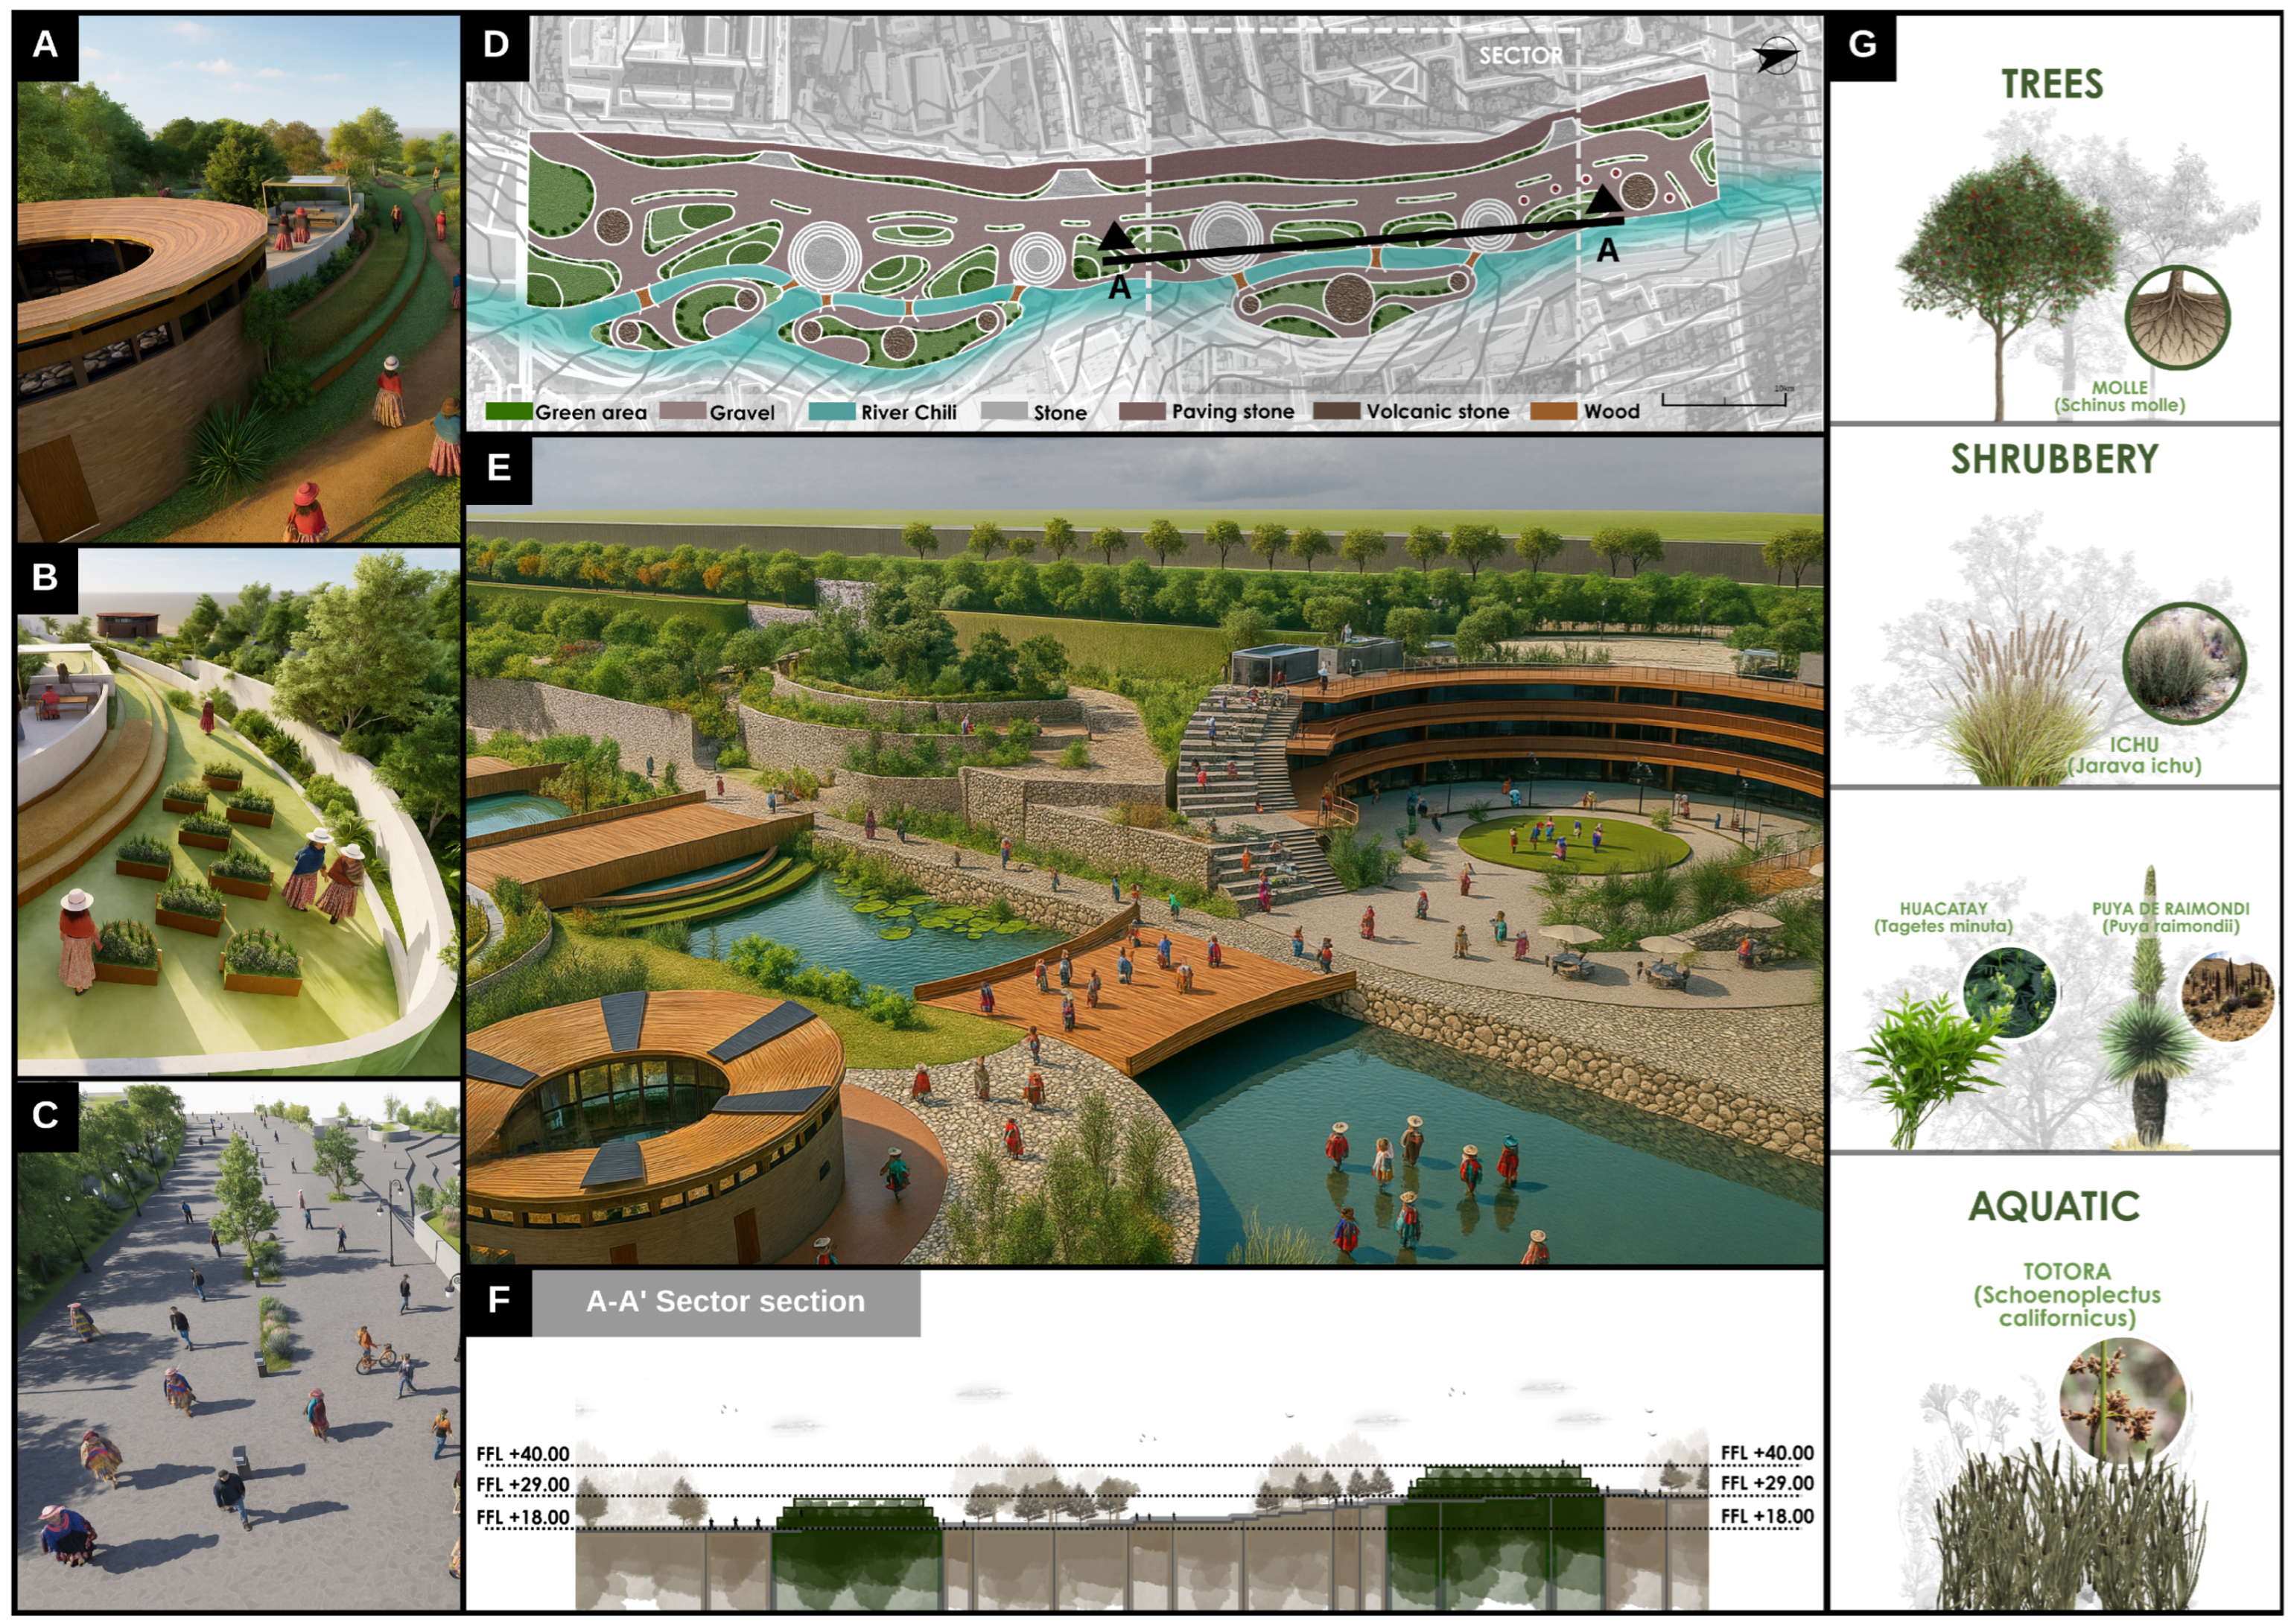
To ensure the environmental sustainability of the system, various clean technologies have been incorporated. Notably, the biogas system, shown in Figure 20A, transforms the organic waste generated in the area into renewable energy, contributing to the project’s energy self-sufficiency and reducing its carbon footprint. Complementarily, a community bio-garden, shown in Figure 20B, promotes local production of healthy food, supports environmental education, and strengthens the circular economy through collective cultivation and responsible management of natural resources.
Similarly, the green corridor, represented in Figure 20C, provides a continuous connection between the various intervention areas, integrating cultural, recreational, and productive facilities. This corridor serves not only as an ecological transit space but also as an active mobility axis for pedestrians and cyclists, enhancing accessibility and social interaction throughout the project.
The general planning, illustrated in Figure 20D, shows the strategic arrangement of spaces and their direct relationship with the natural environment, organizing the environmental and urban components hierarchically. Subsequently, Figure 20E presents the detailed spatial organization of a sector of the project, clearly showing the articulation between public areas, green zones, and facilities, creating a coherent system linking infrastructure, landscape, and social function.
At this point, the proposal also incorporates the use of sillar, a white volcanic stone extracted from the Añashuayco and Cerro Colorado quarries, located northwest of Arequipa. This material, locally abundant and low-cost, is a traditional resource in Arequipa architecture and is integrated coherently and sustainably into the green corridor design. Its use responds not only to esthetic and identity criteria but also to environmental principles, as the proximity of the quarries significantly reduces transportation-related emissions and strengthens the regional economy. The sillar extraction process begins with quarrying blocks, followed by artisanal carving and cutting, allowing its application in walls, pavements, urban furniture, and landscape elements [56,98].
On the other hand, the Master Plan, shown in Figure 20F, illustrates the interaction between topographic elevations, natural landscape, and projected infrastructure, revealing the coherence between territorial planning and terrain morphology. In the ecological terraces, the minimum widths of ecological corridors defined for each species in the corresponding table were applied, considering a width of 300 m for the Andean fox, 500 m for the vicuña and taruca, and 1000 m for the puma and Andean condor. This ecological zoning ensures functional corridors for local fauna, maintaining biological connectivity and facilitating migration between habitats at different altitudes. Thus, the terrace system serves not only an agricultural and landscape function but also acts as ecological infrastructure, integrating conservation and restoration criteria into territorial planning.
Finally, Figure 20G presents the proposed vegetation selection, composed of native and endemic species of the Arequipa region that perform specific ecological functions within the green corridor system. Among them, Schinus molle is used as a structural tree to stabilize slopes and riverbanks; Jarava ichu, a grass adapted to semi-arid conditions, supports erosion control; Tagetes minuta serves as an aromatic ground cover and pollinator plant, valued for its high resilience and low water requirement; and Puya raimondii and Schoenoplectus californicus subsp. tatora are emblematic high-Andean species that reinforce the identity value of the landscape.
The selection of these species was validated through a literature review, demonstrating their high tolerance to contaminated soils and heavy metals, highlighting species such as Schinus molle, Jarava ichu, Tagetes minuta, Puya raimondii, and Schoenoplectus californicus subsp. tatora, widely recognized for their effectiveness in phytoremediation processes in the Arequipa region [99]. Additionally, local data confirmed their stable and adaptive growth under the extreme climatic and edaphic conditions of the area [100]. Finally, the selection was corroborated through consultations with regional botanical experts, participants in studies on native trees of Arequipa, who confirmed their ecological functionality and suitability for environmental and urban recovery [101].
As presented in Table 4, the estimated annual carbon sequestration values are shown, along with canopy dimensions, total quantity, and the percentage of assigned area for each selected species. This information allows for the evaluation of each species’ potential contribution to environmental recovery and climate change mitigation.
Schinus molle stands out for its high carbon capture capacity, with values ranging from 0.068 to 0.33 kg C·m−2·year−1 and a wide canopy of 8 m in diameter, which justifies its allocation of 30% of the green area. Jarava ichu shows a lower rate, from 0.0027 to 0.20 kg C·m−2·year−1, but its density and resilience contribute to soil stability and moisture retention, covering 25% [83,84].
Tagetes minuta contributes to the phytoremediation process with a sequestration rate between 0.014 and 0.041 kg C·m−2·year−1, representing 20% of the area. Puya raimondii, although less dense, has a robust structure and significant ecological value, covering 15%. Finally, Schoenoplectus californicus subsp. tatora maintains a rate similar to Schinus molle, thriving in humid areas and occupying 10% of the green space [85,86,87].

3.5. Green Area

In the analyzed proposal, the total land area corresponds to 25 hectares, as shown in Figure 21. Based on the visual analysis of the urban design, it is estimated that approximately 51% of this surface is designated for green areas, representing a total of 127,500 m2. This proportion enables the creation of urban microclimates, enhances environmental quality, and supports the preservation of local biodiversity, particularly the native flora and surrounding wildlife.
To assess the environmental impact of this green area, species-specific carbon sequestration factors were applied, derived from studies on native and aquatic vegetation adapted to high-Andean zones. The weighted average values, considering the proportion of area assigned to each species, yield an average rate equivalent to 0.16 kg C/m2/year, which corresponds to approximately 0.59 kg CO2/m2/year. This factor is representative of semi-arid ecosystems with native and xerophytic vegetation, such as those found in Arequipa.
The calculation followed the methodological procedure proposed by the IPCC (Intergovernmental Panel on Climate Change), using carbon absorption factors commonly referenced in scientific literature and adjusted to the altitudinal conditions and vegetation productivity of the study area. According to these guidelines, reference values for comparable ecosystems range between 2 and 3 kg CO2/m2/year, which in this case were adjusted to reflect the actual sequestration rates observed in high-mountain and semi-arid green areas, such as those of the analyzed project.
Based on these parameters, each square meter of mixed vegetation is capable of absorbing approximately 0.59 kg CO2 per year, resulting in a total absorption of 75,225 kg CO2/year across the projected green surface. Considering a local variation of 15% to 25% associated with seasonality and altitude, the adjusted absorption range fluctuates between 63,941 kg CO2/year and 94,031 kg CO2/year.
These findings highlight the importance of urban design based on green infrastructure, not only from a landscape perspective but also as an effective strategy to mitigate carbon emissions, improve the environmental health of the Chili River ecological corridor, and strengthen the climate resilience of the urban environment [102,103,104].
  • Average factor: 0.59 kg CO2/m2/year
                                      CO2 absorption: 0.59 × 127,500 = 75,225 kg CO2/year
  • Considering variation:
                            Minimum absorption (−15%): 75,225 × 0.85 = 63,941 kg CO2/year
                            Maximum absorption (+25%): 75,225 × 1.25 = 94,031 kg CO2/year

3.6. Photovoltaic Solar Poles

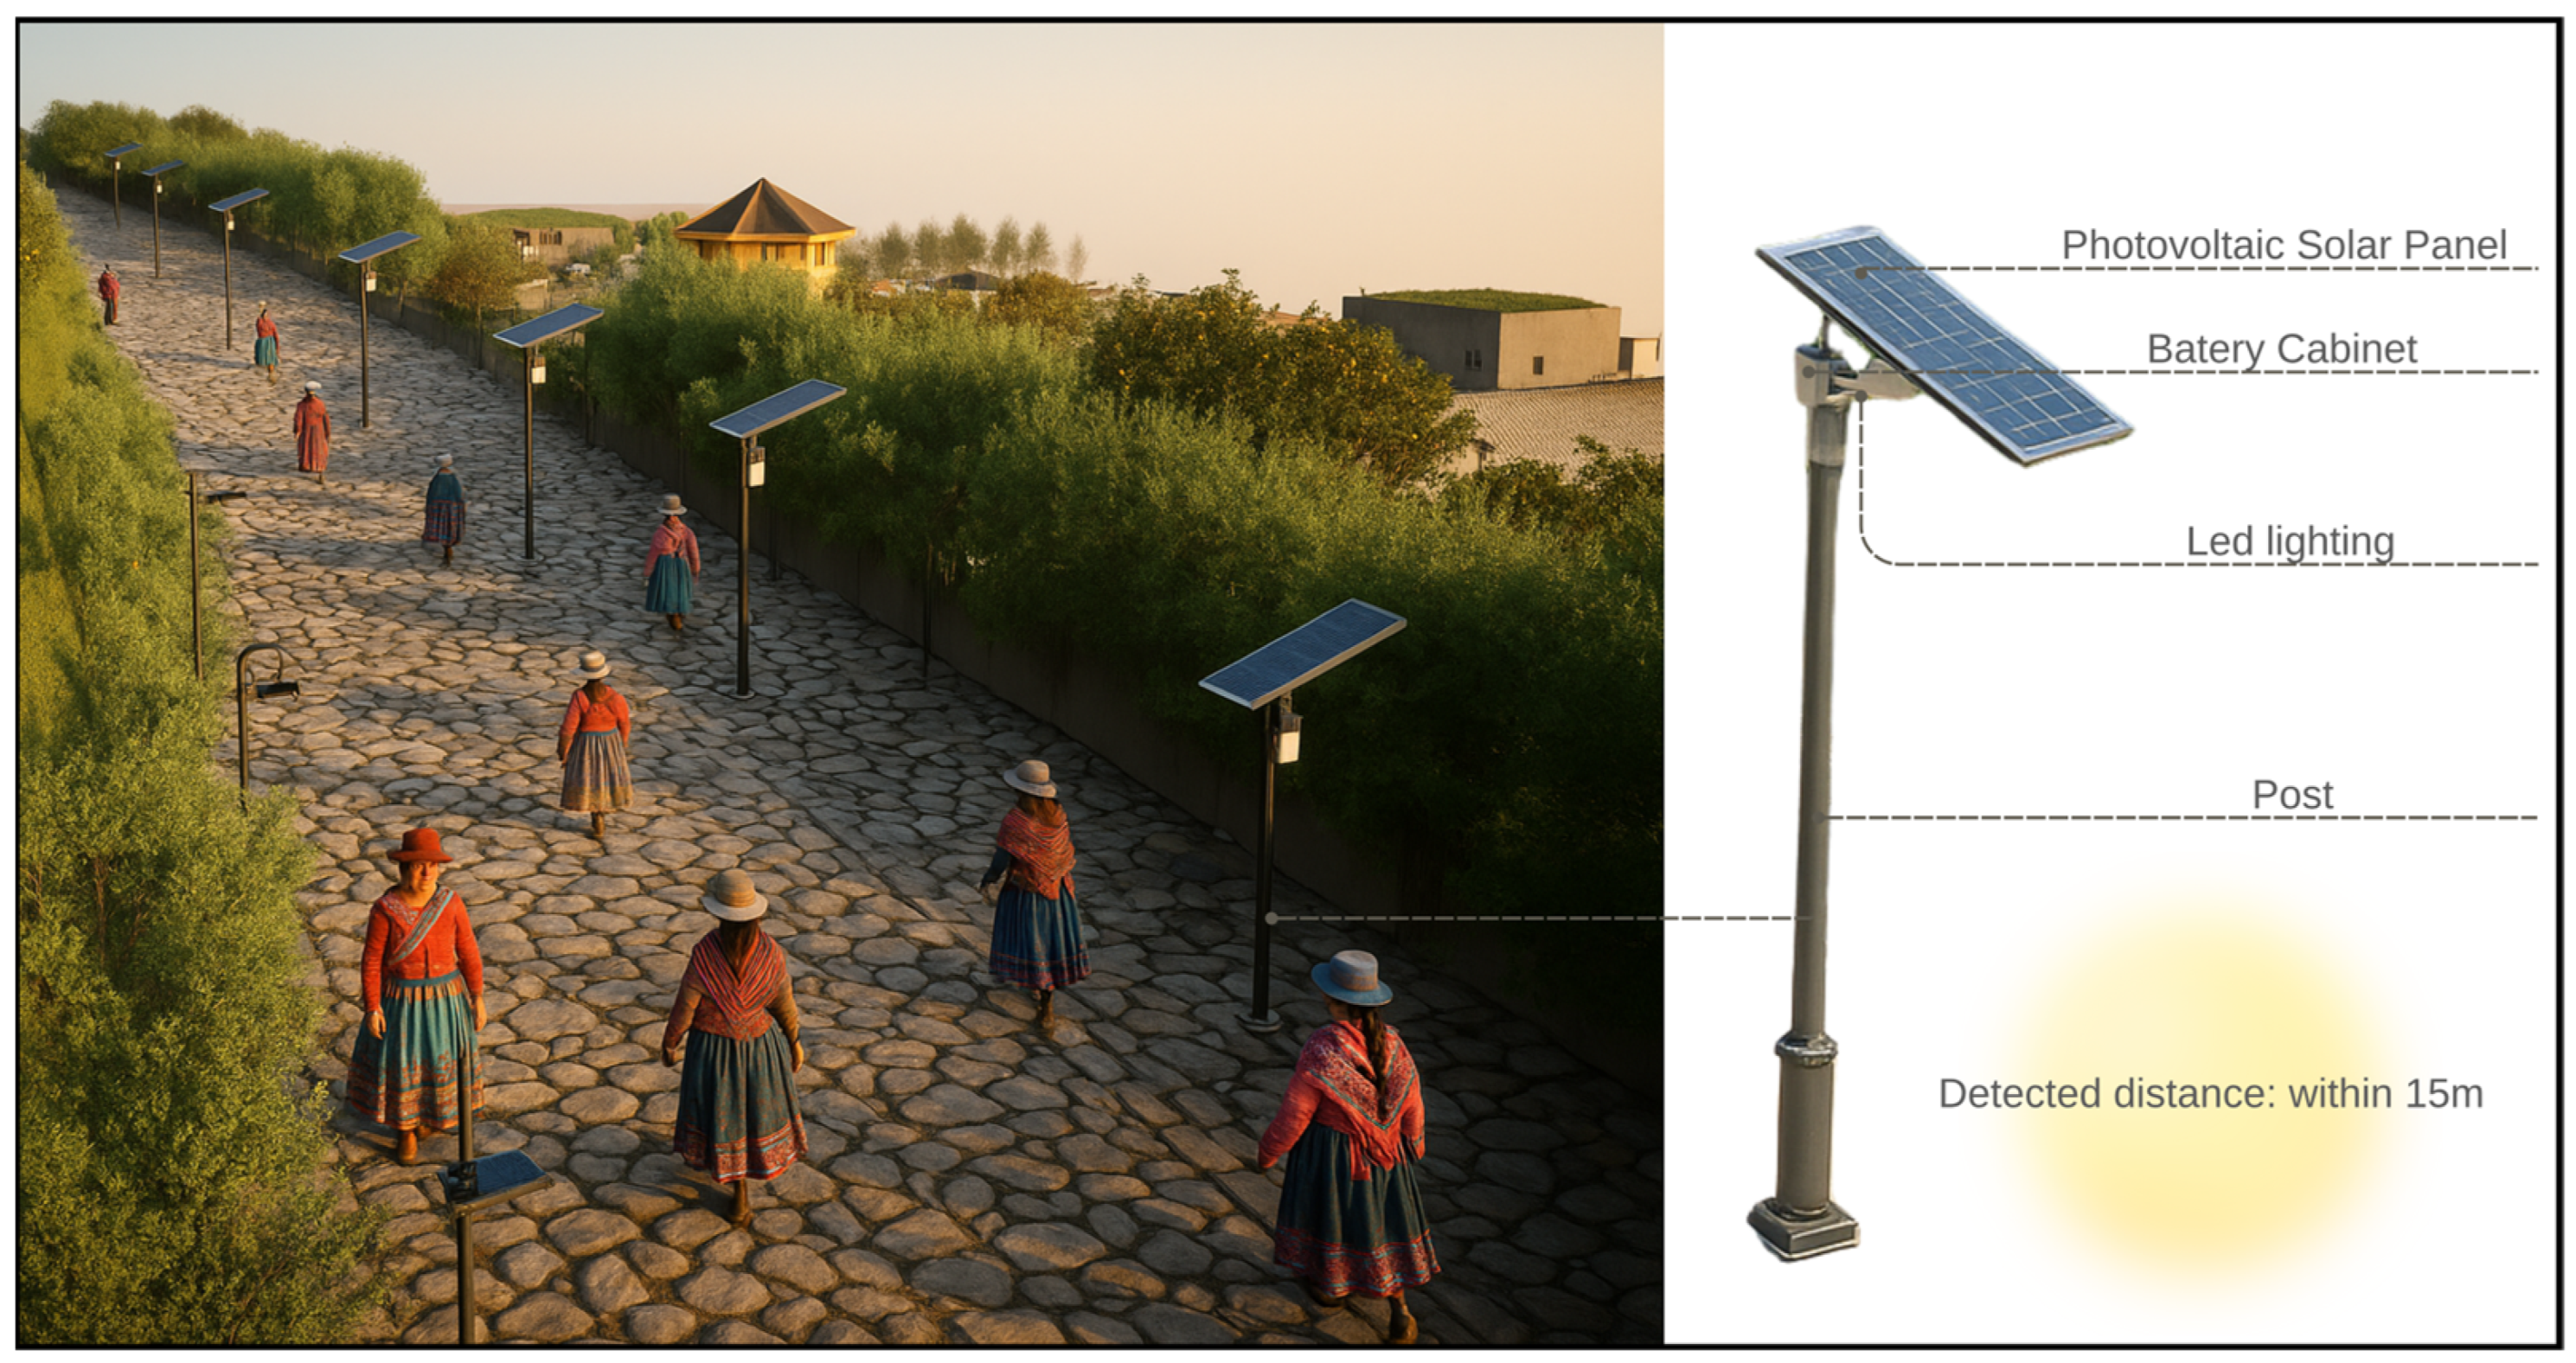
The project incorporates a photovoltaic solar pole system fully powered by solar energy, taking advantage of the high solar radiation that characterizes Arequipa for most of the year. This system, illustrated in Figure 22, employs self-sustaining poles equipped with integrated photovoltaic panels that capture sunlight and convert it into electricity, which is stored in integrated batteries to supply low-consumption LED luminaires during the night. In this way, the lighting operates autonomously, without the need for a grid connection, reducing pollutant emissions and promoting the use of renewable energy.
The photovoltaic solar poles have been strategically distributed to ensure uniform coverage across pedestrian circulation areas, gathering spaces, and cultural areas, improving safety and visibility during nighttime hours. Their design is harmoniously integrated with the landscape, reinforcing the esthetic coherence of the project and reaffirming its commitment to sustainability. Through this solution, the use of local natural resources is optimized, and efficient, durable, and environmentally responsible infrastructure is ensured.
Each photovoltaic pole stores the generated energy in a 30 Ah/25.6 V lithium battery, providing up to five nights of operational autonomy without recharging, even under cloudy conditions or reduced radiation. The luminaires are designed for installation heights of 8–9 m, with an effective lighting range of 30–35 m, ensuring coverage of pedestrian paths, cycling lanes, plazas, and public spaces within the green corridor. An integrated motion sensor regulates light intensity, operating at 30% in standby mode and increasing to 100% upon detecting movement, thereby optimizing energy use and extending the system’s lifespan while meeting necessary demand. Considering a 15 m radius of influence per unit and their strategic placement along the 1.3 km main corridor, a total of 44 streetlights are proposed throughout the project.
The pole structure, manufactured from aluminum alloy and certified with IP65 protection, is designed to withstand Arequipa’s environmental conditions, including intense radiation, rainfall, and dust. Furthermore, the system incorporates IoT technology for remote monitoring, enabling performance supervision, scheduling of lighting cycles, and early fault detection [105,106].
This next-generation photovoltaic solar pole system, detailed in Table 5, was designed to maximize energy efficiency and minimize environmental impact. The system employs BlueSmart P-100 solar luminaires rated at 100 W, capable of producing between 16,000 and 18,000 lumens, ensuring intense, uniform, and adequate illumination for urban spaces in nighttime use. Each unit integrates a 200 W/36 V high-efficiency monocrystalline photovoltaic panel, adjustable up to 360° to optimize solar radiation capture throughout different seasons of the year.
Similarly, Table 6 details the estimated energy production of the solar panels for public lighting. The calculation considers a unit power of 0.1 kW per panel, an average daily solar radiation of 8.2 kWh/m2/day, and an efficiency of 24 percent, using a configuration of 44 panels operating continuously for 30 days per month. Under these conditions, the system is projected to produce approximately 259.8 kWh per month, equivalent to an annual production of 3117.3 kWh. Considering a variation in actual performance due to local environmental factors such as dust accumulation, temperature, and seasonal changes in the solar angle, performance may fluctuate by 15 percent. Therefore, the adjusted estimated monthly production will be 311.76 kWh, with an adjusted annual production of 3740.76 kWh. These figures help quantify the energy contribution of the photovoltaic system for efficient and sustainable public lighting solutions.

3.7. Bio-Garden and Phytoremediation

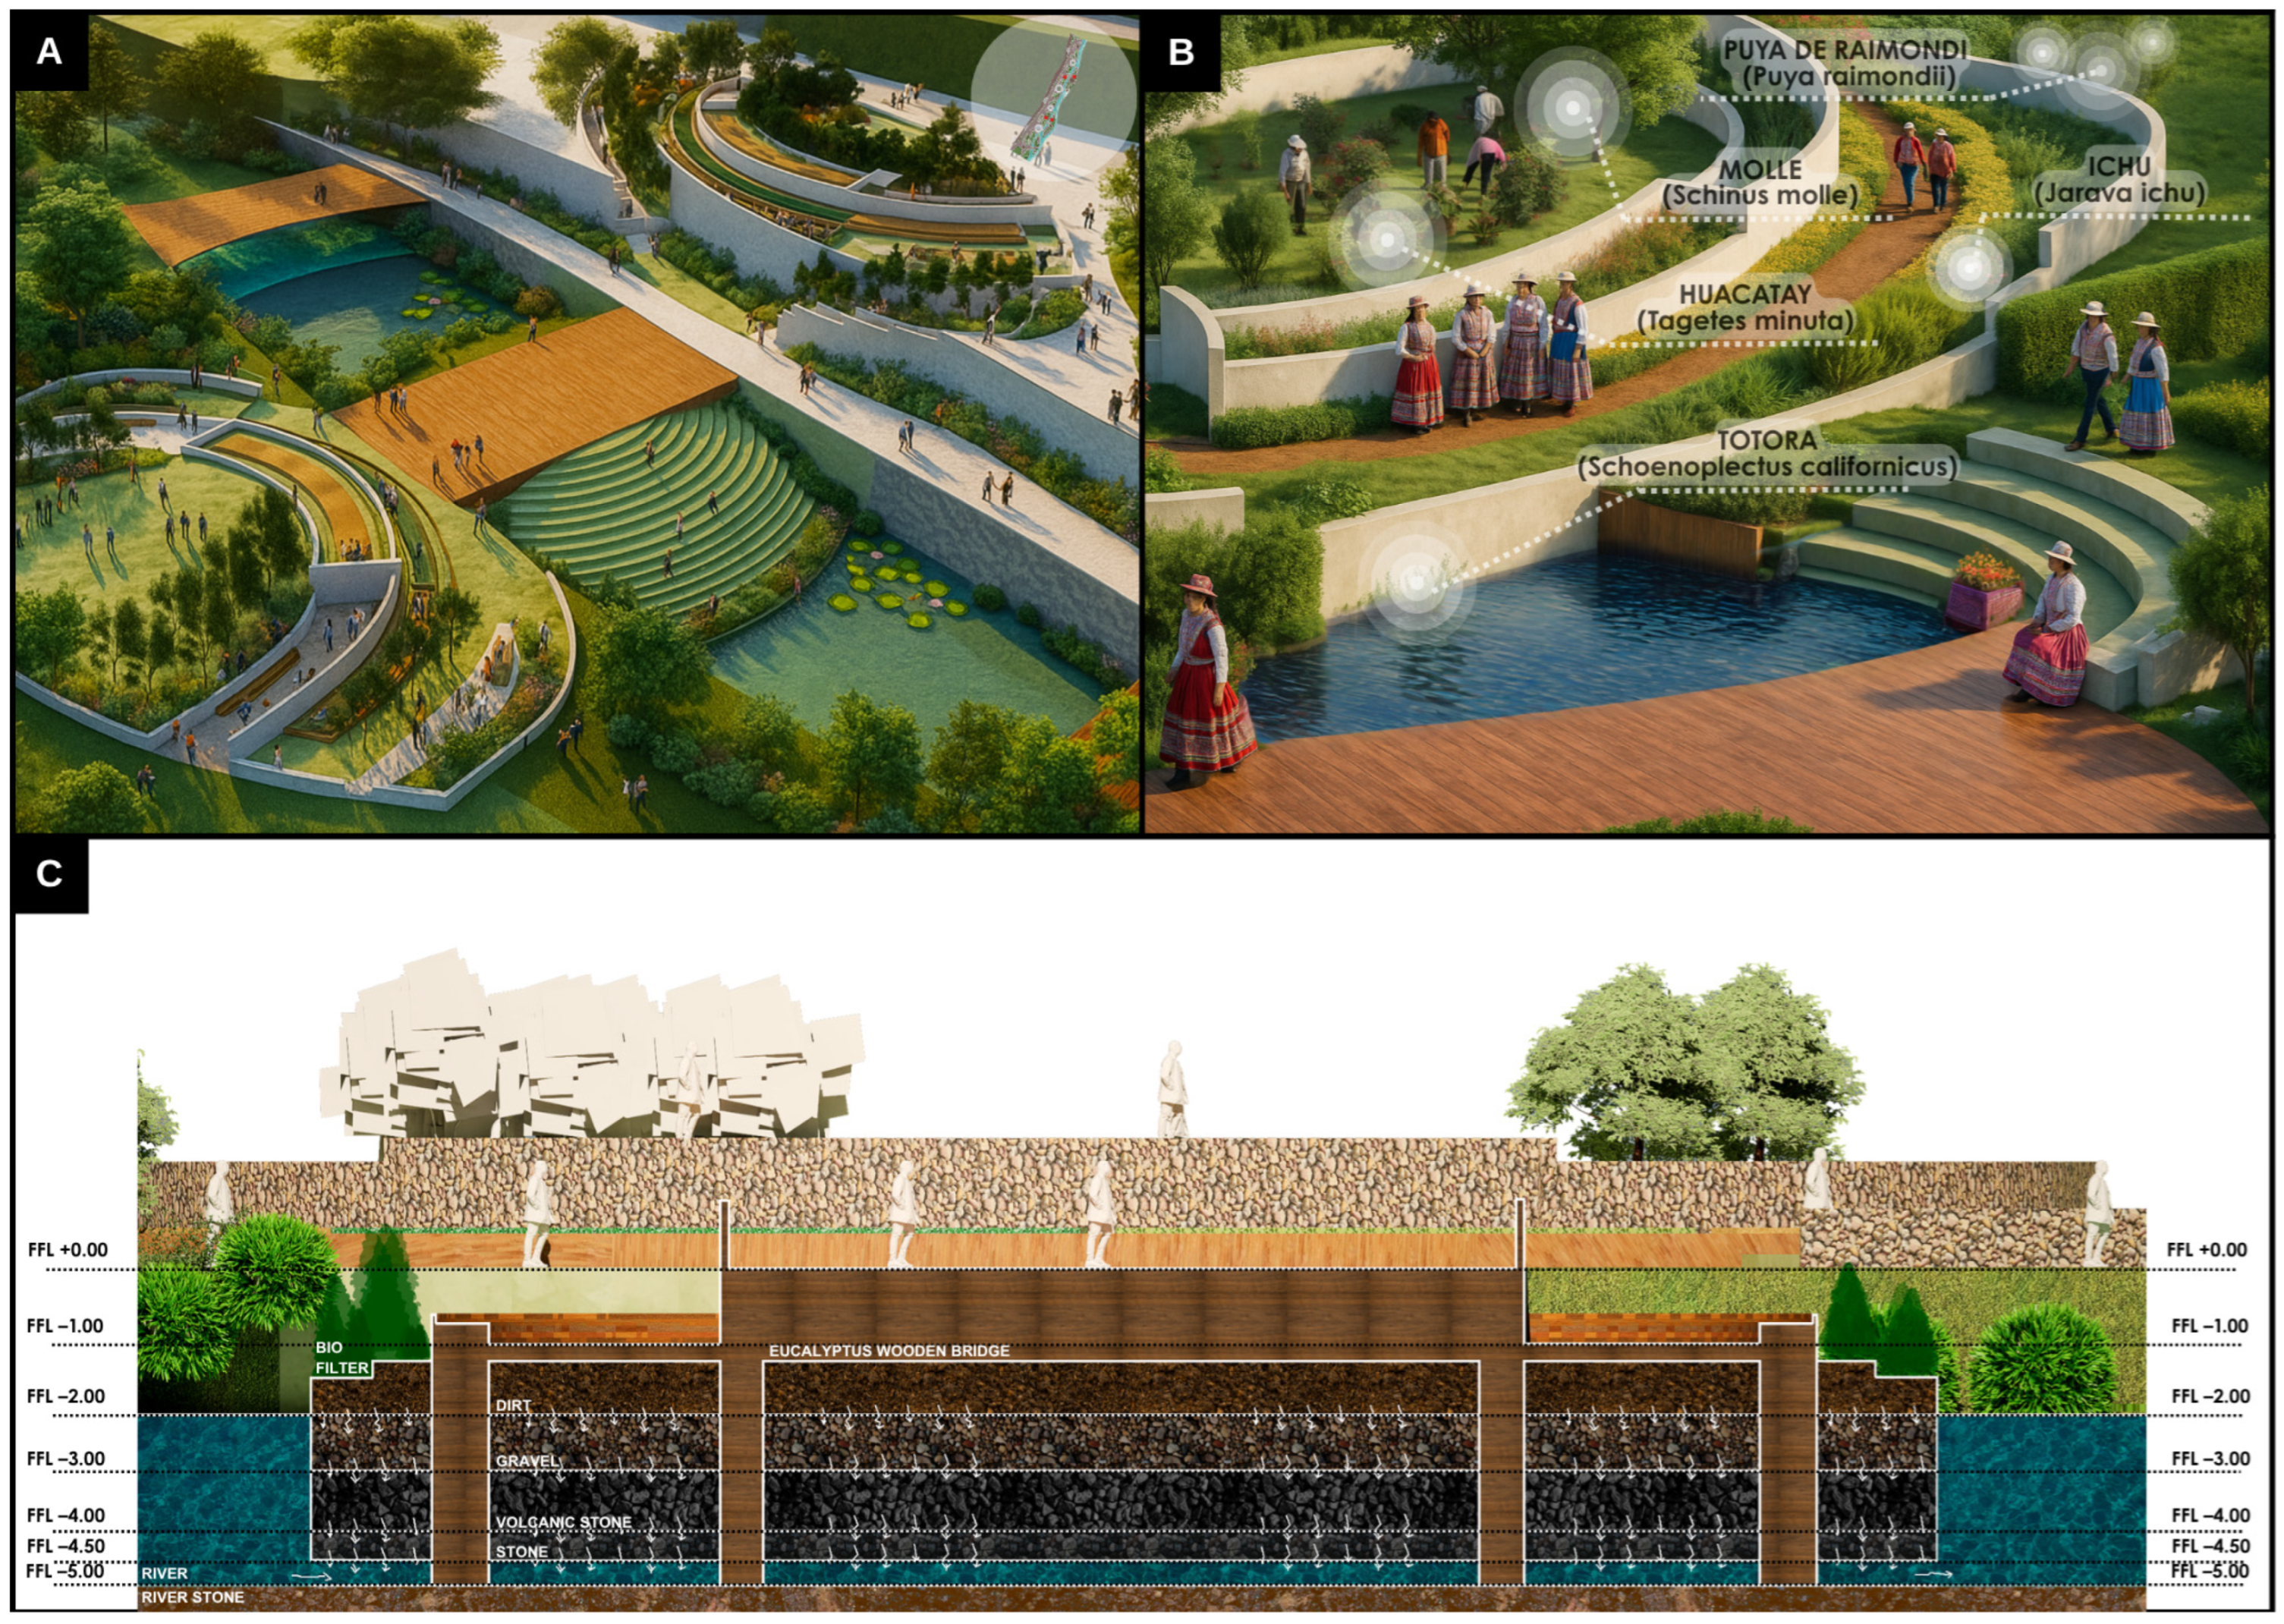
The landscape design is conceived as a pedagogical, social, and ecological resource that provides environmental value while simultaneously promoting education and community interaction in multifunctional public spaces, as reflected in the 3D general view in Figure 23A. This approach seeks to transform the landscape into an active connector between the community and the ecosystem.
A cultivated area of 40 m2 was planned, consisting of aromatic herbs (20 m2), quinoa (12 m2), and lettuce (8 m2). Using a rainwater harvesting system with a 10:1 ratio between collector surface and cultivated area, a total available capture of 25.524 m3 is obtained during the rainy period (January–March) [107]. With strategies to reduce evapotranspiration by 50% through mulching, shading nets, and drip irrigation, the reservoir required to guarantee irrigation during the dry season is reduced to approximately 21.56 m3. This demonstrates the need to integrate passive design, efficient water management, and the selection of drought-adapted species as fundamental principles for the sustainable operation of urban productive spaces, as shown in Table 7.
The thermal and humidity variations guide the use of materials with high thermal inertia, such as stone or gravel, to stabilize interior temperatures. In exterior spaces, permeable pavements and sheltered furniture are prioritized to provide thermal comfort throughout most of the year.
Overall, Arequipa’s climatic patterns decisively shape the project configuration. Intense solar radiation drives energy use and passive heat control, while prolonged drought demands efficient water management and vegetation adapted to arid conditions. Daily thermal fluctuations reinforce the use of materials with thermal storage capacity, and the prevailing wind direction informs strategies for natural ventilation and building orientation.
The selection of plant species and proposed materiality is illustrated in Figure 23B, highlighting their capacity to filter and purify greywater through nutrient absorption, sedimentation, and microbial activity in the root zones. Purification mechanisms include nutrient uptake by roots, sedimentation facilitated by root structures, and stimulation of microbial activity in the rhizosphere, which enhances the biodegradation of organic matter [111,112].
The schematic section of the phytodepuration system in Figure 23C shows the operation of constructed wetlands as an ecological and efficient alternative for wastewater treatment. These systems leverage the natural capacity of aquatic plants to remove contaminants via biological, physical, and chemical processes. In arid contexts like Arequipa, implementation requires specific adaptations, including drought-resistant species and structures designed to minimize evaporation [113]. An example is the horizontal subsurface flow constructed wetland in the city, which channels treated effluent into a community urban garden, supporting both water quality and food security through native crops such as maize and quinoa irrigated by renewable-powered drip systems.
In the Chili River project, phytodepuration is reinforced through the integration of native species adapted to Arequipa’s semi-arid environment, selected for their pollution tolerance and carbon sequestration capacity. Schinus molle, Jarava ichu, Tagetes minuta, Puya raimondii, and Schoenoplectus californicus subsp. tatora form a mixed system capable of acting on inorganic contaminants (Pb, Cr, Hg) and nutrients (NO3).
Schinus molle stands out for its tolerance exceeding 70% and carbon sequestration of up to 1.2 kg CO2/m2/year, retaining heavy metals such as lead and stabilizing riparian soils. Jarava ichu, tolerant of low precipitation (200–400 mm/year), contributes to erosion control and surface filtration, reducing the transport of contaminated sediments. Tagetes minuta, with a tolerance range of 40–50%, absorbs nutrients such as nitrates (81 mg/L in the Chili River), mitigating eutrophication processes. Puya raimondii provides ecological stability in higher zones, sequestering up to 0.25 kg CO2/m2/year, while totora (Schoenoplectus californicus) plays a central role as a biological filter, achieving 80–90% tolerance and simultaneously removing Pb, Cr, and nitrates through dense roots and natural substrate aeration.
This combination of native and aquatic species creates an integrated phytodepuration system that not only treats contaminated waters but also improves air quality, reduces organic load, and gradually restores the ecological functionality of the Chili River. Together, these strategies position the ecological corridor as a model for environmental restoration adapted to high-altitude arid ecosystems, where vegetation plays an active role in decontamination and climate resilience.

3.8. Spatial Distribution and Functionality

3.8.1. Sunken Plaza

The proposal incorporates a careful selection of native and endemic vegetation from Arequipa, visible in Figure 24A, responding to environmental, functional, and landscape criteria. Schinus molle contributes to riparian soil stabilization and retention of heavy metals; Jarava ichu aids in erosion control and surface filtration; Tagetes minuta mitigates nutrient excess and supports soil regeneration; Puya raimondii enhances ecological stability in higher zones; and totora (Schoenoplectus californicus), adapted to aquatic environments, is essential for water purification. This plant palette is complemented by local materials such as volcanic stone, characterized by its high availability and low cost in the region. This resource provides cultural identity and sustainability by reducing the transportation footprint and strengthening the regional economy. Gravel and clay brick are also employed, along with eucalyptus wood, a highly available resource in the region due to its extensive use in reforestation processes. Eucalyptus is a fast-growing and low-cost species, ensuring a constant supply for infrastructure projects [55]. Procurement for the project is carried out through specialized local distributors such as Maderas Intiynova, which facilitates efficient transport to the intervention area adjacent to the green corridor, reducing transportation costs and reinforcing the link with the regional economy [114].
In the general view shown in Figure 24B, the main facility is composed of a commercial ring built with eucalyptus wood, used in the slab and railings. This space encircling the central sunken plaza is organized into exhibition, recreation, and rest areas, articulated with stands and green zones that promote social and cultural interaction. The design takes advantage of the existing topography to generate fluid connections between levels, integrating vegetation, urban furniture, and eucalyptus wood structural elements that add warmth and a natural identity to the complex.
The exploded isometric view, illustrated in Figure 24C, reveals the organization and constructive sequence of the project. The peripheral commercial ring houses modules for local and artisanal products, while the central area accommodates the stands and the sunken plaza as the core of cultural activities. Complementary modules are strategically distributed, designed with semicircular lightweight structures of eucalyptus wood and volcanic stone, ensuring functional flexibility and construction efficiency.
Finally, the longitudinal section represented in Figure 24D highlights the relationship of heights and spatial distribution throughout the facility. It shows how the architecture adapts to the topography, integrating natural and built elements, providing visual and climatic comfort through vegetation, and establishing a continuous dialog between commercial, cultural, and recreational areas. The use of eucalyptus wood in roofs, connections, and furniture reinforces the project’s sustainability, ensuring an economical, ecological, and context-appropriate construction system aligned with Arequipa’s territorial identity. Similarly, the application of volcanic stone in the recreational corridor adds durability and esthetic character, while strengthening harmony with the natural environment, fostering integration between tradition and modernity in the design.

3.8.2. Workshop Modules

The workshop modules constitute flexible community spaces strategically integrated within Arequipa’s green corridor, conceived as platforms for learning, gathering, and collective production. A total of 8 modules are proposed, each equipped with 5 photovoltaic panels, resulting in 40 solar panels that supply renewable energy to the complex. In the general view, their circular volumetry can be appreciated, with roofs equipped with high-efficiency solar panels that reinforce the project’s sustainability approach, as shown in Figure 25A. The modular design allows adaptation to a wide range of activities, from traditional crafts to art and technology programs, promoting practical and inclusive education [115].
The interior, illustrated in Figure 25B, is equipped with basic facilities for maintenance workshops, training in renewable energy, and the creation of local handicrafts. These multifunctional environments also operate as centers for innovation in sustainable agriculture and community infrastructure repair. Natural and artificial terrain slopes are leveraged to implement semi-underground areas that create cool microclimates through passive ventilation, integrating stands for cultural activities and sustainable drainage systems to control the torrential rains characteristic of the region [115].
The materiality, presented in Figure 25C, relies on local resources such as volcanic stone for walls and eucalyptus wood, a fast-growing, low-cost, and sustainable material directly linked to the Sustainable Development Goals. Clay finishes and gravel are also used, serving as natural filters against solar radiation. The longitudinal section, shown in Figure 25D, demonstrates the incorporation of cross-ventilation strategies and solar optimization, which ensure passive thermal comfort and reduce the need for mechanical systems. A total of five workshop modules are proposed with diverse uses, including dance, gastronomy, research, art, and crafts, their forms inspired by leaves to reinforce biocultural identity and the connection with local flora.
As part of the energy strategy, ten Astronergy 610 W bifacial solar panels with N-Type TOPCon technology are integrated. These offer superior performance thanks to their dual-glass design and ability to capture both direct and ground-reflected radiation. Each photovoltaic module achieves a nominal power of 610 W, representing a total installed capacity of approximately 6.1 kW. This capacity is sufficient to power workshop lighting, kitchens, and fair facilities, ensuring the energy self-sufficiency of the entire system. The benefits are reflected not only in reduced operational costs but also in a lower carbon footprint and the consolidation of a resilient and sustainable corridor that harnesses clean energy to sustain its community activities [116].
The project is powered by photovoltaic technologies that maximize the solar resource characteristic of Arequipa. For this purpose, 610 W Astronergy Bifacial N-Type TOPCon solar panels are used to supply electricity for the facilities of the green corridor, while Bluesmart Integrated Exterior luminaires with motion sensors are implemented for public lighting.
The photovoltaic system installed in the facilities incorporates bifacial technology, which allows solar radiation to be captured on both sides of the module, thereby increasing energy performance in open urban environments. Each module integrates high-efficiency monocrystalline solar cells and double-glass tempered encapsulation. Table 8 presents the technical specifications of the selected solar panels, describing the characteristics of a solar lighting model manufactured by Astronergy (headquartered in China) and distributed by Panel Solar Perú [116].
The estimation of the maximum electrical demand was carried out by considering different equipment, including luminaires, emergency lights, standard power outlets, and Wi-Fi access points, as detailed in Table 9. The analysis took into account the number of devices, their individual power, the diversity factor, and the maximum demand, resulting in a total value of 551.6 W.
Similarly, Table 10 presents the total monthly and annual energy demand of the facilities, considering an operating schedule of 10 h per day, 20 days per month.
On the other hand, energy production through solar panels was calculated based on a daily solar radiation of 8.2 kWh/m2 and an efficiency of 22.6%. As shown in Table 11, five panels are proposed to meet this demand for each facility. With eight workshop modules, each equipped with five panels, a total of 40 ASTRONERGY 610 W BIFACIAL N-TYPE TOPCON solar panels would be used throughout the entire project.
Finally, Table 12 summarizes the relationship between the required and supplied energy. The results indicate that the solar panels completely satisfy the monthly and annual energy requirements of the workshop modules, slightly surpassing the estimated demand, which confirms the high efficiency of the proposed system.
The photovoltaic generation results follow the approach that establishes a comparative framework between the estimated energy demand and the potential photovoltaic output, considering local solar irradiance data. This approach recommends applying a correction factor or safety margin to account for real-world conditions that affect system performance, including losses associated with temperature, dust accumulation, wiring losses, inverter inefficiencies, and the gradual degradation of modules over time.
In line with the recommendations of the International Renewable Energy Agency (IRENA) and the Photovoltaic System Design Guidelines of the National Renewable Energy Laboratory (NREL), a 20% safety margin was incorporated into the energy balance to ensure system reliability in the face of seasonal irradiance variations and long-term module efficiency decline. The adjustment is applied once the base production is determined and is expressed as follows
According to this procedure, the calculated annual energy per installation was 1356.54 kWh/year. After applying the 20% margin, this value increases to 1627.85 kWh/year.

3.8.3. Gastronomic Fairs

The gastronomic fairs are harmoniously integrated into the public space, reinforcing cultural identity and stimulating the local economy. A total of 5 fair modules are strategically distributed throughout the site, providing spaces for local gastronomy, artisanal production, and community exchange. Located along pedestrian sections of the green corridor, these structures take advantage of accessibility and existing infrastructure to consolidate themselves as open, inclusive, and active meeting points, as illustrated in the 3D image in Figure 26A. Their proposal revolves around Arequipa’s cuisine, blending culinary tradition with innovative contributions from small producers and entrepreneurs. Emblematic dishes such as rocoto relleno, ocopa arequipeña, adobo dominical, chupe de camarones, costillar frito, and various guinea pig-based preparations are prepared and offered, all of which form part of the region’s gastronomic heritage. By providing locally sourced food and traditional recipes, the fairs foster economic reactivation, strengthen food sovereignty, and revalue popular knowledge tied to the territory [117].
To highlight the gastronomic richness of Arequipa, flexible fair modules are proposed, adaptable to a wide variety of dishes, employing locally sourced materials and finishes. As shown in Figure 26B, dry eucalyptus tree trunks supplied by local distributors are used, which facilitates transportation, reduces costs, and strengthens the regional economy. These trunks are used as furniture, evoking the esthetic of Japanese gardens. The interior of these modules, illustrated in Figure 26C, is designed to provide a warm and functional atmosphere that facilitates food preparation and sales, while the acrylic canvas roofing serves as an enclosure and protection against high solar radiation, strong winds, and occasional rainfall.
Finally, the architectural section shown in Figure 26D demonstrates sustainable design strategies, such as cross-ventilation, which promotes thermal comfort inside the modules, optimizing the use of natural resources and reducing the need for mechanical climate control systems, thereby ensuring efficient and environmentally responsible operation.

3.9. Biodigester and Biofertilizer

The guinea pig farm is conceived as a sustainable productive facility that not only meets breeding needs but also integrates into a broader ecological cycle. Its strategic location within the landscape system takes advantage of the terrain’s contours, achieving harmonious integration with the surroundings. One of its main innovations is the utilization of organic waste generated by the guinea pigs, which is Figure 27A. collected and directed to a biodigestion system. In this process, the excreta are transformed into biogas and biofertilizers, reducing environmental pollution and generating clean energy to illuminate or heat the farm itself. This reinterpretation of an ancestral practice incorporates sustainable technologies, producing positive environmental and social impacts in both rural and urban contexts [118].
The materials used are shown in Figure 27B, with eucalyptus wood and volcanic sillar stone predominating, complemented by clay. The choice of eucalyptus responds to its high availability in the Arequipa region due to reforestation programs, its low cost, rapid growth, and sustainability when responsibly managed.
Inside the farm, shown in Figure 27C, the design optimizes animal comfort and facilitates waste collection, ensuring efficient operation of the production system. The employed biodigestion system can produce between 0.30 and 0.50 m3 of biogas per kilogram of volatile organic matter, specifically adjusted to local altitude and temperature conditions. The high calorific value of the generated biogas is due to its methane content, resulting in an energy generation capacity close to 6 kWh per cubic meter, which is used for various functions within the facility.
As summarized in Table 13, the biodigestion process is structured through a sequence of technical parameters that allow precise estimation of biogas and energy production from the organic waste generated at the farm. First, an average daily excreta production of 0.05 kg per adult guinea pig is considered, based on experimental measurements in similar breeding systems. With a group of 100 guinea pigs, approximately 5 kg of excreta are generated per day, representing the total mass of organic matter available for the anaerobic process.
Under Arequipa’s altitude and temperature conditions (approximately 2300 m.a.s.l. and temperatures between 20 and 26 °C), a specific conversion factor of 0.30 to 0.50 m3 of biogas per kilogram of volatile organic matter is applied, resulting in an estimated daily production of 1.5 to 2.5 m3 of biogas. This range reflects the process efficiency in high-altitude temperate climates, where the digester’s thermal control maintains optimal fermentation levels. The generated biogas has an average energy content of 6 kWh/m3, equivalent to 9 to 15 kWh per day, sufficient energy to supply lighting, cooking, and equipment in the fair modules and community workshops. On a monthly projection, energy production reaches 270 to 450 kWh, demonstrating the system’s self-sufficiency and viability within the green corridor’s comprehensive sustainability strategy.
This process not only contributes to the reduction in waste and pollutant emissions, but also closes the material and energy cycle within the project, transforming waste into usable resources. The resulting biofertilizer is reused in the community gardens and green areas of the complex, completing a circular economy model that strengthens the environmental and social resilience of the productive system.
The biodigester, shown in Figure 27D, is strategically located between the gastronomic area and the green corridor of the plaza, allowing organic waste from food establishments to be transformed into energy and natural fertilizer. The process begins with the decomposition of food scraps and animal excreta in a sealed digester, where through an anaerobic process, biogas and a nutrient-rich liquid byproduct are generated. The produced biogas is purified and used not only for kitchens and lighting systems in the plaza, but also to supply energy to the fair modules and community workshops, reinforcing its multifunctional and sustainable nature. In case of surplus, this energy resource is safely burned using a special flare. Meanwhile, the resulting biofertilizer is applied to community gardens and green spaces along the corridor, closing a circular economy loop in which nothing is wasted: residues return to the soil as nutrients, supporting local agricultural production.
In terms of performance, the proposed 6 m3 biodigester generates up to 36 kWh of thermal energy, equivalent to 12 kWh of usable electricity, sufficient to partially supply lighting, kitchens, fair equipment, and workshop modules. Considering that a single guinea pig produces approximately 0.05 kg of daily excreta, a group of 100 guinea pigs housed in a 24 m2 area of the farm generates around 5 kg/day of manure, corresponding to a daily biogas production of 1.5 to 2.5 m3, adjusted to local altitude conditions. This translates into a daily usable energy of 3 to 5 kWh, which exceeds the initial estimate due to the positive effect of controlled temperature in the biodigester [119]. On a monthly cycle, production reaches 45–75 m3 of biogas and a total generation of 90–150 kWh of electricity, significantly contributing to the project’s energy self-sufficiency.
The generated energy is mainly intended to supplement the electricity consumption of productive and community spaces. Comparatively, a standard domestic electric stove requires between 1.5 and 2.0 kWh per hour of operation, while an LED lighting system for a 100 m2 area consumes approximately 0.5 kWh per hour. Thus, the biogas energy can power up to six hours of daily cooking or keep general lighting on for over 20 h, directly reducing electricity consumption from the conventional grid.
Biogas production estimates are based on conversion factors established for anaerobic digestion at high altitude, specifically adapted to the Arequipa region. These factors consider a production range of 0.30 to 0.50 m3 of biogas per kilogram of volatile organic matter, adjusted to local temperature conditions (average between 20 and 26 °C) and atmospheric pressure at an altitude of approximately 2300 m above sea level [119]. The methodology includes thermal control of the biodigester to maintain optimal fermentation temperature, as well as energy calculation based on the calorific value of methane contained in the biogas, estimated at 6 kWh/m3.

4. Discussion

The central value of this research lies in the ecological restoration proposed by the Green Corridor of the Chili River in Arequipa, conceived as an active ecological infrastructure that integrates environmental, social, and energy functions within an arid, high-altitude urban context. The proposal draws from five international references: Ribera de Deusto in Bilbao, the High Line in New York, Cheonggyecheon in Seoul, the Hermosillo–Mexicali corridors in Mexico, and the Green Belt of Vitoria in Spain. These cases demonstrate the potential of blue-green infrastructure to regenerate degraded urban environments and integrate nature with the city.
Among them, two experiences were particularly influential. From the Hermosillo–Mexicali corridors, sustainable drainage strategies, xerophytic vegetation with low water consumption, permeable pavements, and shading structures were adapted to the Chili Valley to control runoff, reduce surface temperature, and improve thermal comfort [18]. From Cheonggyecheon, the project adopted the concept of fluvial restoration through phytoremediation wetlands and accessible riverbanks, reinterpreted with native species such as Schoenoplectus californicus and Arundo donax to enhance water quality and reconnect riparian ecosystems with the community [17]. The combination of both approaches enabled the development of an integrated model that articulates active mobility, ecological restoration, thermal comfort, and energy self-sufficiency, aligned with the environmental conditions of Arequipa.
The project incorporates biodigesters, forty photovoltaic panels, and autonomous solar lighting systems, with an estimated carbon capture potential of 318,750 kg of CO2 per year, validated through energy efficiency and vegetation surface calculations. The sustainable materiality prioritizes eucalyptus wood from reforestation and local volcanic sillar stone, materials that reduce the transportation footprint, provide thermal inertia, lower CO2 emissions, and reinforce Arequipa’s cultural identity, in alignment with Sustainable Development Goals 9, 11, 12, 13, and 15. Unlike precedents in temperate climates, the Chili River corridor faces conditions of high solar radiation, significant thermal amplitude, and limited water availability, which demand adaptive strategies scarcely documented in the literature, such as drought- and metal-resistant vegetation, rainwater storage, anti-soiling maintenance of solar panels, and modular wetlands with hydraulic bypass systems. These solutions constitute an innovative technical framework tailored to the semi-arid environment and high-altitude challenges.
However, its implementation requires inter-institutional and community coordination to ensure long-term sustainability, involving the Provincial Municipality of Arequipa, Sedapar, and the National Water Authority. Economic and technical feasibility will depend on establishing a collaborative management model with mixed public, cooperative, and private funding, supported by environmental and social monitoring protocols based on indicators of water quality, biodiversity, thermal comfort, and energy performance. This monitoring framework will enable adaptive management in response to performance variations or extreme climatic events, ensuring the reliability of the phytoremediation and renewable energy systems.
Overall, the Chili River Green Corridor consolidates an urban intervention model that integrates green infrastructure, clean energy, and local culture under principles of resilience, sustainability, and social inclusion. Its methodological and adaptable nature provides a transferable technical reference for ecological planning in Andean cities with similar climatic and environmental conditions, where future empirical validation can strengthen the scientific and operational foundations of this ecosystem-based urban approach.

5. Conclusions

The Chili River Green Corridor represents an integrated and contextual response to the urban and environmental challenges of Arequipa. More than a landscape intervention, it is conceived as an ecological infrastructure of integration capable of restoring degraded ecosystems, regenerating the urban edge, and strengthening the relationship between the city and its natural surroundings. Through the implementation of phytoremediation, energy self-sufficiency, and the use of local eco-efficient materials such as eucalyptus wood and volcanic sillar stone, the project proposes a territorial model that harmonizes technology, culture, and sustainability in coherence with SDGs 7, 9, 11, 12, 13, and 15.
The main contribution of this study lies in its integral and replicable approach, which adapts global green infrastructure strategies to semi-arid and high-altitude contexts, demonstrating the feasibility of combining ecological sustainability, energy efficiency, and cultural identity within a single territorial framework. While this work addresses the key technical, social, and environmental aspects required for implementation, future research could expand the analysis toward long-term performance assessment, maintenance costs, the real efficiency of phytoremediation systems, and the urban impact of renewable energy. The application of tools such as Life Cycle Assessment and studies on collaborative governance could further strengthen operational sustainability and the replicability potential of the model.
Overall, the Chili River Green Corridor reaffirms the possibility of rethinking the relationship between nature, city, and community from a more just, resilient, and sustainable perspective, consolidating itself as a transferable reference for other Andean cities with comparable environmental conditions.

Author Contributions

Conceptualization, L.K.M., C.M. and J.V.C.; methodology, D.E. and J.V.C.; software, D.E., A.I.L.T., M.V.G., G.W.S.D. and M.M.E.L.; validation, J.V.C.; formal analysis, L.K.M., C.M. and J.V.C.; investigation, L.K.M., C.M. and J.V.C.; resources, L.K.M., C.M. and J.V.C.; data curation, D.E., A.I.L.T., M.V.G., G.W.S.D. and M.M.E.L.; writing—original draft preparation, L.K.M., C.M. and J.V.C.; writing—review and editing, L.K.M., C.M. and J.V.C.; visualization, L.K.M., C.M. and J.V.C.; supervision, D.E. and J.V.C.; project administration, D.E. and J.V.C.; funding acquisition, A.I.L.T., M.V.G., G.W.S.D. and M.M.E.L. All authors have read and agreed to the published version of the manuscript.

Funding

This research received no external funding.

Institutional Review Board Statement

Not applicable.

Informed Consent Statement

Not applicable.

Data Availability Statement

All the data is in the manuscript.

Acknowledgments

We sincerely thank our colleagues for the opportunity to develop an architectural design proposal for “Green Corridor along the Chili River as an Ecosystem-Based Strategy for Social Connectivity and Ecological Resilience in Arequipa, Arequipa, Peru, 2025”.

Conflicts of Interest

The authors declare no conflicts of interest.

References

  1. UN-Habitat. Available online: https://unhabitat.org/?utm_source=chatgpt.com (accessed on 4 September 2025).
  2. Tafur Anzualdo, V.I.; Aguirre Chavez, F.; Vega-Guevara, M.; Esenarro, D.; Vilchez Cairo, J. Causes and Effects of Climate Change 2001 to 2021, Peru. Sustainability 2024, 16, 2863. [Google Scholar] [CrossRef]
  3. Benedict, M.A.; McMahon, E.T. Green Infrastructure: Linking Landscapes and Communities; Island Press: Washington, DC, USA, 2006; Available online: https://islandpress.org/books/green-infrastructure#desc (accessed on 7 July 2025).
  4. Vilchez Cairo, J.; Rodriguez Chumpitaz, A.N.; Esenarro, D.; Ruiz Huaman, C.; Alfaro Aucca, C.; Ruiz Reyes, R.; Veliz, M. Green Infrastructure and the Growth of Ecotourism at the Ollantaytambo Archeological Site, Urubamba Province, Peru, 2024. Urban Sci. 2025, 9, 317. [Google Scholar] [CrossRef]
  5. Raymundo, V.; Vargas, C.; Alcalá, C.; Marin, S.; Jaulis, C.; Esenarro, D.; Huerta, E.; Fernandez, D.; Martinez, P. Green Infrastructure as an Urban Landscape Strategy for the Revaluation of the Ite Wetlands in Tacna. Buildings 2025, 15, 355. [Google Scholar] [CrossRef]
  6. Hanna, E.; Comín, F.A. Urban Green Infrastructure and Sustainable Development: A Review. Sustainability 2021, 13, 11498. [Google Scholar] [CrossRef]
  7. Berman, M.G.; Jonides, J.; Kaplan, S. The Cognitive Benefits of Interacting with Nature. Psychol. Sci. 2009, 19, 1207–1212. [Google Scholar] [CrossRef]
  8. Kaplan, R.; Kaplan, S. The Experience of Nature: A Psychological Perspective; Cambridge University Press: Cambridge, UK; New York, NY, USA, 1989; Available online: https://www.cambridge.org/9780521349390 (accessed on 7 July 2025).
  9. Holthöfer Díaz, Y.R. El Papel de los Espacios Verdes Como Mediador en el Bienestar Psicológico. Master’s Thesis, Universitat de les Illes Balears, Palma de Mallorca, Spain, 2022. Available online: https://dspace.uib.es/xmlui/handle/11201/161719 (accessed on 4 September 2025).
  10. Wan, C.; Shen, G.Q.; Choi, S. Underlying relationships between public urban green spaces and social cohesion: A systematic literature review. City Cult. Soc. 2021, 24, 100383. [Google Scholar] [CrossRef]
  11. Markowitz, E.M.; Nisbet, M.C.; Danylchuk, A.J.; Engelbourg, S.I. What’s That Buzzing Noise? Public Opinion on the Use of Drones for Conservation Science. BioScience 2017, 67, 382–385. [Google Scholar] [CrossRef]
  12. Google Maps. Street View. Available online: https://www.google.com/maps/@-12.0467088,-77.0347329,3a,75y,136.99h,93.97t/data=!3m7!1e1!3m5!1sIAHBjX3eXW5w8bHe8fpRGQ!2e0!6shttps:%2F%2Fstreetviewpixels-pa.googleapis.com%2Fv1%2Fthumbnail%3Fcb_client%3Dmaps_sv.tactile%26w%3D900%26h%3D600%26pitch%3D-3.969999999999999%26panoid%3DIAHBjX3eXW5w8bHe8fpRGQ%26yaw%3D136.99!7i16384!8i8192?entry=ttu&g_ep=EgoyMDI1MTAxMy4wIKXMDSoASAFQAw%3D%3D (accessed on 16 October 2025).
  13. Google Maps. Street View. Available online: https://www.google.com/maps/@40.3973757,-3.7106187,3a,75y,313.83h,87.87t/data=!3m7!1e1!3m5!1snKjGRoTs82dqYjNMkQq-tw!2e0!6shttps:%2F%2Fstreetviewpixels-pa.googleapis.com%2Fv1%2Fthumbnail%3Fcb_client%3Dmaps_sv.tactile%26w%3D900%26h%3D600%26pitch%3D2.1344626097888835%26panoid%3DnKjGRoTs82dqYjNMkQq-tw%26yaw%3D313.82676863609464!7i16384!8i8192?entry=ttu&g_ep=EgoyMDI1MTAxMy4wIKXMDSoASAFQAw%3D%3D (accessed on 16 October 2025).
  14. Comisión Gestora de Zorrotzaurre. Public-Private Partnership for a New Flood-Proof District in Bilbao, Spain. Available online: https://climate-adapt.eea.europa.eu/en/metadata/case-studies/public-private-partnership-for-a-new-flood-proof-district-in-bilbao (accessed on 4 September 2025).
  15. Alvarez, I.; Quesada-Ganuza, L.; Briz, E.; Garmendia, L. Urban Heat Islands and Thermal Comfort: A Case Study of Zorrotzaurre Island in Bilbao. Sustainability 2021, 13, 6106. [Google Scholar] [CrossRef]
  16. Sisson, P. Changing the Grid: How the High Line Transformed New York’s West Side. StreetEasy Blog, 2023. Available online: https://streeteasy.com/blog/changing-grid-high-line/ (accessed on 3 November 2025).
  17. Landscape Performance Institute. Cheonggyecheon Stream Restoration Project—Seoul, South Korea. 2015. Available online: https://www.landscapeperformance.org/case-study-briefs/cheonggyecheon-stream-restoration (accessed on 3 November 2025).
  18. Secretaría de Desarrollo Agrario, Territorial y Urbano (SEDATU). Corredores Verdes Urbanos en Zonas Áridas: Hermosillo y Mexicali, Resultados Piloto. México DF, 2022. Available online: https://www.gob.mx/sedatu/ (accessed on 4 September 2025).
  19. Inter-American Development Bank (IDB); CAF—Development Bank of Latin America; World Resources Institute (WRI). Urban Green Infrastructure I: Challenges, Opportunities, and Good Practice Manual; Inter-American Development Bank: Washington, DC, USA, 2021; Available online: https://publications.iadb.org/publications/spanish/document/Infraestructura-Verde-Urbana-I-Retos-oportunidades-y-manual-de-buenas-practicas.pdf (accessed on 30 October 2025).
  20. Zucchetti, A.; Hartmann, N.; Alcántara, T.; Gutiérrez, C. Green Infrastructure and Nature-Based Solutions for Climate Change Adaptation: Inspiring Practices in Cities of Peru, Chile and Argentina. CDKN Latin America, 2020. Available online: https://cdkn.org/es/resource/infraestructura-verde-y-soluciones-basadas-en-la-naturaleza-para-la-adaptacion-al-cambio-climatico (accessed on 30 October 2025).
  21. Google Maps. Street View of Barakaldo, Spain. Available online: https://www.google.com/maps/@43.2791044,-2.9646658,3a,75y,9.82h,86.71t (accessed on 15 October 2025).
  22. Google Maps. Street View of New York, USA. Available online: https://www.google.com/maps/@40.7483187,-74.004395,3a,75y,211.32h,102.12t (accessed on 15 October 2025).
  23. Google Maps. Street View of Seoul, South Korea. Available online: https://www.google.com/maps/@37.5684283,126.9914341,3a,75y,133.08h,85.72t (accessed on 15 October 2025).
  24. Google Maps. Street View of Puente Verde, Hermosillo, Sonora, Mexico. Available online: https://maps.app.goo.gl/7qY9E5Mz4PRzrKzM9 (accessed on 15 October 2025).
  25. United Nations, Department of Economic and Social Affairs, Population Division. World Urbanization Prospects: The 2024 Revision; United Nations: New York, NY, USA, 2024; Available online: https://population.un.org/wup/ (accessed on 30 October 2025).
  26. United Nations. Cities—Sustainable Development Goal 11: Sustainable Cities and Human Settlements. Available online: https://www.un.org/sustainabledevelopment/cities/ (accessed on 4 September 2025).
  27. Pacto Mundial de Naciones Unidas. ODS 11—Ciudades y Comunidades Sostenibles. Available online: https://www.pactomundial.org/ods/11-ciudades-y-comunidades-sostenibles/ (accessed on 4 September 2025).
  28. Pacto Mundial de Naciones Unidas. ODS 7—Energía Asequible y No Contaminante. Available online: https://www.pactomundial.org/ods/7-energia-asequible-y-no-contaminante/ (accessed on 4 September 2025).
  29. UN-Water. SDG 6 Data Portal. Available online: https://www.sdg6data.org/es (accessed on 4 September 2025).
  30. Statista. Infografía: Porcentaje de Población Urbana por Continente. Available online: https://es.statista.com/grafico/33205/porcentaje-de-poblacion-urbana-por-continente/ (accessed on 4 September 2025).
  31. Ritchie, H.; Samborska, V.; Roser, M. Urbanization. Our World in Data. Available online: https://ourworldindata.org/urbanization (accessed on 4 September 2025).
  32. Urban Development Overview. The World Bank, Washington DC, 2023. Available online: https://www.worldbank.org/en/topic/urbandevelopment/overview (accessed on 30 October 2025).
  33. Comisión Económica para América Latina y el Caribe (CEPAL). Desarrollo Sostenible, Urbanización y Desigualdad en américa Latina y el Caribe: Dinámicas y Desafíos Para el Cambio Estructural; Jordán, R., Riffo, L., Prado, A., Eds.; CEPAL: Santiago, Chile, 2017; Available online: https://repositorio.cepal.org/server/api/core/bitstreams/b83172de-d3d6-4e45-a4d7-e5c2adbc9ff0/content (accessed on 4 September 2025).
  34. Chiesura, A. The role of urban parks for the sustainable city. Landsc. Urban Plan 2004, 68, 129–138. [Google Scholar] [CrossRef]
  35. Programa de las Naciones Unidas para el Medio Ambiente. Contaminación del agua en América Latina y el Caribe (Infografía). Available online: https://agua.org.mx/biblioteca/contaminacion-del-agua-en-america-latina-caribe-infografia/ (accessed on 4 September 2025).
  36. Google Maps. Satellite View of the Río Bravo Region (Mexico–USA border). 2025. Available online: https://www.google.com/maps?ll=29.49819,-101.11378&z=10&t=h (accessed on 15 October 2025).
  37. Google Maps. Satellite View of the Orinoco Basin, Venezuela. 2025. Available online: https://www.google.com/maps/@7.86571,-65.91321,446539m/data=!3m1!1e3 (accessed on 15 October 2025).
  38. Google Maps. Satellite View of the Amazon Basin, Brazil. 2025. Available online: https://www.google.com/maps?ll=-3.26488,-60.36059&z=7&t=h (accessed on 15 October 2025).
  39. NASA. Paraná River Floodplain, Brazil. Visible Earth 2024. Available online: https://visibleearth.nasa.gov/images/77444/parana-river-floodplain-brazil (accessed on 10 August 2025).
  40. Google Maps. Satellite View of the Paraná River Floodplain, Argentina–Paraguay Border. 2025. Available online: https://www.google.com/maps?ll=-27.35701,-56.16041&z=9&t=h (accessed on 15 October 2025).
  41. Instituto Nacional de Estadística e Informática (INEI). Población Peruana Alcanzó los 33 Millones 726 mil Personas en el año 2023. INEI Noticias, 2023. Available online: https://m.inei.gob.pe/prensa/noticias/poblacion-peruana-alcanzo-los-33-millones-726-mil-personas-en-el-ano-2023-14470/ (accessed on 28 August 2025).
  42. Green infrastructure and territorial cohesion. EEA Report No 18/2011. Copenhagen, 2011. Available online: https://www.eea.europa.eu/publications/green-infrastructure-and-territorial-cohesion (accessed on 30 October 2025).
  43. Larrea, V.; Pelaez, F.; Esenarro, D. Design of a Green Corridor and the Revitalization of the Huatanay River, City of Cuzco, Peru—2024. Urban Sci. 2024, 8, 185. [Google Scholar] [CrossRef]
  44. Municipalidad Metropolitana de Lima & Instituto Metropolitano de Planificación. Plan de Desarrollo Metropolitano de Lima 2021–2040 (PLANMET 2040)—Volumen 2: Diagnóstico Urbano y Estrategias Ambientales. Lima, 2022. Available online: https://es.scribd.com/document/639747409/VOLUMEN-2-PLANMET-2040 (accessed on 26 October 2025).
  45. Mayorga, A. Servicios ecosistémicos de las áreas verdes del distrito de Cusco. Tesis de licenciatura, Universidad Nacional de San Antonio Abad del Cusco (UNSAAC). 2021. Available online: https://hdl.handle.net/20.500.12692/91615 (accessed on 26 October 2025).
  46. Montesinos-Tubée, D.; Núñez del Prado, H.; Toni, B.; Álvarez, E.; Borgoño, A.; Zegarra, J.; Gutiérrez, G.; Maldonado, M.; Rodríguez, M.; Riveros, G.; et al. Diversidad florística, comunidades vegetales y propuestas de conservación del monte ribereño en el río Chili (Arequipa, Perú). Arnaldoa 2019, 26, 97–130. [Google Scholar] [CrossRef]
  47. Gobierno Regional de Arequipa. Plan Regional de Reforestación y Forestación de la Región Arequipa 2019–2030. Available online: https://sinia.minam.gob.pe/sites/default/files/siar-arequipa/archivos/public/docs/54.pdf (accessed on 26 October 2025).
  48. Araníbar, C. Comportamiento de la Concentración de Metales Pesados (Cu, Zn, Cr, Pb y Fe) en la Parte Baja del río Chili, Arequipa, 2017–2019; Universidad Nacional de San Agustín de Arequipa: Arequipa, Peru, 2019; Available online: https://alicia.concytec.gob.pe/vufind/Record/UNSA_a6c0e23fd13c61d4f853fedf65d64518/Details (accessed on 26 October 2025).
  49. Google Maps. Available online: https://www.google.com/maps/place/parque+a+medir/@-16.4015596,-71.5453207,3a,75y/data=!3m8!1e2!3m6!1sCIHM0ogKEICAgICD5eijag!2e10!3e12!6shttps:%2F%2Flh3.googleusercontent.com%2Fgps-cs-s%2FAC9h4nrkpjw6OFt0AuBPNRGWlYbhd6LcaFoHStFGmxi0xi4akbNcReCsdmEslFaxos3rAdAvRWKx83GvCkFW_V74kh1Fbw3m_QoVcyYnRno2MGhVQvN0RZCQSyVD3c-8U27-n4XFp4M%3Dw203-h360-k-no!7i1080!8i1920!4m10!1m2!2m1!1sParque+Los+%C3%81ngeles,arequipa!3m6!1s0x91424b321429bb19:0x615c11ada8ae1cfb!8m2!3d-16.4017975!4d-71.5454582!10e5!16s%2Fg%2F11rc93v75q?entry=ttu&g_ep=EgoyMDI1MDgwNi4wIKXMDSoASAFQAw%3D%3D (accessed on 10 August 2025).
  50. Google Maps. Available online: https://www.google.com/maps/place/Parque+del+Maestro/@-16.399777,-71.5480983,3a,75y,90t/data=!3m8!1e2!3m6!1sCIHM0ogKEICAgICq-8eN2AE!2e10!3e12!6shttps:%2F%2Flh3.googleusercontent.com%2Fgps-cs-s%2FAC9h4nrO8MO1M2_OO-99WdoxvFwlqKva2CdMO-OUj6ThQBRl397A7zJXU5PxYBPmLZhuWqdimHwOmYrAonw7jby0TT6KkQa_6mQuAh4nuK_nN4HaeBrD9dLv-LHBRGnHctYIUimfMqIsFw%3Dw203-h271-k-no!7i3472!8i4640!4m7!3m6!1s0x91424a5e00d53ce7:0x469e20286fad9371!8m2!3d-16.3999861!4d-71.5481925!10e5!16s%2Fg%2F1v_vtzd1?entry=ttu&g_ep=EgoyMDI1MDgwNi4wIKXMDSoASAFQAw%3D%3D (accessed on 10 August 2025).
  51. Google Maps. Available online: https://www.google.com/maps/place/Parque+%22Libertad+de+expresi%C3%B3n%22,+C.+Lazo+de+Los+Rios,+Arequipa+04013/@-16.4034579,-71.5484707,3a,75y,90t/data=!3m8!1e2!3m6!1sCIHM0ogKEICAgID4t-D_aQ!2e10!3e12!6shttps:%2F%2Flh3.googleusercontent.com%2Fgps-cs-s%2FAC9h4noVFx44RMsZ7QG7Jp4ePmejw-vNq406RXGQhnJvac91-j-jRI0ltDNIn6zQ1Zw_CKvqImAwU9N2cksIM5aUlZ_SgIhxaXp9gFyXku9_hSst5fqJEDPWf8UuyNHf0Wn2b3i6tlY%3Dw203-h152-k-no!7i3264!8i2448!4m7!3m6!1s0x91424a5fd9bd3d55:0xe8561a3490fcf0d0!8m2!3d-16.4034579!4d-71.5484707!10e5!16s%2Fg%2F11cknft707?entry=ttu&g_ep=EgoyMDI1MDgwNi4wIKXMDSoASAFQAw%3D%3D (accessed on 10 August 2025).
  52. Google Maps. Available online: https://www.google.com/maps/@-16.4000476,-71.5461416,3a,90y,21.73h,87.73t/data=!3m8!1e1!3m6!1sCIHM0ogKEICAgIDElu7UWg!2e10!3e11!6shttps:%2F%2Flh3.googleusercontent.com%2Fgpms-cs-s%2FAB8u6Ha3sLrRyLzeVuC4P3ZrwFLtRVUv1nG3AolrUlSxNOrDMa36znPGXPxvnxbgnmfhAn0_r6fGCgAqHfVFcTu9lKPsEz8b9y3AfSb78Zu1_G7pNOV06TpvYUBh1VVuyOZwoxzDYDMV%3Dw900-h600-k-no-pi2.271415469598722-ya47.72556109829611-ro0-fo100!7i10240!8i5120?entry=ttu&g_ep=EgoyMDI1MDgwNi4wIKXMDSoASAFQAw%3D%3D (accessed on 10 August 2025).
  53. Diario Correo—Arequipa. Aguas Negras en el río Chili y Quebrada Añashuayco de Arequipa. Available online: https://diariocorreo.pe/edicion/arequipa/aguas-negras-en-rio-chili-y-quebrada-anashuayco-de-arequipa-noticia/ (accessed on 4 September 2025).
  54. Diario Viral. Río Chili Contaminado con Vertederos de Basura y Desagüe. Available online: https://diarioviral.pe/gran-tema/rio-chili-contaminado-con-vertederos-de-basura-y-desage--28716 (accessed on 4 September 2025).
  55. Vance, E.D.; Loehle, C.; Wigley, T.B.; Weatherford, P. Scientific Basis for Sustainable Management of Eucalyptus and Populus as Short-Rotation Woody Crops in the U.S. Forests 2014, 5, 901–918. [Google Scholar] [CrossRef]
  56. Vargas, D.E.; Vega, D.J.A.; Cairo, J.V.; Mavila, M.F.V.; Martinez, V.O.R.; Medina, A.G.S. Structural System in Wood and Its Impact on Environmental Design in the Surfer Bungalow in Canoas, Tumbes, Peru. In Proceedings of the 8th ASRES International Conference on Intelligent Technologies ICIT 2023, Jakarta, Indonesia, 15–17 December 2023; Available online: https://link.springer.com/chapter/10.1007/978-981-97-3859-5_34 (accessed on 4 September 2025).
  57. Paredes Quispe, E.J.; Paredes Quispe, E.H. Análisis de la Influencia del Ángulo de Inclinación de Paneles Fotovoltaicos Para la Generación de Energía Eléctrica Utilizando los Modelos Matemáticos de Klucher, Liu & Jordan y Temp & Coulson en Arequipa. Tesis de Grado, Universidad Tecnológica del Perú, 2024. Available online: https://alicia.concytec.gob.pe/vufind/Record/UTPD_bc7417a832008a9e1d7f6a3cc1fc3ac1/Description#tabnav (accessed on 1 November 2025).
  58. Cuya, N.; Estrada, P.; Esenarro, D.; Vega, V.; Vilchez Cairo, J.; Mancilla-Bravo, D.C. Comfort for Users of the Educational Center Applying Sustainable Design Strategies, Carabayllo-Peru-2023. Buildings 2024, 14, 2143. [Google Scholar] [CrossRef]
  59. Grijalva Campoverde, C.X.; Vélez Mosquera, F.D. Estudio e Implementación de un Sistema Fotovoltaico Aplicado a Luminarias: Caso de Estudio Unidad Educativa “Dr. Francisco Falquez Ampuero” [Study and Implementation of a Photovoltaic System Applied to Lighting: Case Study of “Dr. Francisco Falquez Ampuero” Educational Unit]. Bachelor’s Thesis, Universidad Politécnica Salesiana, Guayaquil, Ecuador, 2020. Available online: https://dspace.ups.edu.ec/bitstream/123456789/18646/4/UPS-GT002920.pdf (accessed on 2 November 2025).
  60. Banco Central de Reserva del Perú—Sucursal Arequipa. Caracterización del Departamento de Arequipa. Available online: https://www.bcrp.gob.pe/docs/Sucursales/Arequipa/Arequipa-Caracterizacion.pdf (accessed on 4 September 2025).
  61. Arela-Bobadilla, R.; Riesco-Lind, G.; Chávez, G. Una Mirada a la Expansión de la Ciudad de Arequipa en los Últimos 40 Años. Informe del Centro de Estudios en Economía y Empresa, Universidad Católica San Pablo. Available online: https://ucsp.edu.pe/archivos/CEEE/crecimiento-arequipa-2021-09-06.pdf (accessed on 4 September 2025).
  62. DeltaVolt. Radiación Solar por Departamento. Available online: https://deltavolt.pe/atlas/atlassolar/radiacion-departamento/ (accessed on 4 September 2025).
  63. WebLakes. WRPLOT View (Freeware Wind Rose Plotting Software). Available online: https://www.weblakes.com/software/freeware/wrplot-view/ (accessed on 4 September 2025).
  64. Calcina, D. Análisis—Carta Solar Estereográfica. Available online: https://es.scribd.com/document/532459468/Analisis-carta-Solar-Estereografica (accessed on 4 September 2025).
  65. Diario Correo—Arequipa. Cambio Climático Transformará Ríos. Diario Correo—Arequipa. Available online: https://diariocorreo.pe/edicion/arequipa/cambio-climatico-transformara-rios-881229/ (accessed on 4 September 2025).
  66. Gobierno Regional de Arequipa/SINIA-Ministerio del Ambiente. Mapa CLIMA—PRECIPITACIÓN. Available online: https://sinia.minam.gob.pe/mapas/clima-precipitacion (accessed on 4 September 2025).
  67. Servicio Nacional de Meteorología e Hidrología del Perú (SENAMHI)—Dirección Zonal 06 Arequipa. Datos Hidrometeorológicos en Arequipa: Estaciones Convencionales y Automáticas. Available online: https://www.senamhi.gob.pe/main.php?dp=arequipa&p=estaciones (accessed on 4 September 2025).
  68. Arquitectura PUCP. Cuadernos 14 (Edición Digital). Available online: https://arquitectura.pucp.edu.pe/wp-content/uploads/2018/06/CUADERNOS-14_edicion-digital.pdf (accessed on 4 September 2025).
  69. Gobierno Regional de Arequipa—Autoridad Regional Ambiental. Estrategia Regional y Plan de Acción de la Diversidad Biológica de Arequipa. Available online: https://arma.regionarequipa.gob.pe/uploads/docs/72.pdf (accessed on 4 September 2025).
  70. Ministerio del Ambiente del Perú. Ministro del Ambiente Invita a Disfrutar de la Espectacular Temporada de Florecimiento de la puya Raimondi en el Parque Nacional Huascarán. Available online: https://www.gob.pe/institucion/minam/noticias/1012938-ministro-del-ambiente-invita-a-disfrutar-de-la-espectacular-temporada-de-florecimiento-de-la-puya-raimondi-en-el-parque-nacional-huascaran (accessed on 4 September 2025).
  71. Fernando, P. Flora y Fauna de Arequipa: 14 Especies Fotos. Available online: https://blog.incarail.com/es/flora-y-fauna-de-arequipa (accessed on 4 September 2025).
  72. Gobierno Regional de Arequipa. Mapa de Medio Biológico—Riqueza de Flora de la Región Arequipa. Available online: https://sinia.minam.gob.pe/mapas/mapa-medio-biologico-riqueza-flora-region-arequipa (accessed on 4 September 2025).
  73. Autoridad Nacional del Agua. Plan de Prevención y Reducción del Riesgo Hídrico en Cuencas Costeras del Perú. Available online: https://repositorio.ana.gob.pe/bitstream/20.500.12543/4537/1/ANA0002970_1.pdf (accessed on 28 August 2025).
  74. Montesinos-Tubée, D.B. Plantas Nativas y Endémicas de Arequipa; VICAJFA Foundation: Arequipa, Peru, 2024; 215p, Available online: https://www.researchgate.net/publication/386341945_Plantas_Nativas_y_Endemicas_de_Arequipa (accessed on 28 August 2025).
  75. Comisión Nacional Forestal (CONAFOR). Schinus molle L. [Peruvian Pepper Tree]; Documento técnico de la Subgerencia de Desarrollo Forestal: Guadalajara, Mexico, 2012; Available online: http://www.conafor.gob.mx:8080/documentos/docs/13/1000Schinus%20molle.pdf (accessed on 3 November 2025).
  76. Iturralde, C. Noticias de Montaña. Centro Cultural Argentino de Montaña. Available online: https://revistadigital.culturademontania.org.ar/articulo/646cc8cffc0d3efac6f6e57b (accessed on 3 November 2025).
  77. IJEP. Anticipated Performance Index of Tree Species for Green Belt Development Using Air Pollution Tolerance Index. 2022. Available online: https://www.e-ijep.co.in/42-3-316-327/ (accessed on 3 November 2025).
  78. Medina, R.; Churata, J.; Herrera, M.; Quispe, F. Evaluación del potencial energético de paneles fotovoltaicos en condiciones de radiación solar del sur del Perú. Rev. de Investig. Altoandinas 2023, 25, 347–358. Available online: http://www.scielo.org.pe/scielo.php?script=sci_arttext&pid=S2414-10462023000400347 (accessed on 3 November 2025).
  79. Salazar, L. Evaluación del Comportamiento Hidráulico de Suelos Arenosos Mejorados con Geopolímeros de Ceniza Volante [Evaluation of the Hydraulic Behavior of Sandy Soils Improved with Fly Ash Geopolymers]. Master’s Thesis, Universitat Politècnica de Catalunya, Barcelona, Spain, 2019. Available online: https://upcommons.upc.edu/server/api/core/bitstreams/5a30dc18-2729-4b7f-aaf0-0714d5aab1a7/content (accessed on 3 November 2025).
  80. Nirola, R.; Meghraj, M.; Palanisami, T.; Aryal, R.; Venkateswarlu, K.; Naidu, R. Evaluation of metal uptake factors of native trees colonizing an abandoned copper mine—A quest for phytostabilization. J. Sustain. Min. 2015, 14, 115–123. Available online: https://doi.org/10.1016/j.jsm.2015.11.001 (accessed on 3 November 2025).
  81. Wang, X.; Zhang, W.; He, N.; Zhu, J.; Huang, Y.; Xu, L.; Yu, G. Grassland soil carbon sequestration: Current understanding, challenges, and solutions. Sci. Total Environ. 2022, 850, 158000. Available online: https://www.researchgate.net/publication/362505682_Grassland_soil_carbon_sequestration_Current_understanding_challenges_and_solutions (accessed on 3 November 2025).
  82. Tapia, M.; Fries, A.M. Guía de Campo de los Cultivos Andinos; Organización de las Naciones Unidas para la Agricultura y la Alimentación (FAO): Roma, Italia, 2007; Available online: https://www.fao.org/4/ai185s/ai185s.pdf (accessed on 3 November 2025).
  83. Salas-Luévano, M.A.; González-Rivera, M.L.; Letechepía de León, C.; Hernández-Dávila, V.M.; Vega-Carrillo, H.R. Estabili-zación de Metales Pesados en Jales Mediante Vegetación Endémica e Introducida en Fresnillo, Zacatecas. Biotecnología y Sustentabilidad, Año II, No. 1, Universidad Autónoma de Zacatecas, 2017. Available online: https://revistas.uaz.edu.mx/index.php/biotecnologiaysust/article/download/221/202/646 (accessed on 3 November 2025).
  84. Chrysargyris, A.; Tzionis, A.; Xylia, P.; Tzortzakis, N. Effects of Salinity on Tagetes Growth, Physiology, and Shelf Life of Edible Flowers Stored in Passive Modified Atmosphere Packaging or Treated with Ethanol. Front. Plant Sci. 2018, 9, 17652018. [Google Scholar] [CrossRef]
  85. Horn, C.M.; Guerrero, G.; Tovar, C.; León, B.; Roque, J.; Young, K.R. Queen of the Andes: The ecology and conservation of Puya raimondii. Ecol. Evol. 2024, 14, e11012. Available online: https://www.researchgate.net/publication/377806568_Queen_of_the_Andes_the_ecology_and_conservation_of_Puya_raimondii (accessed on 3 November 2025).
  86. Blanco, J.A. Suitability of Totora (Schoenoplectus californicus (C.A. Mey.) Soják) for Its Use in Constructed Wetlands in Areas Polluted with Heavy Metals. Sustainability 2019, 11, 19. Available online: https://doi.org/10.3390/su11010019 (accessed on 3 November 2025).
  87. Achá, D. (Ed.) Construcción de Humedales Artificiales de Totora: Resultados de Una Experiencia Piloto Para el Altiplano Boliviano; Unidad de Ecología Acuática, Instituto de Ecología—Universidad Mayor de San Andrés (UMSA); Global Environment Facility (GEF); Programa de las Naciones Unidas para el Desarrollo (PNUD); Ministerio de Medio Ambiente y Agua de Bolivia; Institut de Recherche pour le Développement (IRD): La Paz, Bolivia, 2022; Available online: https://observatorio.alt-perubolivia.org/storage/multi/h6FbaFFzTBKUhv7OQj5TiMpO60epNTkBpFgyMH2P.pdf (accessed on 3 November 2025).
  88. Cejas, M.C.; Alonso, J.M.; Bustamante, C.D. Cuantificación de la Captura de CO2 por la Flora Nativa de la Provincia de Córdoba (Argentina); Universidad Católica Argentina (UCA), Facultad de Ciencias Agrarias, Instituto de Ciencias de la Tierra y Am-bientales de La Pampa: Córdoba, Argentina, 2019; Available online: https://repositorio.uca.edu.ar/bitstream/123456789/5761/1/cuantificacion-captura-co2-flora-nativa.pdf (accessed on 3 November 2025).
  89. Ponce, S.R. Análisis del Comportamiento térmico de Materiales de Construcción Convencionales y Ecológicos en la Ciudad de Arequipa; Universidad Alas Peruanas, Facultad de Ingeniería: Arequipa, Peru, 2020; Available online: https://repositorio.uap.edu.pe/xmlui/handle/20.500.12990/8674 (accessed on 3 November 2025).
  90. Lifeder. Fauna de Arequipa: Especies Representativas y Características. Lifeder Ciencia y Educación. 2024. Available online: https://www.lifeder.com/fauna-de-arequipa/ (accessed on 3 November 2025).
  91. Machupicchu Terra. Flora and Fauna in the Arequipa Region. Available online: https://www.machupicchuterra.com/es/guia/flora-fauna-arequipa (accessed on 4 September 2025).
  92. Universidad Nacional de San Agustín de Arequipa (UNSA). Investigadores de la UNSA Realizaron Inventario de Fauna Silvestre en Bosques de Queñua. Oficina Universitaria de Comunicación UNAS. 2023. Available online: https://www.unsa.edu.pe/investigadores-de-la-unsa-realizaron-inventario-de-fauna-silvestre-en-bosques-de-quenua/ (accessed on 3 November 2025).
  93. Consorcio de Investigación Económica y Social. Tratamiento Ecológico, Alternativa Sustentable Para Purificar Aguas Contaminadas Destinadas al Riego de Cultivos en Arequipa. Investigación, Hugo Apaza. 2014. Available online: https://cies.org.pe/investigacion/tratamiento-ecologico-alternativa/ (accessed on 4 September 2025).
  94. Aguilar Córdova, J.E. Evaluación de la Contaminación del río Chili por la Actividad Antrópica en la Ciudad de Arequipa; Universidad Nacional de San Agustín de Arequipa (UNSA), Facultad de Ciencias Biológicas: Arequipa, Peru, 2022; Available online: https://alicia.concytec.gob.pe/vufind/Record/UNSA_a10a484e734593117523459ce72d59d6 (accessed on 3 November 2025).
  95. Instituto Nacional de Gestión Pública (INAGEP). Arequipa: La Sombra del Cáncer Creciente por Contaminación Industrial en el río Chili. INAGEP Noticias, 2024. Available online: https://www.inagep.com/contenidos/arequipa-la-sombra-del-cancer-creciente-por-contaminacion-industrial-en-el-rio-chili (accessed on 3 November 2025).
  96. Salazar Pinto, B.; Cutipa Luque, J.; Ramírez Valverde, G.; Juyo Salazar, R.; Paredes Fuentes, J.; Villanueva Salas, J. Estudio de la contaminación por cromo (Cr) en el río Chili y parque industrial de Río Seco (PIRS), Arequipa—Perú 2015–2016. Rev. Veritas (Univ. Católica De Santa María (UCSM)) 2019, 20, 82–88. Available online: https://revistas.ucsm.edu.pe/ojs/index.php/veritas/article/download/82/88 (accessed on 3 November 2025).
  97. United Nations. Sustainable Development Goals (SDGs). United Nations Department of Economic and Social Affairs. 2015. Available online: https://sdgs.un.org/goals (accessed on 3 November 2025).
  98. Bustamante, R.; Vazquez, P.; Prendes, N. Properties of the Ignimbrites in the Architecture of the Historical Center of Arequipa, Peru. Appl. Sci. 2021, 11, 10571. [Google Scholar] [CrossRef]
  99. Universidad Continental. Trabajo final—Grupo N 06: Seminario de Investigación; Universidad Continental: Junín, Peru, 2023; Available online: https://www.studocu.com/pe/document/universidad-continental/seminario-de-investigacion/trabajofinal-grupo-n06/140004022 (accessed on 3 November 2025).
  100. Ñañez Alcántara, D. Estudio de la Contaminación del río Chili por Efluentes Domésticos e Industriales y su Impacto en la Salud Pública de Arequipa; Universidad Peruana Cayetano Heredia (UPCH), Facultad de Salud Pública y Administración: Lima, Peru, 2019; Available online: https://repositorio.upch.edu.pe/bitstream/handle/20.500.12866/6445/Estudio_NanezAlcantara_Diana.pdf (accessed on 3 November 2025).
  101. Servicio Nacional Forestal y de Fauna Silvestre (SERFOR). Árboles Nativos de Arequipa; Ministerio de Desarrollo Agrario y Riego del Perú (MIDAGRI): Lima, Peru, 2024; Available online: https://repositorio.serfor.gob.pe/bitstream/SERFOR/972/1/SERFOR%202024%20Libro%20arboles%20nativos%20Arequipa.pdf (accessed on 3 November 2025).
  102. Martel C, Cairampoma L. Cuantificación del carbono almacenado en formations vegetales amazónicas en CICRA, Madre de Dios (Perú). Ecol Apl. 2012, 11, 57–65. Available online: http://www.scielo.org.pe/scielo.php?script=sci_arttext&pid=S1726-22162012000200003 (accessed on 3 November 2025).
  103. Huamán-Carrión, M.L.; Espinoza-Montes, F.; Barrial-Lujan, A.I.; Ponce-Atencio, Y. Influencia de la altitud y características del suelo en la capacidad de almacenamiento de carbono orgánico de pastos naturales altoandinos. Sci. Agropecu. 2021, 12, 83–90. [Google Scholar] [CrossRef]
  104. Luza Eyzaguirre, T. Evaluación de la Calidad del Agua del río Chili y su Impacto Ambiental en el Distrito de Cayma, Arequipa; Universidad Continental, Facultad de Ingeniería Ambiental, Arequipa, Peru. 2014. Available online: https://repositorio.continental.edu.pe/bitstream/20.500.12394/7530/3/IV_FIN_107_TE_Luza_Eyzaguirre_2014.pdf (accessed on 3 November 2025).
  105. Panel Solar Perú. Luminaria Solar 100 W 18000 lm Bluesmart Exterior Integrado con Sensor de Movimiento. Available online: https://panelsolarperu.com/384-luminaria-solar-100w-18000lm-bluesmart-exterior-integrado-con-sensor-de-movimiento/ (accessed on 4 September 2025).
  106. Vilchez Cairo, J.; Baca Gaspar, A. Estrategias Neuroarquitectónicas Aplicadas a un Centro de Educación Básica Especial (CEBE) para la Integración Social de Niños con Trastorno del Espectro Autista (TEA) en Lurín-Perú-2022; Universidad Ricardo Palma-URP: Lima, Peru, 2024; Available online: https://repositorio.urp.edu.pe/handle/20.500.14138/9270 (accessed on 26 October 2025).
  107. Pari, L.; Cozzolino, L.; Bergonzoli, S. Rainwater: Harvesting and Storage through a Flexible Storage System to Enhance Agricultural Resilience. Agriculture 2023, 13, 2289. [Google Scholar] [CrossRef]
  108. Mancarella, S.; Branca, G.; Dragoni, F.; Giamperi, L.; Nasini, L.; Proietti, S. Water requirements and crop coefficients of edible, spicy, and medicinal herbs and vegetables; a review aimed at supporting plant and water management. Irrig. Sci. 2024, 42, 1199–1228. [Google Scholar] [CrossRef]
  109. Fernández, F.; Mamani, L.; Choque, M.; Huanca, D. Evapotranspiration Analysis and Irrigation Requirements of Quinoa (Chenopodium Quinoa Willd.) in the Bolivian Altiplano; Universidad Mayor de San Andrés (UMSA): La Paz, Bolivia, 2023; Available online: https://pure.umsa.bo/en/publications/evapotranspiration-analysis-and-irrigation-requirements-of-quinoa/ (accessed on 3 November 2025).
  110. Allen, R.G.; Pereira, L.S.; Raes, D.; Smith, M. ; Food and Agriculture Organization of the United Nations (FAO). Crop Evapotranspiration: Guidelines for Computing Crop Water Requirements—FAO Irrigation and Drainage Paper 56; FAO: Rome, Italy, 1998; Available online: https://www.fao.org/4/x0490e/x0490e0b.htm (accessed on 3 November 2025).
  111. Ecodena—Ecología y Depuración Natural S.L.U. Fitodepuración y Evapotranspiración. Available online: https://ecodena.com/fitodepuracion-y-evapotranspiracion/ (accessed on 4 September 2025).
  112. Zurita, F.; De Anda, J.; Belmont, M.A. Treatment of domestic wastewater and production of commercial flowers in vertical and horizontal subsurface-flow constructed wetlands. Ecol. Eng. 2009, 35, 861–869. [Google Scholar] [CrossRef]
  113. Aguasresiduales. La fitodepuración y Evapotranspiración Para el Tratamiento de Las Aguas Residuales Urbanas e Industriales. Available online: https://www.aguasresiduales.info/revista/reportajes/fitodepuracion-y-evapotranspiracion-para-el-tratamiento-de-las-aguas-residuales-urbanas-e-industriales (accessed on 4 September 2025).
  114. Maderas y Tableros Inti Nova. Maderas y Tableros Inti Nova. Available online: https://maderasintiynova.com/ (accessed on 18 August 2025).
  115. Municipalidad Provincial de Arequipa; MobiliseYour City; Ministerio de Transportes y Comunicaciones (MTC). Plan de Movilidad Urbana Sostenible de Arequipa (PMUS-AQP); MobiliseYour City: Arequipa, Perú, 2022; Available online: https://www.mobiliseyourcity.net/sites/default/files/2024-04/2022-10-23_Documento_PMUS-AQP_VFinal(Word97).pdf (accessed on 3 November 2025).
  116. Panel Solar Perú. Panel Solar 610 W Astronergy Bifacial N-Type TOPCon. Available online: https://panelsolarperu.com/panel-solar-610w-astronergy-bifacial-n-type-topcon/ (accessed on 28 August 2025).
  117. El Comercio Perú. FestiSabores: Así Será el Evento de Ingreso Libre Que Celebra la Cocina de Arequipa. Available online: https://elcomercio.pe/provecho/tendencias/festisabores-fecha-lugar-y-todo-sobre-el-festival-que-celebra-la-cocina-de-arequipa-agenda-fin-de-semana-actividades-gratis-noticia/ (accessed on 4 September 2025).
  118. Municipalidad Provincial de Arequipa. FestiSabores 2024: Celebrando la Gastronomía Arequipeña. YouTube, 3 Noviembre 2024. Available online: https://www.youtube.com/watch?v=YciA1YNkM30 (accessed on 28 August 2025).
  119. Sencia Choquenaira, J. Evaluación de la Calidad del Agua del río Chili Mediante Parámetros Físico-Químicos y Biológicos en el Distrito de Sachaca, Arequipa; Universidad Continental, Facultad de Ingeniería Ambiental: Arequipa, Peru, 2020; Available online: https://repositorio.continental.edu.pe/bitstream/20.500.12394/8679/4/IV_FIN_108_TI_Sencia_Choquenaira_2020.pdf (accessed on 3 November 2025).
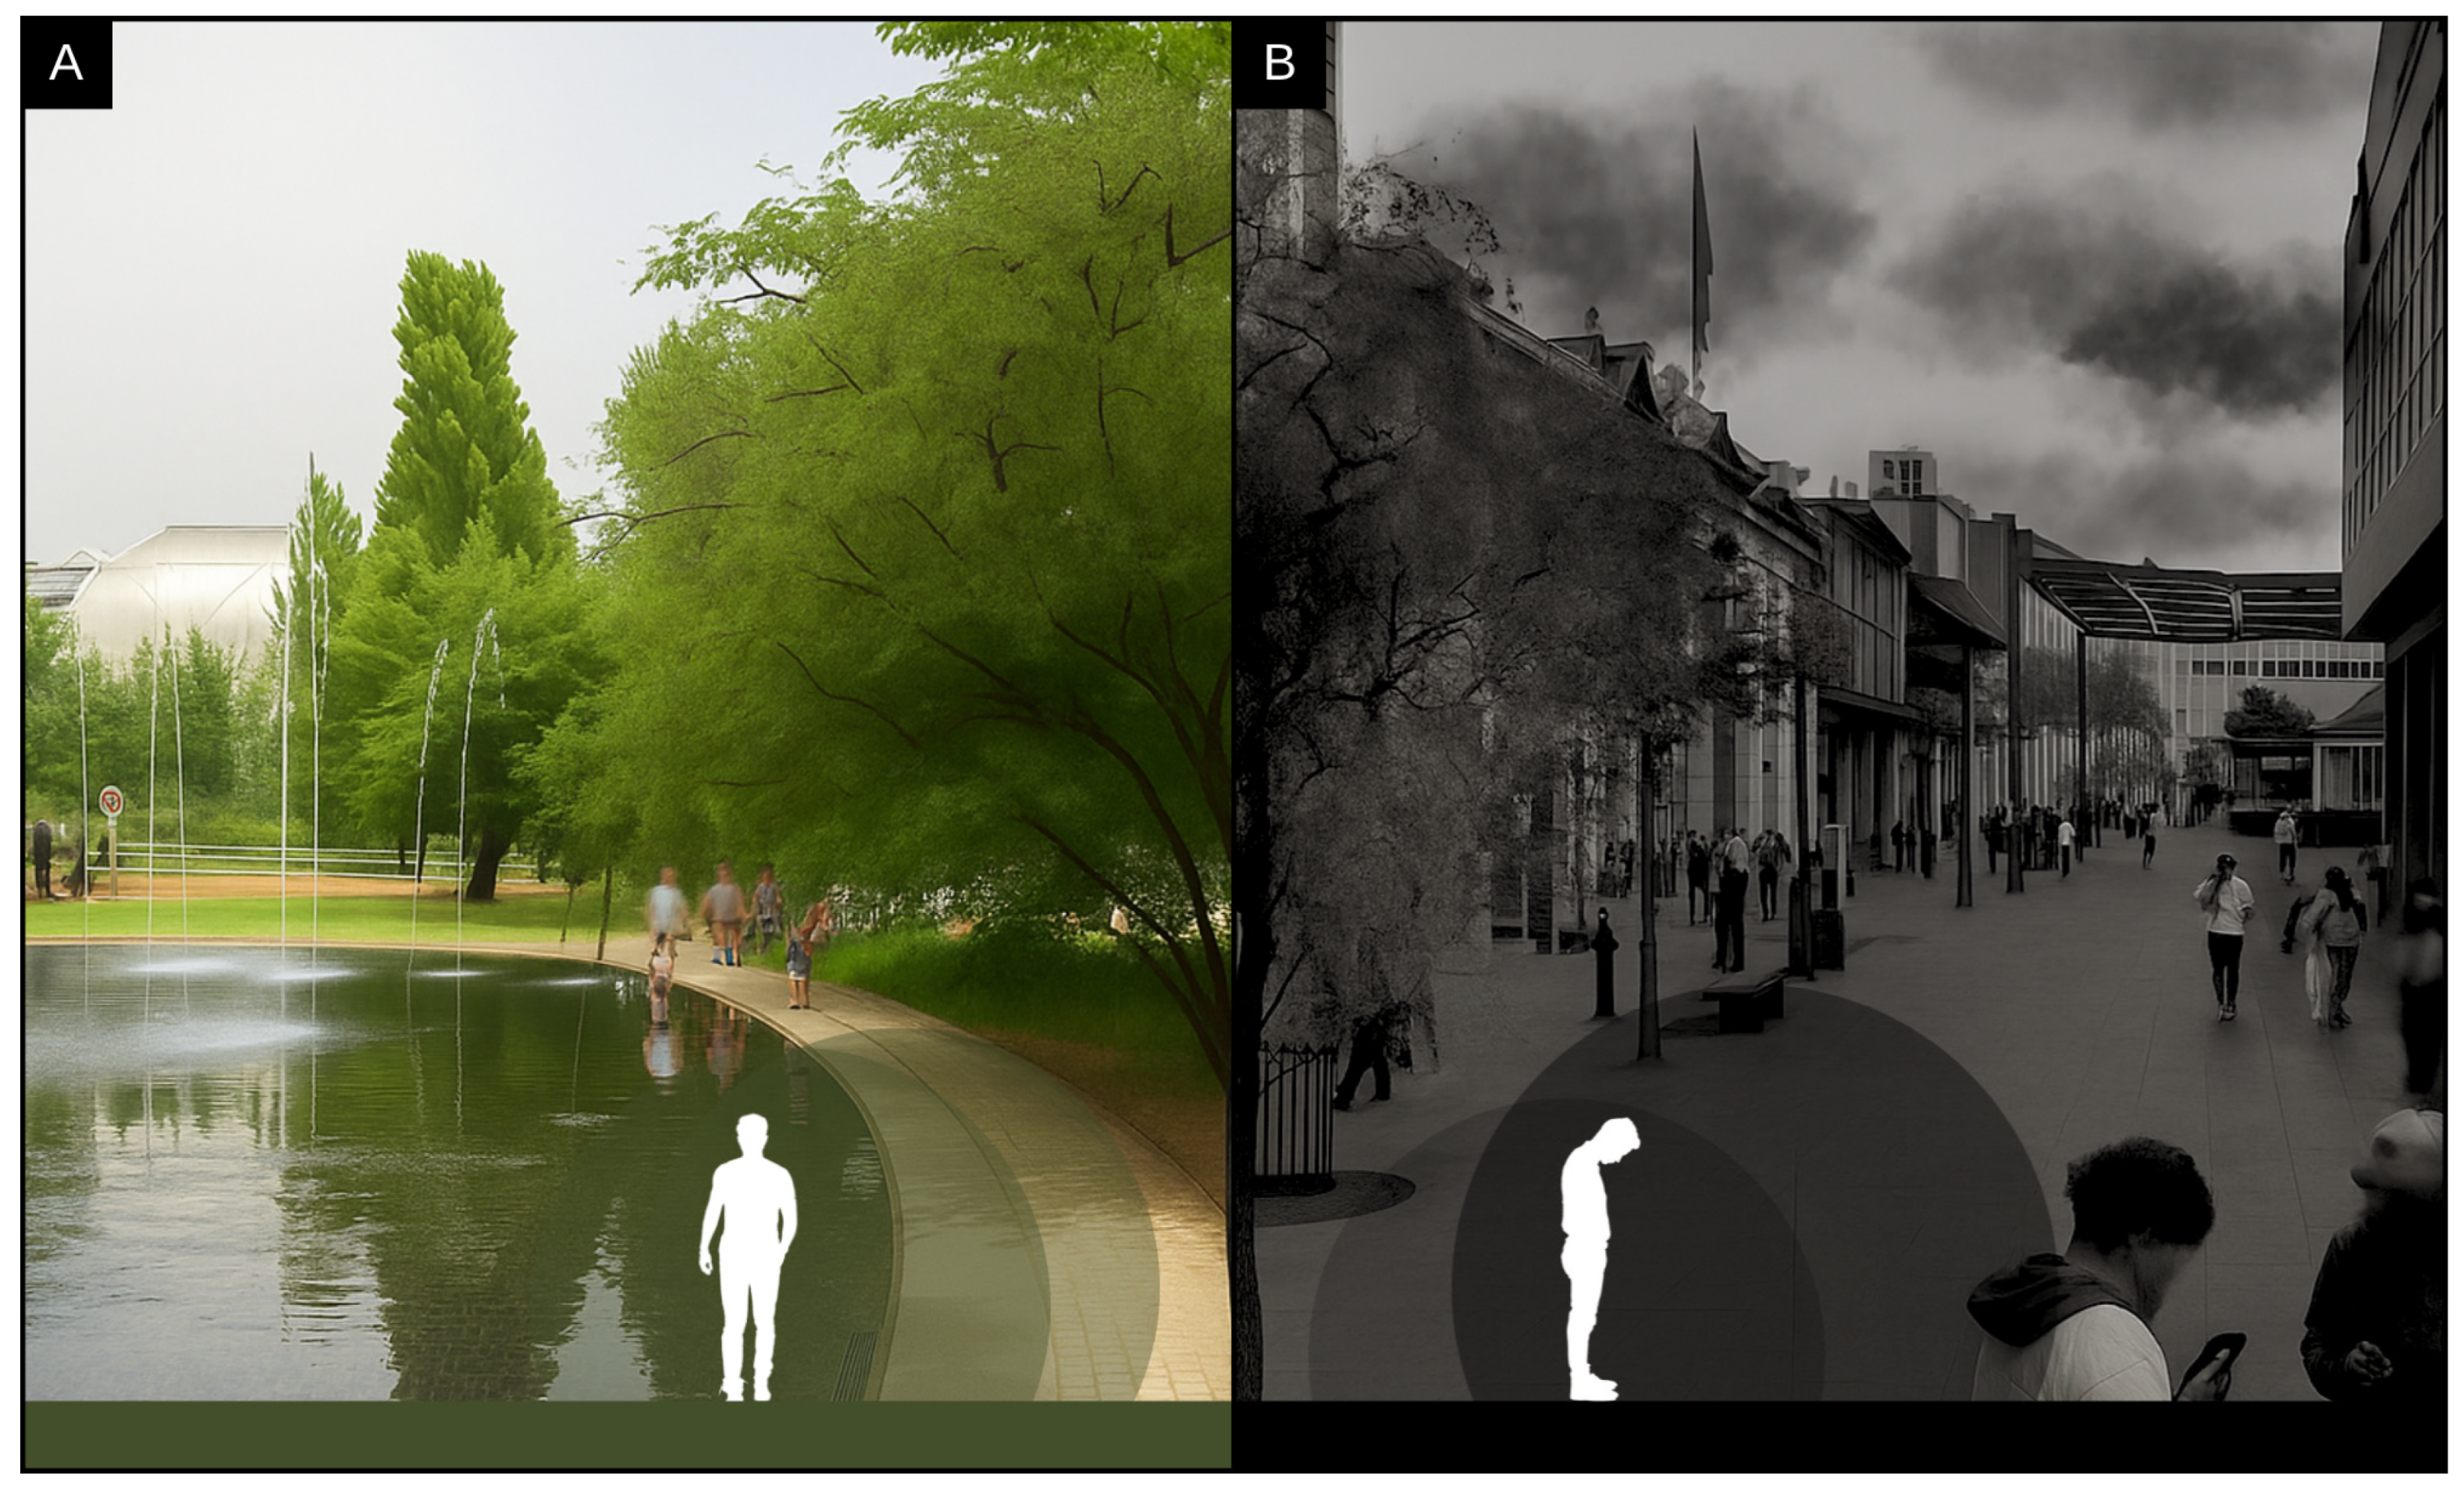
Figure 1. (A) Public spaces with a green corridor, image source: Google Maps © Google, 2025 [12]; and (B) Public spaces without green corridors, image source: Google Maps © Google, 2025 [13]. Figure created by the authors using Adobe Photoshop 2024.
Urbansci 09 00488 g001
Figure 3. Evolution and projection of the urban population by continent. Figure created by the authors using Adobe Photoshop 2024.
Urbansci 09 00488 g003
Figure 4. Comparison of CO2 emissions in Latin America (million tons). Figure created by the authors using Adobe Photoshop 2024.
Urbansci 09 00488 g004
Figure 5. Pollution radius of deltas in Latin America and the Caribbean: (A) Bravo Basin, image source: Google Maps © Google, 2025 [36]; (B) Orinoco Basin, image source: Google Maps © Google, 2025 [37]; (C) Amazon Basin, image source: Google Maps © Google, 2025 [38]; (D) Paranaíba Basin, image source: NASA Visible Earth, 2012 [39]; and (E) Paraná Basin, image source: Google Maps © Google, 2025 [40]. Figure created by the authors using Adobe Photoshop 2024.
Urbansci 09 00488 g005
Figure 6. Site analysis: (A) Urban grid, elaborated by the authors; (B) Longitudinal section, elaborated by the authors; (C) Transversal section, elaborated by the authors; (D) Los Angeles Park, image source: Google Maps © Google, 2025 [49]; (E) Del Maestro Park, image source: Google Maps © Google, 2025 [50]; (F) Libertad de Expresión Park, image source: Google Maps © Google, 2025 [51]; and (G) Simón Rodríguez Park, image source: Google Maps © Google, 2025 [52]. Figure created by the authors using Adobe Photoshop 2024.
Urbansci 09 00488 g006
Figure 7. Methodological framework. Figure created by the authors using Adobe Photoshop 2024.
Urbansci 09 00488 g007
Figure 8. Implementation process of the proposal. Figure created by the authors using Adobe Photoshop 2024.
Urbansci 09 00488 g008
Figure 9. Solar radiation analysis (Grasshopper–Ladybug simulation). (A) Solar analysis of the facility and (B) optimal photovoltaic panel placement. Figure created by the authors.
Urbansci 09 00488 g009
Figure 10. Location of the province of Arequipa. (A) Map of Peru, country; (B) Map of Arequipa, department; and (C) Map of Arequipa, province. Figure created by the authors using Adobe Photoshop 2024.
Urbansci 09 00488 g010
Figure 11. (A) Spring equinox; (B) autumn equinox; (C) summer solstice; and (D) winter solstice. Figure created by the authors using Adobe Photoshop 2024.
Urbansci 09 00488 g011
Figure 12. (A) Climate analysis of the province of Arequipa; and (B) statistical data. Source: Authors’ elaboration. Figure created by the authors using Adobe Photoshop 2024.
Urbansci 09 00488 g012
Figure 13. (A) Givoni bioclimatic chart of Arequipa; and (B) Bioclimatic design strategies. Figure created by the authors using Adobe Photoshop 2024.
Urbansci 09 00488 g013
Figure 14. (A) Flora map of the province of Arequipa; (B) Native flora species; and (C) Cultivated flora species. Figure created by the authors using Adobe Photoshop 2024.
Urbansci 09 00488 g014
Figure 15. (A) Fauna map of the province of Arequipa; (B) Highland fauna species; and (C) Coastal fauna species. Figure created by the authors using Adobe Photoshop 2024.
Urbansci 09 00488 g015
Figure 16. Location of the proposed site within the district of Arequipa, in relation to the Chili River: (A) Connection of the intervention site with the wastewater treatment plant; and (B) Site location of the proposal. Figure created by the authors using Adobe Photoshop 2024.
Urbansci 09 00488 g016
Figure 17. Urban analysis. (A) Urban Density; (B) Urban Road Network; (C) Water Bodies; and (D) Green Areas. Figure created by the authors using Adobe Photoshop 2024.
Urbansci 09 00488 g017
Figure 18. Conceptualization. Figure created by the authors using Adobe Photoshop 2024.
Urbansci 09 00488 g018
Figure 19. (A) Sunken plaza; (B) Workshop modules; (C) Bio-garden; (D) Fair modules; (E) Biodigester—Biofertilizer; (F) Master Plan layout; and (G) Master Plan section. Figure created by the authors using Adobe Photoshop 2024.
Urbansci 09 00488 g019
Figure 20. (A) Biogas; (B) bio-garden; (C) green corridor; (D) master Plan layout; (E) isometric view of a project sector; (F) master Plan section; and (G) vegetation used in the project. Figure created by the authors using Adobe Photoshop 2024.
Urbansci 09 00488 g020
Figure 21. Total green area of the project. Figure created by the authors using Adobe Photoshop 2024 and V-Ray.
Urbansci 09 00488 g021
Figure 22. Photovoltaic solar poles integrated into the ecological corridor. Figure created by the authors using Adobe Photoshop 2024 and V-Ray.
Urbansci 09 00488 g022
Figure 23. (A) 3D general view; (B) vegetation and materials used; and (C) Section of the phytoremediation process. Figure created by the authors using Adobe Photoshop 2024 and V-Ray.
Urbansci 09 00488 g023
Figure 24. (A) Vegetation and materials used; (B) general view; (C) exploded isometric view; and (D) longitudinal section. Figure created by the authors using Adobe Photoshop 2024 and V-Ray.
Urbansci 09 00488 g024
Figure 25. (A) 3D view; (B) Interior 3D view; (C) Materiality; and (D) Section. Figure created by the authors using Adobe Photoshop 2024 and V-Ray.
Urbansci 09 00488 g025
Figure 26. (A) 3D view; (B) materiality; (C) interior; and (D) section. Figure created by the authors using Adobe Photoshop 2024 and V-Ray.
Urbansci 09 00488 g026
Figure 27. (A) 3D view of the biogas system and guinea pig farm; (B) materiality; (C) 3D view of the guinea pig farm; and (D) biogas process. Figure created by the authors using Adobe Photoshop 2024 and V-Ray.
Urbansci 09 00488 g027
Table 1. Parameters of water-use efficiency, pollution tolerance, and carbon sequestration in native Andean species.
SpeciesUseful Precipitation Range (mm/year)Water Required ≈ L/day per 1000 m2Consumption ≈ L/month per 1000 m2Estimated Sequestration ≈ kg CO2/m2/yearEstimated Sequestration ≈ kg C/m2/yearPollution Tolerance (%)
Schinus molle250–600 mm/year [75]60–90 L/day [76]1800–2700 L/month0.25–1.2 kg CO2·m−2·yr−1 [77]0.068–0.33 kg C·m−2·yr−1>70% [78]
Jarava ichu200–400 mm/year [79]15–30 L/day [80]450–900 L/month0.01–0.73 kg CO2·m−2·yr−1 [81]0.0027–0.20 kg C·m−2·yr−130–40%
Tagetes minuta500–700 mm/year [82]30–45 L/day [83]900–1350 L/month0.05–0.15 kg CO2·m−2·yr−1 [84]0.014–0.041 kg C·m−2·yr−140–50% [83]
Puya raimondii300–500 mm/year [80]6–15 L/day [80]180–450 L/month0.02–0.25 kg CO2·m−2·yr−1 [85]0.0055–0.068 kg C·m−2·yr−160–70%
Schoenoplectus californicus500–1500 mm/year [86]20,000 L/day [87]600,000 L/month0.25–1.2 kg CO2·m−2·yr−1 [88]0.068–0.33 kg C·m−2·yr−180–90% [89]
Table 2. Spatial and structural parameters of the corridor based on the habitat requirements of native fauna.
SpeciesMaximum Body Width (m)Minimum Corridor Width (m)Maximum Corridor Width (m)Vegetation Structure/Habitat Type
Vicuña1.2–1.5 [92]5001000Natural high-Andean vegetation, low shrubs, and grasslands
Andean condor2.5–3.0 [90]10002000Open areas with cliffs and sparse native vegetation
Puma1.0–1.5 [92]10003000Mixed forests and shrublands with dense tree cover
Taruca0.8–1.2 [90]5001500Mixed vegetation, queuña forests, and Andean shrublands
Sea lionWide protected coastsNot applicable; marine habitat with sandy and rocky shores
Andean fox0.5–0.8 [71]3001000Andean shrublands and rocky terrains
Table 3. Water quality parameters and applicable phytotechnical measures for the Chili River context.
ContaminantLevel in Chili River (mg/L)Additional NotesPhytoremediation Measures
Lead (Pb)0.12 [94]Exceeds national limit (0.05 mg/L); poses risks to human health and aquatic ecosystems [94]Use of metal-accumulating plants such as carrizo, totora, and rushes
Mercury (Hg)<0.01 (trace) [94]Trace concentrations in sediments; risk of bioaccumulation in the food chain [94]Phytoremediation with plants capable of reducing Hg toxicity, such as native aquatic species
Nitrates (NO3)81 [95]Well above the maximum permissible limit (10 mg/L, WHO); causes eutrophication [95]Plants with nutrient absorption capacity, such as totora and water lilies
Chromium (Cr)0.34 [96]Exceeds national limit (0.1 mg/L); probable origin in industrial activities such as cement production and tanneries [89]Phytoremediation using tolerant plants capable of absorbing or transforming Cr
Table 4. Carbon sequestration parameters and area allocation for native project species.
SpeciesEstimated Sequestration ≈ kg C/m2/yearCanopy Diameter (m)Canopy Area (m2)Total Quantity% of Assigned AreaAssigned Area (m2)
Schinus molle0.068–0.33 kg C·m−2·year−1
[83]
8.0050.2655211530%21.150
Jarava ichu0.0027–0.20 kg C·m−2·year−1
[84]
0.200.0314176225%17.625
Tagetes minuta0.014–0.041 kg C·m−2·year−1
[85]
0.500.1963282020%14.100
Puya raimondii0.0055–0.068 kg C·m−2·year−1
[86]
2.504.908770615%10.575
Schoenoplectus californicus subsp. tatora0.068–0.33 kg C·m−2·year−1
[87]
0.600.2827235010%7.050
Table 5. Technical specifications of the photovoltaic solar pole panel [105].
ComponentManufacturerCityCountryDistributorDimensions (mm)Peak Power (W)Efficiency (%)
Bluesmart Outdoor Integrated with
Motion Sensor
BluesmartShenzhenChinaSolar Panel Peru775 × 675 × 120 mm10024
Table 6. Estimated energy production of photovoltaic solar poles.
ComponentPower per Panel (kW)Daily Solar
Radiation (kWh/m2/day)
Efficiency (%)#PanelsDays per MonthMonthly
Energy (kWh)
Annual
Energy (kWh)
Photovoltaic Solar Pole0.18.20.244430259.83117.3
“#” indicates the numbers of Panels.
Table 7. Water Deficit and Storage Requirements for the Urban Garden Crops.
CropArea (m2)Rainwater Catchment (m2)Total Available Capture (L/m3) [107]Adjusted Deficit (50%) (L)Deficit Remaining After Capture (L)Required Reservoir (L)Reservoir (m3)
Herbs (Kc ≈ 0.6) [108]2020012.762 L = 12.762 m320.0604 L7.2984 L10.3043 L10.30 m3
Quinoa (Kc ≈ 0.5) [109]121207.6572 L = 7.6572 m310.0090 L2.3518 L3.3216 L3.32 m3
Lettuce (Kc ≈ 0.8) [110]8805.104.8 L = 5.1048 m310.7272 L5.6224 L7.936.5 L7.94 m3
Total Urban Garden (40 m2)4040025.524 L = 25.524 m340.7966 L15.2726 L21.562.4 L21.56 m3
Table 8. Technical specifications of the selected solar panel [116].
ManufacturerCityCountryDistributorDimensions (mm)Peak Power (W)Efficiency (%)
SOLAR PANEL 610 W ASTRONERGY BIFACIAL N-TYPE TOPCONAstronergyHangzhouChinaSolar Panel Peru2382 × 1134 × 30 mm61022.6
Table 9. Maximum electrical demand calculation.
DeviceQuantityLoad (W)Installed Power (W)Diversity FactorMax. Demand (M)
Lighting41004001400
Emergency lights16616
Standar Outlets11621620.8129.6
Wi-Fi Outlet120200.816
TOTAL (W)551.6
Table 10. Electrical energy demand in the Workshop Module.
Toral (W)Total (kW)Days per MonthHours per MonthMonthly
Energy (kWh)
Annual
Energy (kWh)
551.60.55162010110.321323.84
Table 11. Solar panel production.
Power per Panel (kW)Daily Solar
Radiation (kWh/m2/day)
Efficiency (%)#PanelsDays per MonthMonthly
Energy (kWh)
Annual
Energy (kWh)
Solar Panel0.618.20.226520113.04521356.5424
“#” indicates the numbers of Panels.
Table 12. Monthly and annual energy supply by source in the Workshop Module.
Monthly
Energy (kWh)
Annual
Energy (kWh)
Electrical Grid110.321323.84
Solar Panel113.04521356.5424
Table 13. Estimated Biogas and Energy Production from Guinea Pig Excreta in the Proposed Biodigester.
ParameterValueExplanation
Daily excreta per guinea pig0.05 kg/dayAverage estimate for an adult guinea pig
Number of guinea pigs in the farm100 guinea pigsGroup size used for calculation
Total daily excreta5 kg/day (0.05 kg × 100)Total mass of excreta generated daily
Specific biogas production0.30 to 0.50 m3 biogas/kg volatile organic matterRange adapted to Arequipa’s altitude and temperature conditions
Estimated daily biogas volume1.5 to 2.5 m3/day (5 kg × 0.30–0.50)Product of excreta and biogas production factor
Biogas energy content6 kWh/m3Energy generated per cubic meter of biogas
Estimated daily energy generated9 to 15 kWh/day (1.5 to 2.5 m3 × 6 kWh/m3)Estimated energy produced per day
Estimated monthly energy270 to 450 kWh/month (9 to 15 kWh × 30)Monthly electrical energy, reflecting energy self-sufficiency
Disclaimer/Publisher’s Note: The statements, opinions and data contained in all publications are solely those of the individual author(s) and contributor(s) and not of MDPI and/or the editor(s). MDPI and/or the editor(s) disclaim responsibility for any injury to people or property resulting from any ideas, methods, instructions or products referred to in the content.