Article

Interplay of Regional Climate Change and Urban Effects: Projected Impacts on Tourism Climate Potential in Szeged, Hungary

Department of Atmospheric and Geospatial Data Sciences, University of Szeged, 2 Egyetem Str., HU-6722 Szeged, Hungary
*
Author to whom correspondence should be addressed.
Urban Sci. 2025, 9(11), 447; https://doi.org/10.3390/urbansci9110447
Submission received: 4 September 2025 / Revised: 14 October 2025 / Accepted: 24 October 2025 / Published: 29 October 2025

Abstract

Climate change exerts wide-ranging impacts on urban tourism, influencing visitor well-being, experiences, and the timing and location of activities. Anticipating future variation in climatic conditions in urban destinations is essential for developing climate-resilient strategies and targeted adaptation measures. This study employs high-resolution (1 km) land surface simulations to assess tourism’s climate potential in Szeged, Hungary. Two tourism climate indices were computed at the urban scale for multiple future periods using bias-corrected datasets under different emission scenarios. The analysis examines whether the model can capture urban-induced alterations in the indices and how these impacts emerge in their spatiotemporal patterns. It also evaluates projected changes in tourism potential, arising from the combined influence of regional climate change and urban climate processes, across scenarios and periods. Results show that the climate-modifying effects of urban surfaces are reflected in both urban–rural and intra-urban variations, with outcomes strongly dependent on the index, season, and scenario. Projections indicate a decline in conditions between May and September, alongside stable or improved potential during other months. The findings underscore the challenges and opportunities posed by climate change and urban modifications, emphasizing the potential to extend the tourism season and the need to improve pedestrian comfort during critical periods.

1. Introduction

Recovering from the impact of the pandemic, tourism is re-emerging as one of the largest and most rapidly growing economic sectors in the world. According to the United Nations World Tourism Organization, Europe recorded 747 million international arrivals in 2024, reflecting a 1% increase over 2019 levels and about a 5% rise relative to 2023 [1]. The World Travel & Tourism Council reported that the European Union’s tourism sector contributed more than 10% to the EU’s economy in 2024, which represents an increase of nearly 6% compared to 2019. This economic share is expected to reach 10.5% in 2025. Employment in the tourism industry exceeded 24.5 million in 2024, representing one out of nine jobs within the region. Projections indicate 26 million employees for 2025, constituting 12% of all EU jobs [2]. In Central European Hungary, the tourism sector also represents considerable economic importance. In 2023, tourism-specific activities contributed 6.3% to the Hungarian economy, reaching 9.3% with multiplier production effects. Additionally, the tourism industry generated 9.1% of national employment in 2023 [3].
Tourism in urban environments is one of the thriving segments in global tourism, given that cities offer plenty of recreational and leisure activities. In Hungary, urban tourism is one of the driving tourism types. Notably, in terms of the number, duration, and expenditure of inbound trips with overnight stays to Hungary, city-oriented sightseeing has become the leading purpose in recent years [4]. Tourism in urban areas creates significant opportunities for the environmental, socio-cultural, and economic development of cities. Urban tourism can revitalize city planning, improve urban infrastructure and public services, build interactions between residents and tourists, and increase employment and revenue for cities [5,6]. On the other hand, mass tourism can pose significant challenges to sustainable urban development through the overuse of public spaces, traffic congestion, increases in greenhouse gas emissions and prices, elevated water consumption, augmented waste generation, pressure on security networks, and the commodification of culture [6,7]. Identifying the impacts of these challenges and combating them through innovative management strategies is essential for the sustainable growth of tourism in urban settings [5,7].
It has long been acknowledged that, besides several natural, social, and economic factors, weather and climate significantly influence all outdoor tourism activities [8,9,10]. Weather and climate can constitute a fundamental resource for the tourism industry and can even serve as tourism attractions [10,11]. By supporting attractions and events, weather and climatic factors substantially affect the behaviour of tourists through their motivation for travel or their selection of tourism destinations and travel times [12,13].
Multiple studies have investigated, primarily at continental or national levels, how tourism might change from the perspective of future climate. The majority of this research has used specialized tourism climate indices. Most studies have attained consistent findings, outlining both spatial and temporal shifts in future conditions (e.g., [14,15,16,17,18]). Specifically, in areas located at higher latitudes (i.e., in the northern parts of Europe and North America), climatic conditions are likely to become more favourable in summer, which may also extend to the transitional seasons (spring and autumn). In lower latitudes (i.e., in the Mediterranean area or the Caribbean), on the other hand, climatic conditions may become less suitable for tourism in summer. At the same time, tourism’s climate potential is likely to improve in the transitional seasons in southern areas. In response to this trend, domestic tourism and the number of international tourist arrivals may increase in the summer period in the northern regions, while a decline in tourism volume is expected in southern areas. As an example, Hein et al. [15] found that while tourism to northwestern Spain was anticipated to increase during the summer, international summer tourism to the entire country would experience a decline due to the significant decrease in tourist numbers in summer.
Numerous pioneering studies have explored at a national level how climate change may affect tourism demand and what factors influence tourists’ destination preferences (e.g., [19,20,21,22]). Most tourism-related climate change impact assessments relied on country-level comparisons, although region-specific evaluations are increasingly important for managing sub-regional and local risks and opportunities. This is underlined by the growing demand for alternative and experience-based tourism targeting local attributes [23].
Recent studies have begun to assess changes in tourism climate conditions and tourism demand in smaller entities (i.e., provinces, districts, or tourism destinations). Barrutiabengoa et al. [18] compared all 50 Spanish provinces and found that southern and eastern provinces are projected to experience considerable declines in summer demand due to increasing heat stress, while there might be recovery in spring and autumn. However, northern regions, which are primarily driven by urban tourism, will likely meet a rising overall demand that is most pronounced in spring and autumn. Aygün Oğur and Baycan [23] selected 30 Turkish provinces relevant for tourism and anticipated a significant drop in summer and overall tourism demand. Moreover, the findings indicated a shift in the peak tourism season from summer toward winter and spring. Lemesios et al. [24] focused on selected popular urban, beach, and mountainous ski tourism destinations in Greece. Considering urban tourism, the results suggested more unfavourable conditions in the peak summer months (particularly in July and August) and a potential to extend the tourism season due to improved conditions in the transitional seasons (April, May, and September, October).
By using distinct thermal comfort indices, studies focusing on individual urban tourism destinations have also shown that residents and tourists are exposed to severe heat stress during the summer months in many cities [25,26,27,28]. Local and micro-scale climatic conditions in urban environments can significantly affect the health, well-being, satisfaction, and behaviour of humans, even causing urban tourists to prefer rural or mountainous destinations compared to overcrowded cities [27]. This could also change tourists’ time–space activities, movements, and intra-destination experiences in cities [29]. Consequently, monitoring the impact of climate system transformations on urban tourism destinations is crucial for engaging tourists and stakeholders in climate-resilient tourism planning and targeted adaptation strategies.
Urban areas significantly interact with the regional climate; thus, when it comes to destination selection, understanding this synergy is of great importance. Even in less populated cities, densely transformed surfaces and anthropogenic activities can alter the overlying boundary layer [30,31]. Since environmental factors (e.g., temperature, wind, and radiation) are the most variable near the surface [32], the well-being of tourists is directly impacted by atmospheric interactions that take place in cities.
As previously indicated, the majority of studies have assessed future tourism’s climate potential at a continental, national, or sub-country (provinces, districts, agglomerations) scale. For this objective, they have predominantly employed regional climate models, which serve as appropriate tools due to their adequate (10–25 km) horizontal spatial resolution. However, current regional climate models are unable to describe local physical processes in sufficient detail due to their coarse resolution and the lack of detailed parameterizations of the underlying physical mechanisms [33,34,35,36]. Considering the urban environment, which is the focus area of this research, complex surface processes are not present in regional climate models or are heavily simplified (e.g., vegetation or rock instead of urban geometry). For a detailed analysis of urban climate processes, city-specific urban canopy models may serve as more appropriate tools. Moreover, for several meteorological variables relevant to tourism (e.g., temperature, humidity, and wind speed), these models provide more detailed and reliable outputs than regional climate models, offering a better representation of local-scale information for impact assessments in urban environments.
In this paper, we employ fine-scale (1 km) land surface model simulations to quantify the climate potential in Szeged, a medium-sized city in Hungary, using various tourism climate indices. To the best of our knowledge, this approach is novel for two key reasons. First, it enables the computation of tourism climate metrics at a highly detailed granularity. Second, the results can be directly applied to intra-urban, site-specific planning of future tourism activities. It should be noted that, for medium-sized cities in Central and Eastern Europe, studies addressing urban climate and tourism climate remain underrepresented in the literature, even though the degree of urban thermal modification and the volume of tourism justify investigating the potential synergies between them [37,38].
In order to overcome the existing limitations of the literature and gain deeper, more grounded insights into the tourism’s climate potential shaped by urban environment and regional climate change, this study aims to address the following research questions:
  • Whether the applied surface model can detect urban-induced alterations in tourism climate indices;
  • How potential urban impacts are displayed in the spatial and temporal patterns of these indices;
  • Assessing projected future changes in tourism climate conditions due to the combined effects of regional climate change and urban climate processes, across different time periods and emission scenarios;
  • Identifying the implications of potential future redistribution of tourism potential for the study area.

2. Materials and Methods

2.1. Study Area

The study city, Szeged, is located in the Southern Great Plain region in the southeast part of Hungary (46°15′ N, 20°10′ E, 75 m a.s.l.) (Figure 1). Szeged is the third most populous city in the country, with 158,000 inhabitants and an area of 281 km2. During the climate period 1991–2020, the annual mean air temperature was 11.4 °C, with the highest values in July and August, and the lowest in January and December. The average annual precipitation sum was 535 mm during this period, while the mean annual sunshine duration reached 2110 h [39].
Szeged is the primary economic, educational, and cultural centre of the Southern Great Plain region. It is the third largest city within the Danube–Criș–Mureș–Tisa (DKMT) Euroregion. The Szeged region serves as a significant tourism destination in Hungary. In 2024, tourist accommodation establishments recorded a total of 443,000 arrivals, comprising 273,000 domestic and 170,000 international tourists. The total number of overnight stays reached 892,000, with 567,000 domestic and 325,000 international visitors [40]. The peak months for tourism activities are August and July for both domestic and international tourists [41].

2.2. Applied Tourism Climate Indices

In this study, the climate suitability of the city for tourism activities is quantified by two indices tailored to tourism climate: the urban type of the Holiday Climate Index (HCI-Urban [42]) and the modified form of the Tourism Climate Index (mTCI [43,44]). Both metrics build upon the concept of the seminal Tourism Climate Index (TCI [8]) and were developed to address some of its limitations. Each of the indices focuses on activities conducted in the urban environment, i.e., sightseeing, recreation, shopping, or other light physical activities. Both indices rely on numerous meteorological variables relevant to tourism. These parameters are combined into sub-indices, which are then rated by scores, with higher scores indicating better conditions for urban tourism. Finally, the rating scores are weighted by their relative importance and summed, resulting in a composite, dimensionless index value. The calculation formula of mTCI and HCI-Urban (the latter hereinafter referred to as HCI) is given in Equations (1) and (2), respectively.
mTCI = 2 ( 4 C I d + C I a + 2 P + 2 S + W )
HCI = 4 T C + 2 A + 3 P + W
Humidex = T + 5 9 × 6.112 × 10 7.5 × T 237.7 + T × R H 100 10
Each index includes thermal comfort, aesthetic (sunshine or cloudiness), and physical (precipitation and wind speed) sub-indices. In the formula of mTCI (Equation (1) [43,44,45]), CId means the daytime thermal comfort index, while CIa is the daily thermal comfort index. CId is based on the daily maximum Physiologically Equivalent Temperature (PET [46]) (°C), which is calculated from the daily maximum air temperature (°C), daily minimum relative humidity (%), daily mean wind speed (m/s), and daily mean cloud cover (octa) or global radiation (W/m2) data. CIa sub-index relies on the daily mean PET, which is computed using daily mean values of air temperature, relative humidity, wind speed, and cloud cover or global radiation data. In Equation (1), the sub-indices P, S, and W represent daily precipitation sum (mm), sunshine duration (hours), and mean wind speed (km/h), respectively.
The formula of HCI (Equation (2) [42]) contains the thermal comfort index TC, aesthetic index A, precipitation index P, and wind speed index W. Here P and W are based on the same variables as those for mTCI, while A applies the daily mean cloud cover (%). For the sub-index TC, the Canadian Humidex (°C) is usually applied [47], where daily maximum air temperature (T, °C) and daily mean relative humidity (RH, %) are commonly taken for calculation (Equation (3) [47]).
The main novelty of the mTCI index in comparison to TCI lies in the incorporation of the PET index into its thermal comfort components (CId and CIa), along with the development of corresponding PET-based rating score schemes [43,44]. These PET systems were based on the seasonally different thermal perception patterns of Hungarian residents, which were determined from an extensive outdoor thermal comfort survey conducted in Szeged [43,48]. Data collection took place between spring and autumn; therefore, the winter period is excluded from the analysis with mTCI. The mTCI index has been applied to describe tourism climate conditions in various Hungarian and other European tourism destinations, as well as for all of Hungary [43,44,45,49].
The overall index scores of both the HCI and mTCI typically range from 0 to 100, where higher (lower) values signify more favourable (less favourable) climatic conditions for urban tourism activities. Detailed conceptual and methodological aspects of mTCI development, including its sub-index rating systems, are presented in Kovács et al. [43,44], while the applied form of HCI is thoroughly described by Scott et al. [42] and Rutty et al. [50].

2.3. SURFEX Model and Configuration

To describe the urban impacts on tourism climate conditions in Szeged, the SURFEX land surface model (Surface Externalisée [51]) is employed. The model data were provided by the HungaroMet Hungarian Meteorological Service, produced within the framework of the KlimAdat research project [52]. During this project, SURFEX outputs for the main meteorological variables (e.g., temperature and wind speed) were validated in detail for Szeged and Budapest by HungaroMet [34,36,53,54]. Additionally, future projections for these cities concerning the basic meteorological parameters were conducted and thoroughly assessed by Allaga-Zsebeházi [36,55,56]. In the present study, we use these data to compute tourism climate metrics at the urban level.
SURFEX describes the physical processes and interactions between the surface and some 10 m layers of the atmosphere. The model distinguishes four main surface types: natural land, urban, inland water, and sea. Each grid cell in the model contains a specified fraction of these surface types, and for each type, a dedicated scheme calculates the corresponding prognostic variables and turbulent fluxes. The total flux of the grid cell is then obtained by summing the individual fluxes, weighted according to their respective surface fractions [36,53,56]. The studied city and its vicinity encompass the urban and natural land surface types, with no pixels representing large water bodies in the investigated region. Over urban surfaces, the Town Energy Balance scheme (TEB [57]) performs the calculation, while processes over natural land surfaces are described by the Interactions between Soil–Biosphere–Atmosphere scheme (ISBA [58]). The surface types of each grid cell and other parameters associated with the surface (e.g., building height, street width, albedo, vegetation type and height) are produced by the ECOCLIMAP global surface database [59] with a horizontal resolution of 1 km.
Model outputs used in this study were based on an offline application of SURFEX; that is, atmospheric forcings were provided by an external atmospheric model. Specifically, atmospheric data were obtained from the ALADIN-Climate v5.2 regional climate model (hereinafter called ALADIN), implemented by HungaroMet [35,60,61]. The lateral boundary conditions for ALADIN data were derived from the CNRM-CM5 earth system model [62], which was downscaled to a horizontal resolution of 10 km. The atmospheric data provided by ALADIN included air temperature, humidity, wind speed and wind direction, downward shortwave and longwave radiation, surface pressure, and snow and rain. The future anthropogenic activity in ALADIN simulations was described by the RCP4.5 and RCP8.5 scenarios (Representative Concentration Pathways [63]). RCP4.5 represents a moderate pathway for greenhouse gas concentration trajectories, whereas RCP8.5 assumes high and continuously rising emissions throughout the 21st century. RCP4.5 projects an increase in global mean air temperature of 1.4 °C (likely range: 0.9–2.0 °C) for the period 2046–2065, and 1.8 °C (1.1–2.6 °C) for 2081–2100, relative to the 1986–2005 baseline. Under RCP8.5, temperatures are expected to rise by 2.0 °C (1.4–2.6 °C) by the mid-21st century and 3.7 °C (2.6–4.8 °C) by the late century. Considering the pre-industrial period (1850–1900) as the reference, RCP4.5 indicates a mean temperature increase of 2.5 °C (1.7–3.3 °C), while RCP8.5 projects an increase of 4.3 °C (3.2–5.4 °C) by the end of the century. During the preprocessing of the data by HungaroMet, the 10-km resolution ALADIN outputs were interpolated to 1-km resolution, taking the topography and air stratification into account. Then, future urban projections were performed with SURFEX for Szeged and Budapest for the period 2006–2100. Additionally, a control experiment was performed for the period 1960–2005 to serve as a reference and for model validation [36,53,55,56].
Comprehensive details about the adapted SURFEX model and the simulation settings can be found in Allaga-Zsebeházi [36]. It is important to note that the driving 10-km resolution ALADIN data, along with other regional climate model outputs, have been used for tourism climate purposes in our previous study for the area of Hungary [45]. In that study, we calculated the same climate indices for the same periods as in the present research. This research constitutes a logical progression from the prior study by using fine-scale land surface model data for a single urban tourism destination.

2.4. Data Processing

The HCI and mTCI indices were calculated using daily data on the relevant meteorological variables described in Section 2.2. All datasets were obtained from HungaroMet (Budapest, Hungary). For the TC component of HCI, the Humidex formula (Equation (3)) was applied, calculated using daily maximum air temperature and mean relative humidity. For PET calculation, required for mTCI, daily mean cloud cover data were used in addition to the above-mentioned variables. PET values were derived using the RayMan radiation and bioclimate model [64].
Future tourism climate conditions were analyzed for the climate periods 2041–2070 and 2071–2100, considering the RCP4.5 and RCP8.5 anthropogenic scenarios. For the reference period, the last thirty-year climate period that does not overlap with the model period was selected (i.e., 1971–2000).
During the data processing, three substantial datasets were utilized. First, SURFEX model data with a resolution of 1 km were applied for the reference and future periods. Second, the driver ALADIN model data with a resolution of 10 km were used for the reference and future periods. Lastly, an observational database was also required for the reference period to characterize the reference conditions and ensure bias correction of the model data. For this purpose, the database CarpatClim-HU, developed by HungaroMet, was applied [65]. This database comprises homogenized meteorological measurement data interpolated to a regular 0.1° (approx. 10 km) resolution grid across Hungary. Data was available on the same grid as the 10-km ALADIN model data. The SURFEX model domain included 19 × 19 grid points across Szeged and the surrounding area, whereas the ALADIN and CarpatClim-HU domains covered identically 4 × 2 grid points due to the coarser resolution. Key details of the main datasets utilized in this study are summarized in Table 1.
It is essential to point out that urban canopy surface energy balance models, like SURFEX, are not capable of explicitly simulating the effect of cities on precipitation sum and cloudiness or sunshine conditions due to their limited focus on the bottom atmosphere. These models can rather provide critical information about urban effects on temperature, humidity, and wind speed [36]. It is important to add that the impact of cities on precipitation and cloudiness or sunshine conditions is low, particularly in the case of a medium-sized city like Szeged; therefore, the added value of surface models would likely be limited. Consequently, these variables were estimated from the driving ALADIN outputs.
Since both regional and urban climate projections are burdened with uncertainties, a bias-correction procedure should be applied to these databases. The process requires the existence of gridded observational data, with a spatial resolution comparable to the model results. This applies only to the 10-km ALADIN model data, since a 1-km gridded reference (observational) dataset that reflects urban features is not available for Hungary [36]. Therefore, additional adjustments should be introduced to obtain corrected urban climate projection data. The principles of corrections applied in this study follow the methodology of KlimAdat project [52] and Allaga-Zsebeházi [36,55,56] and are described in the following sections.
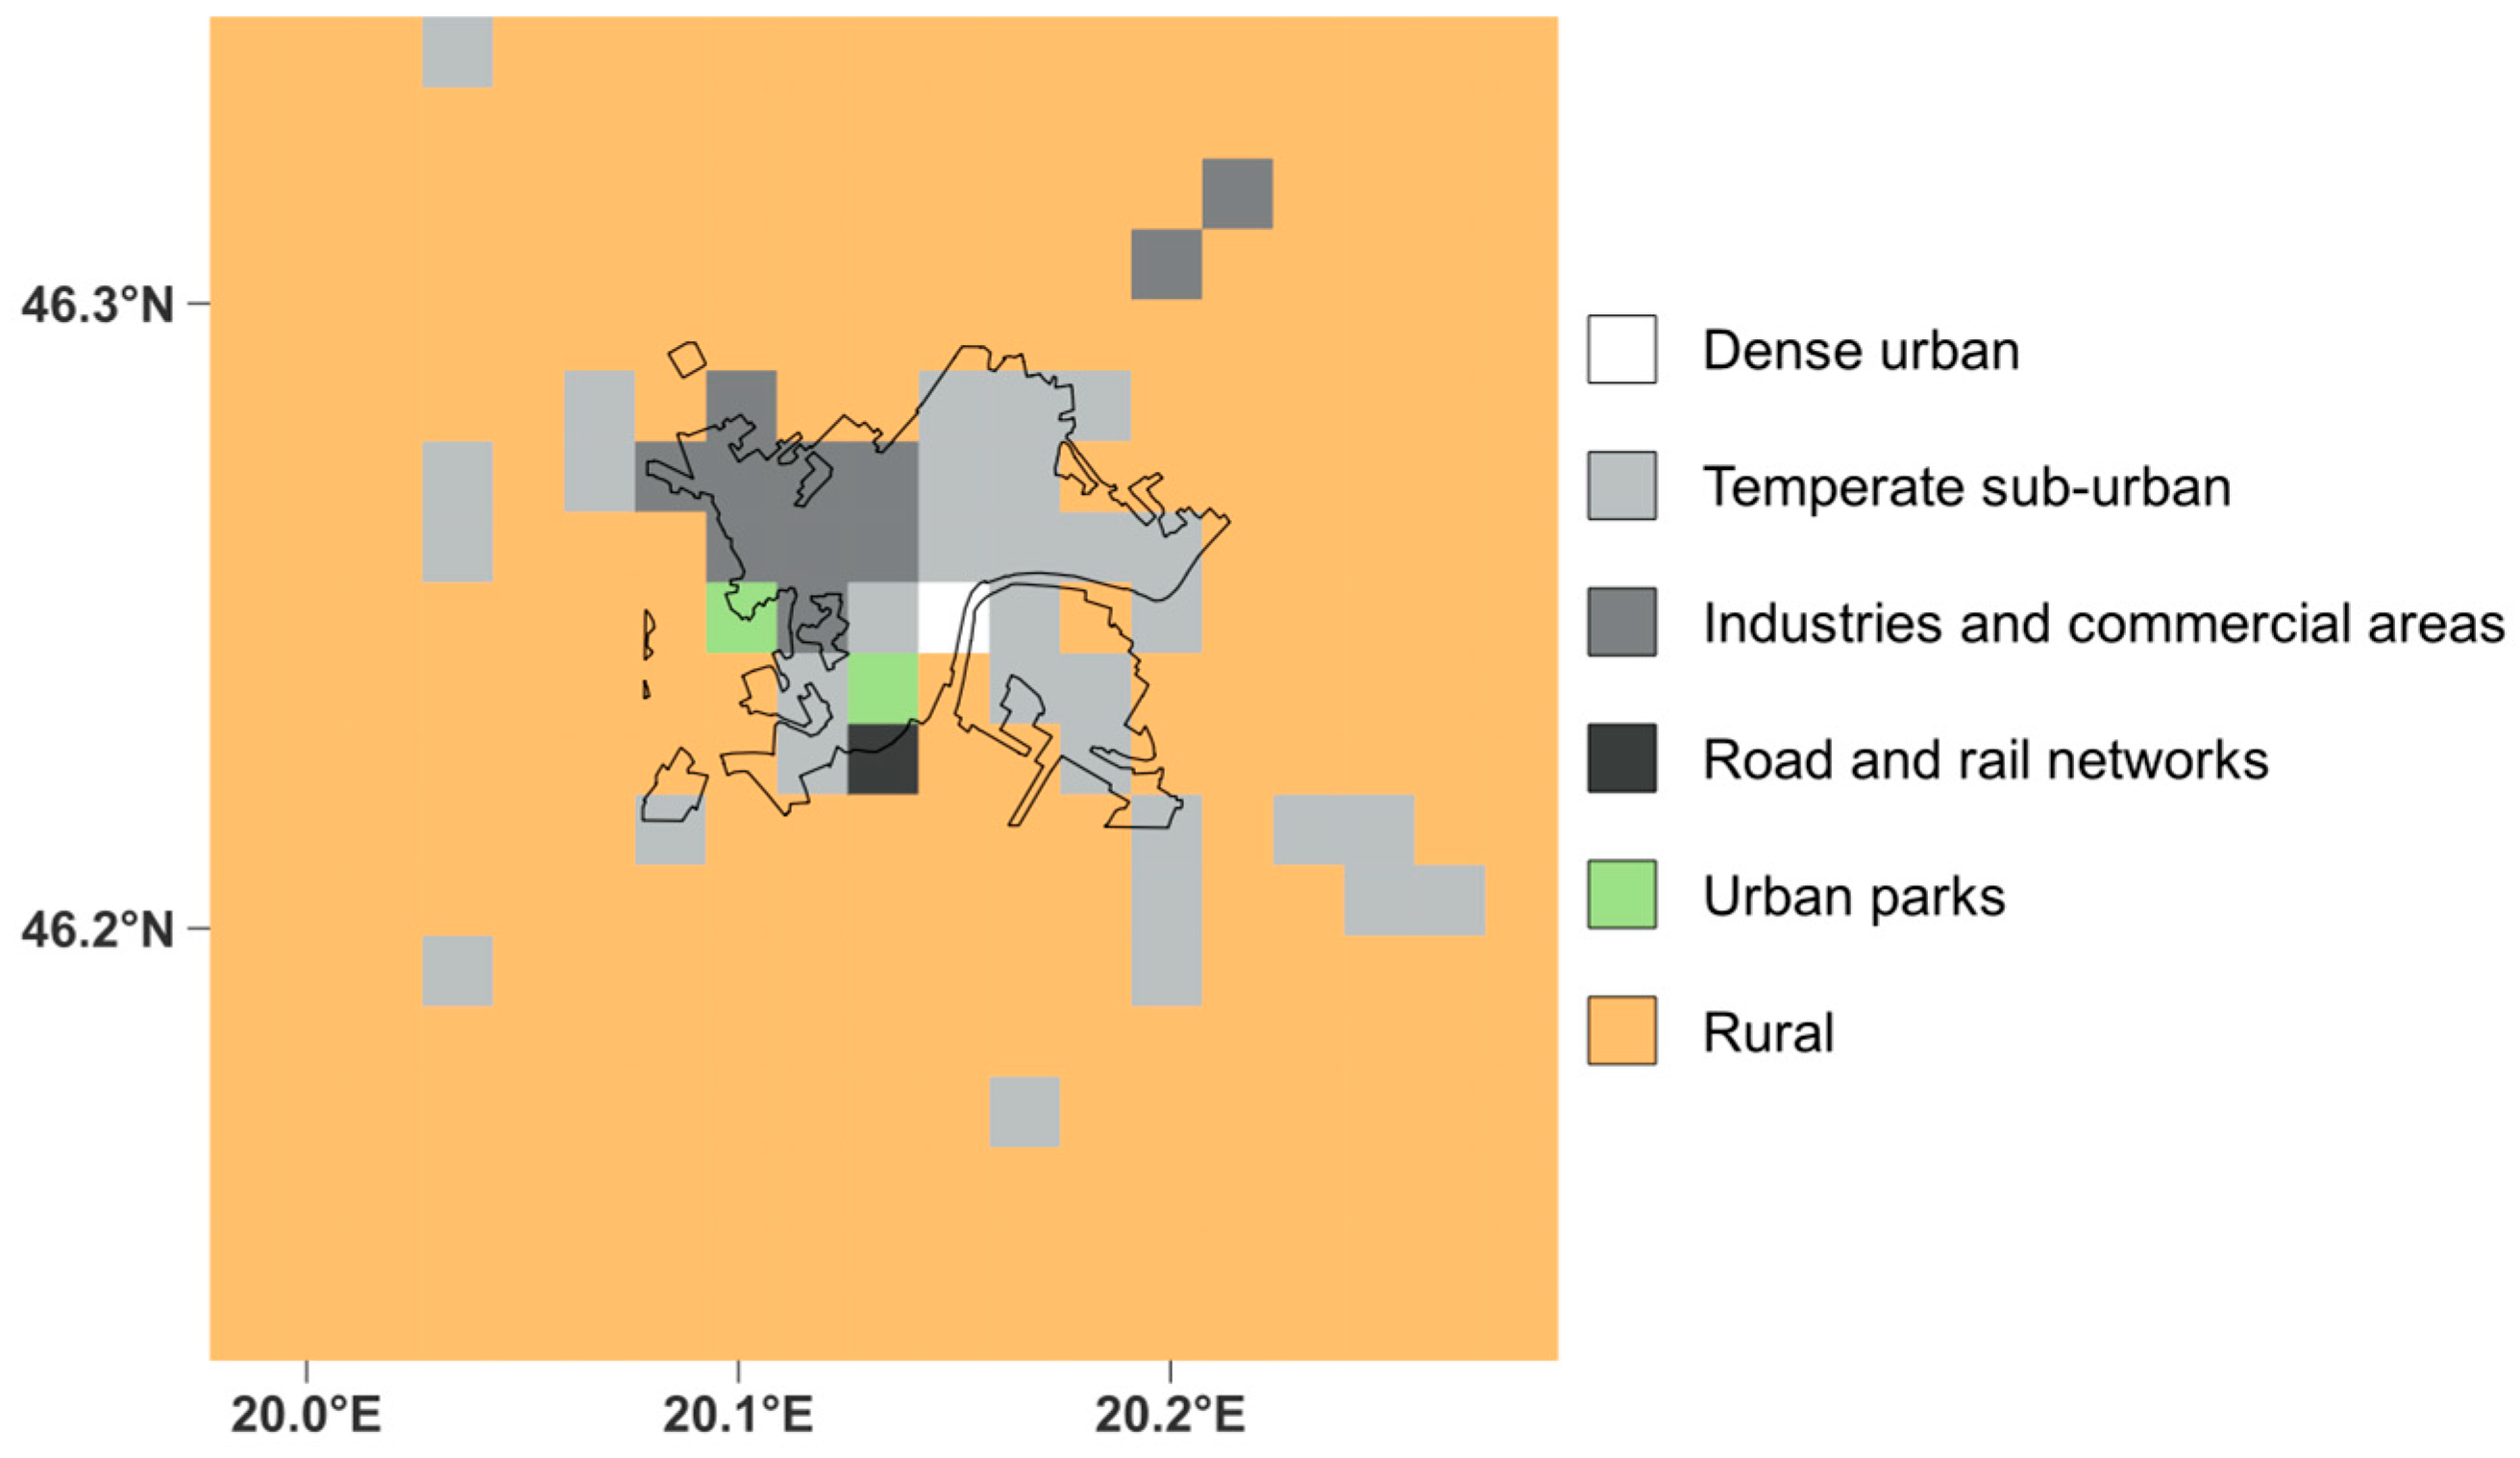
The correction procedure requires the separation of urban and adjacent non-urban (rural) grid points. For this process, the list of ECOCLIMAP land cover classes used in SURFEX was utilized ([66]; Chapter 4.4.2.5), identifying 14 urban or rural surface types present within the study area. We classified the classes ‘Dense urban’, ‘Temperate sub-urban’, ‘Industries and commercial areas’, ‘Road and rail networks’, and ‘Urban parks’ as urban, while all remaining types were considered rural. Most of the rural grid cells are dominated by Central European crops. The resulting land cover classification used in this research is illustrated in Figure 2, whereas key parameters of the different urban land cover types are depicted in Table 2.
The employed bias-correction method consisted of three major steps. First, the 10-km ALADIN regional climate model outputs were corrected using the CarpatClim-HU observational database as a reference. Second, the corrected ALADIN data were interpolated to the 1-km grid of SURFEX over the study area. Lastly, the ‘urban signature’ simulated by SURFEX was added to the bias-corrected, interpolated ALADIN values. In the first step, precisely, bias adjustment of ALADIN data was carried out using the delta method [67]. This process involved calculating the differences at each ALADIN grid point between future values (2041–2070, 2071–2100) and values for the model reference (1971–2000), and then adding these differences to the observed data from the same reference period (CarpatClim-HU; 1971–2000). It should be noted that for the precipitation sum and sunshine duration variables, the delta values were calculated by multiplying by relative changes rather than using a signed sum [56,68]. In the second stage of corrections, the nearest neighbour search (NNS) geospatial optimization method was utilized to interpolate the 10-km ALADIN values to the 1-km SURFEX grid. Then, during the third phase, from each 1-km SURFEX grid cell data classified as urban, the mean value of adjacent rural grid point data was subtracted, producing the simulated ‘urban signature’. Finally, these differences were added to the corresponding bias-corrected, urban ALADIN grid point data. It should be noted that for the variables excluded from SURFEX (i.e., precipitation sum, sunshine duration, and cloud cover), the third phase could not be performed; therefore, the interpolated 1-km ALADIN values were used for index calculation.
For describing the reference conditions (1971–2000), due to the lack of a database with adequate resolution and urban representation, the same correction method as detailed above was performed by applying the CarpatClim-HU observational database. Notably, each 10-km observational value was interpolated to the above-mentioned 1-km grid. Then, in the case of the variables available from SURFEX, the ‘urban signature’ of the model was added to the 1-km interpolated values. The latter was produced using the same technique as for future data, but with the SURFEX database for the period 1971–2000. For the parameters not simulated by SURFEX, only the spatial adjustment was carried out. Finally, it should be highlighted that the delta method, which was the first step in future data corrections, was not needed for this procedure.
After implementing all bias corrections, HCI and mTCI values were computed from the corrected individual daily variables for the reference period (1971–2000) as well as for the future periods considering the applied RCP scenarios (2041–2070 RCP4.5, 2041–2070 RCP8.5, 2071–2100 RCP4.5, 2071–2100 RCP8.5). The dataset on tourism climate indices generated and analyzed in this study is included in Supplementary Materials S1. Following the index calculation, the spatial distribution of indices was plotted on maps for Szeged at a monthly level. For this purpose, monthly means of the daily index data were computed for each grid point for the five studied cases. The HCI results covered the entire year, whereas the mTCI maps, given the construction of the mTCI index (Section 2.2), were generated for the months between March and November.
In summary, the workflow for data processing included the following main steps:
  • A multi-step bias-correction procedure was applied to the basic data from the ALADIN regional climate model and fine-scale SURFEX model, prepared by HungaroMet;
  • Using the bias-corrected data, daily values of the two tourism climate indices were calculated for both the reference period and future periods under different emission scenarios;
  • For each case, the spatial distributions of the indices were presented in monthly maps.
At this point, it should be noted that the model simulations, their bias corrections, and the applied indices may be subject to certain inherent limitations and uncertainties. Following the presentation of the specific results, these constraints are discussed in Section 4.

3. Results

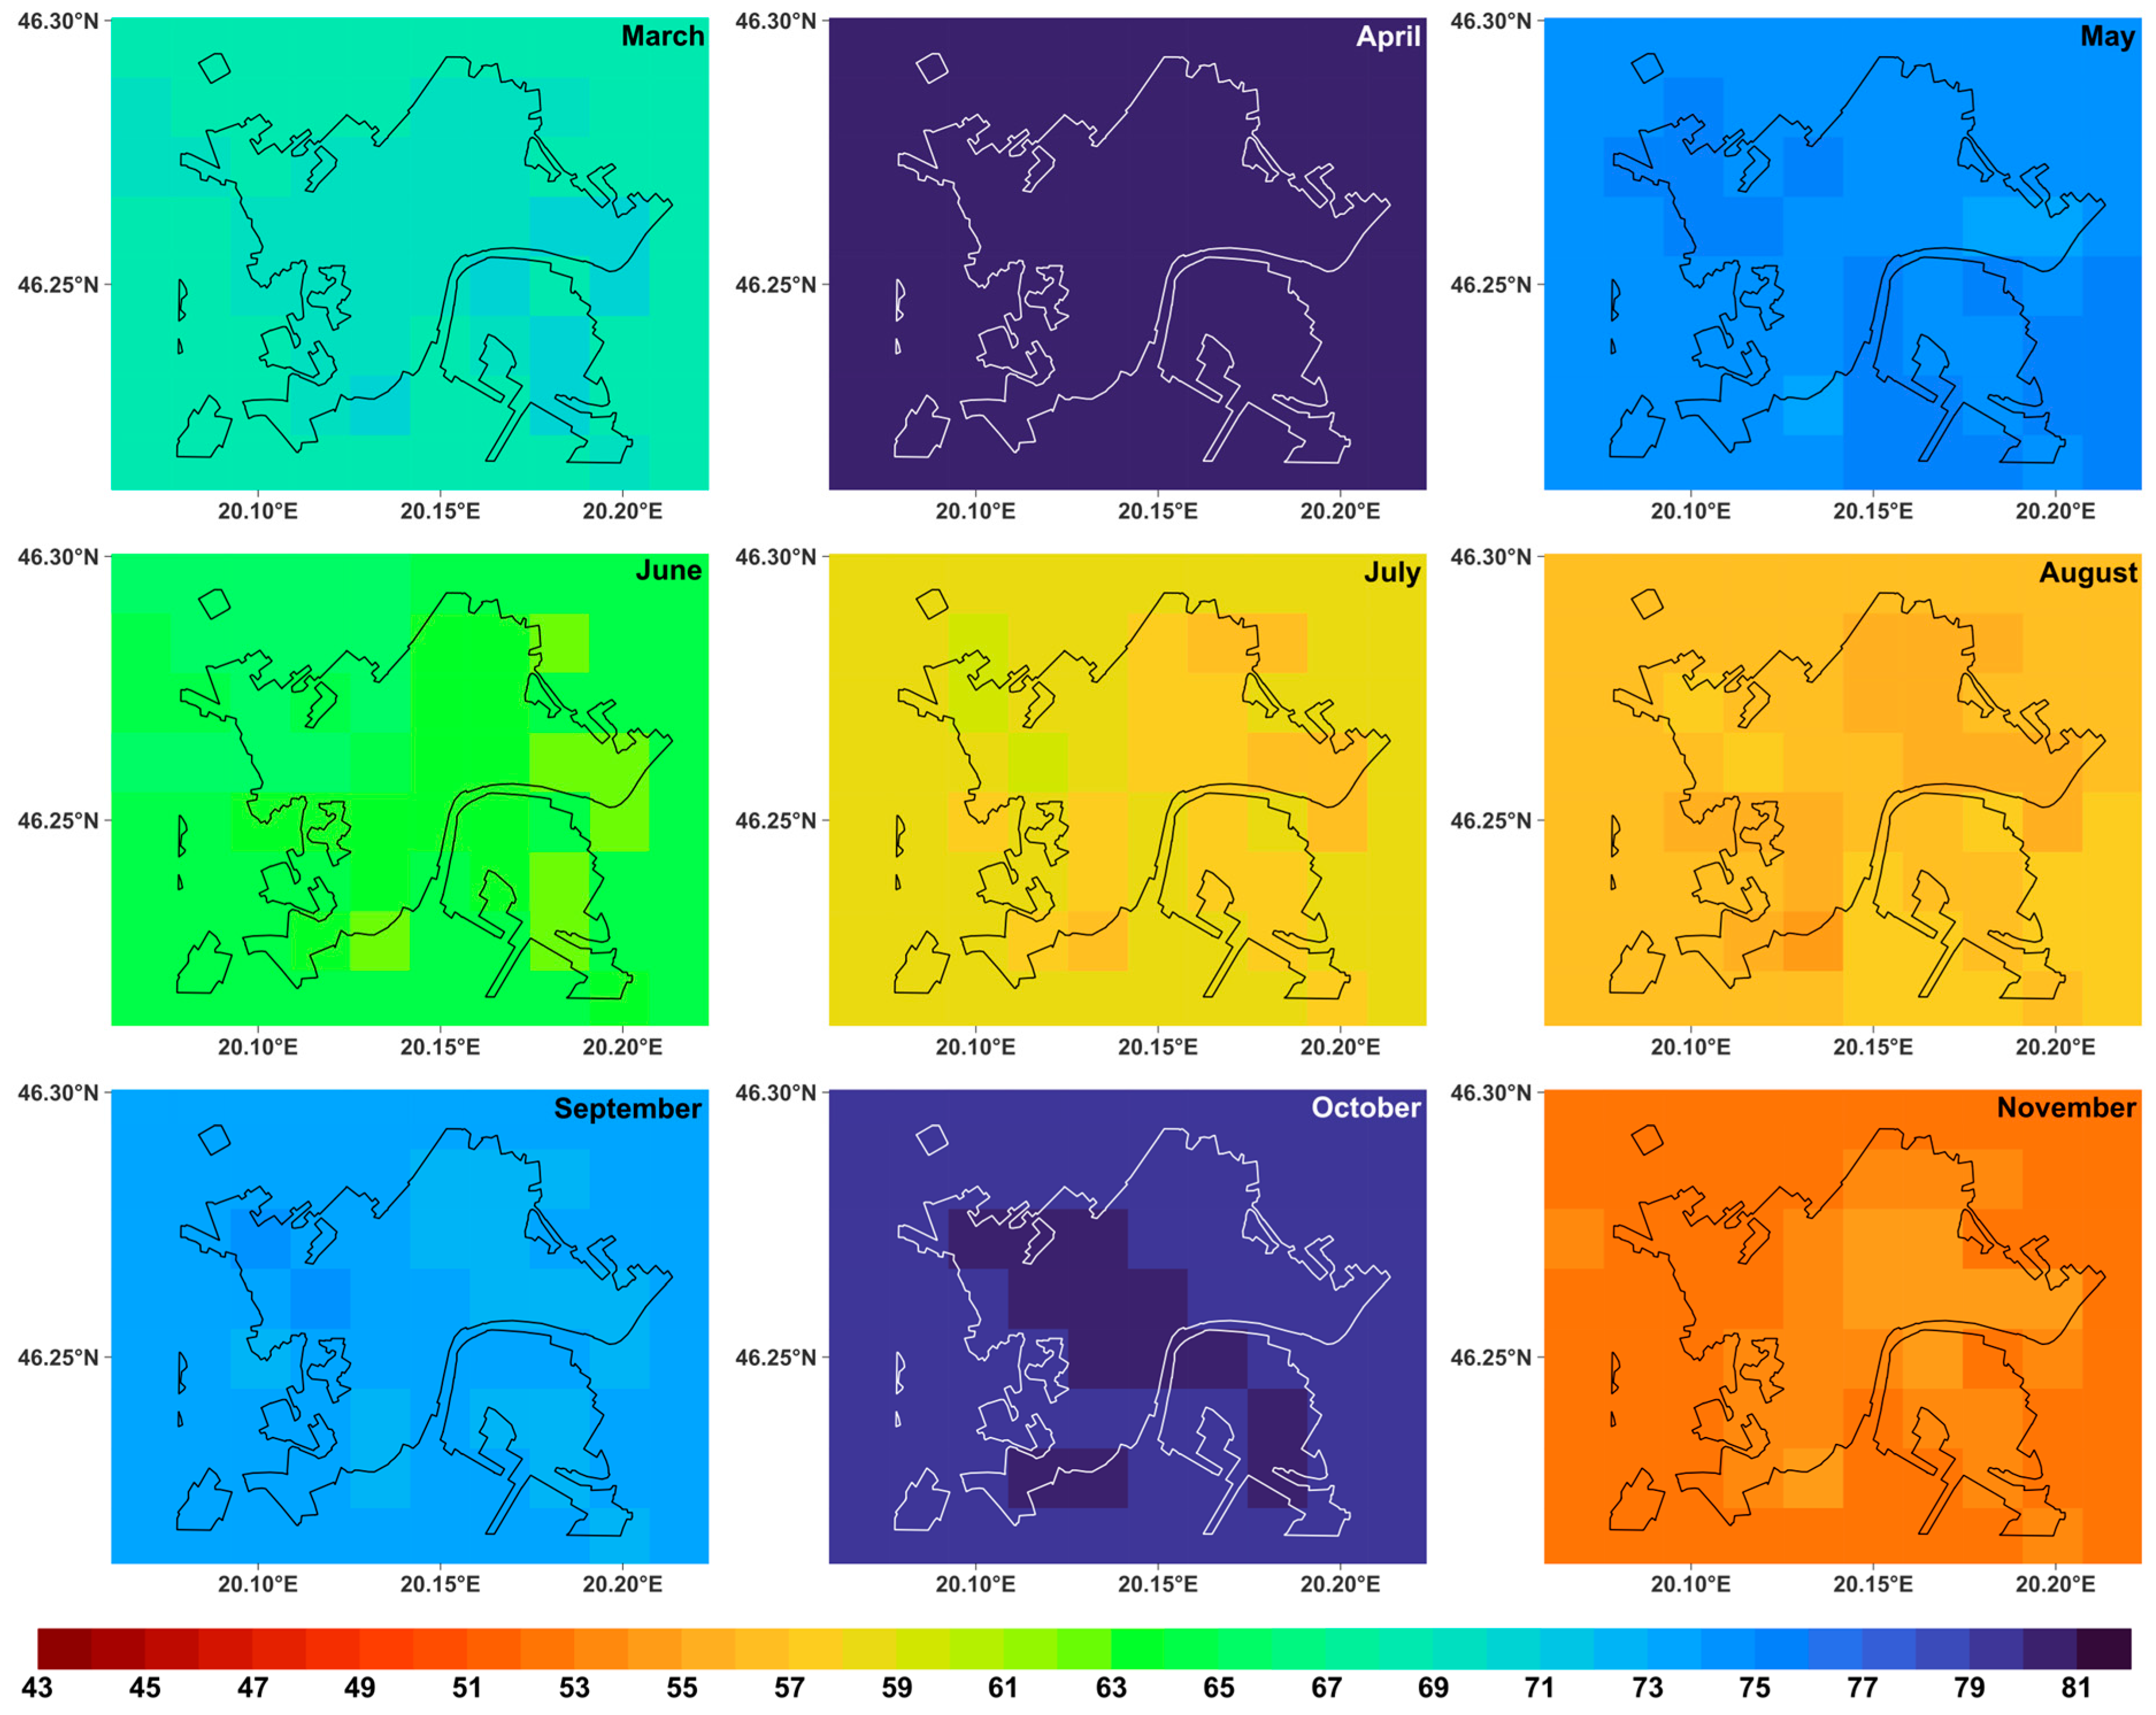
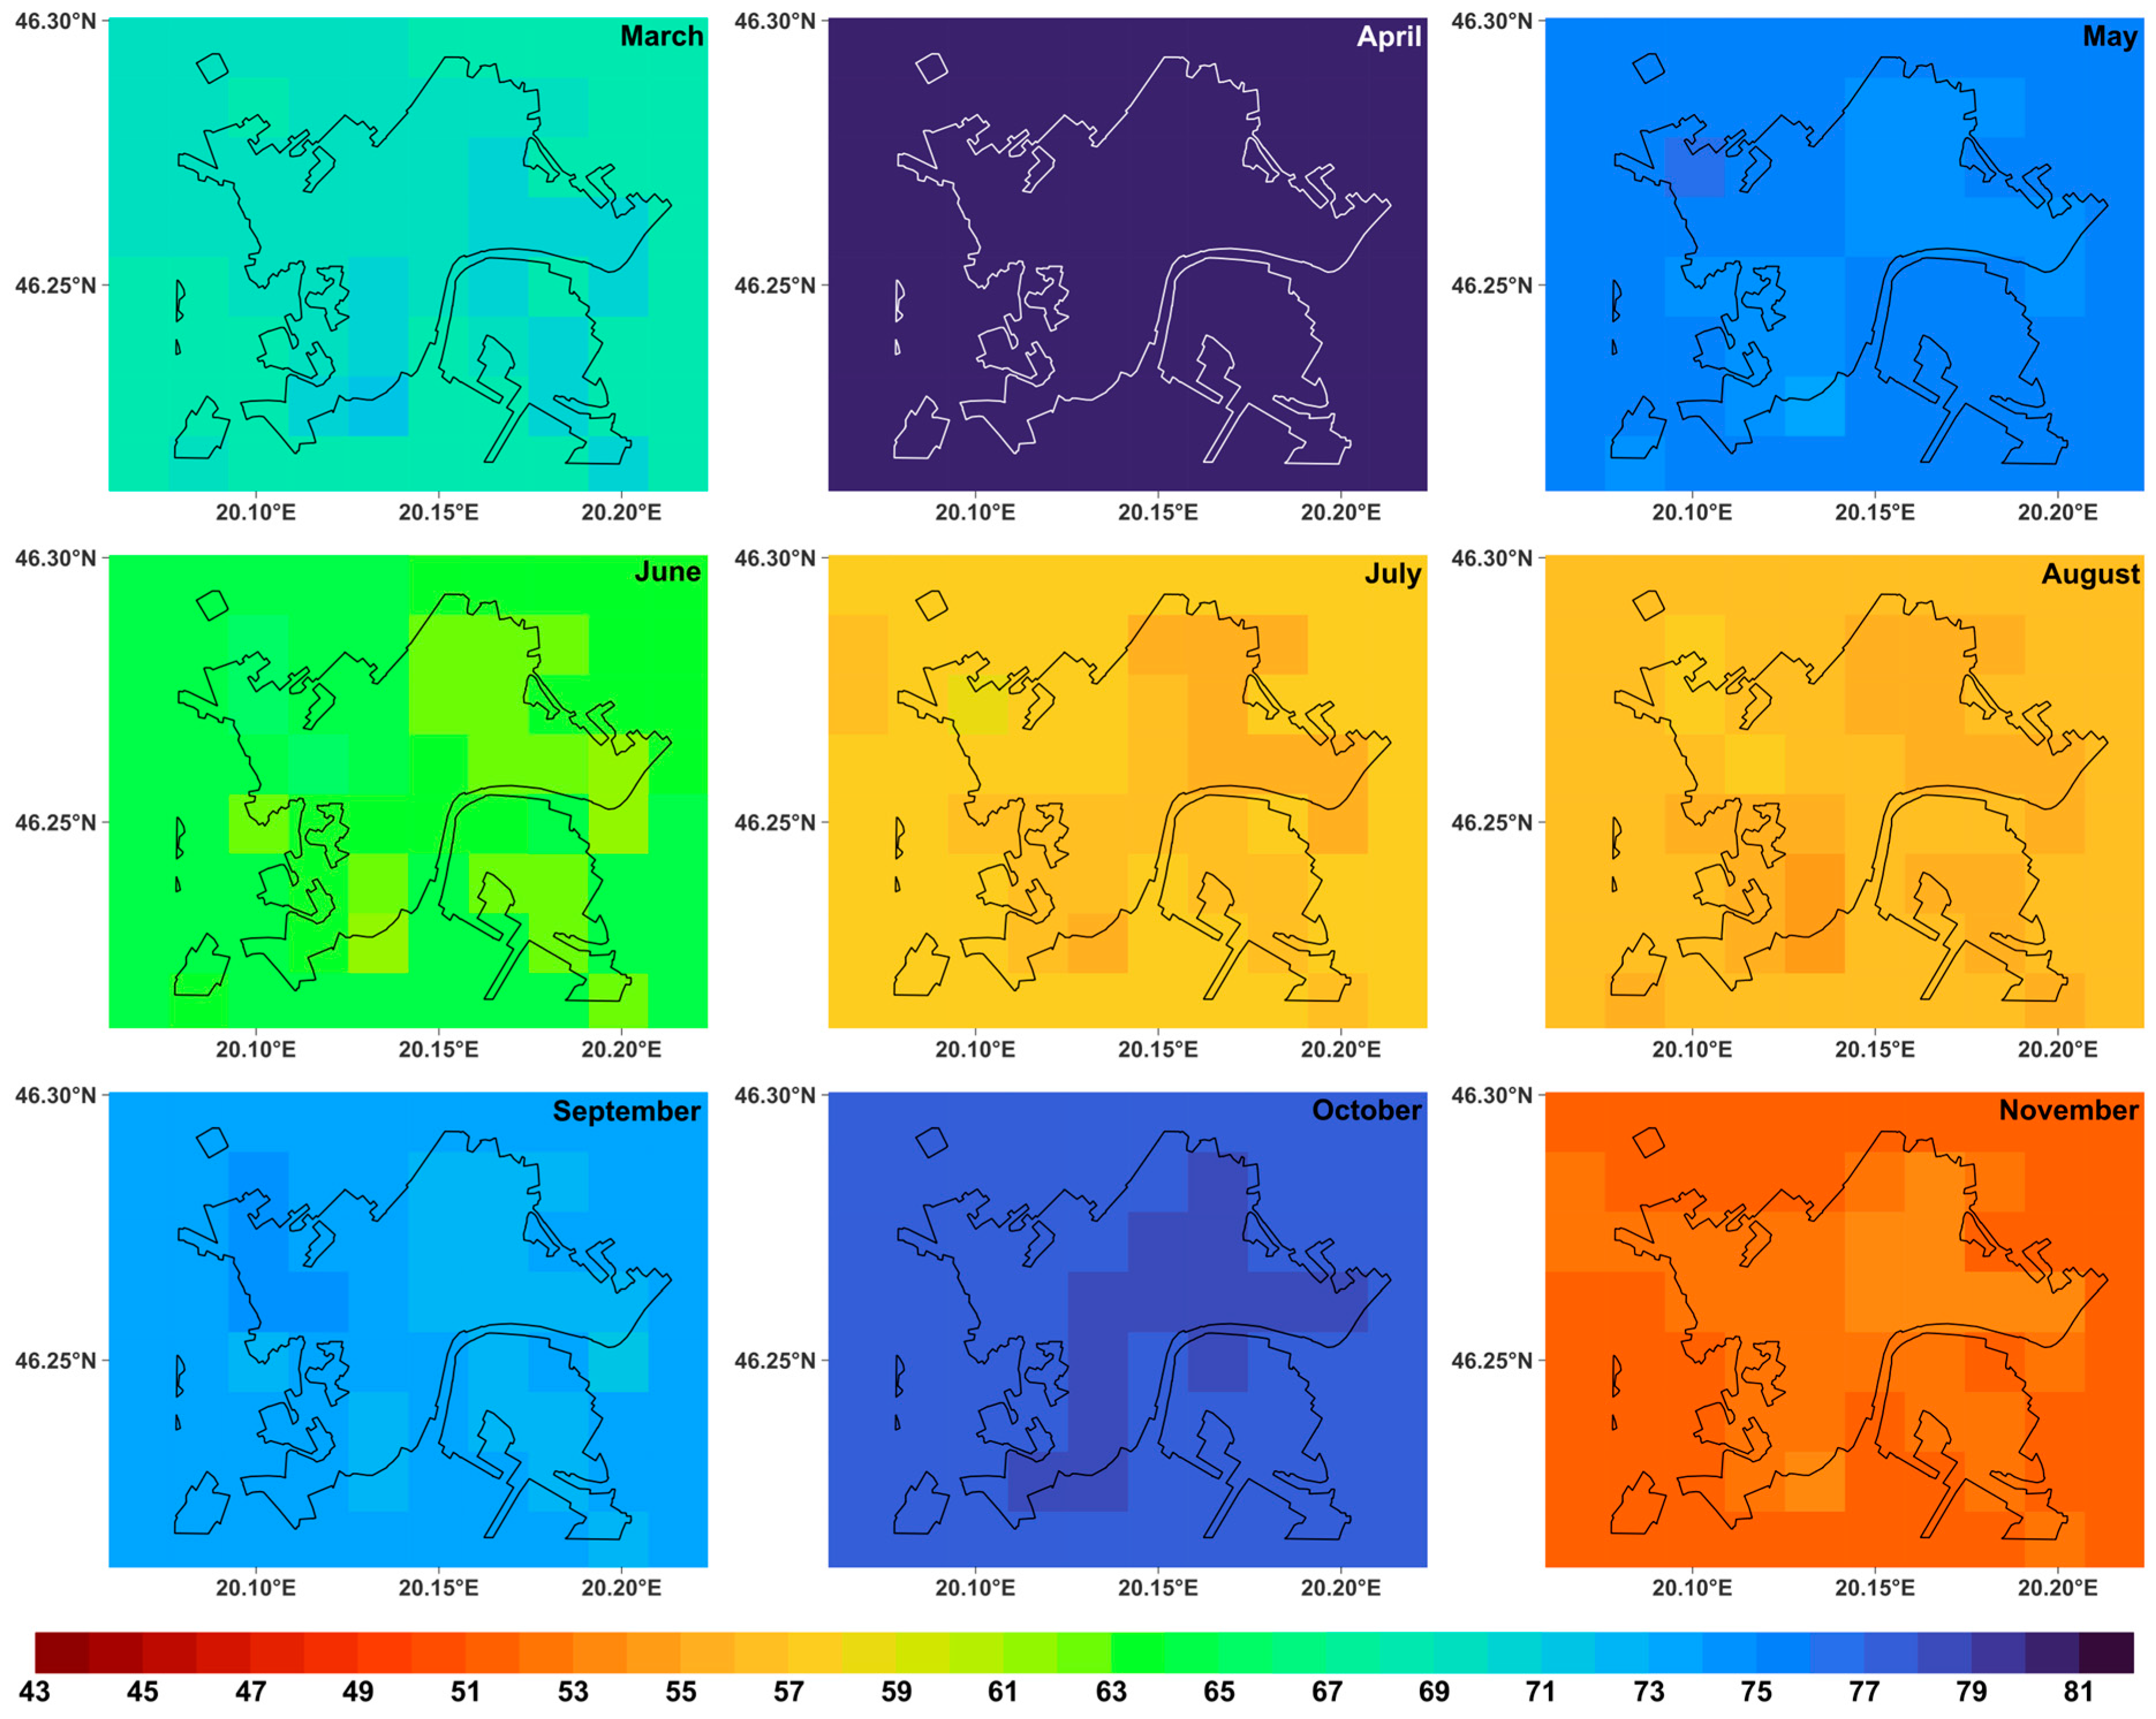
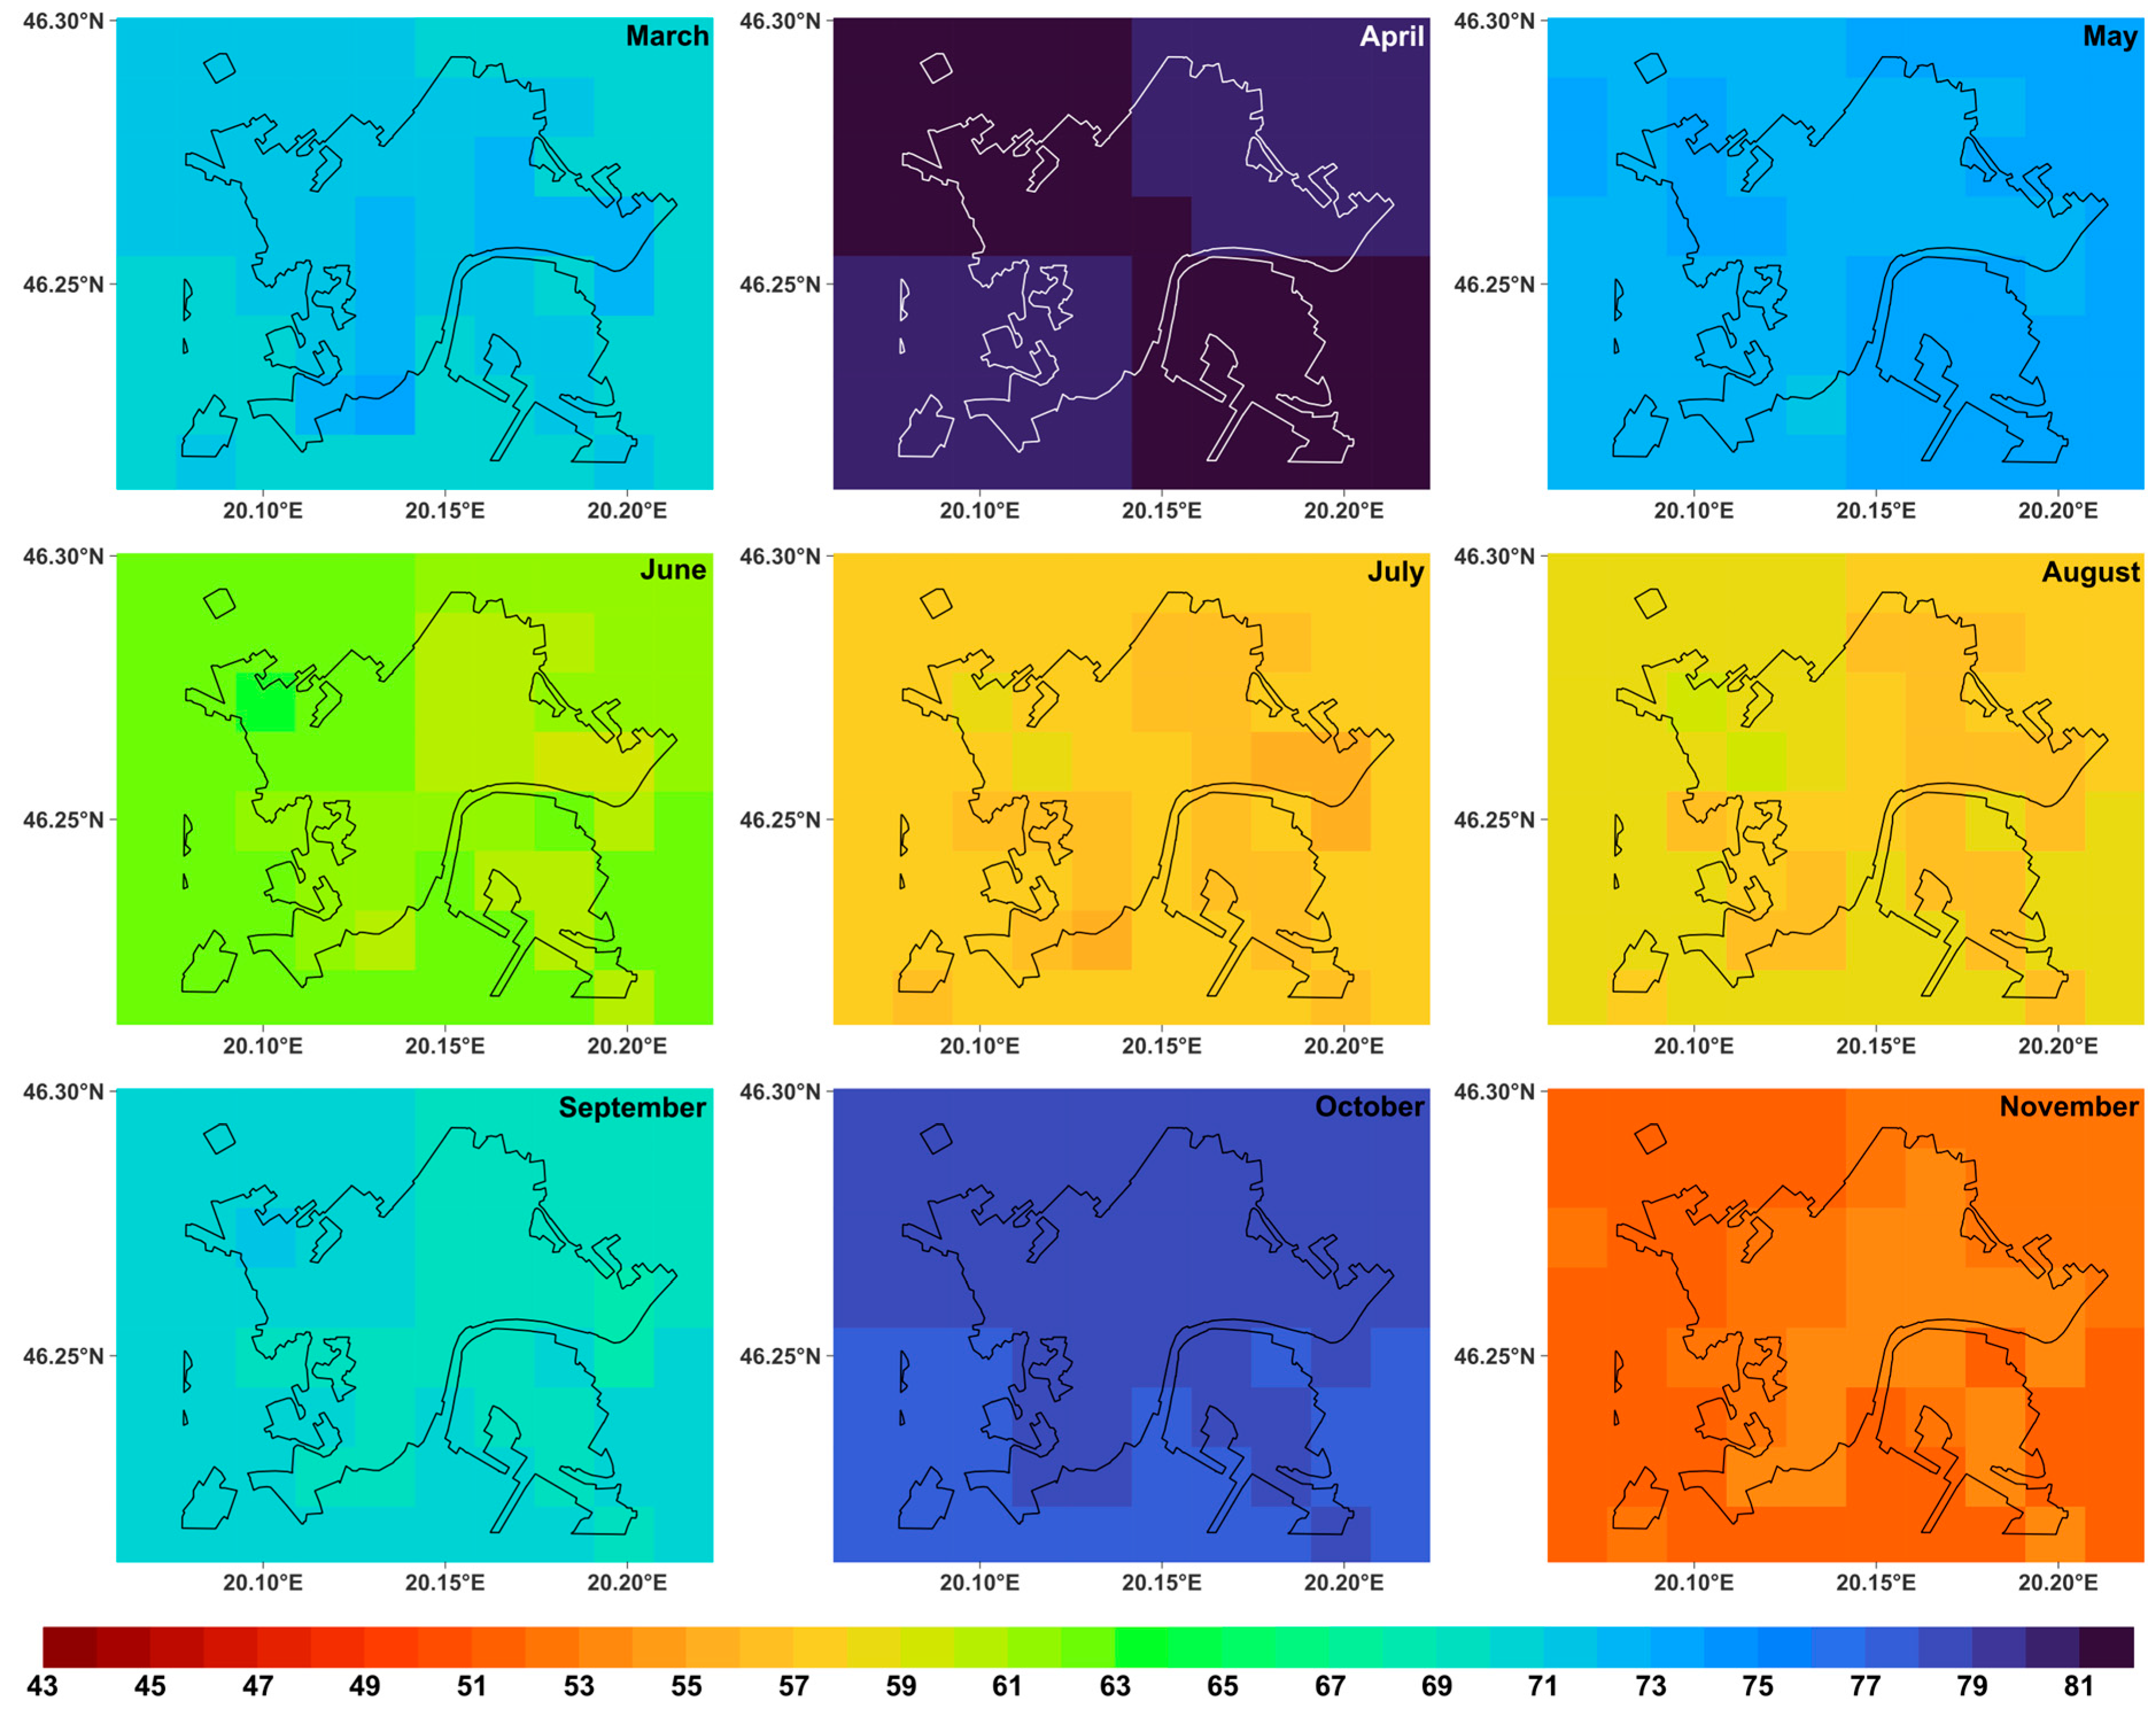
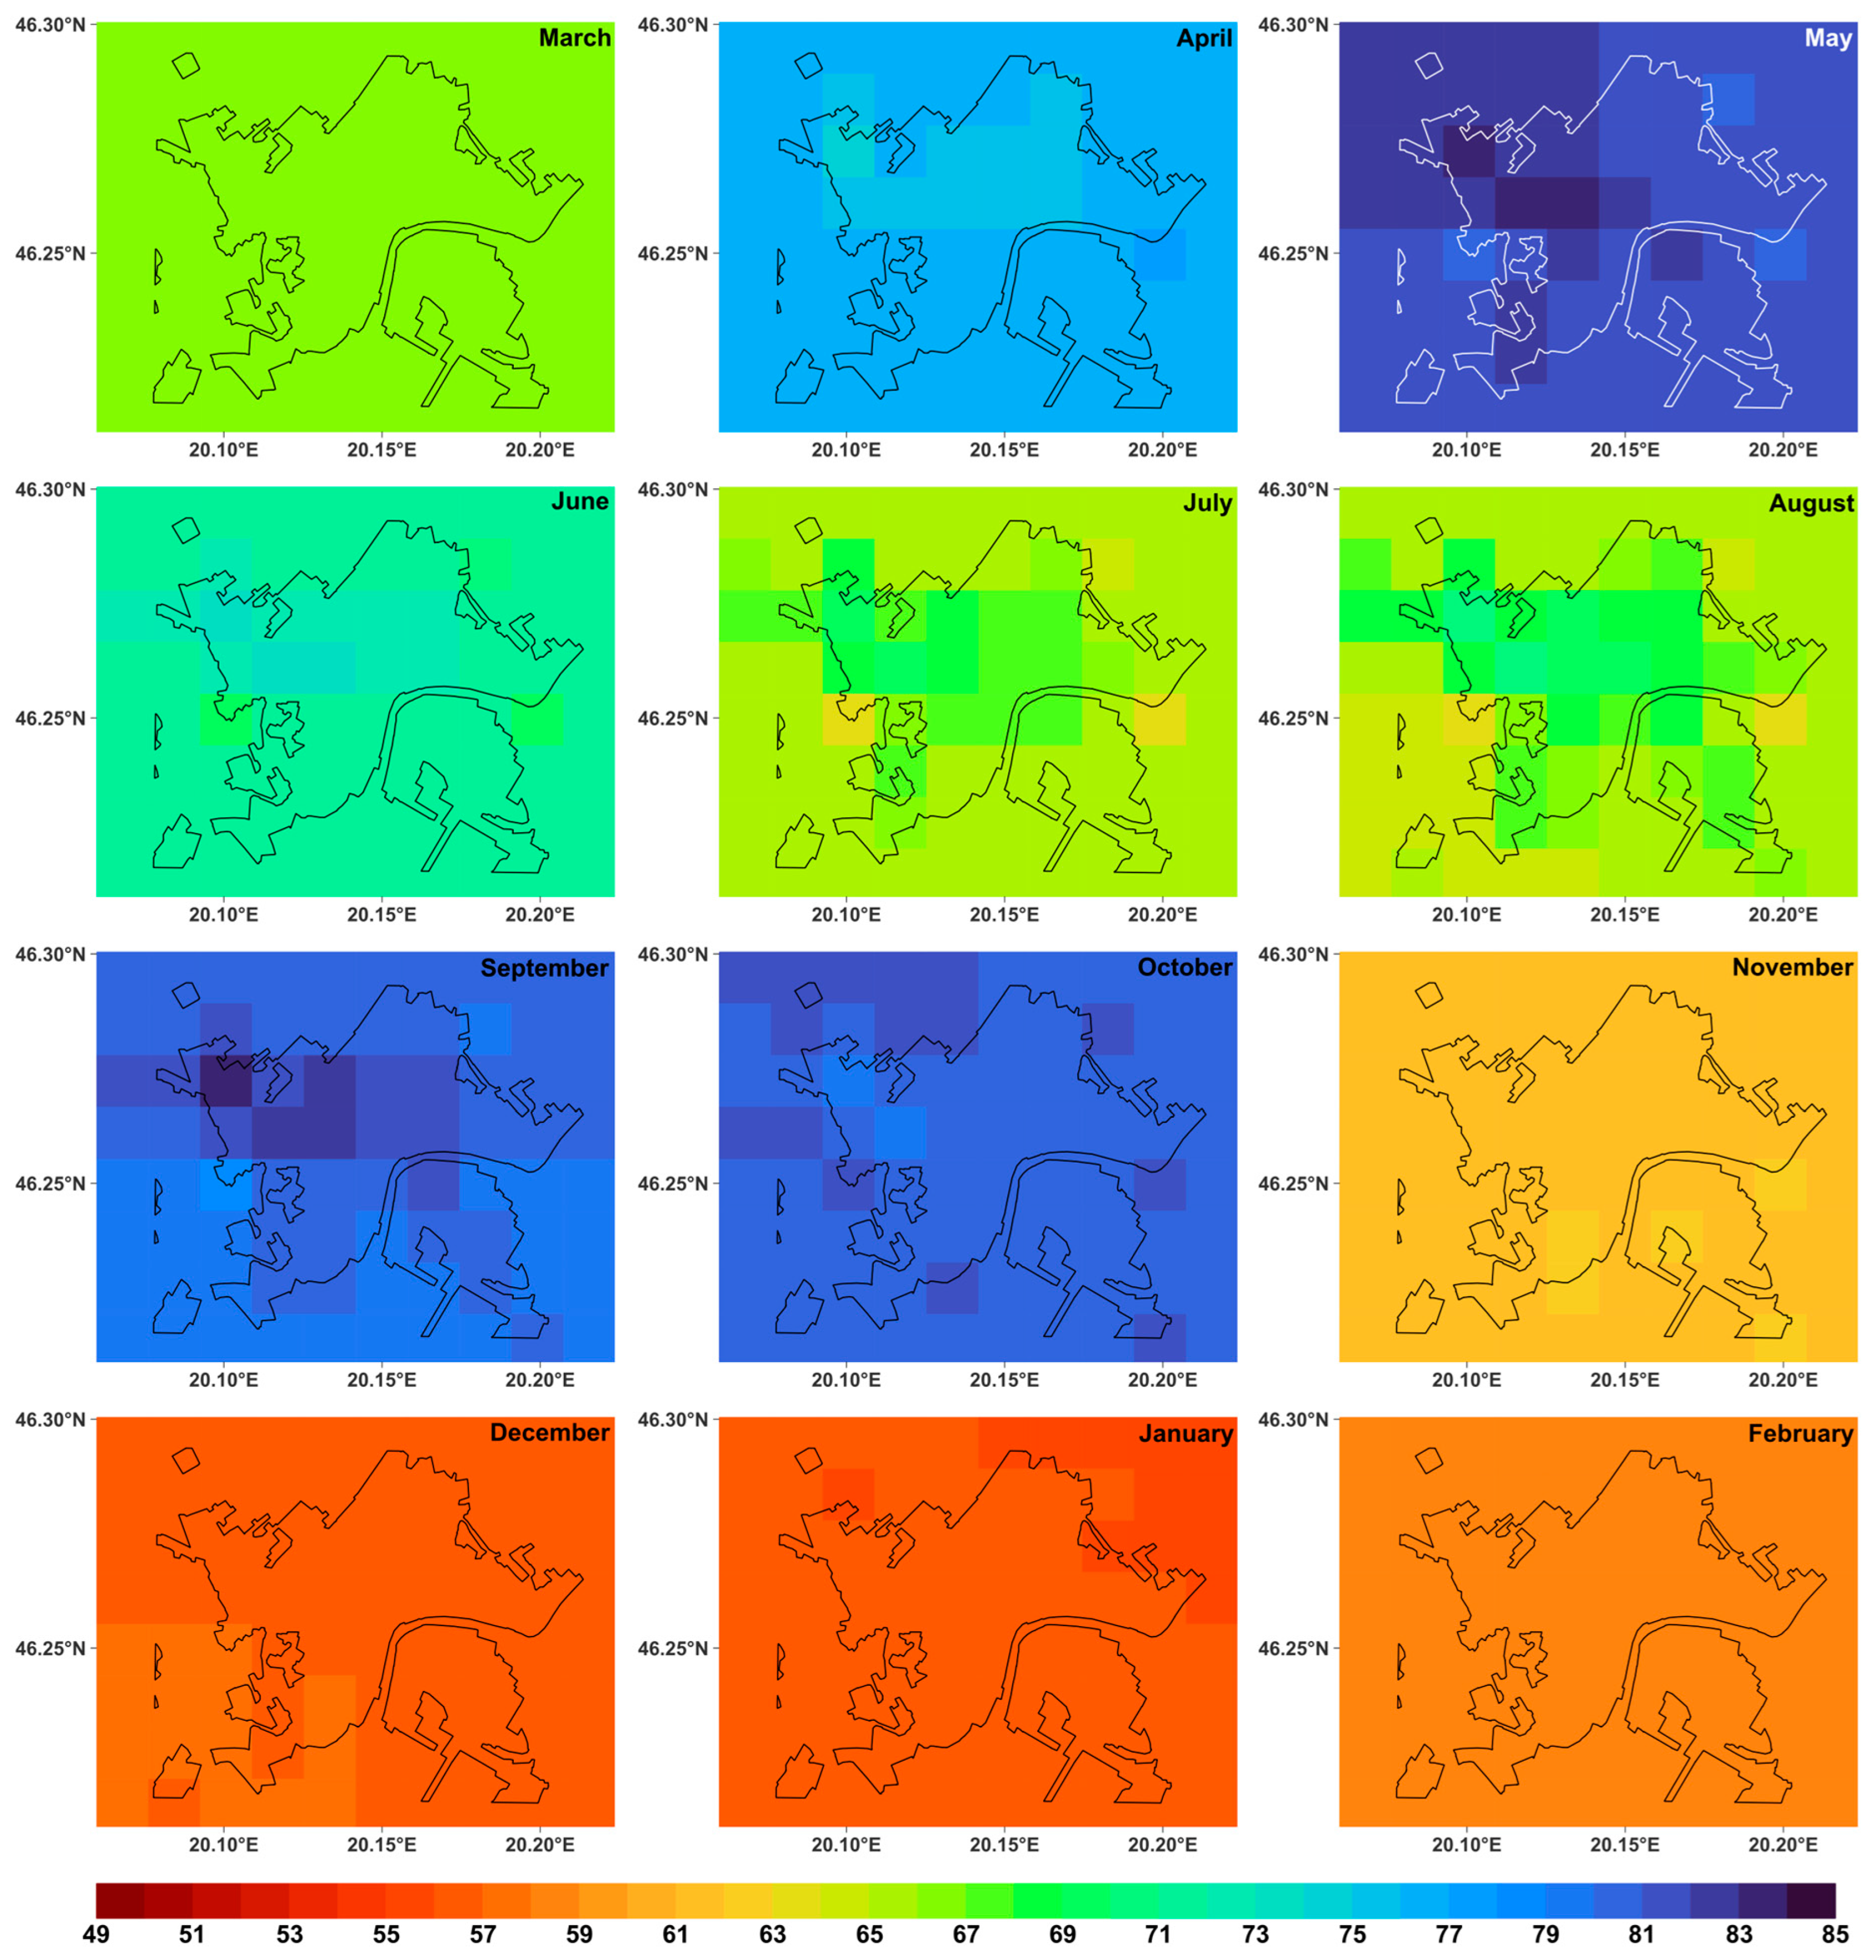
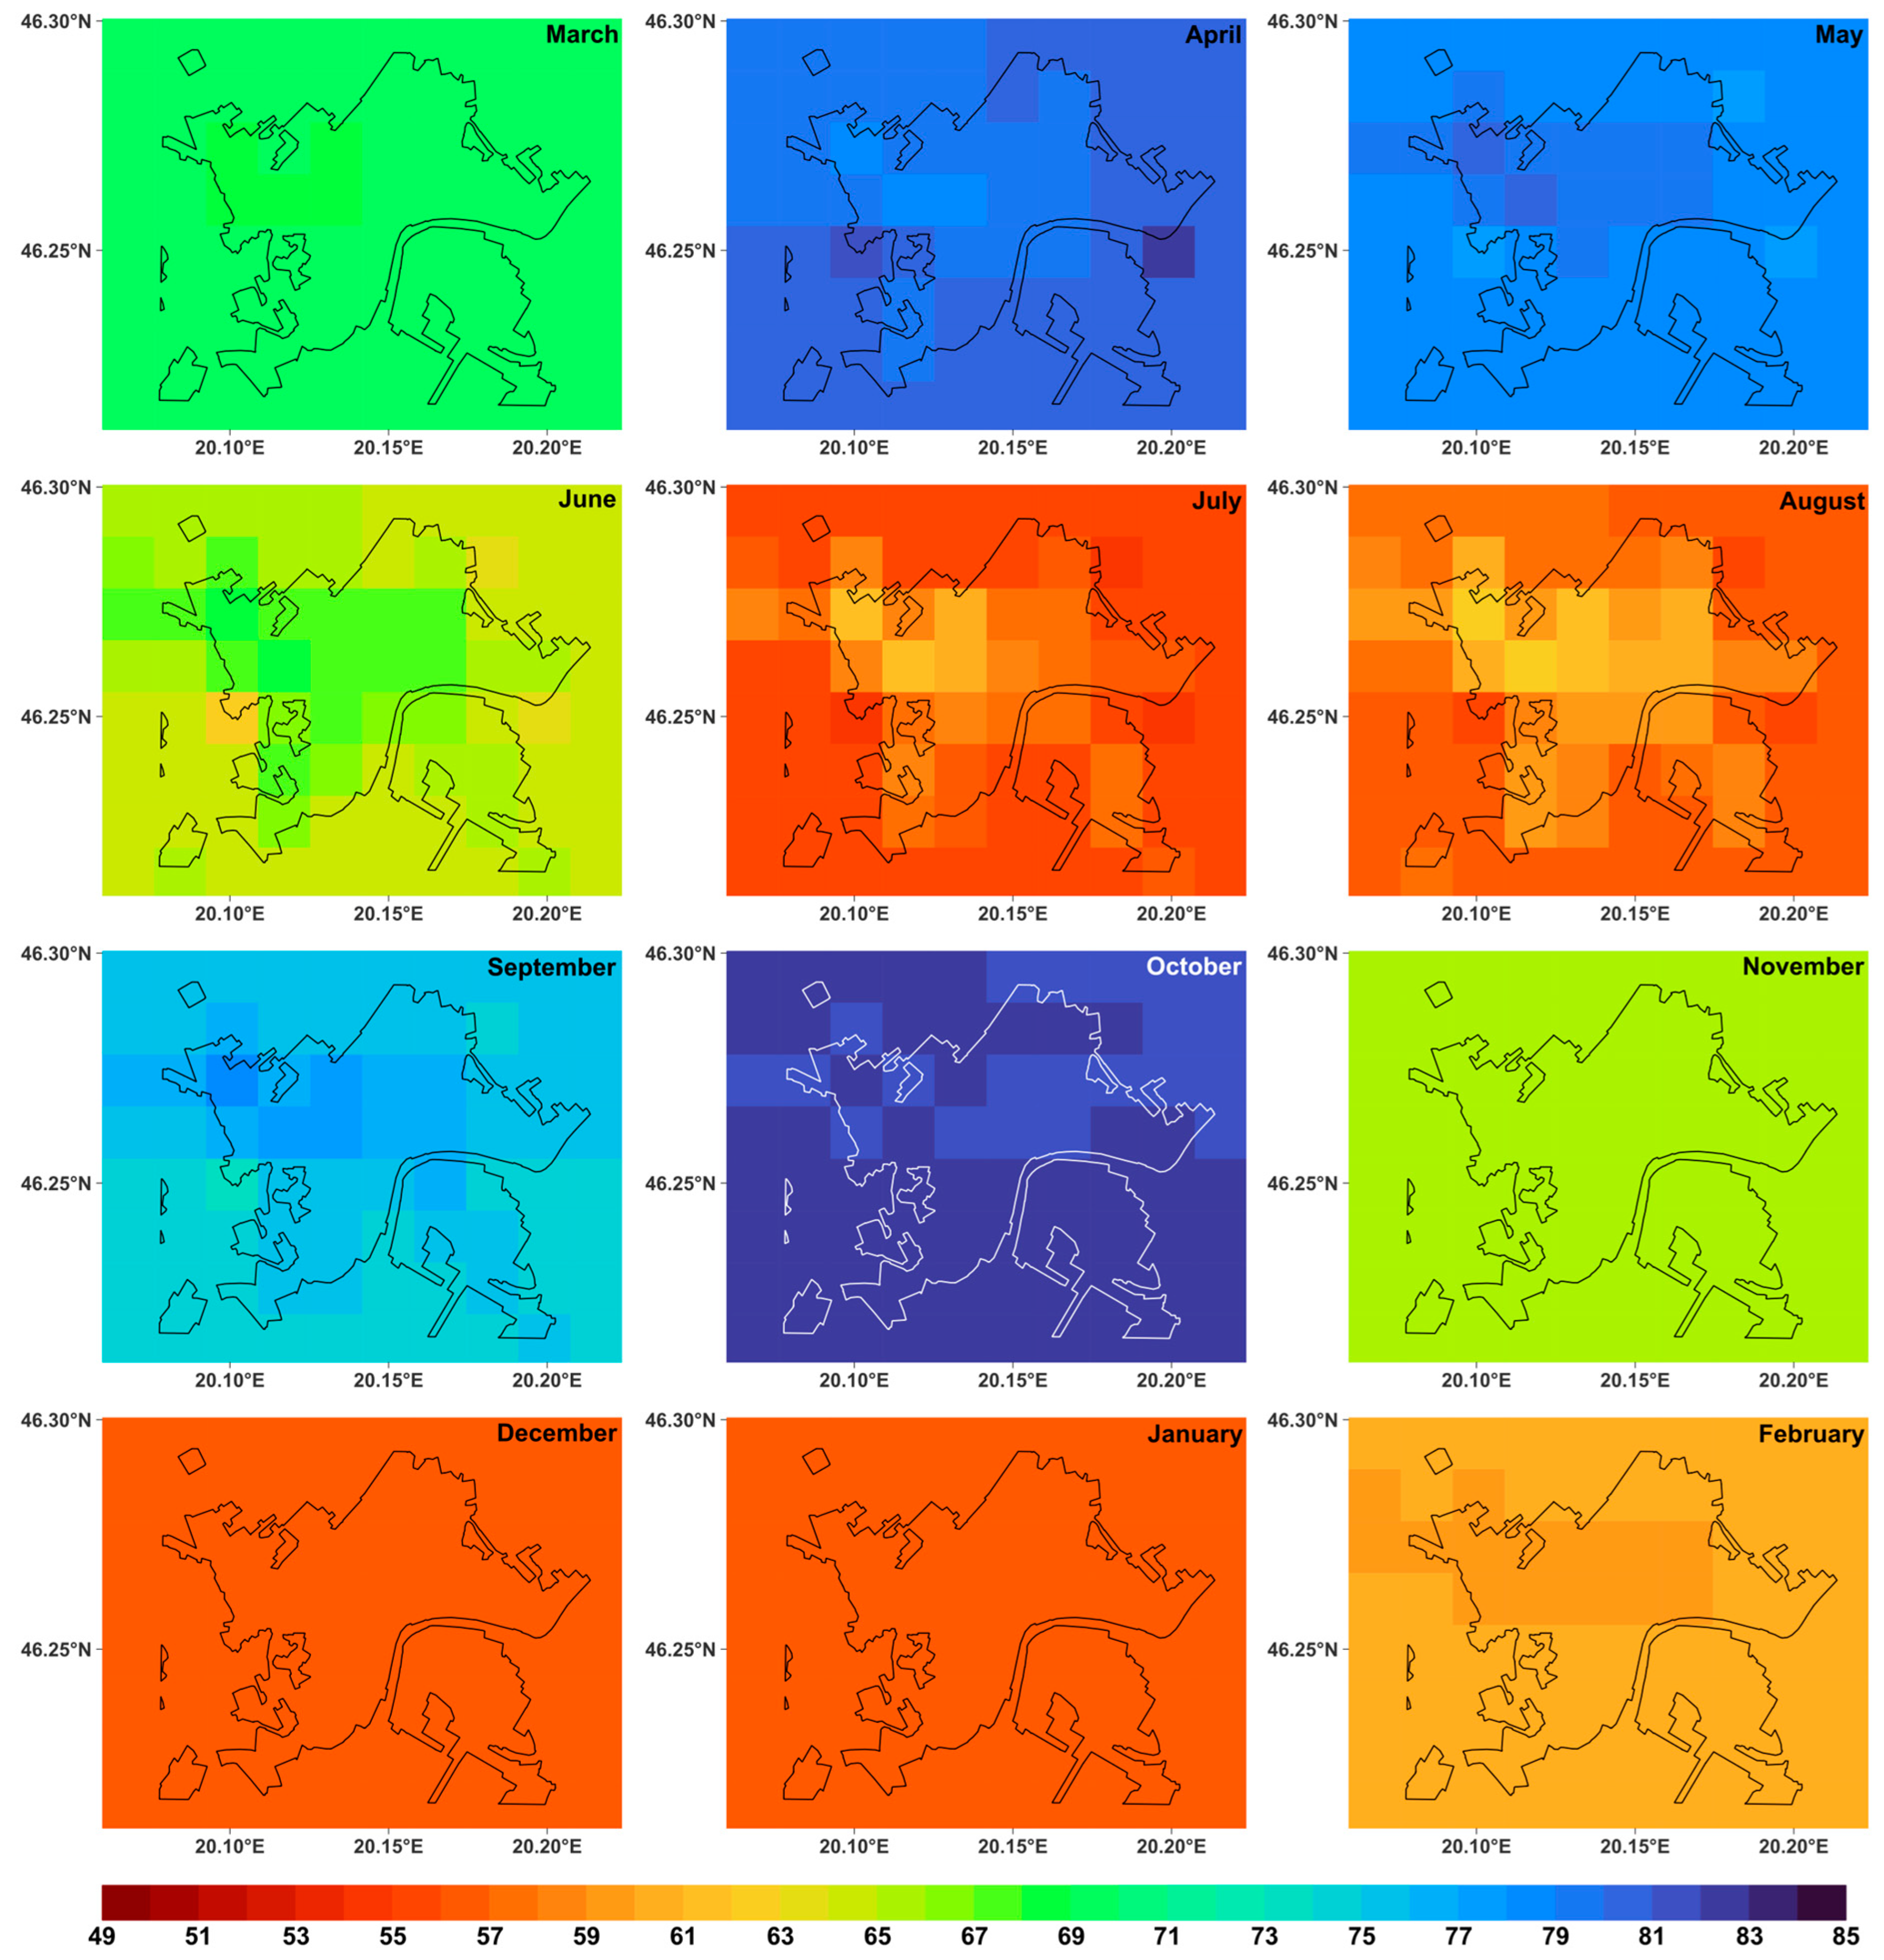
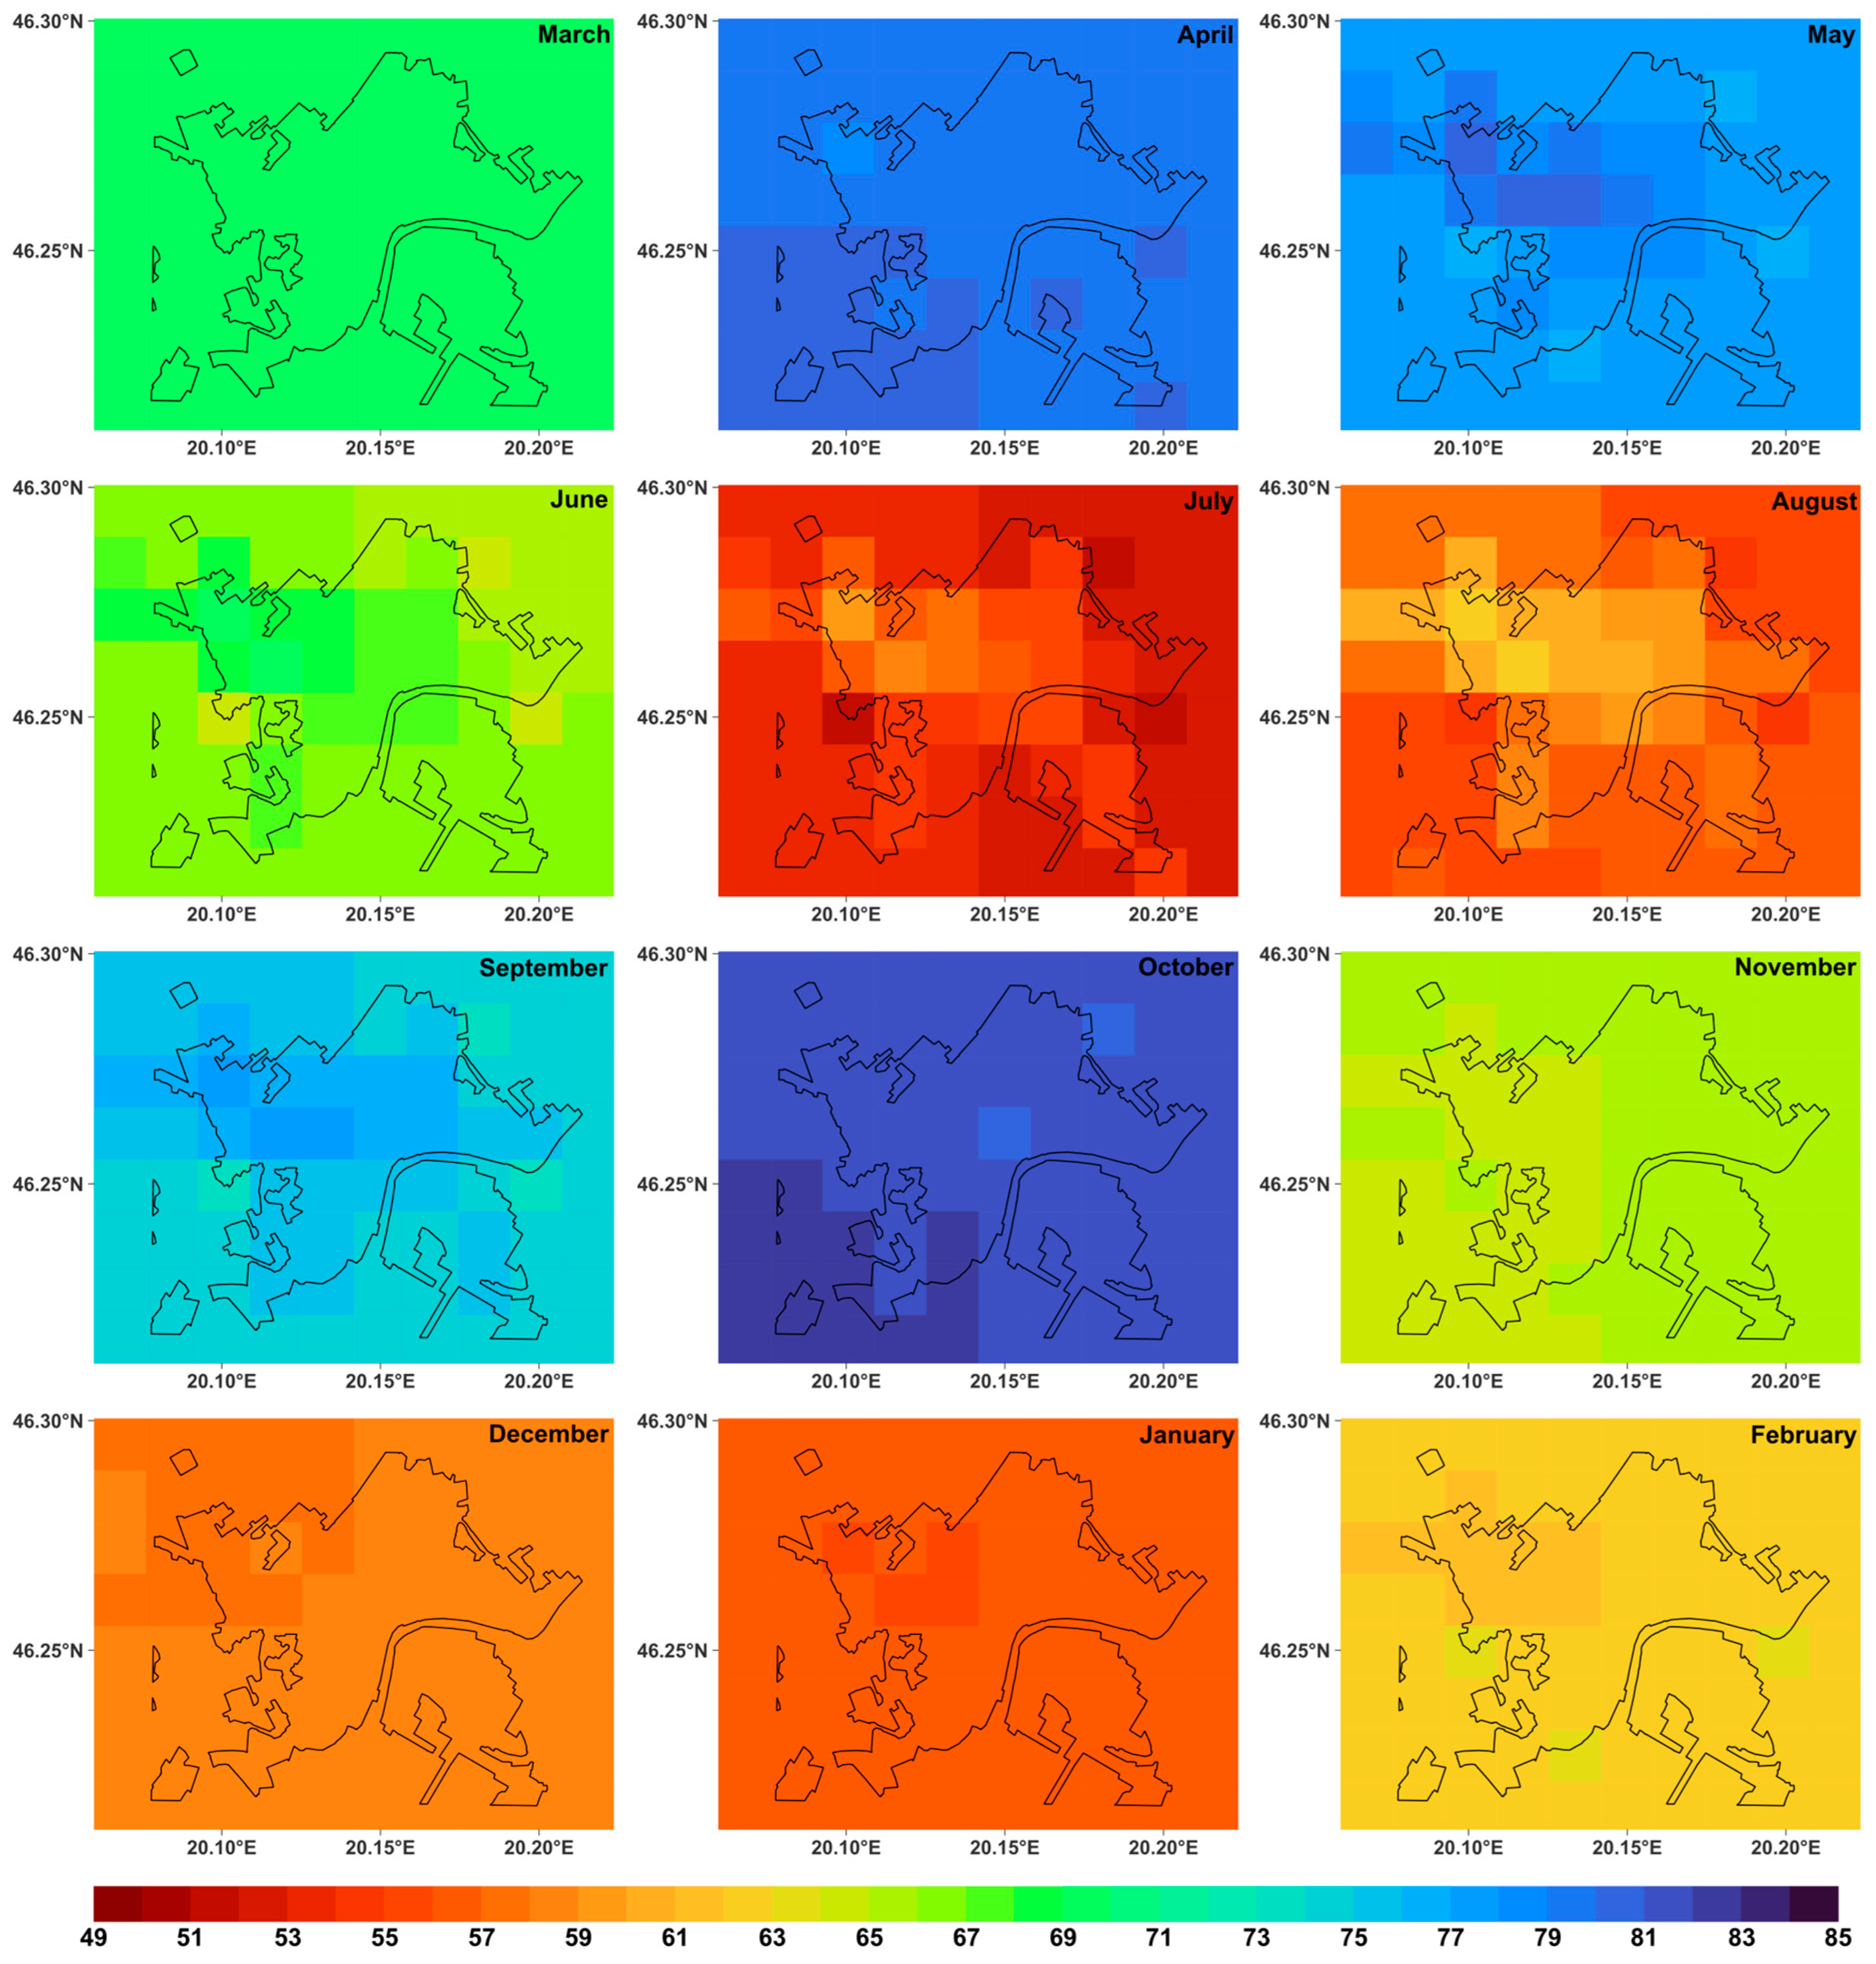
In this section, the urban–rural and intra-urban distinctions in tourism climate conditions are first evaluated through the comparison of the indices (Section 3.1). Subsequently, projected future trends in tourism climate conditions are analyzed considering the different periods and emission scenarios (Section 3.2). The spatial distribution of monthly HCI values, derived from the corrected CarpatClim-HU observational dataset, is displayed in Figure 3. HCI results for future conditions based on the corrected SURFEX model data are presented in Figure 4, Figure 5, Figure 6 and Figure 7. Corresponding results for the mTCI index can be found in Appendix A, Figure A1, Figure A2, Figure A3, Figure A4 and Figure A5.

3.1. Urban Alterations of Tourism Climate Indices

Considering the HCI during the reference period, noticable impact of the urban environment on tourism’s climate potential can be detected from April to September (Figure 3). In April, the northern parts of the city, classified as industrial and commercial infrastructure as well as temperate sub-urban zones, show slightly less favourable conditions. However, from May to September, more suitable conditions are observed across the majority of urban areas, most pronounced in the northwestern part of the city, which is characterized by industrial and commercial zones. An additional urban effect can be observed in the dense urban and temperate sub-urban regions of the city. During the remaining months, significant differences between urban and rural areas do not appear (Figure 3).
Future HCI cases indicate similar spatial patterns, with the largest urban–rural distinctions occurring between May and September (Figure 4, Figure 5, Figure 6 and Figure 7). In these months, urban areas offer more pleasant conditions, with the most favourable conditions once again occurring in areas with the highest building coverage. It is important to note that under the RCP8.5 scenario, by the end of the 21st century, the city’s ability to enhance index values appears to decrease during the summer months relative to the RCP4.5 case as well as to the earlier periods (Figure 7). A further interesting discrepancy is that the highest urban improvement that usually emerges in August is postponed to September under the RCP8.5 estimation over the period 2071–2100 (Figure 7). In April, on the other hand, urban areas may still indicate slightly less suitable conditions according to the majority of future HCI cases (Figure 4, Figure 6 and Figure 7). Finally, it should be mentioned that the urban park grid cell located on the western edge of the city generally indicates worse conditions in summer than most urban and rural areas (Figure 3, Figure 4, Figure 5 and Figure 6).
The spatial distribution of the mTCI index generally reflects a more variable urban pattern compared to the HCI. During March, April, October, and November of the reference period, most areas of the city offer slightly more favourable conditions than the adjacent areas (Figure A1). The index values are characterized by the highest urban–rural as well as intra-urban differences during the summer months. For this index, the general summertime improvement observed for HCI is not evident in urban grids. During this time, the central, eastern, and southern parts of the city, classified as dense urban fabric, temperate sub-urban zones, and extensive road and railway infrastructure, tend to show the least suitable conditions (Figure A1). In contrast, the industrial northwestern areas depict somewhat better conditions, similar to the pattern observed in the HCI index.
In the future periods for mTCI, favourable urban conditions persist in March and November, particularly in the eastern and southern parts of the city (Figure A2, Figure A3, Figure A4 and Figure A5). Meanwhile, the less suitable conditions, characterized by lower mTCI values, are maintained during the summer months and appear in September in the southern and eastern regions. While the estimations of the reference period suggest the largest urban deterioration in the index in August, there is agreement that this urban–rural contrast may shift to June in the future, profoundly for the period 2041–2070 under RCP4.5 and for 2071–2100 under RCP8.5 (Figure A2 and Figure A5). Considering the western urban park zone, it can be concluded that mTCI values do not differ significantly from those of other urban grid points, in contrast to the HCI (Figure A1, Figure A2, Figure A3, Figure A4 and Figure A5).

3.2. Projected Future Trends in Tourism Climate Conditions

The annual patterns of both HCI and mTCI reveal the most favourable conditions in each case during the spring and autumn months. Within these periods, some decline in climate potential is noticeable (Figure 3, Figure 4, Figure 5, Figure 6, Figure 7, Figure A1, Figure A2, Figure A3, Figure A4 and Figure A5). Typically, April–May and September–October offer the most pleasant conditions, while climate suitability drops significantly in summer, especially in July and August. A secondary decline is also evident during the winter months and in November. This seasonal distribution reflects a ‘bimodal’ pattern, as defined by Scott and McBoyle [69].
Future tendencies in tourism climate conditions vary significantly depending on the time of year. Overall, the most substantial changes compared to present conditions are projected to occur toward the end of the century and under the RCP8.5 scenario. For the HCI, relatively stable or slightly improved conditions can be expected in December and January, while a more remarkable improvement is projected for February (Figure 3, Figure 4, Figure 5, Figure 6 and Figure 7). These positive trends continue through much of spring and autumn. In particular, March and April are expected to see major improvements in climatic conditions, especially by the end of the century. October and November also show slight improvements. In contrast, from May to September, climatic conditions are expected to deteriorate, with the most significant decline projected for the end of the century. The least favourable conditions are anticipated under the RCP8.5 scenario in July and August, when conditions are projected to be substantially less suitable for tourism than in winter (Figure 7). It is important to note that the decline in HCI during summer is more significant than the improvements observed in spring and autumn.
The estimations for the mTCI also reveal a significant decline in conditions during the summer months (Figure A1, Figure A2, Figure A3, Figure A4 and Figure A5), most conspicuously in the 2071–2100 period under the RCP8.5 scenario (Figure A5). The summertime deterioration of mTCI is generally smaller than that of the HCI index. This unfavourable summer pattern extends into May and September, with a moderate decline estimated. In April and October, conditions are likely to remain stable, while March and November are projected to experience notable improvements in climate suitability (Figure A1, Figure A2, Figure A3, Figure A4 and Figure A5). This favourable tendency is more pronounced than that of the HCI in February, March, and April.

4. Discussion

The climate-modifying effects of surface types with differing physical characteristics are clearly detectable in the urban–rural contrasts and intra-urban patterns of the HCI and mTCI indices (Section 3.1). In other words, the spatial and temporal variability of tourism’s climate potential reflected by these indices can be attributed to the diverse interactions between the surface types and the parameters constituting the indices within the study area. In the case of the HCI, among the input factors [42,50], primarily the spatial pattern of the Humidex component shaped the observable differences in the index distribution. The greatest deviations—regardless of the studied case—occurred between May and September, when the city exhibited a more favourable climate potential (Figure 3, Figure 4, Figure 5, Figure 6 and Figure 7). This phenomenon was particularly evident in the industrial and commercial zones, as well as in the dense urban and temperate sub-urban classes. As indicated in Table 2, the model consistently assumes artificial surface coverages of 60% or higher in these areas, with urban canyons reaching heights of up to 30 m. The constructed narrow urban canyons and the high degree of built-up area can theoretically influence the Humidex in two ways. On the one hand, during daytime hours, reduced sky view factor and increased shading generate a cooling urban heat island effect [70], resulting in lower maximum temperatures in the urban area compared to the surrounding rural regions. On the other hand, the low proportion of vegetation and permeable surfaces reduces evapotranspiration, leading to lower relative humidity. Considering the magnitude of these factors indicated by the simulations, the latter effect appears to be decisive; therefore, the less humid urban air in the summer months creates more favourable conditions for the realization of tourism’s climate potential quantified by the HCI.
The related estimates suggested that the more favourable tourism climate conditions of the city may persist in future periods during the months between May and September (Figure 4, Figure 5, Figure 6 and Figure 7). However, a new feature was observed in the RCP8.5 projection for the last period, when the urban–rural difference appeared to diminish (Figure 7). During the 30-year period including the most intense warming, a surplus in the sensible heat flux may develop at urban grid points, which can support thermally-driven convection throughout the summer months [71]. Following this, the model assumes a greater increase in convective precipitation (primarily over densely built-up areas), enhancing moisture release and the occurrence of periods with higher relative humidity, which are less favourable for tourism according to the ratings of Humidex in the HCI. Although increased moisture input can theoretically have a positive thermoregulatory effect through evaporative cooling, surface water in downtown areas usually runs off rapidly after precipitation events [72]. Thus, unlike over natural surfaces, high moisture tended to have a greater impact on relative humidity, whereas it showed limited influence on the urban diurnal temperature cycle.
Compared to the HCI index, the mTCI is composed of factors that are more complex and responsive to fluctuations [43,44]. This may have contributed to the larger variability observed in the estimates. During the transitional months (March, April, October, and November), the grid points in the city presented slightly better tourism climate conditions compared to the surrounding rural grid points (Figure A1, Figure A2, Figure A3, Figure A4 and Figure A5). This is primarily attributable to the wind chill rating scheme of the mTCI [8,43,44], which is activated during periods with maximum temperatures below 15 °C and wind speeds exceeding 8 km/h. For example, in March of the reference period, wind chill-affected conditions occurred 8–9% more frequently at rural grid points, resulting in lower mTCI values in those areas (Figure A1). Naturally, the more densely built-up urban cores are protected more effectively from the adverse effects of air movement, leading to more favourable thermal comfort conditions during the cooler months. Although under certain wind directions, urban canyons can accelerate wind flow, acting as wind tunnels [73], the urban scheme employed in the SURFEX model is physically inadequate to reproduce such events.
During the summer months, the mTCI—contrary to the HCI index—showed a less favourable climate potential within the city (Figure A1, Figure A2, Figure A3, Figure A4 and Figure A5). By analyzing the sub-indices of mTCI, the precipitation component, predominantly the summer convective processes, was found to influence the index’s behaviour. Even during the reference period, model evidence indicates that the temporal distribution of precipitation in most urban grids tends to shift toward rainfall episodes with higher amounts, which is manifested in lower mTCI values in these areas (Figure A1). This trend becomes more pronounced as the regional climate is exposed to additional warming. According to the simulation under the RCP8.5 scenario for the period 2071–2100, the frequency of intense, short precipitation events is projected to increase most markedly in the dense urban and temperate sub-urban classes, thereby reducing the climate potential quantified by the mTCI in this case (Figure A5).
Since the RCP8.5 scenario projects a 4 °C higher average temperature approximately for Szeged by the end of the century, convective activation in the atmosphere may strengthen and shift earlier, leading to its peak sooner compared to the reference case. This was suggested by the results related to the mTCI index, which showed that the greatest deterioration relative to rural areas is increasingly expected in early summer (June), rather than in August as in the reference period (Figure A1 and Figure A5). This shift may be explained by the fact that, despite increased summer precipitation, soil moisture can significantly decrease by late summer under higher temperatures, providing insufficient moisture for thermals (air parcels) to initiate condensation [74]. Nevertheless, this decrease in soil moisture was not yet expected to occur in June, leading to peak convective activation and thus the greatest index deterioration in that month.
Considering the western urban park zone, the HCI generally indicated less favourable conditions in summer compared to most urban and rural areas (Figure 3, Figure 4, Figure 5 and Figure 6), whereas the mTCI did not reflect these differences as strongly (Figure A1, Figure A2, Figure A3, Figure A4 and Figure A5). This grid is a mixed-type cell that includes water bodies, a characteristic not observed in the other cells within the study area. In summer, intense evaporation increases moisture release, which worsens HCI values by elevating Humidex levels. In contrast, due to its more complex structure, the mTCI is less affected by this phenomenon and therefore does not show a significant deviation from the values of the surrounding areas.
The annual patterns of the indices and the projected trends in tourism climate conditions (Section 3.2) primarily reflect the influence of the driving regional climate model outputs, and consequently, the tendencies of regional climate change. As noted earlier, the driving 10-km ALADIN regional climate model data were used in our previous study for the area of Hungary to calculate the same indices for identical periods [45]. Therefore, the observed trends across the periods and RCP scenarios essentially reflect the findings of that study. In the present research, the influence of the regional model is further amplified by the modifying effect of the urban environment on regional climate characteristics, arising from the combined effects of regional climate change and urban climate processes. As highlighted previously, conducting city-specific research using a high-resolution surface model for tourism climate assessment is novel; consequently, comparisons with international literature can mainly be framed in terms of trends in regional climate change.
Despite considerable differences in methodologies and interpretations of results, the projected future trends identified in this study align with international findings. As outlined in Section 1, projections suggest overall improvements in tourism’s climate potential in Northern Europe but deteriorating conditions in southern areas of the continent during summer. However, in most regions of Europe, climatic conditions are expected to become more favourable during the transitional seasons of spring and autumn [16,17]. Similarly, Aygün Oğur and Baycan [23] and Lemesios et al. [24] projected improved conditions in the transitional seasons or winter but less favourable conditions in summer for Turkey and Greece, indicating a potential shift in the peak tourism season from summer to the transitional months. Carrillo et al. [75] also reported climatic improvements from autumn to spring and a decline in summer conditions for the Canary Islands. In a broader context, Demiroglu et al. [76] assessed future climate suitability across the Mediterranean region, finding improved conditions in spring but a decline in summer for much of the area.
The results of this study show strong alignment with the previously identified trends, which may be attributed to the transitional geographical location of Hungary and Szeged between Northern and Southern Europe. The results indicated that during the main tourism season in Szeged, spanning from May to September, the city’s climate potential was projected to decline according to both indices, with the most pronounced deterioration expected in the period 2071–2100 under the RCP8.5 scenario (Figure 7 and Figure A5). The summertime decrease in HCI values was generally greater than the decline observed in the mTCI index. Another key finding is that the influence of regional climate change during this period outweighs the improvement or deterioration arising from the urban–rural and intra-urban differences caused by the local environmental settings. The two indices do not agree on whether the city will offer more or less favourable climatic conditions than the surrounding rural areas under the general climatic deterioration. While most parts of the city provide better conditions by HCI, mTCI suggests less suitable potential, though the magnitude of these differences is comparable. Under a changing climate, cities increasingly aim to enhance liveability for residents and attractiveness for tourists by fostering improvements for local or micro-scale climatic conditions. However, our results suggest that as regional background climatic conditions become less favourable, the scope for enhancing urban resilience may be somewhat limited in Szeged.
In contrast, the remaining transitional months of spring (March–April) and autumn (October–November) are typically projected to show improvements in climate suitability according to both indices in terms of the regional climate change trends (Figure 3, Figure 4, Figure 5, Figure 6, Figure 7, Figure A1, Figure A2, Figure A3, Figure A4 and Figure A5). For HCI, the influence of the city during these months is marginal, whereas for mTCI, climatic conditions within the city are projected to improve further. Consequently, these months may serve as an alternative period for outdoor tourism activities in the future, potentially shifting peak visitor flows from summer to these transitional months. These findings are also consistent with the above-mentioned international research and suggest possible benefits for Szeged’s tourism sector, as altered climatic conditions could enable diversification of tourism offerings by extending the main tourism season.
Overall, the results of this study highlight both the challenges and opportunities that regional climate change presents for urban tourism in Szeged, underscoring the need for adaptive planning to sustain the city’s liveability and attractiveness across shifting seasonal conditions. While improving local and micro-scale climatic conditions within the city is undoubtedly important and such efforts should be strengthened, our results suggest that this activity requires outstanding efforts in the light of rapidly changing regional climate. The effectiveness of such interventions will be critical in enabling tourists to cope with altered climatic conditions, and failure to achieve successful adaptation could reduce the tourism appeal of the city and its surrounding region, as visitors may favour destinations that are better prepared for future climatic conditions.
From a practical perspective, Szeged could implement a range of measures to enhance the sustainability of tourism in response to projected shifts in climate suitability. One important approach is to extend the tourism season into the transitional months of spring and autumn, when HCI and mTCI typically indicate more favourable conditions. This could involve adjusting opening times of attractions and services, rescheduling outdoor events, and promoting alternative activities such as cultural and gastronomic festivals, themed walks, visitor centres, cycling routes, baths and water parks, or medical services that are less sensitive to high summer temperatures. Enhancing local and micro-scale climatic conditions can further improve thermal comfort and visitor experience. Urban greening strategies, such as planting trees along streets, creating new parks, installing green walls, and adding water features like fountains or water walls, can provide shade, reduce the urban heat island effect, and improve local thermal conditions. The use of reflective or lighter-coloured pavement and strategically placed artificial shading can also help moderate surface heating, making public spaces more comfortable during hot periods. By combining season-extension measures with targeted urban climate adaptation strategies, Szeged and its surrounding region can maintain their attractiveness as tourist destinations, strengthen resilience, and support sustainable tourism development under changing climatic conditions. Enhancing the city’s resilience and preserving its tourism appeal would also be advantageous for the local population, enabling them to sustain their healthy living and working environment while maintaining the quality of the tourism services the local labour force can provide.
Beyond the novel approaches of this research, our study has several limitations that are worth acknowledging. Firstly, due to the absence of a gridded observational dataset with adequate spatial resolution for urban-scale model simulations in Hungary, a complex bias-adjustment procedure had to be employed in order to obtain corrected urban climate projections. In urban areas where such datasets are available, the correction methodology applied in this study can be simplified, enabling even more accurate estimates of future urban climate. Nevertheless, the bias-adjustment approach used here has inherent limitations. While the method can correct errors in the SURFEX model arising from the interactions between the driving regional climate model and the land surface model, the urban simulation (i.e., the added ‘urban signature’) remains unchanged due to the absence of an urban-scale gridded observational database. As a result, potential biases in the urban parameterization of SURFEX are not adequately addressed [36,56]. One possible solution is to employ alternative models, such as the Weather Research and Forecasting model (WRF [77]) or HARMONIE-AROME [78], incorporating more advanced urban schemes and parameterizations to allow finer temporal and spatial characterization of urban impacts.
Another limitation is that the ECOCLIMAP land surface database used in SURFEX relies on land cover observations from the 1990s and does not reflect subsequent changes, which may be substantial in urban areas [36,56]. Moreover, ECOCLIMAP includes only a limited number of urban land cover categories for the study area, thus oversimplifying urban surface diversity in Szeged. An alternative approach could be the integration of the Local Climate Zones classification system (LCZ [79]) into the urban model, which distinguishes 10 urban categories and thus ensures a more granular physical representation of surface elements. Furthermore, it is important to note that the projected future trends in tourism climate conditions depend heavily on the underlying regional climate model outputs. Therefore, apart from incorporating multiple anthropogenic scenarios, coupling SURFEX with other regional climate models would help to capture uncertainties associated with both the scenarios and the models. Finally, the applied indices also have certain limitations, as they do not account for additional weather and climatic factors that influence tourism’s climate potential, such as extreme precipitation events (e.g., the impacts of supercells) and air pollution episodes (e.g., dust storms and smog). In addition, variations in the surveys used for their empirical validation can substantially affect their rating scales and threshold values, thereby influencing the outcomes of the indices. Despite the aforementioned limitations, the methods used in this study may provide a useful framework for evaluating the future tourism’s climate potential of other cities.

5. Conclusions

The study contributes to addressing the research questions and bridging potential knowledge gaps by presenting the following conclusions:
  • Using a high-resolution, multi-model approach, the modification of tourism’s climate potential by urban surfaces is clearly evident in the medium-sized Central European settlement under investigation. The results suggest that even in a city the size of Szeged, based on 30-year climatic averages, diverse spatial and temporal characteristics can emerge. This underscores the need for more in-depth analyses of tourism climate conditions in cities with similar climatic, urban density, and socio-cultural characteristics than is currently undertaken.
  • Through the influence of the climate parameters that constitute the indices, the greatest changes occur in the densely built-up surface categories (i.e., industrial and commercial, dense urban, and temperate sub-urban areas), regardless of the time period examined. In cities with structures similar to Szeged, tourism activities are predominantly concentrated in downtown areas (e.g., museums, theatres, churches, and leisure centres). Therefore, climate change mitigation efforts should primarily target these areas. However, only spatially differentiated interventions, combined with continuous monitoring of their effects, can produce meaningful improvements.
  • Due to their design, the indices used do not uniformly capture the temporal influence of the city on tourism’s climate potential. Climatic conditions are generally more favourable in the city during May and September compared to surrounding rural areas. However, during the summer period, typically the peak of the tourism season in Central Europe, the two indices may lead to differing conclusions. Regardless of which index more accurately reflects reality, establishing sustainable tourism in Szeged and its region requires enhancing the adaptive capacity of areas most affected by climate change. This may involve strengthening existing positive measures (e.g., increasing artificial shading) or implementing new interventions (e.g., integrating green and blue infrastructure). While cities in the region exhibit unique urban climate conditions due to varying characteristics and functions, transferring best practices that align with local environmental and tourism contexts can yield effective strategic outcomes.
  • Regional climate projections indicate a clear warming trend for Szeged. From a tourism perspective, this is expected to further intensify the existing bimodal annual distribution of climatic conditions, potentially enhancing tourism activity during most transitional months while reducing it during the traditional peak season (May to September) in cities with similar climates. Overall, this could lead to an extended tourism season and increased activity in spring and autumn. Consequently, in practical terms, urban planners and stakeholders should aim to improve comfort levels in urban areas during summer months (as highlighted above) and extend the viable tourism season. This would help maintain tourism volumes and associated revenues at levels comparable to current figures.
Due to uncertainties associated with the modelling techniques used, emission scenario assumptions, and the time horizon, accurately predicting future tourism climate conditions and expected changes in Szeged and other cities in the region with similar characteristics remains challenging. What is certain, however, is that maintaining current attractiveness will not be possible without increasing climate resilience. If adaptation measures are successfully implemented, Szeged and other cities in the region could benefit from the advantages of an extended tourism season. This may even foster a form of competition among cities, where settlements that effectively integrate climate adaptation strategies with evolving tourist needs are best positioned to achieve cost-effective and sustainable tourism development.
A potential extension of this study could involve integrating the SSP climate change scenarios (Shared Socioeconomic Pathways [80]), which would be highly novel by complementing greenhouse gas emission trends with narratives describing socioeconomic developments. In addition, employing alternative fine-scale surface models that incorporate advanced urban schemes and parameterizations would enable a more detailed temporal and spatial characterization of urban impacts. Finally, our methodological framework could be extended to additional urban regions. The methodology applied here would be particularly well-suited to areas where long-term, urban-scale measurement datasets are available.

Supplementary Materials

The following supporting information can be downloaded at: https://www.mdpi.com/article/10.3390/urbansci9110447/s1, S1: Spreadsheet on tourism climate indices generated and analyzed in the study (.xlsx).

Author Contributions

Conceptualization, A.K.; methodology, A.K. and G.M.; software, A.K. and G.M.; validation, A.K. and G.M.; formal analysis, A.K. and G.M.; investigation, A.K. and G.M.; resources, A.K. and G.M.; data curation, A.K. and G.M.; writing—original draft preparation, A.K. and G.M.; writing—review and editing, A.K. and G.M.; visualization, A.K.; supervision, A.K.; project administration, A.K.; funding acquisition, A.K. All authors have read and agreed to the published version of the manuscript.

Funding

Author Attila Kovács was supported by the Ministry of Culture and Innovation of Hungary from the National Research, Development and Innovation Fund, financed under the PD_22 funding scheme (project no. NKFI PD-142335). Open access and the article processing charge were funded by this project.

Data Availability Statement

The original contributions presented in this study are included in the Supplementary Material. Further inquiries can be directed to the corresponding author.

Acknowledgments

Project no. 142335 has been implemented with the support provided by the Ministry of Culture and Innovation of Hungary from the National Research, Development and Innovation Fund, financed under the PD_22 funding scheme. The authors express their thanks to HungaroMet Hungarian Meteorological Service for providing the observed and model data.

Conflicts of Interest

The authors declare no conflicts of interest.

Abbreviations

The following abbreviations are used in this manuscript:
DKMTDanube–Criș–Mureș–Tisa Euroregion
HCIHoliday Climate Index
mTCImodified Tourism Climate Index
TCITourism Climate Index
PETPhysiologically Equivalent Temperature
SURFEXSurface Externalisée
TEBTown Energy Balance
ISBAInteractions between Soil–Biosphere–Atmosphere
RCPRepresentative Concentration Pathways
NNSNearest neighbour search
WRFWeather Research and Forecasting
LCZLocal Climate Zones
SSPShared Socioeconomic Pathways

Appendix A

Figure A1. Spatial distribution of monthly mTCI values for the period 1971–2000 according to the corrected CarpatClim-HU observational dataset (note: increasing values indicate more favourable tourism climate conditions).
Urbansci 09 00447 g0a1
Figure A2. Spatial distribution of monthly mTCI values for the period 2041–2070 according to the corrected SURFEX model dataset under the RCP4.5 scenario (note: increasing values indicate more favourable tourism climate conditions).
Urbansci 09 00447 g0a2
Figure A3. Spatial distribution of monthly mTCI values for the period 2041–2070 according to the corrected SURFEX model dataset under the RCP8.5 scenario (note: increasing values indicate more favourable tourism climate conditions).
Urbansci 09 00447 g0a3
Figure A4. Spatial distribution of monthly mTCI values for the period 2071–2100 according to the corrected SURFEX model dataset under the RCP4.5 scenario (note: increasing values indicate more favourable tourism climate conditions).
Urbansci 09 00447 g0a4
Figure A5. Spatial distribution of monthly mTCI values for the period 2071–2100 according to the corrected SURFEX model dataset under the RCP8.5 scenario (note: increasing values indicate more favourable tourism climate conditions).
Urbansci 09 00447 g0a5

References

  1. UNWTO. World Tourism Barometer; World Tourism Organization: Madrid, Spain, 2025; Volume 23. [Google Scholar] [CrossRef]
  2. WTTC. Press Release: Travel & Tourism to Create 4.5MN New Jobs Across the EU by 2035; World Travel & Tourism Council: London, UK, 2025; Available online: https://wttc.org/news/travel-and-tourism-to-create-4-5mn-new-jobs-across-the-eu-by-2035 (accessed on 4 June 2025).
  3. HCSO. Tourism Satellite Accounts, 2023; Hungarian Central Statistical Office: Budapest, Hungary, 2024; Available online: https://www.ksh.hu/s/en/publications/tourism-satellite-accounts-2023 (accessed on 4 June 2025).
  4. HCSO. The Number of Inbound Trips to Hungary and the Related Expenditures by Main Motivation; Hungarian Central Statistical Office: Budapest, Hungary, 2025; Available online: https://www.ksh.hu/stadat_files/tur/en/tur0005.html (accessed on 4 June 2025).
  5. UNWTO. Global Report on City Tourism—Cities 2012 Project; World Tourism Organization: Madrid, Spain, 2012; Available online: https://www.e-unwto.org/doi/epdf/10.18111/9789284415300 (accessed on 4 June 2025).
  6. Castela, A. Impacts of tourism in an urban community: The case of Alfama. Athens J. Tour. 2018, 5, 133–148. [Google Scholar] [CrossRef]
  7. UNWTO. Expert Group Meeting, Final Report; Advancing Sustainable Urban Tourism: Tools for Promoting Good Practices in Cities and Territories; World Tourism Organization: Bilbao, Spain, 2024; Available online: https://observatorio2030.com/sites/default/files/2024-11/Advancing%20sustainable%20urban%20tourism.pdf (accessed on 4 June 2025).
  8. Mieczkowski, Z.T. The tourism climatic index: A method of evaluating world climates for tourism. Can. Geogr. 1985, 29, 220–233. [Google Scholar] [CrossRef]
  9. Smith, K. The influence of weather and climate on recreation and tourism. Weather 1993, 48, 398–404. [Google Scholar] [CrossRef]
  10. de Freitas, C.R. Tourism climatology: Evaluating environmental information for decision making and business planning in the recreation and tourism sector. Int. J. Biometeorol. 2003, 48, 45–54. [Google Scholar] [CrossRef] [PubMed]
  11. Gómez Martín, M.B. Weather, climate and tourism. A geographical perspective. Ann. Tour. Res. 2005, 32, 571–591. [Google Scholar] [CrossRef]
  12. Lohmann, M.; Kaim, E. Weather and holiday destination preferences image, attitude and experience. Tour. Rev. 1999, 54, 54–64. [Google Scholar] [CrossRef]
  13. Gössling, S.; Bredberg, M.; Randow, A.; Sandström, E.; Svensson, P. Tourist perceptions of climate change: A study of international tourists in Zanzibar. Curr. Issues Tour. 2006, 9, 419–435. [Google Scholar] [CrossRef]
  14. Scott, D.; McBoyle, G.; Schwartzentruber, M. Climate change and the distribution of climatic resources for tourism in North America. Clim. Res. 2004, 27, 105–117. [Google Scholar] [CrossRef]
  15. Hein, L.; Metzger, M.J.; Moreno, A. Potential impacts of climate change on tourism; a case study for Spain. Curr. Opin. Environ. Sustain. 2009, 1, 170–178. [Google Scholar] [CrossRef]
  16. Perch-Nielsen, S.L.; Amelung, B.; Knutti, R. Future climate resources for tourism in Europe based on the daily Tourism Climatic Index. Clim. Change 2010, 103, 363–381. [Google Scholar] [CrossRef]
  17. Amelung, B.; Moreno, A. Costing the impact of climate change on tourism in Europe: Results of the PESETA project. Clim. Change 2012, 112, 83–100. [Google Scholar] [CrossRef]
  18. Barrutiabengoa, J.M.; Carta, G.; González, N.; Pérez, D.; Más, P.; Yücel, G. Climate change scenarios and the evolution of Spanish tourism. Clim. Change 2025, 178, 129. [Google Scholar] [CrossRef]
  19. Maddison, D. In search of warmer climates? The impact of climate change on flows of British tourists. Clim. Change 2001, 49, 193–208. [Google Scholar] [CrossRef]
  20. Lise, W.; Tol, R.S.J. Impact of climate on tourist demand. Clim. Change 2002, 55, 429–449. [Google Scholar] [CrossRef]
  21. Agnew, M.D.; Palutikof, J.P. Impacts of short-term climate variability in the UK on demand for domestic and international tourism. Clim. Res. 2006, 31, 109–120. [Google Scholar] [CrossRef]
  22. Eugenio-Martin, J.L.; Campos-Soria, J.A. Climate in the region of origin and destination choice in outbound tourism demand. Tour. Manag. 2010, 31, 744–753. [Google Scholar] [CrossRef]
  23. Aygün Oğur, A.; Baycan, T. Assessing climate change impacts on tourism demand in Turkey. Environ. Dev. Sustain. 2023, 25, 2905–2935. [Google Scholar] [CrossRef]
  24. Lemesios, I.; Varotsos, K.V.; Georgopoulou, E.; Sarafidis, Y.; Kapetanakis, D.; Mirasgedis, S.; Gakis, N.; Giannakopoulos, C. Effects of climate change on the future attractiveness of tourist destinations in Greece. Atmosphere 2024, 15, 1185. [Google Scholar] [CrossRef]
  25. Çalişkan, O.; Çiçek, I.; Matzarakis, A. The climate and bioclimate of Bursa (Turkey) from the perspective of tourism. Theor. Appl. Climatol. 2012, 107, 417–425. [Google Scholar] [CrossRef]
  26. Ndetto, E.L.; Matzarakis, A. Basic analysis of climate and urban bioclimate of Dar es Salaam, Tanzania. Theor. Appl. Climatol. 2013, 114, 213–226. [Google Scholar] [CrossRef]
  27. Salata, F.; Golasi, I.; Proietti, R.; de Lieto Vollaro, A. Implications of climate and outdoor thermal comfort on tourism: The case of Italy. Int. J. Biometeorol. 2017, 61, 2229–2244. [Google Scholar] [CrossRef]
  28. Mansuroğlu, S.; Dağ, V.; Önaç, A.K. Attitudes of people toward climate change regarding the bioclimatic comfort level in tourism cities; evidence from Antalya, Turkey. Environ. Monit. Assess. 2021, 193, 420. [Google Scholar] [CrossRef]
  29. Caldeira, A.M.; Kastenholz, E. It’s so hot: Predicting climate change effects on urban tourists’ time–space experience. J. Sustain. Tour. 2018, 26, 1516–1542. [Google Scholar] [CrossRef]
  30. Holec, J.; Feranec, J.; Šťastný, P.; Szatmári, D.; Kopecká, M.; Garaj, M. Evolution and assessment of urban heat island between the years 1998 and 2016: Case study of the cities Bratislava and Trnava in western Slovakia. Theor. Appl. Climatol. 2020, 141, 979–997. [Google Scholar] [CrossRef]
  31. Molnár, G.; Kovács, A.; Gál, T. How does anthropogenic heating affect the thermal environment in a medium-sized Central European city? A case study in Szeged, Hungary. Urban Clim. 2020, 34, 100673. [Google Scholar] [CrossRef]
  32. Arnfield, A.J. Two decades of urban climate research: A review of turbulence, exchanges of energy and water, and the urban heat island. Int. J. Climatol. 2003, 23, 1–26. [Google Scholar] [CrossRef]
  33. Molnár, G.; Gyöngyösi, A.Z.; Gál, T. Integration of an LCZ-based classification into WRF to assess the intra-urban temperature pattern under a heatwave period in Szeged, Hungary. Theor. Appl. Climatol. 2019, 138, 1139–1158. [Google Scholar] [CrossRef]
  34. Zsebeházi, G.; Mahó, S.I. Assessment of the urban impact on surface and screen-level temperature in the ALADIN-Climate driven SURFEX land surface model for Budapest. Atmosphere 2021, 12, 709. [Google Scholar] [CrossRef]
  35. Megyeri-Korotaj, O.A.; Bán, B.; Suga, R.; Allaga-Zsebeházi, G.; Szépszó, G. Assessment of climate indices over the Carpathian Basin based on ALADIN5.2 and REMO2015 regional climate model simulations. Atmosphere 2023, 14, 448. [Google Scholar] [CrossRef]
  36. Allaga-Zsebeházi, G. Estimating the Climate Change Impacts in Urban Areas Using the SURFEX Land Surface Model. Ph.D. Dissertation, Eötvös Loránd University, Budapest, Hungary, 2024. [Google Scholar] [CrossRef]
  37. Žgela, M.; Herceg-Bulić, I.; Lozuk, J.; Jureša, P. Linking land surface temperature and local climate zones in nine Croatian cities. Urban Clim. 2024, 54, 101842. [Google Scholar] [CrossRef]
  38. Tasan, M.; Dąbrowska, J.; Michałowska, K. Surface urban heat islands during heatwaves: Thermal impacts on the built environment in selected polish cities. Build. Environ. 2025, 285 Pt B, 113603. [Google Scholar] [CrossRef]
  39. HMS. Climate Data Series 1901–2020, Szeged; HungaroMet Hungarian Meteorological Service: Budapest, Hungary, 2021; Available online: https://met.hu/en/eghajlat/magyarorszag_eghajlata/eghajlati_adatsorok/Szeged/adatok/eves_adatok (accessed on 18 June 2025).
  40. HCSO. Tourist Arrivals and Tourism Nights at Tourist Accommodation Establishments in Budapest and by Tourism Areas; Hungarian Central Statistical Office: Budapest, Hungary, 2025; Available online: https://www.ksh.hu/stadat_files/tur/en/tur0086.html (accessed on 20 June 2025).
  41. HCSO. Tourism Nights at Tourist Accommodation Establishments in Budapest and by Tourism Areas (Monthly Data); Hungarian Central Statistical Office: Budapest, Hungary, 2025; Available online: https://www.ksh.hu/stadat_files/tur/en/tur0081.html (accessed on 20 June 2025).
  42. Scott, D.; Rutty, M.; Amelung, B.; Tang, M. An inter-comparison of the Holiday Climate Index (HCI) and the Tourism Climate Index (TCI) in Europe. Atmosphere 2016, 7, 80. [Google Scholar] [CrossRef]
  43. Kovács, A.; Unger, J.; Gál, C.V.; Kántor, N. Adjustment of the thermal component of two tourism climatological assessment tools using thermal perception and preference surveys from Hungary. Theor. Appl. Climatol. 2016, 125, 113–130. [Google Scholar] [CrossRef]
  44. Kovács, A.; Németh, Á.; Unger, J.; Kántor, N. Tourism climatic conditions of Hungary—Present situation and assessment of future changes. Időjárás (Q. J. Hung. Meteorol. Serv.) 2017, 121, 79–99. [Google Scholar]
  45. Kovács, A.; Molnár, G.; Megyeri-Korotaj, O.A. Projected climate suitability for Hungarian tourism in the 21st century: Application of the Holiday Climate Index and modified Tourism Climate Index. Int. J. Biometeorol. 2025, 69, 1429–1442. [Google Scholar] [CrossRef] [PubMed]
  46. Höppe, P. The physiological equivalent temperature—A universal index for the biometeorological assessment of the thermal environment. Int. J. Biometeorol. 1999, 43, 71–75. [Google Scholar] [CrossRef]
  47. Burke, M.; Sipe, N.; Evans, R.; Mellifont, D. Climate, geography and the propensity to walk: Environmental factors and walking trip rates in Brisbane. In Proceedings of the 29th Australasian Transport Research Forum, Gold Coast, Australia, 27–29 September 2006. [Google Scholar]
  48. Kántor, N.; Kovács, A.; Takács, Á. Seasonal differences in the subjective assessment of outdoor thermal conditions and the impact of analysis techniques on the obtained results. Int. J. Biometeorol. 2016, 60, 1615–1635. [Google Scholar] [CrossRef] [PubMed]
  49. Kovács, A.; Király, A. Assessment of climate change exposure of tourism in Hungary using observations and regional climate model data. Hung. Geogr. Bull. 2021, 70, 215–231. [Google Scholar] [CrossRef]
  50. Rutty, M.; Scott, D.; Matthews, L.; Burrowes, R.; Trotman, A.; Mahon, R.; Charles, A. An inter-comparison of the Holiday Climate Index (HCI:Beach) and the Tourism Climate Index (TCI) to explain Canadian tourism arrivals to the Caribbean. Atmosphere 2020, 11, 412. [Google Scholar] [CrossRef]
  51. Masson, V.; Le Moigne, P.; Martin, E.; Faroux, S.; Alias, A.; Alkama, R.; Belamari, S.; Barbu, A.; Boone, A.; Bouyssel, F.; et al. The SURFEXv7.2 land and ocean surface platform for coupled or offline simulation of earth surface variables and fluxes. Geosci. Model Dev. 2013, 6, 929–960. [Google Scholar] [CrossRef]
  52. KlimAdat Project, Implemented in the Framework of the Environmental and Energy Efficiency Operative Program (KEHOP-1.1.0). Available online: https://www.met.hu/klimadat/en/kezdo (accessed on 2 October 2024).
  53. Zsebeházi, G. Az ALADIN-Climate-tal Meghajtott SURFEX Modellkísérletek Eredményeinek Validációja (Validation of the ALADIN-Climate Driven SURFEX Simulations’ Results); Project Report, KlimAdat (KEHOP-1.1.0) Project; Hungarian Meteorological Service: Budapest, Hungary, 2020; Available online: https://www.met.hu/downloads.php?fn=/klimadat/doc/reports/KLIMADAT_beszamolo_Zsebehazi_202010.pdf (accessed on 2 October 2024).
  54. Zsebeházi, G.; Szépszó, G. Modeling the urban climate of Budapest using the SURFEX land surface model driven by the ALADIN-Climate regional climate model results. Időjárás (Q. J. Hung. Meteorol. Serv.) 2020, 124, 191–207. [Google Scholar] [CrossRef]
  55. Allaga-Zsebeházi, G. Future temperature and urban heat island changes in Budapest: A comparative study based on the HMS-ALADIN and SURFEX models. Időjárás (Q. J. Hung. Meteorol. Serv.) 2021, 125, 675–692. [Google Scholar] [CrossRef]
  56. Allaga-Zsebeházi, G. Az RCP4.5 és RCP8.5 Forgatókönyvekkel Készített SURFEX Városi Éghajlatváltozási Kísérletek Kiértékelése (Evaluation of the SURFEX Urban Climate Projections Using the RCP4.5 and RCP8.5 Anthropogenic Scenarios); Project Report, KlimAdat (KEHOP-1.1.0) Project; Hungarian Meteorological Service: Budapest, Hungary, 2021; Available online: https://www.met.hu/downloads.php?fn=/klimadat/doc/reports/KLIMADAT_beszamolo_Allaga-Zsebehazi_202112.pdf (accessed on 2 October 2024).
  57. Masson, V. A physically-based scheme for the urban energy budget in atmospheric models. Bound Layer. Meteorol. 2000, 94, 357–397. [Google Scholar] [CrossRef]
  58. Noilhan, J.; Mahfouf, J.-F. The ISBA land surface parameterisation scheme. Glob. Planet. Change 1996, 13, 145–159. [Google Scholar] [CrossRef]
  59. Masson, V.; Champeaux, J.-L.; Chauvin, F.; Meriguet, C.; Lacaze, R. A global database of land surface parameters at 1-km resolution in meteorological and climate models. J. Clim. 2003, 16, 1261–1282. [Google Scholar] [CrossRef]
  60. Bán, B.; Megyeri, O.A.; Suga, R. Az ALADIN5.2 és a REMO2015 Regionális Klímamodellek Múltbeli Időszakra Vonatkozó Eredményeinek Validációja (Validation of the ALADIN5.2 and REMO2015 Regional Climate Models’ Results for a Past Period); Project Report, KlimAdat (KEHOP-1.1.0) Project; Hungarian Meteorological Service: Budapest, Hungary, 2021; Available online: https://www.met.hu/downloads.php?fn=/klimadat/doc/reports/KLIMADAT_beszamolo_ALADIN_REMO_final.pdf (accessed on 2 October 2024).
  61. Bán, B.; Szépszó, G.; Allaga-Zsebeházi, G.; Somot, S. ALADIN-Climate at the Hungarian Meteorological Service: From the beginnings to the present day’s results. Időjárás (Q. J. Hung. Meteorol. Serv.) 2021, 125, 647–673. [Google Scholar] [CrossRef]
  62. Voldoire, A.; Sanchez-Gomez, E.; Salas y Mélia, D.; Decharme, B.; Cassou, C.; Sénési, S.; Valcke, S.; Beau, I.; Alias, A.; Chevallier, M.; et al. The CNRM-CM5.1 global climate model: Description and basic evaluation. Clim. Dyn. 2013, 40, 2091–2121. [Google Scholar] [CrossRef]
  63. van Vuuren, D.P.; Edmonds, J.; Kainuma, M.; Riahi, K.; Thomson, A.; Hibbard, K.; Hurtt, G.C.; Kram, T.; Krey, V.; Lamarque, J.-F.; et al. The representative concentration pathways: An overview. Clim. Change 2011, 109, 5–31. [Google Scholar] [CrossRef]
  64. Matzarakis, A.; Rutz, F.; Mayer, H. Modelling radiation fluxes in simple and complex environments: Basics of the RayMan model. Int. J. Biometeorol. 2010, 54, 131–139. [Google Scholar] [CrossRef]
  65. Bihari, Z.; Lakatos, M.; Szentimrey, T. Felszíni megfigyelésekből készített rácsponti adatbázisok az Országos Meteorológiai Szolgálatnál (Gridded data series prepared from surface observation at Hungarian Meteorological Service). Légkör 2017, 62, 148–151. [Google Scholar]
  66. SURFEX User’s Guide V8.1, 2020. Available online: https://www.umr-cnrm.fr/surfex/IMG/pdf/surf-v8-1d.pdf (accessed on 11 December 2024).
  67. Hawkins, E.; Osborne, T.M.; Ho, C.K.; Challinor, A.J. Calibration and bias correction of climate projections for crop modelling: An idealised case study over Europe. Agric. Meteorol. 2013, 170, 19–31. [Google Scholar] [CrossRef]
  68. Szépszó, G. A REMO Regionális Éghajlati Modellen Alapuló Klímadinamikai Vizsgálatok a KÁRPÁT-Medence Éghajlatának Jellemzésére (Climate Dynamics Investigations for the Carpathian Basin with the REMO Regional Climate Model). Ph.D. Dissertation, Eötvös Loránd University, Budapest, Hungary, 2014. [Google Scholar]
  69. Scott, D.; McBoyle, G. Using a ‘tourism climate index’ to examine the implications of climate change for climate as a tourism resource. In Proceedings of the First International Workshop on Climate, Tourism and Recreation, Porto Carras, Neos Marmaras, Halkidiki, Greece, 5–10 October 2001; pp. 69–88. [Google Scholar]
  70. Qi, L.; Hu, Y.; Bu, R.; Li, B.; Gao, Y.; Li, C. Evaluation of the thermal environment based on the urban neighborhood heat/cool island effect. Land 2024, 13, 933. [Google Scholar] [CrossRef]
  71. Wen, J.; Chen, J.; Lin, W.; Jiang, B.; Xu, S.; Lan, J. Impacts of anthropogenic heat flux and urban land-use change on frontal rainfall near coastal regions: A case study of a rainstorm over the Pearl River Delta, South China. J. Appl. Meteorol. Climatol. 2020, 59, 363–379. [Google Scholar] [CrossRef]
  72. Gunawardena, K.R.; Wells, M.J.; Kershaw, T. Utilising green and bluespace to mitigate urban heat island intensity. Sci. Total Environ. 2017, 584–585, 1040–1055. [Google Scholar] [CrossRef] [PubMed]
  73. Kastner-Klein, P.; Fedorovich, E.; Rotach, M.W. A wind tunnel study of organised and turbulent air motions in urban street canyons. J. Wind Eng. Ind. Aerodyn. 2001, 89, 849–861. [Google Scholar] [CrossRef]
  74. Wang, J.; Feng, J.; Yan, Z. Potential sensitivity of warm season precipitation to urbanization extents: Modeling study in Beijing-Tianjin-Hebei urban agglomeration in China. J. Geophys. Res. Atmos. 2015, 120, 9408–9425. [Google Scholar] [CrossRef]
  75. Carrillo, J.; González, A.; Pérez, J.C.; Expósito, F.J.; Díaz, J.P. Projected impacts of climate change on tourism in the Canary Islands. Reg. Environ. Change 2022, 22, 61. [Google Scholar] [CrossRef]
  76. Demiroglu, O.C.; Saygili-Araci, F.S.; Pacal, A.; Hall, C.M.; Kurnaz, M.L. Future Holiday Climate Index (HCI) performance of urban and beach destinations in the Mediterranean. Atmosphere 2020, 11, 911. [Google Scholar] [CrossRef]
  77. Skamarock, W.C.; Klemp, J.B.; Dudhia, J.; Gill, D.O.; Liu, Z.; Berner, J.; Wang, W.; Powers, J.G.; Duda, M.G.; Barker, D.M.; et al. A Description of the Advanced Research WRF Model Version 4. NCAR Technical Notes NCAR/TN-556+STR; National Center for Atmospheric Research: Boulder, CO, USA, 2019. [Google Scholar] [CrossRef]
  78. Bengtsson, L.; Andrae, U.; Aspelien, T.; Batrak, Y.; Calvo, J.; de Rooy, W.; Gleeson, E.; Hansen-Sass, B.; Homleid, M.; Hortal, M.; et al. The HARMONIE–AROME model configuration in the ALADIN–HIRLAM NWP System. Mon. Weather Rev. 2017, 145, 1919–1935. [Google Scholar] [CrossRef]
  79. Stewart, I.D.; Oke, T.R. Local climate zones for urban temperature studies. Bull. Am. Meteorol. Soc. 2012, 93, 1879–1900. [Google Scholar] [CrossRef]
  80. Riahi, K.; van Vuuren, D.P.; Kriegler, E.; Edmonds, J.; O’Neill, B.C.; Fujimori, S.; Bauer, N.; Calvin, K.; Dellink, R.; Fricko, O.; et al. The Shared Socioeconomic Pathways and their energy, land use, and greenhouse gas emissions implications: An overview. Glob. Environ. Change 2017, 42, 153–168. [Google Scholar] [CrossRef]
Figure 1. Geographical location of Hungary and Szeged.
Urbansci 09 00447 g001
Figure 2. Land cover types in Szeged, based on the ECOCLIMAP database used in the SURFEX model [66]. The covers that were considered non-urban are merged into a single class called ‘Rural’.
Urbansci 09 00447 g002
Figure 3. Spatial distribution of monthly HCI values for the period 1971–2000 according to the corrected CarpatClim-HU observational dataset (note: increasing values indicate more favourable tourism climate conditions).
Urbansci 09 00447 g003
Figure 4. Spatial distribution of monthly HCI values for the period 2041–2070 according to the corrected SURFEX model dataset under the RCP4.5 scenario (note: increasing values indicate more favourable tourism climate conditions).
Urbansci 09 00447 g004
Figure 5. Spatial distribution of monthly HCI values for the period 2041–2070 according to the corrected SURFEX model dataset under the RCP8.5 scenario (note: increasing values indicate more favourable tourism climate conditions).
Urbansci 09 00447 g005
Figure 6. Spatial distribution of monthly HCI values for the period 2071–2100 according to the corrected SURFEX model dataset under the RCP4.5 scenario (note: increasing values indicate more favourable tourism climate conditions).
Urbansci 09 00447 g006
Figure 7. Spatial distribution of monthly HCI values for the period 2071–2100 according to the corrected SURFEX model dataset under the RCP8.5 scenario (note: increasing values indicate more favourable tourism climate conditions).
Urbansci 09 00447 g007
Table 1. Summary of the primary datasets used in the study.
DatabaseEmission ScenariosResolutionPeriods
CarpatClim-HU10 km1971–2000
ALADIN5.2RCP4.5, RCP8.510 km1971–2000, 2041–2070, 2071–2100
SURFEXRCP4.5, RCP8.5 *1 km1971–2000, 2041–2070, 2071–2100
* Derived from ALADIN5.2.
Table 2. Key parameters of the different urban land cover types in Szeged, based on the ECOCLIMAP database used in the SURFEX model (adapted from [36]).
Land Cover TypeDense UrbanTemperate Sub-UrbanIndustries and Commercial AreasRoad and Rail NetworksUrban Parks
Fraction of urban and artificial areas0.90.60.90.90.1
Fraction of cultivated and natural areas0.10.40.10.10.9
Building height (m)30102055
Disclaimer/Publisher’s Note: The statements, opinions and data contained in all publications are solely those of the individual author(s) and contributor(s) and not of MDPI and/or the editor(s). MDPI and/or the editor(s) disclaim responsibility for any injury to people or property resulting from any ideas, methods, instructions or products referred to in the content.