Cooling of Maximum Temperatures in Six Saudi Arabian Cities (1994–2024)—Reversal of Urban Heat Islands
Abstract
1. Introduction
- The use of two independent and high-resolution datasets, ERA5-Land and CHIRTS-ERA5, to cross-validate UHI estimates, enhancing the robustness of the results.
- A multi-city approach encompassing six major Saudi cities (Dammam, Jeddah, Makkah, Madinah, Riyadh, and Abha), in contrast to most previous UHI studies in the Kingdom that have focused on a single city.
- Assessing the UHI across urban, suburban, and rural zones to provide a continuous perspective from city centers to rural landscapes.
- The comparative analysis of coastal cities (Dammam and Jeddah) and inland cities (e.g., Riyadh), allowing for the examination of the role of maritime influence on UHI intensity.
- The inclusion of high-altitude cities such as Abha, enabling an evaluation of how elevation and mountainous terrain affect UHI patterns.
- A spatiotemporal perspective that assesses UHI changes over a 30-year period (1994–2024), providing insights into both long-term climate variability and the impacts of rapid urbanization.
2. Methodology
2.1. City Selection
2.2. Zonal Classification
2.3. Temperature Data
2.3.1. The ERA5-Land Dataset
2.3.2. CHIRTS-ERA5
2.4. Normalized Difference Vegetation Index (NDVI) Data
2.5. Software, Mapping and Analysis
- ✓
- Selection of study cities: Six cities were selected for UHI analysis. These cities represent the five most populated cities in Saudi Arabia (Dammam, Makkah, Madinah, Jeddah, and Riyadh) and Abha, representing a high-altitude, hilly region.
- ✓
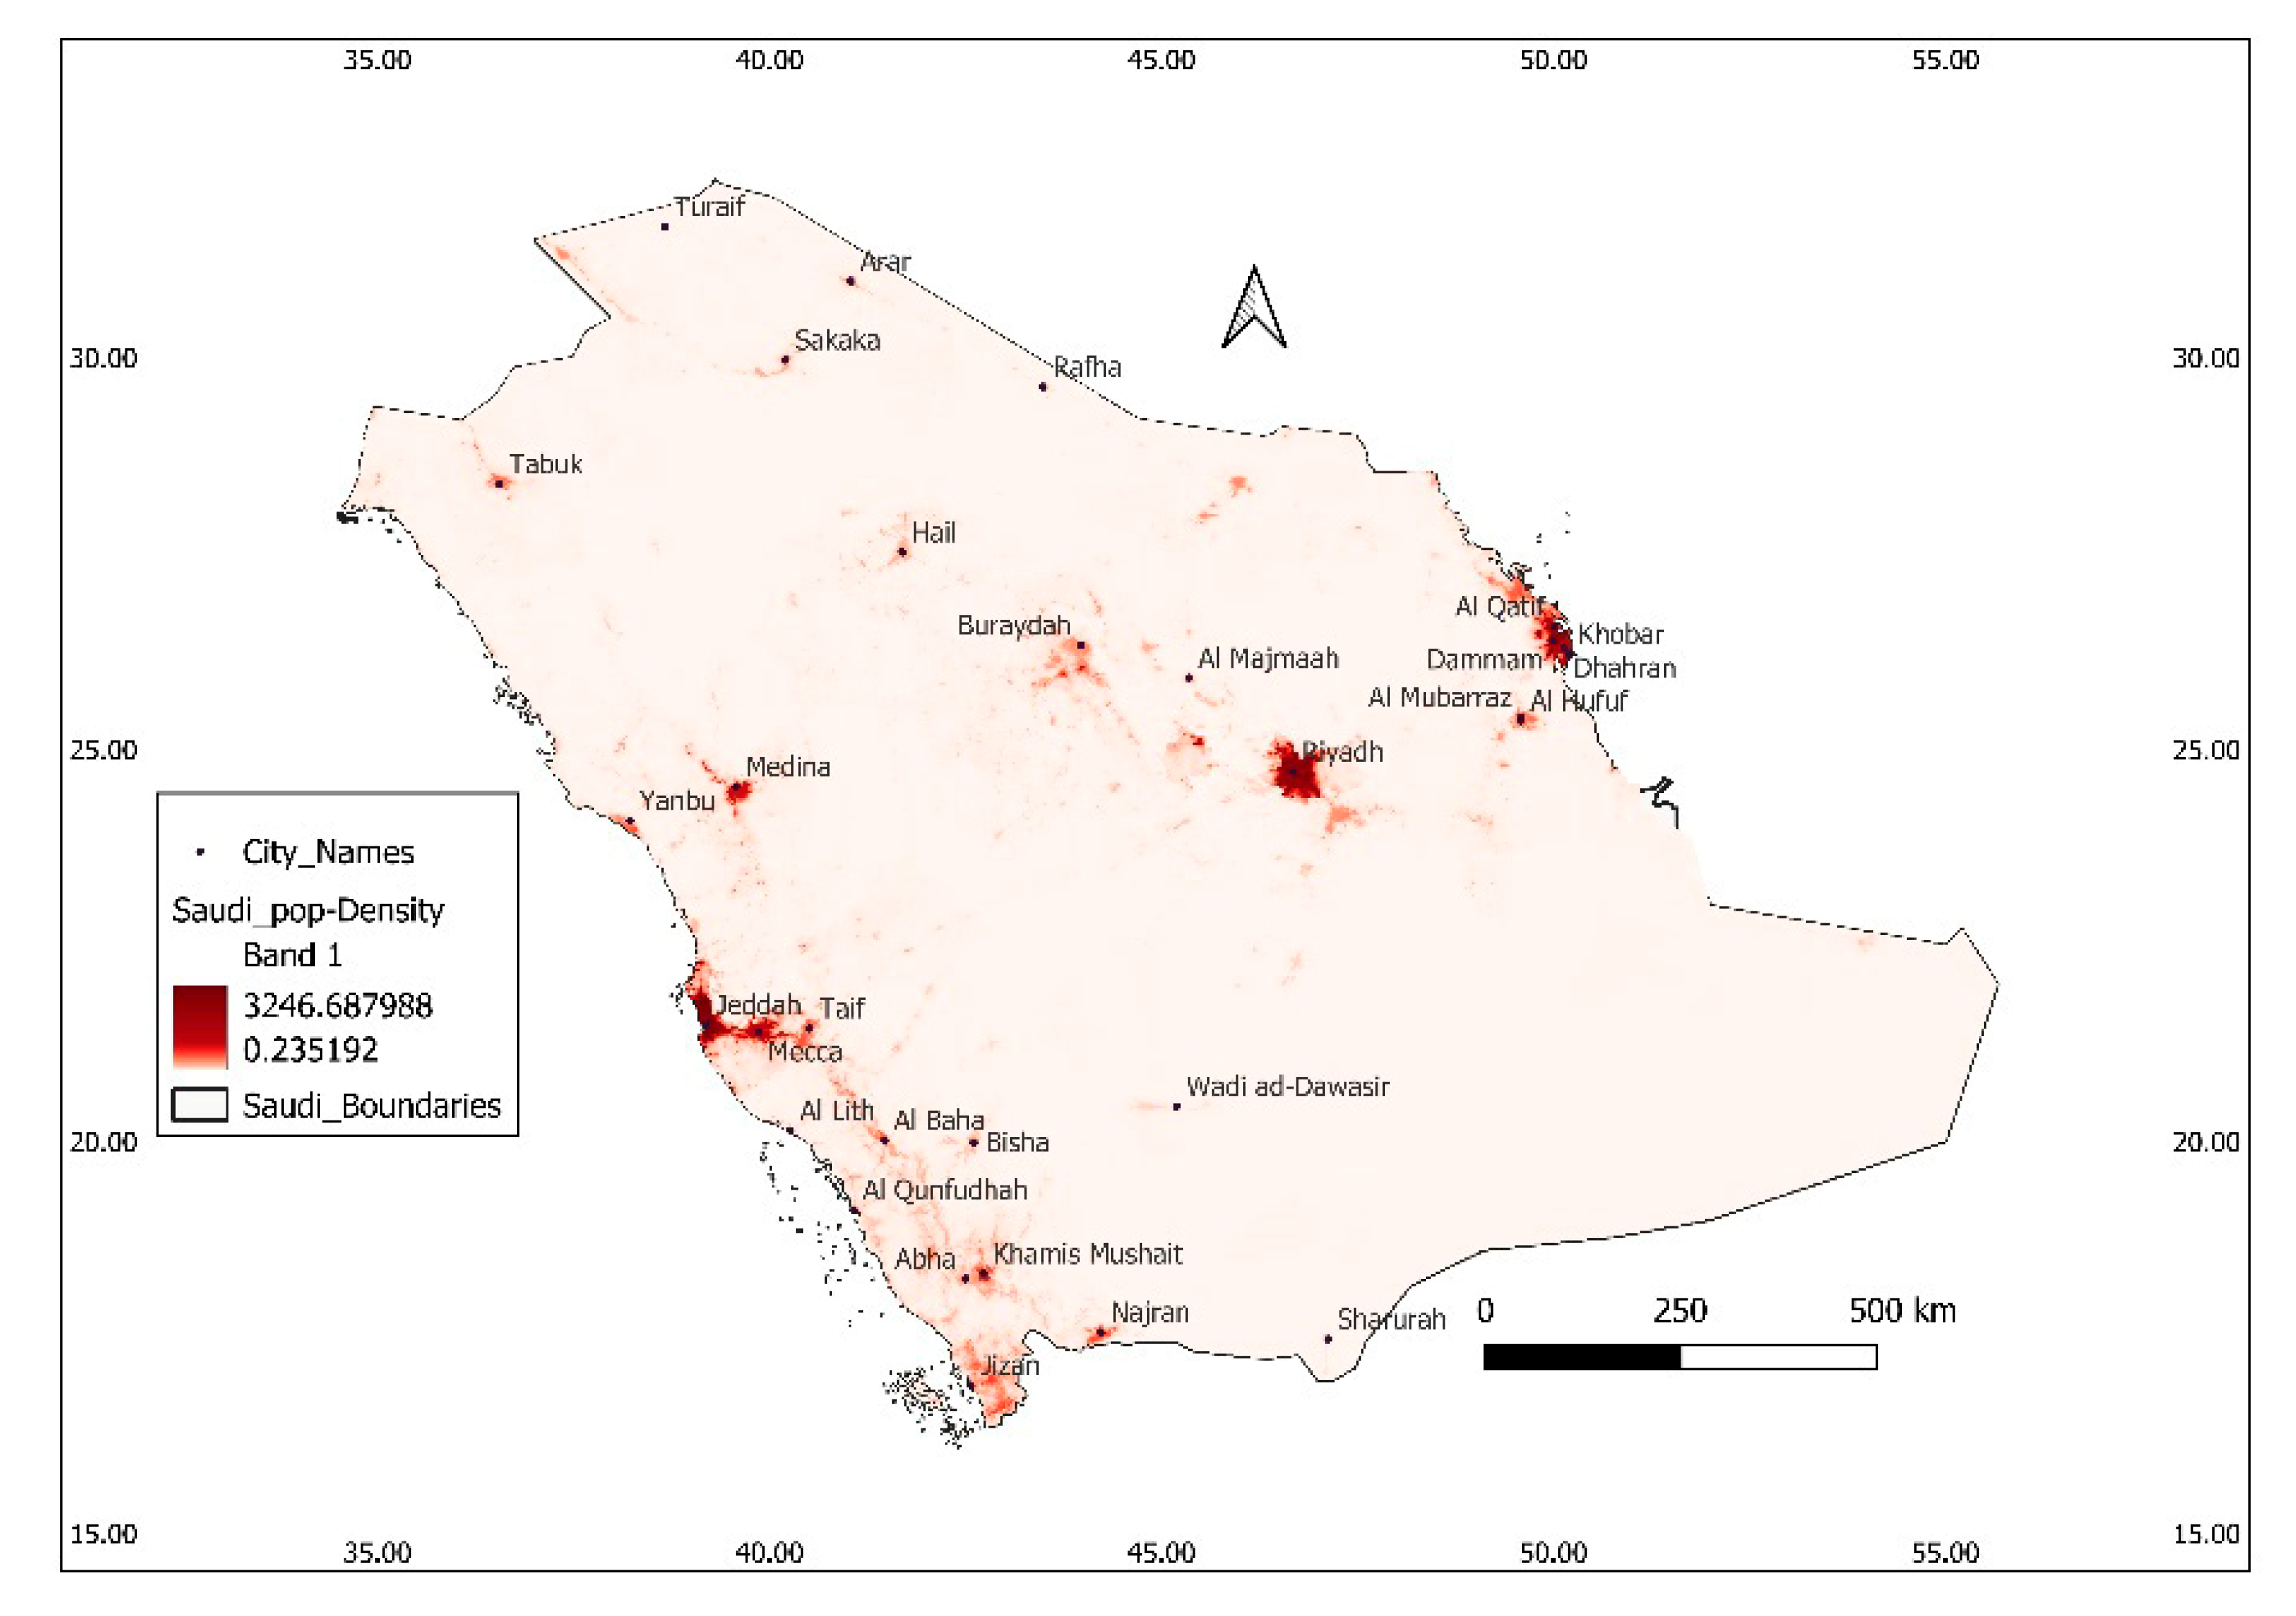
- Acquisition of population density data: A high-resolution population density map of Saudi Arabia was obtained and used as the basis for spatial classification.
- ✓
- Extraction of city boundaries: Administrative boundary outlines for the six selected cities were sourced and prepared for spatial analysis.
- ✓
- Derivation of population density values for each city: Population density data were spatially intersected with the city boundaries to extract population density values specific to each urban area.
- ✓
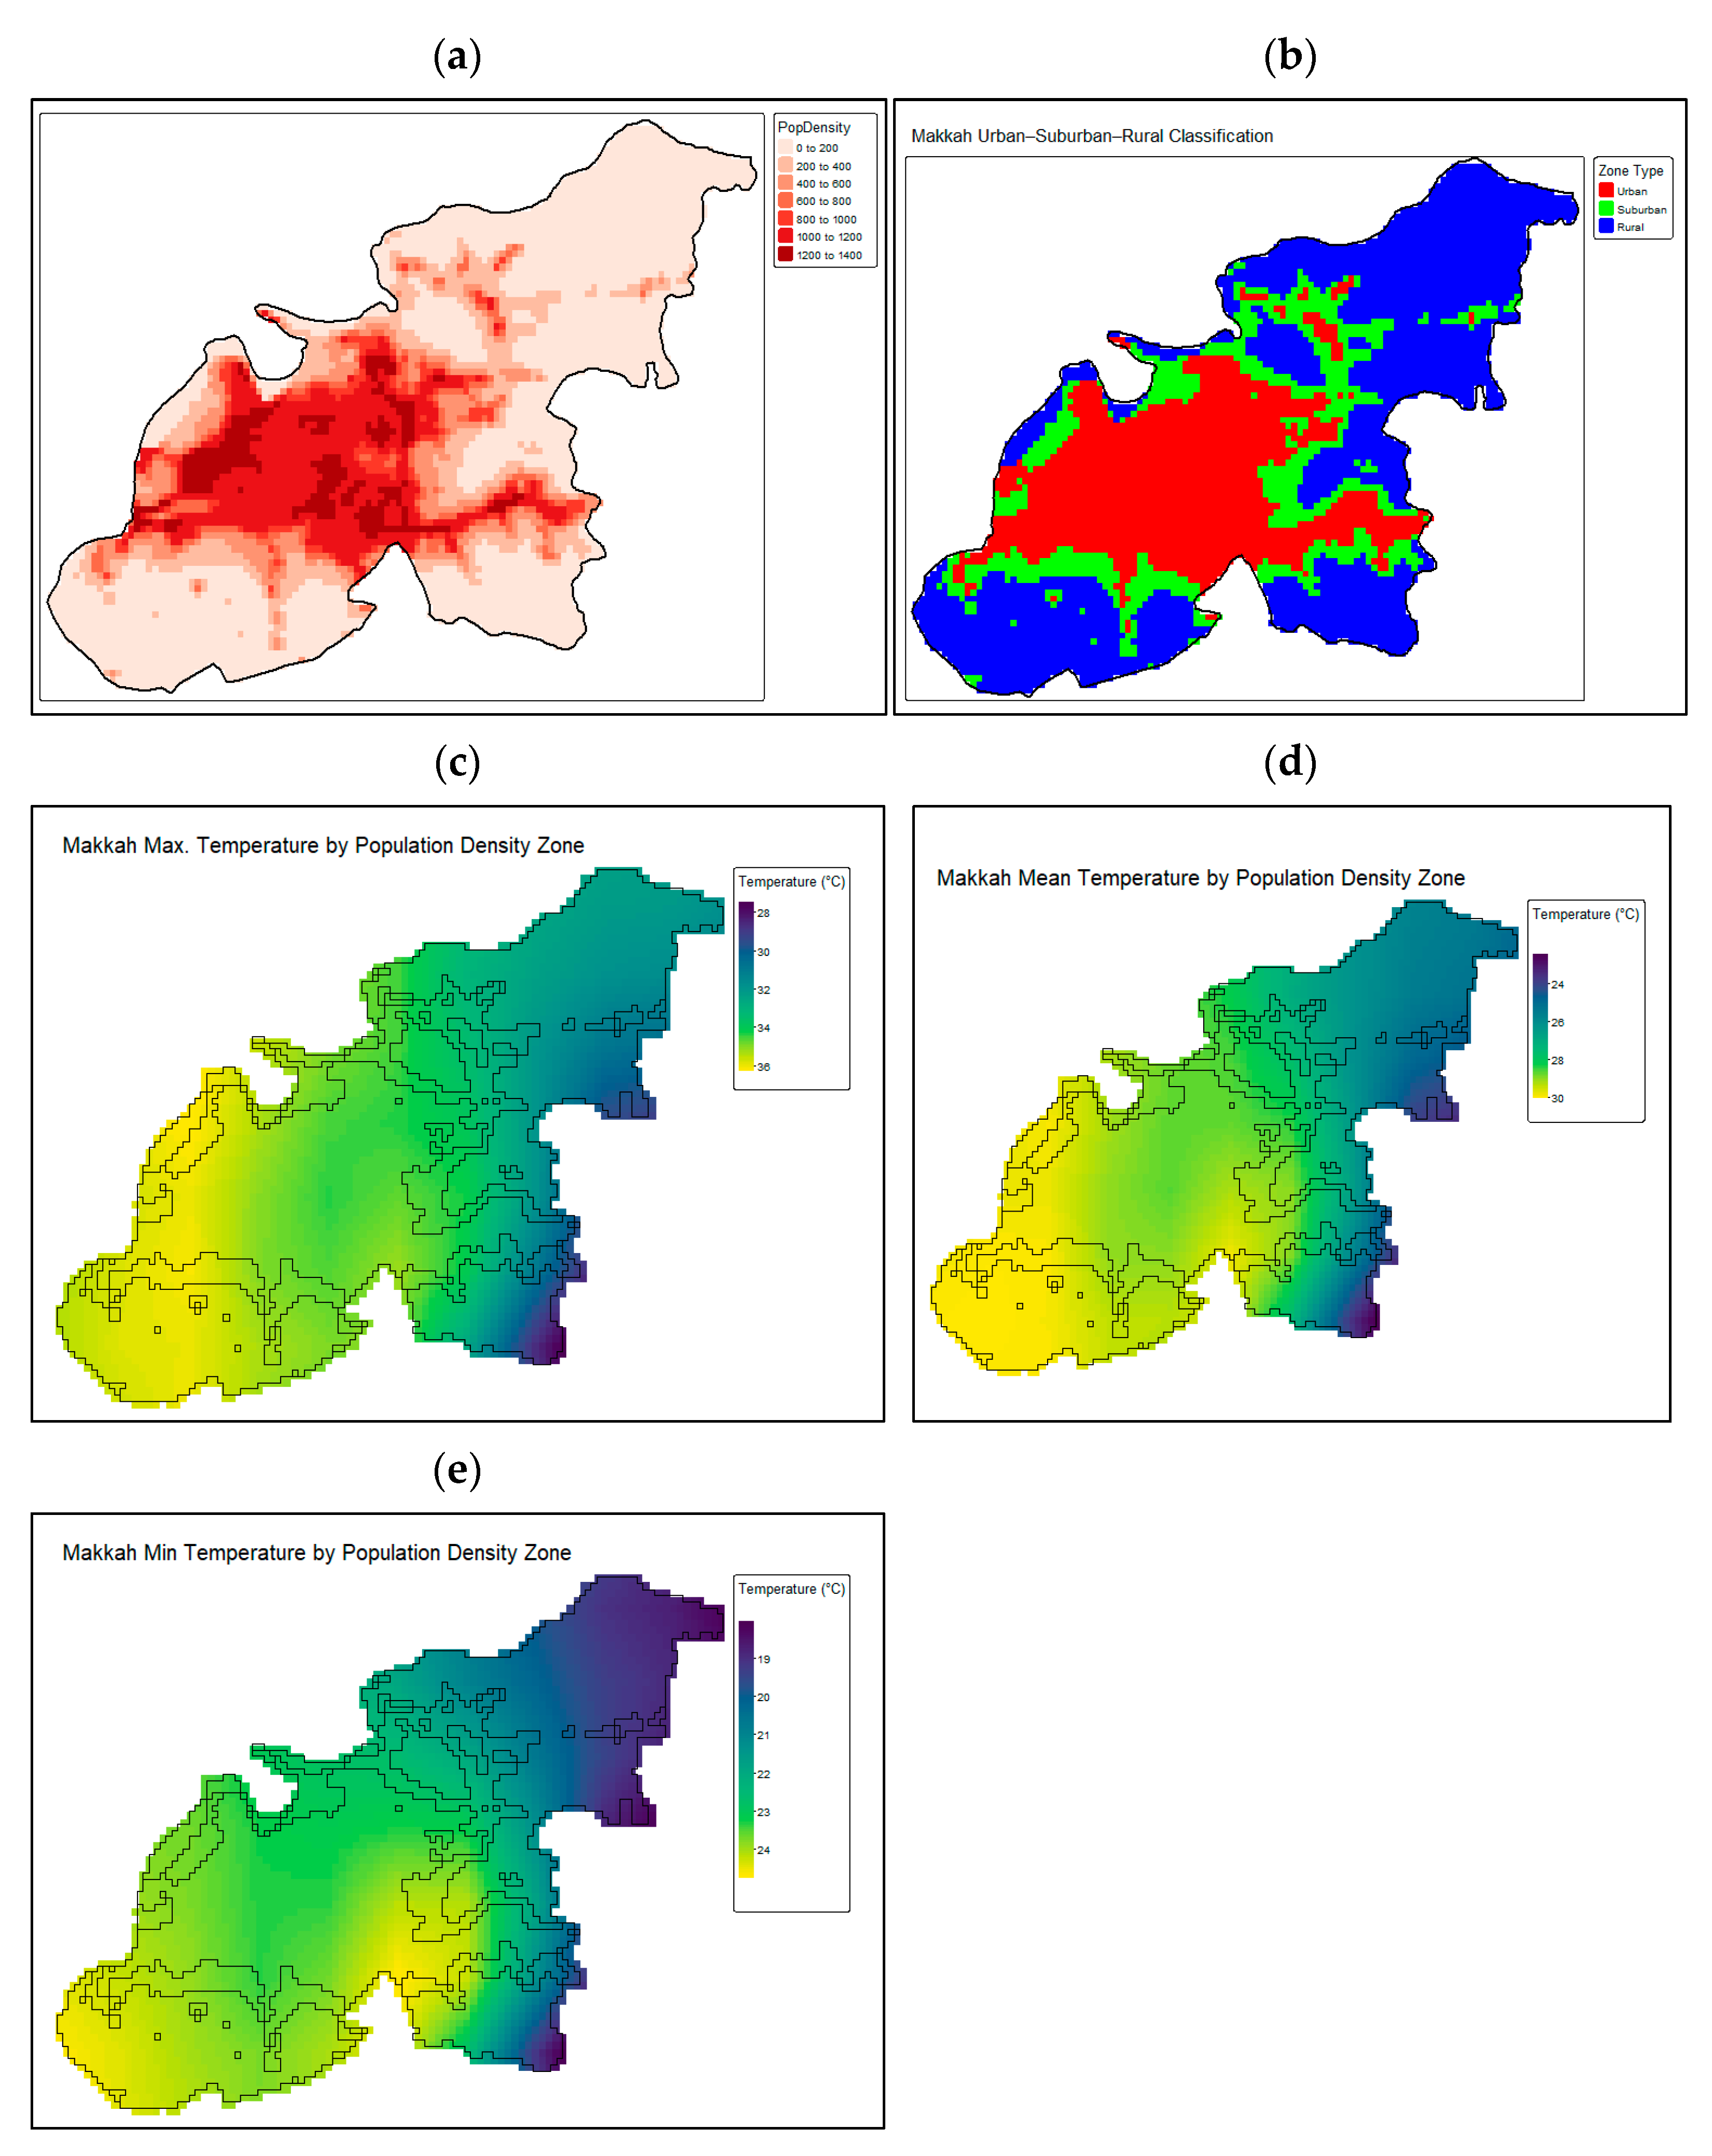
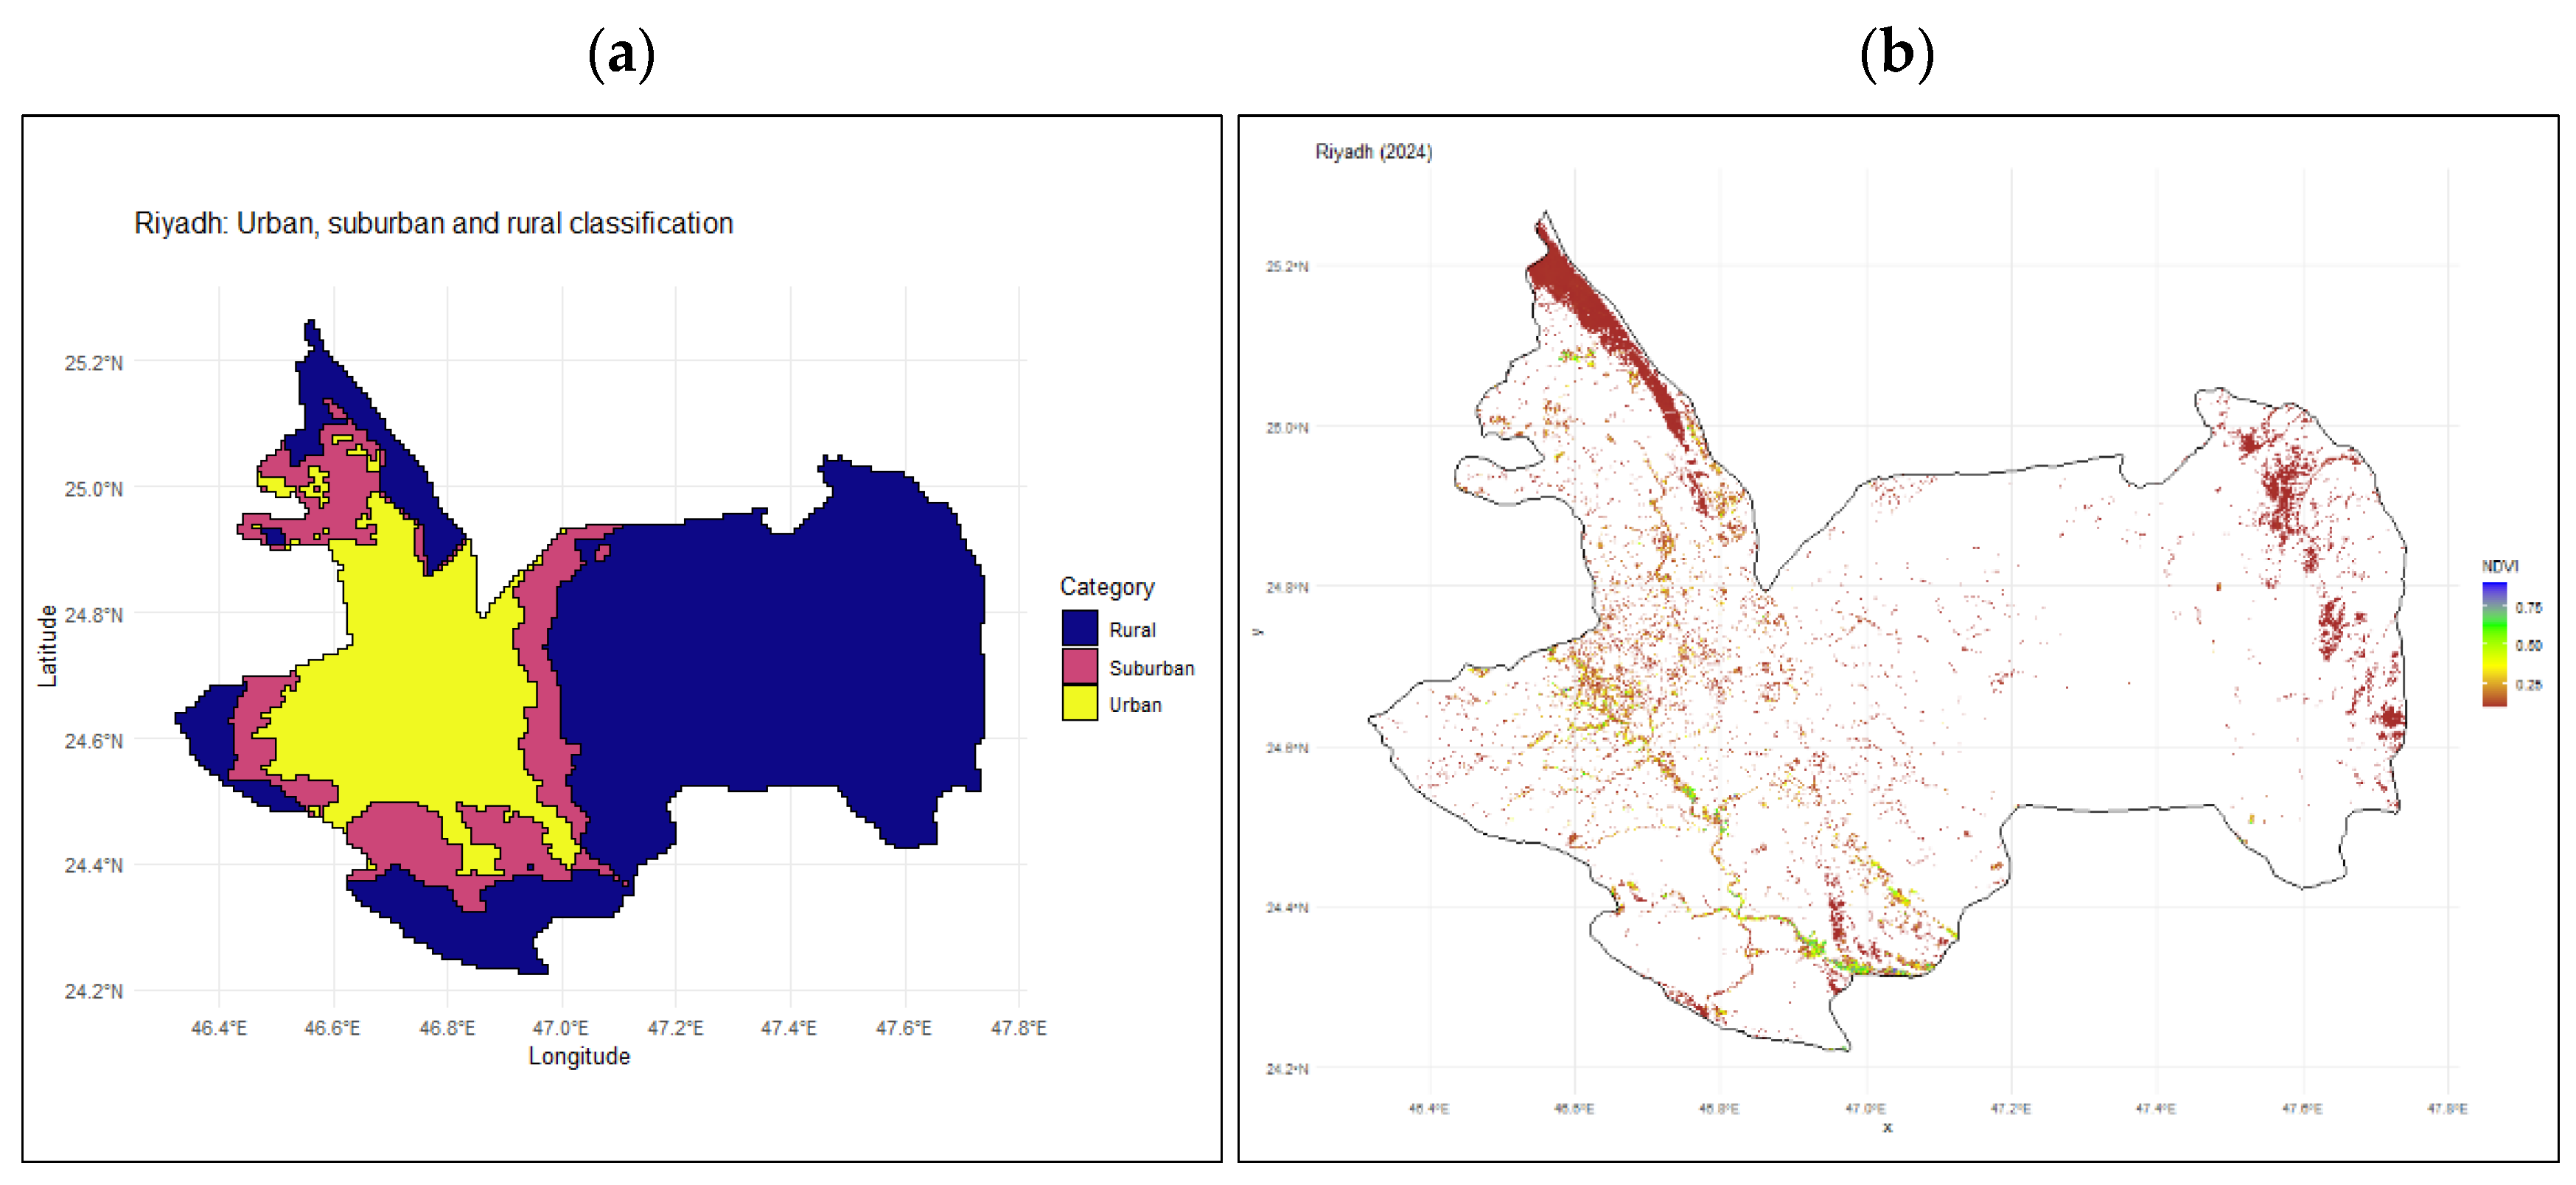
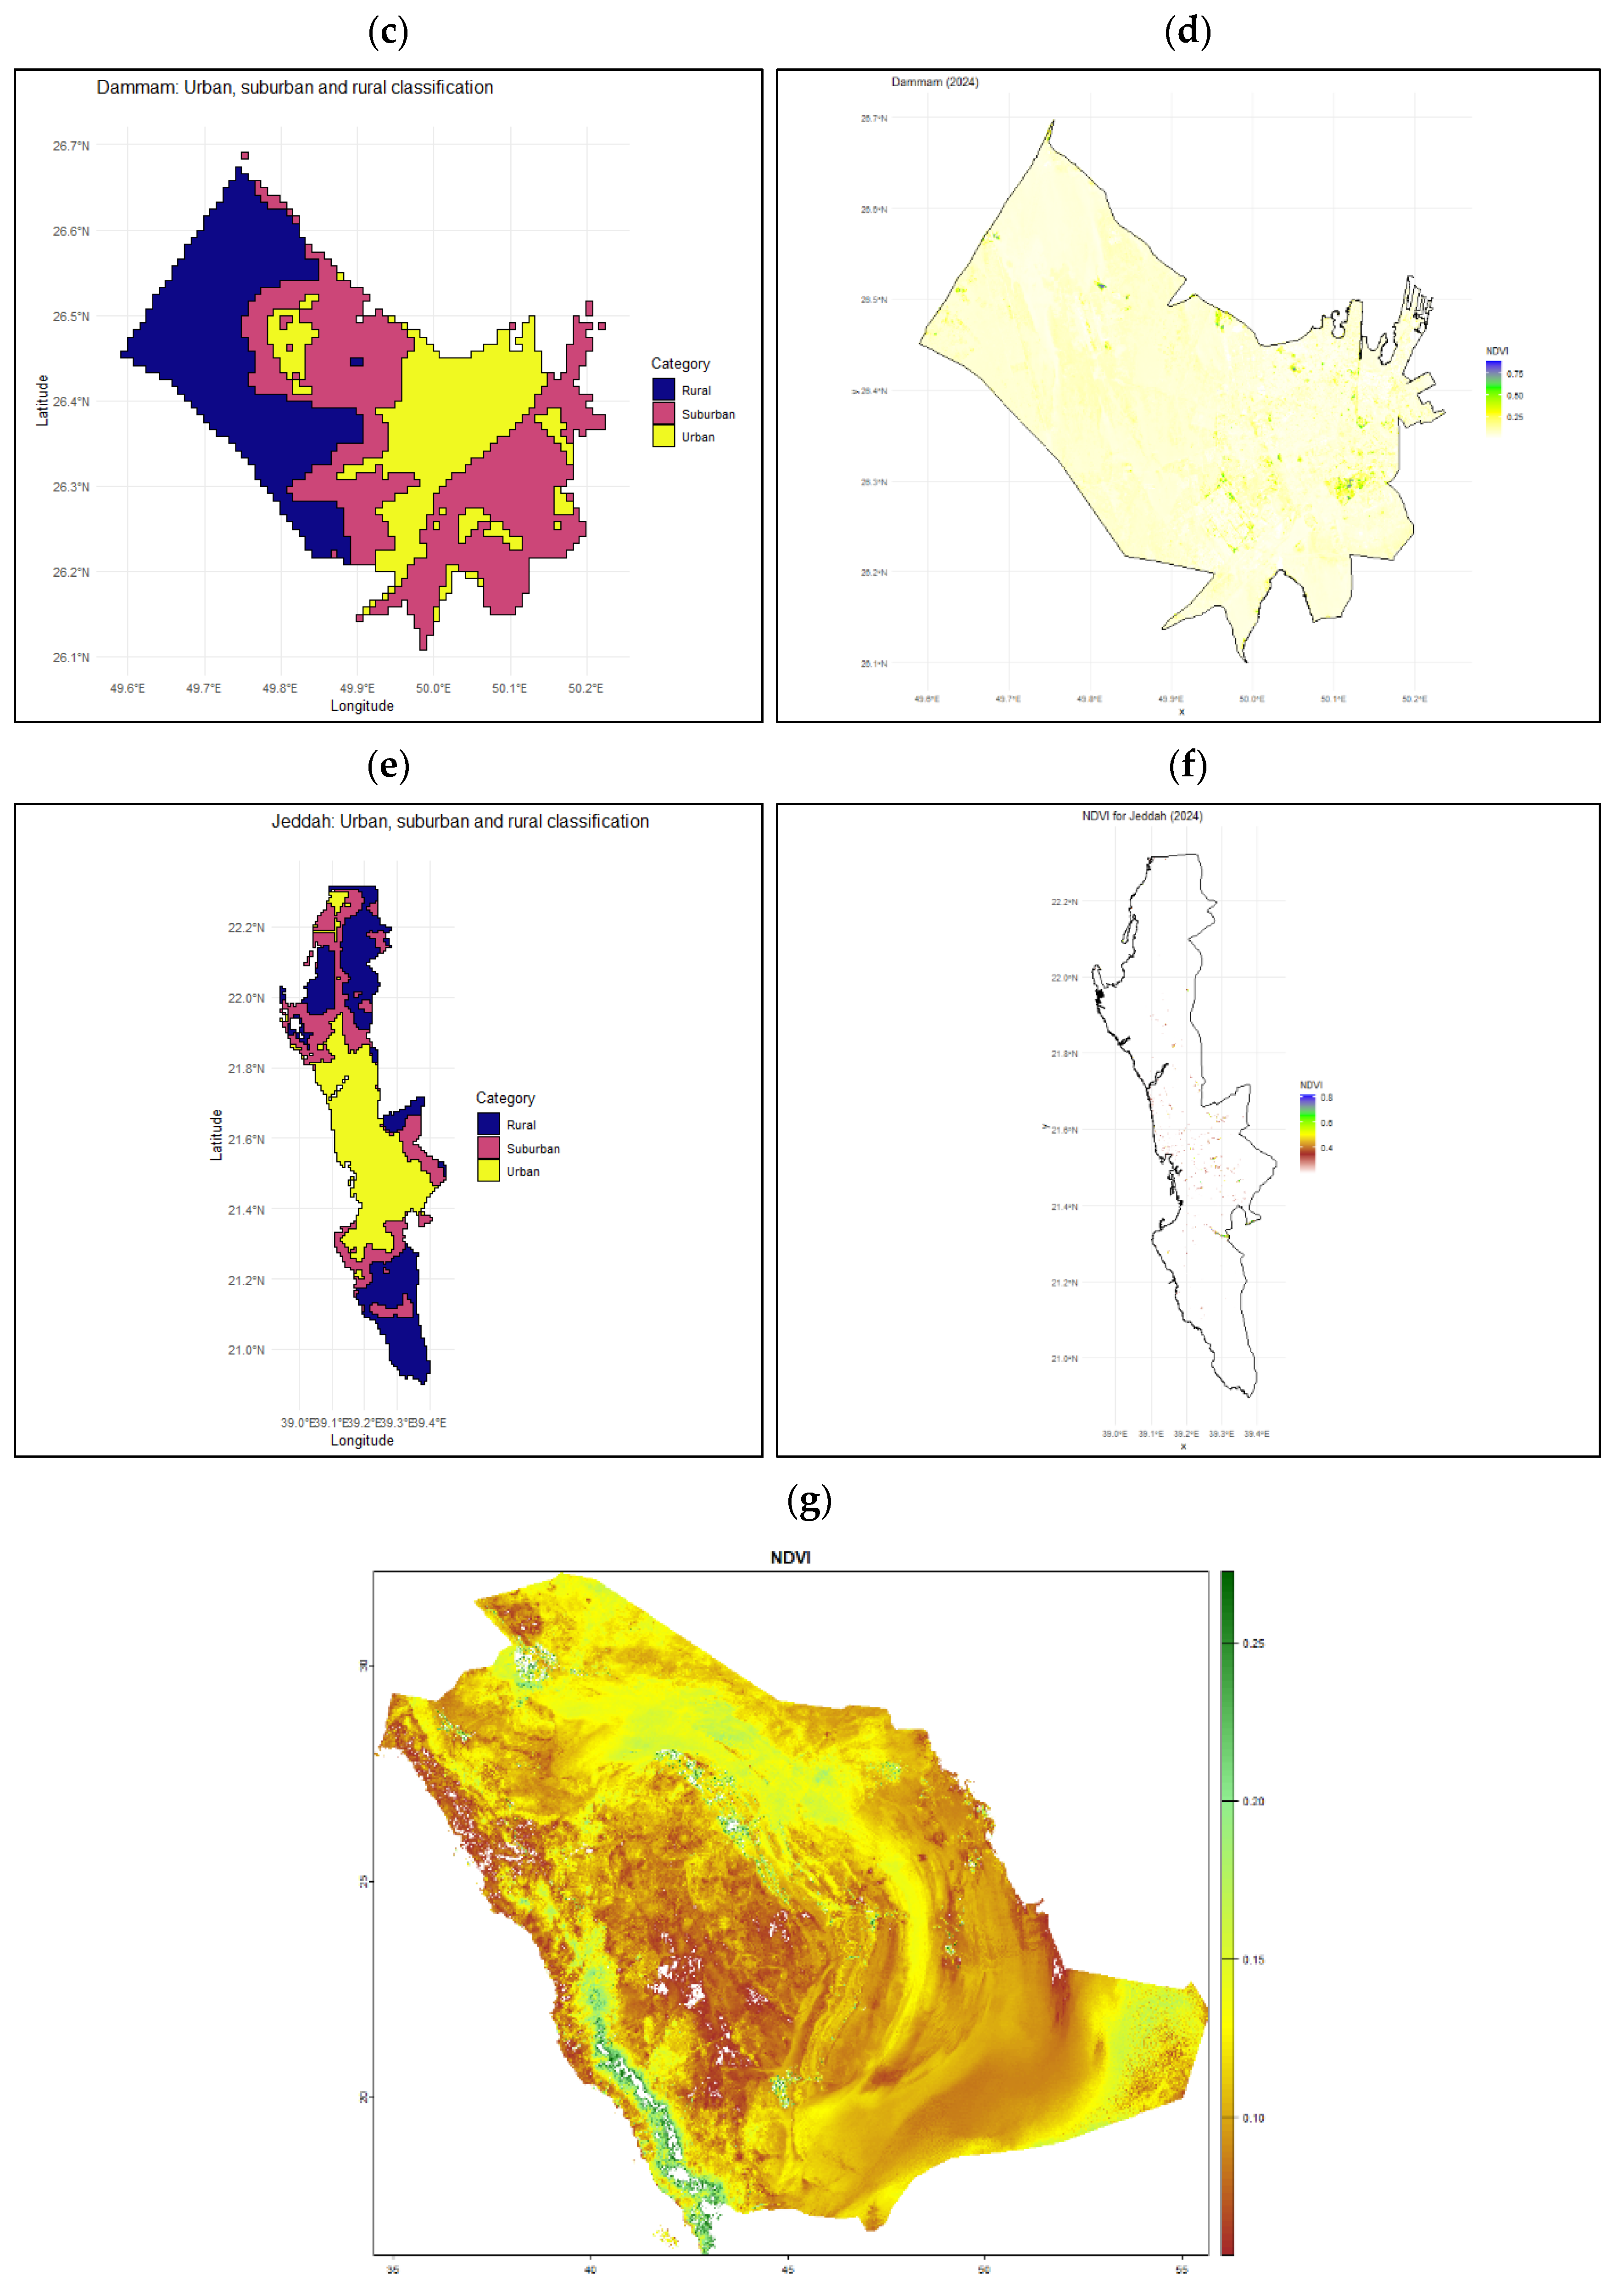
- Zonal classification: Based on established thresholds, each city was subdivided into three zones: urban (>1500 people km−2), suburban (300 – 1500 people km−2), and rural (<300 people km−2).
- ✓
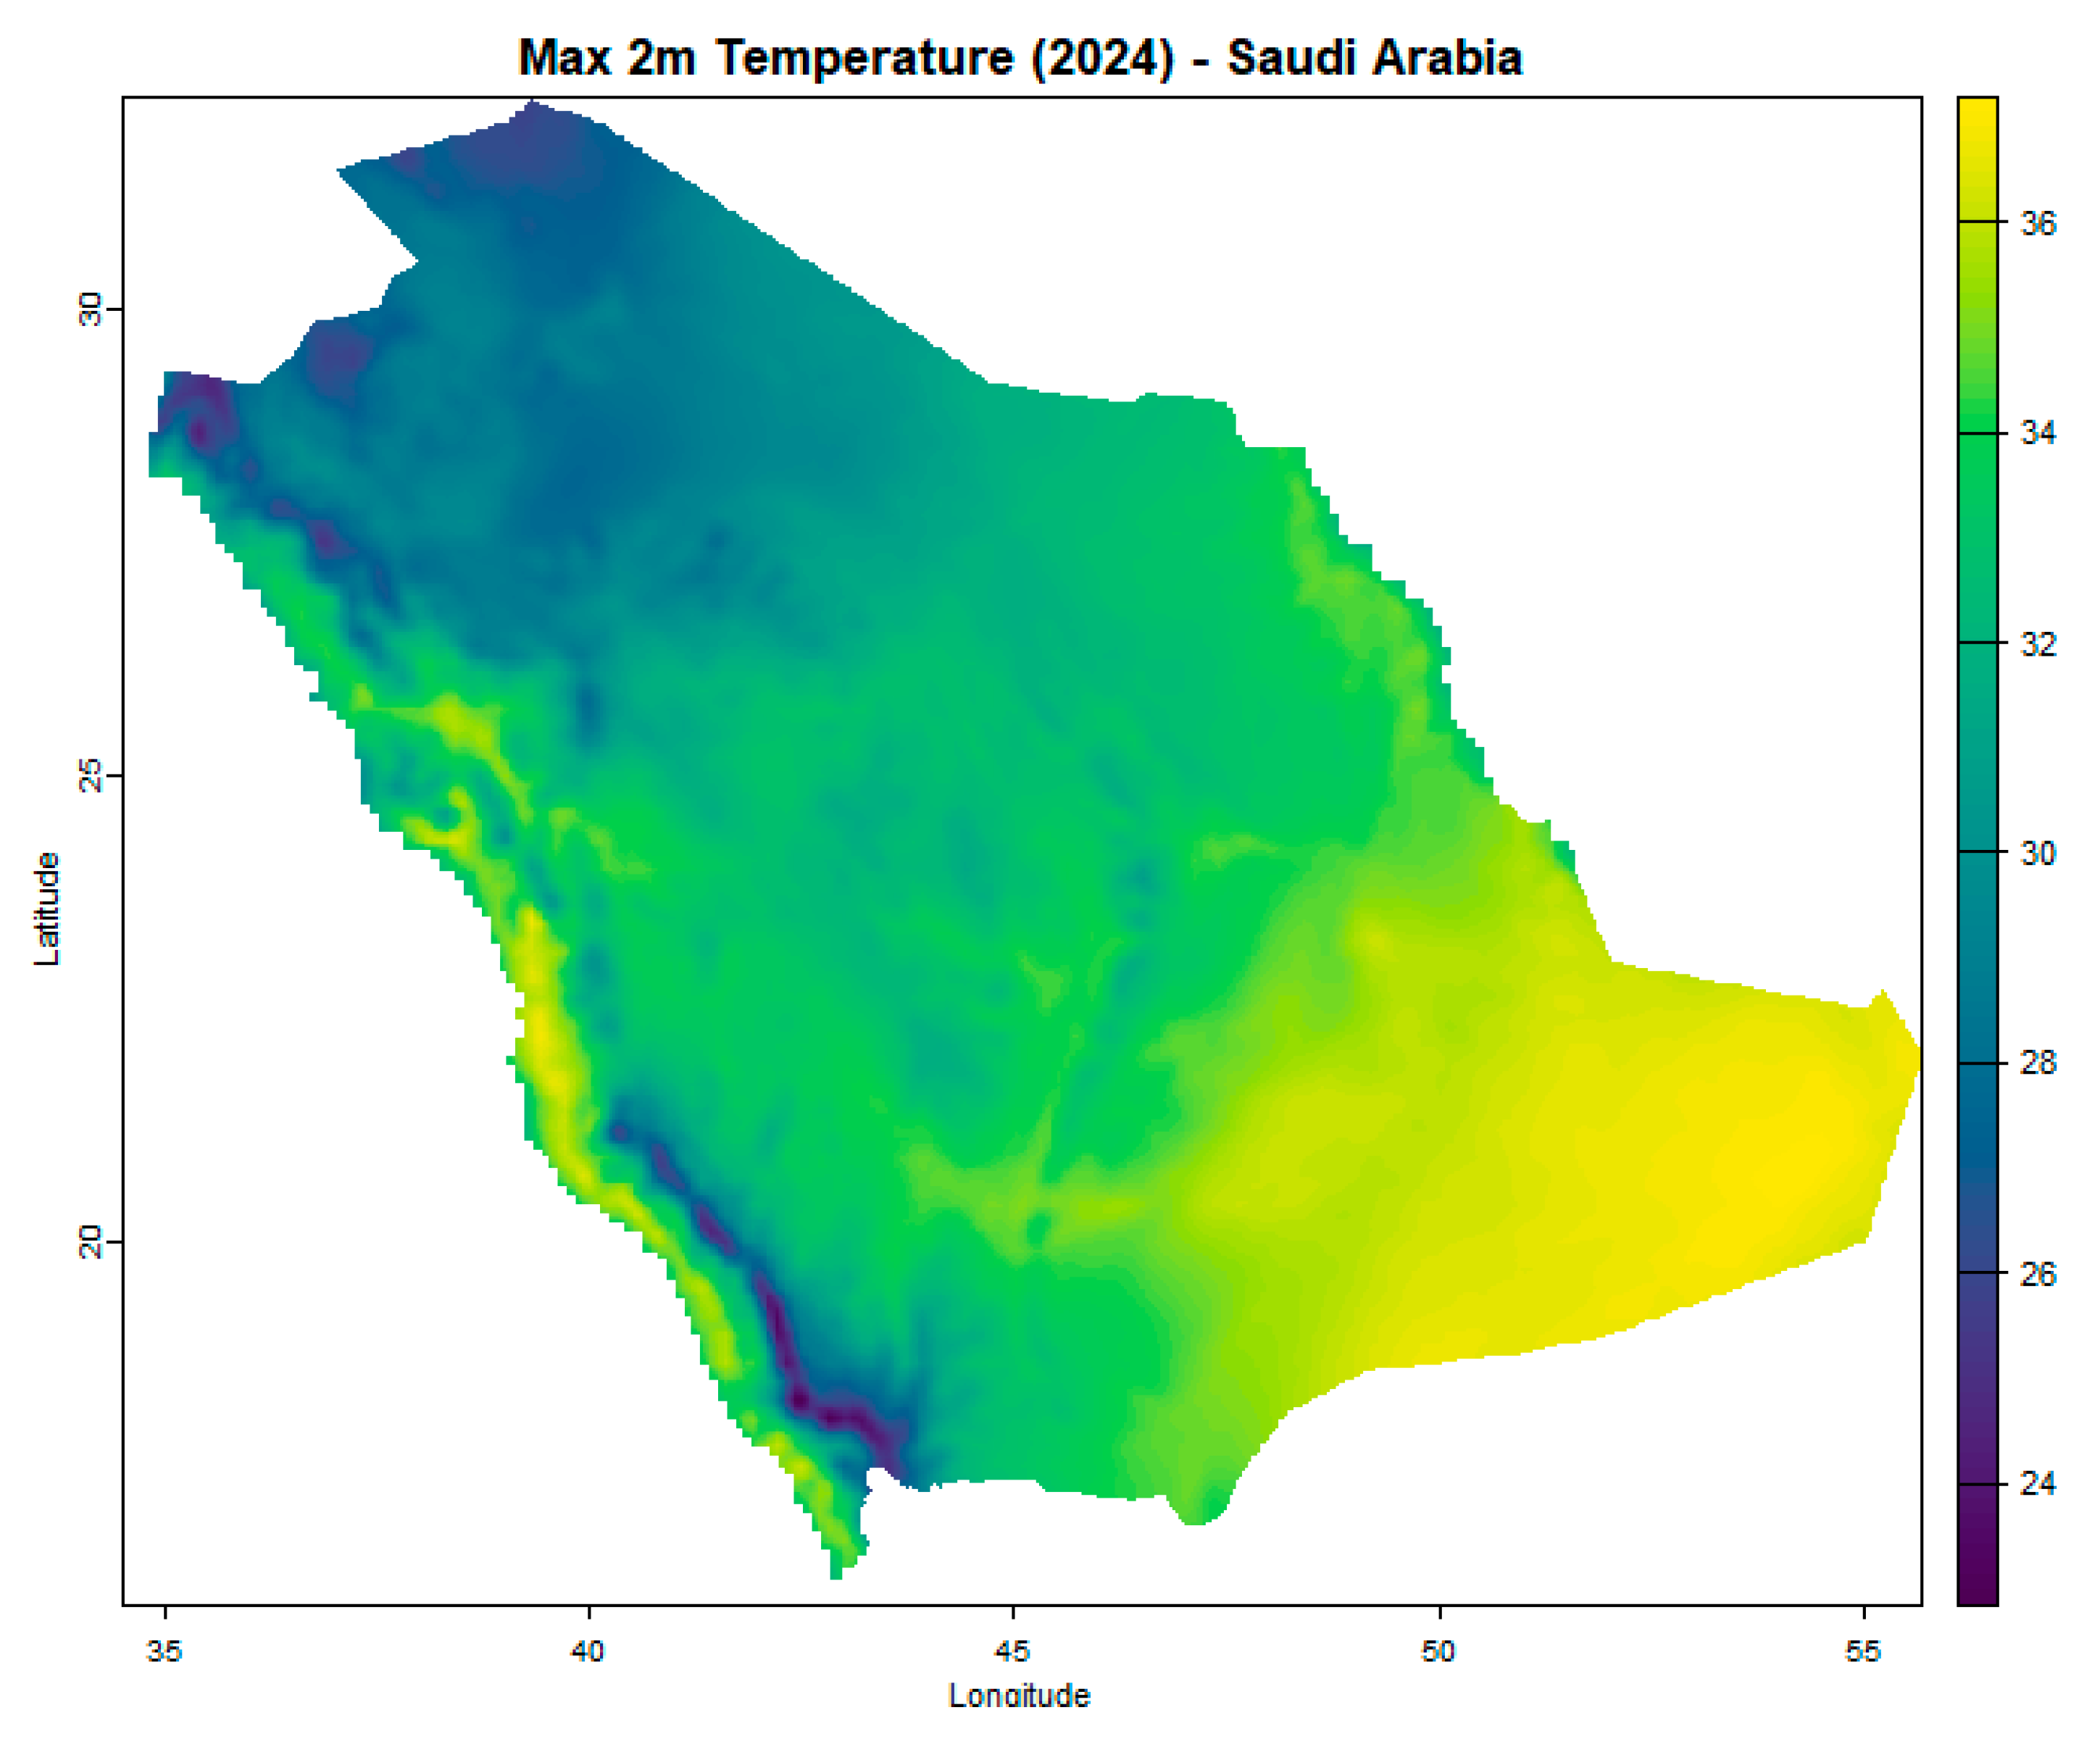
- Acquisition of temperature datasets: Two independent gridded climate datasets were downloaded for the entire Kingdom of Saudi Arabia: (i) ERA5-Land and (ii) CHIRTS-ERA5.
- ✓
- City-level temperature extraction: For each dataset, temperature values corresponding to the spatial extent of each city and its zonal subdivisions (urban, suburban, rural) were extracted for the years 1994, 2004, 2014, and 2024.
- ✓
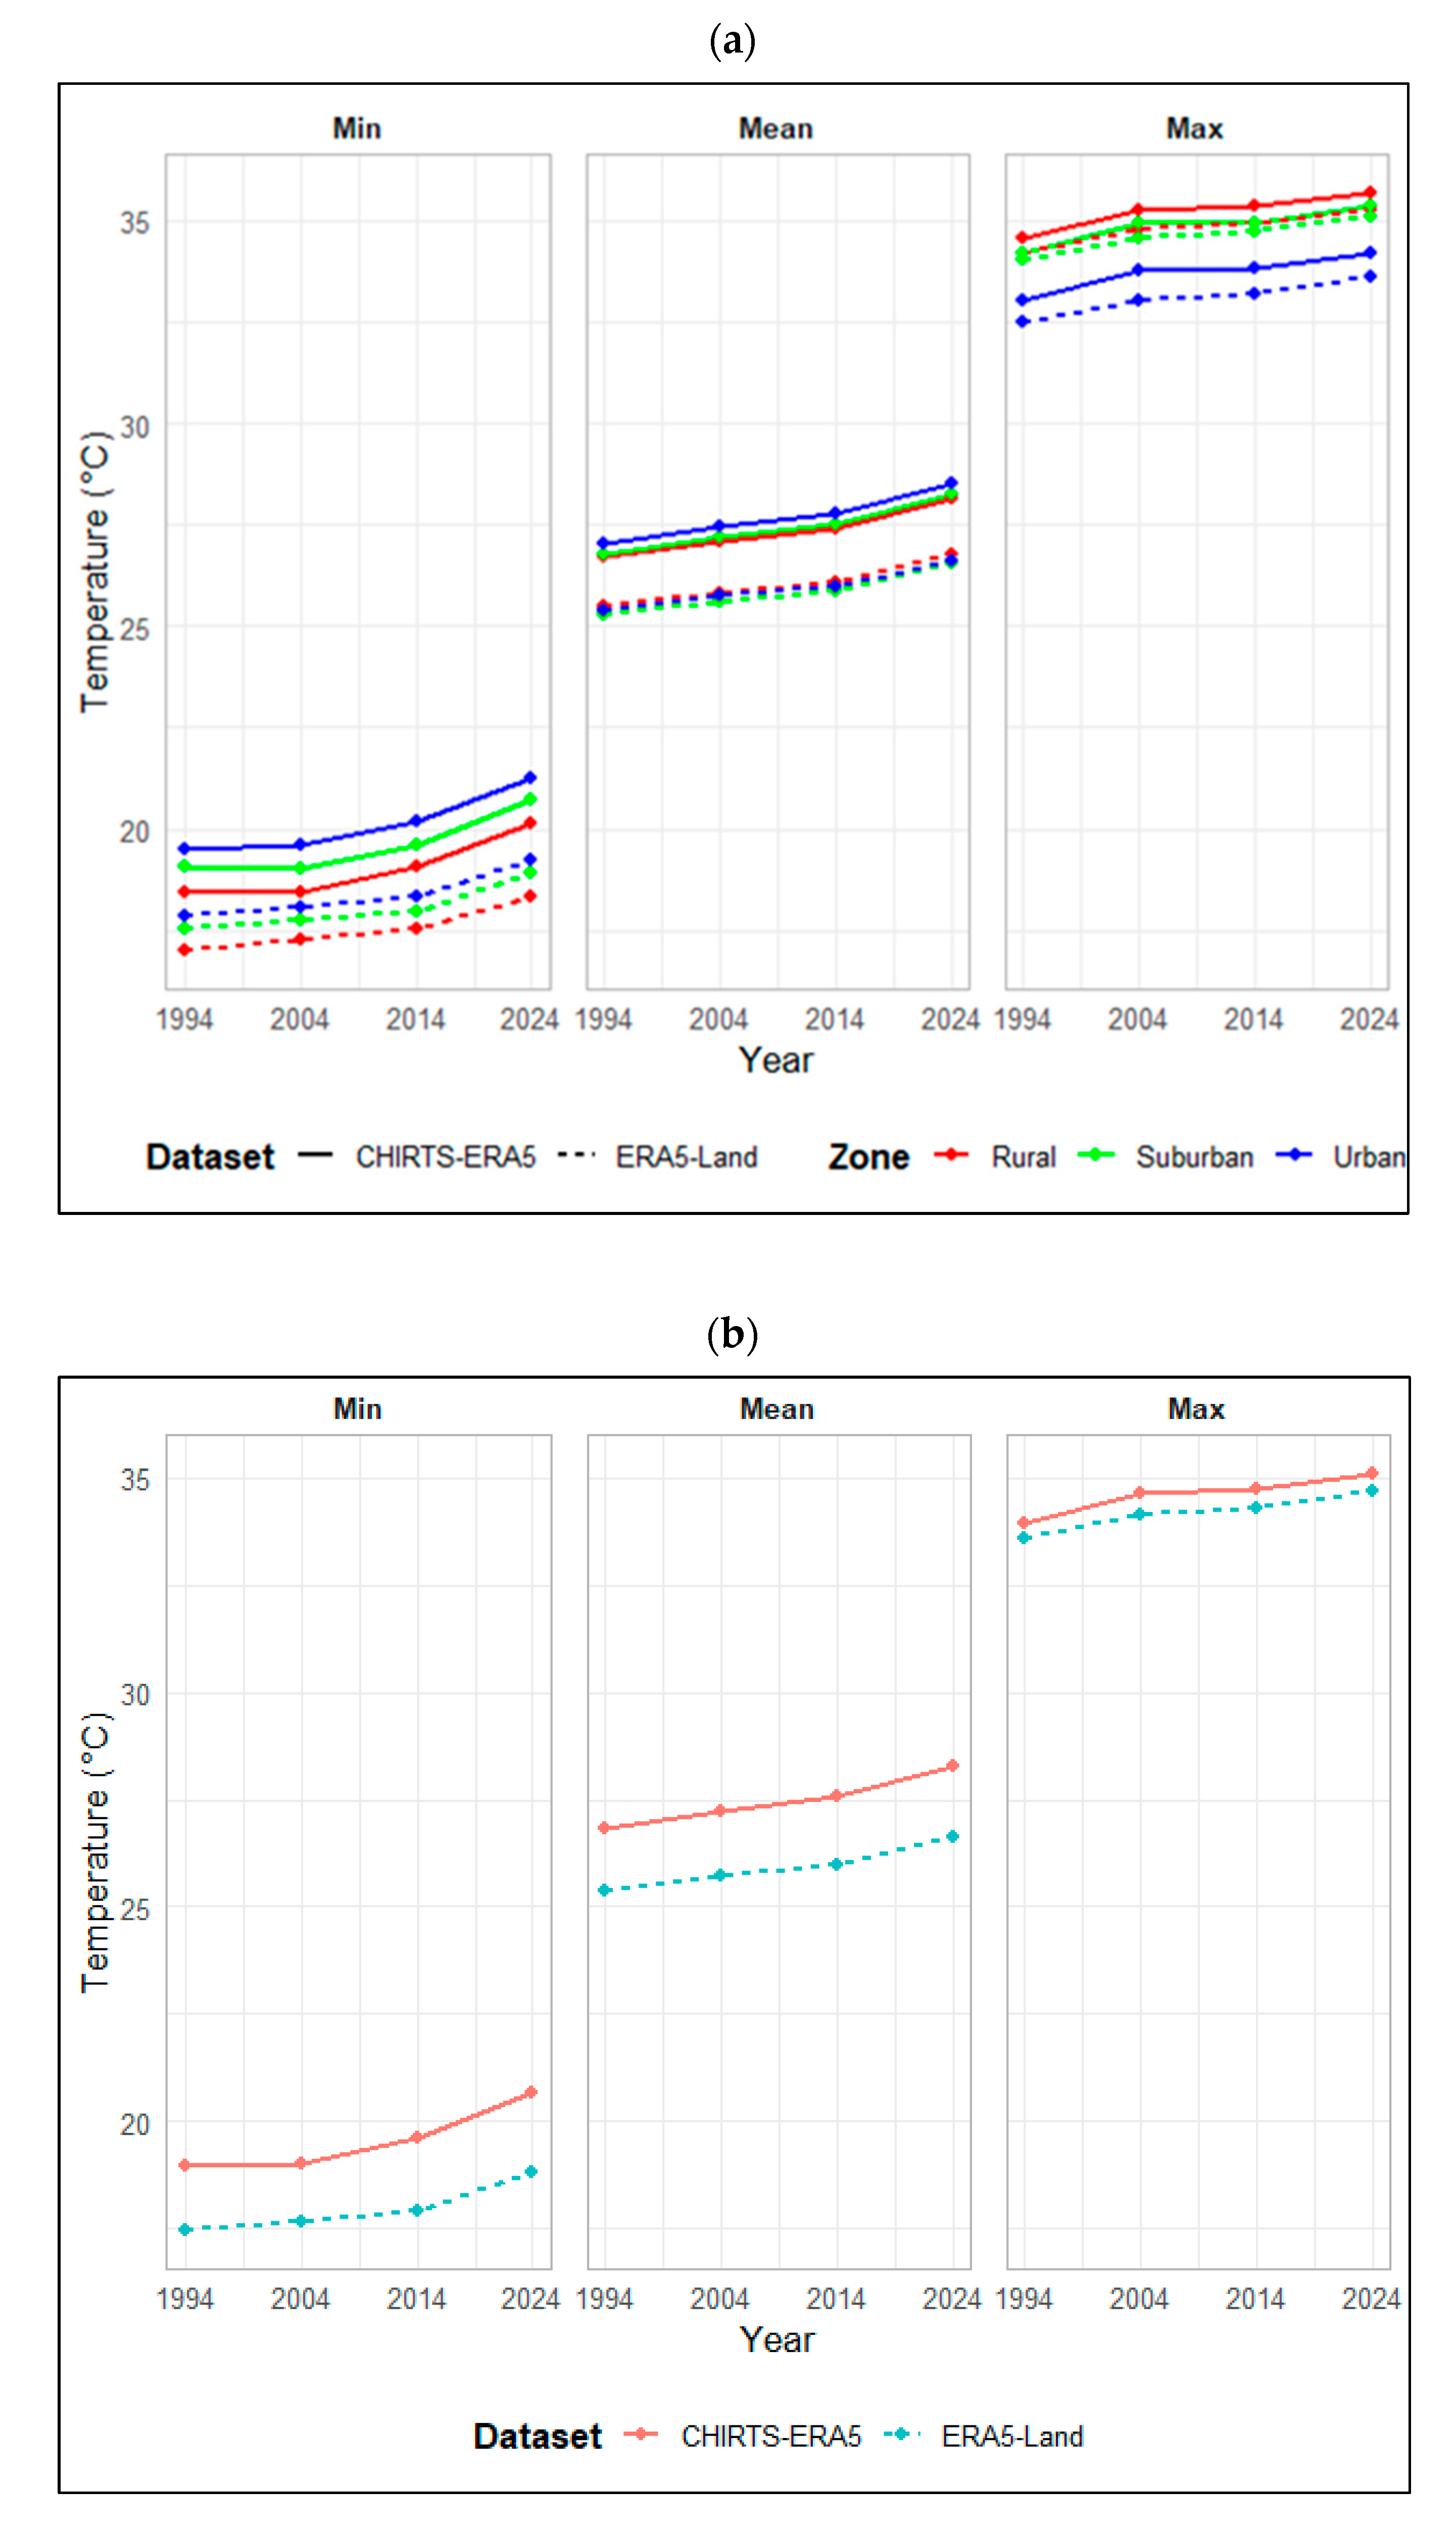
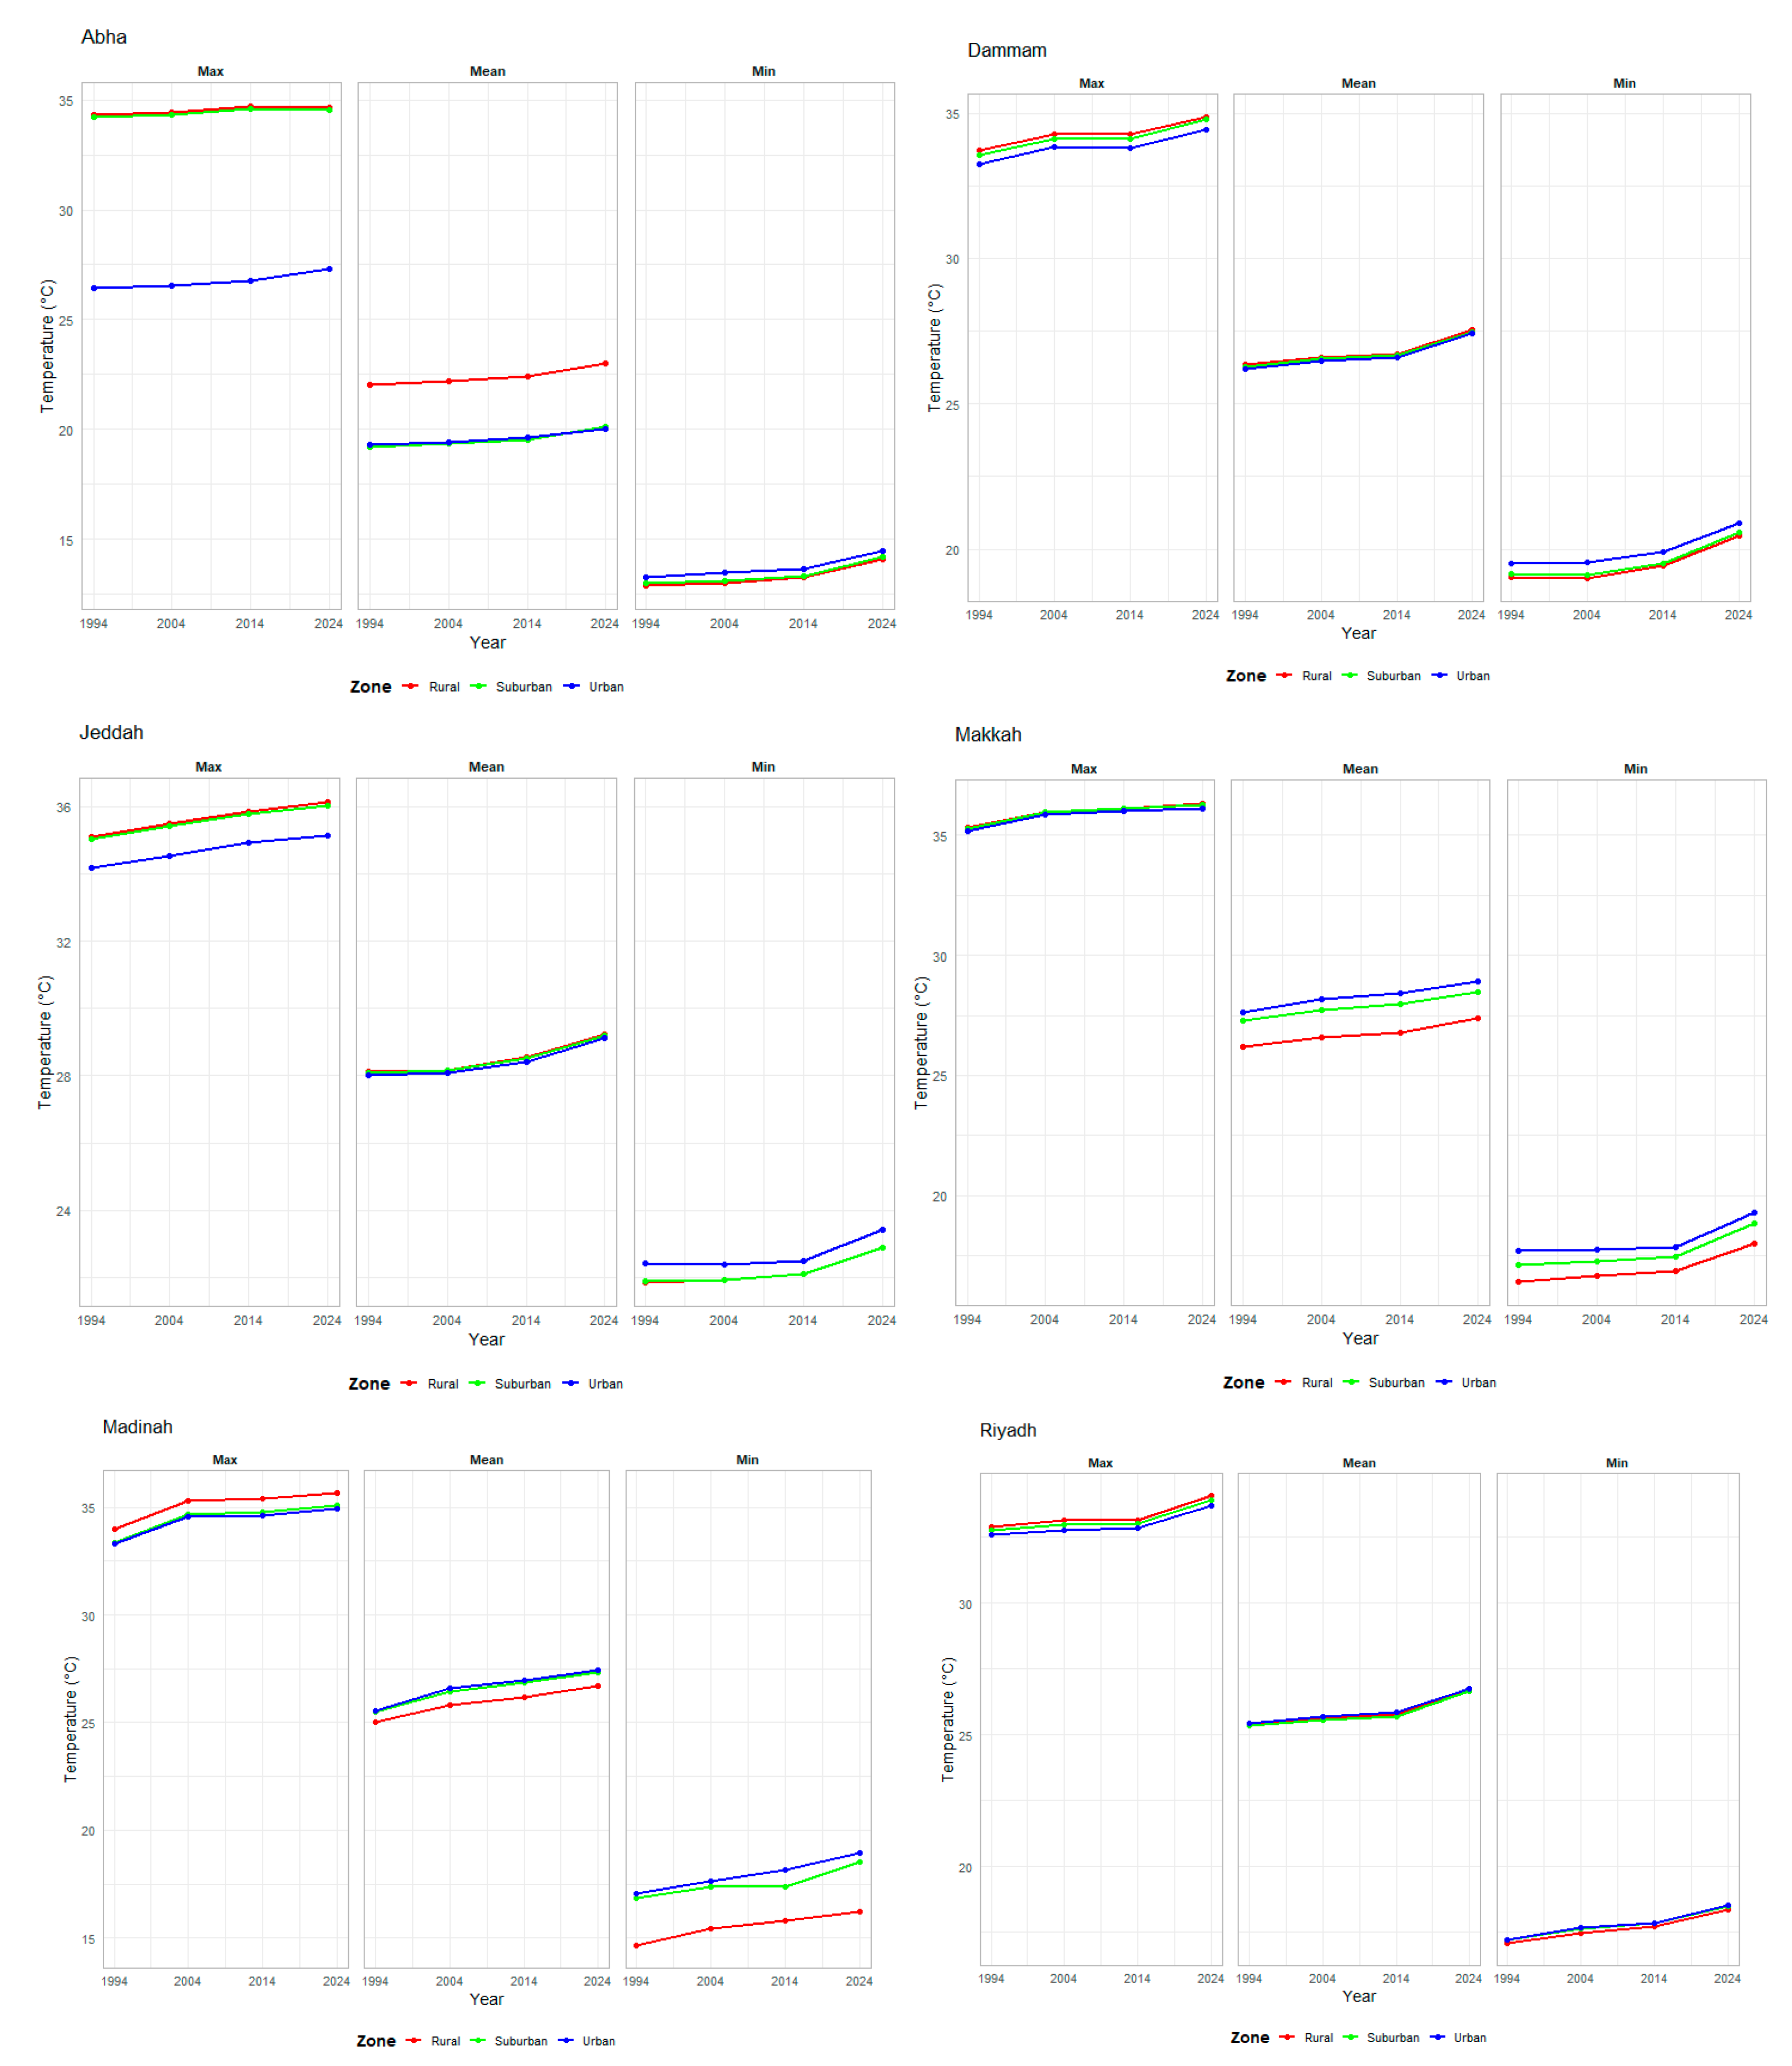
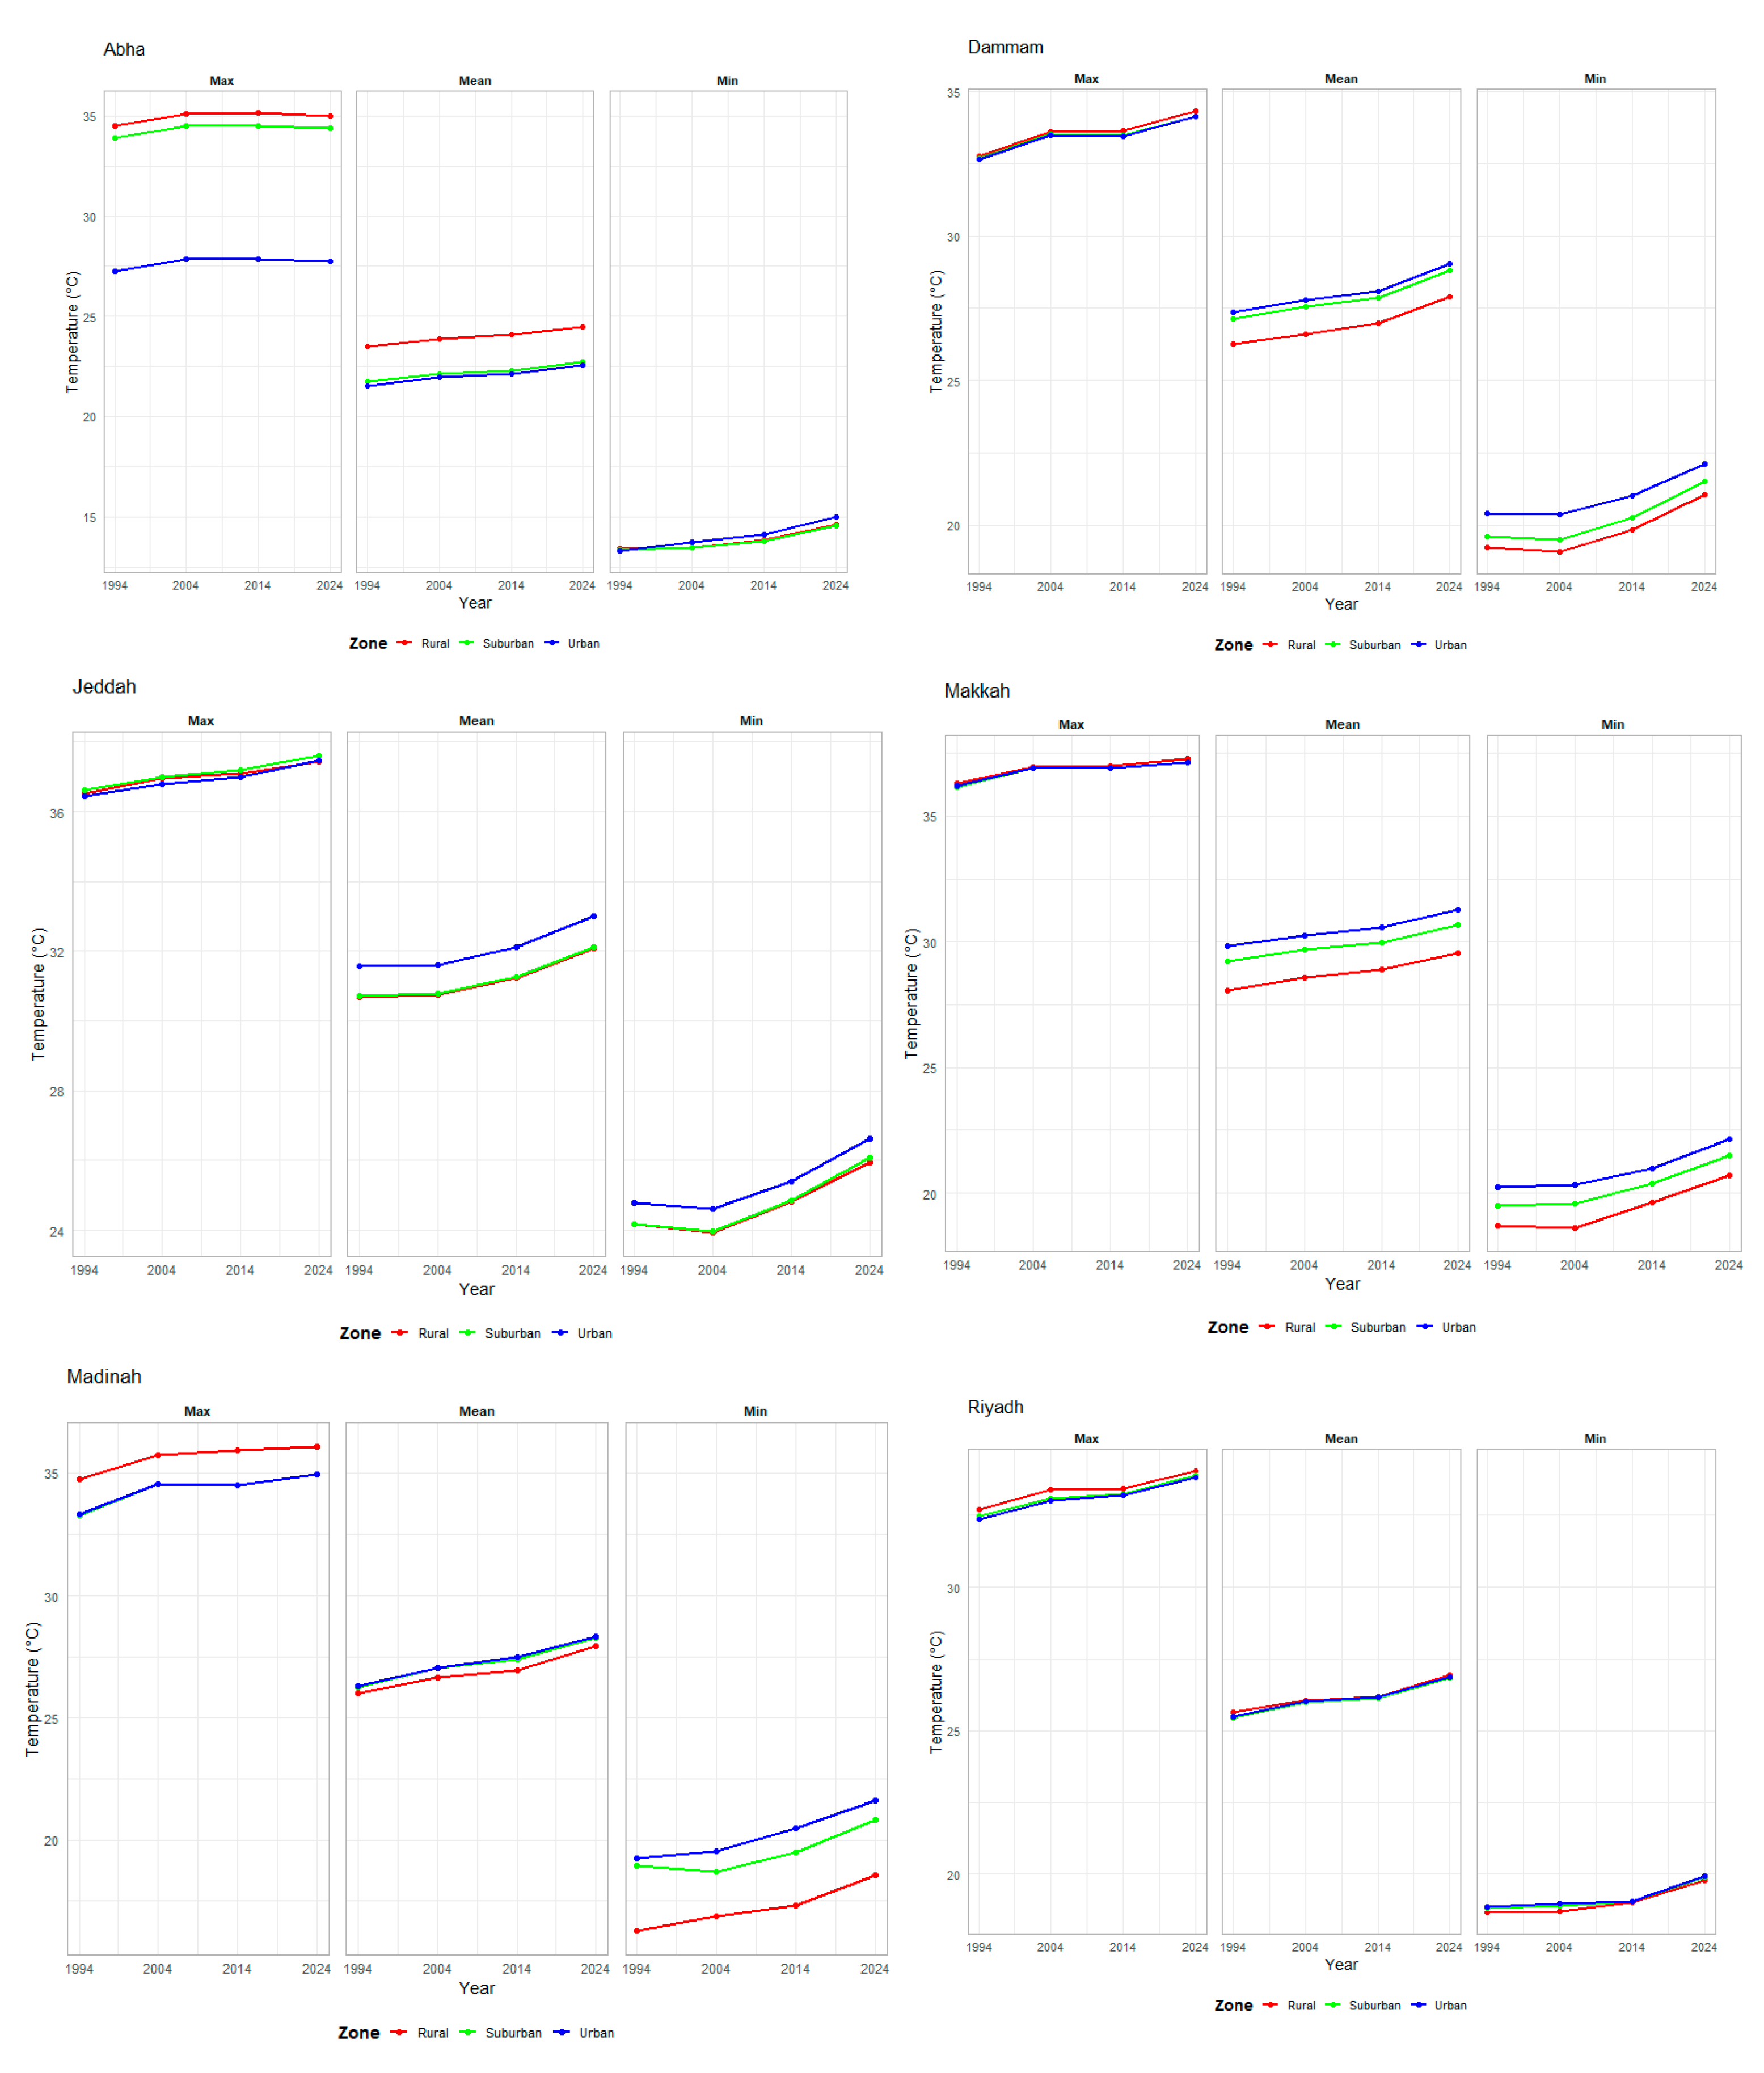
- Temperature estimation for each zone: For each study year, mean, minimum, and maximum annual air temperature values were calculated for the urban, suburban, and rural zones within each city.
- ✓
- Computation of annual temperature differences: The annual temperature differences between urban–suburban, urban–rural, and suburban–rural zones were calculated to quantify the magnitude of the UHI effect.
- ✓
- Visualization and comparative analysis: The results were visualized using graphical methods to facilitate both temporal and spatial comparison of UHI intensity across the selected cities and zones.
3. Results and Discussion
3.1. Comparing CHIRTS-ERA5 and ERA5-Land Datasets
3.2. City-Level Results: ERA5-Land Data
3.3. City-Level Results: CHIRTS-ERA5 Data
3.4. Discussion
3.5. Analysis of NDVI
4. Conclusions and Recommendations
- Integrate UHI monitoring into national climate adaptation frameworks, particularly in arid and semi-arid regions, where the effects of urbanization differ from temperate climates, especially considering minimum and maximum temperature.
- Encourage the use of high-resolution gridded datasets (e.g., ERA5-Land, CHIRTS-ERA5) for climate diagnostics and urban climate modeling in data-sparse regions.
- Foster regional collaborations among Middle Eastern countries to study UHI dynamics in similar desert environments, enabling more unified mitigation strategies.
- Promote climate-informed urban growth policies at both national and regional levels to ensure sustainable development while minimizing heat-related risks.
- Develop an integrated regional–global climate strategy to reduce greenhouse gas emissions and lower the carbon footprint, aligning with international climate commitments.
- Develop city-specific UHI mitigation strategies that prioritize increasing green cover, especially in highly built-up zones, through sustainable landscaping and urban forestry.
- Encourage urban greening programs and heat-resilient infrastructure, such as cool roofs, reflective surfaces, and water-sensitive urban design.
- Implement detailed zoning policies that consider thermal comfort and heat exposure, especially in new urban developments.
- Increase community awareness and stakeholder engagement regarding the UHI effect and its health, energy, and environmental implications.
- Expand the existing monitoring networks to include ground-based sensors that complement satellite data and enable real-time climate risk assessments.
- Employing machine learning and artificial intelligence tools, future research should aim to estimate the relative contributions of key driving factors such as land-use and land-cover changes, population density, vehicular traffic, and vegetation cover in shaping the intensity and spatial distribution of UHI effects.
Supplementary Materials
Author Contributions
Funding
Data Availability Statement
Acknowledgments
Conflicts of Interest
References
- United Nations. World Urbanization Prospects: The 2018 Revision; Department of Economic and Social Affairs, Population Division: New York, NY, USA, 2019; Available online: https://population.un.org/wup/ (accessed on 11 September 2025).
- Wilson, E.H.; Hurd, J.D.; Civco, D.L.; Prisloe, M.P.; Arnold, C. Development of a geospatial model to quantify, describe and map urban growth. Remote Sens. Environ. 2003, 86, 275–285. [Google Scholar] [CrossRef]
- Oke, T.R. The energetic basis of the urban heat island. Q. J. R. Meteorol. Soc. 1982, 108, 1–24. [Google Scholar] [CrossRef]
- Voogt, J.A.; Oke, T.R. Thermal remote sensing of urban climates. Remote Sens. Environ. 2003, 86, 370–384. [Google Scholar] [CrossRef]
- Stone, B.; Vargo, J.; Habeeb, D. Managing climate change in cities: Will climate action plans work? Landsc. Urban Plan. 2010, 97, 263–271. [Google Scholar] [CrossRef]
- Aina, Y.A.; Adam, M.N.; Hameed, R. Spatiotemporal variations in the impacts of urban land use types on urban heat island effects: The case of Riyadh, Saudi Arabia. ISPRS Arch. Photogramm. Remote Sens. Spat. Inf. Sci. 2017, XLII-3/W2, 9–14. [Google Scholar] [CrossRef][Green Version]
- Zhao, L.; Lee, X.; Smith, R.B.; Oleson, K. Strong contributions of local background climate to urban heat islands. Nature 2014, 511, 216–219. [Google Scholar] [CrossRef] [PubMed]
- Li, X.; Zhou, Y.; Asrar, G.R.; Imhoff, M.; Li, X. The surface urban heat island response to urban expansion: A panel analysis for the conterminous United States. Sci. Total Environ. 2017, 605, 426–435. [Google Scholar] [CrossRef]
- Deng, H.; Zhang, S.; Chen, M.; Feng, J.; Liu, K. Characteristics of surface urban heat islands in global cities of different scales: Trends and drivers. Sustain. Cities Soc. 2024, 107, 105483. [Google Scholar] [CrossRef]
- Abulibdeh, A. Analysis of urban heat island characteristics and mitigation strategies for eight arid and semi-arid gulf region cities. Environ. Earth Sci. 2021, 80, 259. [Google Scholar] [CrossRef] [PubMed]
- Georgescu, M.; Moustaoui, M.; Mahalov, A.; Dudhia, J. Summer-time climate impacts of projected megapolitan expansion in Arizona. Nat. Clim. Change 2013, 3, 37–41. [Google Scholar] [CrossRef]
- Alghamdi, A.S.; Moore, T.W. Detecting temporal changes in Riyadh’s urban heat island. Pap. Appl. Geogr. 2015, 1, 312–325. [Google Scholar] [CrossRef]
- Miky, Y.; Al Shouny, A.; Abdallah, A. Studying the impact of urban management strategies and spatiotemporal dynamics of LULC on land surface temperature and SUHI formation in Jeddah, Saudi Arabia. Sustainability 2023, 15, 15316. [Google Scholar] [CrossRef]
- Abdelatti, H.; Elagib, N.A.; Musa, A.A. Urban heat island effect in arid climates: The case of Al-Ahsa Oasis, Saudi Arabia. Urban Clim. 2020, 34, 100693. [Google Scholar] [CrossRef]
- AlSarmi, S.; Washington, R. Changes in climate extremes in the Arabian Peninsula: Analysis of daily data. Int. J. Climatol. 2014, 34, 1329–1345. [Google Scholar] [CrossRef]
- WorldPop. Population Density: University of Southampton, University of Louisville, Université de Namur, and CIESIN, Columbia University. Population Density (1km): Saudi Arabia 2020. 2018. Available online: https://hub.worldpop.org/doi/10.5258/SOTON/WP00674 (accessed on 3 July 2025).
- Eurostat. Territorial Typologies Manual—Degree of Urbanisation: Classes for the Typology and Their Conditions. 2021. Available online: https://ec.europa.eu/eurostat/statistics-explained/index.php?title=Territorial_typologies_manual_-_degree_of_urbanisation (accessed on 11 September 2025).
- Hersbach, H.; Bell, B.; Berrisford, P.; Hirahara, S.; Horányi, A.; Muñoz-Sabater, J.; Nicolas, J.; Peubey, C.; Radu, R.; Schepers, D.; et al. The ERA5 global reanalysis. Q. J. R. Meteorol. Soc. 2020, 146, 1999–2049. [Google Scholar] [CrossRef]
- Muñoz-Sabater, J.; Dutra, E.; Agustí-Panareda, A.; Albergel, C.; Arduini, G.; Balsamo, G.; Boussetta, S.; Choulga, M.; Harrigan, S.; Hersbach, H.; et al. ERA5-Land: A state-of-the-art global reanalysis dataset for land applications. Earth Syst. Sci. Data 2021, 13, 4349–4383. [Google Scholar] [CrossRef]
- Verdin, A.; Funk, C.; Peterson, P.; Landsfeld, M.; Tuholske, C.; Grace, K.; Husak, G.; Pedreros, D.; Shukla, S.; Michaelsen, J.; et al. Development and validation of the CHIRTS-daily high-resolution daily temperature data set for Africa. J. Clim. 2020, 33, 10161–10190. [Google Scholar] [CrossRef]
- Funk, C.; Peterson, P.; Landsfeld, M.; Pedreros, D.; Verdin, J.; Shukla, S.; Husak, G.; Rowland, J.; Harrison, L.; Hoell, A.; et al. A high-resolution 1983–2016 Tmax climate data record based on infrared temperatures and stations by the Climate Hazard Center. J. Clim. 2019, 32, 5639–5658. [Google Scholar] [CrossRef]
- R Core Team. R: A Language and Environment for Statistical Computing; R Foundation for Statistical Computing: Vienna, Austria, 2024; Available online: https://www.R-project.org/ (accessed on 11 September 2025).
- Wickham, H.; François, R.; Henry, L.; Müller, K.; Vaughan, D. dplyr: A Grammar of Data Manipulation (R Package Version 1.1.4). 2023. Available online: https://CRAN.R-project.org/package=dplyr (accessed on 11 September 2025).
- Wickham, H.; Girlich, M. tidyr: Tidy Messy Data (R Package Version 1.3.0). 2023. Available online: https://CRAN.R-project.org/package=tidyr (accessed on 11 September 2025).
- Wickham, H.; Averick, M.; Bryan, J.; Chang, W.; McGowan, L.; François, R.; Grolemund, G.; Hayes, A.; Henry, L.; Hester, J.; et al. Welcome to the tidyverse. J. Open Source Softw. 2019, 4, 1686. [Google Scholar] [CrossRef]
- Wickham, H. stringr: Simple, Consistent Wrappers for Common String Operations (R Package Version 1.5.1). 2023. Available online: https://CRAN.R-project.org/package=stringr (accessed on 11 September 2025).
- Wickham, H.; Hester, J.; Bryan, J. readr: Read Rectangular Text Data (R Package Version 2.1.4). 2023. Available online: https://CRAN.R-project.org/package=readr (accessed on 11 September 2025).
- Wickham, H. ggplot2: Elegant Graphics for Data Analysis; Springer: New York, NY, USA, 2016; Available online: https://ggplot2.tidyverse.org (accessed on 11 September 2025).
- Pebesma, E. Simple features for R: Standardized support for spatial vector data. R Journal 2018, 10, 439–446. [Google Scholar] [CrossRef]
- Pebesma, E. Stars: Spatiotemporal Arrays, Raster and Vector Data Cubes (R Package Version 0.6-2). 2023. Available online: https://CRAN.R-project.org/package=stars (accessed on 11 September 2025).
- Hijmans, R.J. terra: Spatial Data Analysis. R Package Version 1.7-29. 2023. Available online: https://CRAN.R-project.org/package=terra (accessed on 11 September 2025).
- Pierce, D. ncdf4: Interface to Unidata netCDF (Version 4 or Earlier) Format Data Files (R Package Version 1.17). 2019. Available online: https://CRAN.R-project.org/package=ncdf4 (accessed on 11 September 2025).
- Almazroui, M.; Islam, M.N.; Jones, P.D. Urbanization effects on the air temperature rise in Saudi Arabia. Clim. Change 2013, 120, 109–122. [Google Scholar] [CrossRef]
- Hassaballa, A.; Salih, A. A spatio-temporal analysis of heat island intensity influenced by the substantial urban growth between 1990 and 2020: A case study of Al-Ahsa Oasis, Eastern Saudi Arabia. Appl. Sci. 2023, 13, 2755. [Google Scholar] [CrossRef]
- Halder, B.; Bandyopadhyay, J.; Khedher, K.M.; Fai, C.M.; Tangang, F.; Yaseen, Z.M. Delineation of urban expansion influences urban heat islands and natural environment using remote sensing and GIS-based in industrial area. Environ. Sci. Pollut. Res. 2022, 29, 73147–73170. [Google Scholar] [CrossRef]
- Munir, S.; Muhammad, A.F.; Habib Allah, T.M.; Mursi, I.A. The effect of tree plantations on moderating air temperature in Arafat, Makkah for the period 2002–2016. J. King Abdul Aziz Univ. Meteorol. Environ. Arid Land Agric. Sci. 2018, 27, 63–72. [Google Scholar] [CrossRef]
- De Razza, S.; Zanetti, C.; De Marchi, M.; Pappalardo, S.E. Mapping Urban Heatwaves and Islands: The Reverse Effect of Salento’s “White Cities”. Front. Earth Sci. 2024, 12, 1375827. [Google Scholar] [CrossRef]
- Marando, F.; Heris, M.P.; Zulian, G.; Udías, A.; Mentaschi, L.; Chrysoulakis, N.; Parastatidis, D.; Maes, J. Urban Heat Island Mitigation by Green Infrastructure in European Functional Urban Areas. Sustain. Cities Soc. 2022, 77, 103564. [Google Scholar] [CrossRef]
- Ghedira, H. Lessons from Abu Dhabi’s Urban Heat Island Effect. Khalifa University. 2018. Available online: https://www.ku.ac.ae/lessons-from-abu-dhabi-s-urban-heat-island-effect (accessed on 14 October 2025).
- MeteoSwiss. Decrease in Temperature with Altitude. Federal Office of Meteorology and Climatology MeteoSwiss. 2024. Available online: https://www.meteoswiss.admin.ch/weather/weather-and-climate-from-a-to-z/temperature/decreases-in-temperature-with-altitude.html (accessed on 14 October 2025).
- Navarro-Serrano, F.; López-Moreno, J.I.; Azorin-Molina, C.; Alonso-González, E.; Aznarez-Balta, M.; Buisán, S.T.; Revuelto, J. Elevation Effects on Air Temperature in a Topographically Complex Mountain Valley in the Spanish Pyrenees. Atmosphere 2020, 11, 656. [Google Scholar] [CrossRef]
- Jandaghian, Z.; Colombo, A. The Role of Water Bodies in Climate Regulation: Insights from Recent Studies on Urban Heat Island Mitigation. Buildings 2024, 14, 2945. [Google Scholar] [CrossRef]


| City Name | Latitude (°N) | Longitude (°E) | Elevation (m) | Population (Residents) | Mean Temperature (2024) (°C) |
|---|---|---|---|---|---|
| Abha | 18.2465 | 42.5117 | 1700 | 334,290 | 23.23 |
| Dammam | 26.4257 | 50.05516 | 13 | 1,386,166 | 28.59 |
| Jeddah | 21.4925 | 39.17757 | 35 | 3,712,917 | 32.40 |
| Madinah | 24.4709 | 39.61224 | 852 | 1,411,599 | 28.17 |
| Makkah | 21.42251 | 39.82617 | 577 | 2,385,509 | 30.50 |
| Riyadh | 24.77427 | 46.73859 | 606 | 6,924,566 | 26.90 |
| Year | AbsDiff_Min | AbsDiff_Mean | AbsDiff_Max | %Diff_Min | %Diff_Mean | %Diff_Max |
|---|---|---|---|---|---|---|
| 1994 | 1.52 | 1.44 | 0.36 | 8.72 | 5.67 | 1.06 |
| 2004 | 1.34 | 1.51 | 0.53 | 7.57 | 5.87 | 1.55 |
| 2014 | 1.70 | 1.58 | 0.45 | 9.50 | 6.07 | 1.30 |
| 2024 | 1.86 | 1.66 | 0.42 | 9.85 | 6.23 | 1.21 |
| Average | 1.60 | 1.55 | 0.44 | 8.91 | 5.96 | 1.28 |
Disclaimer/Publisher’s Note: The statements, opinions and data contained in all publications are solely those of the individual author(s) and contributor(s) and not of MDPI and/or the editor(s). MDPI and/or the editor(s) disclaim responsibility for any injury to people or property resulting from any ideas, methods, instructions or products referred to in the content. |
© 2025 by the authors. Licensee MDPI, Basel, Switzerland. This article is an open access article distributed under the terms and conditions of the Creative Commons Attribution (CC BY) license (https://creativecommons.org/licenses/by/4.0/).
Share and Cite
Munir, S.; Habeebullah, T.M.A.; Zamreeq, A.O.; Alfehaid, M.M.A.; Ismail, M.; Khalil, A.A.; Baligh, A.A.; Islam, M.N.; Jamaladdin, S.; Ghulam, A.S. Cooling of Maximum Temperatures in Six Saudi Arabian Cities (1994–2024)—Reversal of Urban Heat Islands. Urban Sci. 2025, 9, 445. https://doi.org/10.3390/urbansci9110445
Munir S, Habeebullah TMA, Zamreeq AO, Alfehaid MMA, Ismail M, Khalil AA, Baligh AA, Islam MN, Jamaladdin S, Ghulam AS. Cooling of Maximum Temperatures in Six Saudi Arabian Cities (1994–2024)—Reversal of Urban Heat Islands. Urban Science. 2025; 9(11):445. https://doi.org/10.3390/urbansci9110445
Chicago/Turabian StyleMunir, Said, Turki M. A. Habeebullah, Arjan O. Zamreeq, Muhannad M. A. Alfehaid, Muhammad Ismail, Alaa A. Khalil, Abdalla A. Baligh, M. Nazrul Islam, Samirah Jamaladdin, and Ayman S. Ghulam. 2025. "Cooling of Maximum Temperatures in Six Saudi Arabian Cities (1994–2024)—Reversal of Urban Heat Islands" Urban Science 9, no. 11: 445. https://doi.org/10.3390/urbansci9110445
APA StyleMunir, S., Habeebullah, T. M. A., Zamreeq, A. O., Alfehaid, M. M. A., Ismail, M., Khalil, A. A., Baligh, A. A., Islam, M. N., Jamaladdin, S., & Ghulam, A. S. (2025). Cooling of Maximum Temperatures in Six Saudi Arabian Cities (1994–2024)—Reversal of Urban Heat Islands. Urban Science, 9(11), 445. https://doi.org/10.3390/urbansci9110445


