Article

Evaluation of Ecological Sustainability Criteria of Urban Green Spaces in Adelaide Metropolitan Area

UniSA Creative, City West Campus, University of South Australia, Adelaide, SA 5000, Australia
*
Author to whom correspondence should be addressed.
Urban Sci. 2025, 9(10), 434; https://doi.org/10.3390/urbansci9100434
Submission received: 26 August 2025 / Revised: 30 September 2025 / Accepted: 14 October 2025 / Published: 21 October 2025

Abstract

Urban green space (UGS) is a fundamental element of urban systems for enhancing the quality of urban life. UGS plays a pivotal role in promoting urban ecological sustainability if important criteria are integrated into urban planning programs. This paper explores the impacts of the ecological criteria on urban sustainability through UGS planning and examines these criteria within the context of the Adelaide Metropolitan Area as a case study. To address the study’s goals, a content analysis was conducted to identify the most critical criteria affecting urban ecological sustainability through UGS planning. Subsequently, based on the identified criteria, a household survey was conducted to evaluate the status of the case study concerning the ecological sustainability factors. In this stage, 100 responses were collected through a questionnaire survey. Then, based on the household survey results, a solution was provided to the challenging criteria by a local experts’ interview. For promoting urban ecological sustainability, ten criteria were identified as the most important and effective criteria based on the previous studies. Household survey data was analysed using one-sample T-test, multiple linear regression, and geographically weighted regression (GWR) model. The results indicated that the criteria of reviving ecological networks, water resources, and the protection of UGS with the score below standard average (which is 3), require practical guidelines and policies to enhance the sustainability of Adelaide Metropolitan Area. The regression analysis demonstrated that ecological landscape and design had the strongest positive effect on sustainability (adjusted R2 = 0.685), while the geographically weighted regression highlighted biodiversity and vegetation as particularly influential in Plympton (local R2 = 0.866) and Unley (local R2 = 0.488). Expert interviews recommended strategies such as wastewater recycling, long-term conservation planning, and restoring ecological connectivity. This study provides a practical framework to guide urban planners and policymakers in enhancing ecological sustainability through UGS planning.

1. Introduction

The environmental balance of cities all over the world has been disturbed as a result of urban physical development, urban sprawl, and rapid urbanisation [1,2,3]. Green areas were the first urban element that was damaged and destroyed in this process [4,5,6,7]. On the other hand, several studies indicated that to make cities favourable living places for urban residents and different habitats, planning and designing green spaces in urban areas based on ecological criteria can enhance the environmental functions of the urban ecosystems. For instance, according to Feng et al. [8], Maheng et al. [9], Mukherjee and Takara [10], and Wang et al. [11], planning UGS based on ecological sustainability indicators can mitigate environmental hazards such as urban heat islands, air pollution, and flooding. Therefore, the environmental advantages of UGS are related to climate and the ecological situation of cities, providing opportunities for habitats, and improving cities’ urban landscape and aesthetics.
The concept of sustainability of urban planning is related to the sustainable development of societal, environmental, and economic dimensions of urban life [12]. Nowadays, ecological sustainability aims to preserve natural and environmental resources for current and future generations. Urban green space (UGS) is one of the natural resources in cities to promote urban sustainability. Sustainability of natural ecosystems is a significant prerequisite and a durable approach for sustainable urban development [13]. Hence, given the increasing impact of human activities on natural resources and ecosystems, the consideration of ecological sustainability has become a critical factor in sustainable development research [13]. UGS as one of the significant urban ecosystem components can help protect ecological diversity, reduce environmental challenges, and enhance human life quality [14]. As the key component of the urban ecosystem, urban green space (UGS) can help preserve ecological diversity, solve challenges of urban environments, and enhance human well-being [14].
Despite of the growing body of research highlighting the benefits of UGS, there remains a significant gap in identifying and evaluating the specific ecological sustainability criteria that should guide UGS planning, particularly in the context of Australian cities. Previous studies [15,16,17,18] have largely focused on broader ecological impacts without a focused analysis of measurable planning criteria. This lack of specificity hinders the development of contextually relevant, evidence-based planning strategies.
To address this gap, this study investigates the ecological sustainability criteria of UGS in selected suburbs in the Adelaide Metropolitan Area. It seeks to understand how these criteria are fulfilled and impact the overall ecological sustainability at the local level based on data collected from a household survey.
The main aim of this study is to examine the ecological sustainability criteria within UGSs in order to determine their impact on enhancing urban ecological sustainability. To guide this investigation, the study is driven by the following objectives:
  • To identify the ecological sustainability criteria most relevant to effective UGS planning;
  • To evaluate the current status of UGS in the case study suburbs based on these criteria;
  • To compare the selected suburbs to determine spatial differences in ecological sustainability performance;
  • To determine which criteria most significantly influence ecological sustainability in the context of Adelaide;
  • To develop guidelines and policies to improve the challenging criteria to promote ecological sustainability.
Accordingly, this study addresses the following research question: How does UGS planning impact the urban ecological sustainability?
To answer the main question, this study will also consider the following sub-questions:
-
Which UGS planning criteria are more effective for urban ecological sustainability?
-
What is the status of UGS in the case study in terms of affecting ecological sustainability criteria?
-
What are the differences between the studied suburbs regarding ecological criteria?
-
Which criteria have more impact on the urban ecological sustainability?
-
What solutions are required to improve the challenging criteria?

2. Methodology

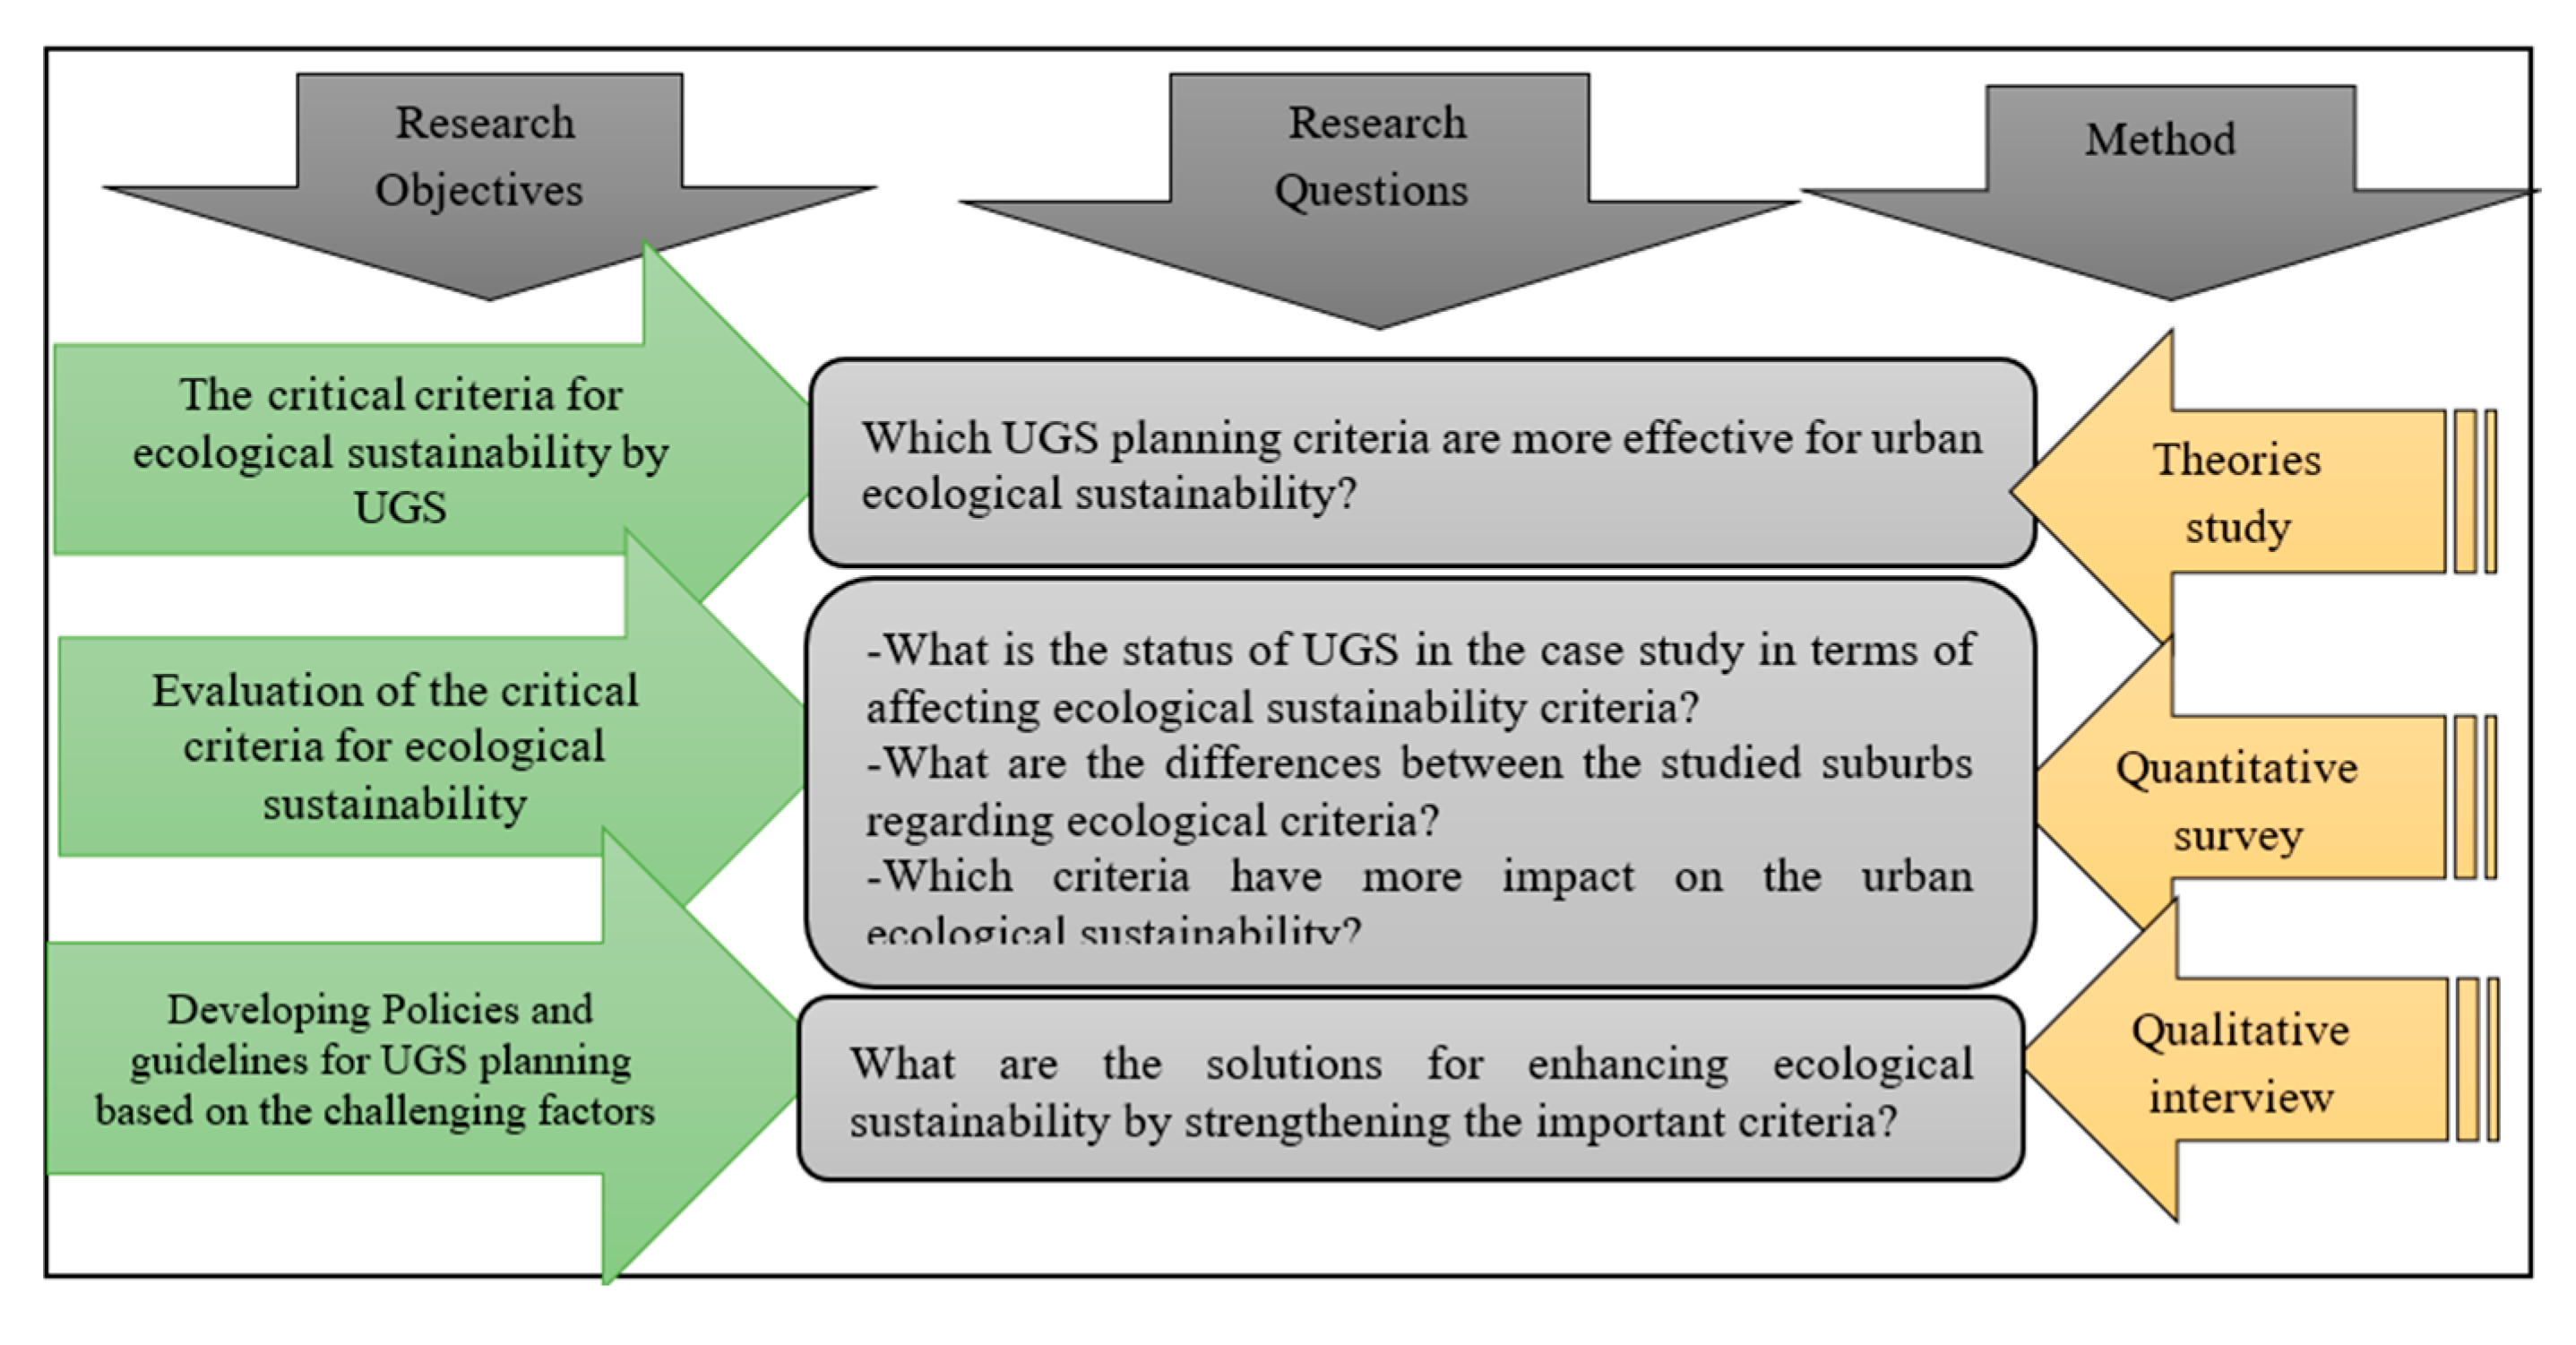
The main purpose of this study is to investigate the status of ecological sustainability criteria adapted in urban green space planning in the neighbourhoods of the Adelaide Metropolitan Area. To address this aim, data collection and analyses were carried out by three methods: (1) content analysis to identify the affecting criteria, (2) quantitative households’ survey to explore the ecological sustainability criteria condition throughout UGSs, and (3) a local experts’ interview to develop practical solutions to enhance the ecological sustainability of the Adelaide Metropolitan Area through improving the study criteria (Figure 1).
Research methods according to these research objectives and questions are presented in Figure 2.

2.1. Content Analysis

The content analysis was undertaken based on a systematic literature review to identify the main affecting ecological factors for UGS planning to enhance urban sustainability. To better analyse the criteria, they were considered in five main domains which were identified by reviewing the related literature. The most repeated criteria from the related literature were chosen as the critical ecological factor by previous studies.

2.2. Household Survey

In the next step, a questionnaire survey was designed to understand the situation of UGS in residential areas based on the most critical ecological factors. The case study area for this research is the Adelaide Metropolitan Area. To reach the aim of the research, six sample suburbs were selected from this area. This was undertaken at the suburban level. The understanding of what constitutes a suburb may vary based on the planning systems followed in different countries. While in some developing countries suburbs are considered outer regions or parts of cities, in Australia the term suburb refers to neighbourhood units. In other words, suburbs in Australia are equivalent to neighbourhoods as commonly defined in most countries [19].
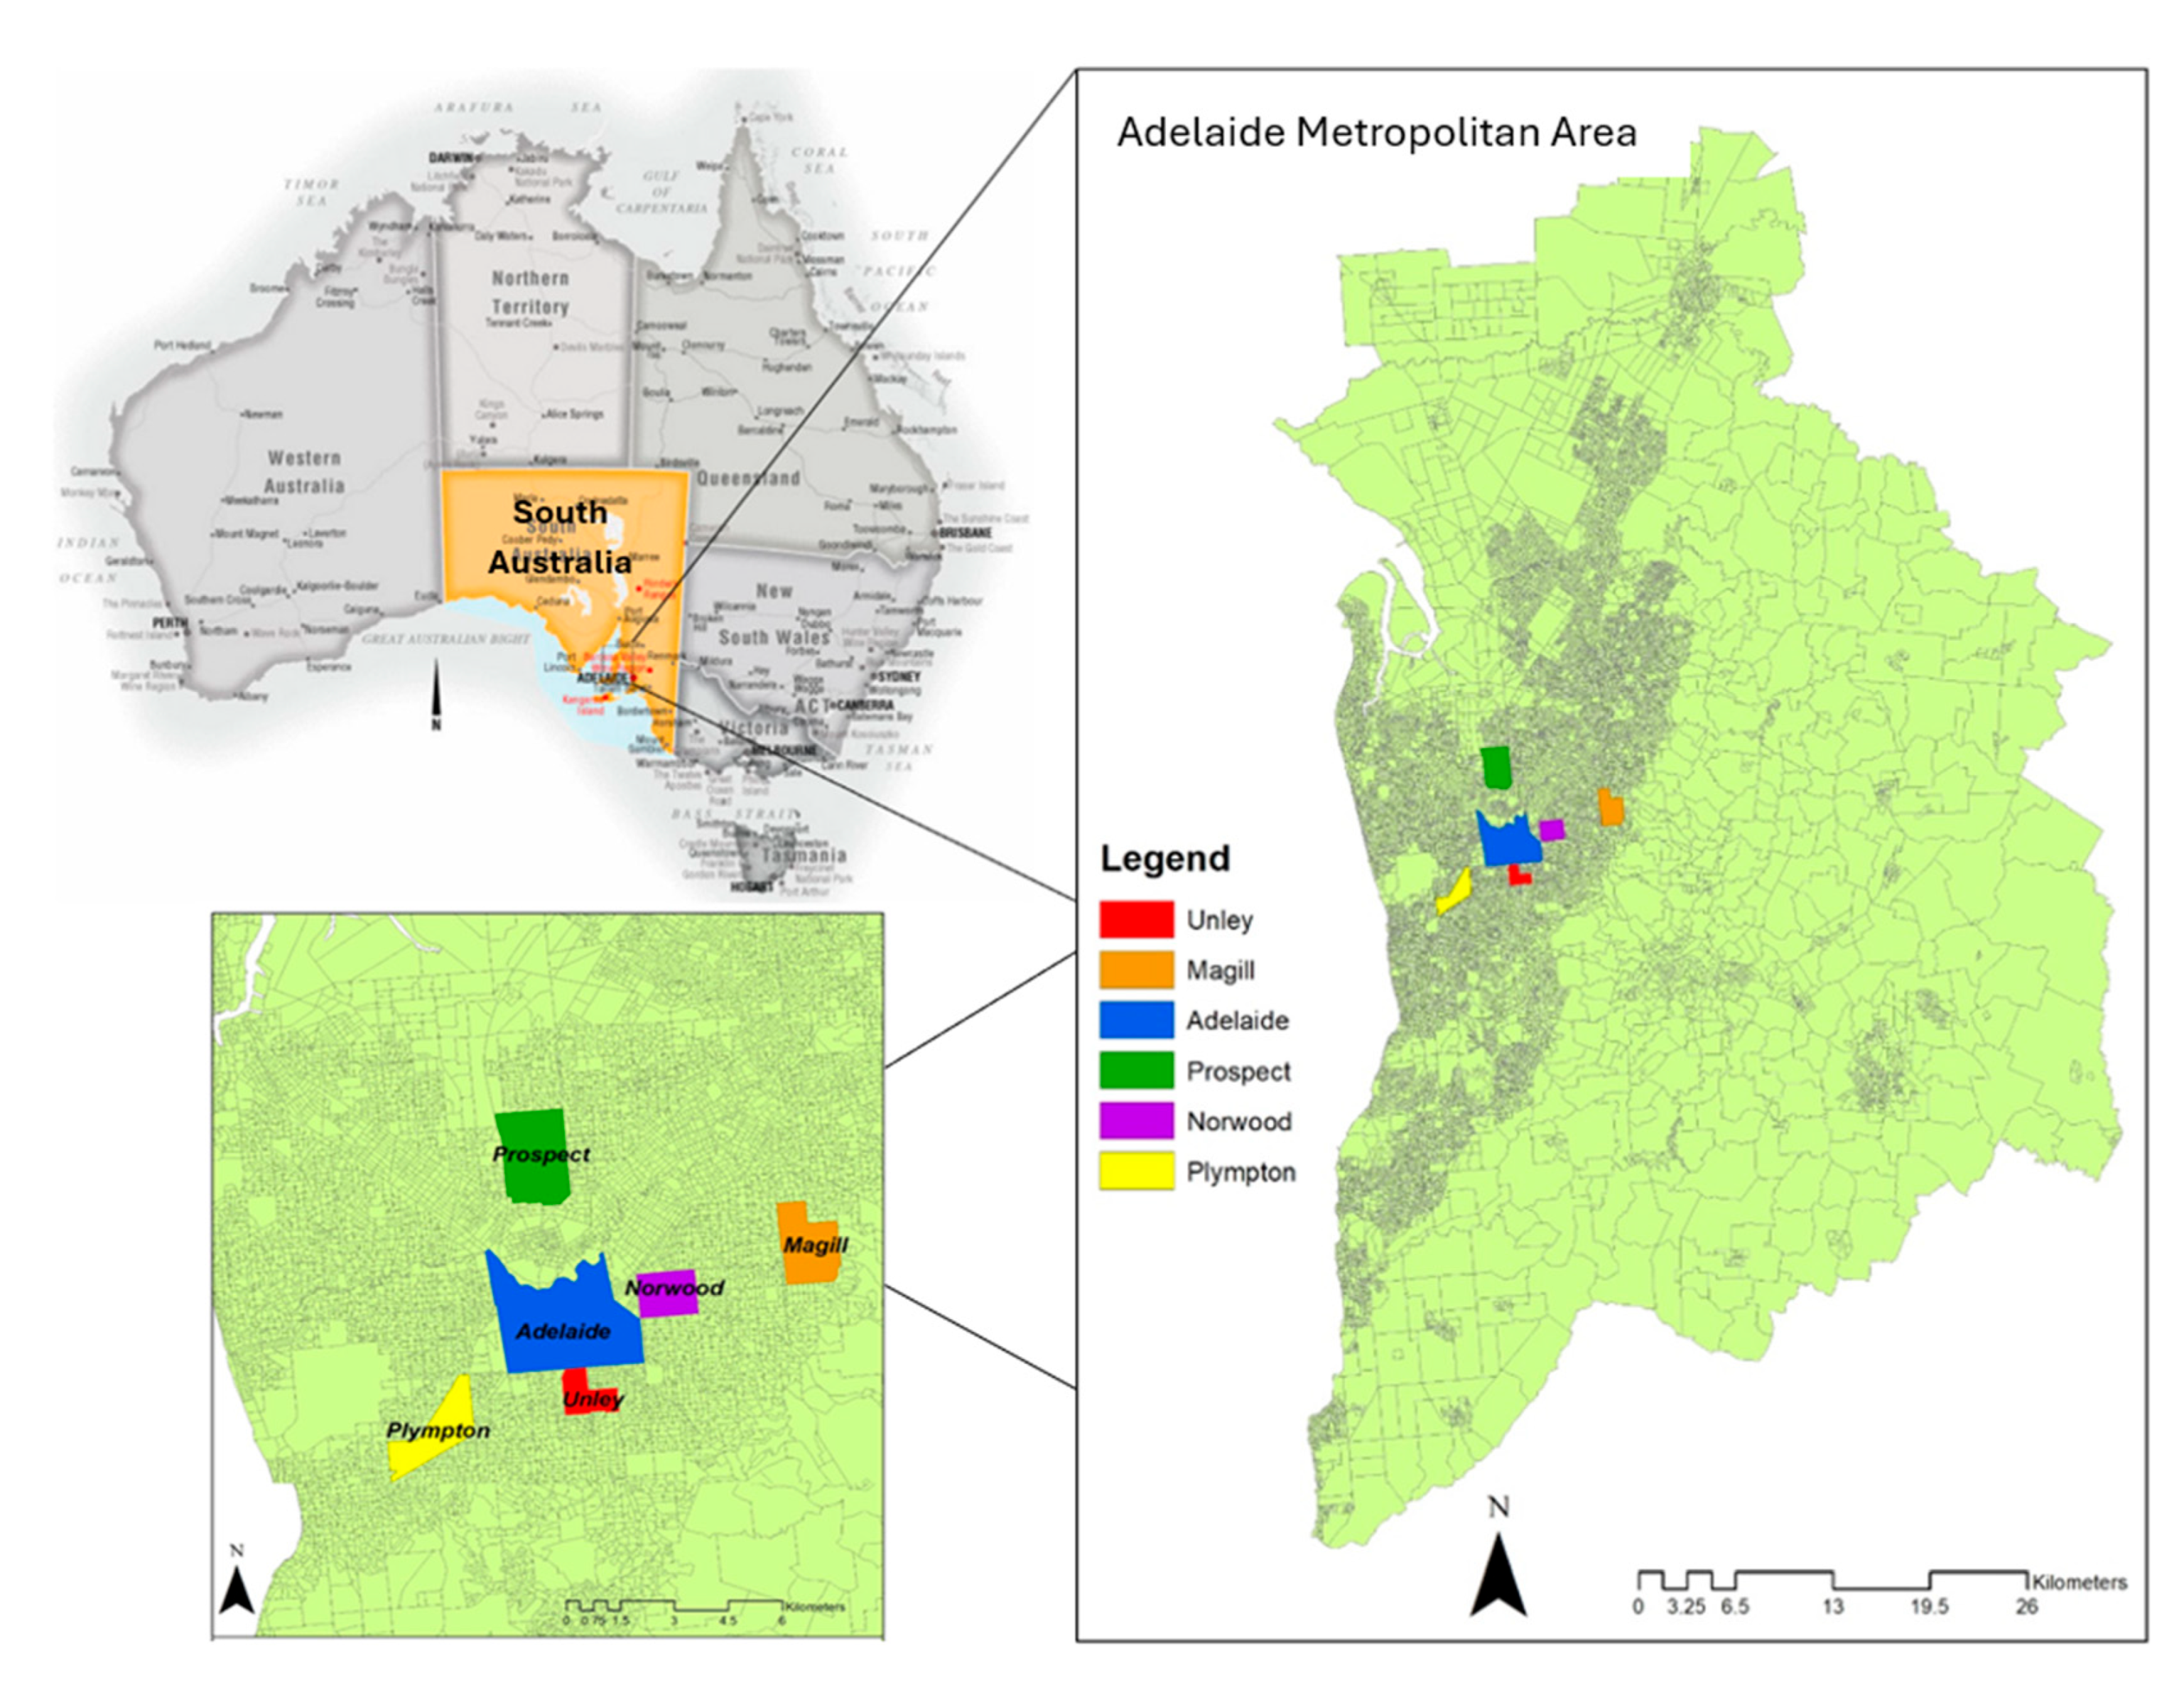
Based on the similarities and characteristics such as distance to the central city, density, land use, cultural, demographic, and environmental similarities, the five suburbs of Unley, Plympton, Prospect, Norwood, and Magill and the city of Adelaide CBD were selected (Figure 3). These suburbs have experienced UGS planning more than those far from the city centre, with a considerable number of natural landscapes and green spaces.
According to the quantitative evaluation of UGS in the Adelaide Metropolitan Area and sample suburbs, it was found that 11% of the total area of the Adelaide Metropolitan Area is dedicated to public UGS. Of this, about 1.92% is located in the six sample suburbs, out of which the largest share of UGS is located in the Adelaide CBD.
Table 1 presents demographic characteristics, area, and per capita of UGSs throughout the studies suburbs and their share of the total green space per capita in Adelaide. As it is clear from Table 1, Prospect suburb has lowest per capita among the studied suburbs, but due to its proximity to the central part of the city, most of its residents use nearby green spaces in the central part of the metropolis. Also, CBD has the highest number of green spaces per capita considering its commercial role in the metropolis. Also, the basic structure and planning of this part of the metropolis was design as a garden city, which could be the reason for the high per capita green space.
Given the varying population of sample suburbs, the authors employed a criterion based on population ratios to determine statistical sample sizes. Initially, the population of the suburbs were extracted from the Australian Bureau of Statistics [20]. Then, the population ratio of each suburb was calculated based on the total population of all studied suburbs. Continuing, based on the total population of the six suburbs which is 51,971 people and using Morgan’s Table which is a widely used method for determining statistical sample size, 382 people was determined for conducting the survey (Table 2). Systematic random sampling was conducted for the selection of the survey participants. This study’s main limitation was collecting data during the COVID-19 outbreak and restricted time. Unfortunately, the response rate was lower than the estimated rate, and only 100 responses were collected over an extended period. While this sample is smaller than originally planned, participants were distributed across all studied suburbs, which allowed the research to capture a range of perspectives and experiences regarding the organization of UGS. Given the extraordinary circumstances of the pandemic, this sample size is considered adequate to provide indicative insights into spatial organization and residents’ perceptions.
While the city centre and Unley suburbs primarily consist of Australian people, other suburbs include people from various nationalities. The authors made efforts to include occupants regardless of their nationality and from various age groups, social classes, income levels, and residency durations.
Considering the limitations of public knowledge regarding ecological sustainability criteria, the survey was designed to capture public perceptions rather than technical assessments. In addition, a Participant Information Sheet and Consent Form were provided to residents to ensure they had sufficient understanding of the survey topic and were willing to contribute to the study. When designing the survey questionnaire, the ecological criteria were divided into five categories according to the critical criteria.
Questions about ecological sustainability were divided into five domains: (1) biodiversity and vegetation, (2) planning for ecological networks, (3) landscape and design, (4) water resources, and (5) protection.
In this study, a Likert scale was used to gather residents’ ideas for the household survey. This method had five options that allowed people to show how much they agreed or disagreed with a particular statement [21]. Participants were asked to rate their opinion regarding the ecological sustainability criteria situation in the green spaces they used on a Likert scale from 1 to 5. The ratings were: not at all (1), poor (2), average (3), well (4), and very well (5).
To measure the reliability of the survey tool, a Cronbach’s alpha test was used before studying and evaluating the ecological sustainability factors in the case studies (Table 3). Cronbach’s alpha for the questionnaire is 0.701, indicating the high reliability of the tool used in the survey. A Cronbach’s alpha value higher than 0.3 indicates the high reliability of the questionnaire used in the research [22].
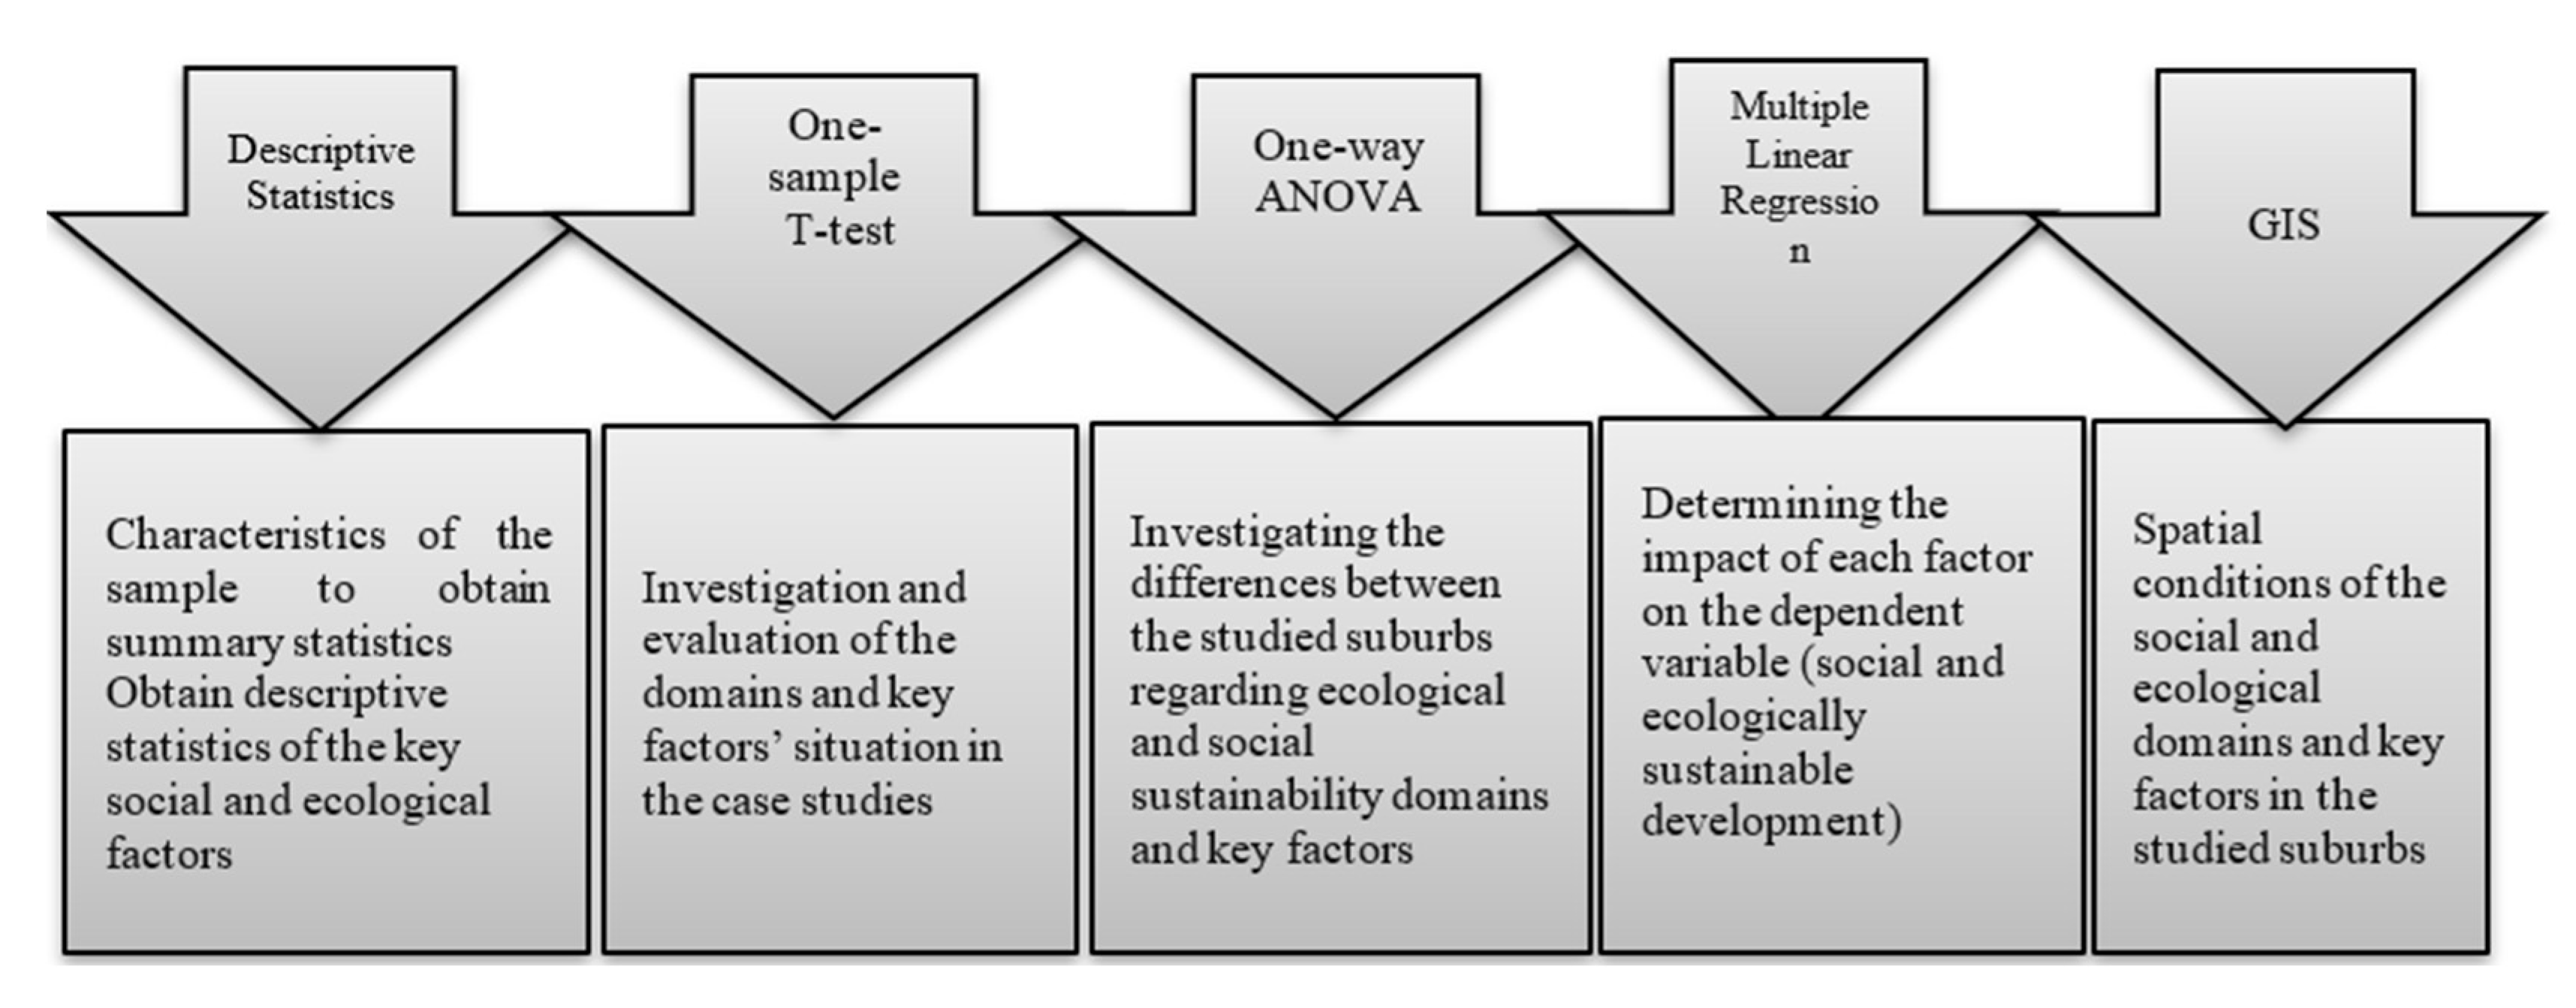
Figure 4 presents the processes adapted in the analysis of household survey data. These analyses were performed using statistical and spatial analysis by SPSS 30 and GIS 10.8. The descriptive statistics, one-sample T-test, and variance analysis, including one-way ANOVA and multiple linear regression analysis, were done to obtain the survey’s aims.

2.3. Local Experts’ Interview

To identify guidelines and policies to strengthen and improve the challenging factors in the sample suburbs, local stakeholders were interviewed to get their ideas in this regard. To achieve this aim, qualitative semi-structured interviews were conducted. The main reason for using the qualitative method in this part of the research is the compatibility of the qualitative method with providing solutions for the investigated subject. In addition, the qualitative method focuses on understanding the problem through the specialised knowledge and insights of specialists. The statistical populations included landscape engineers, UGS planners, and experts who had management and executive experience in the field of green space planning and design in the Adelaide Metropolitan Area. The selection criteria for employing interviewees were their management and executive experiences in the area of UGS development. By exploring the webpages of the local councils and relevant private companies, the interviewees were selected. In this part of the study, eight participants were interviewed. Three interviewees were landscape designers and architects from the private sector. Four interviewees were local council open space planners and landscape architects and urban designers, and finally, one interviewee was an academician who was also the head of an urban design and architecture company.
The purposive sampling method was used to select samples, and in this sampling method, people were selected who had the required information about the purpose of the research [23]. The sample size in this study was determined using the principle of saturation theory. Saturation theory is one of the methods in qualitative research, which shows that the collected data is enough, and more data is not necessary and will have no benefit on the research result [24]. Therefore, saturation is used in qualitative research as a criterion for discontinuing data collection or analysis. In this research, it was found that after the sixth and seventh interviews, the answers and opinions received from the experts were repeated, and no new strategies and ideas were received regarding the interview questions. The interview continued until the eighth person to ensure enough and reliable responses were obtained.
The data collected from the interviews were organised, coded, and analysed by ATLAS.ti 24 software. ATLAS.ti helps to enhance the accuracy and consistency of the analysis by creating a systematic and transparent coding process. This can help to ensure that your analysis is grounded in the data and that the interview findings are reliable and valid [25].
To analyse the data with this program, three steps were performed.
First, the data were entered into the software. Second, a coding process was conducted, where meaningful segments of text were categorised using codes derived from the literature and participants’ responses, while preserving their original wording. Duplicate and repetitive codes were then merged or refined during secondary coding. Finally, the data were analysed by organising the final codes into a tree diagram, highlighting major challenges in UGS planning, namely, water resources, protection, and ecological networks, along with proposed strategies to address them.

3. Results

This section presents the findings from the two research methods used. The first part outlines the results of the literature and theoretical study, identifying the critical factors that most significantly impact the ecological sustainability of cities through UGS planning. The second part analyses the household survey, reflecting residents’ views on UGS in their neighbourhoods. It also evaluates the status of ecological sustainability criteria in the case study of green spaces from various dimensions.

3.1. Ecological Sustainability Criteria for UGS Planning

Identifying urban ecological sustainability criteria and incorporating them into UGS planning and design can significantly contribute to advancing urban sustainability. Teimouri et al. [26] suggest that to better understand the impacts of the criteria, it is helpful to group and examine them within key domains. Accordingly, this study has analysed the criteria across five domains based on their similarities: biodiversity and vegetation, UGS protection, water resources, ecological landscape design, and ecological networks. These domains are considered essential for promoting urban ecological sustainability through effective UGS planning.

3.1.1. Main Affecting Domains

Based on the literature review, the main domains influencing UGS planning to enhance their ecological sustainability functions were identified as follows: biodiversity and vegetation [15,27,28,29,30,31,32], protection [33], water resources [34,35,36,37], ecological networks [38,39], and ecological landscape design [15,26,40,41,42,43,44,45,46,47,48,49,50,51,52].
Table 4 presents all criteria related to these domains, as identified in the studies by Teimouri et al. [26,52].

3.1.2. Most Critical Ecological Sustainability Criteria

It is important to ensure that urban ecological sustainability necessitates the identification and implementation of key ecological sustainability criteria within green space development programs.
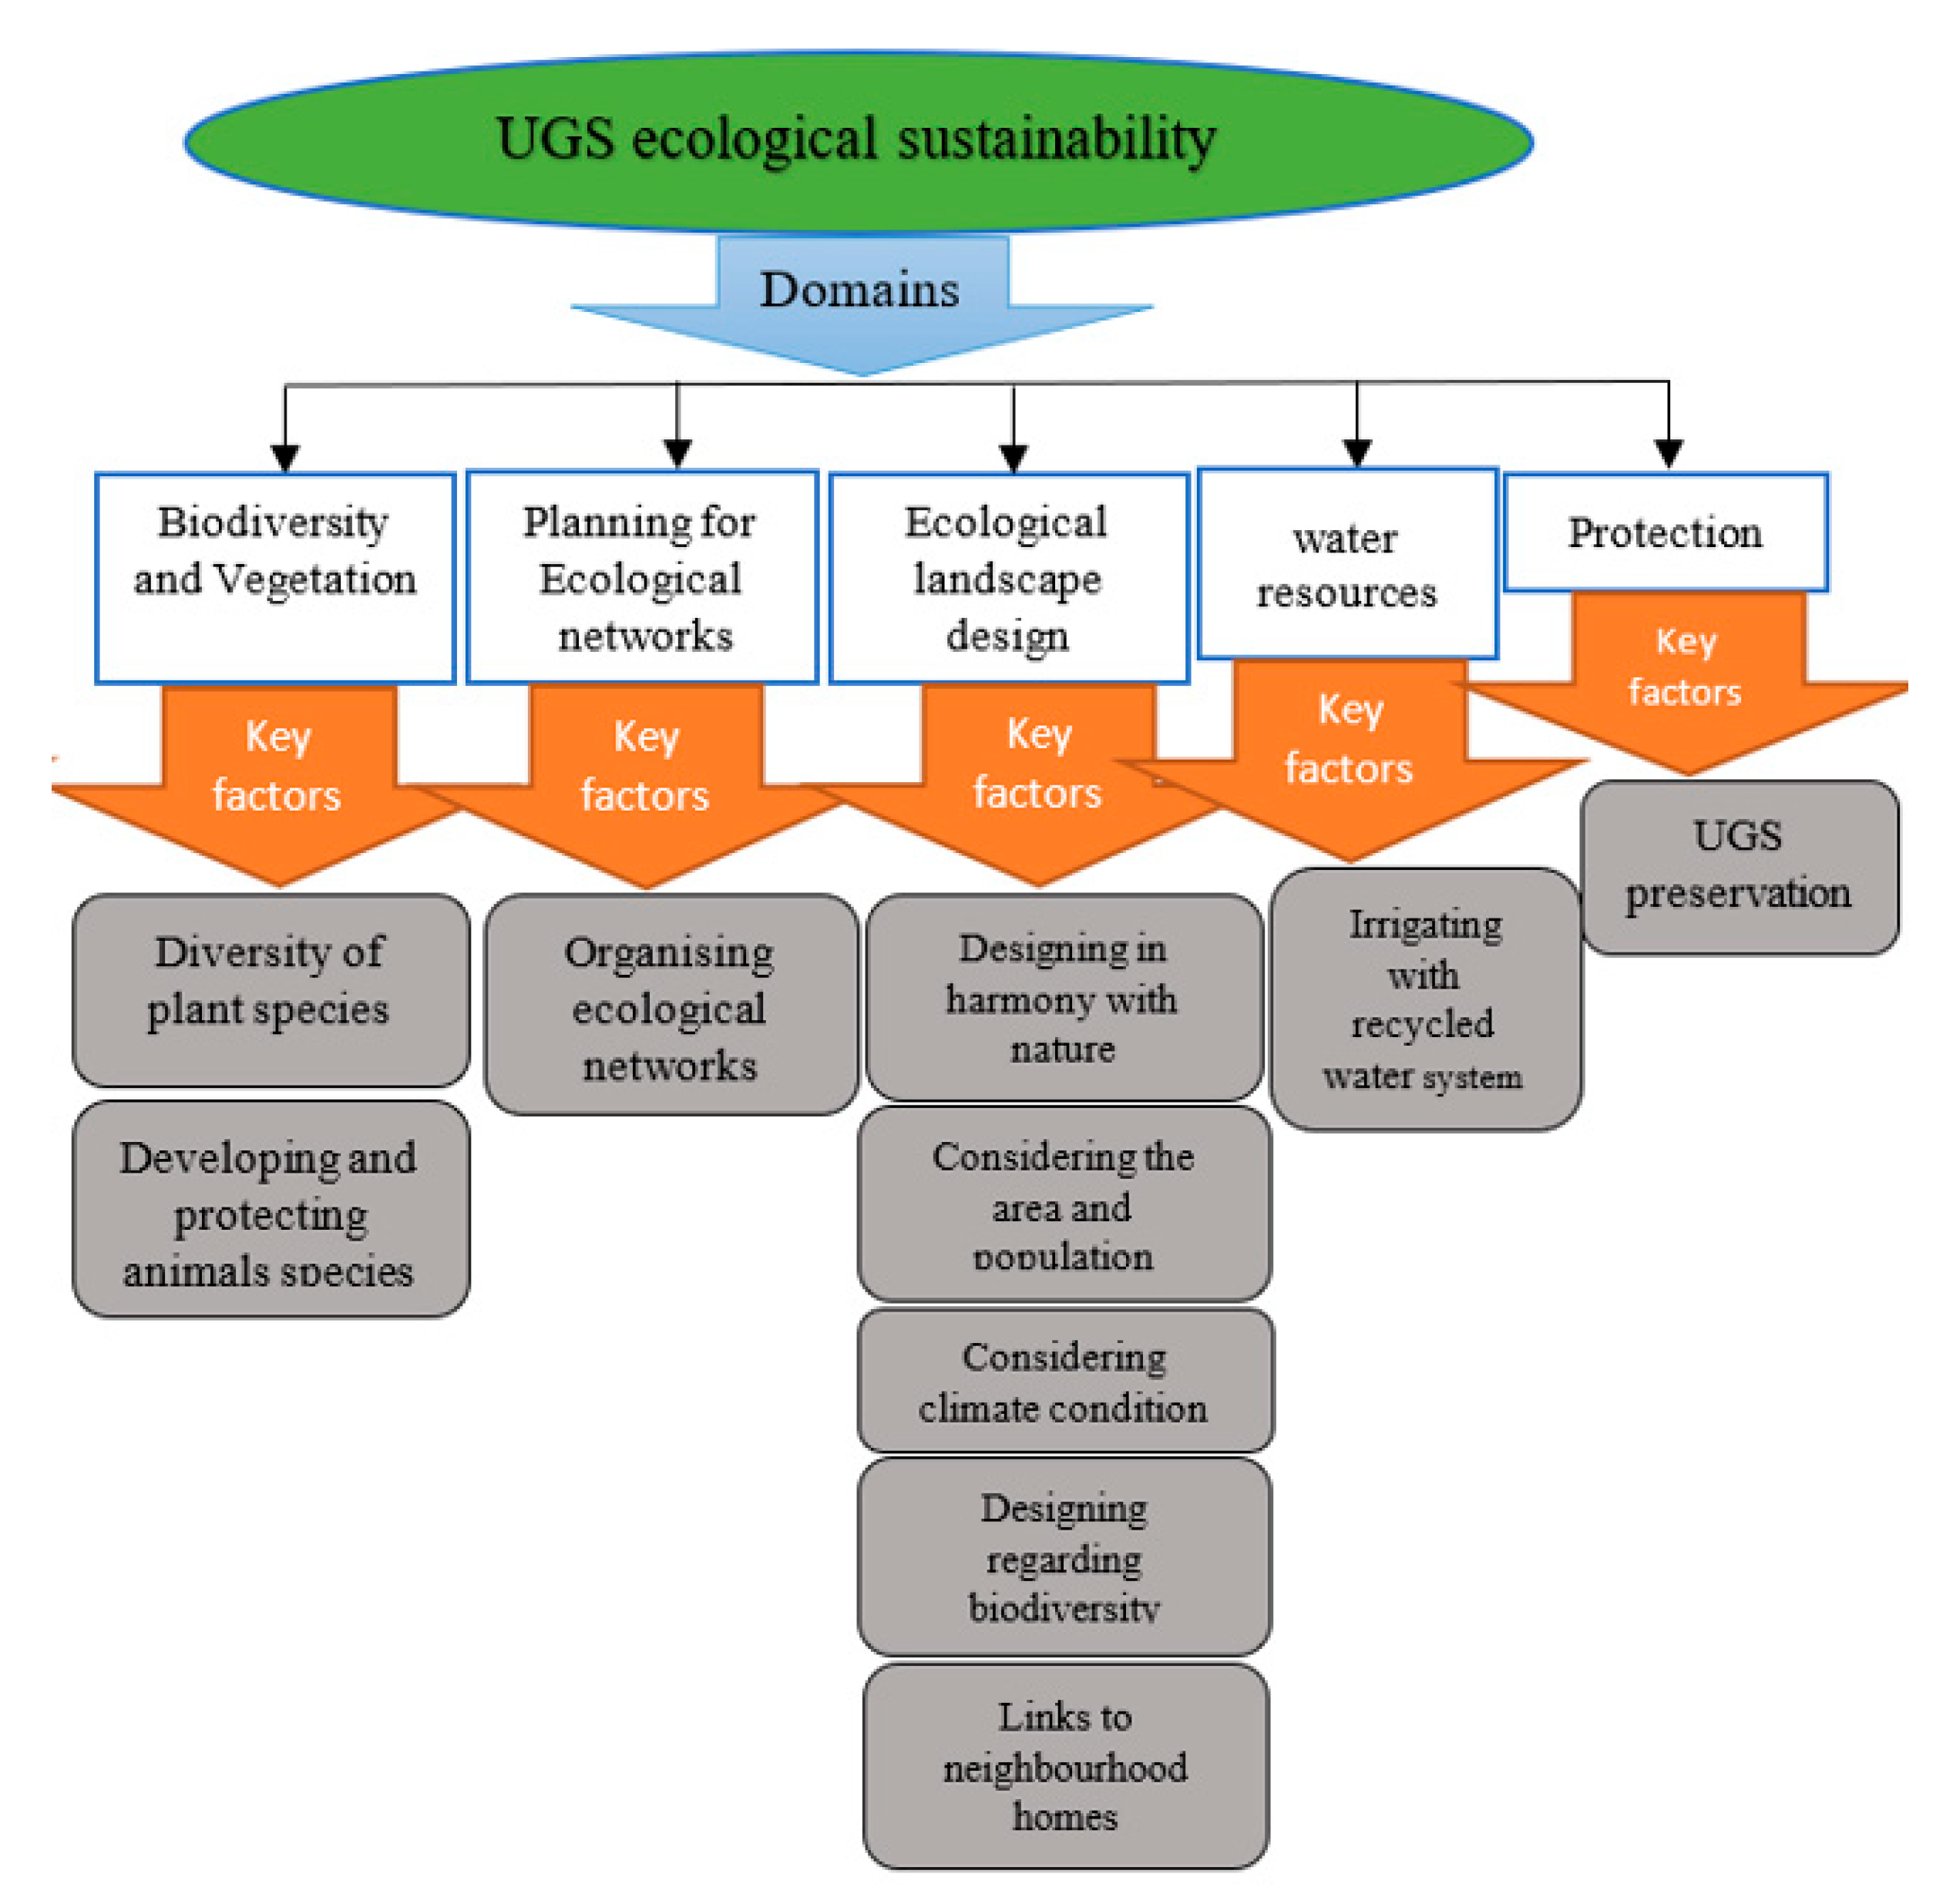
According to the international experts’ survey results presented in Teimouri et al.’s [26] study, the most significant UGS criteria that can enhance ecological sustainability in urban areas are (a) from the biodiversity and vegetation domain: diversity of plant species and protecting animal species; (b) from the ecological networks domain: organising ecological networks through planning; (c) from the ecological landscape and design domain: form and shape in harmony with nature, designing for the population, area of the neighbourhoods or suburbs, and climate conditions; (d) from the water resources domain: irrigation with recycled water; and (e) from the protection domain: UGS preservation (Figure 5).
The results of study by Teimouri et al. [26] indicated that the factor of protection plays the most important role in maximising the ecological benefits of UGS to enhance ecological sustainability. Therefore, despite fast urbanisation, urban sprawl, and increasing construction in cities, to support the urban environment, biodiversity, and liveable residential areas, protection of green cover and urban nature should be considered as the priority of urban and green space planning.
Also, the study findings reveal a close relationship between the affecting key criteria for the ecological functions of UGS. In other words, the function of each factor affects the other criteria, so all criteria should be considered in UGS planning and design programs to increase the overall sustainability of urban areas. Promoting urban ecological sustainability would be inevitable if the identified important ecological criteria is considered in UGS planning programs. Therefore, the environmental consequences of such planning will benefit the neighbourhoods through UGS and biodiversity protection, improving air quality and creating a favourable green urban landscape.

3.2. Evaluation of the Critical Criteria for Ecological Sustainability

The results of the household surveys are presented in this section.

3.2.1. General Characteristics of the Respondents

Out of the 100 total participants, 41% of the participants were male, and 59% were female. Most respondents were in the 31–40 age group (51%). Other age groups in the survey sample were ages 20–30 (20%), 41–50 (15%), 61–70 (7%), and 71–80 (1%). Most of the respondents (72%) were married. However, 13 people were single, 8 were separated, 4 were divorced, and 3 were widowed.
In terms of the educational background of the participants, the majority of people, comprising 45%, held a bachelor’s degree. Respondents with a master’s degrees and above constituted 33% of the participants, while those with graduate diplomas comprised 7%, and individuals with high school diplomas and elementary studies represented 2% of the participants. Additionally, 13% of the respondents did not answer to this question. The residency duration of the respondents indicated that suburbs such as Prospect and Plympton have more immigrants who arrived in Australia in recent years, most of whom are tenants. Therefore, their residency in these areas was less than two years. In contrast, suburbs like Unley and Adelaide CBD include more Aussie people with a long residency duration. The authors tried to gather diverse perspective on UGS usage, ranging from immigrants to Australians in order to capture a comprehensive understanding of residents’ viewpoints.
The participants were asked about distance from home to the nearest park and green spaces (Figure 6). Distance to UGS is one of the critical criteria to having easy accessibility to UGS for the residents. As it is clear from Figure 5, in most of the suburbs, residents had a less than 5 min walk to access a UGS in their neighbourhoods with 39%. Also, 26 per cent of the residents declared they had to walk 5–10 min for access, and 27 per cent of them had to walk 10–15 min to access green spaces. However, 5% of the participants had to walk about 15–20 min, and 3% had to walk more than 20 min to reach a UGS to get its benefits.

3.2.2. Descriptive Analysis of Ecological Criteria in the Case Studies

In this part of this study, the status of ten criteria which were identified by the previous study [26] as the most important criteria to increase urban ecological sustainability by UGS planning were analysed. Therefore, the ecological sustainability of the studied suburbs was measured by the selected criteria. Based on the similarities and for better analysis, the criteria were divided into five domains: biodiversity and vegetation, planning for ecological networks, landscape and design, protection, and water resources. To analyse the survey data, all the domains and criteria were coded, which are presented in Table 5.
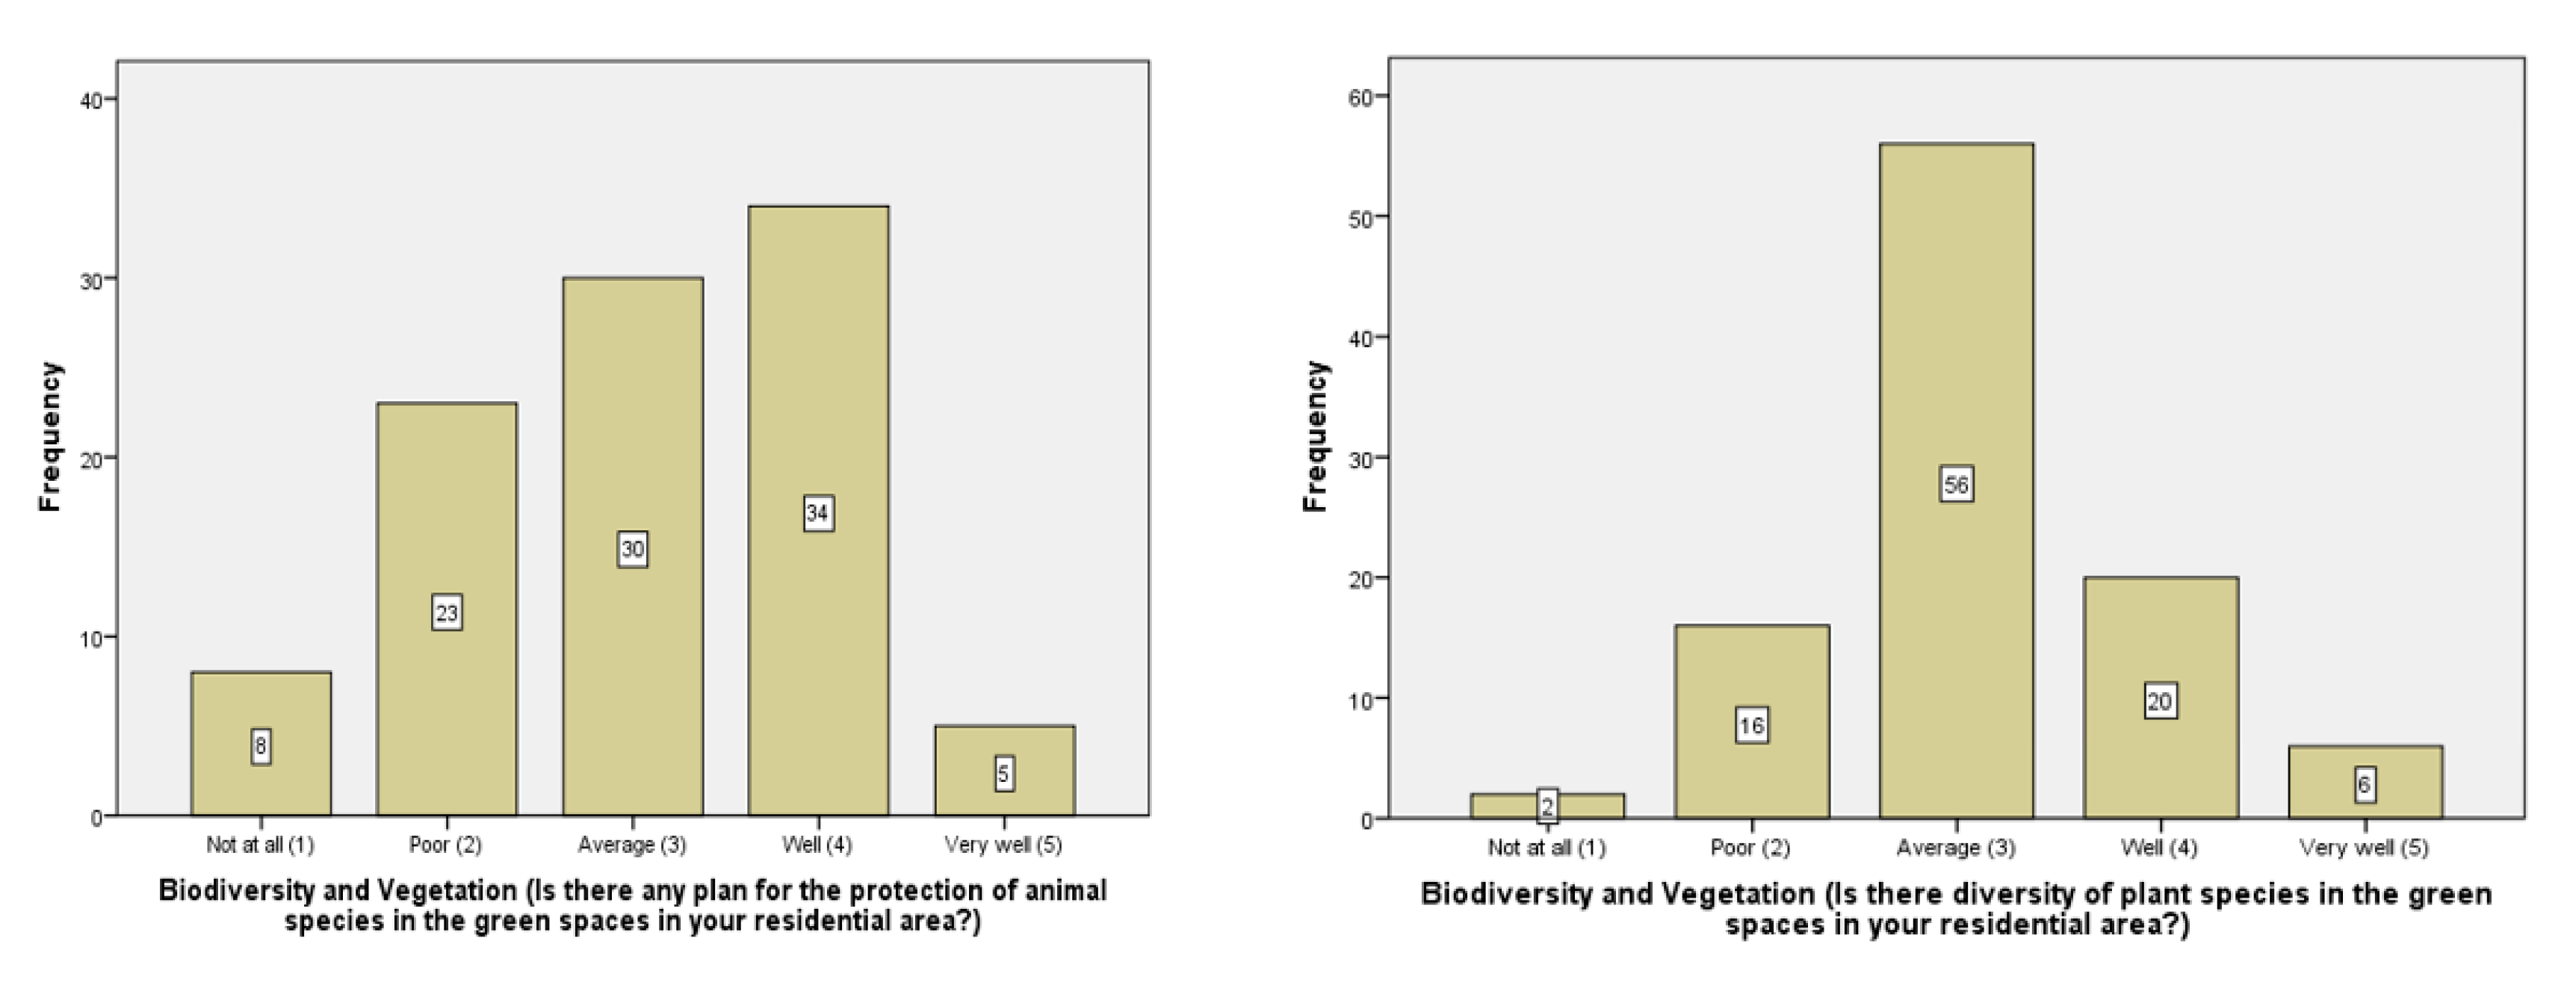
Figure 7 presents the frequency of the residents’ responses about the selected ecological sustainability criteria in the studied suburbs.
According to the three criteria of the biodiversity and vegetation domain, for the “protection of animal species” criterion, most respondents rated it as well, followed by average. For the “diversity of plant species” criterion, the highest frequency of responses was well, followed by very well. Planning for ecological networks, as a single criterion in its domain, received a majority of responses rating this aspect as well, with average and very well also receiving significant responses.
Regarding the four charts for frequency of responses for criteria in the landscape and design domain, the “shape in harmony with nature” criterion had the most respondents selecting well, followed by very well. The responses for “link with neighbourhoods’ homes” criterion shows that most responses were dedicated to well, followed by very well. Additionally, for the “consideration of biodiversity” criterion, the majority of respondents chose well from the Likert spectrum followed by very well. Furthermore, the “climate care in design of green spaces” chart illustrates the responses about whether climate considerations are taken into account in the design of green spaces. Most respondents rated this aspect as well followed by very well.
In general, the charts present a positive perception of residents towards these criteria, with a tendency toward higher ratings in all categories.
Regarding the “Protection” criteria and to answer to the question of whether there is any preservation program for green spaces in residential areas, the majority of respondents (61%) perceived the preservation efforts as average. Finally, for the “Water Resources” criteria, over half of the respondents (52%) rated this practice as average. The next largest group (21%) rated it as poor, followed by 17% who rated it as well, 8% as “Very Well,” and a small minority (2%) as not at all.
Therefore, the survey results for protection and water resources show that while there are some efforts towards preservation and using recycled water for irrigation, many residents view these efforts as only moderately effective.

3.2.3. Evaluating Ecological Sustainability Criteria in the Case Studies

One of the widely used statistical tools, the one-sample T-test, was used to test the mean difference between the selected case studies [77]. In this part of the study, a one-sample T-test was done to evaluate the domains and included criteria within the studied suburbs. Considering that a five-option Likert scale was used to answer the survey questions included in the questionnaire, number 3 is considered as the test value and ideal state to measure each factor situation [77,78]. In other words, if the average of each factor is higher than 3, it can be concluded that the studied factor has a positive condition. In contrast, if the actual average value is lower than the test value (3), it indicates the poor state of the factor from the residents’ point of view. According to Table 6, among the ecological criteria, three criteria, including planning to organise ecological networks with an average of 2.94 and water resources with an average of 2.80 have a lower average than the standard value. Also, criteria of protection with an average of 3.08 got the score close to the standard value. The other criteria had a higher average than the standard value which is number 3. This condition indicates the relative favourability of the ecological sustainability criteria in the studied suburbs.
To investigate the general status of ecological sustainability in the case studies, number 30 was considered as a measure of the overall average of the criteria. As the total number of the criteria is 10, considering the Likert scale, the number 30 was identified as the standard average. Therefore, an average above the number 30 shows the favourability and an average below it shows the unfavorability of the criteria.
The T-test results regarding the ecological criteria condition in the case studies are presented in Table 7. As it is clear from the table, the T-test value is (2.472) with a confidence of 0.99 and an error level smaller than 0.00. The calculated average for the ecological criteria (31.47) differs from the test value (30). Due to its value being higher than the standard value, it can be said that generally the ecological criteria have been evaluated as acceptable from the studied suburbs’ residents’ point of view.
According to the results of the one-sample T-test, three sub-criteria including organising ecological networks, protection, and sustainable water resources received a low score from the residents’ point of view compared to other sub-criteria.

3.2.4. Investigating the Impact of UGS Planning Criteria on Urban Ecological Sustainability

The analysis showed that most of the ecological criteria examined for the UGS planning process to enhance urban sustainability had almost acceptable scores according to T-test analysis results.
Generally, the surveyed criteria demonstrated the status of ecological sustainability provided by UGSs to the neighbourhoods in the studied areas. The criteria’s overall status can be recognised by their average scores based on the residents’ ideas. In other words, each criterion influences the ecological sustainability in the studied suburbs by urban green space planning. Therefore, in this part of the study, a multiple linear regression model was used to determine the impact of each criterion on the dependent variable, which is urban ecological sustainability by UGS planning.
Multiple linear regression is a widely used method to clarify the nature of a dependent variable by using a set of independent variables that are considered to affect the dependent variable’s nature [79,80].
Table 8 consists of three main components. The value of R is known as the multiple correlation coefficient, which shows the degree of multiple correlations between the independent and the dependent variables. Generally, its value fluctuates between 0 and 1. The value of R is 0.839, which shows the significant influence of independent variables on the dependent variable. Another component of the multiple linear regression model is R squared, also is known as the square of the multiple correlation coefficient, which shows the amount of the variance of the dependent variable by the independent variables. The value of this coefficient also varies between 0 and 1. The closer the mentioned number is to 1 indicates that the independent variables is able to show the changes in the dependent variable. According to the results of Table 8, the obtained R squared value is 0.705, which shows that the changes in the independent variables well explained the changes in the dependent variables.
Another main component considered in this model is the adjusted R squared value, which shows the effect of the independent variable on the dependent variable as a coefficient. The multiple correlation coefficient (R) is 0.685, which indicates a very high correlation between the set of independent variables and the dependent variable. On the other hand, the value of adjusted R squared for the study variables is calculated as 0.685. About 68.5% of dependent variable changes (ecological sustainability by UGS planning) are related to independent variable changes. Therefore, the quantity and quality of the variables associated with the ecological criteria examined in this study effect 68.5% of urban ecological sustainability by UGS planning; 31.5% of the impacts on ecological sustainability in the planning process of UGS depend on other variables that were not addressed in this research.
In addition, Table 9 shows the regression effect coefficients of each ecological domain as an independent variable on the dependent variable, which is analysed first by the results of the Beta coefficient. This statistic shows the standardised regression coefficient of each independent variable (biodiversity and vegetation, planning for ecological networks, landscape and design, water resources, and protection) on the dependent variable (ecological sustainability). In other words, based on this coefficient, we can determine the relative contribution of each independent variable in the model. The comparison of the examined variables shows that the effect of all the examined variables on the dependent variable is significant, and the error level of their t value is lower than 0.05, indicating the independent variables’ effect on the dependent variable. In addition, to clarify the results of the regression coefficient, three types of correlations were calculated, and their results are explained here.
Zero-order correlation, which varies between 0 and 1, shows the correlation between variables without the control variable. The test results for the studied variables are positive, but the intensity and degree of the zero-order correlation between the independent variables and the dependent variable (ecological sustainability) are different. Therefore, the zero-order correlation coefficient of the study variables is high, and there is a correlation between the independent research variables and the dependent variable. However, the degree and intensity of the correlation of the independent variables are different. In other words, the zero-order correlation of biodiversity and vegetation with protection variables are high and, in the planning process of UGS, are in line with urban ecological sustainability. Thus, it can be said that the mentioned variables have a high impact on urban ecological sustainability.
The following correlation coefficient analysed in the regression table is the partial correlation coefficient. The higher the value of the correlation, the more significant the role of the variable in the model is compared to other variables. In this study, the correlation coefficient calculated for the landscape and design variable is more than other variables.
In the end, the partial correlation value or part was investigated. The difference between the part correlation and the previous correlation in this correlation removes the linear effect of other independent variables. It directly measures the relationship of an independent variable with the dependent variable, the value of which is lower than the previous two correlations. As can be seen in the Table 9, the part correlation value of landscape and design with the dependent variable (ecological sustainability) is high.
Finally, according to the discussed correlation results, it can be said that for UGS planning to enhance urban ecological sustainability, the contribution and effectiveness of criteria in the landscape and design domain is more than the other examined criteria.

3.2.5. Analysing the Spatial Impacts of UGS Planning Criteria on Ecological Sustainability by GWR

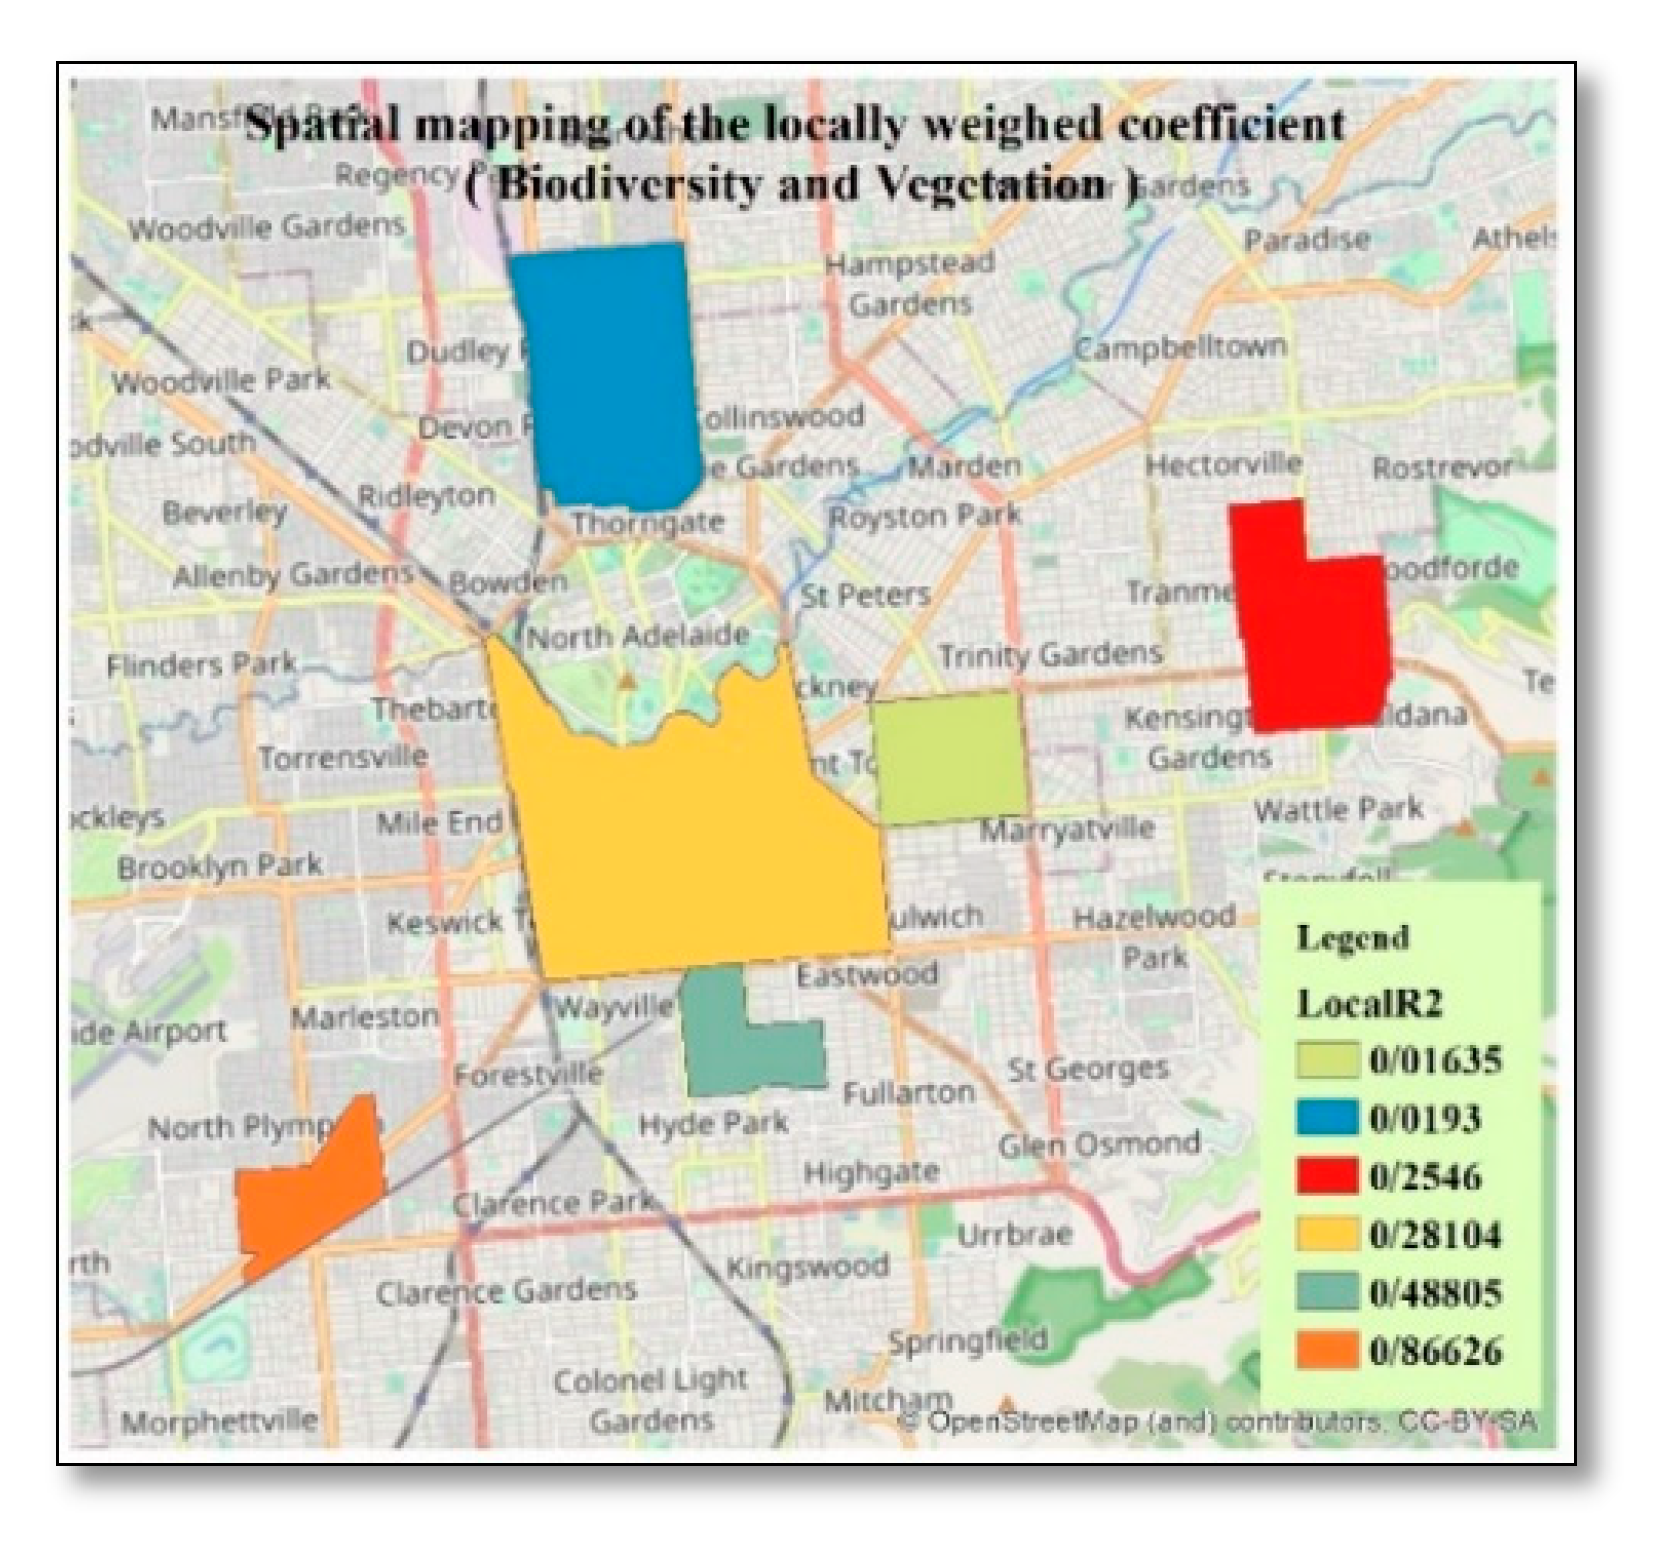
A geographically weighted regression (GWR) model was conducted to explore the spatial impact of each domain including its criteria on the dependent variable (ecological sustainability concerning UGS planning). Therefore, for spatial analysis of the effectiveness of the domains and to determine their ecological sustainability ranks in the case studies, geographically weighted regression (GWR) was used. The dependent variables for the linear regression and GWR analysis were obtained from the sum of the averages of all the domains (including the criteria) scores, and the independent variables were the sum of the averages of the criteria in each domain. Therefore, considering that domains and their related criteria are effective in the ecological sustainability of the urban areas by UGS planning, their sustainability status can be determined in the studied suburbs by their average sum.
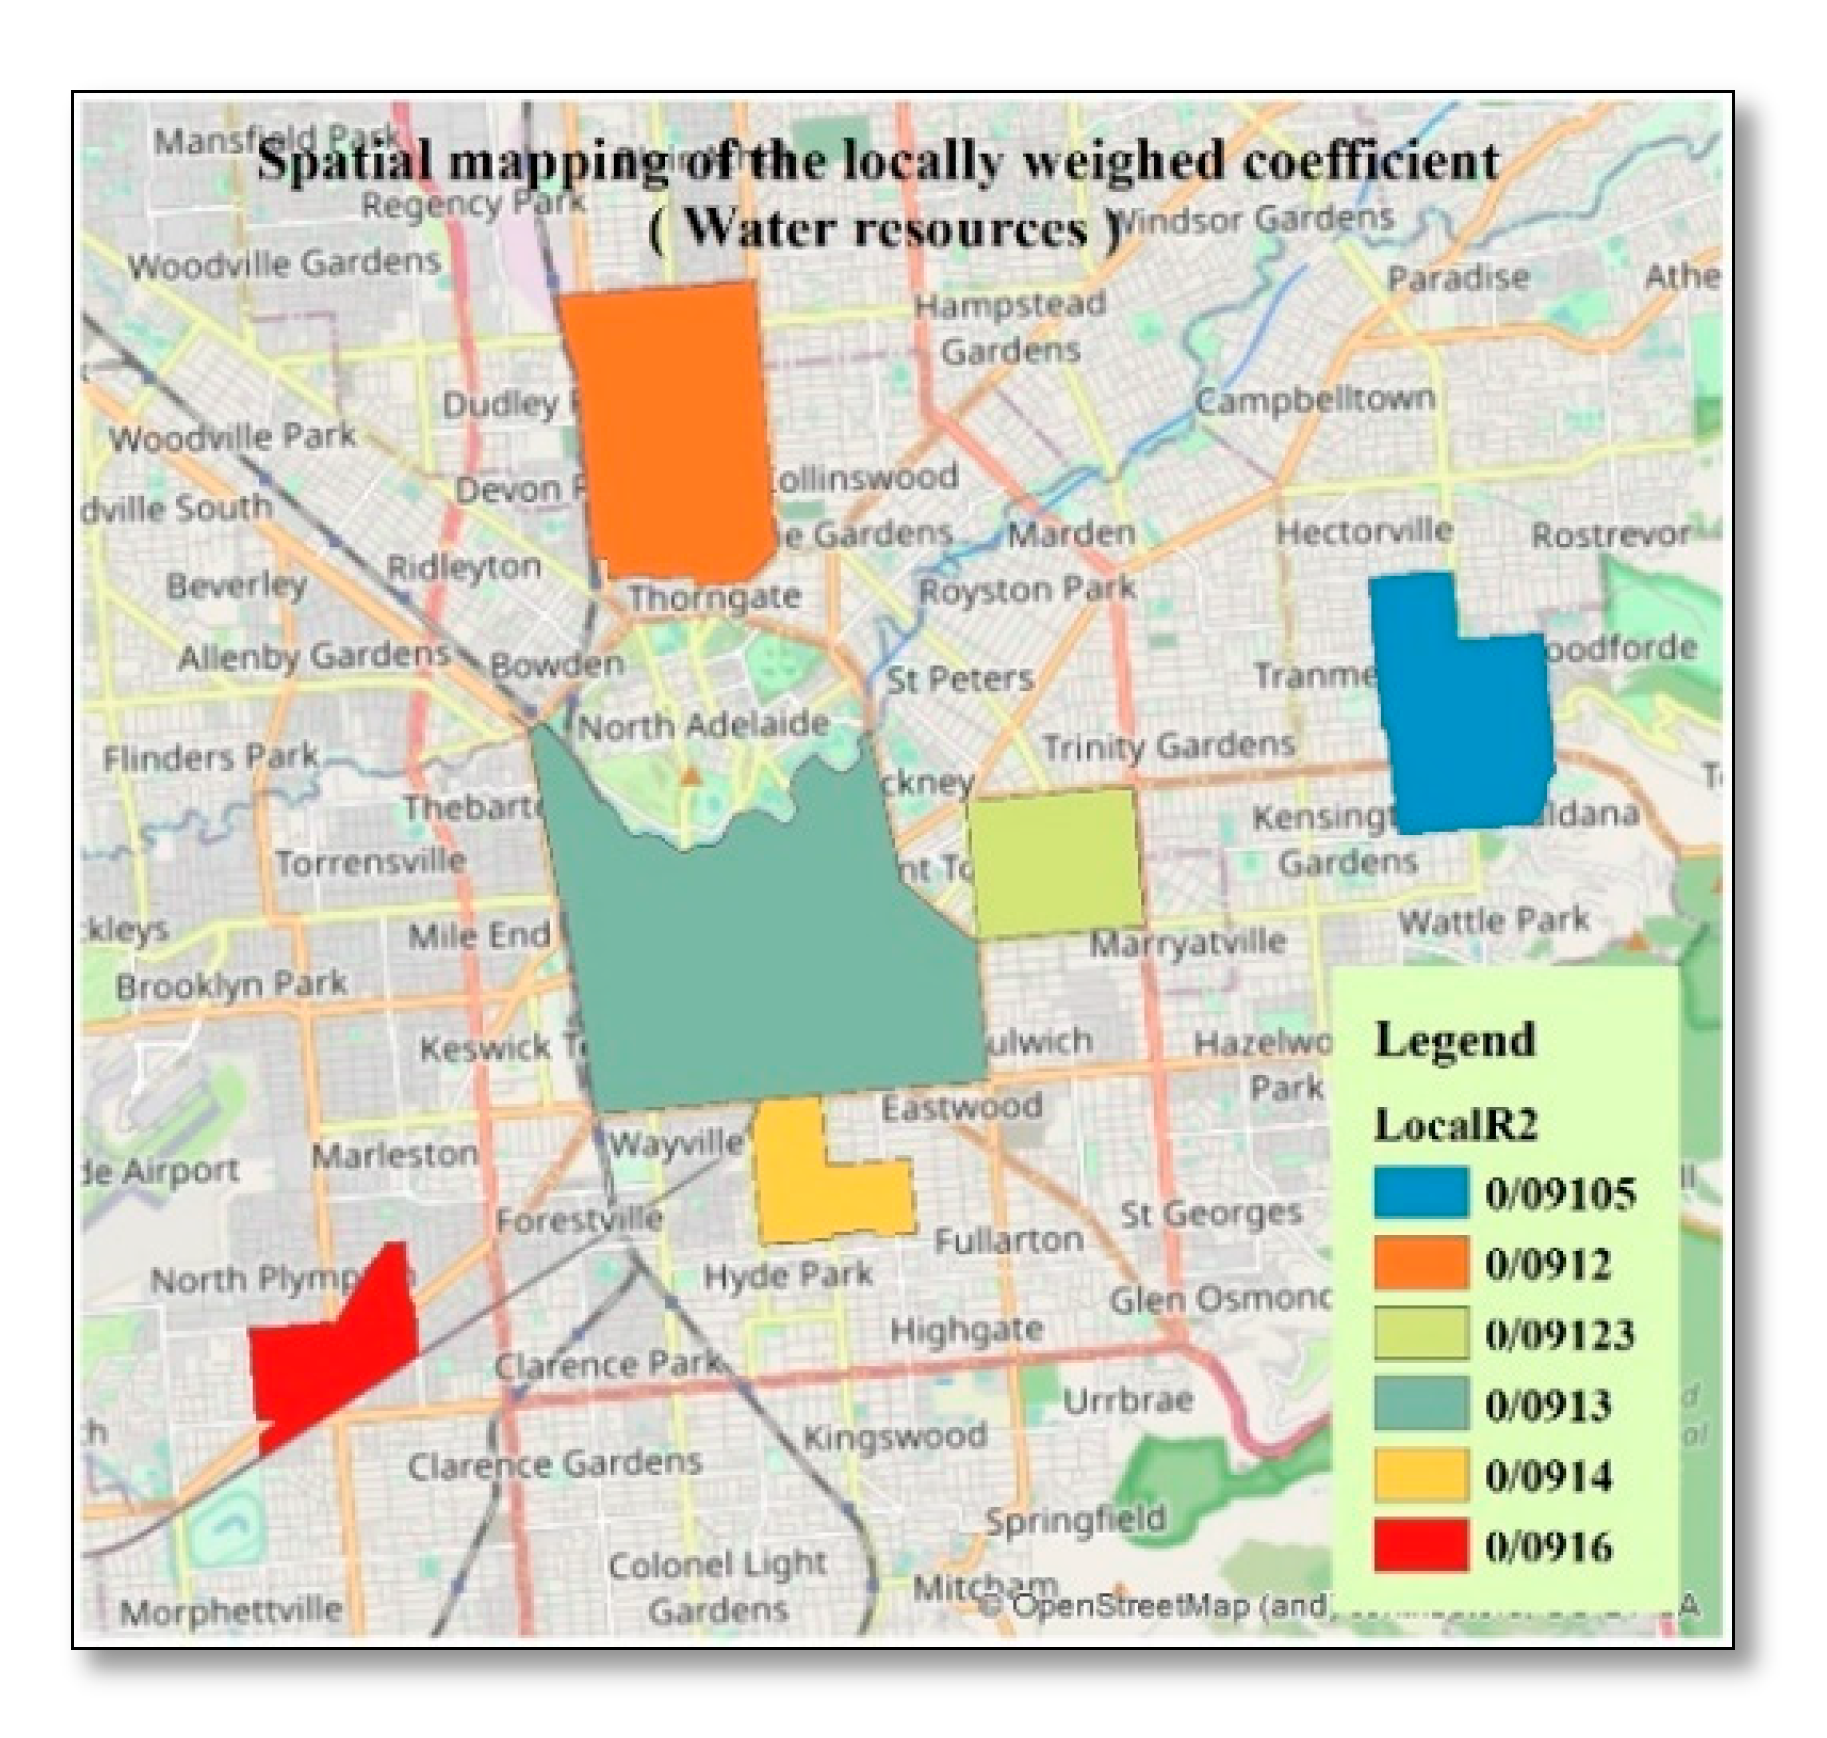
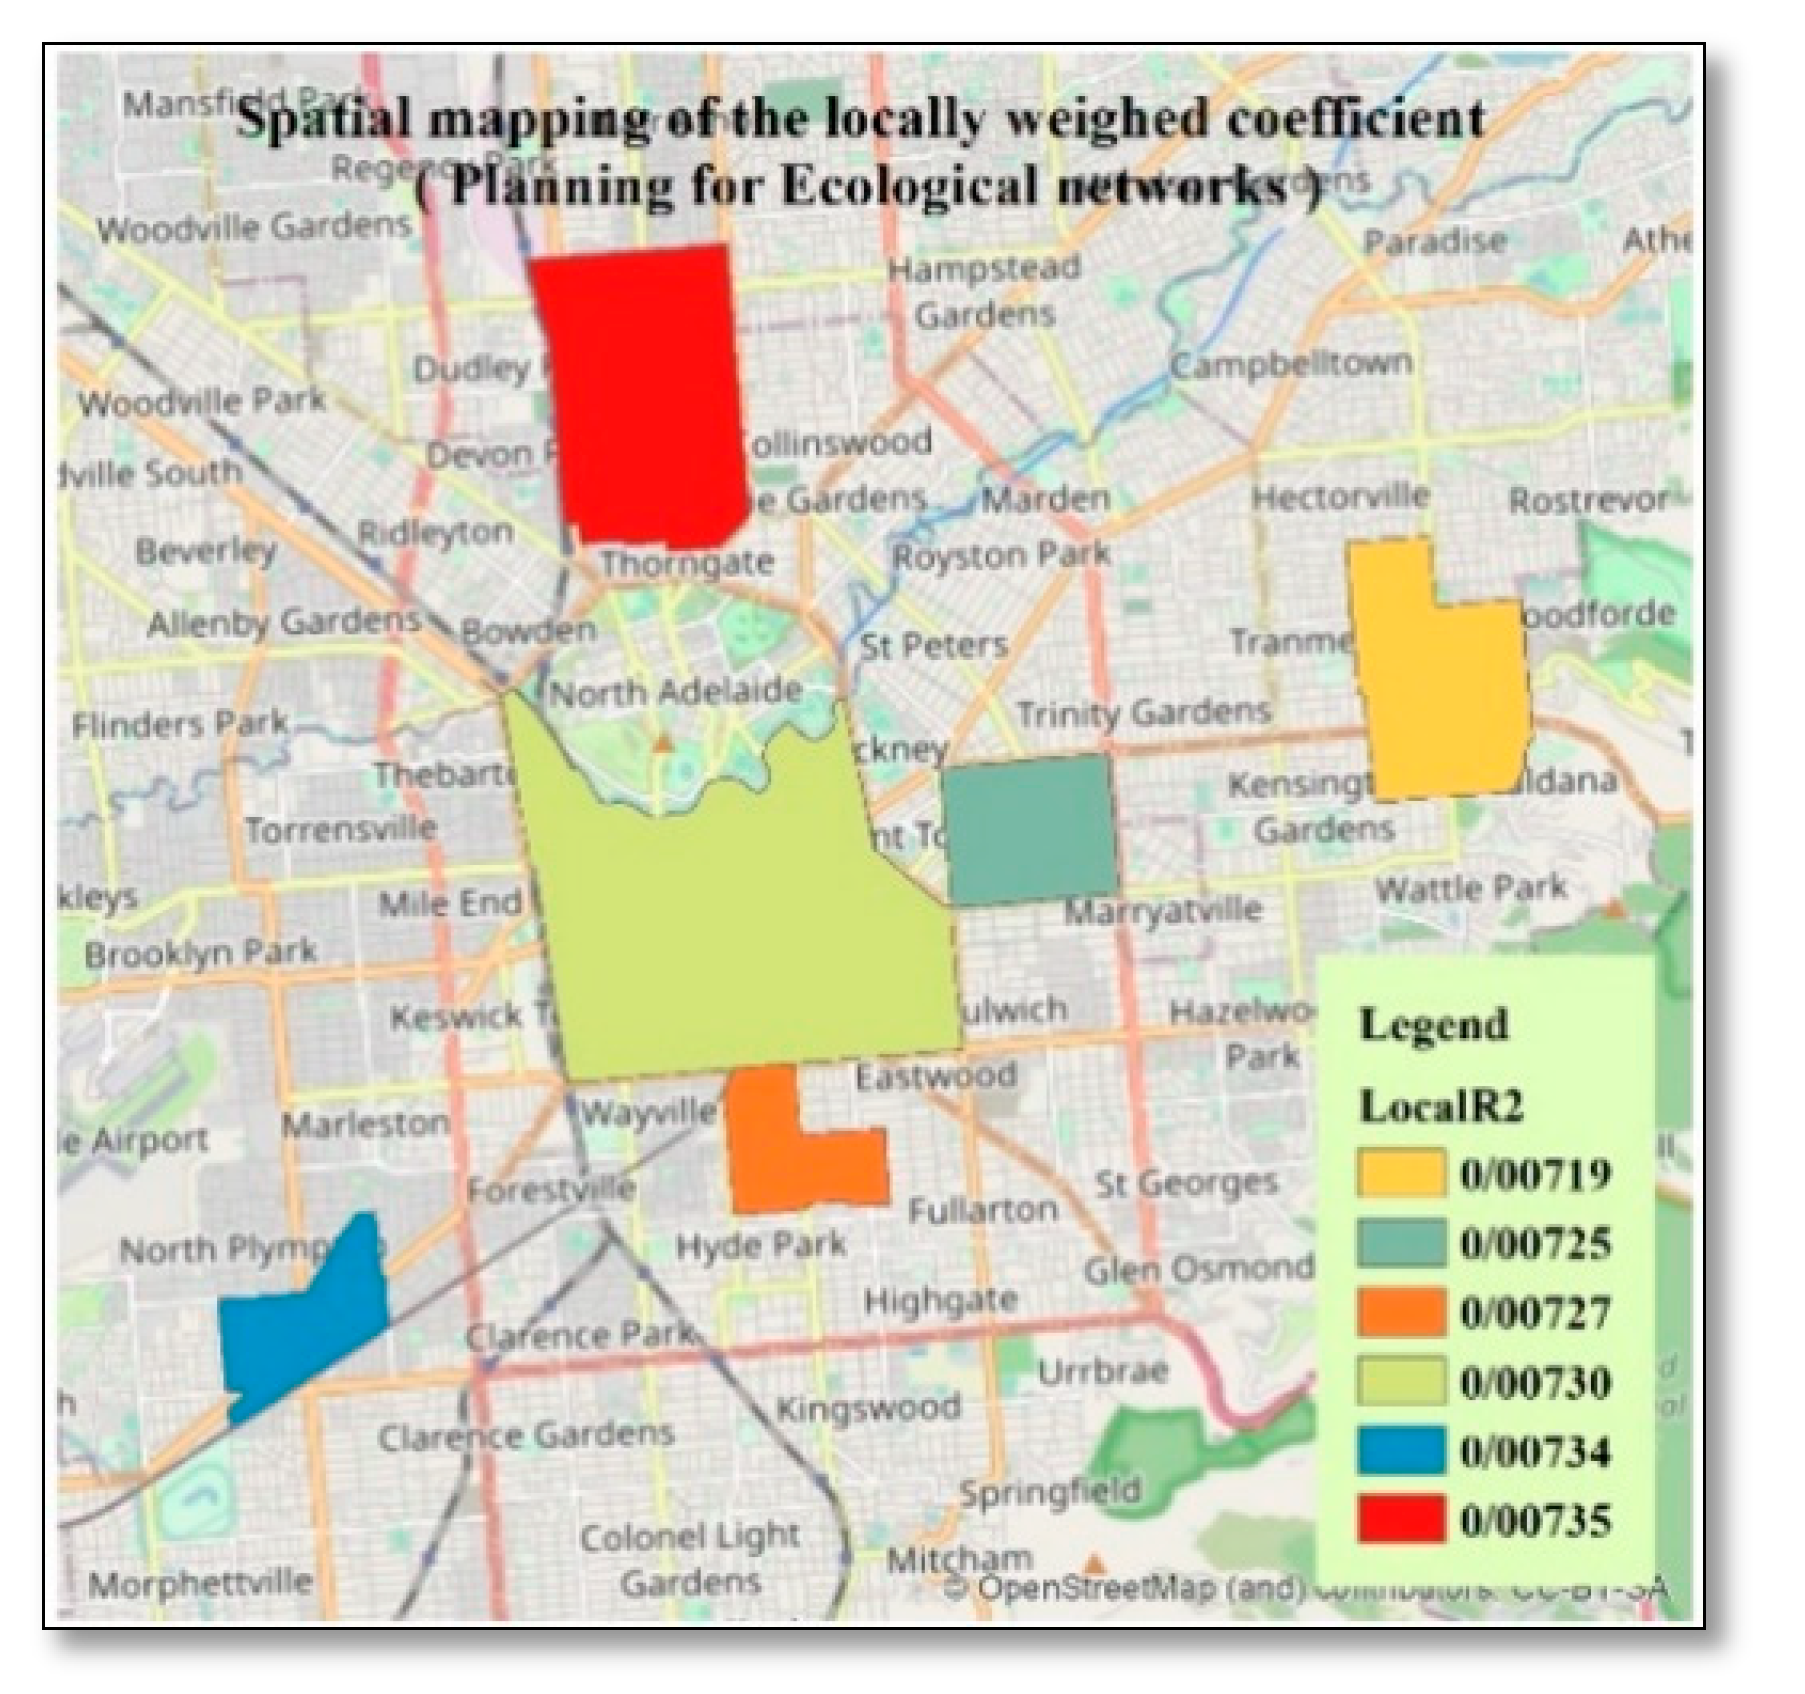
By using GWR, the rank of the studied suburbs was determined according to the domains’ impact. The most important value in the GWR model is the value of local R2. A value closer to 1 means that the independent variables are able to justify the changes in the dependent variable. By increasing the score of each domain, the ecological sustainability of the suburbs increases in the same proportion.
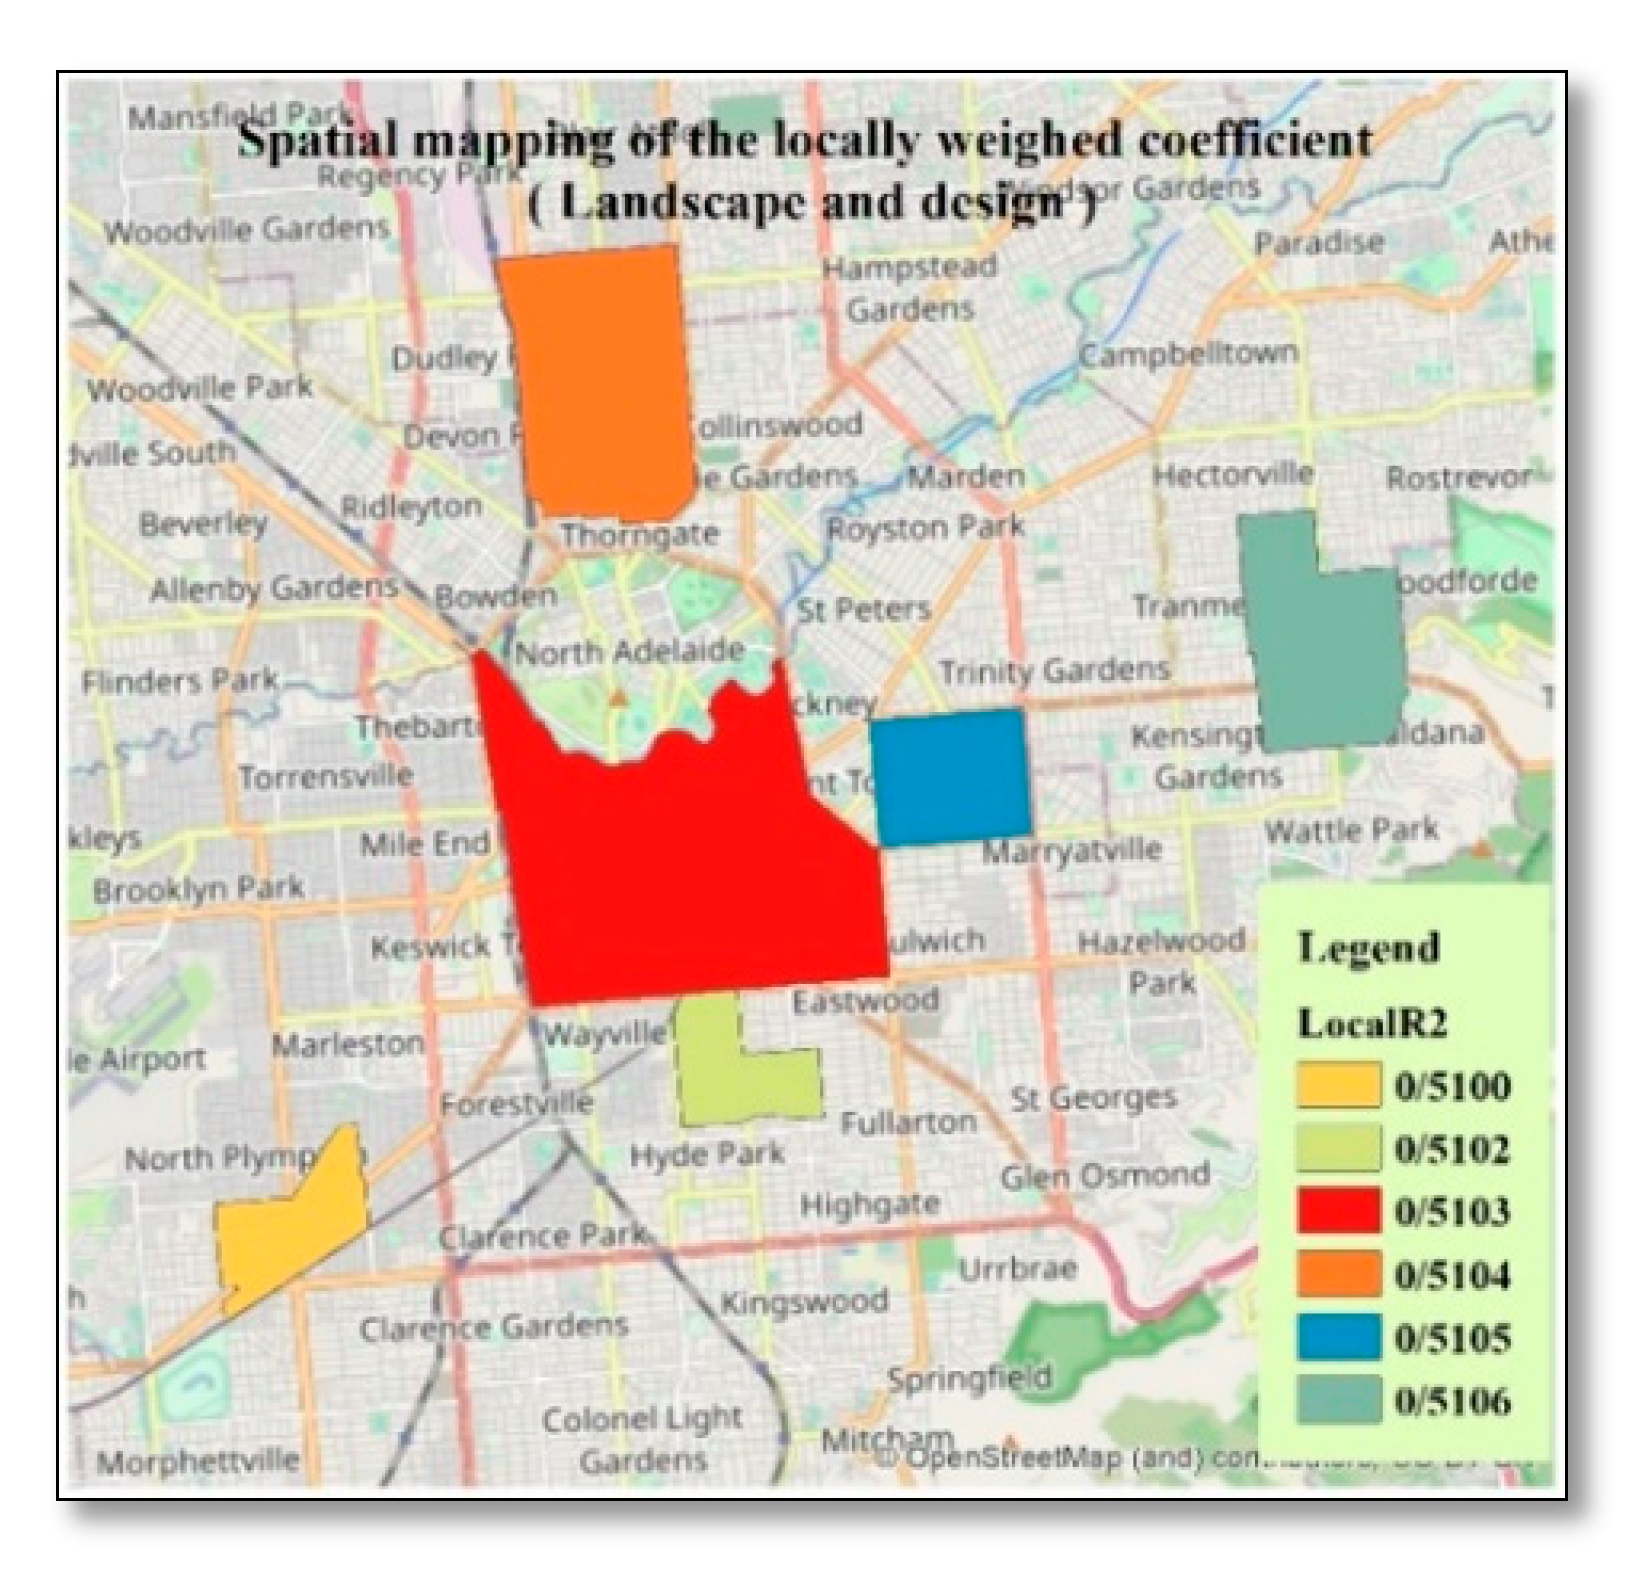
According to Figure 8, regarding the biodiversity and vegetation domain, there is a positive relationship between the favourability and sustainability of the biodiversity and vegetation criteria and the overall ranking of ecological sustainability (dependent variable) in the suburbs of Plympton (with a local R2 of 0.86) and Unley (with a local R2 of 0.48). Therefore, in the studied suburbs, the criteria for the biodiversity and vegetation domain were the most effective criteria for promoting ecological sustainability by UGS planning compared to the other suburbs. Also, the analysis of the GWR for the landscape and design domain indicated (Figure 9) that the value of the local R2 in all studied suburbs was almost the same, and with a value close to and above 0.5, it affects the dependent variable (the ecological sustainability of the studied suburbs). Therefore, there are not any differences between the suburbs in relation to the influence of the landscape and design domain criteria on ecological sustainability.
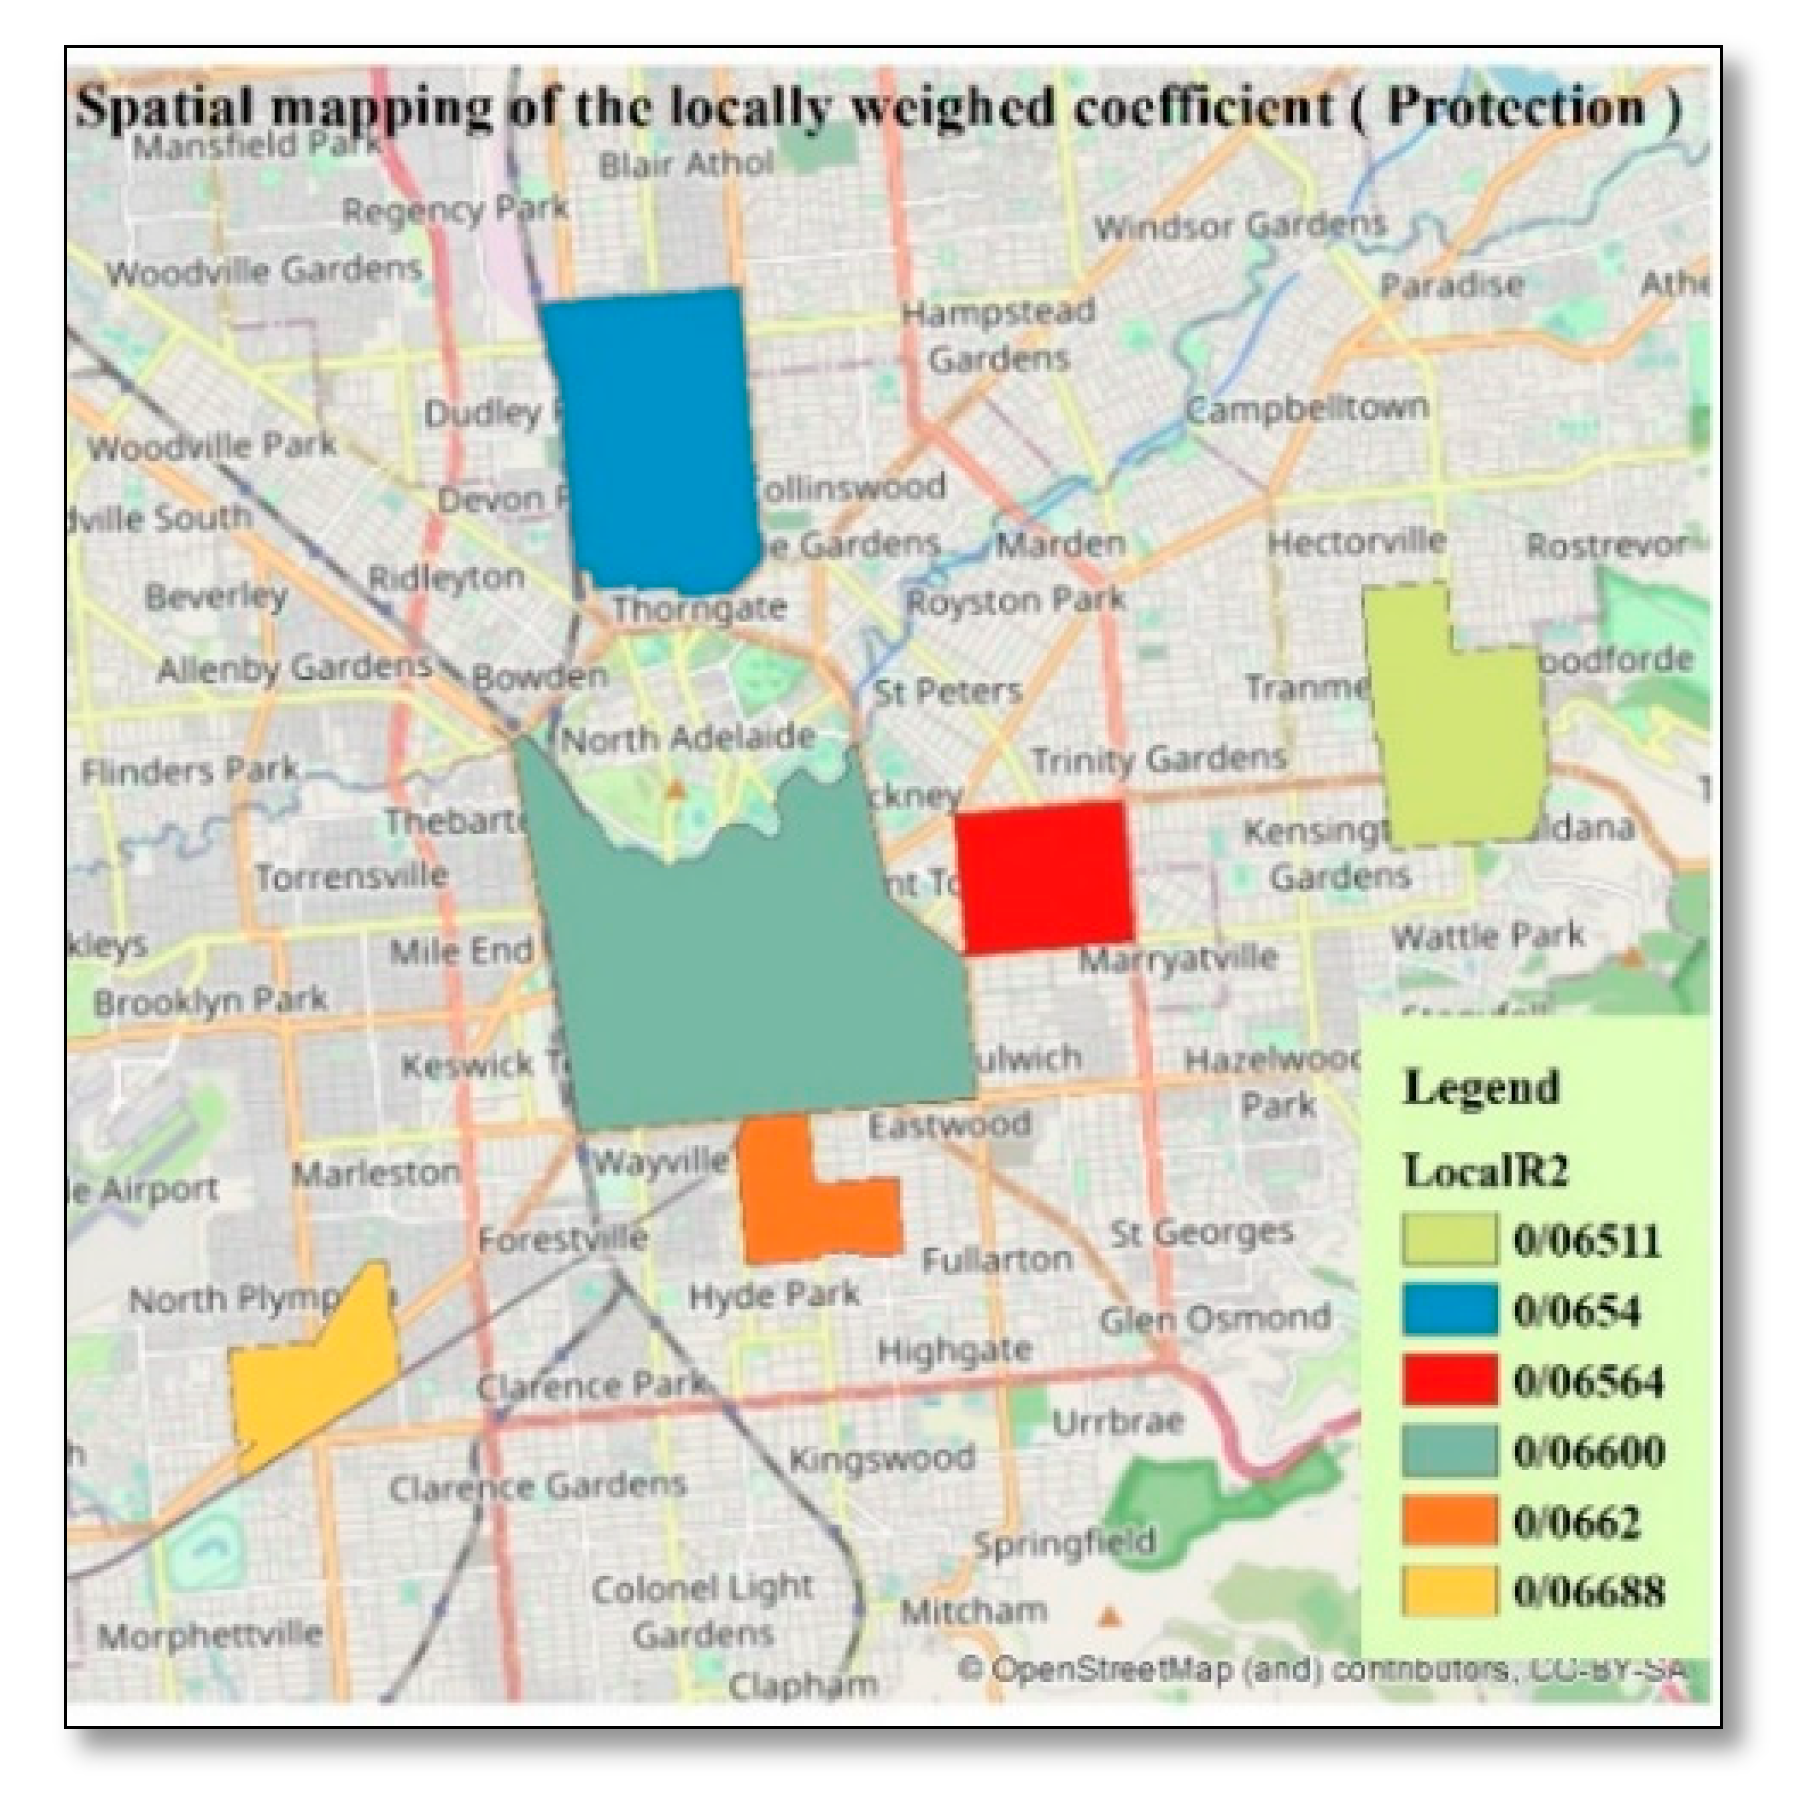
Regarding the effects of the domains of protection (Figure 10), water resources (Figure 11), and planning for ecological networks (Figure 12), the results of the GWR show that the effects of these domains on the ecological sustainability of the studied suburbs are less than the biodiversity and the landscape and design domains. Thus, it can be said that the criteria in the domains of protection, water resources, and planning for ecological networks have a relatively lower impact on the process of ecological sustainability in the case studies.
Table 10 presents GWR analysis results for all ecological sustainability domain.

3.3. Experts Interview

According to the household survey results, among the ecological criteria, three criteria including water resources, protection, and planning for ecological networks scored below the standard average. Therefore, to identify solutions for improving these aspects and enhancing the ecological sustainability role of green spaces, interviews with local experts were conducted.
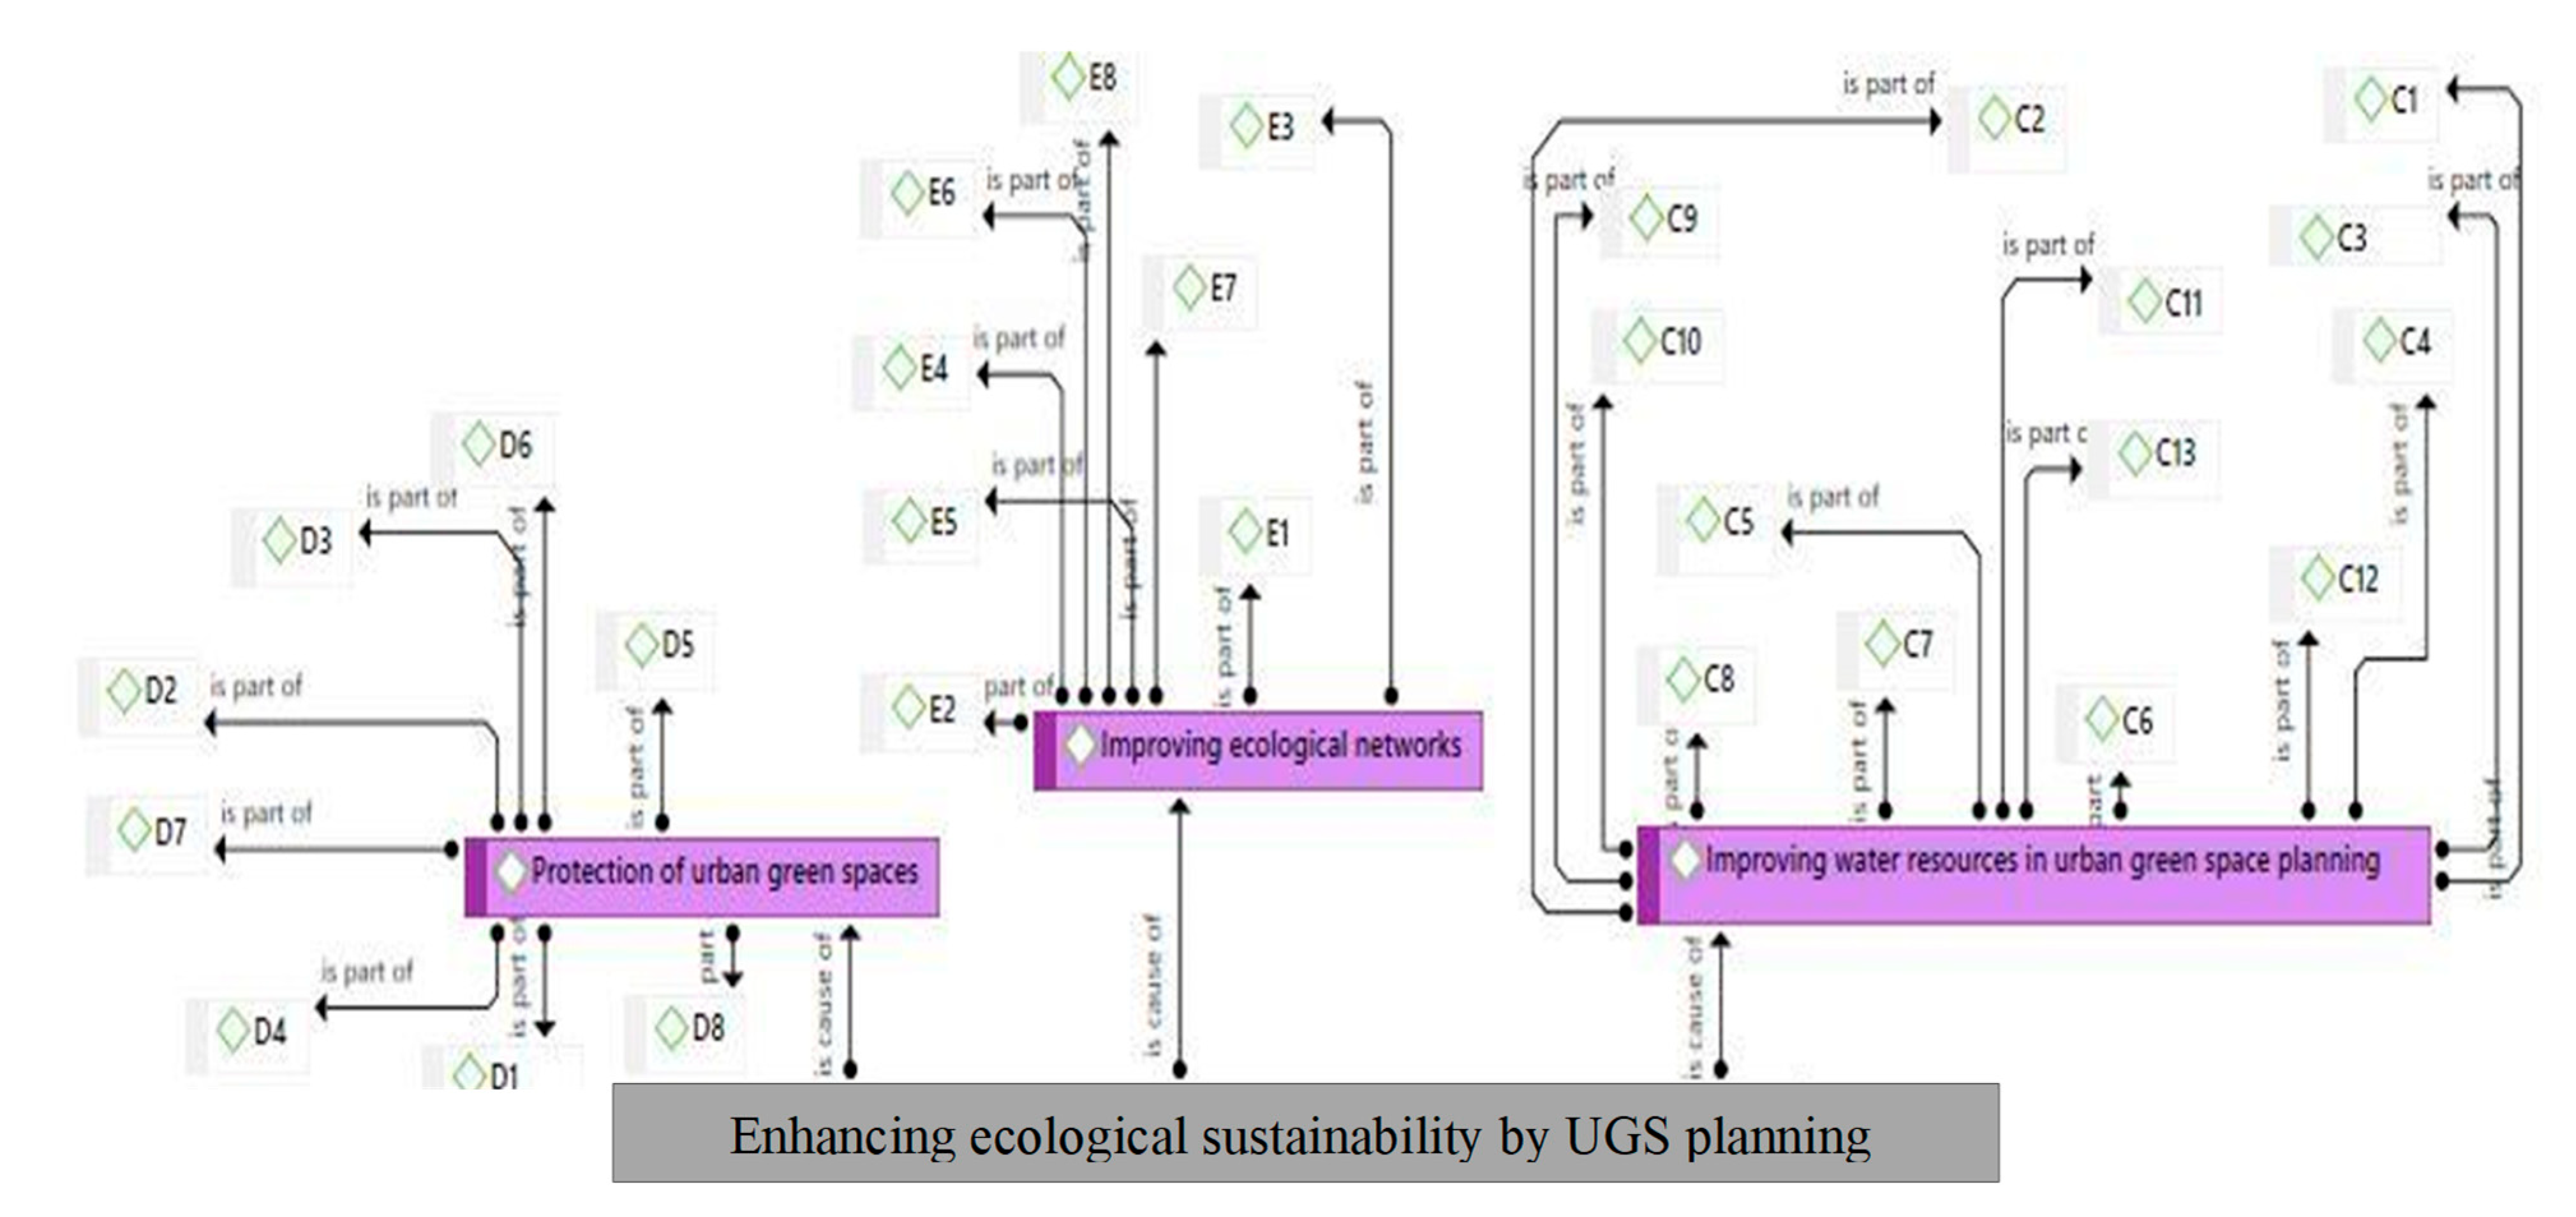
According to Figure 13, the three criteria shown in purple share a common goal: enhancing ecological sustainability through UGS planning. The tree diagram illustrates three main categories within the UGS planning system, connected by arrows labelled Cause Of. These indicate causal relationships among the categories. Each of the three main categories also includes subcategories, derived from expert interview transcripts. These subcategories represent strategies or solutions intended to improve the quality of the corresponding factors and are linked to their parent categories by arrows labelled Part Of. The subcategory codes used in Figure 13 represent detailed criteria under three major domains of ecological sustainability in urban green space (UGS) planning. Codes D1–D8 correspond to strategies for the protection of urban green spaces. Codes E1–E8 refer to actions aimed at improving ecological networks. Finally, codes C1–C13 denote strategies for improving water resources in UGS planning. These codes provide a systematic breakdown of the ecological functions that contribute to enhancing sustainability in UGS planning. The entire structure of the tree diagram, developed through qualitative analysis of expert interviews, demonstrates the connections between categories, subcategories, and the overarching research goal. Each code in the diagram represents a guideline for optimal UGS planning to support sustainable green space development.
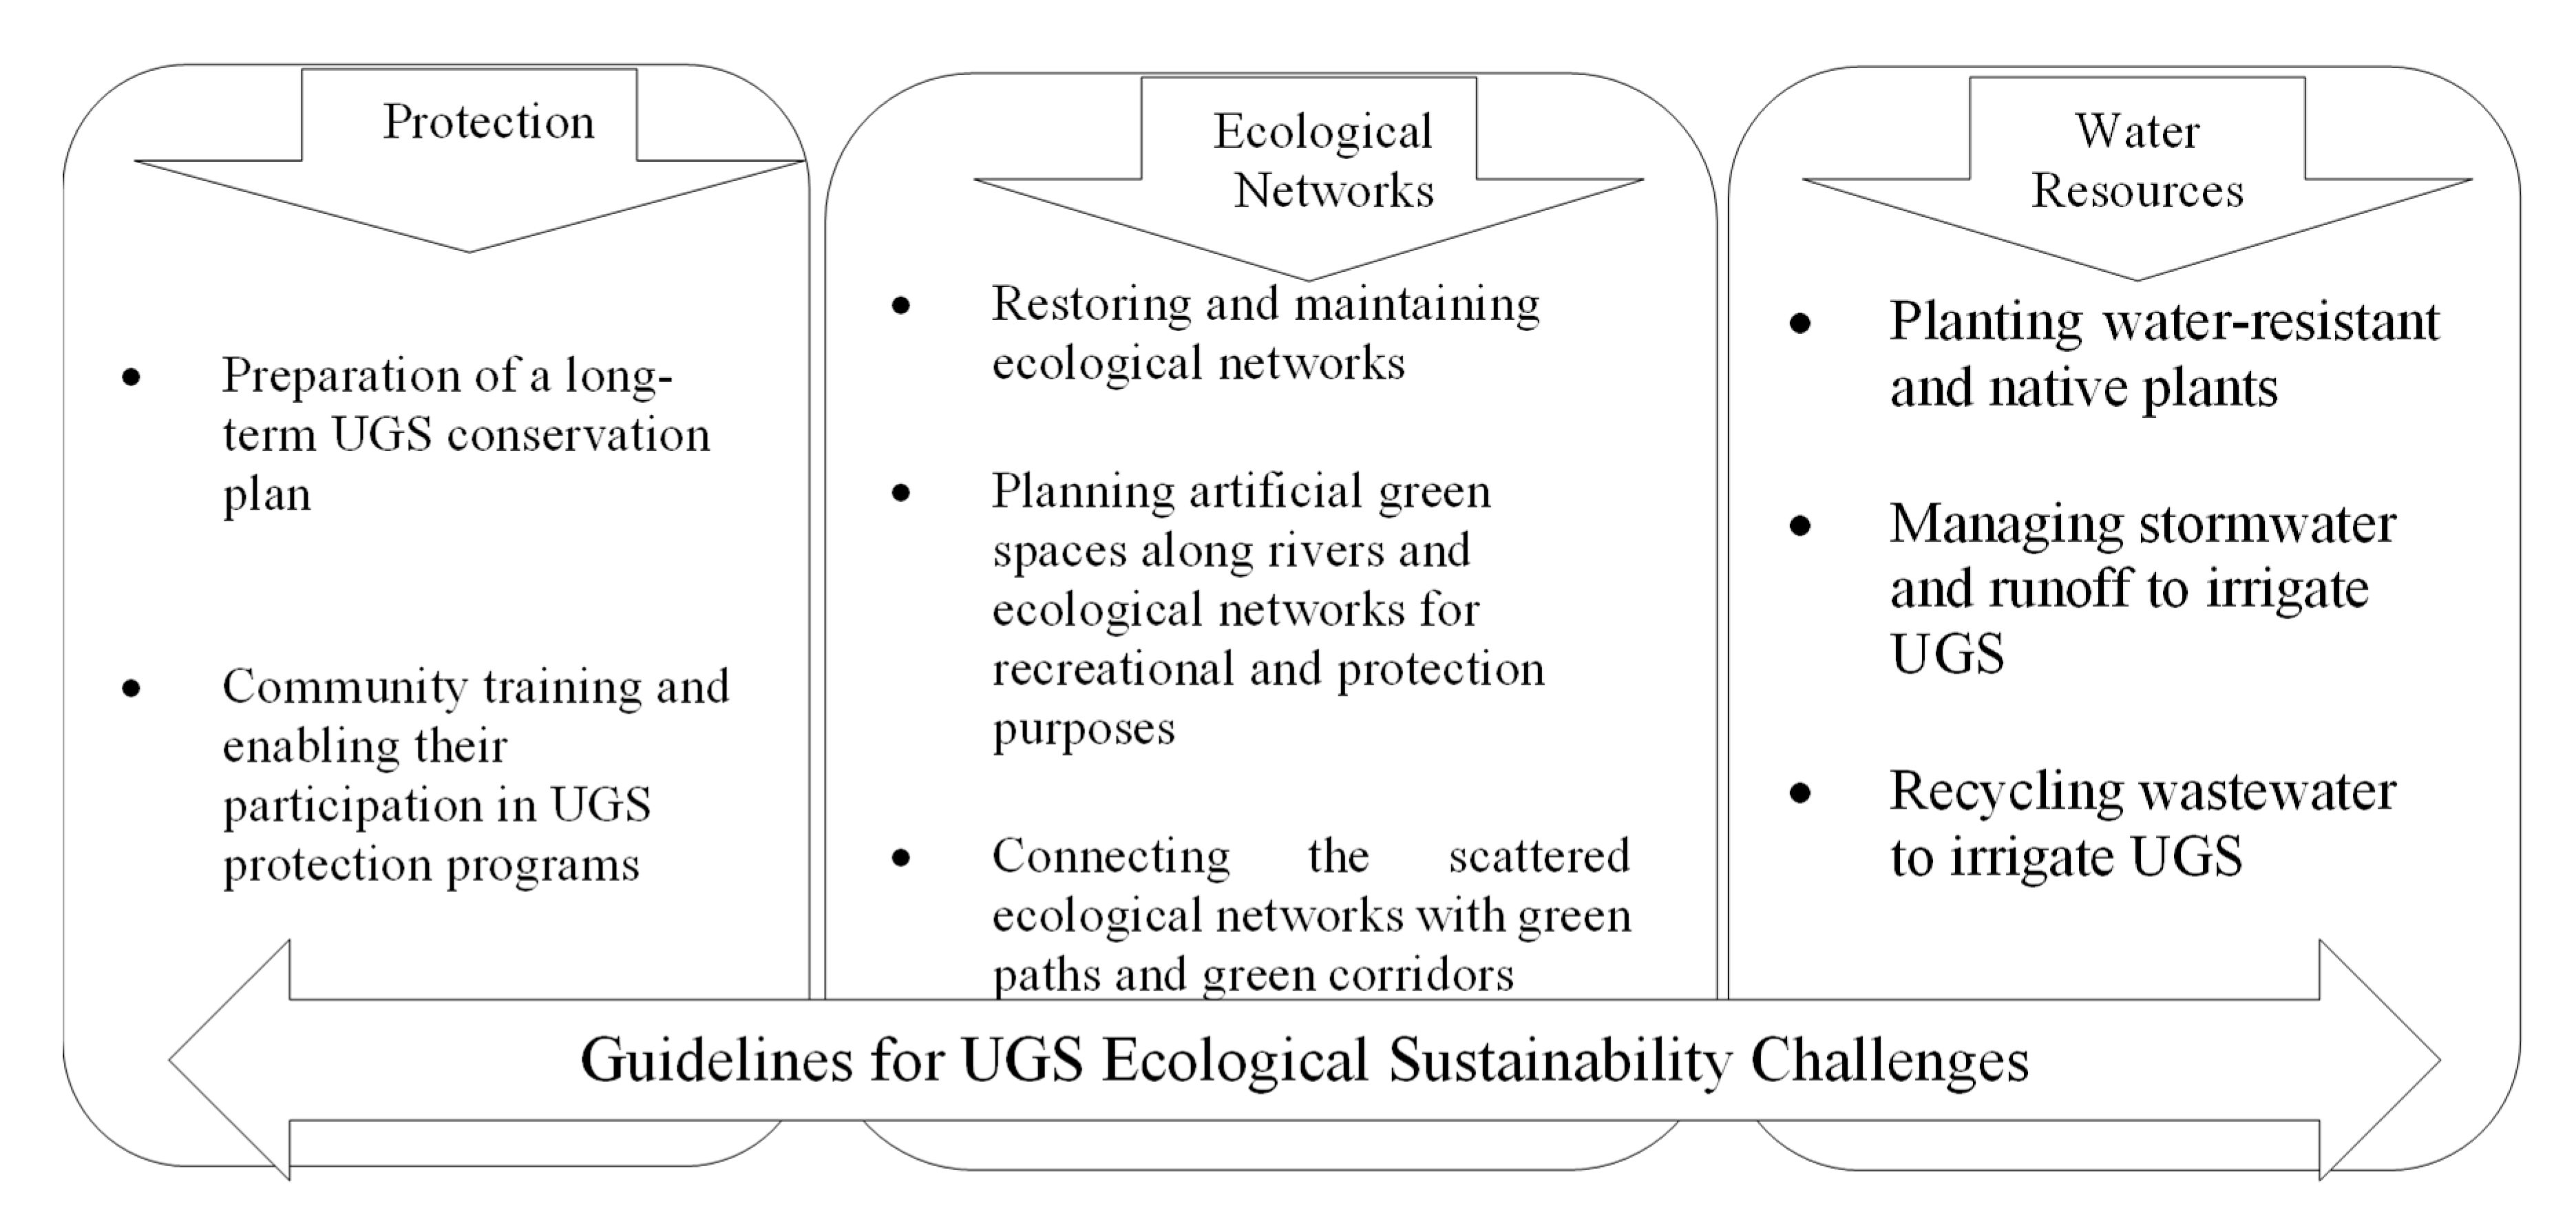
As shown in Figure 14, stakeholders identified several policies to address water resource challenges in urban green space (UGS) development. This includes planting native and drought-resistant species, managing stormwater, and recycling wastewater for irrigation to ensure sustainable water use. In terms of UGS protection, another key ecological challenge, collaboration among the public and stakeholders at the neighbourhood, local, and state levels is essential. Recommended strategies include developing long-term conservation plans (e.g., a green space master plan) and promoting community training and participation in UGS protection initiatives. Lastly, addressing the planning challenges of ecological networks across the case study suburbs requires professional landscape and green space management. Interviewees emphasised that restoring, maintaining, and enhancing connectivity between fragmented ecological networks, particularly through the integration of green spaces along these corridors, will contribute to creating a greener and more sustainable urban environment.

4. Discussion

Green space planning interventions have been validated as one of the best solutions to improve the environmental conditions of the cities which are struggling with rapid urbanisation consequences [81,82]. Therefore, comprehensive UGS planning, by providing a range of ecological benefits, holds the potential to maintain the health of local ecosystems and support the overall sustainability of the built environment.
The findings of this study emphasise the importance of ecological sustainability criteria that should be considered in UGS planning to enhance ecological sustainability of the residential areas at the neighbourhood level. Therefore, theoretically, this study contributes to the existing body of knowledge by identifying and evaluating key ecological sustainability criteria specifically within the context of urban green spaces (UGSs). By analysing these criteria through a structured household survey and comparative suburb-level assessment, this study provides a framework that can guide future empirical research in urban ecology and planning. This contributes to filling a gap in the literature where measurable, place-based ecological planning principles have been underexplored.
Practically, the findings of this study offer evidence-based insights that can inform urban planning and green space development policies. Urban planners, policymakers, and environmental agencies can use the identified criteria and suburb comparisons to improve the ecological performance of UGS. The study’s implications for practice include:
  • Supporting data-driven, context-specific planning and design of green spaces;
  • Informing local governments on where to prioritise ecological improvements in UGS;
  • Enhancing community resilience through more sustainable urban ecosystems.
The study offers a comprehensive analysis of the household survey findings by identifying and explaining the performance of specific ecological sustainability criteria. It also incorporated a suburb-level analysis to highlight spatial differences in ecological performance and discussed how these differences can inform targeted planning interventions. Furthermore, the results of both the multiple linear regression and geographically weighted regression (GWR) analyses have been interpreted in detail, with specific attention to domains such as landscape and design, biodiversity, and vegetation influencing ecological sustainability across the case study suburbs.
The analysis highlights that protection is the most influential criterion in maximising the ecological benefits of urban green spaces (UGSs) to enhance ecological sustainability. Despite increasing urbanisation, sprawl, and construction, the preservation of green cover and urban nature must remain a core priority in urban and green space planning. This aligns with prior research emphasising the necessity of maintaining green infrastructure to support urban biodiversity, liveability, and environmental health [38,39]. Planning must therefore focus on protecting these assets through coordinated efforts from local and state governments and communities.
Reviving ecological networks emerged as the most underperforming ecological criterion according to the household survey. Ecological corridors are vital for the movement and survival of plant and animal species and contribute to maintaining the dynamic natural structure of urban environments [38,39]. Strengthening these networks by aligning UGS planning with ecological infrastructure has proven effective in cities such as Zurich and Munich. This integration ensures not only ecological connectivity but also fosters a more resilient urban fabric [83].
Water resource management for irrigating UGS was another ecological criterion scoring below average. Given the extent of green spaces in the study suburbs and declining rainfall trends, a key limitation in UGS expansion is the availability of sustainable water sources. Effective strategies such as wastewater recycling and rainwater harvesting are essential to support these areas. Sustainable water management is critical not only for the maintenance of green spaces but also for climate regulation and enhancing public space quality, which are core aspects of a liveable city.
The protection of urban parks and green spaces also received a relatively low score, reinforcing the importance of regulatory frameworks and community-based stewardship to safeguard these spaces. As public awareness of the benefits of UGS grows, ensuring long-term preservation through policy and participatory governance becomes increasingly crucial.
Among the ecological domains, landscape and design demonstrated the strongest correlation with ecologically sustainable development (r = 0.508), as revealed by a multiple linear regression analysis. This finding indicates that thoughtful spatial design, incorporating natural forms, climate adaptation, and population density considerations, plays a pivotal role in enhancing ecological sustainability. These results align with Hunter et al. [84], who argue that assessing UGS design and layout can significantly influence both environmental and social health outcomes.
To ensure effective green space planning, emphasis should be placed on landscape and design criteria, such as aligning form with natural features, designing for demographic needs, and adapting to climatic conditions. Prioritising these in planning processes can contribute to more resilient and liveable neighbourhoods while strengthening the overall ecological performance of urban areas.
Spatial analysis using geographically weighted regression (GWR) provided further insights by identifying biodiversity and vegetation as the most effective criteria in promoting ecological sustainability, particularly in the suburbs of Plympton and Unley. The uniform effectiveness of landscape and design criteria across all case study suburbs further reinforces their critical role in UGS planning. In contrast, the domains of protection, water resources, and ecological networks showed relatively lower impacts on ecological sustainability within the case study areas.
These spatially differentiated findings enable planners to tailor green space strategies to local needs. For example, in Plympton and Unley, biodiversity enhancement and vegetation planning should be prioritised. This aligns with Cao et al. [85], who advocate for value-based UGS development that balances ecological goals with urban growth. By integrating ecological criteria with spatial planning, decision-makers can implement targeted interventions to improve ecosystem services and promote equitable access to green infrastructure. Therefore, by identifying both strengths and challenges across ecological criteria and domains, this study provides a practical basis for strategic UGS planning. To promote the ecological value of UGS and enhance urban sustainability, planning and design interventions must address key challenges. Expert interviews were conducted to develop guidelines and policies targeting these challenges. The findings highlight prioritising policies for protection, ecological connectivity, and sustainable water use can significantly improve ecological sustainability in urban areas.

5. Conclusions

In response to escalating population density, prioritising UGS planning guided by the most important ecological criteria can be considered as a vital policy initiative for enhancing urban sustainability.
In this study, the ecological sustainability criteria identified in previous research were evaluated in six suburbs in the Adelaide Metropolitan Area. The results of this study revealed challenges in certain aspects of the UGS planning despite a high UGS per capita in the studied suburbs, impacting the ecological sustainability of the Adelaide Metropolitan Area.
According to the household survey results, among the ecological sustainability criteria, the three criteria of water resources, protection, and reviving ecological networks were identified as the criteria requiring more effective planning programs to enhance the ecological sustainability impacts of green spaces. The water resources criterion requires efficient actions by relevant authorities to properly manage the current water resources, including wastewater and recycled water management, to have sustainable water resources for green space development. In addition, the factor of protection is another problematic ecological factor that requires more attention from the relevant stakeholders at the neighbourhood, local, and state levels to preserve green cover. Ecological networks, a third criterion which faced challenges throughout the sample suburbs, need professional planning and organising interventions by the planners, landscapers, and green space planning authorities.
The primary aim of this study was to identify challenges and barriers to ecological sustainability through UGS planning using a case study approach. Consequently, the study provides practical insights for planners and policy makers to improve the overall ecological impacts of UGS planning for promoting urban sustainability.
The results of this research can guide future studies by encouraging the application of similar frameworks in different urban contexts or by integrating them with spatial analysis tools such as GIS for more comprehensive urban sustainability planning. This study focused on the potential of UGS to enhance ecological sustainability at the neighbourhood level. However, ecological sustainability status and criteria may vary depending on regional climate and socio-economic conditions. Therefore, further research is needed to evaluate ecological sustainability through UGS planning at a regional scale. Additionally, future studies are encouraged to explore and address various criteria across different urban dimensions beyond UGS to achieve broader urban environmental and ecological sustainability. Furthermore, investigating key criteria related to social and economic sustainability is recommended for future research to ensure a more comprehensive understanding of sustainability across all its dimensions.
This study faced some limitations, including the impact of COVID-19 restrictions, which reduced the number of participants and prolonged the data collection process. Additionally, the unique urban planning system in Adelaide may limit the generalisability of the findings to cities with different planning frameworks. However, the results remain relevant and applicable, especially to other Australian cities with similar urban planning contexts.

Author Contributions

R.T.: Conceptualisation, investigation, methodology, data curation, writing original draft. S.K.: Writing, methodology, review and editing, supervision. A.S.: Supervision, validation, editing, resources. N.G.: Supervision and final editing. All authors have read and agreed to the published version of the manuscript.

Funding

This research received no external funding.

Institutional Review Board Statement

The study was approved by the University of South Australia Human Research Ethics Committee (UniSA HREC) (202773) on 3 February 2020.

Informed Consent Statement

Informed consent was obtained from all subjects involved in the study.

Data Availability Statement

The original contributions presented in this study are included in the article. Further inquiries can be directed to the corresponding author.

Conflicts of Interest

The authors declare no conflicts of interest.

References

  1. Arshad, S.; Ahmad, S.R.; Abbas, S.; Asharf, A.; Siddiqui, N.A.; ul Islam, Z. Quantifying the contribution of diminishing green spaces and urban sprawl to urban heat island effect in a rapidly urbanizing metropolitan city of Pakistan. Land Use Policy 2022, 113, 105874. [Google Scholar] [CrossRef]
  2. García-Ayllón, S. Rapid development as a factor of imbalance in urban growth of cities in Latin America: A perspective based on territorial indicators. Habitat Int. 2016, 58, 127–142. [Google Scholar] [CrossRef]
  3. Haas, J.; Ban, Y. Urban growth and environmental impacts in jing-jin-ji, the yangtze, river delta and the pearl river delta. Int. J. Appl. Earth Obs. Geoinf. 2014, 30, 42–55. [Google Scholar] [CrossRef]
  4. Zenouzi, A.S.; Yenneti, K.; Teimouri, R.; Abbasiyan, F.; Palme, M. Analysis of changes in vegetation index during the rapid urban spatial development period (1990–2020) in Tehran metropolis, Iran. Atmosphere 2022, 13, 2010. [Google Scholar] [CrossRef]
  5. Dinda, S.; Chatterjee, N.D.; Ghosh, S. An integrated simulation approach to the assessment of urban growth pattern and loss in urban green space in Kolkata, India: A GIS-based analysis. Ecol. Indic. 2021, 121, 107178. [Google Scholar] [CrossRef]
  6. Olad Ghaffari, P.; Monavari, S.M. Physical development trend and green space destruction in developing cities: A GIS approach. Environ. Dev. Sustain. 2013, 15, 167–175. [Google Scholar] [CrossRef]
  7. Trinder, J.; Liu, Q. Assessing environmental impacts of urban growth using remote sensing. Geo-Spat. Inf. Sci. 2020, 23, 20–39. [Google Scholar] [CrossRef]
  8. Feng, L.; Mi, X.; Yuan, D. Optimal planning of urban greening system in response to urban microenvironments in a high-density city using genetic algorithm: A case study of Tianjin. Sustain. Cities Soc. 2022, 87, 104244. [Google Scholar] [CrossRef]
  9. Maheng, D.; Ducton, I.; Lauwaet, D.; Zevenbergen, C.; Pathirana, A. The Sensitivity of Urban Heat Island to Urban Green Space—A Model-Based Study of City of Colombo, Sri Lanka. Atmosphere 2019, 10, 151. [Google Scholar] [CrossRef]
  10. Mukherjee, M.; Takara, K. Urban green space as a countermeasure to increasing urban risk and the UGS-3CC resilience framework. Int. J. Disaster Risk Reduct. 2018, 28, 854–861. [Google Scholar] [CrossRef]
  11. Wang, X.; Meng, Q.; Zhang, L.; Hu, D. Evaluation of urban green space in terms of thermal environmental benefits using geographical detector analysis. Int. J. Appl. Earth Obs. Geoinf. 2021, 105, 102610. [Google Scholar] [CrossRef]
  12. Yoong, H.Q.; Lim, K.Y.; Lee, L.K.; Zakaria, N.A.; Foo, K.Y. Sustainable urban green space management practice. In Proceedings of the International Malaysia-Indonesia-Thailand Symposium on Innovation and Creativity (iMIT-SIC), Arau, Malaysia, 26–27 July 2017; pp. 1–4. [Google Scholar]
  13. Peng, J.; Wang, Y.; Wu, J.; Shen, H.; Pan, Y. Research progress on evaluation frameworks of regional ecological sustainability. Chin. Geogr. Sci. 2011, 21, 496–510. [Google Scholar] [CrossRef]
  14. Van Oijstaeijen, W.; Van Passel, S.; Cools, J. Urban green infrastructure: A review on valuation toolkits from an urban planning perspective. J. Environ. Manag. 2020, 267, 110603. [Google Scholar] [CrossRef]
  15. Aronson, M.F.; Lepczyk, C.A.; Evans, K.L.; Goddard, M.A.; Lerman, S.B.; MacIvor, J.S.; Nilon, C.H.; Vargo, T. Biodiversity in the city: Key challenges for urban green space management. Front. Ecol. Environ. 2017, 15, 189–196. [Google Scholar] [CrossRef]
  16. Tian, Y.; Jim, C.Y.; Wang, H. Assessing the landscape and ecological quality of urban green spaces in a compact city. Landsc. Urban Plan. 2014, 121, 97–108. [Google Scholar] [CrossRef]
  17. Chan, K.M.; Vu, T.T. A landscape ecological perspective of the impacts of urbanization on urban green spaces in the Klang Valley. Appl. Geogr. 2017, 85, 89–100. [Google Scholar] [CrossRef]
  18. Cobbinah, P.B.; Nyame, V. A city on the edge: The political ecology of urban green space. Environ. Urban. 2021, 33, 413–435. [Google Scholar] [CrossRef]
  19. Burton, P. The Australian good life: The fraying of a suburban template. Built Environ. 2015, 41, 504–518. [Google Scholar] [CrossRef]
  20. Australian Bureau of Statistics, 2017. Available online: https://www.abs.gov.au/statistics (accessed on 18 August 2023).
  21. Joshi, A.; Kale, S.; Chandel, S.; Pal, D.K. Likert scale: Explored and explained. Br. J. Appl. Sci. Technol. 2015, 7, 396–403. [Google Scholar] [CrossRef]
  22. Bland, J.M.; Altman, D.G. Statistics notes: Cronbach’s alpha. BMJ 1997, 314, 572. [Google Scholar] [CrossRef]
  23. Sandelowski, M. Combining qualitative and quantitative sampling, data collection, and analysis techniques in mixed—Method studies. Res. Nurs. Health 2000, 23, 246–255. [Google Scholar] [CrossRef]
  24. Saunders, B.; Sim, J.; Kingstone, T.; Baker, S.; Waterfield, J.; Bartlam, B.; Burroughs, H.; Jinks, C. Saturation in qualitative research: Exploring its conceptualization and operationalization. Qual. Quant. 2018, 52, 1893–1907. [Google Scholar] [CrossRef]
  25. Ronzani, C.M.; da Costa, P.R.; da Silva, L.F.; Pigola, A.; de Paiva, E.M. Qualitative methods of analysis: An example of Atlas. TI™ Software usage. Rev. Gestão Tecnol. 2020, 20, 284–311. [Google Scholar] [CrossRef]
  26. Teimouri, R.; Karuppannan, S.; Sivam, A.; Gu, N.; Yenneti, K. Exploring International Perspective on Factors Affecting Urban Socio-Ecological Sustainability by Green Space Planning. Sustainability 2023, 15, 14169. [Google Scholar] [CrossRef]
  27. Davern, M.; Farrar, A.; Kendal, D.; Giles-Corti, B. Quality Green Space Supporting Health, Wellbeing and Biodiversity: A Literature Review, National Heart Foundation 2017; University of Melbourne: Melbourne, Australia, 2017. [Google Scholar]
  28. Kong, F.; Yin, H.; Nakagoshi, N.; Zong, Y. Urban green space network development for biodiversity conservation: Identification based on graph theory and gravity modeling. Landsc. Urban Plan. 2010, 95, 16–27. [Google Scholar] [CrossRef]
  29. Rubino, M.J.; Hess, G.R. Planning open spaces for wildlife 2: Modeling and verifying focal species habitat. Landsc. Urban Plan. 2003, 64, 89–104. [Google Scholar] [CrossRef]
  30. Baruch, Z.; Liddicoat, C.; Cando-Dumancela, C.; Laws, M.; Morelli, H.; Weinstein, P.; Young, J.M.; Breed, M.F. Increased plant species richness associates with greater soil bacterial diversity in urban green spaces’. Environ. Res. 2021, 196, 110425. [Google Scholar] [CrossRef]
  31. Bilgili, B.C.; Gökyer, E. Urban green space system planning. In Landscape Planning 2012; Ozyavuz, M., Ed.; InTech: Rijeka, Croatia, 2012; pp. 107–121. [Google Scholar]
  32. Onder, S. Water-saving opportunities in urban green space applications. In Proceedings of the International Multidisciplinary Scientific GeoConference: SGEM 2010, Albena, Bulgaria, 20–26 June 2010; Volume 2, p. 859. [Google Scholar]
  33. Asteria, D.; Brotosusilo, A.; Soedrajad, M.R.; Nugraha, F.N. Environmental preservation and sustainability of natural resources through traditional adat value (Study case Kampung Naga, West Jawa). IOP Conf. Ser. Earth Environ. Sci. 2021, 716, 012051. [Google Scholar] [CrossRef]
  34. Zhang, J.; Yu, Z.; Cheng, Y.; Chen, C.; Wan, Y.; Zhao, B.; Vejre, H. Evaluating the disparities in urban green space provision in communities with diverse built environments: The case of a rapidly urbanizing Chinese city. Build. Environ. 2020, 183, 107170. [Google Scholar] [CrossRef]
  35. Minelli, A.; Minelli, M.; Pasini, I. Green space irrigation: Reuse of rainwater and use of wastewaters-some Italian examples. In Proceedings of the XXVIII International Horticultural Congress on Science and Horticulture for People (IHC2010): International Symposium on Citrus, Bananas and other Tropical Fruits under Subtropical Conditions, Lisborn, Portugal, 22–27 August 2010; pp. 75–82. [Google Scholar] [CrossRef]
  36. Saeedi, I.; Goodarzi, M. Rainwater harvesting system: A sustainable method for landscape development in semiarid regions, the case of Malayer University campus in Iran. Environ. Dev. Sustain. 2020, 22, 1579–1598. [Google Scholar] [CrossRef]
  37. Rahman, M.S.; Hasan, A.K.M.M.; Rahman, M.; Meghla, N.T.; Islam, M.A. Investigation of the household waste generation and wastewater management techniques in Bogra municipal area. J. Environ. Sci. Nat. Resour. 2016, 9, 123–126. [Google Scholar] [CrossRef]
  38. Li, H.; Chen, W.; He, W. Planning of green space ecological network in urban areas: An example of Nanchang, China. Int. J. Environ. Res. Public Health 2015, 12, 12889–12904. [Google Scholar] [CrossRef]
  39. Jongman, R. Ecological networks are an issue for all of us. J. Landsc. Ecol. 2008, 1, 7–13. [Google Scholar] [CrossRef]
  40. Ziaesaeidi, P.; Cushing, D.F. The social sustainability of neighbourhood-schools: A qualitative study with Iranian children and youth about their neighbourhood perceptions. Local Environ. 2019, 24, 1178–1196. [Google Scholar] [CrossRef]
  41. Aram, F.; García, E.H.; Solgi, E.; Mansournia, S. Urban green space cooling effect in cities. Heliyon 2019, 5, e01339. [Google Scholar] [CrossRef]
  42. Graça, M.; Cruz, S.; Monteiro, A.; Neset, T.S. Designing urban green spaces for climate adaptation: A critical review of research outputs. Urban Clim. 2022, 42, 101126. [Google Scholar] [CrossRef]
  43. Sun, S.; Xu, X.; Lao, Z.; Liu, W.; Li, Z.; García, E.H.; He, L.; Zhu, J. Evaluating the impact of urban green space and landscape design parameters on thermal comfort in hot summer by numerical simulation. Build. Environ. 2017, 123, 277–288. [Google Scholar] [CrossRef]
  44. Chen, B.; Adimo, O.A.; Bao, Z. Assessment of aesthetic quality and multiple functions of urban green space from the users’ perspective: The case of Hangzhou Flower Garden, China. Landsc. Urban Plan. 2009, 93, 76–82. [Google Scholar] [CrossRef]
  45. Jahani, A.; Fazel, A.M. Aesthetic quality modeling of landscape in urban green space using artificial neural network. J. Nat. Environ. 2016, 69, 951–963. [Google Scholar]
  46. Wolch, J.R.; Byrne, J.; Newell, J.P. Urban green space, public health, and environmental justice: The challenge of making cities ‘just green enough’. Landsc. Urban Plan. 2014, 125, 234–244. [Google Scholar] [CrossRef]
  47. Yilmaz, S.; Mumcu, S. Urban green areas and design principles. In Environmental Sustainability and Landscape Management; St. Kliment Ohridski University Press: Sofia, Bulgaria, 2016; pp. 100–118. [Google Scholar]
  48. Jutz, F.; Andanson, J.M.; Baiker, A. A green pathway for hydrogenations on ionic liquid-stabilized nanoparticles. J. Catal. 2009, 268, 356–366. [Google Scholar] [CrossRef]
  49. Verma, P. Awareness and introduction in Greenway, with benefit and planned greenway planning strategies. Int. J. Adv. Res. Ideas Innov. Technol 2018, 4, 577–582. [Google Scholar]
  50. Massoni, E.S.; Barton, D.N.; Rusch, G.M.; Gundersen, V. Bigger, more diverse and better? Mapping structural diversity and its recreational value in urban green spaces. Ecosyst. Serv. 2018, 31, 502–516. [Google Scholar] [CrossRef]
  51. Werquin, A.C.; Duhem, B.; Lindholm, G.; Oppermann, B.; Pauleit, S.; Tjallingii, S.; Attwell, K. Green Structure and Urban Planning: Final Report; Cost Action 2005, C (Vol. 11); [Online]; European Commission: Brussels, Belgium, 2005. [Google Scholar]
  52. Teimouri, R.; Karuppannan, S.; Sivam, A.; Gu, N. Key ecological factors of Urban Green Space (UGS) planning for sustainable cities. In Proceedings of the 10th State of Australasian Cities National Conference 2022, Melbourne, Australia, 1–3 December 2021. [Google Scholar]
  53. Threlfall, C.G.; Ossola, A.; Hahs, A.K.; Williams, N.S.; Wilson, L.; Livesley, S.J. Variation in vegetation structure and composition across urban green space types’. Front. Ecol. Evol. 2016, 4, 66. [Google Scholar] [CrossRef]
  54. Du, X.; Zhang, X.; Wang, H.; Zhi, X.; Huang, J. Assessing green space potential accessibility through urban artificial building data in Nanjing, China. Sustainability 2020, 12, 9935. [Google Scholar] [CrossRef]
  55. Zeunert, J. Urban agriculture up-scaled: Economically and socially productive public green space. In Sustainable Urban Agriculture and Food Planning; Routledge: London, UK, 2016; pp. 121–139. [Google Scholar]
  56. McCammon, T.A. Water-Conserving Landscapes: An Evaluation of Landscape Drought Response and Homeowner Preference; Utah State University: Logan, UT, USA, 2006. [Google Scholar]
  57. Rodenburg, J.; Both, J.; Heitkönig, I.M.; Van Koppen, C.S.A.; Sinsin, B.; Van Mele, P.; Kiepe, P. Land use and biodiversity in unprotected landscapes: The case of noncultivated plant use and management by rural communities in Benin and Togo. Soc. Nat. Resour. 2012, 25, 1221–1240. [Google Scholar] [CrossRef]
  58. Elmqvist, T.; Fragkias, M.; Goodness, J.; Güneralp, B.; Marcotullio, P.J.; McDonald, R.I.; Wilkinson, C. Urbanization, Biodiversity and Ecosystem Services: Challenges and Opportunities: A Global Assessment; Springer Nature: Dordrecht, The Netherlands; Berlin/Heidelberg, Germany; New York, NY, USA, 2013; p. 755. [Google Scholar]
  59. Strohbach, M.W.; Arnold, E.; Haase, D. The carbon footprint of urban green space—A life cycle approach. Landsc. Urban Plan. 2012, 104, 220–229. [Google Scholar] [CrossRef]
  60. Cetin, M. Using GIS analysis to assess urban green space in terms of accessibility: Case study in Kutahya’. Int. J. Sustain. Dev. World Ecol. 2015, 22, 420–424. [Google Scholar] [CrossRef]
  61. Jim, C.Y. Green-space preservation and allocation for sustainable greening of compact cities. Cities 2004, 21, 311–320. [Google Scholar] [CrossRef]
  62. Guo, J.; Niu, H.; Xiao, D.; Sun, X.; Fan, L. Urban green-space water-consumption characteristics and its driving factors in China. Ecol. Indic. 2021, 130, 108076. [Google Scholar] [CrossRef]
  63. Zhao, Q.J.; Wen, Z.M. Integrative networks of complex social-ecological systems. Procedia Environ. Sci. 2012, 13, 1383–1394. [Google Scholar] [CrossRef]
  64. Dizdaroglu, D.; Yigitcanlar, T.; Dawes, L. A micro—Level indexing model for assessing urban ecosystem sustainability. Smart Sustain. Built Environ. 2012, 1, 291–315. [Google Scholar] [CrossRef]
  65. Wissen Hayek, U.; Halatsch, J.; Kunze, A.; Schmitt, G.; Grêt-Regamey, A. Integration natural resource indicators into procedural visualization for sustainable urban green space design. In Peer Reviewed Proceedings of Digital Landscape Architecture 2010 at Anhalt University of Applied Sciences; Buhmann, E., Pietsch, M., Kretzler, E., Eds.; Wichmann: Heidelberg, Germany, 2010; pp. 361–369. [Google Scholar]
  66. Dickinson, D.C. Green Space Perth: A Social-Ecological Study of Urban Green Space in Perth, Western Australia. Doctoral Thesis, University of Western Australia, Nedlands, Australia, 2018. [Google Scholar]
  67. Jennings, V.; Larson, L.; Yun, J. Advancing sustainability through urban green space: Cultural ecosystem services, equity, and social determinants of health. Int. J. Environ. Res. Public Health 2016, 13, 196. [Google Scholar] [CrossRef] [PubMed]
  68. Dong, Y.; Ren, Z.; Fu, Y.; Miao, Z.; Yang, R.; Sun, Y.; He, X. Recording urban land dynamic and its effects during 2000–2019 at 15-m resolution by cloud computing with Landsat series. Remote Sens. 2020, 12, 2451. [Google Scholar] [CrossRef]
  69. İnançoğlu, S.; Özden, Ö.; Kara, C. Green corridors in urban landscapes, case study Nicosia Pedieos river. Eur. J. Sustain. Dev. 2020, 9, 1. [Google Scholar] [CrossRef]
  70. Dang, M. Designing green corridors network within cities: A case study in vienna. Rooftop Urban Agric. 2017, 291–306. [Google Scholar] [CrossRef]
  71. Hong, A.; Sallis, J.F.; King, A.C.; Conway, T.L.; Saelens, B.; Cain, K.L.; Fox, E.H.; Frank, L.D. Linking green space to neighborhood social capital in older adults: The role of perceived safety. Soc. Sci. Med. 2018, 207, 38–45. [Google Scholar] [CrossRef]
  72. Chen, T.; Lang, W.; Li, X. Exploring the impact of urban green space on residents’ health in Guangzhou, China. J. Urban Plan. Dev. 2020, 146, 05019022. [Google Scholar] [CrossRef]
  73. Francis, M. Urban Open Space: Designing for User Needs; Island Press: Washington, DC, USA, 2003. [Google Scholar]
  74. Rahnema, S.; Sedaghathoor, S.; Allahyari, M.S.; Damalas, C.A.; El Bilali, H. Preferences and emotion perceptions of ornamental plant species for green space designing among urban park users in Iran. Urban For. Urban Green. 2019, 39, 98–108. [Google Scholar] [CrossRef]
  75. Cui, L.; Wang, J.; Sun, L.; Lv, C. Construction and optimization of green space ecological networks in urban fringe areas: A case study with the urban fringe area of Tongzhou district in Beijing. J. Clean. Prod. 2020, 276, 124266. [Google Scholar] [CrossRef]
  76. Yang, J.; Zeng, C.; Cheng, Y. Spatial influence of ecological networks on land use intensity. Sci. Total Environ. 2020, 717, 137151. [Google Scholar] [CrossRef]
  77. Sayfi, P.; Nikbakht, M. Identification and ranking green supplier selection criteria using one-sample T-test and FANP methods: A case study for petrochemical industry. J. Mod. Process. Manuf. Prod. 2016, 5, 53–67. [Google Scholar]
  78. Gerald, B. A brief review of independent, dependent and one sample t-test. Int. J. Appl. Math. Theor. Phys. 2018, 9, 50–54. [Google Scholar] [CrossRef]
  79. Morena, M.; Cia, G.; Baiardi, L.; Rodríguez Rojas, J.S. Residential property behavior forecasting in the metropolitan city of Milan: Socio-economic characteristics as drivers of residential market value trends. Sustainability 2021, 13, 3612. [Google Scholar] [CrossRef]
  80. Carbonara, S.; Faustoferri, M.; Stefano, D. Real estate values and urban quality: A multiple linear regression model for defining an urban quality index. Sustainability 2021, 13, 13635. [Google Scholar] [CrossRef]
  81. Mwanzu, A.; Nguyu, W.; Nato, J.; Mwangi, J. Promoting sustainable environments through urban green spaces: Insights from Kenya. Sustainability 2023, 15, 11873. [Google Scholar] [CrossRef]
  82. Cilliers, E.J.; Ghosh, S.; Ndaguba, E.A. Reclaiming Healthy Cities Through Nature-Based Planning Solutions. In The Empathic City: An Urban Health and Wellbeing Perspective; Springer Nature: Cham, Switzerland, 2023; pp. 123–141. [Google Scholar]
  83. Ignatieva, M.; Stewart, G.H.; Meurk, C. Planning and design of ecological networks in urban areas’. Landsc. Ecol. Eng. 2011, 7, 17–25. [Google Scholar] [CrossRef]
  84. Hunter, R.F.; Cleland, C.; Cleary, A.; Droomers, M.; Wheeler, B.W.; Sinnett, D.; Nieuwenhuijsen, M.J.; Braubach, M. Environmental, health, wellbeing, social and equity effects of urban green space interventions: A meta-narrative evidence synthesis. Environ. Int. 2019, 130, 104923. [Google Scholar] [CrossRef]
  85. Cao, W.; Li, X.; Lyu, X.; Dang, D.; Wang, K.; Li, M.; Liu, S. To Explore the Effectiveness of Various Ecological Security Pattern Construction Methods in Many Growth Situations in the Future: A Case Study of the West Liaohe River Basin in Inner Mongolia. Sci. Total Environ. 2024, 948, 174607. [Google Scholar] [CrossRef]
Figure 1. Research process.
Urbansci 09 00434 g001
Figure 2. Research methods based on the research objectives and questions.
Urbansci 09 00434 g002
Figure 3. The case study suburbs in the Adelaide Metropolitan Area, South Australia.
Urbansci 09 00434 g003
Figure 4. Analysis of household survey.
Urbansci 09 00434 g004
Figure 5. The most critical criteria for urban ecological sustainability by UGS planning. Teimouri et al. [26] (p. 22).
Urbansci 09 00434 g005
Figure 6. Distance to UGS from respondents’ homes.
Urbansci 09 00434 g006
Figure 7. Frequency of the responses for the ecological criteria in the case studies.
Urbansci 09 00434 g007aUrbansci 09 00434 g007b
Figure 8. Local R2 value for biodiversity and vegetation.
Urbansci 09 00434 g008
Figure 9. Local R2 value for landscape and design.
Urbansci 09 00434 g009
Figure 10. Local R2 value for planning for protection.
Urbansci 09 00434 g010
Figure 11. Local R2 value for water resources.
Urbansci 09 00434 g011
Figure 12. Local R2 value for planning for ecological networks.
Urbansci 09 00434 g012
Figure 13. Semantic relationships between identified codes, concepts, and categories.
Urbansci 09 00434 g013
Figure 14. Guidelines for UGS ecological sustainability challenging criteria.
Urbansci 09 00434 g014
Table 1. Area and share of UGS in case studies and Adelaide Metropolitan Area.
NoSuburbsPopulationArea (Hectares)UGS Per Capita
(Person per Square Meter)
Share (Percentage)The Total Area of the Green Spaces in the Metropolitan AreaThe Share of the Suburban UGSs from the Total Metro Green Space
1Plympton47568.99818.9201.34034,955.80.026
2Magill886112.28713.8661.8300.035
3Unley40065.49013.7050.8180.016
4CBD15,115636.914421.37994.8711.822
5Prospect13,2802.1281.6020.3170.006
6Norwood59535.5309.2890.8240.016
Total51,971671.347129.17100.0001.92
Table 2. The case study suburbs and number of participants.
SuburbsParticipants NumberPopulationPercent
Adelaide CBD2015,11529.084
Norwood16595311.45
Magill18886117.050
Plympton1547569.151
Unley1340067.708
Prospect1913,28025.553
Total10051,971100
Table 3. Cronbach’s alpha results obtained for the study criteria.
NoCriterionCronbach’s Alpha
1Biodiversity and vegetation0.677
2Planning for ecological networks0.697
3Landscape and design0.735
4Protection0.713
5Water resources0.689
Table 4. Affecting criteria for ecological sustainability by UGS planning.
Ecological Criteria Ecological Sub-Criteria References
Biodiversity
and
vegetation
Planning for developing different species of animals in UGS[15,27]
Considering diversity of plant species[15,30]
Planting native plants[30,53]
Emphasizing planting trees instead of other plants[31]
Dense planting[54]
Planting productive trees and vegetables[55]
Planting water-conserving plants[32,56]
Protection Biodiversity protection[57,58]
Using recycling facilities in UGS development[59,60]
Green space preservation programs[33,61]
Water resources Irrigation with a rain harvesting system[35,36]
Irrigation with reused recycled water[37,62]
Wastewater management for UGS irrigation[37]
Irrigation with retention pond[63]
Ecological landscape
design
Designing UGS regarding biodiversity[15,42]
Designing UGS regarding the area and population of the suburbs or neighbourhoods[40,64]
Designing regarding the natural shape of the land[65]
Designing regarding climate condition[41,43]
UGS area[66,67]
UGS form and shape in harmony with city nature[46,47]
UGS connectivity[68]
UGS connections with green corridors[69,70]
UGS connections with neighbourhood homes[71]
UGS isolation[72]
Designing elements and statues in UGS[73]
Planting colourful flowers[74]
Designing green pathway-walkway-cycle track[48,49]
UGS design aesthetic[44,45]
Considering the structure of UGS (linear, dot, polygon)[50,51]
Ecological networks Organizing ecological networks (rivers, marshes, etc.)[38,75,76]
Source: Teimouri et al. [26] (p. 8).
Table 5. Ecological sustainability criteria and sub-criteria and their codes.
CriteriaNoDomainNo
Is there any plan to protect animal species in the green spaces in your residential area? (F1)1Biodiversity and vegetation (F)1
Is there a diversity of plant species in the green spaces in your residential area? (F2)2
Are native plants planted in the green spaces in your residential area? (F3)3
Is there any planning for organising ecological networks (organising rivers, marshes, water bodies, …) (G1)4Planning for ecological networks (G)2
Do the green spaces in your residential area have a form and shape in harmony with nature? (H1)5Landscape and design (H)3
Are the green spaces in your residential area linked with neighbourhood homes? (H2)6
Should biodiversity be considered in the design of green spaces in your residential area? (H3)7
Is climate taken care of in the design of green spaces in your residential area? (H4)8
Is there any preservation program for green spaces in your residential area? (I1)9Protection (I)4
Are the green spaces in your residential area irrigated with recycled water? (J1)10Water resources (J)5
Table 6. Frequencies and percentages of participants’ responses to the ecological criteria.
ObjectsNot at All (1)Poor (2)Average (3)Well (4)Very Well (5)SumAverageOverall Average
F1Frequency810304481003.343.31
Percent8.15%10%30%44%8%100%
F2Frequency216463061003.22
Percent2%16%46%30%6%100%
F3Frequency45503291003.37
Percent4%5%50%32%9%100%
G1Frequency517621151002.942.94
Percent5%17%62%11%5%100%
H1Frequency164927171003.533.42
Percent1%6%49%27%17%100%
H2Frequency29503091003.35
Percent2%9%50%30%9%100%
H3Frequency454526201003.53
Percent4%5%45%26%20%100%
H4Frequency5 9 58 20 81003.28
Percent5%9%58%20%8%100%
I1Frequency2 2152 1781003.083.08
Percent2%21%52%17%8%100%
J1Frequency121461851002.802.80
Percent7%4%71%13%5%100%
Table 7. Descriptive analysis results of the t-test of the overall situation of the ecological criteria.
NoNdfTSigThe Average Limit of the AverageAverageMean Difference
1 38299 2.4720.0013031.471.47
Table 8. Model summary.
ModeRR SquareAdjusted R SquareStd. Error of the Estimate
10.8390.7050.6855.493
Table 9. Standardized regression effect coefficients of the criteria with ecological sustainability.
PartPartialZero-OrderSigtStandardized Coefficients BetaCriterion
0.2990.5330.5630.0006.1780.323Biodiversity and vegetation
0.1340.2130.3050.0002.1200.142Planning for ecological networks
0.5180.6430.6370.0008.1780.538Landscape and design
0.2050.3150.2450.0003.2400.210Water resources
0.3000.4370.5480.0004.7380.331Protection
Table 10. Results of the spatial impacts of UGS planning criteria on ecological sustainability by GWR.
Domain (Figure)Suburbs with Notable Local R2Local R2 RangeKey FindingsRelative Influence on Ecological Sustainability
Biodiversity and Vegetation (Figure 8)Plympton (0.866), Unley (0.488)0.016–0.866Strong positive relationship between biodiversity/vegetation criteria and ecological sustainability, especially in Plympton and Unley.Most effective domain for promoting ecological sustainability among all studied suburbs.
Landscape and Design (Figure 9)All suburbs (Adelaide CBD, Prospect, Norwood, Unley, Magill, Plympton)~0.50–0.51Local R2 values are almost identical across suburbs (close to and slightly above 0.5), showing a consistent positive influence.Moderately strong and uniform effect across all suburbs.
Protection (Figure 10)Prospect (higher values), others lower0.065–0.067Positive but weaker contribution compared to biodiversity and design.Relatively low impact.
Water Resources (Figure 11)Prospect, Plympton (slightly higher)0.091–0.092Very limited effect on ecological sustainability.Minor effect.
Planning for Ecological Networks (Figure 12)Prospect (higher), Plympton (lower)0.071–0.073Weakest contribution among all domains.Lowest impact.
Disclaimer/Publisher’s Note: The statements, opinions and data contained in all publications are solely those of the individual author(s) and contributor(s) and not of MDPI and/or the editor(s). MDPI and/or the editor(s) disclaim responsibility for any injury to people or property resulting from any ideas, methods, instructions or products referred to in the content.