Article

Comprehensive Assessment of Heavy Metal(loid) Pollution in Agricultural and Urban Soils near an Oil Refining Facility: Distribution Patterns, Source Apportionment, Ecological Impact, and Probabilistic Health Risk Analysis

1
Faculty of Technology and Metallurgy, University of Belgrade, Karnegijeva 4, 11120 Belgrade, Serbia
2
Innovation Center of Faculty of Technology and Metallurgy, Karnegijeva 4, 11120 Belgrade, Serbia
3
Aquaculture Department, Agriculture Faculty, Malatya Turgut Özal University, 44210 Malatya, Türkiye
4
Public Health Institute of Belgrade, Bulevar Despota Stefana 54-a, 11108 Belgrade, Serbia
5
Vinča Institute of Nuclear Sciences, University of Belgrade, Mike Petrovića Alasa 12-14, 11351 Belgrade, Serbia
*
Author to whom correspondence should be addressed.
Urban Sci. 2025, 9(10), 415; https://doi.org/10.3390/urbansci9100415
Submission received: 30 August 2025 / Revised: 2 October 2025 / Accepted: 4 October 2025 / Published: 8 October 2025

Abstract

This study investigated the spatial distribution of HMs in agricultural and urban soils near the largest oil refining complex in Serbia, identified pollution sources, and assessed ecological and human health risks. A large fraction of soil samples showed elevated Hg (40% of samples), Pb (53%), Cd (90%), and As (93%) concentrations compared to the background levels. Hotspots for Pb, As, Hg, Cd, and Zn were observed in the industrial area, indicating significant anthropogenic input. Multivariate analysis, including PMF, revealed four contamination sources: emissions from the oil refining industry, agricultural activities, traffic emissions, and natural background. The pollution indices mostly fell into the moderate pollution range, with As, Hg, and Cd showing the highest enrichment. The potential ecological risk index (RI) indicated that about one-third of the samples had moderate ecological risk and determined a major RI hotspot near the refinery. The health risk assessment identified As and Cr as the largest contributors to non-carcinogenic risk, although the average HI was below one. Monte Carlo simulation confirmed that adults and children had negligible health risks at the 95th percentile and highlighted exposure frequency and body weight as the most influential exposure parameters. Based on source-specific risk, the oil refining industry emissions had the highest impact on HI and TCR values.

1. Introduction

Soil pollution has attracted significant attention worldwide because it is an important environmental component [1]. Among the hazardous substances released into the soil environment, heavy metal(loid)s (HMs) are recognized as significant pollutants [2]. Their content is used for environmental pollution assessments [3], including soil [4], plants [5], air [6], water [7], and sediment [8,9]. Owing to their characteristics and high toxicity, HMs pose a risk to ecosystems by affecting soil quality, and may also impact human health through the food chain [10]. Although HMs can be naturally present in the soil, various anthropogenic activities have led to elevated HM concentrations. Naturally occurring heavy metal(loid)s are usually found at low concentrations, but anthropogenic activities can significantly increase their levels, leading to potential health effects [11]. Industrialization and economic development have led to an increasing number of anthropogenic sources of HMs. Urban soils are generally more exposed to HM pollution because of the large number of inhabitants and numerous pollution sources, such as traffic emissions and industrial activities [12,13]. Pollution near industrial complexes is a significant environmental problem [14,15]. The chemical industry, specifically oil processing complexes, may release large amounts of HMs into the soil during production [16,17]. Waste products from the refinery industry (oily sludge) contain high concentrations of Pb, Cd, As, and other heavy metals. Some of the problems that most often lead to pollution are lack of environmental control and poor management [16,18].
Previous studies have focused on different approaches to soil pollution, such as geospatial distribution [19,20], pollution source identification [21], and risk assessment [22]. The distribution of HMs and the results of risk indices are typically represented using geographic information systems (GIS) [23,24]. HMs may accumulate in soil through different processes, and it is important to distinguish their potential sources. Therefore, determining and identifying the sources of HMs is becoming an increasingly important priority in the analysis of soil pollution [19]. Multivariate statistical methods such as correlation analysis, principal component analysis, factor analysis, and hierarchical cluster analysis (HCA) are often used to understand the relationships between HMs and qualitative source identification [25,26]. However, receptor models, such as the positive matrix factorization model (PMF), can quantify the contribution of each source to the HMs in the soil [13]. The PMF model has been widely employed for the efficient source apportionment of HMs in soil [27]. Accordingly, this study combined correlation analysis, cluster analysis, and the PMF model to precisely identify the main contributors to soil HM pollution. The ecological risk posed by HMs in soil is affected by their concentrations and toxicity. Various pollution indices have been used to assess risks and soil contamination characteristics. Among these, the enrichment factor (EF), geoaccumulation index (Igeo), and potential ecological risk index (RI) are widely used [28,29]. Using these indices, it is possible to determine the impact of human activity on soil pollution status [30]. Many studies have focused on health risk assessment because it is vital to understand how HMs from soil affect human health [28,31]. The application of deterministic health risk assessment (HRA) allows the characterization of possible adverse non-carcinogenic and carcinogenic effects on human health [32]. However, this model uses point values for the exposure factors, and its implementation may result in under-or overestimation of the final outcomes. Comparative studies have shown that the probabilistic approach (Monte Carlo simulation-MCS) can provide a better representation of data variability and predictions of potential health risks [7,13]. The probabilistic risk model has been an important component of many research studies, enabling accurate interpretation of risk [1,33]. Understanding the relationship between HMs, pollution sources, and potential risks is essential. Merging the PMF model with health risks enables the determination of risk levels attributed to different source [7]. The integration of all three models, HRA, PMF, and MCS, enables a comprehensive source-specific probabilistic health risk approach. Studies focusing on soil have shown that these methods are very useful for assessing soil quality. Ma et al. (2025) used the Igeo index to identify increased soil contamination with Pb (mean Igeo value of 3.76), which was further confirmed by a health risk assessment because Pb contributed the most to the hazard index [34]. Moreover, Deng et al. (2020) reported elevated contamination of HMs in agricultural soils with HI values for adults of 4.3 at the 97.5th percentile [32].
This study aimed to investigate the spatial distribution, source apportionment, and ecological and health risk assessment of ten HMs in soil from one of the major oil refining industrial zones in Serbia. A combination of developed industries and the use of agrochemicals may cause excessive soil pollution in this region; therefore, it is important to focus on HM content in the soil. Previous studies have indicated that soil in surrounding industrial facilities can be contaminated with HMs [27,35]. Therefore, investigating current soil pollution in the vicinity of oil refining facilities is important for future research. To the best of our knowledge, no previous research has combined source identification with ecological and health risk assessment of heavy metal(loid)s in this region. The major hypotheses of this study were: how the distribution patterns of HMs in urban and agricultural soils near the oil refining facility are manifested, how their sources are apportioned, and how they affect the environment and human health. The main objectives were to (1) determine the total concentrations and spatial distributions of Pb, Cr, As, Hg, Cd, Zn, Cu, Ni, Ba, and Mn in the soil; (2) identify and interpret statistical factors related to potential pollution sources using the PMF source apportion method; (3) evaluate the possible level of contamination and ecological risk using the enrichment factor, geoaccumulation index, and potential ecological risk index; and (4) investigate potential health issues for residents associated with the studied HMs based on a source-specific probabilistic health risk model. This research can help evaluate the soil pollution status in the vicinity of the oil refining industry.

2. Materials and Methods

2.1. Study Area and Sample Collection

The study area is located in the Pančevo municipality (southwestern Banat, Serbia), which is adjacent to the capital of Belgrade and bordered by the Tamish and Danube Rivers. It spreads between latitude (N) 44°40′30.9″–45°00′18.0″ and longitude (E) 20°33′02.0″–20°54′44″ (Figure 1 and Figure S1). This is a major industrial zone in Serbia. Rapid growth of the chemical industry occurred in the 1960s, and its main industrial complex, which consists of HIP Petrohemija, HIP Azotara, and NIS Oil Refinery facilities, is situated in the south of the city. Moreover, a large part of the municipality is arable land, and the population engages in intensive agricultural production. Therefore, the Pančevo area is a typical integrated industrial and agricultural area.
Thirty representative composite soil samples were collected at depths of up to 30 cm using a soil sampling probe. In total, 62% of the soil samples were collected from agricultural regions, and 38% were collected from other areas of the district. At each sampling location, a minimum of 10 subsamples were collected using the zigzag method over a 10 × 10 m area, with approximately 1–2 kg of soil per subsample. All subsamples were then mixed using the coning and quartering method, resulting in a composite sample weighing up to 5 kg. Each composite sample was divided into triplicate parts. The specific geographical coordinates of each sampling site were recorded using a global positioning system (Garmin Montana 680 Handheld GPS, Garmin Ltd., Olathe, KS, USA). All samples were preserved in sterile glass containers, labeled appropriately, and transported to the laboratory for further analysis.

2.2. Sample Preparation and Analysis

Soil samples were dried at room temperature in the laboratory. Because the collected soil consisted of relatively coarse aggregates, the samples were first ground with an agate mortar, and following this step, they were passed through a 2 mm nylon sieve. The soil pH was measured using a pH meter (Orion 3-Star pH meter, Thermo Scientific, Waltham, MA, USA) at a soil/water ratio of 1:5. Soil organic matter (OM) was measured using the Walkley-Blacks procedure. Soil particle size (clay percentage) was determined using the pipette method.
Sample preparation for HM analysis was conducted in accordance with EPA 3051A methodology. An accurately weighed 1.000 g soil sample was digested, cooled, filtered, and diluted to 50 mL. The soil samples were acid-digested by HNO3-HCl in a CEM Mars 6 iWAVE microwave oven (CEM Corporation, Matthews, NC, USA).
The concentrations of Pb, Cr, As, Cd, Zn, Cu, Ni, Ba, and Mn were quantified by inductively coupled plasma mass spectrometry (Thermo iCap Q ICP-MS instrument, Thermo Scientific, Waltham, MA, USA). Only Hg content was measured using a mercury analyzer (DMA-80, Milestone, Bergamo, Italy). All HM concentrations were expressed on a dry weight basis (Table S1). Quality assurance and quality control (QA/QC) procedures were performed using a standard reference material (SRM) (NIST SRM 2711a—Montana II soil) from the National Institute of Standards and Technology (NIST), reagent blanks, and duplicate samples (Table S2). To ensure the reliability of the results, all measurements, including soil samples, blanks, recovery, and SRM analyses, were performed using the same procedure. For all analyzed HMs, the relative standard deviation (RSD) was less than 12%, and the percentage recoveries were in the range of 91–116%.

2.3. Multivariate Data Analysis

Multivariate analysis included descriptive statistics, geospatial interpolation of soil HMs, Pearson correlation analysis, hierarchical cluster analysis (HCA), and PMF.
Geographical information systems (GIS) have been used to determine the spatial distribution of HM concentrations in soil [30,36,37]. Spatial interpolation was performed using ordinary kriging. However, because our dataset comprised only 30 samples, the variogram fitting and model parameters may be subject to limitations, which could affect the accuracy of the interpolated maps.
The similarities between the studied HMs were determined using HCA, which is shown as a dendrogram [14,38]. HMs arranged in the same clusters originate from the same pollution source [39].
The PMF model recommended by the USEPA was predominantly used for source apportionment and determination of the contribution of each source to soil pollution [40]. This model requires both HM concentration data and uncertainties to obtain the source profiles and contributions [37]. In this study, the PMF was used to quantitatively identify the main sources of HMs in the soil. PMF was performed using EPA PMF 5.0, and all steps were followed according to the USEPA guidelines [41]. The original dataset consisted of HMs concentrations and uncertainty values, with greater uncertainty weights applied to the elements with lower concentrations. To achieve the best results and obtain a minimum and stable Q value, the number of factors was varied from three to six, and the system was run 20 times [13]. According to the various PMF model solutions, the lowest Q value was obtained when the number of factors was four (Q/Qexpected = 0.82). The uncertainty for all HMs was within 16%, and none of the HM concentrations were below the LOD. The coefficient of determination between the observed and predicted values (r2) for all parameters was in the range of 0.62–0.98, and all residuals were between −3 and 3. This model output indicated that the PMF model was accurate and that the analyzed parameters were well apportioned. Therefore, four factors were adopted for source interpretation.

2.4. Soil Pollution Indices

HM pollution levels in the soil were assessed using three ecological risk indicators: enrichment factor (EF), geoaccumulation index (Igeo), and potential ecological risk index (RI). The classification criteria for these indices are presented in Table S3 [8].
The enrichment factor was used to estimate soil HM enrichment and distinguish between anthropogenic and natural impacts on HM concentrations in the soil [21]. This method normalizes HM concentration using a reference element [42,43]. The enrichment factor was calculated using the following equation:
E F = C i C r e f S a m p l e C i C r e f B a c k g r o u n d
where Ci is the concentration of the studied HM and Cref is the concentration of the reference element. Elements such as Fe, Al, Sc, Mn, and Ti are commonly used as normalizing elements for estimating the EF [14,37,44]. In this study, Mn was used as the reference element because of its natural presence and stability in soil [45,46].
The geoaccumulation index was introduced by Müller [47]. By comparing the measured concentration with the background values, Igeo provides information about soil pollution status [25]. Equation (2) was used to calculate Igeo:
I g e o = l o g 2 C n 1.5 B n
Cn represents the measured concentration of HM in the soil sample (mg/kg), Bn is the background concentration of the selected HM (mg/kg), and 1.5 is a factor used to correct for variations in the background value [48,49]. In this study, the upper continental crust values were used as background values.
Hakanson developed a potential ecological risk index (RI) to assess the ecological risk [50] caused by all studied HMs [51]. RI uses the concentration and toxicity of HMs and can be calculated as follows:
R I = i = 1 n E r i = i = 1 n T r i C f i
where E r i , C f i , and T r i represent the potential ecological risk, contamination factor, and toxic response factor, respectively, of a single HM. T r i values were Pb (5), Cr (2), As (10), Hg (40), Cd (30), Zn (1), Cu (5), Ni (5), and Mn (1) [52,53].
Although these indices are widely used in soil pollution studies, they have certain limitations. The calculation of EF and Igeo requires background concentrations of HMs, which directly influence the final results. As these indices depend on background concentrations and a reference element, any inconsistencies with the geogenic baseline can affect the results. Moreover, these indices, along with the RI, do not consider the bioavailable fractions of metal concentrations.

2.5. Source-Specific Health Risk Assessment

The potential effects of HMs on human health were evaluated using the health risk assessment (HRA) model recommended by the USEPA [54]. For a more precise evaluation, the HRA model was merged with the source apportion method. This integrated approach enables the estimation of risks from particular pollution sources [55]. The hazard quotient (HQ) and hazard index (HI) were used to quantify the non-carcinogenic risk. On the other hand, potential carcinogenic effects were assessed using carcinogenic risk (CR) and total carcinogenic risk (TCR) [18,35]. Three main pathways of exposure to soil HMs were considered during the risk assessment: ingestion, inhalation, and dermal contact. Owing to the behavioral differences among residents, the HRA model was determined separately for children and adults [56]. HI levels greater than one indicate a potential negative impact on health; otherwise, the risk is insignificant. The TCR values can be divided into three classes: negligible risk (TCR < 10–6), acceptable risk (10–6 < TCR < 10–4), and unacceptable risk (TCR > 10–4) [34,57]. The calculations for the source-specific HRA model are listed in Table 1.

2.6. Monte Carlo Simulation

The deterministic risk model takes into account only considers the individual values of the exposure parameters, excluding the influence of different factors on their variability [58]. Hence, a probabilistic risk assessment model using a Monte Carlo simulation (MCS) was employed to address these shortcomings. MCS minimizes the uncertainties in the exposure parameters using their probability distributions. Therefore, Monte Carlo simulations provide the probabilities of risk values [3,33,59]. MCS was performed using Crystal Ball 11.1.24 (Oracle, Austin, TX, USA). The model was run for 10,000 iterations, with a confidence level of 95%. All the exposure parameters and their probability distributions used for the HRA calculations are presented in Tables S4 and S5 [60]. The distribution boundary for exposure frequency was 180–365, while the ingestion rate exhibited boundaries of 90–110 for adults and 180–220 for children.

3. Results and Discussion

3.1. Descriptive Statistics and Spatial Distribution of Soil HMs

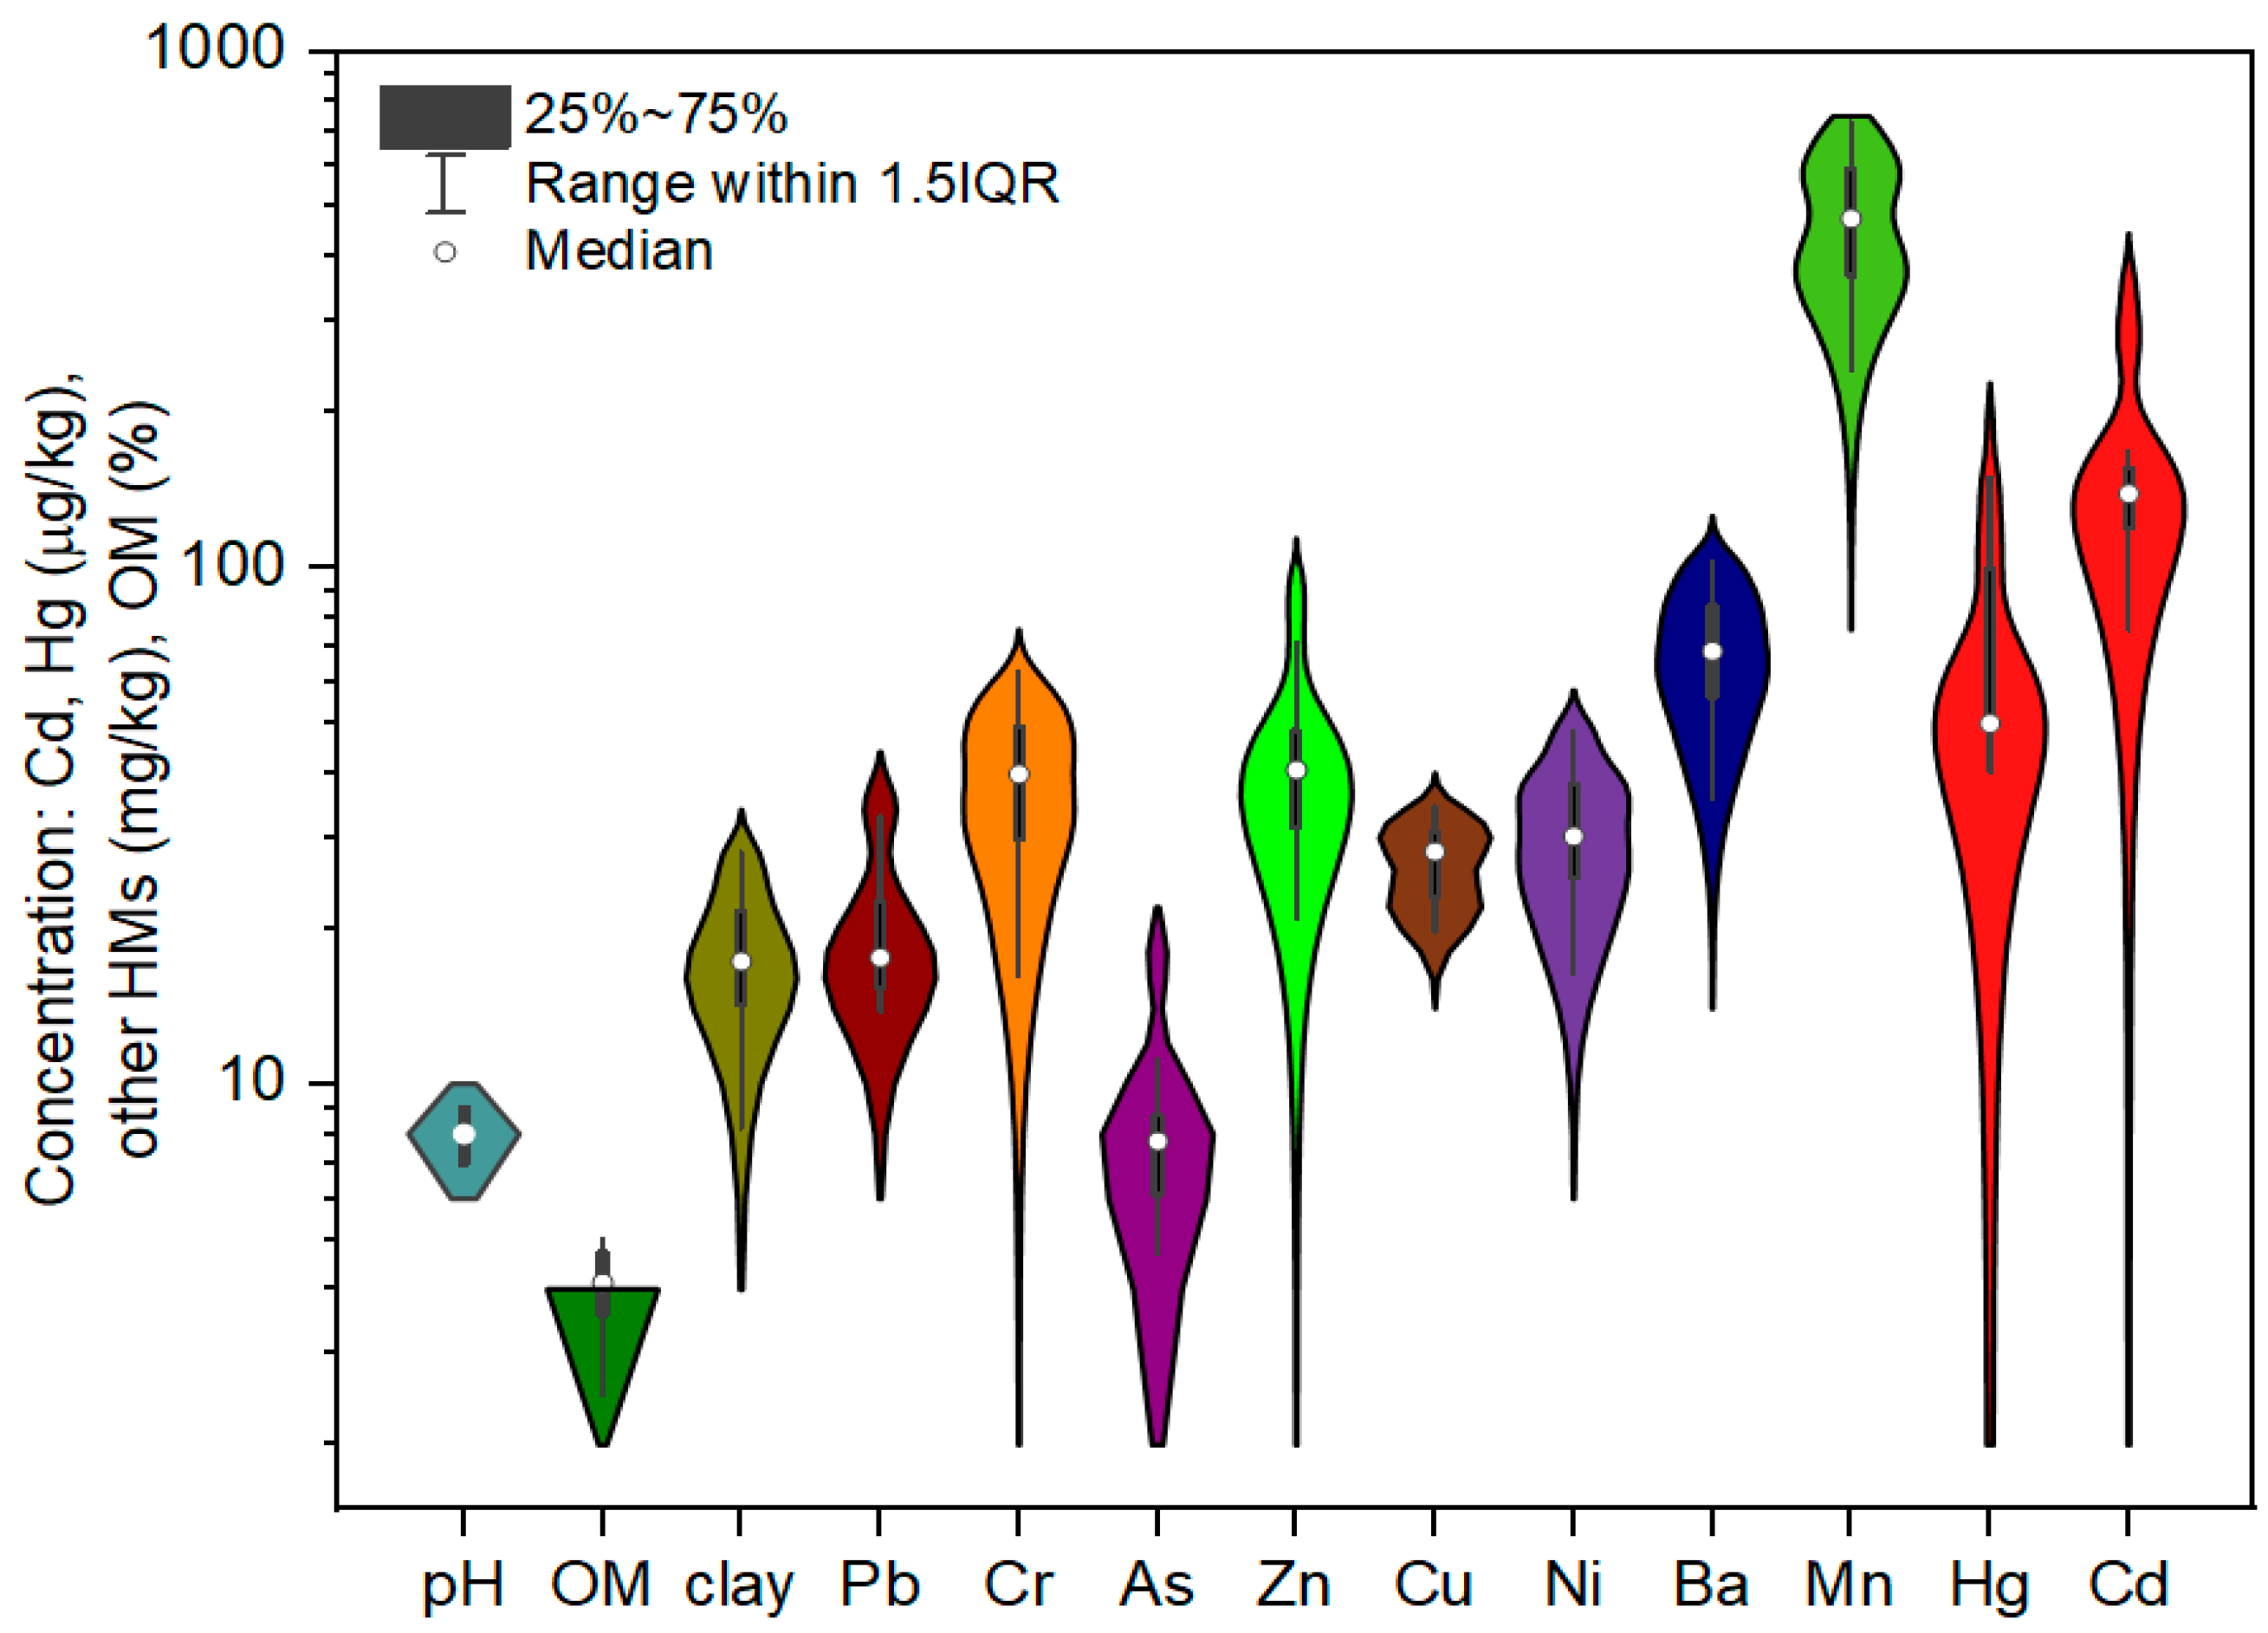
The statistical results for the HM content and physicochemical properties of the soil samples are presented in Figure 2. Soil pH varied from 7.3 to 8.7, indicating slightly alkaline soil conditions. The soil organic matter (OM) had a mean value of 4.0%, ranging from 2.5% to 5.0%. Based on soil texture analysis, the average clay content was found to be 18.2%.
The concentrations decreased in the order Mn > Ba > Zn > Cr > Ni > Cu > Pb > As > Cd > Hg (Figure 2), with Mn and Ba being predominantly of natural origin (see Section 3.2). It is common to compare measured HM concentrations with background values to determine whether there has been increased accumulation of HMs [3]. The concentrations of HMs found in the upper continental crust (UCC) were used as background values (17, 92, 4.8, 0.05, 0.09, 67, 28, 47, 624, and 438.6 mg/kg for Pb, Cr, As, Hg, Cd, Zn, Cu, Ni, Ba, and Mn, respectively) [61]. The mean Pb, As, Hg, Cd, and Mn contents were higher than the corresponding UCC contents. The increased concentrations of Pb, As, Hg, and Cd suggested that these HMs were elevated by anthropogenic activities [16,39,53]. However, higher Mn concentrations were most likely affected by the soil parent material [62]. The maximum Cr and Ba values did not exceed background values. The maximum values of Pb were two times higher and those of As, Hg, and Cd were four times higher than the UCC value. Approximately half of the samples were contaminated with Pb (53%) and Hg (40%), and nearly all samples were contaminated with As and Cd, with shares of 93% and 90%, respectively). Therefore, these four HMs are considered to be the most important pollutants in the study area. These observations are consistent with the results of other studies investigating soils near oil refineries. In northern Greece, elevated concentrations of As, Cu, Pb, and Zn were detected in soils near an oil refinery compared to reference sites [63], while soils from the Arvand area (the Middle East’s oldest oil refinery zone) were enriched with Cd, Co, Cr, Cu, Hg, Mo, Ni, Pb, and Zn [15].
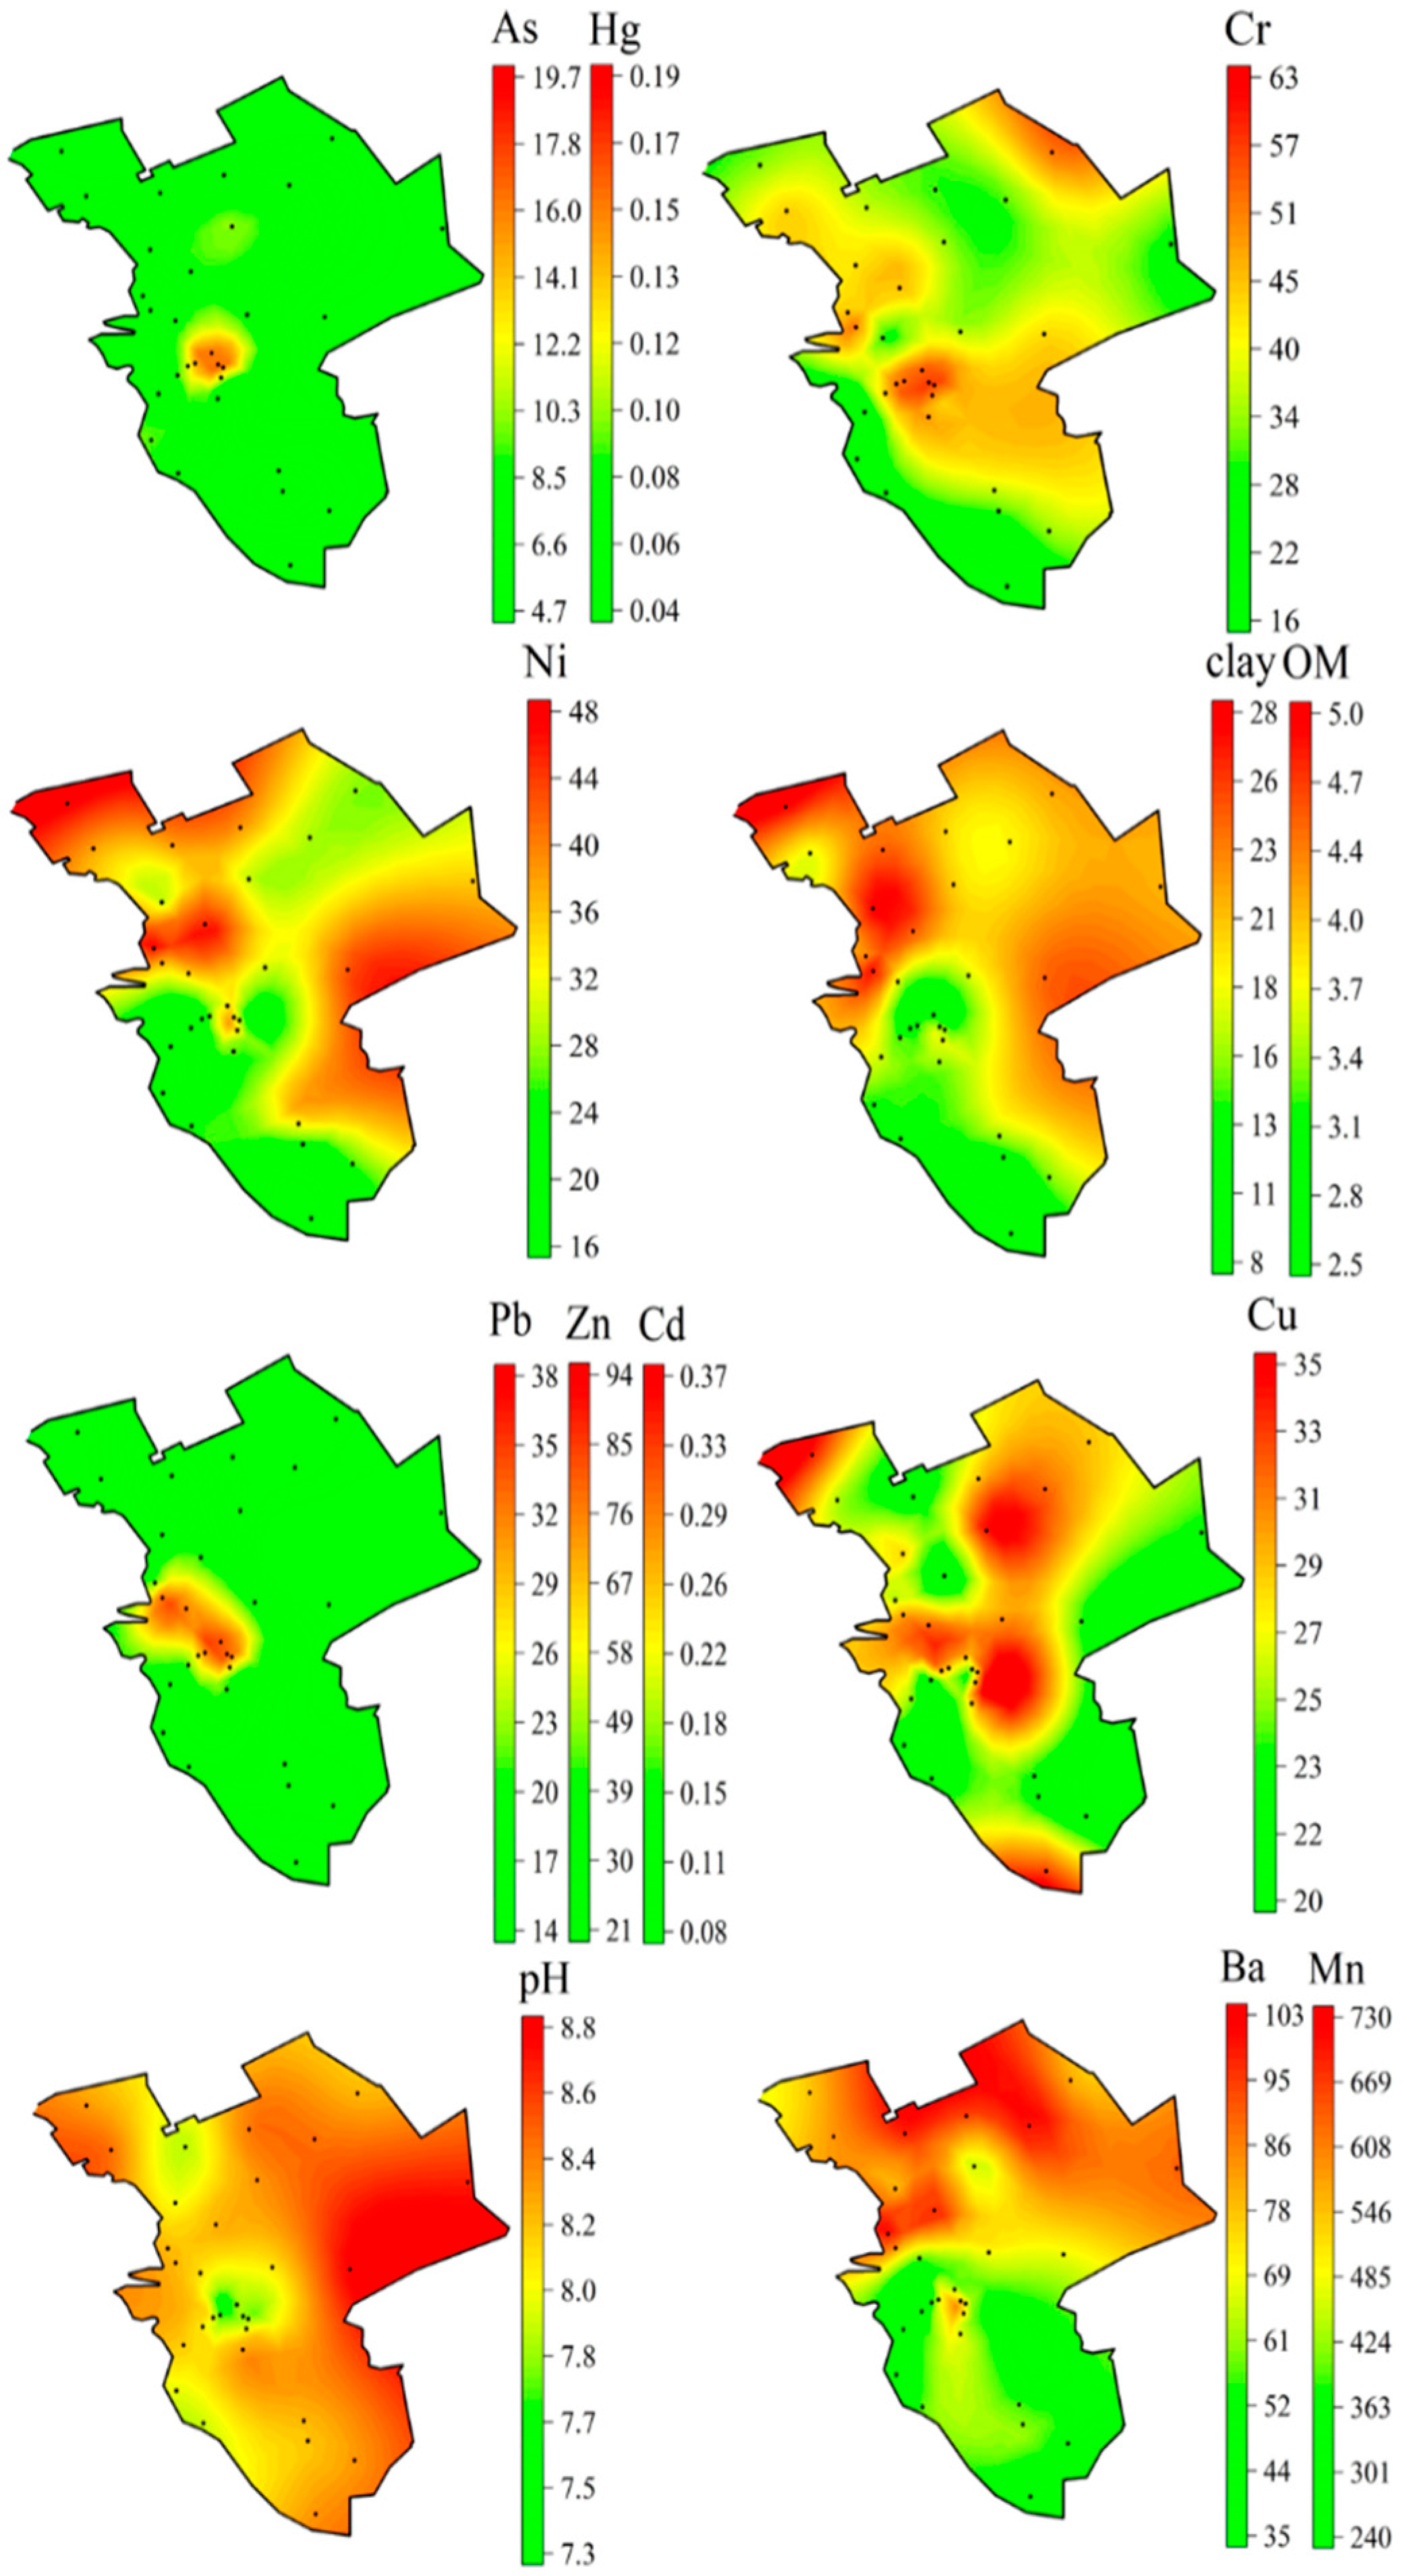
The spatial distribution of HM concentrations and physicochemical properties of the soil were used for pollution hotspot identification, and the results are shown in Figure 3. Overall, the distribution of soil properties differed throughout the study area, with higher values observed in the north than in the south. For most HMs, the concentration in the oil refining industrial area was much higher than that in other parts of the Pančevo municipality. The distribution of Pb, As, Hg, Cd, and Zn followed a similar pattern to that of the high-value areas in Pančevo. The highest concentrations of these HMs were recorded in the industrial zone between Pančevo City and Starčevo Village, while Pb, Zn, and Cd also showed elevated concentrations in the downtown area of Pančevo. This spatial pattern indicates a significant relationship with human activities due to the existence of three major industrial facilities in the identified hotspot areas. The rest of the study area was categorized as having lower HM concentrations.
Recent studies have reported elevated concentrations of Pb, Hg, and As in industrial activities [2,64]. The Cr and Cu contents were similar to the high values found in the central and northern areas of the municipality. High OM, clay, Ni, Ba, and Mn values were primarily distributed in the upper part of the study area in the soils around Jabuka, Banatsko Novo Selo, Kačarevo, and Dolovo Villages. Their values decreased toward Pančevo City and the southern areas. These spatial patterns indicate that OM, clay, Ni, Ba, and Mn were primarily controlled by natural sources. The pH values differed from those in the center of the study area, around three major industrial facilities, and near Jabuka Village in the north. According to the spatial distribution, the impact of human activities was greatest in the central region, where Pančevo City was located.

3.2. Source Analysis of HMs in Soil

Associations among HM content, soil pH, organic matter, and clay content were observed using the Pearson correlation method, and the results are illustrated in Figure S2. A significant correlation was observed in three pairs of studied parameters based on the correlation coefficient values (strong > 0.7, moderate 0.5 < r < 0.7, and weak < 0.5) [38]. Strong and moderate negative correlations were observed between pH and Pb (r = −0.67), As (r = −0.74), Hg (r = −0.61), Cd (r = −0.63), and Zn (r = −0.53). These negative correlations suggest an association between lower pH values and higher HM concentrations and the lower pH may increase HMs bioavailability [44]. Positive correlations were observed between Pb, Cr, As, Hg, Cd, and Zn, with correlation coefficients ranging from 0.56 0.93. The last pair of intercorrelated parameters includes OM, clay, Ni, Ba, and Mn. Strong correlations between the HMs may indicate a common origin [31,65]. Therefore, this relationship among the HMs indicates that Pb, Cr, As, Hg, Cd, and Zn have similar or the same origin, whereas Ni, Ba, and Mn originate from different sources.
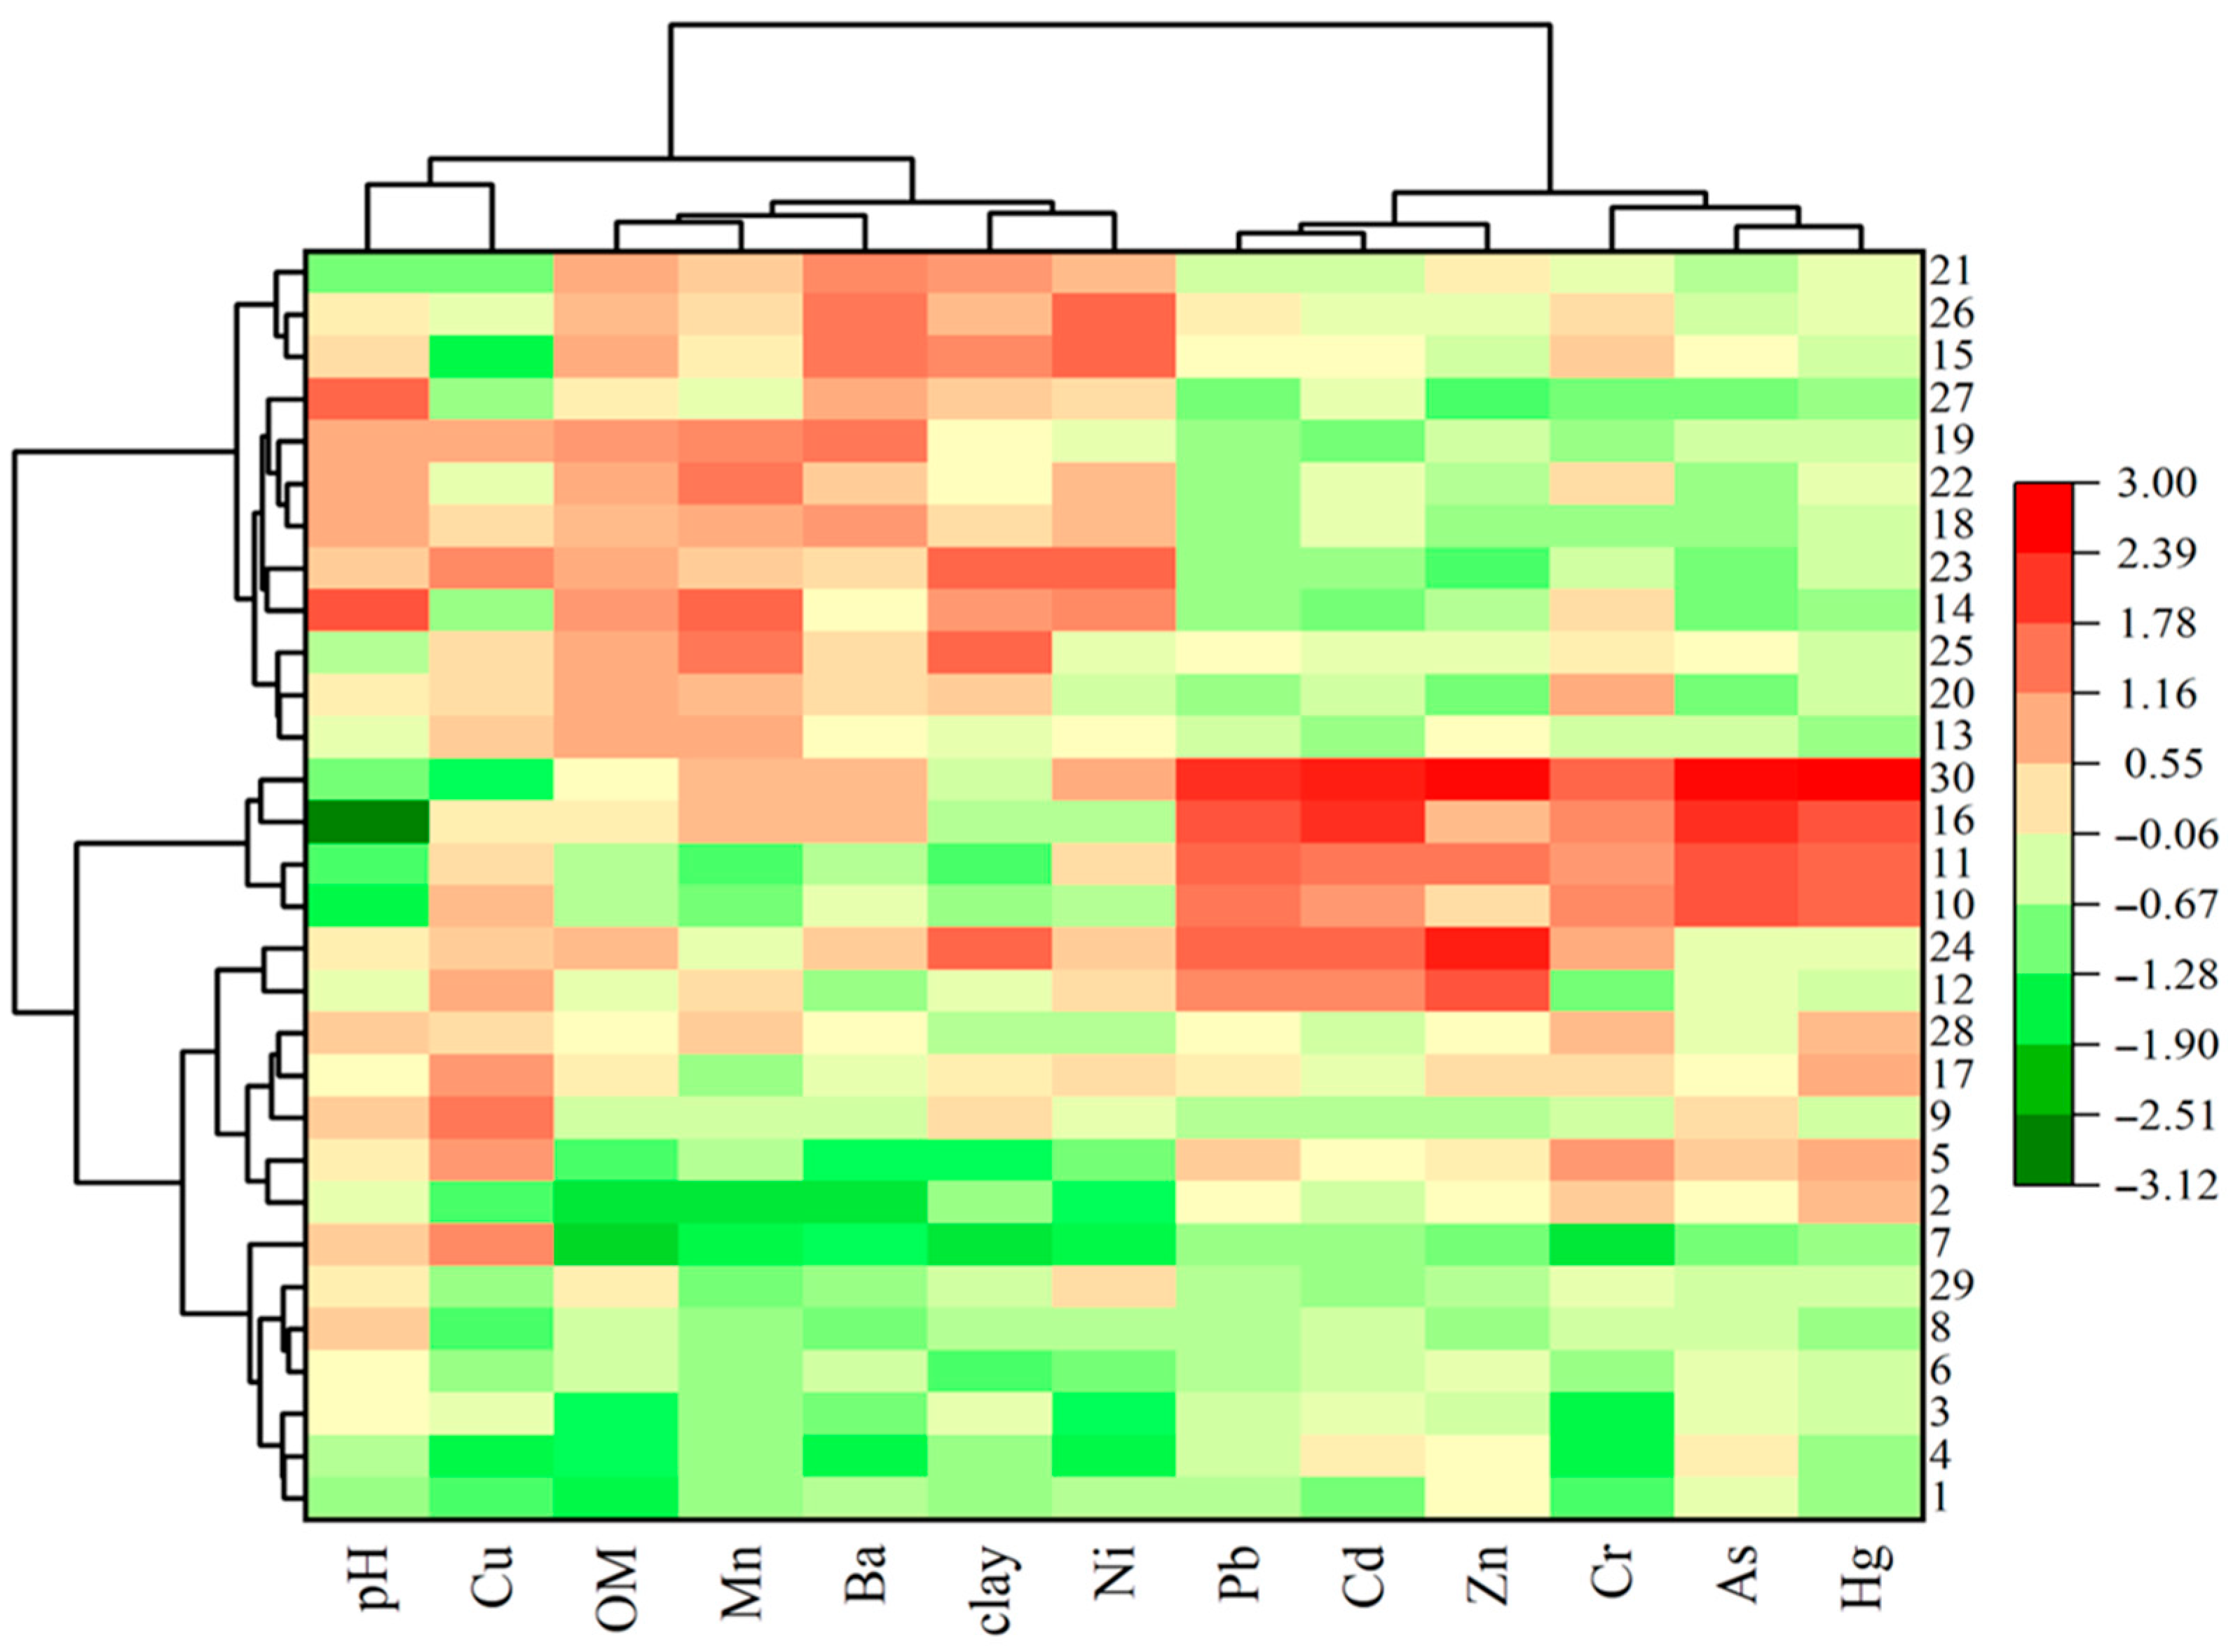
The HCA dendrograms of 13 variables and 30 soil samples were combined into a heat map (Figure 4). The ten HMs and their physicochemical parameters were divided into two main clusters. Each cluster was further classified into two sub-clusters. The first sub-cluster was characterized by pH and Cu, and the second sub-cluster comprised OM, Mn, Ba, clay, and Ni. Three HMs were included in the third (Pb, Cd, and Zn) and fourth (Cr, As, and Hg) subclusters. These classifications indicated that the separated HM groups may have originated from different sources.
The soil samples were grouped according to sampling location and classified into three subclusters. The first cluster was further divided into two sub-clusters. The samples from the southern part of the study area (1, 4, 3, 6, 8, 29, and 7) comprised the first sub-cluster and had relatively low OM, Mn, Ba, clay, Ni, and Cr contents. The second sub-cluster included Samples 2, 5, 9, 17, 28, 12, and 24, which were located in the central part of the study area. Elevated concentrations of Pb, Cd, Zn, Cr, and Hg were observed at these sampling points. Samples 10, 11, 16, and 30, collected from around the main industrial plants in the district, are included in the second cluster. These soil samples were characterized by their maximum concentrations of Zn, Cd, Hg, As, Cr, and Pb, as well as the lowest pH values. The data grouped within the third cluster included samples 13, 20, 25, 14, 23, 18, 22, 19, 27, 15, 26, and 21 from north and northwest of the study area. Elevated pH, OM, clay, Mn, Ba, and Ni concentrations, as well as average Pb, Cd, Zn, Cr, As, and Hg concentrations, were observed in these samples. High HM concentrations were found near industrial areas, highlighting their anthropogenic origin. Overall, the HCA results agreed with Pearson’s correlation analysis.
The results of the PMF model employed to identify the sources of HMs and the three physicochemical parameters in the soil are presented in Figure S3.
The first factor had a contribution of 18.1% and was dominated by Hg (87.7%) and Cr (63.8%) and partially by As (35.6%). Many studies have reported that these HMs are related to industrial activities [13,32]. The main element representing the pollution source for Factor 1 was Hg. This element is mostly released from various industrial processes, such as oil refining, and it reaches the soil through atmospheric deposition [17,31]. The oil processing industry releases As into the environment via fossil fuel combustion [15]. In addition, oil processing can increase the concentration of Cr in soils [66]. Thus, Factor 1 represents the atmospheric deposition of the oil refining industry activities.
Factor 2 was loaded with the pH and Cu with a total contribution of 22.6%. The contributions of Factor 2 to the pH value and Cu concentration were 54.2% and 62.6%, respectively. Factor 2 was moderately loaded with As (44.7%). In addition to industrial activities, As can be released into the environment via agricultural activities and fertilizers [31,67]. Pesticide and manure application in farmlands may be associated with Cu enrichment [37,40]. Therefore, Factor 2 represents agricultural activities and the application of agrochemicals.
Factor 3 was described by Cd, Zn, and Pb, with loadings of 100%, 60.5%, and 52.3%, respectively, and contribution of 24.3%. Cd dominates this factor and is considered a significant pollutant in traffic emissions, along with Pb and Zn [12,43]. According to previous studies, these HMs can be found in tires, lubricating oils, and brakes; thus, they may originate from traffic emissions [13,43]. Vehicle exhaust emissions contain high concentrations of Cd, Zn, and Pb [12,26]. Hence, Factor 3 could be classified as traffic emissions.
Factor 4 was heavily loaded with OM, clay, Mn, Ba, and Ni and partially loaded with pH, Cr, and Cu. This factor had the highest contribution of 35%. Manganese and Ni are often connected to the parent material and are considered to originate from geogenic sources [25,68]. Ba may also originate from the effects of the soil parent material [69]. Numerous studies have reported that Cr and Cu in soils are mostly derived from natural sources [36,37]. Accordingly, Factor 4 was considered a natural source.

3.3. Assessment of Ecological Risks

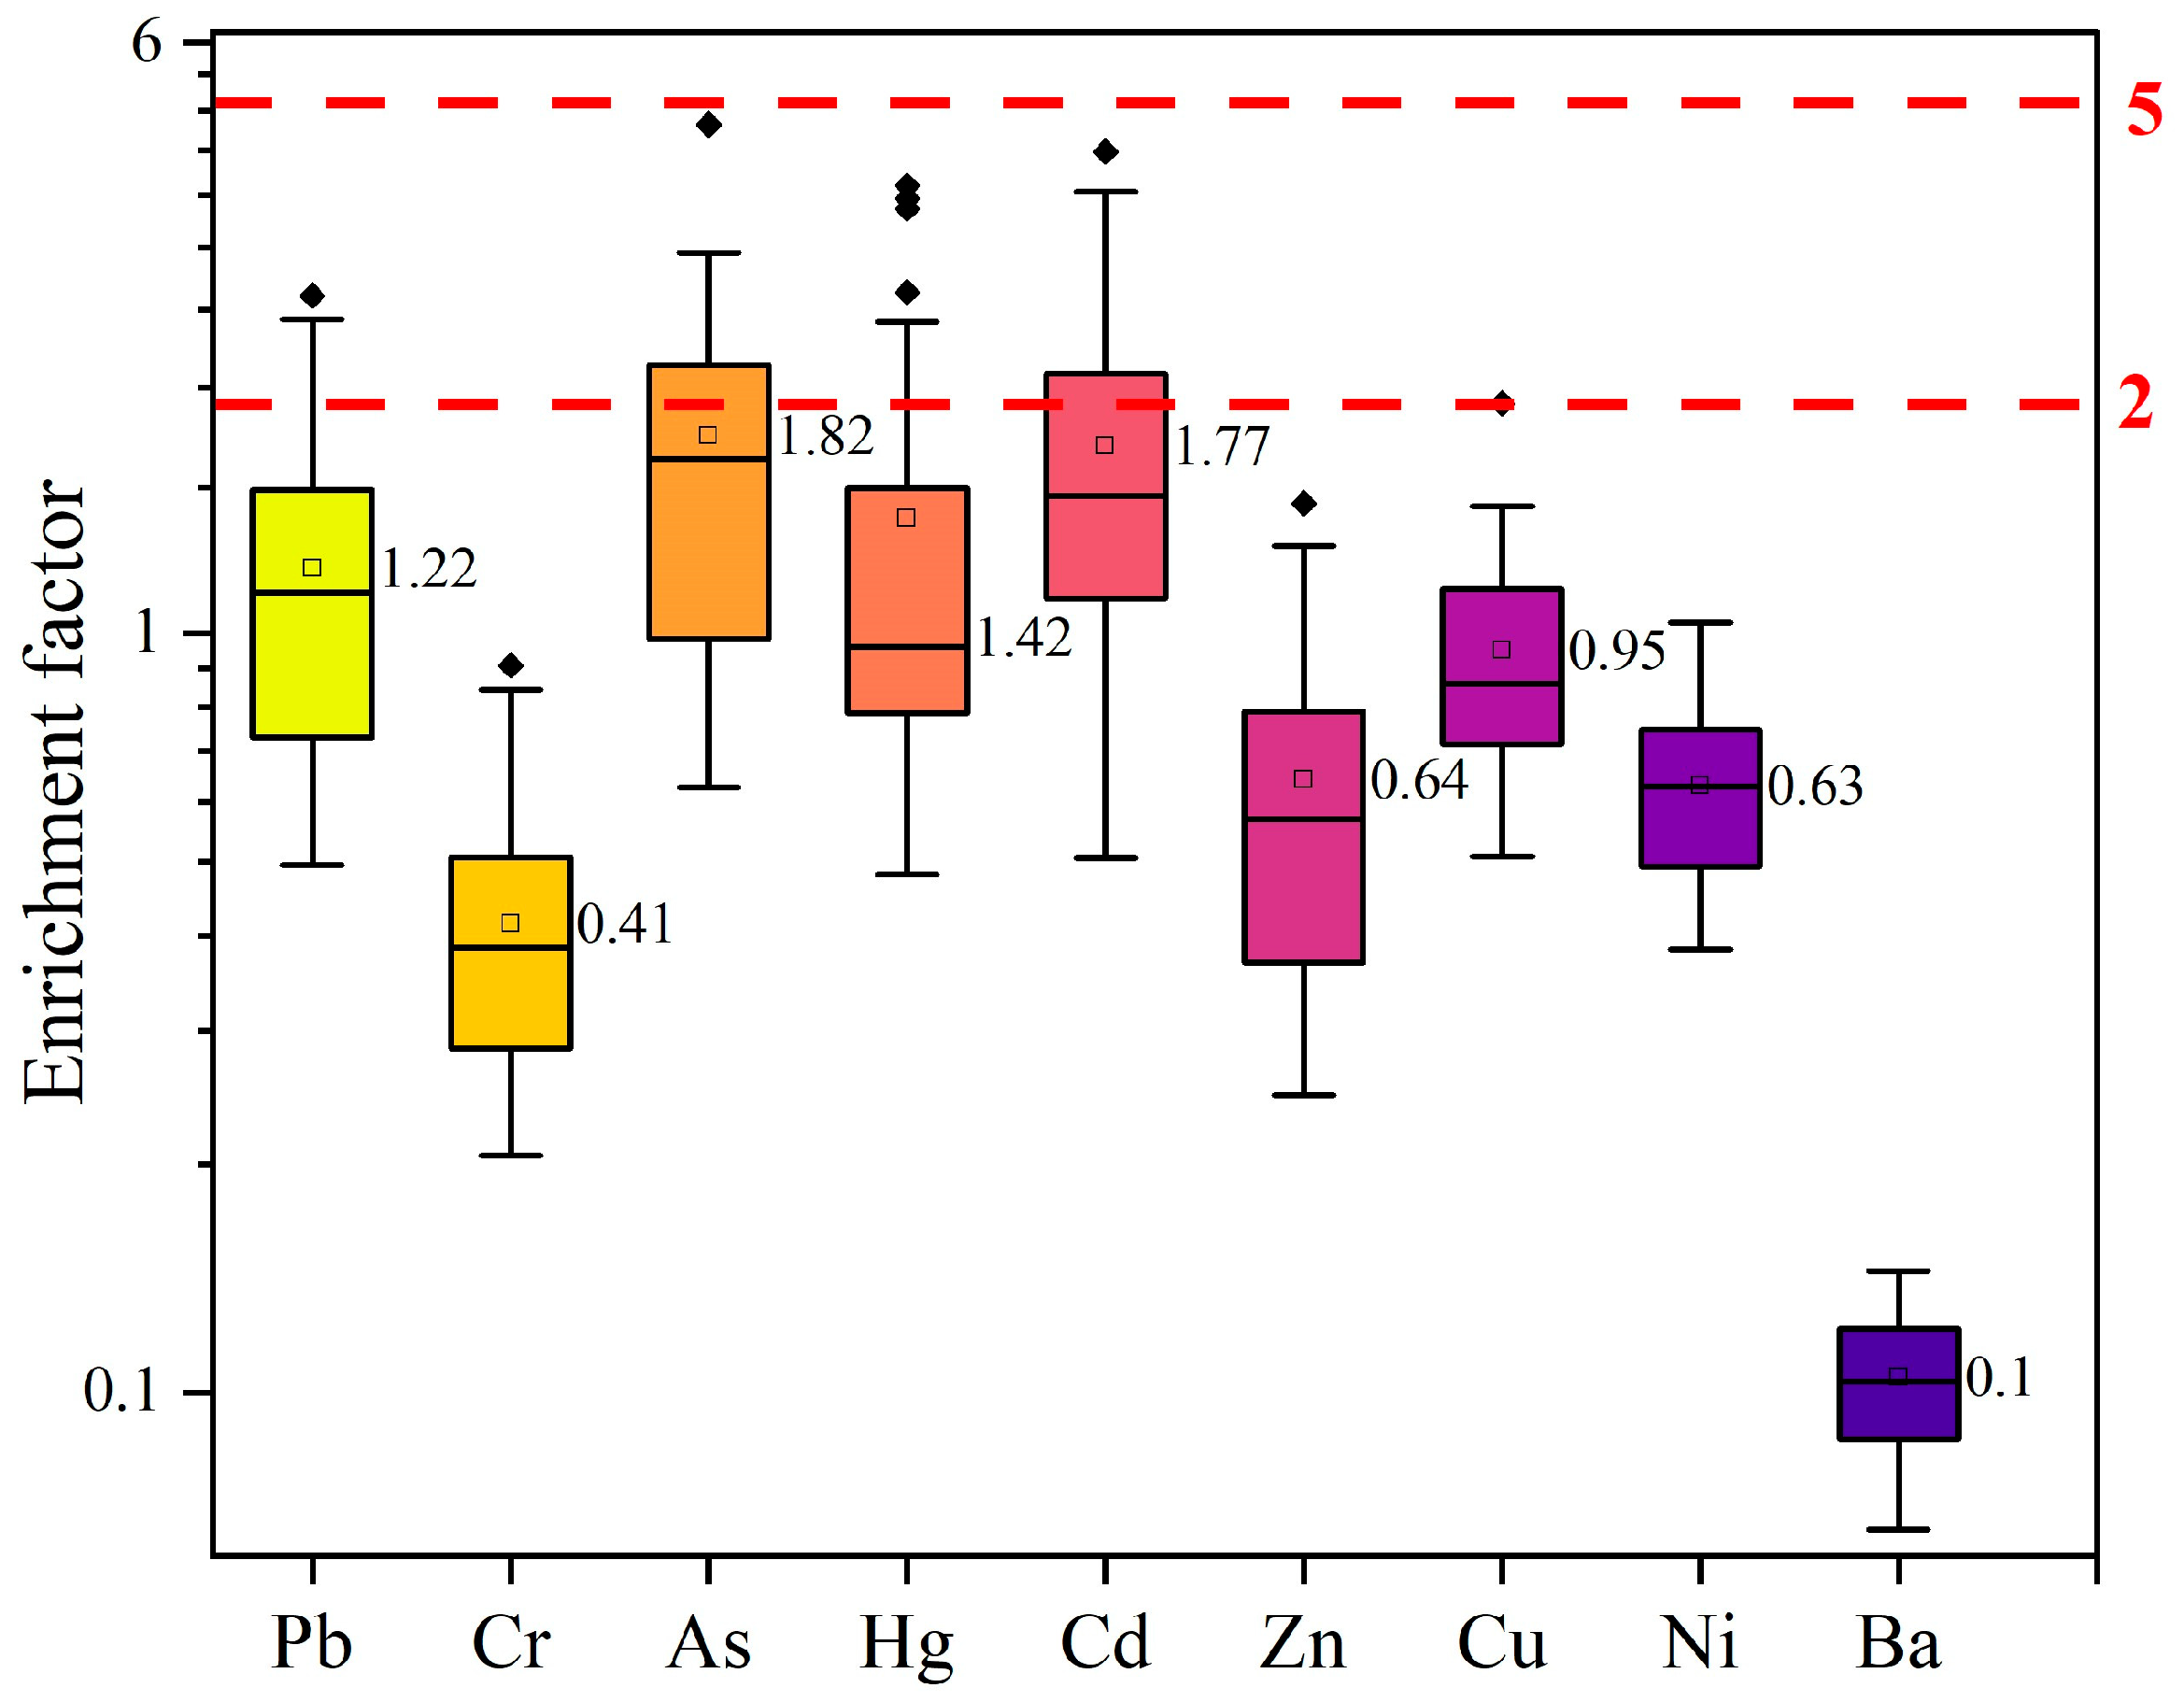
The enrichment factor (EF) is typically used to distinguish between the natural and anthropogenic origins of HMs in soil [40]. Huang et al. [70] reported that the soil exhibited moderate pollution by Cd and slight pollution by Hg, with mean EF values of 2.18 and 1.75, respectively. This finding indicates that contamination by these elements originates mainly from anthropogenic sources, in contrast to the analyzed HMs (Pb, Cu, Cr, Zn, As, and Ni) [70]. The EF was calculated for the nine HMs to determine the soil pollution levels, as shown in Figure 5. The EF values varied among the studied HMs and were in the range of 0.49–2.79 for Pb, 0.21–0.91 for Cr, 0.63–4.69 for As, 0.48–3.89 for Hg, 0.51–4.31 for Cd, 0.25–1.48 for Zn, 0.51–2.01 for Cu, 0.38–1.03 for Ni, and 0.07–0.14 for Ba. The results indicated moderate contamination (2 < EF < 5) of some soil samples with Pb, As, Hg, Cd, and Cu. However, the mean EF values for these HMs did not exceed the limit value of 2 and were 1.22, 1.82, 1.42, 1.77, and 0.95, respectively. Moderate enrichment was observed in 10% of the Pb samples and 3.3% of the Cu samples. Higher EF values for Pb were found at three sampling points (2, 10, and 11) in the industrial area, whereas sample 7 (adjacent to Brestovac village) showed moderate enrichment due to Cu. Mean EF values were 1.8, 1.4 and 1.7 for As, Hg and Cd, respectively, with 33%, 23%, and 27% of samples exceeding the moderate enrichment threshold (EF = 2). The highest enrichment was found in samples 2, 10, 11, 16, and 30, which were located in the vicinity of the oil refinery plants. The maximum EF value (4.69) was recorded for As in sample 11. The high EF values for some HMs may indicate their association with anthropogenic activities [18,63]. In contrast, Cr, Zn, Ni, Ba, and Mn had the lowest EF values, indicating that they were not enriched, seemingly because of their natural origin. Based on EF, none of the samples showed significant enrichment with the studied HMs.
A statistical summary of the Igeo results for HMs is presented in Table 2. The mean Igeo values decreased in the following order: As > Cd > Hg > Pb > Mn > Cu > Ni > Zn > Cr > Ba. Variations in the Igeo values were more prominent for Cd, Hg, and As, with variation range of −0.83–1.44, −0.91–1.34, and −0.62–1.45, respectively. According to this index, the pollution caused by Cd, As, and Hg was more serious than that caused by the other HMs. Moderate pollution was observed in 16.7%, 13.3%, and 3.3% of samples, respectively. All polluted samples (10, 11, 12, 16, 24, and 30) were located in a city or oil refining industrial area, whereas sampling site 30, located near the oil refinery, exhibited the highest Igeo values for As, Hg, and Cd. Increased Igeo values (greater than 0) were recorded in 20 samples for As and 16 samples for Cd. Moreover, only the mean Igeo values for As and Cd were greater than zero. The Igeo results indicate that these two HMs had the greatest impact on soil pollution. The oil refining industry has a significant impact on the environment and can emit large amounts of HMs [17]. The levels of contamination varied for Pb and Mn, with slightly more contamination observed for both metals. The Igeo values were between 0 and 1 for 23.3% and 13.3% of samples, respectively. The highest Igeo values for Pb were found in Pančevo City and the industrial area. Based on Igeo, soil pollution by Mn was insignificant, with values slightly higher than 0 at the sampling points around Dolovo, Banatsko Novo Selo, Glogonj, and Jabuka. The pollution rates were the lowest for Cr, Zn, Cu, Ni, and Ba, and 100% of the samples fell under the unpolluted (Igeo< 0) category. Hence, this index indicated that the pollution caused by Cr, Zn, Cu, Ni, and Ba was negligible in the study area. None of the samples had an Igeo value greater than 2; therefore, the established pollution was moderate.
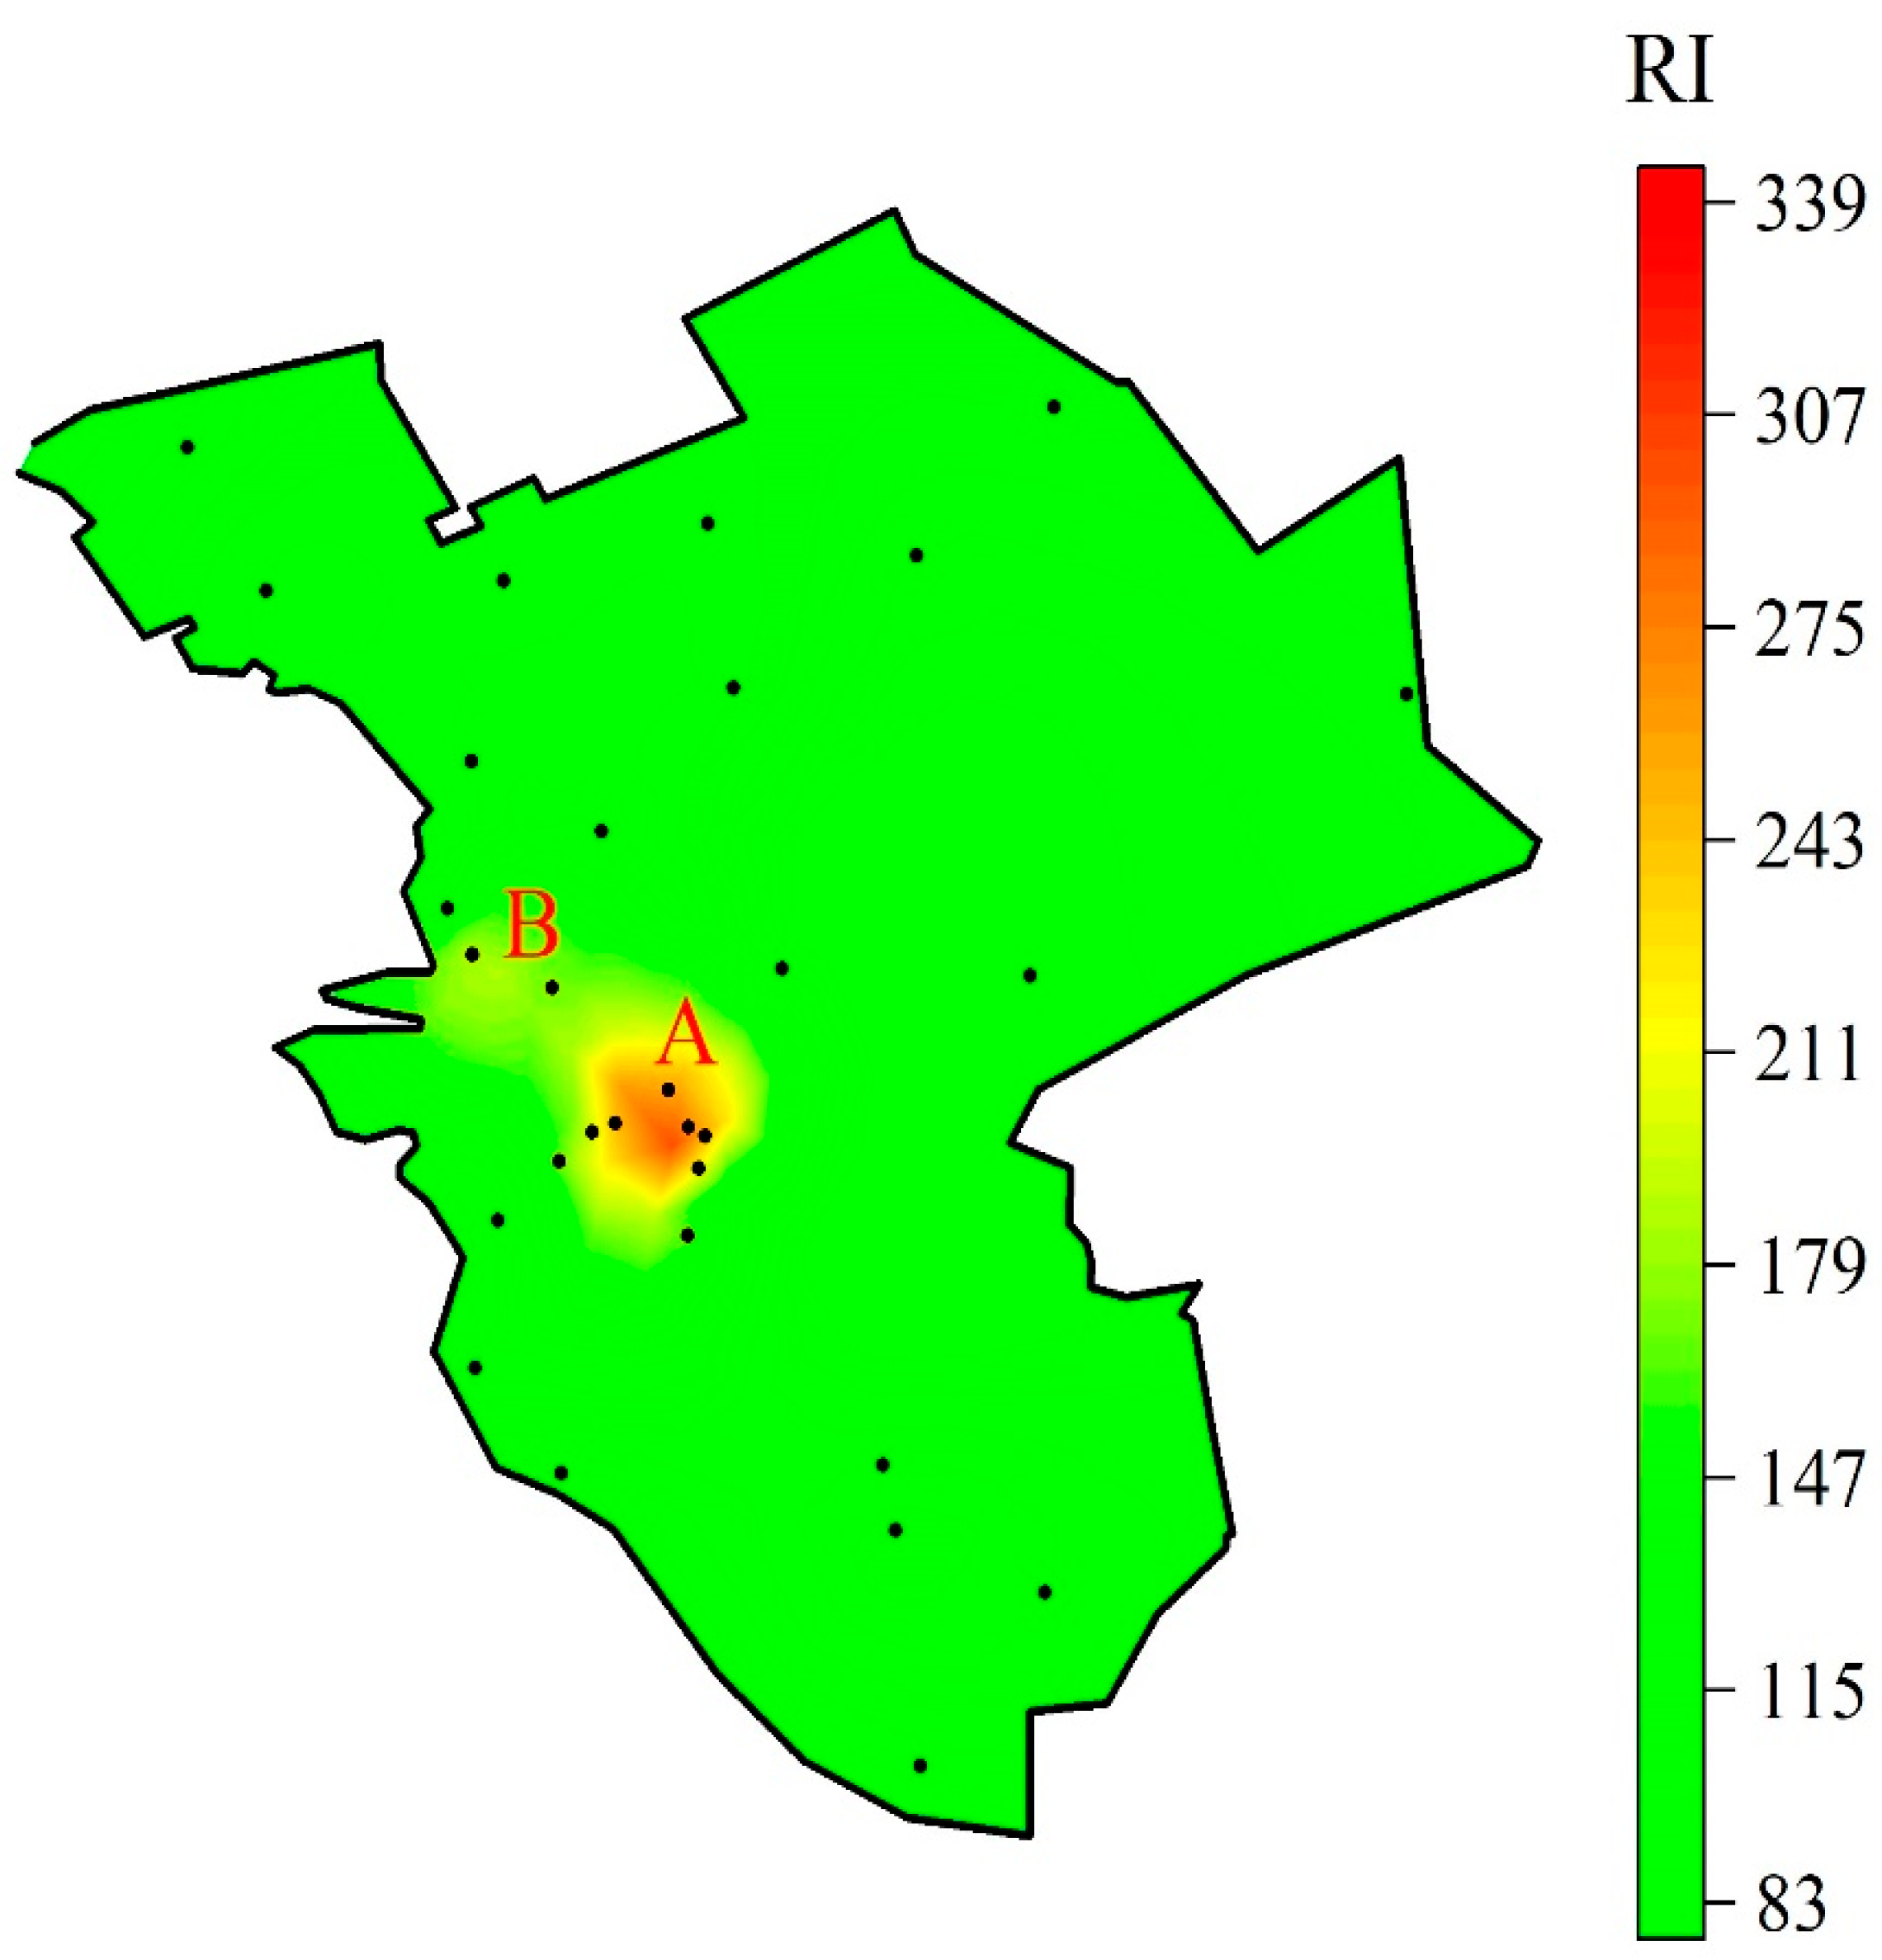
The spatial distribution of RI in the soil of the Pančevo municipality is illustrated in Figure 6. A GIS map was constructed to represent the ecological risk status of the soil. The distribution pattern of RI indicated that the samples with the highest pollution levels were located in the central part of the study area, industrial zone, and urban area of Pančevo City. The spatial distribution of RI is consistent with its greatest human impact on the environment [12]. Ecological risk was observed only in the Pančevo City area, whereas other areas with fewer human inputs had lower RI values. The RI values were calculated only for the nine HMs because of the lack of Tr for Ba. The distribution of the potential ecological risk index ranged from low (RI = 83.7) to significant (RI = 338). The mean RI was 145, which is close to the limit of moderate ecological risk. Based on the RI classification, 33.3% of the samples had some degree of contamination, and 66.7% had a low potential risk. Nine samples had a moderate ecological risk, and only one sample showed a significant ecological risk. According to the calculated RI, the highest value (RI =338) was observed at sample point 30, near the oil refinery. Other sampling points with elevated RI values were located either in the industrial zone (samples 2, 5, 10, 11, 16, and 30) or in Pančevo City and Starčevo (samples 12, 17, 24, and 28). The lowest RI value occurred in farmland soils near Dolovo Village (sample 14). In terms of Er, the Er values of Pb, Cr, Zn, Cu, Ni, Ba, and Mn were less than 40 in all samples. In contrast, Hg, Cd, and As were the major contributors to ecological risk, with loadings of 37.6%, 37%, and 12.6%, respectively. High concentrations of these elements, toxicity response factors, and potential impact risk have been reported [28]. The Er of individual HMs and their corresponding uncertainties are provided in Table S6. Considering the Er classification, Hg and Cd comprised 20% of the samples categorized as having considerable potential ecological risk to the environment. Moderate potential ecological risk was present in 56.7% and 53.3% of the samples for Hg and Cd, respectively, and in only one sample for As. It can be concluded that oil refining industry activities have the greatest influence on RI distribution patterns.

3.4. Concentration-Based Health Risk Assessment

The results of deterministic health risk assessment are presented in Table S7 and Figure S4. The GIS map revealed that the pollution hotspot was located in the industrial zone of Pančevo, which confirms the results of the ecological risk assessment. The mean HI values were 0.08 for adults and 0.74 for children, both below the threshold of 1, indicating no appreciable non-carcinogenic risk under the central-tendency scenario. The mean HI were 0.08 (adults) and 0.74 (children), resulting in insignificant adverse health effects. The highest HI value recorded for adults was 0.15, while children suffered from higher non-carcinogenic possibilities, with a maximum value of 1.42. Only 13.3% of the samples had HI values greater than one for children. In contrast, the HI values for adults ranged from 0.04 to 0.15, indicating low noncarcinogenic risk. The major contributors to the non-carcinogenic risk were As and Cr, accounting for nearly 50% and 30%, respectively. The average TCR values of 1.76 × 10⁻⁵ for adults and 3.97 × 10⁻⁵ for children fell into the acceptable carcinogenic risk category. All calculated TCR values were between 1 × 10⁻⁶ and 1 × 10⁻⁴, ranging from 8.38 × 10⁻⁶ to 3.26 × 10⁻⁵ for adults and 1.90 × 10⁻⁵ to 7.39 × 10⁻⁵ for children. The carcinogenic risk was highly influenced by the Cr concentration. The results obtained for non-carcinogenic and carcinogenic risks showed that ingestion is the primary exposure pathway [3]. Overall, children were more exposed to HMs impacts than adults were. Children are more exposed to potential risks than adults because of their behavioral characteristics. Specifically, children have increased contact with soil through play activities and are more prone to ingesting soil. Because of their lower body weight, identical concentrations of heavy metal(loid)s affect small children differently than they do adults [55].
Figure 7 shows the correlation between the ecological risk (RI) and the health risk indices (HI and TCR). The correlation was linear and confirmed that the samples with the highest ecological contamination also had the greatest impact on human health.

3.5. Source-Oriented Probabilistic Health Risk Assessment

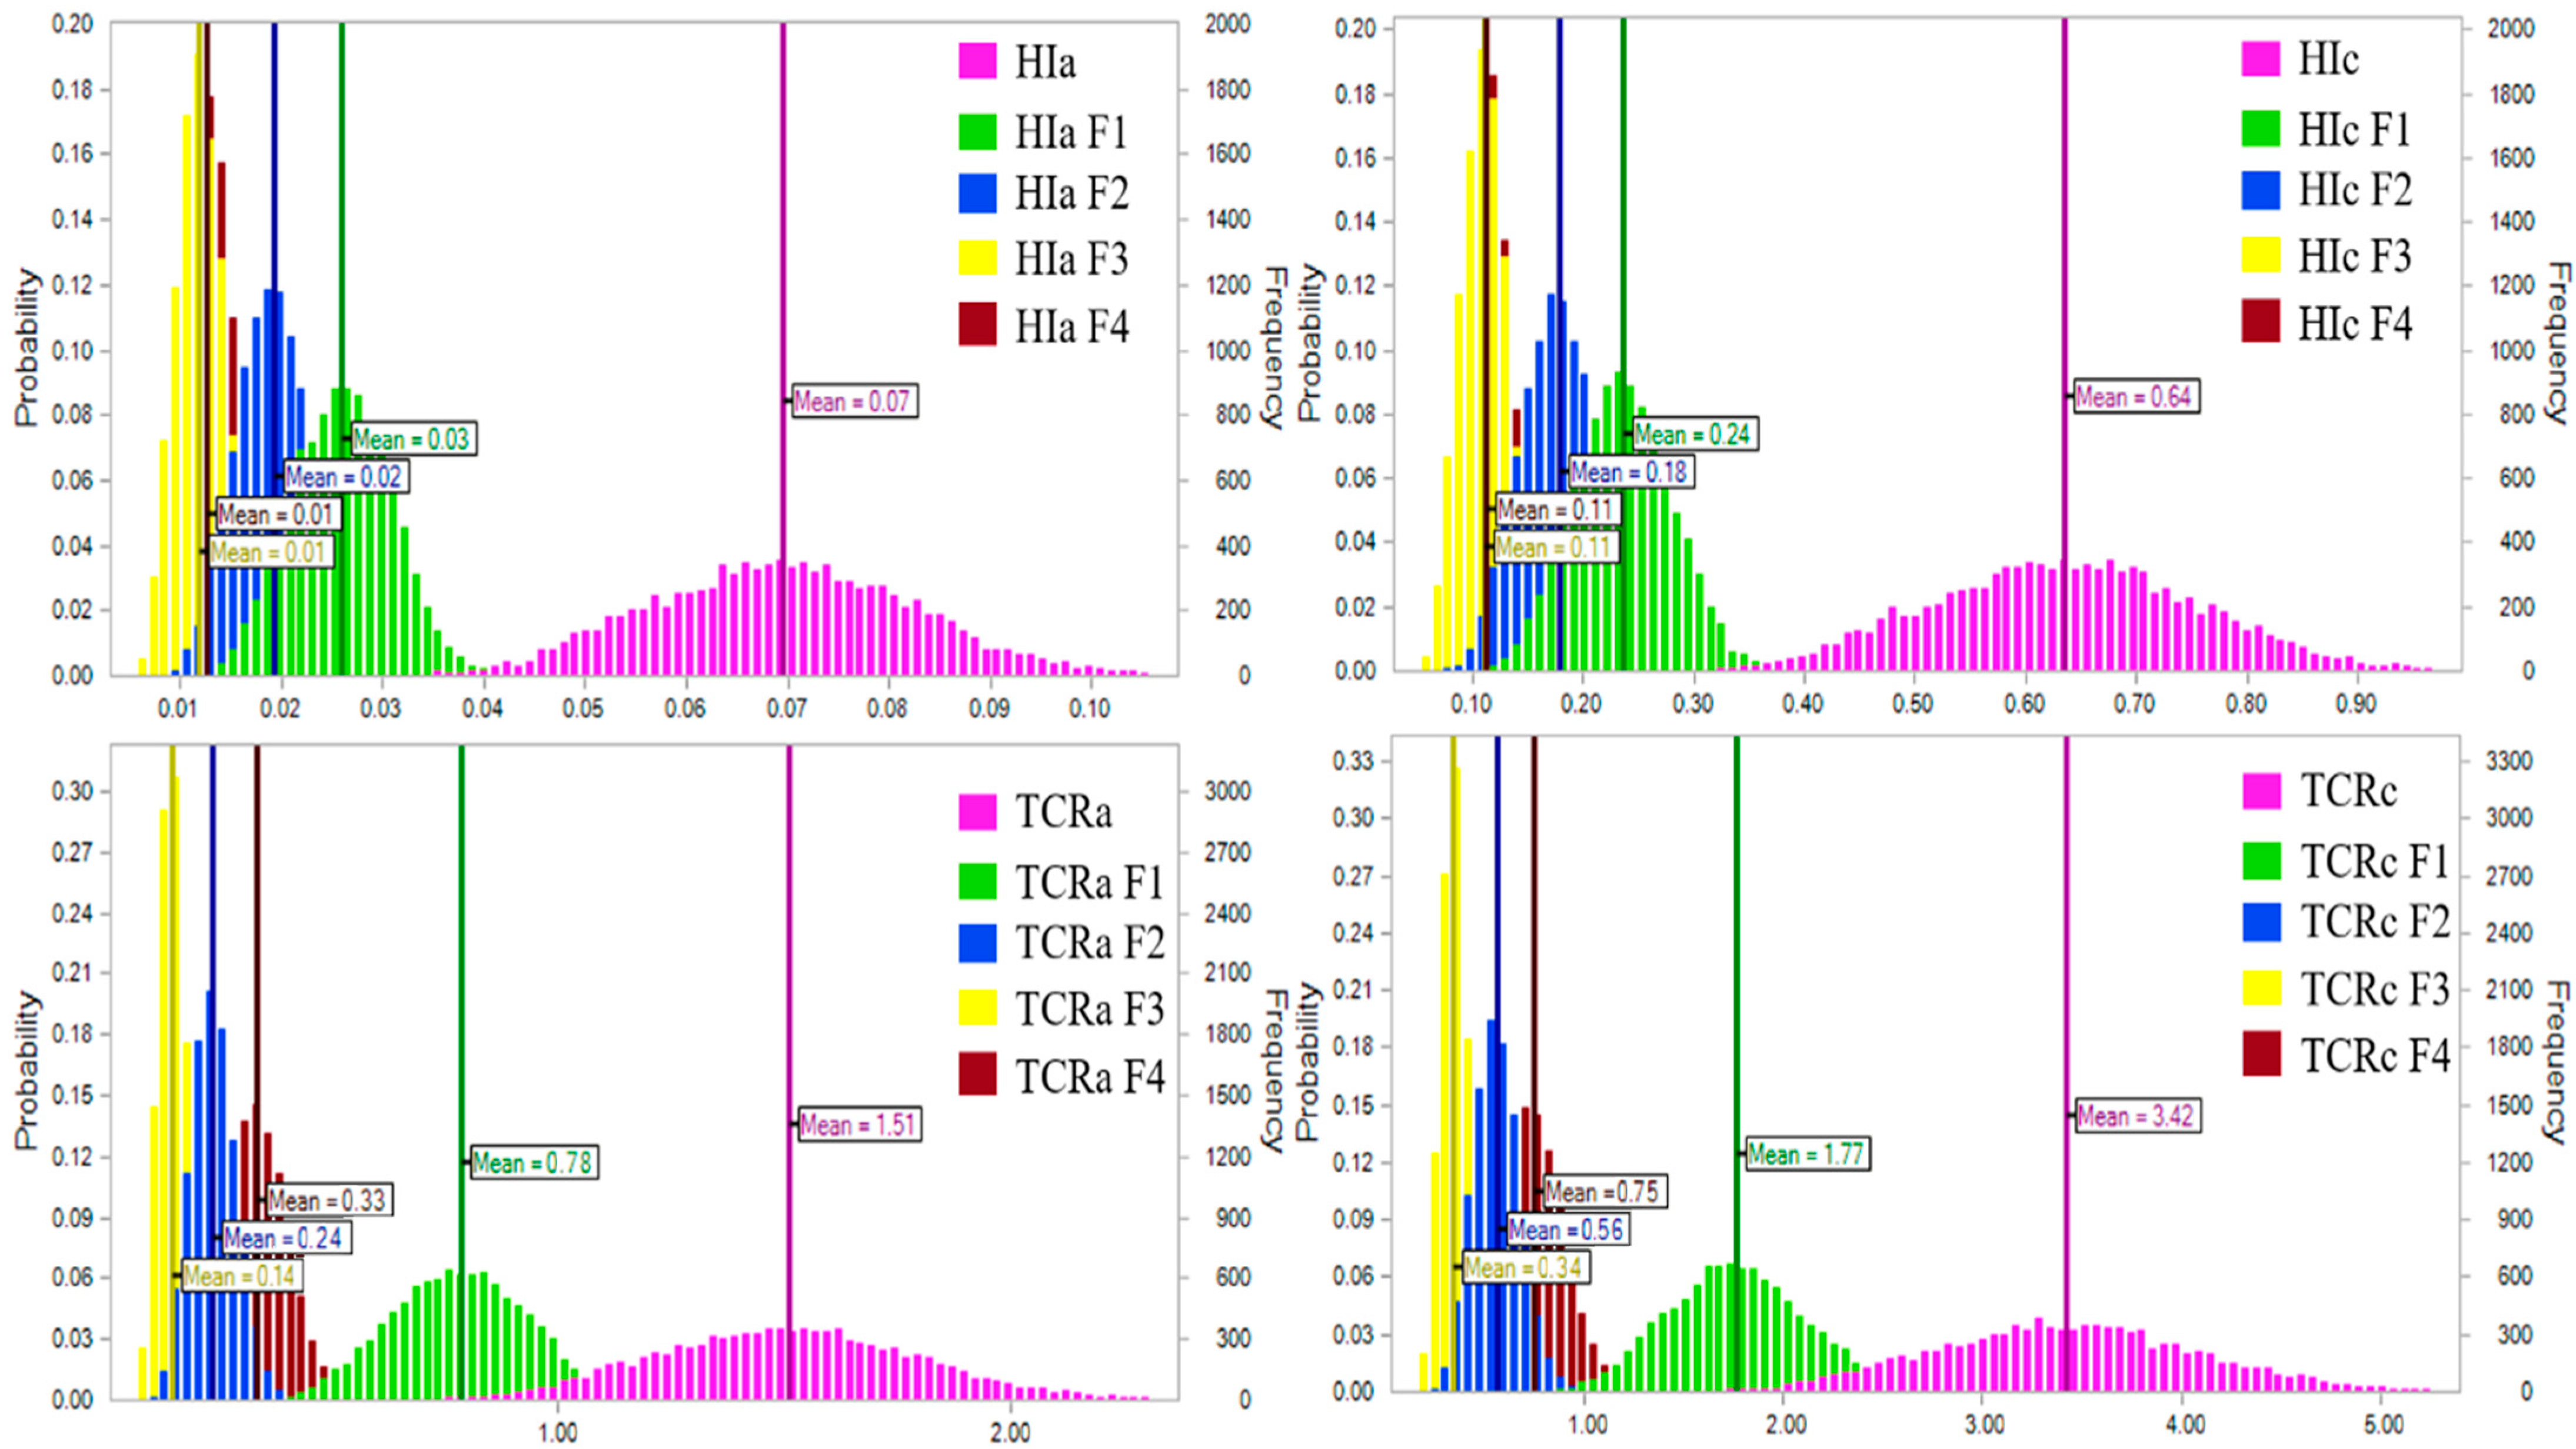
A Monte Carlo simulation was used to obtain probabilistic health risk assessment results for both the deterministic and source-specific models. Figure 8 shows the probabilities of developing non-carcinogenic and carcinogenic conditions in adults and children, while Table S8 displays the confidence interval of each factor for the total HI and TCR. The hazard index was less than one for both resident groups at the 90% confidence level. Additionally, similar results were derived for carcinogenic risk, with TCR values at 90%-ile of 1.88 × 10⁻⁵ for adults and 4.28 × 10⁻⁵ for children. These values did not exceed the limit of 1 × 10⁻⁴, implying that HMs posed no carcinogenic risk in the study area. In agreement with the results of deterministic risk, the probability of HM’s impact on children’s health was higher than that on adults. A sensitivity analysis was conducted to identify exposure parameters that had a major influence on the health risk assessment results [71]. Exposure frequency (ExpF) and body weight (BW) are the two primary factors influencing health risks in both adults and children.
The HI values fluctuated based on the source pollution with a decreasing trend: Factor 1 (oil refining industry emissions; 37%) > Factor 2 (agricultural activities; 27.2%) > Factor 4 (natural source; 18.5%) > Factor 3 (traffic emissions; 17.3%). On the other hand, Factor 1 (51.9%) dominately affected the TCR results, followed by Factor 4 (22.3%), Factor 2 (15.9%), and Factor 3 (9.8%). Despite this, neither HI nor TCR values at the 90% confidence level exceeded the threshold limit. However, the results of this study showed that anthropogenic sources, especially related industries, have a major impact on health risks. This emphasizes the significance of performing source-specific risk assessment, especially in highly contaminated locations.

4. Conclusions

A comprehensive study of HM contamination in the soil of Pančevo, a mid-sized industrial city near a large oil refining facility and its surroundings, was conducted through spatial distribution, source apportionment, and ecological and health risks. The results showed that the concentrations of Hg, Pb, Cd, and As exceeded the UCC background concentrations by 40, 53, 90, and 93% of the samples, respectively. The spatial distribution indicated the highest pollution in the industrial area, with similar patterns observed for Pb, As, Hg, Cd, and Zn. However, the distribution pattern in rural areas was mainly influenced by high OM, clay, Ni, Ba, and Mn content. Pearson correlation and hierarchical cluster analyses were used to classify the studied analytes into multiple categories, indicating that they had different origins. The PMF defined four possible pollution sources: Hg, Cr, and As were derived from the chemical industry; agricultural practices contributed to the higher Cu concentration, and the observed correlation with pH likely reflects liming practices or fertilizer effects; Cd, Zn, and Pb originated from traffic emissions; and the contents of OM, clay, Ni, Ba, and Mn were influenced by natural sources. The enrichment factor displayed the highest values for As, Hg, and Cd, showing that 33%, 23%, and 27% of the samples, respectively, were moderately contaminated with these HMs. The geoaccumulation index confirmed these results, emphasizing that As and Cd have a greater influence on soil pollution than Hg does. The potential ecological risk index ranged from 83.7 to 338, categorizing 30% of the samples as having moderate ecological risk and only 3.3% as having a significant ecological risk. The spatial distribution of the RI identified a major hotspot in the industrial zone. The average HI and TCR values were lower than the permissible limits, indicating no significant adverse noncarcinogenic or carcinogenic effects. Nevertheless, 13.3% of the children showed increased HI values (>1). The probabilistic health risk assessment confirmed these results, showing that even at a 90% confidence level, the HI and TCR values were within acceptable ranges. Moreover, the distribution of source-specific risks indicated low non-carcinogenic and carcinogenic risks, with the greatest contribution from the oil refining industry emissions (Factor 1). The findings of this study provide novel insights into the distribution, source apportionment, and health risk of heavy metal(loid)s in soils near the Pančevo oil refinery, which has not been systematically assessed before. These results can serve as a reference for comparative soil assessments and contribute to a better understanding of refinery-related soil pollution. This study has several limitations that could be overcome in future research. Seasonal monitoring of HMs concentrations, deeper soil profiling, and assessment of the bioavailability of the measured concentrations could provide more detailed insights into soil contamination and its impact on human health.

Supplementary Materials

The following supporting information can be downloaded at: https://www.mdpi.com/article/10.3390/urbansci9100415/s1; Table S1: Concentrations (mg/kg) and standard deviation for each heavy metal(loid) measured in the study based on triplicate sample analyses; Table S2: Average recovery of each heavy metal(loid) based on analysis of NIST SRM 2711a (Montana II soil). Certified values are given for reference, and recoveries are calculated as (measured ÷ certified) × 100%; Table S3: Classification of EF, Igeo, and RI risk indices; Table S4: Distribution and definition of parameters used in health risk assessment [60]; Table S5: The reference doses (mg·kg−1·day−1) and carcinogenic slope factors (kg·day·mg−1) for studied PTEs [60]; Table S6: The potential ecological risk index of individual HMs (Er) and the corresponding standard deviation values; Table S7: Non-carcinogenic and carcinogenic risk of adults and children; Table S8: 95% confidence interval of each factor to the total HI and total TCR; Figure S1: The land-use classess in the Pančevo municipality; Figure S2: Pearson correlation analysis of analyzed parameters in soil samples; Figure S3: Contributions of the four factors to the soil HM pollution; Figure S4. Spatial distribution of HI and TCR in the soil near oil refinery facilities.

Author Contributions

Investigation, A.M.; writing—original draft preparation, A.M.; visualization, J.V.; methodology, J.V.; Conceptualization, M.L.; software, M.L.; formal analysis, M.V.; validation, M.V.; data curation, D.C.; resources, D.C.; funding acquisition, N.P.; project administration, N.P.; supervision, A.O.; writing—review and editing, A.O. All authors have read and agreed to the published version of the manuscript.

Funding

This research was funded by the Ministry of Science, Technological Development, and Innovation of the Republic of Serbia (Contract No: 451-03-136/2025-03/200135, 451-03-136/2025-03/200017, and 451-03-136/2025-03/200287).

Data Availability Statement

Data is contained within the article or Supplementary Material.

Conflicts of Interest

The authors declare no conflicts of interest.

References

  1. Yang, S.; Zhao, J.; Chang, S.X.; Collins, C.; Xu, J.; Liu, X. Status Assessment and Probabilistic Health Risk Modeling of Metals Accumulation in Agriculture Soils across China: A Synthesis. Environ. Int. 2019, 128, 165–174. [Google Scholar] [CrossRef]
  2. Kormoker, T.; Proshad, R.; Islam, S.; Ahmed, S.; Chandra, K.; Uddin, M.; Rahman, M. Toxic Metals in Agricultural Soils near the Industrial Areas of Bangladesh: Ecological and Human Health Risk Assessment. Toxin Rev. 2019, 40, 1135–1154. [Google Scholar] [CrossRef]
  3. Khodadadi, N.; Amini, A.; Dehbandi, R. Contamination, Probabilistic Health Risk Assessment and Quantitative Source Apportionment of Potentially Toxic Metals (PTMs) in Street Dust of a Highly Developed City in North of Iran. Environ. Res. 2022, 210, 112962. [Google Scholar] [CrossRef]
  4. Emami, H.; Memarzadeh, M.; Naghizade Asl, F. Carcinogenic and Non-Carcinogenic Health Risks of Heavy Metals in Windborne Sediments from a Residential Area (Case Study: Tabas, Iran). Aeolian Res. 2024, 70–71, 100938. [Google Scholar] [CrossRef]
  5. Reis, G.A.; Alves Martins, M.V.; Santos, L.M.G.; Neto, S.A.V.; Junior, F.B.; Geraldes, M.C.; Bergamaschi, S.; Figueira, R.C.L.; Patinha, C.; da Silva, E.F.; et al. Contamination by Potentially Toxic Elements (PTEs) in Agricultural Products Grown Around Sepetiba Bay, Rio de Janeiro State (SE Brazil). Arch. Environ. Contam. Toxicol. 2025, 89, 195–220. [Google Scholar] [CrossRef]
  6. Huang, W.; Sun, W.; Zhou, C.; Long, K.; Zhang, Z. Probabilistic Health Risk Assessment and Grading Benchmark Estimation of Atmospheric PM2.5-Bound Heavy Metals in China. Arch. Environ. Contam. Toxicol. 2025, 88, 377–396. [Google Scholar] [CrossRef]
  7. Vesković, J.; Bulatović, S.; Miletić, A.; Tadić, T.; Marković, B.; Nastasović, A.; Onjia, A. Source-Specific Probabilistic Health Risk Assessment of Potentially Toxic Elements in Groundwater of a Copper Mining and Smelter Area. Stoch. Environ. Res. Risk Assess. 2024, 38, 1597–1612. [Google Scholar] [CrossRef]
  8. Trajković, I.; Sentić, M.; Miletić, A.; Vesković, J.; Lučić, M.; Onjia, A. Occurrence, Source Apportionment, and Ecological Risk of Potentially Toxic Elements in an Urban Shallow Lake Sediment. Chem. Ecol. 2024, 40, 1092–1113. [Google Scholar] [CrossRef]
  9. Tokatlı, C.; Ustaoğlu, F.; Yazman, M.M.; Yüksel, B. Where Rivers Meet the Sea: Source Fingerprinting and Health Risk Mapping of Potentially Hazardous Elements in Sediments from the Çanakkale Strait Basin (Türkiye). Mar. Pollut. Bull. 2026, 222, 118626. [Google Scholar] [CrossRef] [PubMed]
  10. Alzahrani, Y.; Alshehri, F.; El-Sorogy, A.S.; Alzahrani, H. Environmental Assessment of Heavy Metals in Soils around Al-Janabeen Dam, Southwest Saudi Arabia. J. King Saud Univ.-Sci. 2023, 35, 102503. [Google Scholar] [CrossRef]
  11. Panghal, V.; Singh, A.; Kumar, R.; Kumari, G.; Kumar, P.; Kumar, S. Soil Heavy Metals Contamination and Ecological Risk Assessment in Rohtak Urban Area, Haryana (India). Environ. Earth Sci. 2021, 80, 731. [Google Scholar] [CrossRef]
  12. Men, C.; Liu, R.; Xu, L.; Wang, Q.; Guo, L.; Miao, Y.; Shen, Z. Source-Specific Ecological Risk Analysis and Critical Source Identification of Heavy Metals in Road Dust in Beijing, China. J. Hazard. Mater. 2020, 388, 121763. [Google Scholar] [CrossRef]
  13. Zhao, Z.; Hao, M.; Li, Y.; Li, S. Contamination, Sources and Health Risks of Toxic Elements in Soils of Karstic Urban Parks Based on Monte Carlo Simulation Combined with a Receptor Model. Sci. Total Environ. 2022, 839, 156223. [Google Scholar] [CrossRef]
  14. Mohebian, M.; Sobhanardakani, S.; Taghavi, L.; Ghoddousi, J. Analysis and Potential Ecological Risk Assessment of Heavy Metals in the Surface Soils Collected from Various Land Uses around Shazand Oil Refinery Complex, Arak, Iran. Arab. J. Geosci. 2021, 14, 2019. [Google Scholar] [CrossRef]
  15. Mokhtarzadeh, Z.; Keshavarzi, B.; Moore, F.; Marsan, F.A.; Padoan, E. Potentially Toxic Elements in the Middle East Oldest Oil Refinery Zone Soils: Source Apportionment, Speciation, Bioaccessibility and Human Health Risk Assessment. Environ. Sci. Pollut. Res. 2020, 27, 40573–40591. [Google Scholar] [CrossRef] [PubMed]
  16. Alshahri, F.; El-Taher, A. Assessment of Heavy and Trace Metals in Surface Soil Nearby an Oil Refinery, Saudi Arabia, Using Geoaccumulation and Pollution Indices. Arch. Environ. Contam. Toxicol. 2018, 75, 390–401. [Google Scholar] [CrossRef]
  17. Naraki, H.; Keshavarzi, B.; Zarei, M.; Moore, F.; Abbasi, S.; Kelly, F.J.; Dominguez, A.O.; Jaafarzadeh, N. Urban Street Dust in the Middle East Oldest Oil Refinery Zone: Oxidative Potential, Source Apportionment، and Health Risk Assessment of Potentially Toxic Elements. Chemosphere 2021, 268, 128825. [Google Scholar] [CrossRef]
  18. Singha, W.J.; Deka, H. Ecological and Human Health Risk Associated with Heavy Metals (HMs) Contaminant Sourced from Petroleum Refinery Oily Sludge. J. Hazard. Mater. 2024, 476, 135077. [Google Scholar] [CrossRef] [PubMed]
  19. Duan, Y.; Zhang, Y.; Li, S.; Fang, Q.; Miao, F.; Lin, Q. An Integrated Method of Health Risk Assessment Based on Spatial Interpolation and Source Apportionment. J. Clean. Prod. 2020, 276, 123218. [Google Scholar] [CrossRef]
  20. Ke, W.; Zeng, J.; Zhu, F.; Luo, X.; Feng, J.; He, J.; Xue, S. Geochemical Partitioning and Spatial Distribution of Heavy Metals in Soils Contaminated by Lead Smelting. Environ. Pollut. 2022, 307, 119486. [Google Scholar] [CrossRef]
  21. Guo, G.; Wang, Y.; Zhang, D.; Li, K.; Lei, M. Human Health Risk Apportionment from Potential Sources of Heavy Metals in Agricultural Soils and Associated Uncertainty Analysis. Environ. Geochem. Health 2023, 45, 881–897. [Google Scholar] [CrossRef]
  22. Onjia, A.; Huang, X.; Trujillo González, J.M.; Egbueri, J.C. Editorial: Chemometric Approach to Distribution, Source Apportionment, Ecological and Health Risk of Trace Pollutants. Front. Environ. Sci. 2022, 10, 1107465. [Google Scholar] [CrossRef]
  23. Saha, A.; Gupta, B.S.; Patidar, S.; Martinez-Villegas, N. Spatial Distribution and Source Identification of Metal Contaminants in the Surface Soil of Matehuala, Mexico Based on Positive Matrix Factorization Model and GIS Techniques. Front. Soil Sci. 2022, 2, 1041377. [Google Scholar] [CrossRef]
  24. Trujillo-González, J.M.; Torres-Mora, M.A.; Serrano-Gómez, M.; Castillo-Monroy, E.F.; Jiménez Ballesta, R.; Rodrigo-Comino, J. Mapping Potential Toxic Elements in Agricultural and Natural Soils of the Piedemonte Llanero in Colombia. Water. Air. Soil Pollut. 2022, 233, 102. [Google Scholar] [CrossRef]
  25. Jiang, W.; Meng, L.; Liu, F.; Sheng, Y.; Chen, S.; Yang, J.; Mao, H.; Zhang, J.; Zhang, Z.; Ning, H. Distribution, Source Investigation, and Risk Assessment of Topsoil Heavy Metals in Areas with Intensive Anthropogenic Activities Using the Positive Matrix Factorization (PMF) Model Coupled with Self-Organizing Map (SOM). Environ. Geochem. Health 2023, 45, 6353–6370. [Google Scholar] [CrossRef] [PubMed]
  26. Li, X.; Li, L.; Zhou, Z.; Li, T.; An, J.; Zhang, S.; Xu, X.; Pu, Y.; Wang, G.; Jia, Y.; et al. Soil Potentially Toxic Element Pollution at Different Urbanization Intensities: Quantitative Source Apportionment and Source-Oriented Health Risk Assessment. Ecotoxicol. Environ. Saf. 2023, 251, 114550. [Google Scholar] [CrossRef] [PubMed]
  27. Miletić, A.; Vesković, J.; Lučić, M.; Onjia, A. Monte Carlo Simulation of Source-Specific Risks of Soil at an Abandoned Lead-Acid Battery Recycling Site. Stoch. Environ. Res. Risk Assess. 2024, 38, 3313–3329. [Google Scholar] [CrossRef]
  28. Tan, C.; Wang, H.; Yang, Q.; Yuan, L.; Zhang, Y.; Martín, J.D. An Integrated Approach for Quantifying Source Apportionment and Source-Oriented Health Risk of Heavy Metals in Soils near an Old Industrial Area. Environ. Pollut. 2023, 323, 121271. [Google Scholar] [CrossRef]
  29. Espindola, P.R.; De Pádua Melo, E.S.; Espindola, D.A.L.F.; Zoccal Garcia, D.A.; Aragão, V.; Pereira Ancel, M.A.; Pott, A.; Do Nascimento, V.A. Assessment of Metal (Loid) s in Fern Amauropelta Rivularioides (Fee), Soil, and River Water in a Peri-Urban Agriculture Area on the Brazil—Paraguay Border. Urban Sci. 2025, 9, 324. [Google Scholar] [CrossRef]
  30. Wang, F.; Guan, Q.; Tian, J.; Lin, J.; Yang, Y.; Yang, L.; Pan, N. Contamination Characteristics, Source Apportionment, and Health Risk Assessment of Heavy Metals in Agricultural Soil in the Hexi Corridor. Catena 2020, 191, 104573. [Google Scholar] [CrossRef]
  31. Liang, J.; Liu, Z.; Tian, Y.; Shi, H.; Fei, Y.; Qi, J.; Mo, L. Research on Health Risk Assessment of Heavy Metals in Soil Based on Multi-Factor Source Apportionment: A Case Study in Guangdong Province, China. Sci. Total Environ. 2023, 858, 159991. [Google Scholar] [CrossRef]
  32. Deng, W.; Liu, W.; Li, X.; Yang, Y. Source Apportionment of and Potential Health Risks Posed by Trace Elements in Agricultural Soils: A Case Study of the Guanzhong Plain, Northwest China. Chemosphere 2020, 258, 127317. [Google Scholar] [CrossRef]
  33. Li, D.; Lu, Q.; Cai, L.; Chen, L.; Wang, H. Characteristics of Soil Heavy Metal Pollution and Health Risk Assessment in Urban Parks at a Megacity of Central China. Toxics 2023, 11, 257. [Google Scholar] [CrossRef] [PubMed]
  34. Ma, Y.; Zhang, Y.; Song, L. Ecological and Health Risk Assessment and Anthropogenic Sources Analysis of Heavy Metals in Different Types of Urban Road Dust. Process Saf. Environ. Prot. 2025, 195, 106813. [Google Scholar] [CrossRef]
  35. Egbueri, J.C.; Ukah, B.U.; Ubido, O.E.; Unigwe, C.O. A Chemometric Approach to Source Apportionment, Ecological and Health Risk Assessment of Heavy Metals in Industrial Soils from Southwestern Nigeria. Int. J. Environ. Anal. Chem. 2020, 102, 3399–3417. [Google Scholar] [CrossRef]
  36. Wang, Z.; Chen, X.; Yu, D.; Zhang, L.; Wang, J.; Lv, J. Source Apportionment and Spatial Distribution of Potentially Toxic Elements in Soils: A New Exploration on Receptor and Geostatistical Models. Sci. Total Environ. 2021, 759, 143428. [Google Scholar] [CrossRef]
  37. Wu, Q.; Hu, W.; Wang, H.; Liu, P.; Wang, X.; Huang, B. Spatial Distribution, Ecological Risk and Sources of Heavy Metals in Soils from a Typical Economic Development Area, Southeastern China. Sci. Total Environ. 2021, 780, 146557. [Google Scholar] [CrossRef] [PubMed]
  38. Radomirović, M.; Miletić, A.; Onjia, A. Accumulation of Heavy Metal(Loid)s and Polycyclic Aromatic Hydrocarbons in the Sediment of the Prahovo Port (Danube) and Associated Risks. Environ. Monit. Assess. 2023, 195, 323. [Google Scholar] [CrossRef] [PubMed]
  39. Kumar, V.; Sharma, A.; Kaur, P.; Sidhu, G.P.S.; Bali, A.S.; Bhardwaj, R.; Thurkal, A.K.; Cerda, A. Pollution Assessment of Heavy Metals in Soils of India and Ecological Risk Assessment: A State-of-the-Art. Chemosphere 2019, 216, 449–462. [Google Scholar] [CrossRef]
  40. Bhuiyan, M.A.H.; Karmaker, S.C.; Bodrud-Doza, M.; Rakib, M.A.; Saha, B.B. Enrichment, Sources and Ecological Risk Mapping of Heavy Metals in Agricultural Soils of Dhaka District Employing SOM, PMF and GIS Methods. Chemosphere 2021, 263, 128339. [Google Scholar] [CrossRef]
  41. USEPA. EPA Positive Matrix Factorization (PMF) 5.0 Fundamentals and User Guide; Office of Research and Development, U.S. Environmental Protection Agency: Washington, DC, USA, 2014; p. 20460.
  42. Ene, A.; Moraru, S.S.; Moraru, D.I.; Pantelica, A.; Gosav, S.; Ceoromila, A.M. Major and Trace Element Accumulation in Soils and Crops (Wheat, Corn, Sunflower) around Steel Industry in the Lower Danube Basin and Associated Ecological and Health Risks. Appl. Sci. 2024, 14, 5616. [Google Scholar] [CrossRef]
  43. Heidari, M.; Darijani, T.; Alipour, V. Heavy Metal Pollution of Road Dust in a City and Its Highly Polluted Suburb; Quantitative Source Apportionment and Source-Specific Ecological and Health Risk Assessment. Chemosphere 2021, 273, 129656. [Google Scholar] [CrossRef]
  44. Zerizghi, T.; Guo, Q.; Tian, L.; Wei, R.; Zhao, C. An Integrated Approach to Quantify Ecological and Human Health Risks of Soil Heavy Metal Contamination around Coal Mining Area. Sci. Total Environ. 2022, 814, 152653. [Google Scholar] [CrossRef]
  45. Yang, X.; Cheng, B.; Gao, Y.; Zhang, H.; Liu, L. Heavy Metal Contamination Assessment and Probabilistic Health Risks in Soil and Maize near Coal Mines. Front. Public Health 2022, 10, 1004579. [Google Scholar] [CrossRef]
  46. Wu, F.; Zhu, D.; Yang, T.; Mao, C.; Huang, W.; Zhou, S.; Yang, Y. Soil Heavy Metal Accumulation and Ecological Risk in Mount Wuyi: Impacts of Vegetation Types and Pollution Sources. Land 2025, 14, 712. [Google Scholar] [CrossRef]
  47. Müller, G. Index of Geoaccumulation in Sediments of the Rhine River. Geo J. 1969, 2, 108–118. [Google Scholar]
  48. Świercz, A.; Zajecka, E. Accumulation of Heavy Metals in the Urban Soils of the City of Skarzysko-Kamienna (Poland) with Regard to Land Use. Carpathian J. Earth Environ. Sci. 2018, 13, 249–266. [Google Scholar] [CrossRef]
  49. Zhang, H.; Zhang, F.; Song, J.; Tan, M.L.; Kung, H.; Johnson, V.C. Pollutant Source, Ecological and Human Health Risks Assessment of Heavy Metals in Soils from Coal Mining Areas in Xinjiang, China. Environ. Res. 2021, 202, 111702. [Google Scholar] [CrossRef] [PubMed]
  50. Hakanson, L. An Ecological Risk Index for Aquatic Pollution Control. A Sedimentological Approach. Water Res. 1980, 14, 975–1001. [Google Scholar] [CrossRef]
  51. Xu, Q.; Wang, J.; Shi, W. Source Apportionment and Potential Ecological Risk Assessment of Heavy Metals in Soils on a Large Scale in China. Environ. Geochem. Health 2023, 45, 1413–1427. [Google Scholar] [CrossRef]
  52. Gujre, N.; Mitra, S.; Soni, A.; Agnihotri, R.; Rangan, L.; Rene, E.R.; Sharma, M.P. Speciation, Contamination, Ecological and Human Health Risks Assessment of Heavy Metals in Soils Dumped with Municipal Solid Wastes. Chemosphere 2021, 262, 128013. [Google Scholar] [CrossRef] [PubMed]
  53. Long, Z.; Huang, Y.; Zhang, W.; Shi, Z.; Yu, D.; Chen, Y.; Liu, C.; Wang, R. Effect of Different Industrial Activities on Soil Heavy Metal Pollution, Ecological Risk, and Health Risk. Environ. Monit. Assess. 2021, 193, 20. [Google Scholar] [CrossRef] [PubMed]
  54. USEPA. Risk Assessment Guidance for Superfund. Volume I Human Health Evaluation Manual (Part A); Office of Emergency and Remedial Response U.S. Environmental Protection Agency: Washington, DC, USA, 1989; p. 20450.
  55. Yuan, B.; Cao, H.; Du, P.; Ren, J.; Chen, J.; Zhang, H.; Zhang, Y.; Luo, H. Source-Oriented Probabilistic Health Risk Assessment of Soil Potentially Toxic Elements in a Typical Mining City. J. Hazard. Mater. 2023, 443, 130222. [Google Scholar] [CrossRef]
  56. Liu, J.; Qiao, S.; Chen, H.; Zhao, S.; Li, C.; Wu, Y.; Li, D.; Li, L. Multiple Pathway Exposure Risks and Driving Factors of Heavy Metals in Soil-Crop System in a Pb/Zn Smelting City, China. J. Clean. Prod. 2024, 459, 142523. [Google Scholar] [CrossRef]
  57. de Paula, F.G.; de Souza, I.D.; Melo, E.S.d.P.; Ancel, M.A.P.; Garcia, D.A.Z.; Bogo, D.; Guimarães, R.d.C.A.; Gielow, K.d.C.F.; Oliveira, R.J.; Sanches, G.M.; et al. Assessment of Metal(Loid)s and Nonmetals Contamination in Soils of Urban Ecological Parks in Brazil: Implications for Ecological Risk and Human Health. Urban Sci. 2025, 9, 193. [Google Scholar] [CrossRef]
  58. Vesković, J.; Deršek-Timotić, I.; Lučić, M.; Miletić, A.; Đolić, M.; Ražić, S.; Onjia, A. Entropy-Weighted Water Quality Index, Hydrogeochemistry, and Monte Carlo Simulation of Source-Specific Health Risks of Groundwater in the Morava River Plain (Serbia). Mar. Pollut. Bull. 2024, 201, 116277. [Google Scholar] [CrossRef]
  59. Liu, J.; Wang, Y.; Wang, Y.; Li, Y.; Li, H.; Xu, J.; Liu, X. Novel Insights into Probabilistic Health Risk and Source Apportionment Based on Bioaccessible Potentially Toxic Elements around an Abandoned E-Waste Dismantling Site. Sci. Total Environ. 2022, 838, 156372. [Google Scholar] [CrossRef]
  60. Miletić, A.; Lučić, M.; Onjia, A. Exposure Factors in Health Risk Assessment of Heavy Metal(Loid)s in Soil and Sediment. Metals 2023, 13, 1266. [Google Scholar] [CrossRef]
  61. Rudnick, R.L.; Gao, S. Composition of the Continental Crust. In The Crust (ed. R.L. Rudnick). Treatise on Geochemistry; Holland, H.D., Turekian, K.K., Eds.; Elsevier-Pergamon: Oxford, UK, 2003; Volume 3, pp. 1–64. [Google Scholar]
  62. Liu, K.; Li, C.; Tang, S.; Shang, G.; Yu, F.; Li, Y. Heavy Metal Concentration, Potential Ecological Risk Assessment and Enzyme Activity in Soils Affected by a Lead-Zinc Tailing Spill in Guangxi, China. Chemosphere 2020, 251, 126415. [Google Scholar] [CrossRef] [PubMed]
  63. Tsamos, P.; Stefanou, S.; Noli, F. Assessment of Distribution of Heavy Metals and Radionuclides in Soil and Plants Nearby an Oil Refinery in Northern Greece. Case Stud. Chem. Environ. Eng. 2024, 9, 100593. [Google Scholar] [CrossRef]
  64. Zhou, Y.; Jiang, D.; Ding, D.; Wu, Y.; Wei, J.; Kong, L.; Long, T.; Fan, T.; Deng, S. Ecological-Health Risks Assessment and Source Apportionment of Heavy Metals in Agricultural Soils around a Super-Sized Lead-Zinc Smelter with a Long Production History, in China ☆. Environ. Pollut. 2022, 307, 119487. [Google Scholar] [CrossRef]
  65. Kurt, M.A. Comparison of Trace Element and Heavy Metal Concentrations of Top and Bottom Soils in a Complex Land Use Area. Carpathian J. Earth Environ. Sci. 2018, 13, 47–56. [Google Scholar] [CrossRef]
  66. Fatoba, P.O.; Ogunkunle, C.O.; Folarin, O.O.; Oladele, F.A. Heavy Metal Pollution and Ecological Geochemistry of Soil Impacted by Activities of Oil Industry in the Niger Delta, Nigeria. Environ. Earth Sci. 2016, 75, 297. [Google Scholar] [CrossRef]
  67. Demİr, A.D. The Impacts of Long-Term Intensive Farming Applications on the Heavy Metal Concentrations in Soils. Carpathian J. Earth Environ. Sci. 2022, 17, 235–244. [Google Scholar] [CrossRef]
  68. Li, J.; Wang, G.; Liu, F.; Cui, L.; Jiao, Y. Source Apportionment and Ecological-Health Risks Assessment of Heavy Metals in Topsoil Near a Factory, Central China. Expo. Health 2021, 13, 79–92. [Google Scholar] [CrossRef]
  69. Agyeman, P.C.; John, K.; Kebonye, N.M.; Borůvka, L.; Vašát, R.; Drábek, O. A Geostatistical Approach to Estimating Source Apportionment in Urban and Peri-Urban Soils Using the Czech Republic as an Example. Sci. Rep. 2021, 11, 23615. [Google Scholar] [CrossRef] [PubMed]
  70. Huang, J.; Peng, S.; Mao, X.; Li, F.; Guo, S.; Shi, L.; Shi, Y.; Yu, H.; Zeng, G. ming Source Apportionment and Spatial and Quantitative Ecological Risk Assessment of Heavy Metals in Soils from a Typical Chinese Agricultural County. Process Saf. Environ. Prot. 2019, 126, 339–347. [Google Scholar] [CrossRef]
  71. Guan, Q.; Liu, Z.; Shao, W.; Tian, J.; Luo, H.; Ni, F.; Shan, Y. Probabilistic Risk Assessment of Heavy Metals in Urban Farmland Soils of a Typical Oasis City in Northwest China. Sci. Total Environ. 2022, 833, 155096. [Google Scholar] [CrossRef] [PubMed]
Figure 1. Study area and sampling locations. A. Petrochemical and oil refinery facility, B. Pančevo City.
Urbansci 09 00415 g001
Figure 2. Violin plots of the physicochemical properties and HM concentration in soil.
Urbansci 09 00415 g002
Figure 3. Spatial distribution of the physicochemical properties and HMs in the study area.
Urbansci 09 00415 g003
Figure 4. Heatmap of samples and soil parameters.
Urbansci 09 00415 g004
Figure 5. Box plot of EF for the HMs in soil samples.
Urbansci 09 00415 g005
Figure 6. Spatial distribution of RI in the soil near oil refinery facilities. A. Petrochemical and oil refinery facility, B. Pančevo City.
Urbansci 09 00415 g006
Figure 7. The correlation between ecological risk (RI) and health risk (HI and TCR).
Urbansci 09 00415 g007
Figure 8. The probability distribution of deterministic and source-specific risks for adults and children. TCR values were divided by 10–5 for scaling..
Urbansci 09 00415 g008
Table 1. Source-specific health risk assessment method calculation.
Risk IndexEquation *
Average daily dose (mg·kg−1·day−1): A D D i j   i n g k = C i j k × I n g R × E x p F × E D B W × A T × C F

A D D i j   i n h k = C i j k × I n h R × E x p F × E D P E F × B W × A T

A D D i j   d e r m k = C i j k × S A × A F × A B S × E x p F × E D B W × A T × C F
Hazard quotient and Hazard index:
HI < 1
HI > 1
H I i k = H Q i j k = H Q i j , p k = A D D i j , p k R f D j , p
Carcinogenic risk and Total carcinogenic risk:
TCR < 10–6
10–6 < TCR < 10–4
TCR > 10–4
T C R i k = C R i j k = C R i j , p k = A D D i j , p k × C S F j , p
* i represents the sample, j is the heavy metal(loid), k is the source, and p is the exposure pathway.
Table 2. Statistical summary of Igeo results.
HMsMeanSDMaxMin
Pb−0.370.460.58−0.89
Cr−1.890.53−1.13−3.09
As0.160.561.45−0.62
Hg−0.270.671.34−0.91
Cd0.130.601.44−0.83
Zn−1.310.55−0.09−2.26
Cu−0.660.25−0.28−1.09
Ni−1.220.44−0.55−2.11
Ba−3.790.42−3.18−4.72
Mn−0.500.440.15−1.44
Percentage of samples in different categories *
<00–11–2
Pb76.723.3
Cr100
As33.353.313.3
Hg73.323.33.3
Cd46.736.716.7
Zn100
Cu100
Ni100
Ba100
Mn86.713.3
* No Igeo value was greater than 2.
Disclaimer/Publisher’s Note: The statements, opinions and data contained in all publications are solely those of the individual author(s) and contributor(s) and not of MDPI and/or the editor(s). MDPI and/or the editor(s) disclaim responsibility for any injury to people or property resulting from any ideas, methods, instructions or products referred to in the content.