Article

A Geospatial Framework for Spatiotemporal Crash Hotspot Detection Using Space–Time Cube Modeling and Emerging Pattern Analysis

Department of Civil, Environmental, and Construction Engineering, University of Central Florida, Orlando, FL 32816, USA
*
Author to whom correspondence should be addressed.
Urban Sci. 2025, 9(10), 411; https://doi.org/10.3390/urbansci9100411
Submission received: 24 July 2025 / Revised: 15 September 2025 / Accepted: 29 September 2025 / Published: 3 October 2025
(This article belongs to the Special Issue Intelligent GIS Application in Cities)

Abstract

Traffic crashes remain a critical public safety issue and are among the leading causes of mortality worldwide. Understanding, analyzing, and forecasting crash trends are essential for implementing effective countermeasures and reducing injury severity. In response to the growing number of crashes and their associated economic and social costs, this study presents a geospatial analytical framework for prioritizing and classifying roadway segments based on crash trends. The framework focuses on a major freeway corridor in the United States, covering a four-year period across 20 counties. This methodology employs spatiotemporal analysis, which integrates both spatial (geographic) and temporal (time-based) dimensions to better understand how crash patterns evolve over time and space. A central component of the analysis is Space–Time Cube (STC) modeling, a three-dimensional GIS-based visualization, and an analytical approach that organizes data into spatial locations (x and y) across a sequence of temporal bins (z-axis) to reveal patterns that may not be evident in a two-dimensional analysis. Additionally, emerging pattern analysis, specifically Emerging Hotspot Analysis (EHA), is used to identify statistically significant trends in crash frequency over time. The results indicate a significant spatial clustering of crashes, with high-risk segments predominantly located in densely populated urban areas with high traffic volumes. Crash hotspots were classified into five distinct categories: persistent, intensifying, new, sporadic, and diminishing, enabling transportation agencies to tailor interventions based on temporal dynamics. The proposed geospatial framework enhances decision making for roadway safety improvements and can be adapted for use in other regional corridors to support infrastructure investment and advance public safety.

1. Introduction

Traffic crashes are a significant public safety concern and are one of the leading causes of death worldwide. According to the World Health Organization (WHO, 2023) [1], about 1.19 million people die each year due to road traffic crashes, which add a significant economic burden to many countries, costing 3% of their gross domestic product. Thus, it is essential to understand crash trends in the space and time dimensions to implement appropriate countermeasures. Identifying crash-prone segments can help decision makers prioritize financial resources and plan the appropriate actions to improve the problematic segments.
Although crash analysis methods have been investigated in many regions, there has been limited focus on the detailed investigation of crash dynamics over space and time. Traditional crash analysis methods, such as observational before-and-after studies in road safety [2], crash frequency analysis [3,4,5], and empirical Bayes and Bayesian models [6,7,8], established essential foundations for safety evaluation. However, these conventional methods overlook the need for dynamic crash analysis, focusing on static crash counts rather than comprehensive spatiotemporal crash analysis. Additionally, most previous crash studies focus on intersection-level, roadway segment-level, or regional scale, with limited attention to the interstate corridor level and complex mobility patterns, freight traffic, and congestion challenges contributing to crash dynamics. Safety and operational issues are major concerns along large corridors, such as Interstate 75 (I-75) in Florida, which require a more dynamic analytical strategy for more effective safety interventions. This corridor is a limited-access facility and is one of Florida’s most important transportation routes. It facilitates freight movement to, from, and within the state, starting in Miami in the south and running northward over approximately 272 miles, crossing through the Florida Department of Transportation (FDOT) Districts 6, 1, 7, 5, and 2.
Furthermore, it is a critical component of the strategic intermodal system (SIS) [9], a network of significant roadways throughout the state. With the growth in freight miles traveled, this major route experienced a substantial increase in traffic volume, leading to operational deficiencies and additional congestion. The corridor serves more than five million residents, representing approximately 25% of the Florida population.
Given its importance, it was selected as the study area in this research. Figure 1 shows the spatial extent of the study area chosen for this research.
To address this need, our study introduces an advanced Geographic Information Systems (GIS) analytical framework to investigate crash dynamics across the corridor for the analysis period. It employs STC analysis, spatial autocorrelation assessment, a 3D visualization of crash patterns to understand how crash hotspots evolve over space and time, and an emerging hotspot analysis (EHA) that categorizes hotspots into distinct types. Previous studies [10,11,12,13] have applied GIS-based spatiotemporal crash analysis at various levels. For example, Feizizadeh et al. [14] analyzed urban traffic accidents at a city level, while Saengow et al. [15] performed a regional analysis of road traffic accidents. However, few studies have integrated these advanced techniques to analyze crash trends across multiple districts and counties at a major corridor level.
Additionally, due to traditionally limited resources for traffic management, it is essential to identify future improvements and road safety priorities to distribute resources efficiently. This study addresses the need for more effective resource allocation strategies and aims to enhance road safety through comprehensive spatiotemporal crash analysis. This analysis will provide a thorough understanding of crash patterns and help develop a framework for efficient resource allocation and improved traffic safety management.
The developed framework integrates spatiotemporal analysis utilizing STC analysis, spatial autocorrelation, and EHA to identify high-crash segments in 20 counties in Florida along the study corridor. Crash analysis was performed using ArcGIS Pro 2.5 [16] (https://www.arcgis.com/index.html, accessed on 22 July 2025), utilizing crash data from 2014 to 2017 (the study period) to identify statistically significant crash trends in space and time.
The purpose of the study is to provide transportation agencies with a decision-support framework to assist traffic managers in making efficient decisions and prioritizing resources toward high-risk locations. To achieve this, the study considers the following specific objectives:
  • Analyze the spatial distribution and the temporal trends of crashes over the corridor during the study period.
  • Identify and classify crash hotspots using STC analysis, Moran’s I, and EHA.
  • Assess the statistical significance of crash clustering.
  • Develop a methodological framework to support decision making in resource allocation.
Table 1 presents the study design and alignment of the objectives, corresponding methodologies, required data, and expected study outcomes.
The limitations noted above highlight the need for a deeper understanding of crash dynamics by identifying and classifying the spatial distribution of crash hotspots and investigating how these patterns change over time at the interstate corridor level.
By employing an innovative spatiotemporal analysis, this study contributes to the literature in the following ways:
  • It advances the understanding of crash patterns from static to dynamic classification.
  • It extends the application of spatiotemporal GIS-based methods to a major interstate corridor level.
  • It provides a robust framework to help decision-makers and traffic management centers identify future improvements and road safety priorities to ensure efficient resource distribution.
  • It establishes a transferable framework that can be generalized to similar networks in other states.
The remaining sections of this paper are organized as follows: Section 2 presents a review of the literature related to traditional crash analysis and its limitations. Additionally, it discusses the application of geographic information systems in transportation, spatiotemporal crash modeling, and the advancement of predictive machine learning approaches.
Section 3 describes the methods for collecting, cleaning, and preparing the data for analysis. It also discusses crash hotspot analysis, the STC analysis, spatial autocorrelation, and EHA.
Section 4 presents the results of the developed model, including the spatial clustering analysis and 3D crash trend visualization. Section 5 discusses the research results, summarizes this study’s findings, draws conclusions, and offers recommendations for future work.

2. Literature Review

Crash analysis has been broadly assessed in many studies, progressing from traditional statistical tools to spatiotemporal analysis, advanced GIS techniques, and machine learning approaches. This section reviews recent studies of four primary approaches of crash analysis: traditional statistical crash analysis methods and their limitations, GIS-based techniques used to analyze traffic crashes, spatiotemporal crash analysis, and the advancement of machine learning in crash research.
Sathish Rao et al. [17] performed a comprehensive review of traffic safety engineering and crash analysis methods in the United States. They reported the advancement from traditional descriptive statistics to more complex predictive models. They concluded that the conventional techniques, such as safety performance functions (SPFs), crash modification factors (CMFs), and empirical Bayes (EB) estimation, are foundational for integrating safety into roadway planning. However, they overlook crash spatial clustering and temporal patterns. The authors confirmed the need for a statistically robust framework to better understand and interpret the variability of crash time and locations to quantify safety measurements effectively. Paliotto et al. [18] performed a systematic review on road network safety analysis methods, reviewing ten different analysis methods and recommending the development of a framework to guide traffic agencies and practitioners in selecting a suitable analysis procedure based on their specific needs and the available data.
Additionally, Abdulhafedh [19] reviewed the development of statistical crash prediction models from simple linear regression to Poisson and Negative Binomial (NB) regression. The author reported that these models are essential for predicting crash occurrence and identifying contributing factors. However, these prediction models do not address the temporal evolution of the crash patterns. Therefore, there is a need for an analytical framework to identify the spatial distribution of crash hotspots and investigate how these patterns evolve. Once these hotspots are identified, the prediction models can be employed to analyze the contributing factors.
Geographical information system (GIS) technology strengthens transportation modeling [20,21] by enabling efficient collection, updating, and encoding of spatial data. In addition, the GIS tools enhance model compatibility, database management, and updating [22,23]. Visualizing model performance significantly improves the functionality of the transportation model as a decision support system (DSS) in transportation planning and policymaking [24,25,26,27,28].
Several studies applied GIS-based tools for hotspot detection. Hazatmeh et al. [29] applied GIS tools such as Kernel Density Estimation (KDE), spatial autocorrelation, and Getis-Ord Gi* statistics to investigate crash patterns in Irbid Governorate, Jordan. The authors confirmed the effectiveness of combining spatial analysis with the statistical techniques of these tools for identifying crash hotspots in Jordan. Alam et al. [30] utilized GIS spatial statistics tools to identify crash hotspots in Ohio. The authors primarily focus on classifying crash hotspots based on the crash severity index (CSI) with a static approach rather than examining the temporal aspect of crash hotspot pattern evolution. Cantisani et al. [31] integrated high-frequency Floating Car Data (FCD) in QGIS to identify critical roadway infrastructure that impacts driver behavior and therefore influences traffic safety. Furthermore, Harirforoush et al. [32] presented a two-step GIS-based method to identify traffic accident (TA) hotspots on the roadway network in Sherbrooke, Canada. The authors combined network Kernel Estimation (KDE) with the critical crash rate (CCR) method from the Highway Safety Manual (HSM) to consider exposure and classify hazardous locations. However, while effective for the city-level static hotspot detection, their analysis overlooked the temporal dynamics of crash patterns. In contrast, Moreno-Ponce et al. [33] integrated a GIS-based hotspot detection with time-series prediction models such as ARIMA, Prophet, and LSTM to investigate crash patterns on Chone-Flavio Alfaro Road in Ecuador. However, their study mainly focused on forecasting future crash patterns on a specific roadway segment, rather than analyzing the spatiotemporal evolution or trends of crash patterns. Our proposed framework builds on these previous studies, advancing beyond identifying where crashes occur to investigating how these crash patterns change over time, providing a practical tool for corridor-level transportation safety management.
Several recent studies have extended GIS methods into spatiotemporal analysis. Zhang et al. [34] presented a combined framework of crash density clustering and a Bayesian network to explore spatiotemporal trends in expressway accidents in China. The researchers concluded that their proposed framework can effectively identify accident-prone black spots and account for various accident-causing factors. Wang et al. [35] conducted a crash hotspot analysis to explore high-crash locations in Rwanda using Kernel Density Estimation (KDE). They collected built environment characteristics, such as road design, traffic density, and road safety, of each hotspot using logistic regression to identify the factors impacting crash frequency. They concluded that some existing traffic safety measures, such as speed limit signs and traffic lights, are not utilized efficiently, and they stressed the importance of enforcing them to reduce road traffic crashes. Zubaidi et al. [36] utilized GIS tools to investigate crash types and identify hotspot areas for roundabouts in Oregon. They highlighted some leading factors of roundabout crashes, such as drivers’ failure to yield the right of way. Gedamu et al. [37] investigated the spatiotemporal patterns of traffic crash severity in Addis Ababa. The authors utilized multinomial logistic regression and the Knox test to investigate spatial-temporal clustering of fatal crashes. However, their primary focus is on explaining the factors of crash severity rather than the dynamic pattern and evolving classification of crash hotspots. Alsahfi [38] conducted spatiotemporal crash analysis across four major cities in California. The authors utilized GIS statistical tools and non-parametric statistical and spatial techniques such as Kernel Density Estimation (KDE) and Density-Based Spatial Clustering of Applications with Noise (DBSCAN) to identify crash clustering patterns. The main goal of their study is a comparative analysis of spatiotemporal crash patterns across four cities.
More research studies have recently focused on modeling spatial and temporal crash data using advanced statistical or machine learning models [39,40,41,42]. Zhao et al. [43] presented a dynamic Bayesian network to predict crash risk. The researchers compared the accuracy of their proposed dynamic model with the static Bayesian models. They confirmed that a dynamic Bayesian model considering temporal correlation has a better prediction effect than static models. Wang et al. [44] developed a framework to predict the severity of motor vehicle crashes. The authors used an optimized Random Forest model to predict crashes and identify the primary factors influencing crash severity.
This study builds on established methods for crash analysis and advances the application of GIS for transportation safety by integrating spatiotemporal modeling and statistical evaluation. Data were collected and pre-processed to support a framework incorporating STC modeling and EHA. Crash data were analyzed using spatial and temporal clustering techniques, including global spatial autocorrelation, to identify statistically significant crash concentrations. The proposed methodology is applied as a case study using four years of crash data across 20 counties to demonstrate its effectiveness. The results regarding spatial patterns, hotspot typologies, and implications for targeted safety interventions are discussed.

3. Materials and Methods

3.1. Data Preparation

Crash data were collected from the State Safety Office Geographic Information System (SSOGIS) using the Crash Query Tool web application, which contains descriptions and information regarding crashes on Florida roads from 2012 to 2020. The SSOGIS is a crash data system used to report, query, and analyze data from crashes on public roads. In this study, it was necessary to identify crashes within the selected counties along the study area. The SSOGIS database allows users to specify these parameters when executing the queries.
Crashes were selected by location, filtered by crash characteristics, and extracted in the format of GIS shapefiles with their respective databases. The collected data included the occurrence of injuries or fatalities, crash roadway ID, crash date, crash location mile-point, type of crash, light conditions, road surface condition, time of day, speed limit, and functional classification.
622,861 crash records were collected for the analysis period and were filtered to 307,774 crash records for the selected 20 counties. The FDOT provides an open data hub that contains GIS maps for the state that can be extracted in Shapefile or XML formats. Several maps were obtained from this hub, including a Florida county layer that contains a map of Florida’s 67 counties, and an interstate layer that maps the interstate system within the state. The table of attributes of this layer also provides the roadway’s beginning and ending mile points and the roadway ID number. Table 2 presents the total crashes along the corridor during the analysis period. Miami-Dade, Hillsborough, and Broward counties reported the top three highest crashes due to their urban nature, high traffic volume, and high-density population.

3.2. Methodology

The prepared crash data were used to develop a spatiotemporal statistical analysis of the study area. Below are the approaches used to achieve the objectives of this research, beginning with a crash hotspot analysis and including a descriptive analysis of crash records distribution.

3.2.1. Crash Hotspot Analysis

Understanding, interpreting, forecasting crash trends, and implementing appropriate countermeasures to prevent crashes and reduce injury severity are essential. Identifying the causes of crashes is complex, and recognizing high-crash and low-crash road segments based on crash locations presents significant challenges. The main objective is to analyze crash distribution patterns using hotspot and spatial statistical techniques.
The methodology integrates spatiotemporal analysis techniques—specifically STC modeling, spatial autocorrelation, and EHA—to identify locations exhibiting high crash rates. Twenty counties along the corridor were selected as the case study. Crash analysis was performed using the GIS platform to identify statistically significant crash trends over space and time. Figure 2 shows the structure of the model used in this study.
First, road segment data were collected and clipped to the study area, and crash data were obtained from the SSOGIS Crash Query Tool web application for the study period. The crash data included the location, date, and time. Subsequently, the crash data points were aggregated using the STC tool. Spatial autocorrelation analysis was performed to investigate spatial hotspot trends. Finally, EHA was utilized to classify hotspots and analyze their spatiotemporal patterns.
Spatiotemporal crash analysis identifies crash characteristics and classifies hotspot trends over time to detect locations with the highest crash rates. A descriptive analysis was performed to investigate the crash frequency distribution. The crash data were plotted using longitude and latitude coordinates. Figure 3 illustrates the distribution of the four years of crashes over the study area.
A descriptive analysis was performed to investigate the temporal crash distribution. Crash counts were plotted daily, monthly, and annually along the study area for four years from 2014 to 2017. Charts and interpretations are presented in the results section.

3.2.2. STC Analysis

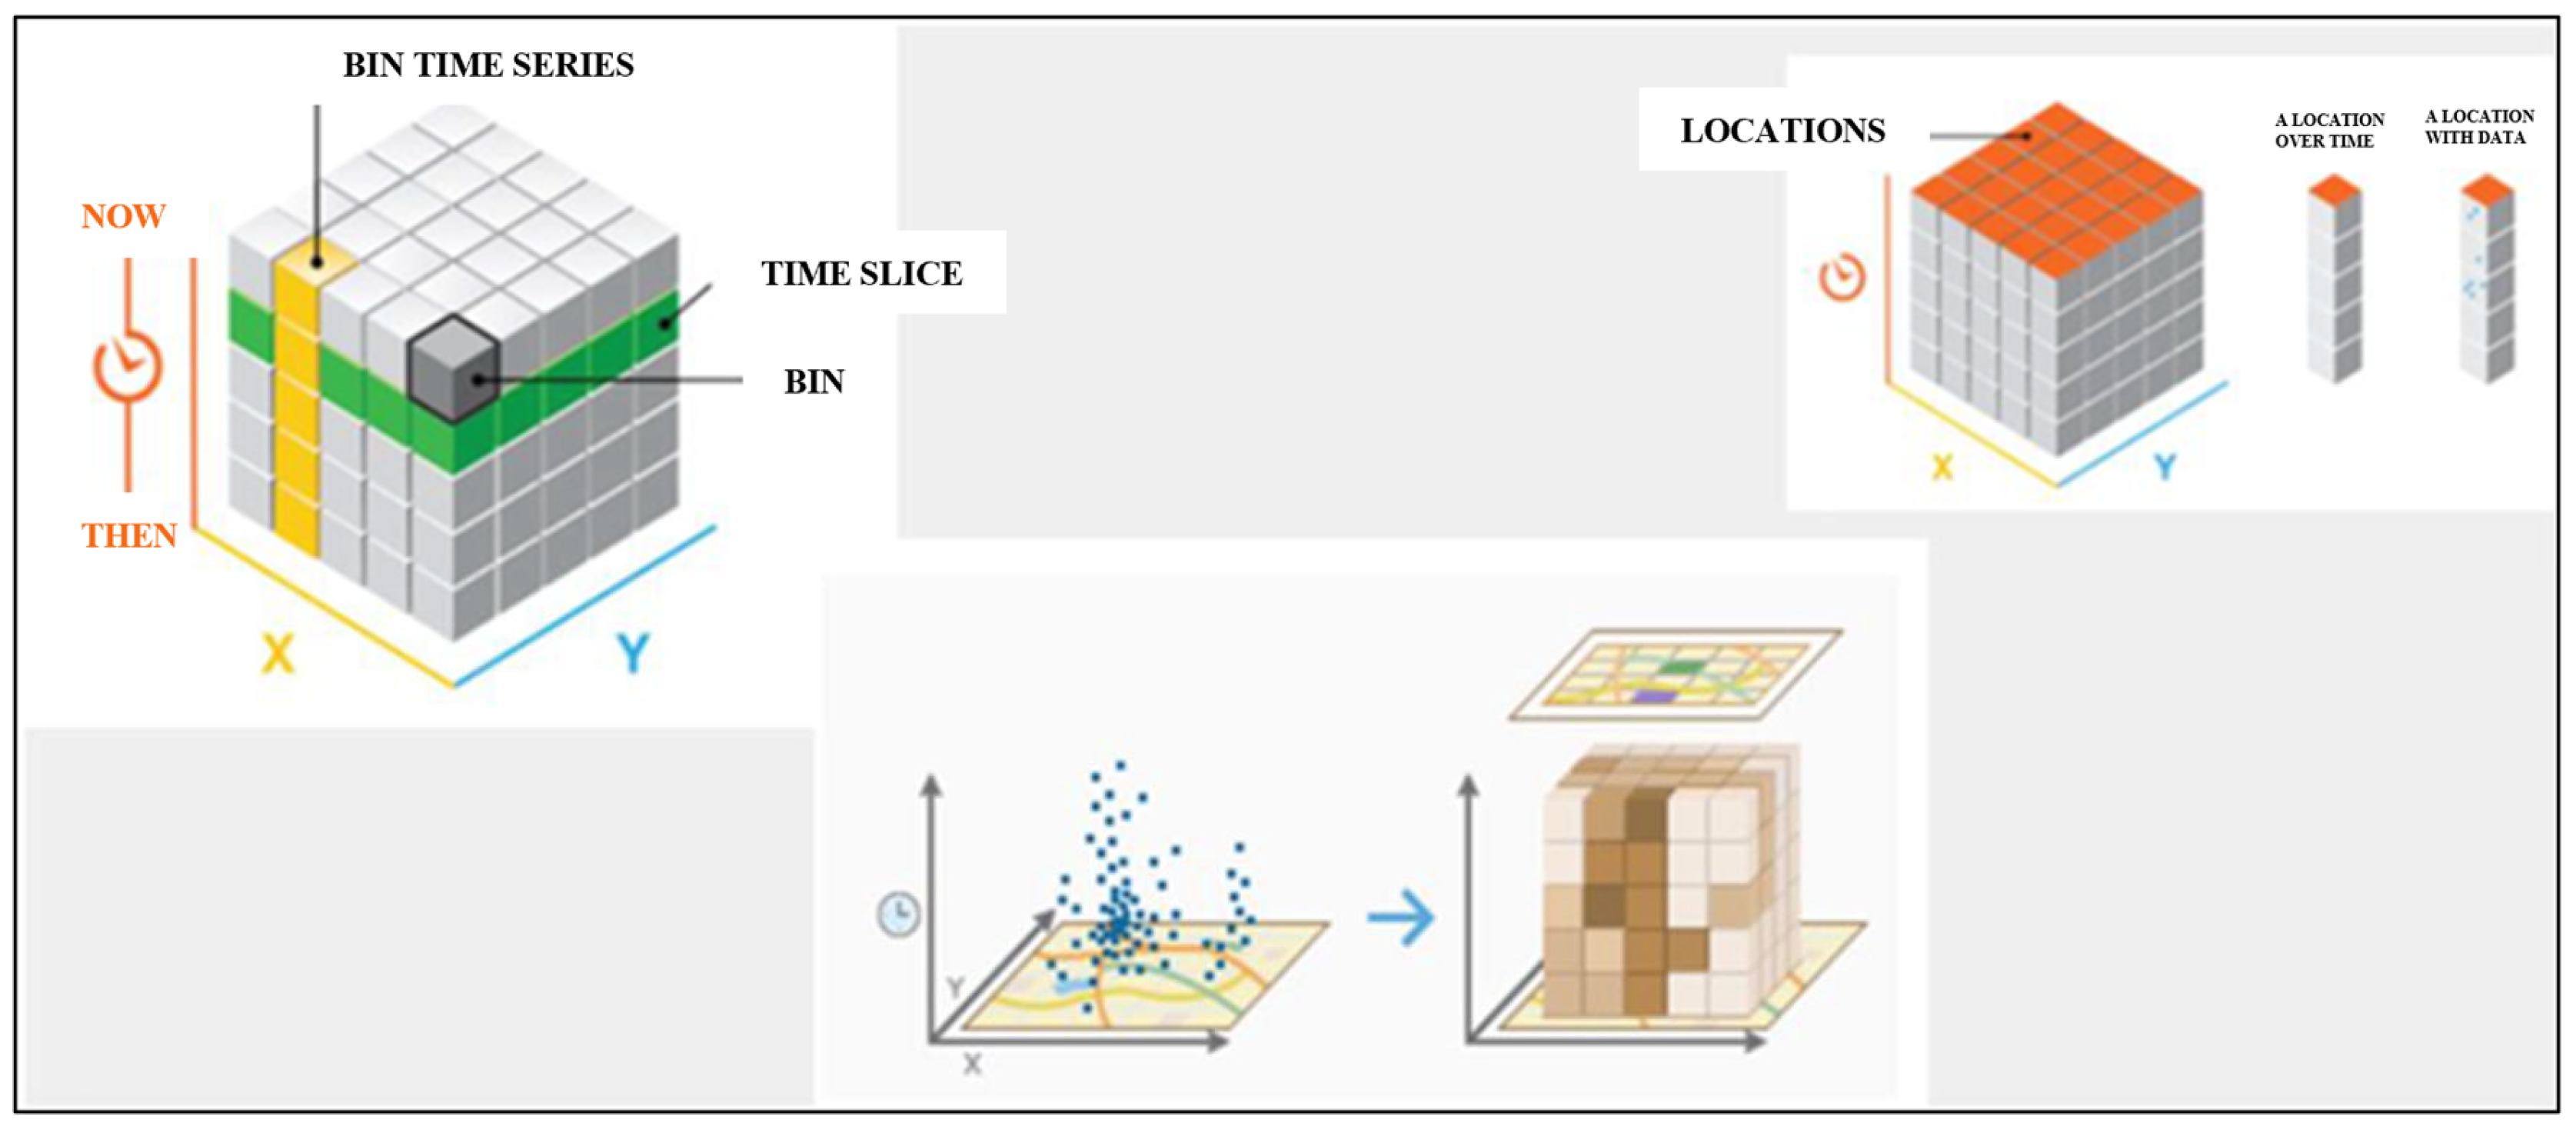
The STC tool was applied to examine the temporal characteristics of the crash points along the roadway segments, providing a 3D visualization of crash data in the spatial and temporal dimensions. Data points were aggregated into space–time bins. The time step interval defines the period of each bin. In the STC analysis, time is denoted along the z-axis, and the spatial locations of the crash records are represented using the x- and y-axes. Figure 4 depicts the structure of the STC analysis. A time step of one month was defined; thus, the z-axis included 48-time steps, representing the 48 months of the study period. A field with type “date” was created in the attribute table in the crash dataset. This field was populated based on the crash occurrence date and time, and the data points were aggregated into 1-month bins over time.

3.2.3. Global Spatial Autocorrelation Analysis

Autocorrelation analyses were conducted to explore spatial aggregation characteristics further and identify statistically significant crash locations. Generally, spatial autocorrelation analysis can be classified as global or local.
The STC analysis revealed the spatiotemporal crash patterns but did not assess the statistical significance of spatial clustering. A spatial autocorrelation analysis was conducted on crash data for 2014–2017 in the selected counties using Moran’s index (Moran’s I) to determine statistically significant high spatial autocorrelation locations. Moran’s I range from −1 (dispersion) to +1 (clustering), with 0 indicating randomness. First, crash attributes are spatially combined with road segments based on their longitude and latitude. Second, a road network was built using the joined crash–road segment attributes. Finally, a spatial weight matrix for the network segments was generated, and global Moran’s I was computed.
Moran’s I statistic for spatial autocorrelation is defined by its standard formula:
I = N W i j w i j x i x ¯ x j x ¯ i x i x ¯ 2
The Getis-Ord Gi* statistic used in hotspot detection is defined as:
G i = j = 1 n w i , j x j X ¯ j = 1 n w i , j S n j = 1 n w i , j 2 j = 1 n w i , j 2 n 1
where
  • x j is the attribute value of feature j;
  • w i , j is the spatial weight between feature i and j;
  • n is the total number of features;
  • X ¯ is the mean of attribute values;
  • S is the standard deviation of attribute values.
The mean and standard deviation of all the attribute values are calculated as follows:
X ¯ = j = 1 n x j n
S = j = 1 n x j 2 n X ¯ 2

3.2.4. Emerging Hotspot Analysis

As explained previously, autocorrelation analysis was conducted to identify crash hotspots. EHA was performed to classify crash hotspots further. After the crash data were aggregated into the STC bins, the EHA tool analyzed each bin statistically. Subsequently, crash trends were identified at different confidence levels using the Getis-Ord Gi statistic. Hotspots were classified into 17 categories to present a detailed explanation of hot and cold spots, their locations, and changes over time.
The methodology described in this study, which includes GIS-based STC modeling, spatial autocorrelation, Getis-Ord Gi* hotspot analysis, and emerging hotspot classification, can be applied to corridors in other locations with available spatial crash data. While this study was conducted on I-75 in Florida, the developed framework can be generalized to all Florida interstate corridors. It can be extended to a similar road network in other states. By following the same procedure developed in the study, decision makers could identify and classify high-risk locations for targeted interventions, understand the dynamic aspects of crashes, and determine the statistical significance of crash clustering and hotspots.
The effects of crash data for other corridors would differ depending on road characteristics and traffic conditions; therefore, a different crash analysis could be predicted. However, spatial bin size and temporal aggregation parameters can be calibrated to align with the specific properties of each corridor.

4. Results and Discussion

Identifying high-crash-rate road segments gives safety professionals insights into crash patterns to enhance road safety management. It is imperative to identify priorities for future safety investments to ensure efficient resource distribution and guide decision-makers effectively. This section presents the findings of the spatiotemporal analysis and discusses their implications for traffic safety management.

4.1. Descriptive Analysis

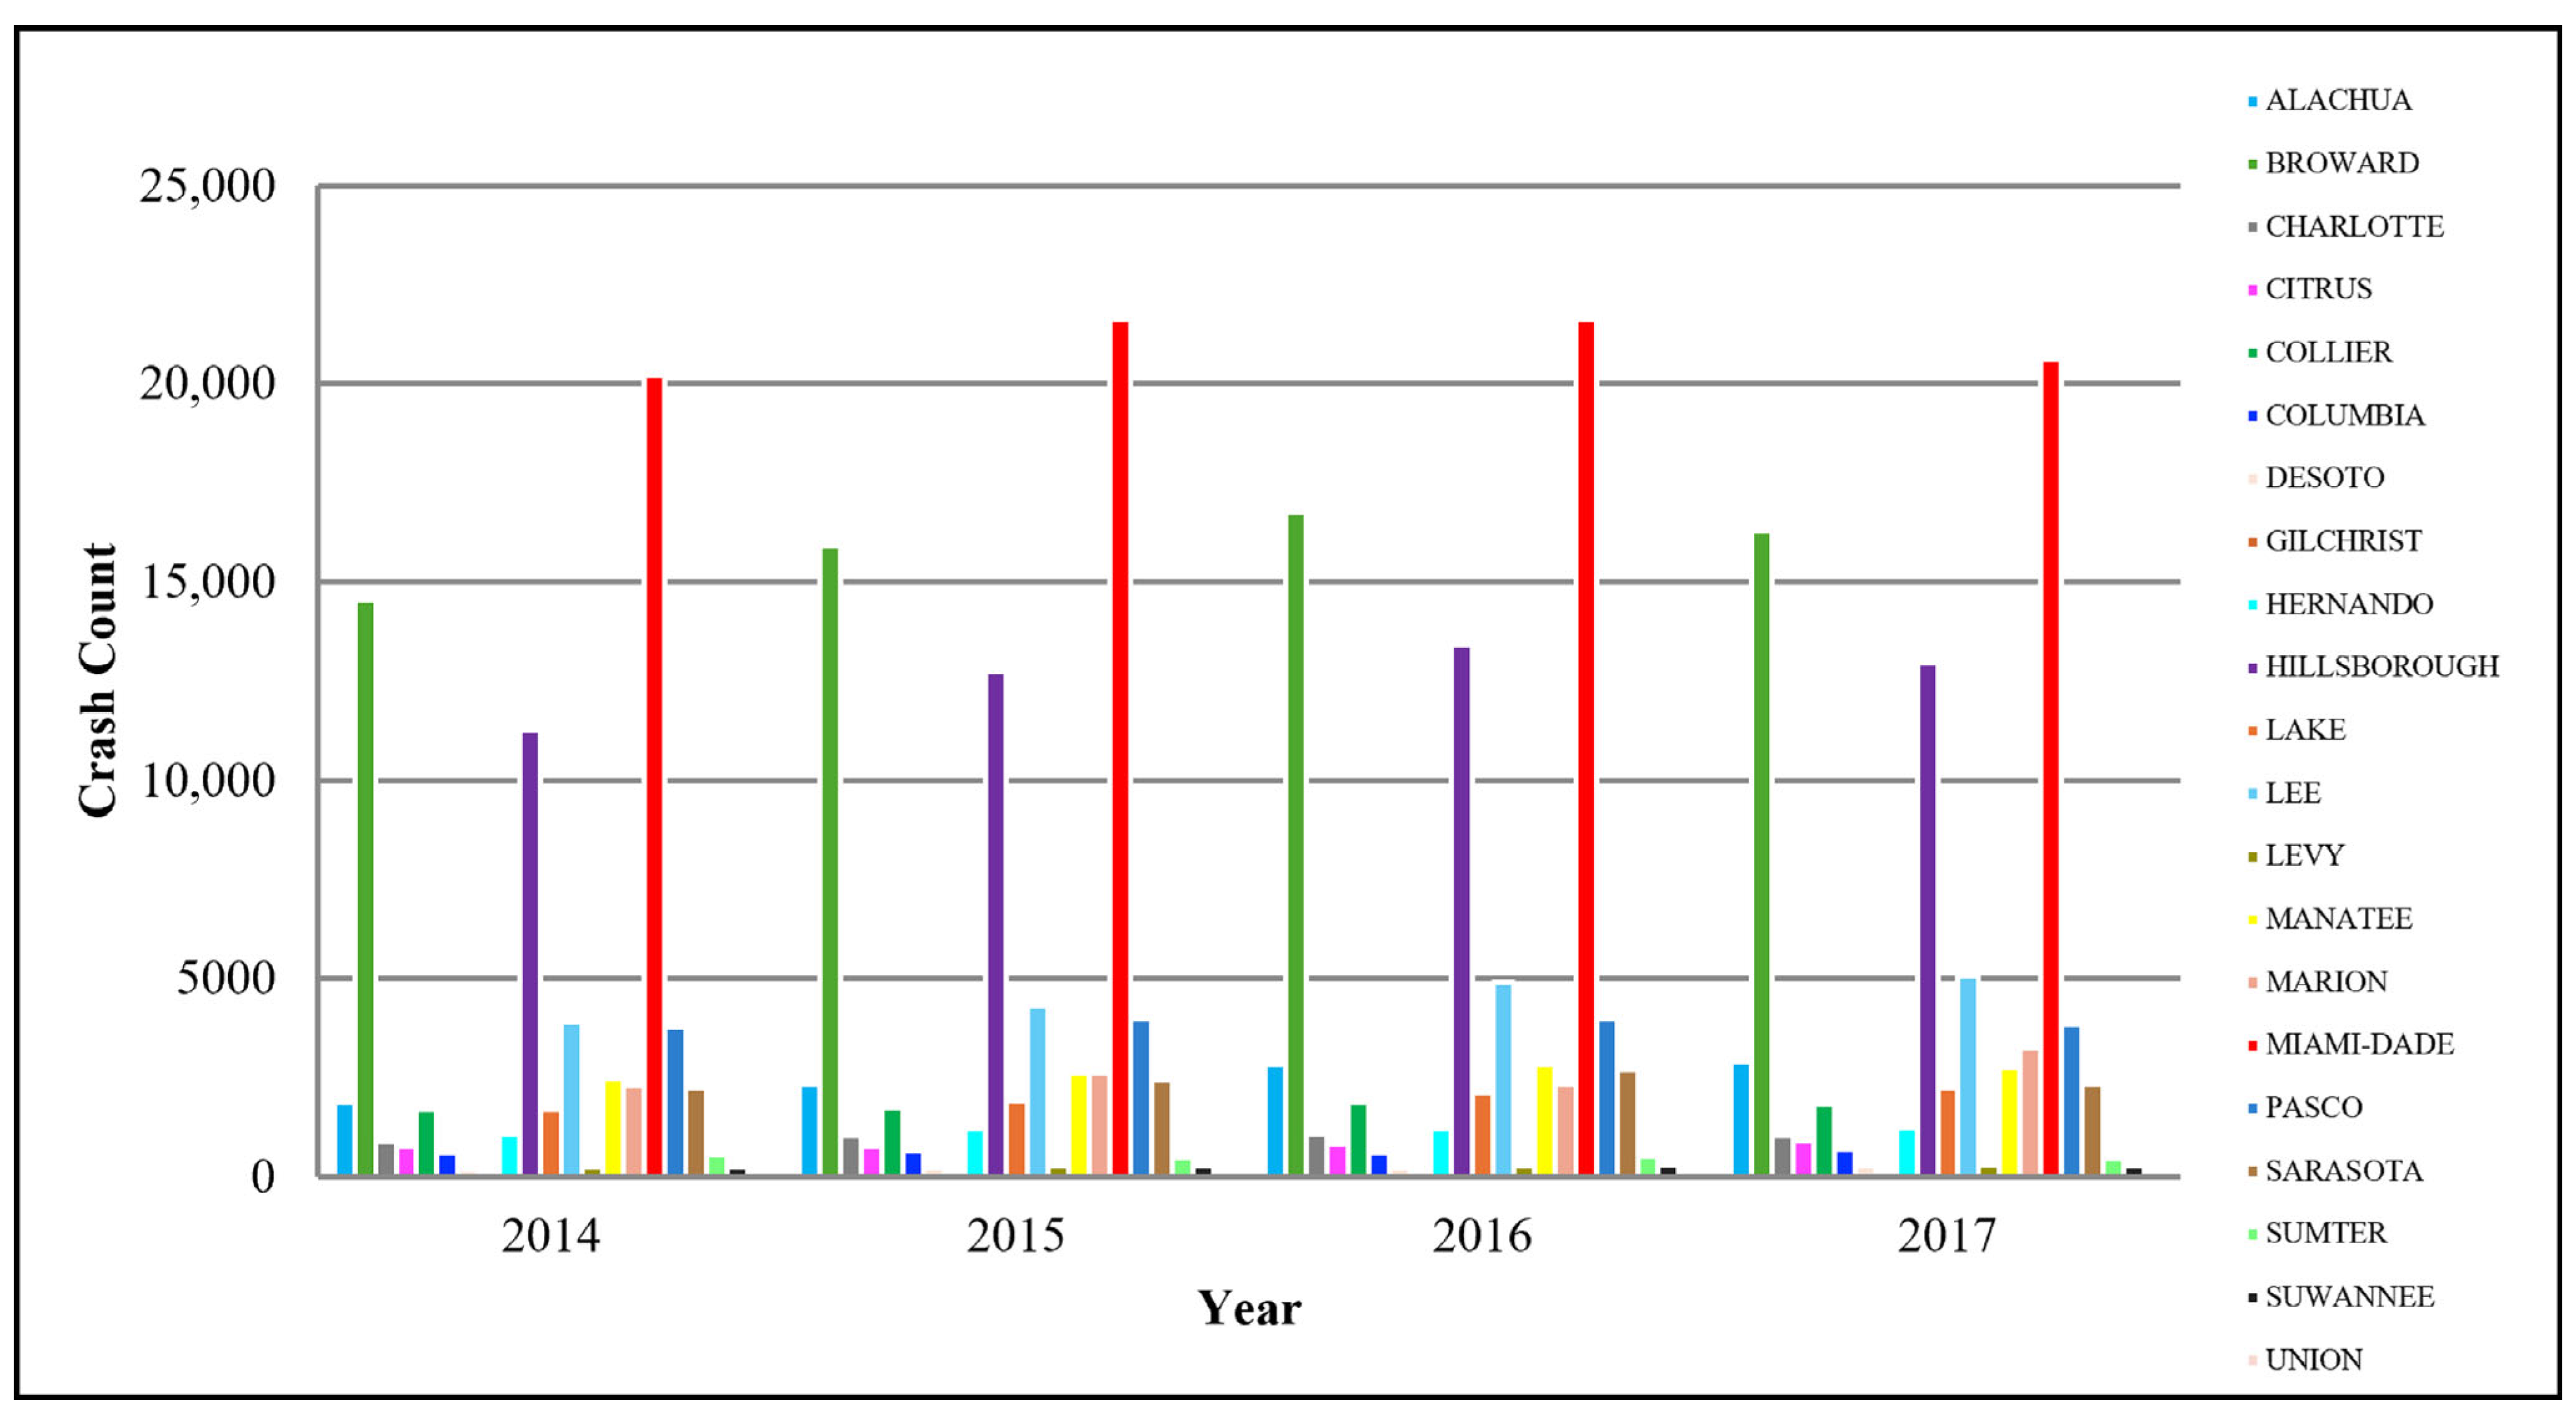
For hotspot classification, resource allocation, and prioritizing areas with a high crash risk for targeted safety interventions, it is essential to identify counties that experienced high crash volumes. A descriptive analysis of the crash data revealed spatial and temporal patterns. Figure 5 shows a comparative bar chart of annual crash counts by county along the study corridor during the analysis period to visualize the spatial distribution of crash frequencies. The figure shows that most counties experienced a general increase in crash counts over time, indicating traffic growth and an increasing crash trend along the corridor. Miami-Dade, Broward, and Hillsborough counties experienced the highest crash frequency. These counties are high-traffic urban areas that serve dense populations. This finding highlights the need for targeted safety interventions in these urban areas.
Figure 6 depicts the temporal crash trends by day of the week across the corridor counties over the study period. Fridays had the highest crash counts, while Sundays had the lowest. Descriptive crash trend analysis showed that crash counts were highest in urbanized regions, with a consistent increase in frequency on Fridays. This preliminary analysis confirmed the need for spatiotemporal analysis to identify peak periods and adjust resource allocation dynamically to those peak periods.
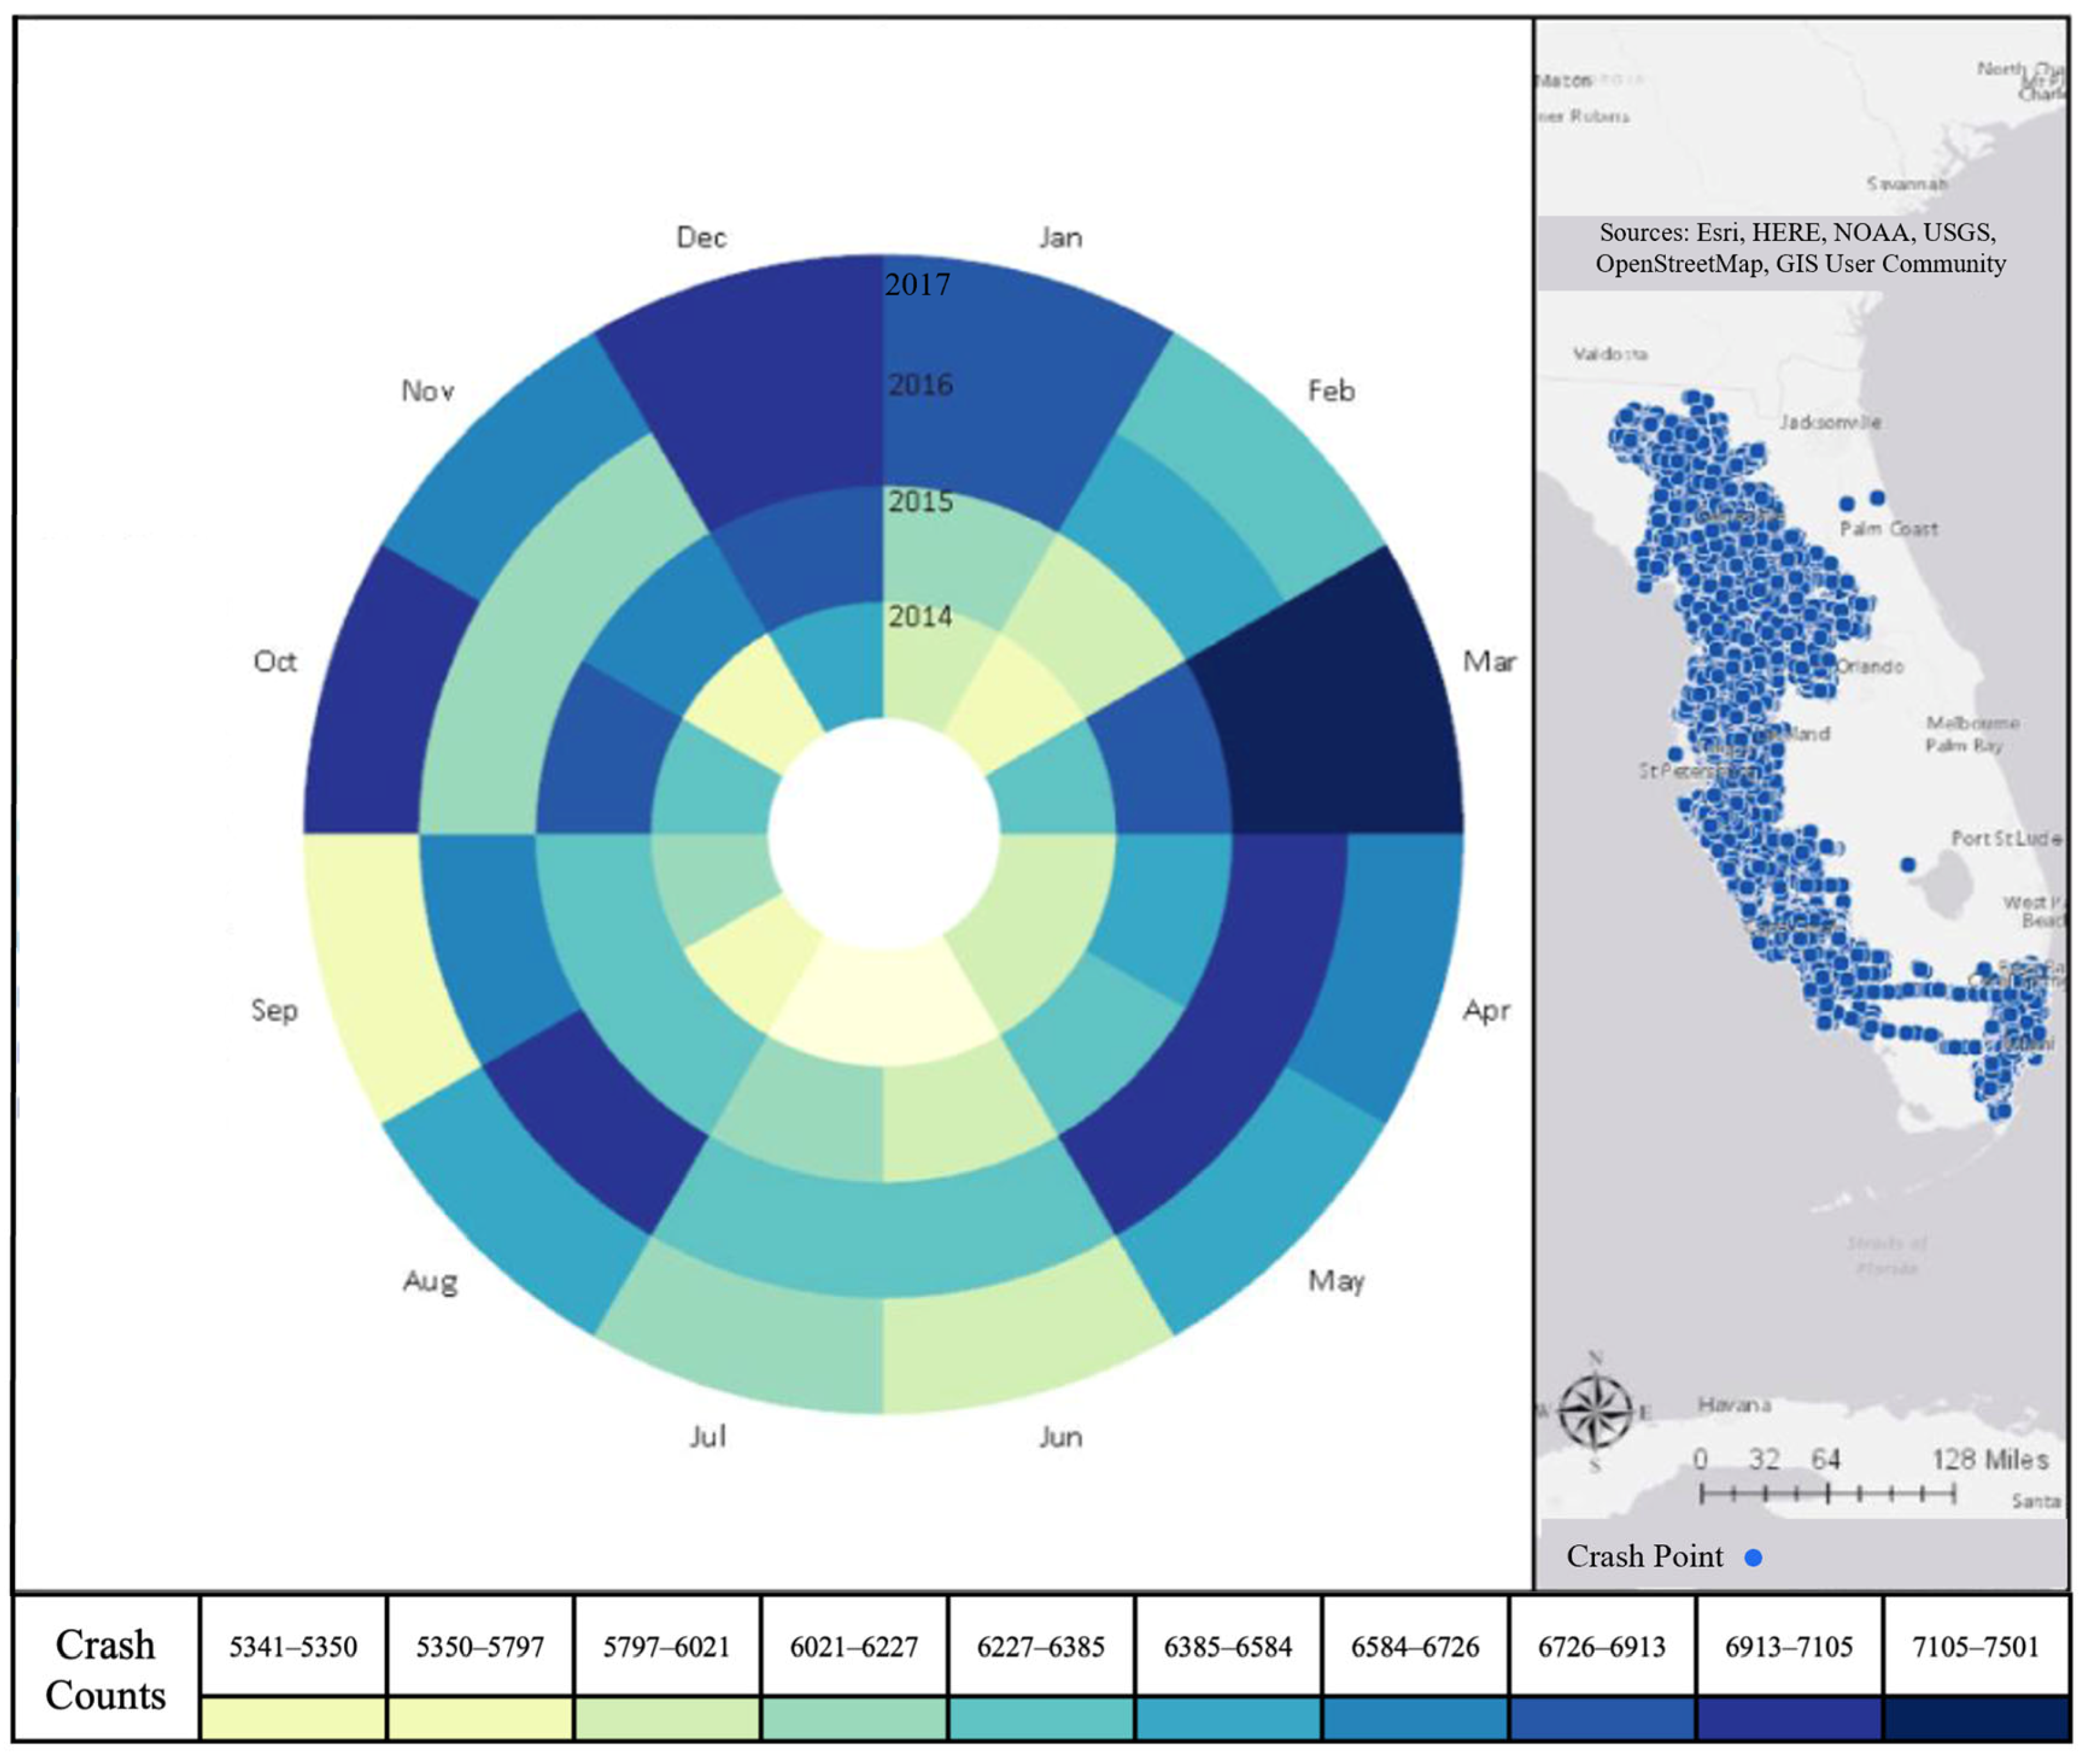
Figure 7 and Figure 8 depict the seasonal fluctuations in crash frequencies and the overall distribution of crashes across the corridor. Figure 7 provides a visualization of the temporal distribution of crashes by month using a crash clock diagram, where each ring represents a year (2014–2017) divided into 12 segments (January–December). Crash frequencies peaked in March and October, while June and July recorded the fewest crashes. This monthly pattern indicates a seasonal influence on crash occurrences, potentially related to variations in travel behavior, weather conditions, or freight activities throughout the year. The figure also displays the geographic crash distribution, highlighting that urbanized high-traffic counties, such as Miami-Dade, Hillsborough, and Lee, contain dense clusters of crash points. This combination of temporal and spatial descriptive analyses offers insights to guide resource allocation and proactive safety interventions at high-intensity crash locations or during high-risk months.
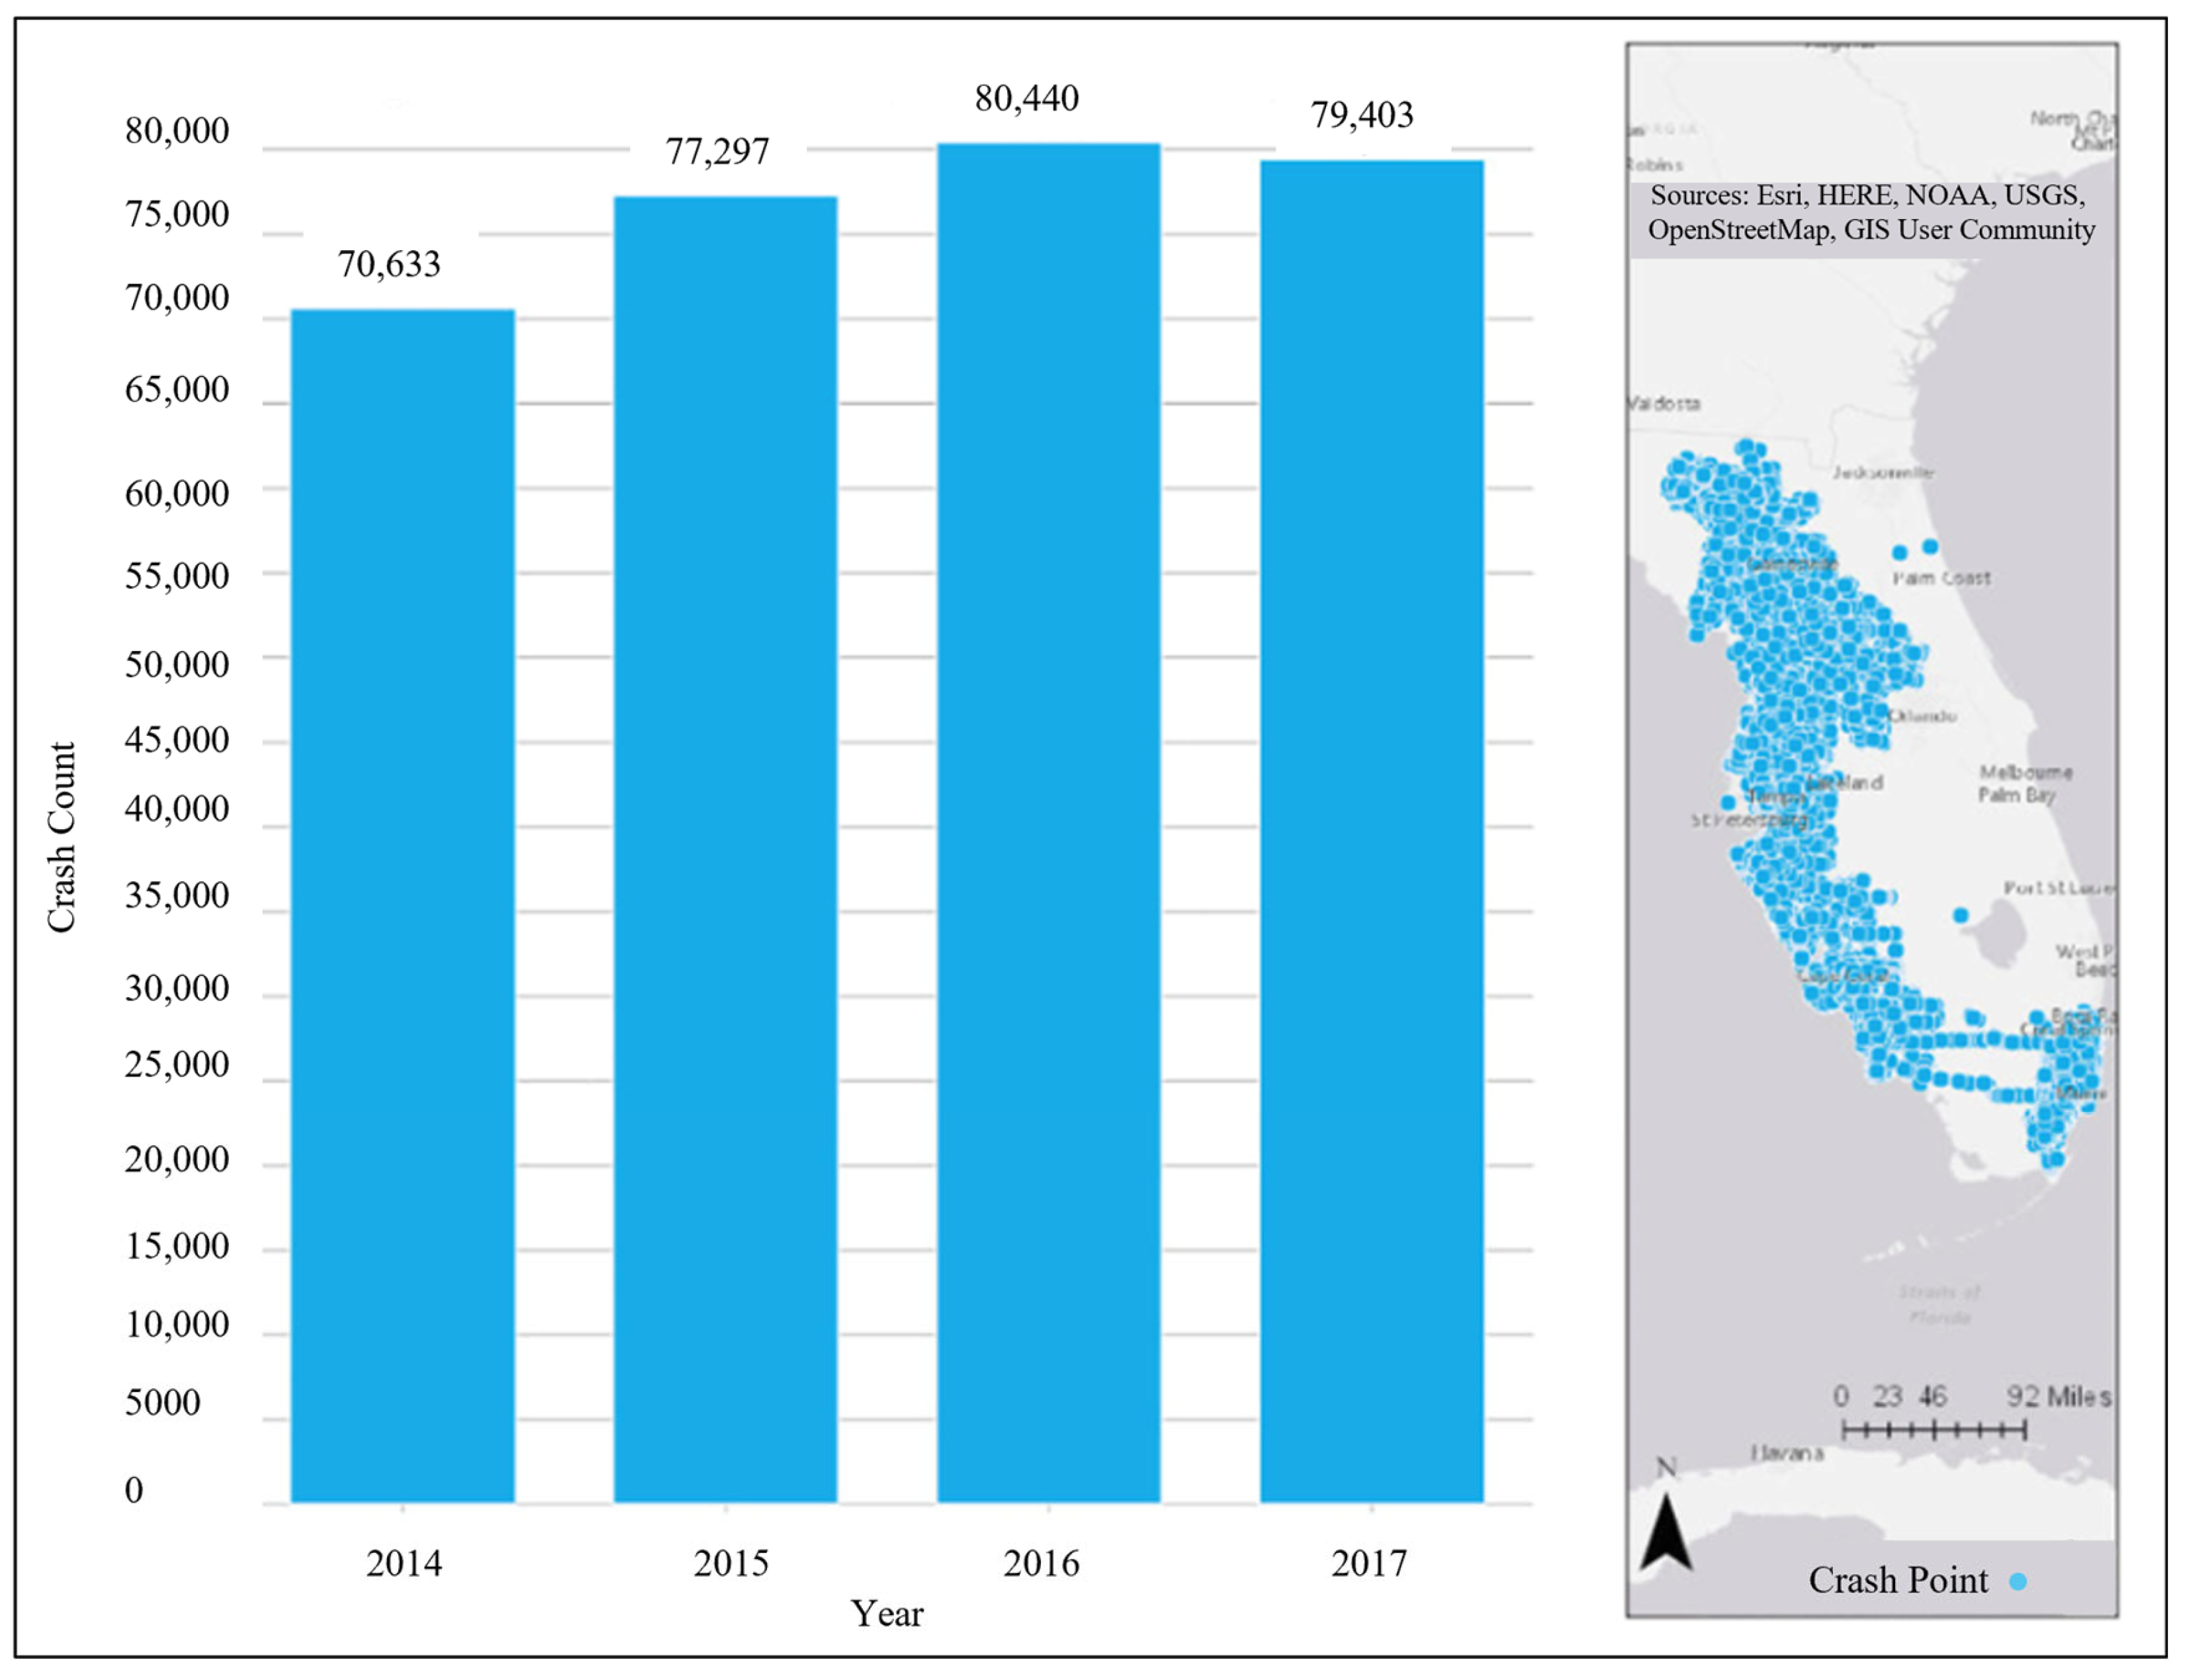
Figure 8 shows a bar chart comparing the annual crash totals from 2014 to 2017. The crash data show an overall rising trend from 70,633 in 2014 to a peak of 80,440 in 2016. This further emphasizes the importance of examining the spatial distribution and temporal crash changes to inform transportation safety planning.

4.2. Spatial Clustering Analysis

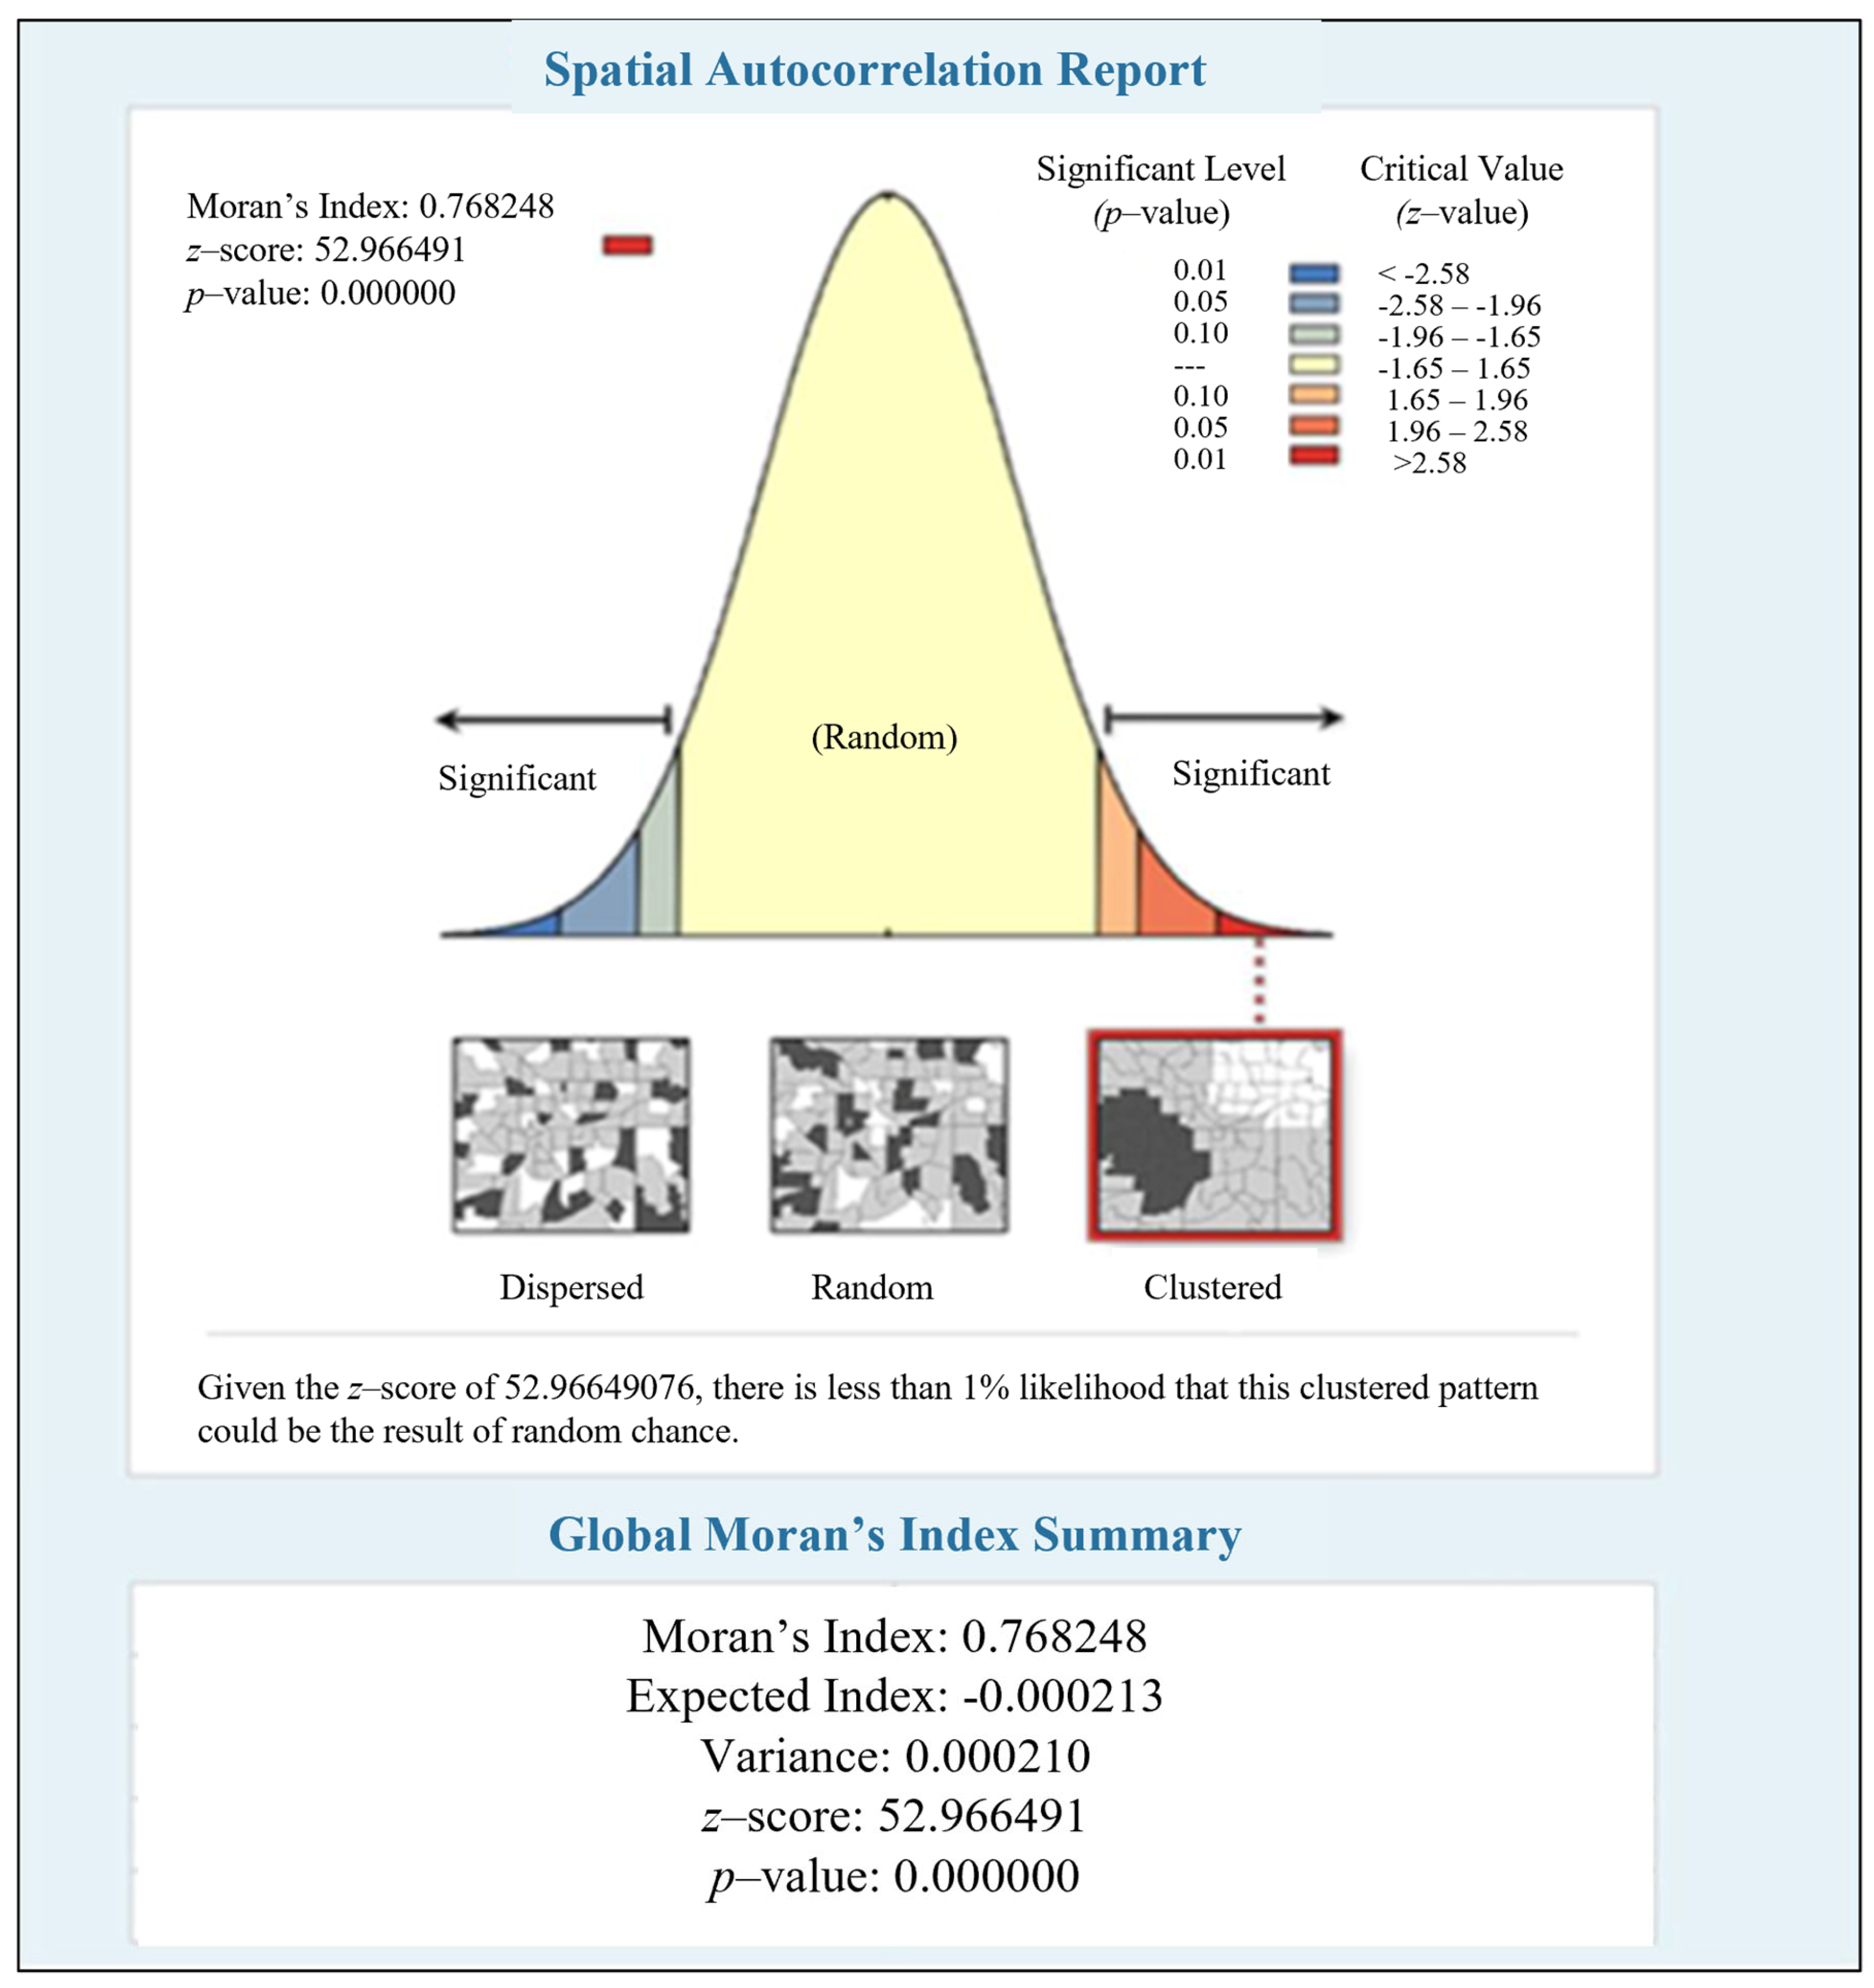
Global Moran’s I (0.7863) revealed a high z-score (52.9) and low p-value, indicating statistically significant spatial clustering as shown in Figure 9. The high z-score and negligible p-value validate the use of Getis-Ord Gi analysis to identify hotspot locations, cluster distribution of crash-prone locations, and their spatial autocorrelation over time. This confirms that crashes cluster in high-risk locations, which require a targeted approach to safety improvements rather than a uniform strategy at the corridor level.

4.3. Emerging Hotspot Analysis (EHA)

The EHA classified corridor areas according to the hotspot patterns from 2014 to 2017, revealing five key categories of hotspots. This categorization is an essential part of the decision-making framework as it enables transportation agencies to understand the behavior of emerging hotspots over time. The five hotspot categories within the study area are as follows:
  • Persistent hotspots are locations that have been statistically significant and consistent over consecutive intervals, and, therefore, they will require more investment in their mitigation strategies.
  • Intensifying hotspots, where the concentration of crashes increases over time, suggest a growing safety concern that requires priority intervention before they become persistent.
  • Sporadic hotspots appear irregularly over time and, therefore, require tailored safety strategies.
  • Diminishing hotspots with a declining crash concentration over time indicate effective application of prior safety improvement, so they require less attention compared to other categories.
  • New hotspots are locations that recently became statistically significant. Identifying new hotspot locations is critical, enabling agencies to proactively mitigate these new areas before they escalate.
Table 3 lists hotspot categories and their locations.
Figure 10 illustrates that intensifying hotspots are concentrated in high-density urban and freight-dominant regions such as Miami and Tampa. Sporadic hotspots appeared more frequently in rural sections of the corridor.
Figure 11 shows several new hotspot locations where crashes have recently become statistically significant. Bright red hexagons represent new hotspots with significantly high crash rates in the last months of 2017. These locations require more attention and traffic management based on their temporal and spatial patterns. Together, the descriptive, statistical, and visual analysis results provide a comprehensive understanding of crash dynamics. They determined the locations where different hotspot categories were concentrated and their changes over time, providing a clear evidence-based tool for transportation agencies to enhance public safety and strategic resource allocation.

4.4. Three-Dimensional Space–Time Crash Trend Visualization

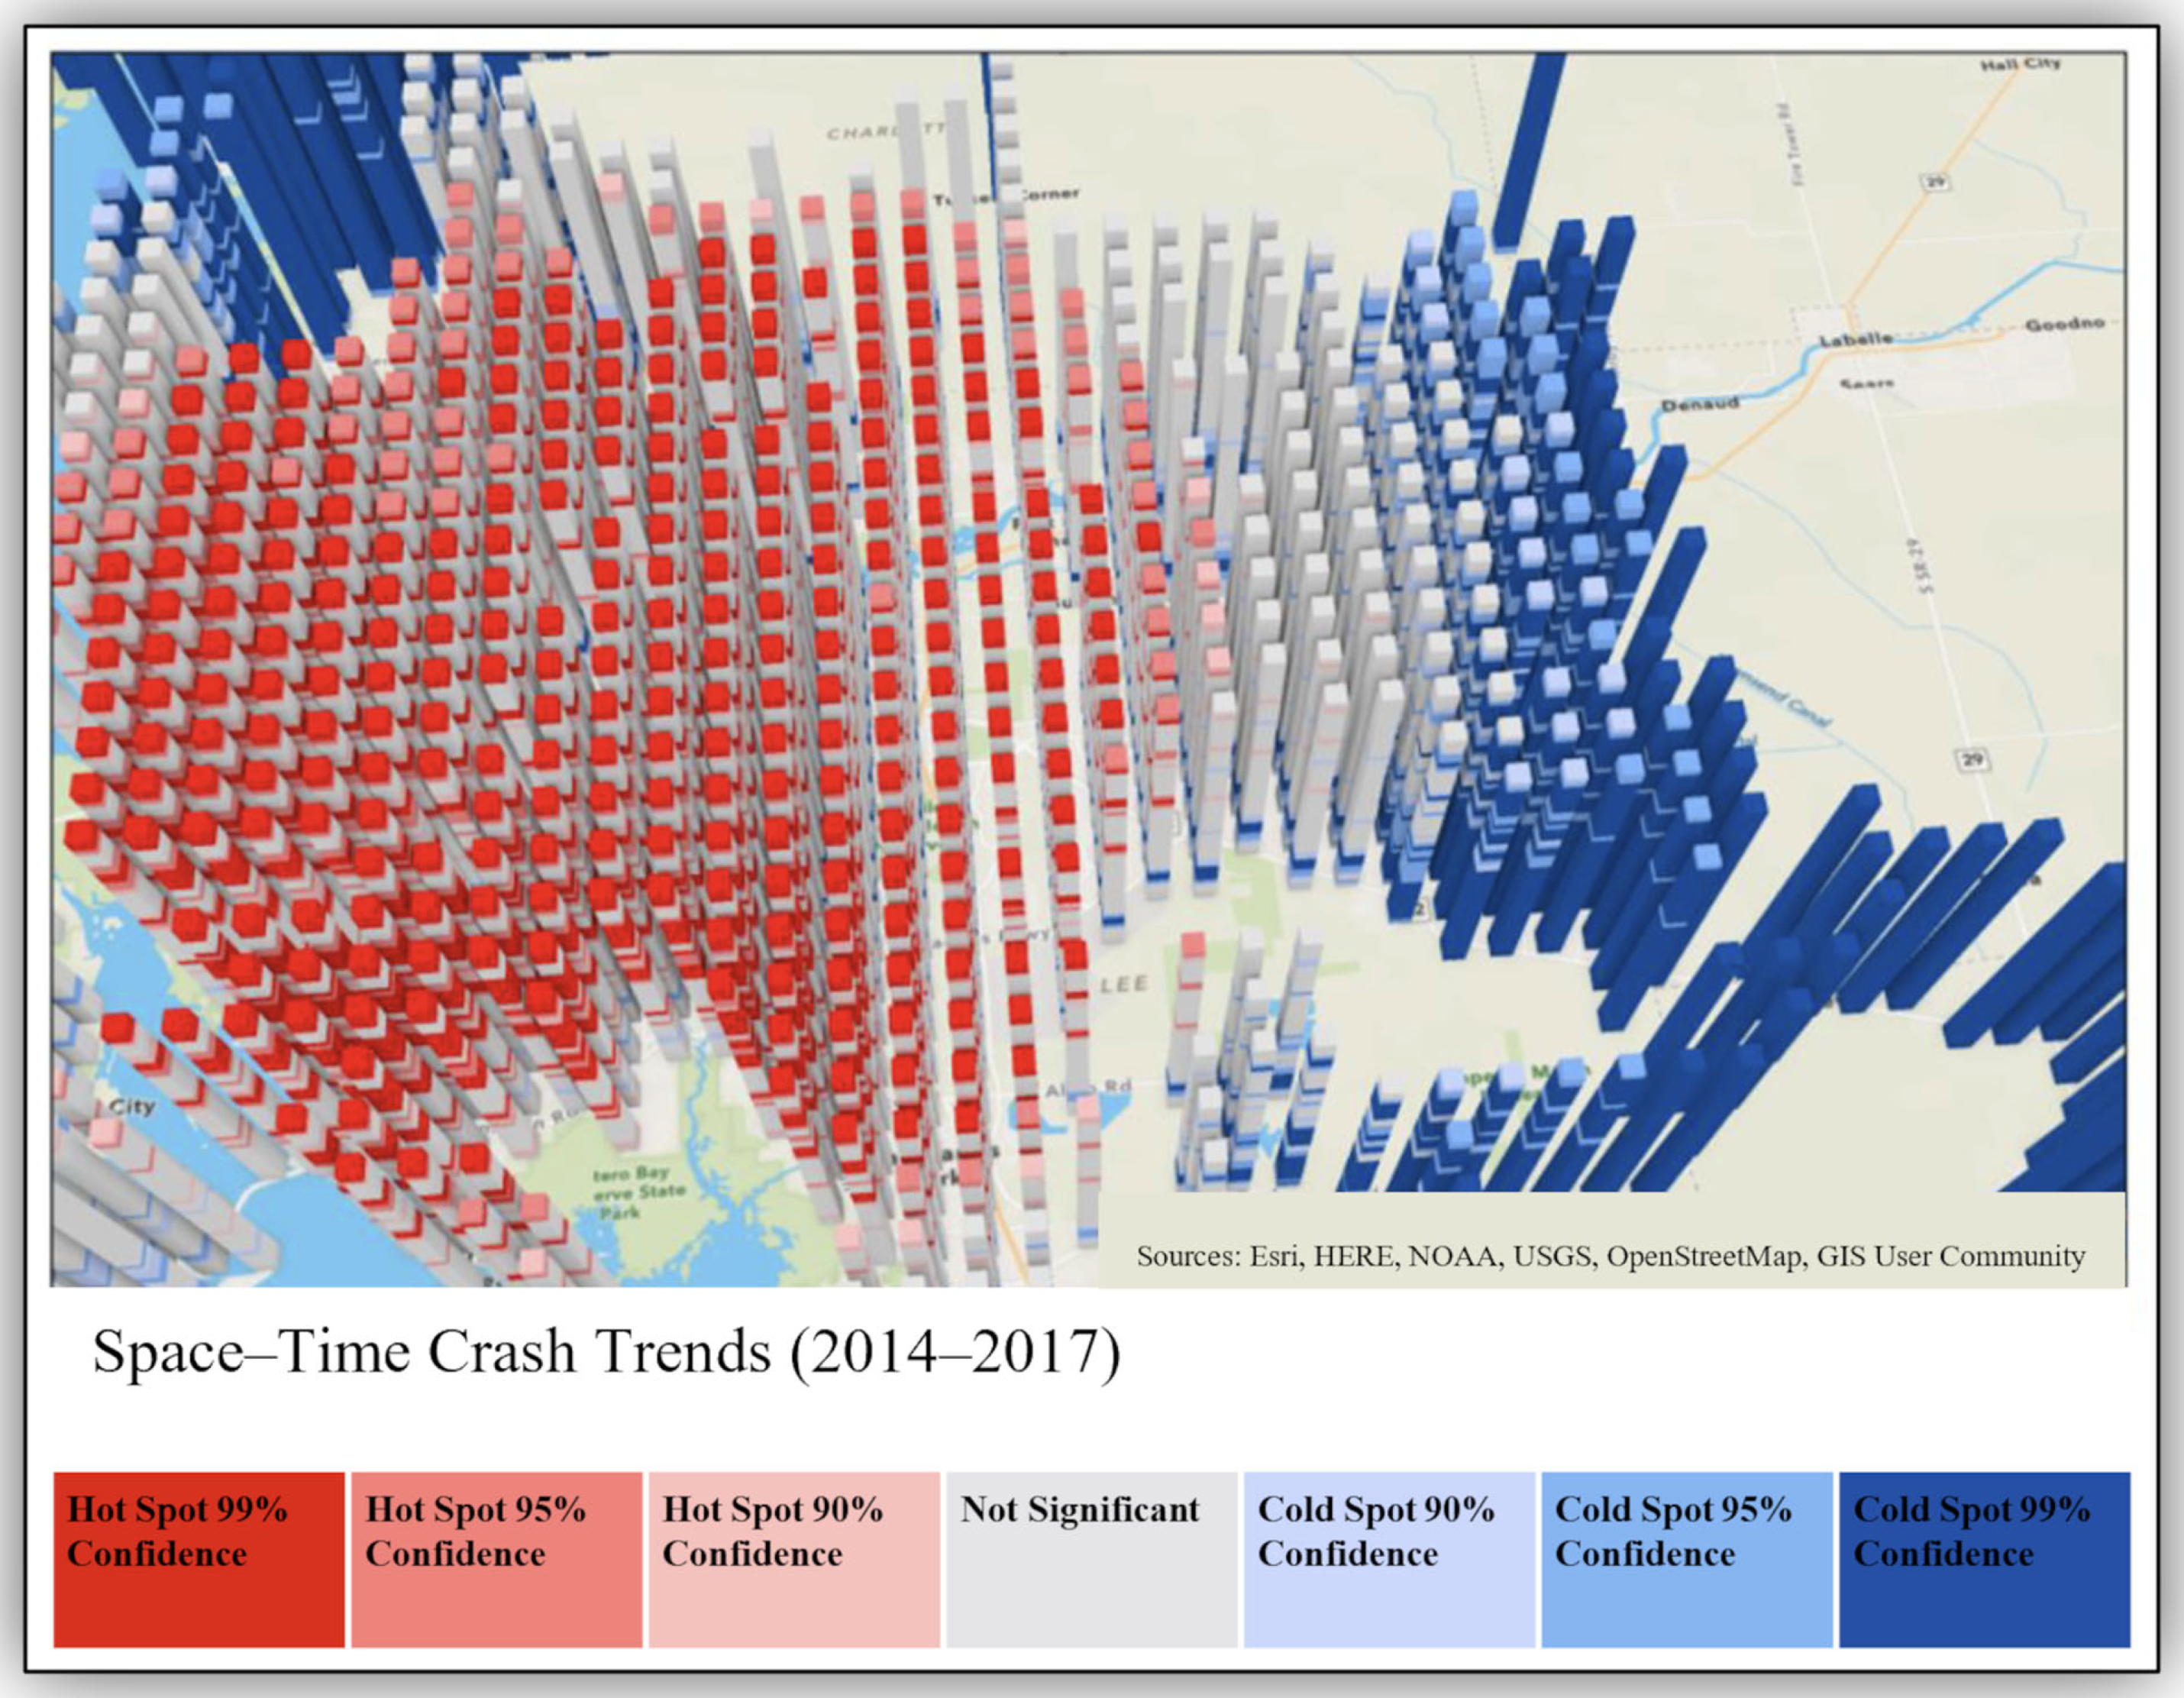
In this study, STC analysis was performed to investigate the statistically significant locations of the crashes and present a three-dimensional visualization of the significant crash trends during the study period. As shown in Figure 12, the hexagons in 3D are represented by columns of slanted bins. Each bin represents a one-month time period, and the top of the column represents the most recent time. The red bins are statistically significant crash clusters with high crash rates, whereas the blue bins are statistically significant clusters with low crash rates and various confidence levels. Gray bins represent areas without significant clustering. This 3D visualization shows how hotspot intensity and significance change over time. The results revealed that some locations remained red through many time layers, indicating intensifying high-crash zones. In contrast, other locations became red only near the top bins, indicating newly emerged hotspots in late 2017. This dynamic 3D visualization helps identify previously safe locations that have become problematic, enabling transportation agencies to develop mitigation strategies.
The results of Moran’s I index of the crash dataset are 0.7863, indicating a positive spatial autocorrelation. A z-score of 52.9 and a low p-value confirmed that the crash clustering patterns along the study area were statistically significant and were not randomly distributed. The proposed methodology classifies crash patterns into multiple categories, such as intensifying and new hotspots, presenting the evolution of spatial and temporal crash risk.
Identifying and classifying crash hotspots, particularly in high-density urban counties such as Miami-Dade, Broward, and Hillsborough, highlights the impact of high traffic volumes and complex roadway geometry on crash risk. Additionally, descriptive analysis revealed a seasonal influence on crash occurrences, potentially related to variations in travel behavior, weather conditions, or freight activities throughout the year. This combination of temporal and spatial descriptive analyses offers insights to guide resource allocation and safety interventions at high-intensity crash locations or during high-risk periods.
The statistical tools utilized in this study, such as Getis-Ord Gi* statistic and STC analysis, emphasize the need to evaluate the dynamic crash risk evolution over time. Identifying crash hotspot categories enables transportation agencies to take the proper actions to improve road safety in these areas. In addition, identifying new emerging hotspot locations helps better target crash countermeasures. Recognizing sporadic and diminishing hotspot locations indicates the efficiency of previous safety improvements or that intensive interventions may be less necessary.
The methodology presented in this study, which includes GIS-based STC modeling, spatial autocorrelation, Getis-Ord Gi* hotspot analysis, and emerging hotspot classification, can be applied to corridors in other locations with the availability of spatial crash data. While this study was conducted on I-75 in Florida, the developed framework can be generalized to all Florida interstate corridors. It can be extended to a similar road network in other states. The effects of crash data for other corridors would differ depending on road characteristics and traffic conditions; therefore, a different crash analysis could be predicted. However, spatial bin size and temporal aggregation parameters can be calibrated to align with the specific properties of each corridor.
The presented methodology can be implemented using more recent crash data. The statistical tools utilized in this framework are compatible with recent crash datasets and can be recalibrated to reflect updated hotspot locations that may occur due to today’s urban development. By following the procedure developed in this study, decision makers can continue to identify and classify high-risk locations for targeted interventions, understand the dynamic aspects of crashes, and determine the statistical significance of crash clustering and hotspots. The developed framework and its analytical procedures are transferable and remain relevant to decision making in roadway safety management.

5. Conclusions and Future Recommendations

Using a GIS-based spatiotemporal analysis framework, this paper presents a robust methodology for prioritizing and classifying roadway segments to identify statistically significant crash trends and locations in the study corridor during the analysis period. A comprehensive 3D STC analysis, Moran’s I, and EHA were conducted to evaluate crash patterns over four years across 20 counties.
The spatial analysis revealed seven new hotspot locations along the study area and a strong autocorrelation with Moran’s I of 0.768 and a z-score of 52.9, confirming the statistically significant crash clustering. Temporal crash analysis identifies the highest crash frequencies, which assists in time-based resource allocation during peak periods. Hotspot classification resulted in five main categories, enabling transportation agencies to implement safety strategies customized for each hotspot category. Assessing and classifying road networks based on safety performance and crash rates can help identify the most critical segments, respond proactively to crash trends, and support decision making for corridor safety management.
Future research recommendations include expanding the model’s scope by integrating factors influencing crash severity, such as weather conditions and roadway geometry. The proposed model can also be improved by including real-time crash data to monitor emerging hotspots.
The proposed framework can be expanded to other corridors to address road safety at the statewide level. The findings of this study highlight the importance of investigating crash patterns in both spatial and temporal dimensions, particularly in areas with persistent or new emerging crash hotspots, to support proactive road safety management.

Author Contributions

All authors (S.Y. and A.O.) contributed equally to this work. All authors have read and agreed to the published version of the manuscript.

Funding

This research was funded by the Florida Department of Transportation grant BDV24-977-28.

Institutional Review Board Statement

Not applicable.

Informed Consent Statement

Not applicable.

Data Availability Statement

The data presented in this study are available upon request from the corresponding author. The data are not publicly available due to privacy.

Acknowledgments

The authors wish to thank the Florida Department of Transportation for funding this research.

Conflicts of Interest

The authors declare no conflicts of interest.

References

  1. World Health Organization. Global Status Report on Road Safety 2023; World Health Organization: Geneva, Switzerland, 2023. [Google Scholar]
  2. Hauer, E. Observational Before-After Studies in Road Safety: Estimating the Effect of Highway and Traffic Engineering Measures on Road Safety; Pergamon: Amsterdam, The Netherlands, 2007; p. 306. Available online: http://worldcat.org/isbn/0080430538 (accessed on 23 July 2025).
  3. Pantangi, S.S.; Fountas, G.; Sarwar, M.T.; Bhargava, A.; Mohan, S.B.; Savolainen, P.; Anastasopoulos, P.C. The impact of public–private partnerships for roadway projects on traffic safety: An exploratory empirical analysis of crash frequencies. Anal. Methods Accid. Res. 2022, 33, 100192. [Google Scholar] [CrossRef]
  4. Lord, D.; Mannering, F. The statistical analysis of crash-frequency data: A review and assessment of methodological alternatives. Transp. Res. Part A Policy Pract. 2010, 44, 291–305. [Google Scholar] [CrossRef]
  5. Deljouyi, N.; Patnala, P.K.; Mehran, B.; Regehr, J.D. Application of reliability models for crash frequency analysis: Implications for network-wide safety performance. Can. J. Civ. Eng. 2024, 52, 60–73. [Google Scholar] [CrossRef]
  6. Guo, X.; Wu, L.; Zou, Y.; Fawcett, L. Comparative Analysis of Empirical Bayes and Bayesian Hierarchical Models in Hotspot Identification. Transp. Res. Rec. 2019, 2673, 111–121. [Google Scholar] [CrossRef]
  7. Howlader, M.M.; Yasmin, S.; Bhaskar, A.; Haque, M.M. A before-after evaluation of protected right-turn signal phasings by applying Empirical Bayes and Full Bayes approaches with heterogenous count data models. Accid. Anal. Prev. 2023, 179, 106882. [Google Scholar] [CrossRef] [PubMed]
  8. Al-Kaisy, A.; Huda, K.T. Empirical Bayes application on low-volume roads: Oregon case study. J. Saf. Res. 2022, 80, 226–234. [Google Scholar] [CrossRef]
  9. Florida Transportation Plan Policy Element Strategic Intermodal System (SIS) Policy Plan. Available online: www.floridatransportationplan.com (accessed on 23 July 2025).
  10. Li, L.; Zhu, L.; Sui, D.Z. A GIS-based Bayesian approach for analyzing spatial-temporal patterns of intra-city motor vehicle crashes. J. Transp. Geogr. 2007, 15, 274–285. [Google Scholar] [CrossRef]
  11. Iamtrakul, P.; Chayphong, S. GIS-based analysis of spatio-temporal clustering of road traffic accidents in Bangkok Metropolitan Region (BMR), Thailand from 2012 to 2021. Transp. Res. Interdiscip. Perspect. 2025, 31, 101489. [Google Scholar] [CrossRef]
  12. Vemulapalli, S.S.; Ulak, M.B.; Ozguven, E.E.; Sando, T.; Horner, M.W.; Abdelrazig, Y.; Moses, R. GIS-based Spatial and Temporal Analysis of Aging-Involved Accidents: A Case Study of Three Counties in Florida. Appl. Spat. Anal. Policy 2017, 10, 537–563. [Google Scholar] [CrossRef]
  13. Mohaymany, A.S.; Shahri, M.; Mirbagheri, B. GIS-based method for detecting high-crash-risk road segments using network kernel density estimation. Geo-Spat. Inf. Sci. 2013, 16, 113–119. [Google Scholar] [CrossRef]
  14. Feizizadeh, B.; Omarzadeh, D.; Sharifi, A.; Rahmani, A.; Lakes, T.; Blaschke, T. A GIS-Based Spatiotemporal Modelling of Urban Traffic Accidents in Tabriz City during the COVID-19 Pandemic. Sustainability 2022, 14, 7468. [Google Scholar] [CrossRef]
  15. Sae-Ngow, P.; Kulpanich, N.; Worachairungreung, M.; Sittarachu, N.; Thanakunwutthirot, K.; Hemwan, P. Identification of road crash zones, spatial patterns, and emerging hot spots of road traffic injury severity in Phuket, Thailand. Geoj. Tour. Geosites 2025, 60, 1067–1077. [Google Scholar] [CrossRef]
  16. Desktop GIS Software. Mapping Analytics. ArcGIS Pro. Available online: https://www.esri.com/en-us/arcgis/products/arcgis-pro/overview (accessed on 23 July 2025).
  17. Rao, S. Traffic safety engineering and crash analysis methods. Int. J. Sci. Res. Arch. 2025, 15, 158–165. [Google Scholar] [CrossRef]
  18. Paliotto, A.; Meocci, M.; Terrosi, A.; La Torre, F. Systematic review, evaluation and comparison of different approaches for the implementation of road network safety analysis. Heliyon 2024, 10, e28391. [Google Scholar] [CrossRef] [PubMed]
  19. Abdulhafedh, A. Road Crash Prediction Models: Different Statistical Modeling Approaches. J. Transp. Technol. 2017, 07, 190–205. [Google Scholar] [CrossRef]
  20. Alazab, A.; Venkatraman, S.; Abawajy, J.; Alazab, M. An Optimal Transportation Routing Approach using GIS-based Dynamic Traffic Flows. In Proceedings of the 3rd International Conference on Information and Financial Engineering IPEDR, Singapore, 26–27 February 2011; IACSIT Press: Singapore, 2011; Volume 12, pp. 172–178. [Google Scholar]
  21. Lepofsky, M.; Abkowitz, M.; Cheng, P. Transportation hazard analysis in integrated GIS environment. J. Transp. Eng. 1993, 119, 239–254. [Google Scholar] [CrossRef]
  22. Kazmi, S.S.A.; Mumtaz, R.; Anwar, Z.; Ahmed, M. Spatiotemporal Clustering and Analysis of Road Accident Hotspots by Exploiting GIS Technology and Kernel Density Estimation. Comput. J. 2020, 65, 155–176. [Google Scholar] [CrossRef]
  23. Amiri, A.M.; Nadimi, N.; Khalifeh, V.; Shams, M. GIS-based crash hotspot identification: A comparison among mapping clusters and spatial analysis techniques. Int. J. Inj. Control. Saf. Promot. 2021, 28, 325–338. [Google Scholar] [CrossRef]
  24. Tulloch, D.L.; Myers, J.R.; Hasse, J.E.; Parks, P.J.; Lathrop, R.G. Integrating GIS into farmland preservation policy and decision making. Landsc. Urban Plan. 2003, 63, 33–48. [Google Scholar] [CrossRef]
  25. Kim, D.; Chae, M. GIS for a Policy Decision Support in National Tourism Portal. In Proceedings of the 24th Annual ESRI User Conference, San Diego, CA, USA, 9–13 August 2004. [Google Scholar]
  26. Terh, S.H.; Cao, K. GIS-MCDA based cycling paths planning: A case study in Singapore. Appl. Geogr. 2018, 94, 107–118. [Google Scholar] [CrossRef]
  27. Huang, B. GIS-Based Route Planning for Hazardous Material Transportation. J. Environ. Inform. 2006, 8, 49–57. [Google Scholar] [CrossRef]
  28. Arampatzis, G.; Kiranoudis, C.T.; Scaloubacas, P.; Assimacopoulos, D. A GIS-based decision support system for planning urban transportation policies. Eur. J. Oper. Res. 2004, 152, 465–475. [Google Scholar] [CrossRef]
  29. Hazaymeh, K.; Almagbile, A.; Alomari, A.H.; Hazaymeh, K.; Almagbile, A.; Alomari, A.H. Spatiotemporal Analysis of Traffic Accidents Hotspots Based on Geospatial Techniques. ISPRS Int. J. Geo-Inf. 2022, 11, 260. [Google Scholar] [CrossRef]
  30. Alam, M.S.; Tabassum, N.J. Spatial pattern identification and crash severity analysis of road traffic crash hot spots in Ohio. Heliyon 2023, 9, e16303. [Google Scholar] [CrossRef] [PubMed]
  31. Cantisani, G.; Peluso, P.; Pompigna, A.; Serrone, G.D. A GIS-based methodology to observe driver behaviors and infrastructure characteristics through operating speeds. Transp. Res. Procedia 2025, 90, 416–423. [Google Scholar] [CrossRef]
  32. Harirforoush, H.; Bellalite, L. A new integrated GIS-based analysis to detect hotspots: A case study of the city of Sherbrooke. Accid. Anal. Prev. 2019, 130, 62–74. [Google Scholar] [CrossRef]
  33. Moreno-Ponce, L.A.; Pérez-Zuriaga, A.M.; García, A. Predictive Models and GIS for Road Safety: Application to a Segment of the Chone–Flavio Alfaro Road. Sustainability 2025, 17, 5032. [Google Scholar] [CrossRef]
  34. Zhang, Y.; Zhu, F.; Li, Q.; Qiu, Z.; Xie, Y. Exploring Spatiotemporal Patterns of Expressway Traffic Accidents Based on Density Clustering and Bayesian Network. ISPRS Int. J. Geo-Inf. 2023, 12, 73. [Google Scholar] [CrossRef]
  35. Wang, D.; Krebs, E.; Nickenig Vissoci, J.R.; de Andrade, L.; Rulisa, S.; Staton, C.A. Built Environment Analysis for Road Traffic Crash Hotspots in Kigali, Rwanda. Front. Sustain. Cities 2020, 2, 17. [Google Scholar] [CrossRef]
  36. Zubaidi, H.; Obaid, I.; Mohammed, H.A.; Das, S.; Al-Bdairi, N.S.S. Hot spot analysis of the crash locations at the roundabouts through the application of GIS. J. Phys. Conf. Ser. 2021, 1895, 012032. [Google Scholar] [CrossRef]
  37. Gedamu, W.T.; Plank-Wiedenbeck, U.; Wodajo, B.T. Spatio-temporal analysis of road traffic crashes by severity. Transp. Eng. 2025, 20, 100327. [Google Scholar] [CrossRef]
  38. Alsahfi, T. Spatial and Temporal Analysis of Road Traffic Accidents in Major Californian Cities Using a Geographic Information System. ISPRS Int. J. Geo-Inf. 2024, 13, 157. [Google Scholar] [CrossRef]
  39. Wang, S.; Gao, K.; Zhang, L.; Yu, B.; Easa, S.M. Geographically weighted machine learning for modeling spatial heterogeneity in traffic crash frequency and determinants in US. Accid. Anal. Amp; Prev. 2024, 199, 107528. [Google Scholar] [CrossRef]
  40. Iranitalab, A.; Khattak, A. Comparison of four statistical and machine learning methods for crash severity prediction. Accid. Anal. Prev. 2017, 108, 27–36. [Google Scholar] [CrossRef]
  41. Ding, C.; Chen, P.; Jiao, J. Non-linear effects of the built environment on automobile-involved pedestrian crash frequency: A machine learning approach. Accid. Anal. Prev. 2018, 112, 116–126. [Google Scholar] [CrossRef]
  42. Karimi Monsefi, A.; Shiri, P.; Mohammadshirazi, A.; Karimi Monsefi, N.; Davies, R.; Moosavi, S.; Ramnath, R. CrashFormer: A Multimodal Architecture to Predict the Risk of Crash. In Proceedings of the UrbanAI ‘23: 1st ACM SIGSPATIAL International Workshop on Advances in Urban-AI, Hamburg, Germany, 13 November 2023; Association for Computing Machinery: New York, NY, USA, 2023; pp. 42–51. [Google Scholar] [CrossRef]
  43. Zhao, L.; Li, F.; Sun, D.; Dai, F. Highway Traffic Crash Risk Prediction Method considering Temporal Correlation Characteristics. J. Adv. Transp. 2023, 2023, 9695433. [Google Scholar] [CrossRef]
  44. Wang, X.; Su, Y.; Zheng, Z.; Xu, L. Prediction and interpretive of motor vehicle traffic crashes severity based on random forest optimized by meta-heuristic algorithm. Heliyon 2024, 10, e35595. [Google Scholar] [CrossRef]
Figure 1. Map of the I-75 study corridor in Florida, highlighting the 20 counties included in the analysis.
Urbansci 09 00411 g001
Figure 2. Workflow of patio-temporal analysis integrating crash data, roadway data, trend detection, and hotspot categorization.
Urbansci 09 00411 g002
Figure 3. Crash distribution across the I-75 corridor (2014–2017) with a zoomed-in view of the Tampa Bay area.
Urbansci 09 00411 g003
Figure 4. Concept of the space–time cube, representing crash data across spatial (X, Y) and temporal (T) dimensions (ArcGIS tool reference).
Urbansci 09 00411 g004
Figure 5. Annual crash counts by county across the I-75 study corridor (2014–2017).
Urbansci 09 00411 g005
Figure 6. Annual crash counts by the day of the week across the I-75 corridor (2014–2017).
Urbansci 09 00411 g006
Figure 7. The temporal distribution of crashes along the I-75 corridor (2014–2017).
Urbansci 09 00411 g007
Figure 8. Annual crash counts (2014–2017) in the I-75 study corridor.
Urbansci 09 00411 g008
Figure 9. Global Moran’s I Summary Report.
Urbansci 09 00411 g009
Figure 10. Emerging Hotspot Analysis of traffic crashes in Florida (2014–2017).
Urbansci 09 00411 g010
Figure 11. Example of a newly identified crash hotspot with corresponding spatial statistics from the emerging hotspot analysis.
Urbansci 09 00411 g011
Figure 12. Three-Dimensional space–time cube analysis of crashes (2014–2017).
Urbansci 09 00411 g012
Table 1. Summary of research objectives and corresponding methods.
Research ObjectivesCorresponding MethodsData RequirementsExpected Outputs
Spatiotemporal analysis of crash patterns and 3D visualizationSTC analysis, 3D visualization of temporal crash trendsMonthly crash records with geolocation (latitude, longitude), timestamp, and roadway ID for the study period Identification of crash temporal patterns, understanding of crash spatial distribution, and crash trends visualization
Identify and classify crash hotspotsGlobal spatial autocorrelation (Moran’s I), EHA (Getis-Ord Gi statistic)Crash records with spatial coordinates and temporal attributesClassification of hotspots into categories, crash trends over time, and statistical significance levels
Assess the statistical analysis of the crash distributionz-score calculations, p-value determination, confidence level assessmentCrash frequency counts aggregated by roadway segments. Spatial weight matrix to define neighborhood relationships between segmentsValidation of crash spatial patterns
Develop a framework to support decision-making in resource allocationCrash pattern analysis and crash trend interpretation, resource allocation assessmentHotspot classification results combined with statistical output (Moran’s I, z-score, p-value)Prioritize financial resources more effectively, and safety improvement recommendations
Table 2. Crash counts by county along I-75 (2014–2017) showing the highest crash frequencies in Miami-Dade, Broward, and Hillsborough counties.
CountyCrash During Study Period (2014–2017)
Alachua9908
Broward63,510
Charlotte4048
Citrus3230
Collier7128
Columbia2541
Desoto859
Gilchrist319
Hernando4691
Hillsborough50,377
Lake 7967
Lee18,186
Levy1082
Manatee10,676
Marion10,499
Miami-Dade84,100
Pasco15,577
Sarasota9700
Sumter2030
Suwannee1084
Union261
Table 3. Hotspot categories, definitions, and study area locations.
Hotspot CategoryDefinitionLocation
Persistent hotspotStatistically significant hotspot for most of the 4-year study periodMiami-Dade and Hillsborough counties (major freight hubs and urban areas)
Intensifying hotspotIncreasing crash concentration with each successive time stepNear Tampa, Fort Myers, Broward County
New hotspotRecently became statistically significant Near Paseo, Manatee, and Collier counties
Sporadic hotspotHotspots appear irregularly over timeRural areas of Colombia, Hernando, and Citrus counties
Diminishing hotspotPreviously a hotspot but declined over timeNorth segments Union, Gilchrist, and Levy counties
Disclaimer/Publisher’s Note: The statements, opinions and data contained in all publications are solely those of the individual author(s) and contributor(s) and not of MDPI and/or the editor(s). MDPI and/or the editor(s) disclaim responsibility for any injury to people or property resulting from any ideas, methods, instructions or products referred to in the content.