Article

Spatial Accessibility in the Urban Environment of a Medium-Sized City: A Case Study of Public Amenities in Odense, Denmark

Department of Sustainability and Planning, Aalborg University, A.C. Meyers Vænge 15, 2450 København, Denmark
Urban Sci. 2025, 9(10), 407; https://doi.org/10.3390/urbansci9100407
Submission received: 31 July 2025 / Revised: 16 September 2025 / Accepted: 22 September 2025 / Published: 2 October 2025

Abstract

Spatial accessibility is a key principle in urban studies, shaping how people reach amenities and services across cities. While most research concentrates on large metropolitan areas and central urban services, small and medium-sized cities and their main amenities remain less studied. To bridge this gap, this study explores spatial accessibility to public amenities in relation to population density in Odense, a medium-sized city known for its compact layout and robust infrastructure supporting walking, cycling, and public transport. Despite Odense’s proactive planning and multimodal transport network, marked accessibility inequalities still exist, especially in peripheral neighbourhoods. This research uses a data-driven approach combining network-based travel time analysis with grid-cell-based spatial visualisation. Additionally, a multi-criteria accessibility scoring framework is introduced, including indicators such as amenity density, diversity of services, temporal thresholds for walking and cycling, and population distribution. The results show an uneven accessibility landscape, with significant gaps in outer districts, highlighting the limitations of uniform planning thresholds. By applying spatial analytical principles, the study uncovers embedded socio-spatial inequalities in everyday urban access. These insights offer practical guidance for planners and policymakers, underscoring the importance of context-sensitive multimodal infrastructure and decentralised service provision to support sustainable urban growth.

1. Introduction

Spatial accessibility is fundamental to sustainable urban development, shaping how residents interact with public services that support daily life, social inclusion and low-carbon lifestyle [1,2]. With urban planning shifting towards climate resilience, transport equity, and liveable neighbourhoods, accessibility acts as a tool for creating fair and resilient cities [3,4]. Concepts such as the “15 min city” have advanced proximity-focused strategies, yet these are tested mainly in high-density metropolises with robust infrastructure [5,6,7]. Medium-sized cities, however, face unique challenges such as sparser populations, more dispersed land uses, and less redundant service networks, making shorter, active-mode thresholds of 5–10 min more realistic than a universal 15 min goal [8,9,10,11,12,13]. Therefore, this study adopts a 10 min city perspective for Odense, arguing that a shorter accessibility threshold better reflects the mobility dynamics and planning needs of medium-sized cities compared to large metropolitan areas.
Despite increasing research on spatial accessibility, ongoing gaps restrict its use across various urban scales in everyday urban settings. Research indicates a metropolitan bias, calibrating models such as ’15 min city’ on large cities while underexploring medium-sized cities, where infrastructure disparities are overlooked [5,6,7]. In this study, we identify three practical gaps that limit everyday applicability in medium-sized cities. First, prior studies focus on “major” facilities (hospitals, large parks, etc.), while overlooking everyday and micro-scale amenities that influence routine access to corner shops, pharmacies, bakeries, etc.; street-level supports such as benches, drinking water, shade, and public toilets; and small green spaces that are actually reachable on foot [8,9,10,11,12,13,14]. These amenities are important because they support short, frequent trips, age-friendly mobility, and inclusive walking. Second, methods often depend on Euclidean buffers, single-mode assumptions, or administrative boundaries (MAUP), which undercount multimodal behaviour and create MAUP-related biases [3,15,16,17,18]. Third, accessibility is rarely assessed for population–service mismatches at short thresholds suitable for medium-sized cities [18,19,20]. We address these gaps with a Multimodal Composite Accessibility Index (MCAI) that (i) integrates essential, occasional, and micro-scale amenities, (ii) uses network-based walking and cycling times with time-decay at 5 and 10 min, and (iii) overlays population on a uniform grid to diagnose demand–supply mismatches. Applied to Odense, the MCAI quantifies both adherence to and deviations from Central Place Theory (CPT) [8,12], revealing polycentric and fragmented patterns relevant to equity-focused planning.
Odense, a compact, cycling-oriented, medium-sized city, offers a representative context where proactive planning coexists with peripheral disparities [14,15]. Using network-based travel-time calculations alongside a grid-cell-based spatial analysis framework, the study introduces a novel multi-criteria score system, MCAI. The MCAI combines amenity density and diversity, mode-specific decay, and population weighting, enabling transparent neighbourhood comparisons and revealing polycentric deviations relevant to equity-driven planning.
According to studies, CPT suggests a gradient of accessibility from the centre to the periphery, with a higher concentration and variety of amenities in the urban core [21,22,23,24,25]. It offers a baseline for understanding urban hierarchies. However, in medium-sized cities like Odense, accessibility is also shaped by amenity-specific siting, such as decentralised green and recreational spaces, multimodal behaviour (walking vs. cycling), and sustainability-led planning can produce polycentric and fragmented accessibility patterns beyond a uniform CPT gradient [8,12,13,26,27,28]. Studies in urban and geospatial sciences link these deviations to uneven population densities and distribution concerns, shifting the focus from whether a gradient exists to where and to what extent it applies, as well as where it diverges from an equity perspective [29,30,31,32]. Accordingly, we treat CPT as a baseline and hypothesise systematic departures by amenity type and travel mode; the MCAI quantifies both conformance and divergence and identifies population-service mismatches indicative of spatial inequity.
To address the research gap, this manuscript is organised as follows: The Section 2 reviews the literature on spatial accessibility and evaluation methods. The Section 3 describes the spatial analysis workflow and the development of the accessibility index. The Section 4 presents the main findings, discussed in terms of planning implications. The Section 5 emphasises including various amenities in accessibility analyses to reveal socio-spatial disparities and introduces a framework for fostering inclusive, sustainable urban environments in medium-sized cities.

2. Literature Review

2.1. Existing Approach to Spatial Accessibility Analysis

Spatial accessibility links the availability of services to people’s ability to reach them, influencing inclusion, health, and low-carbon mobility [1,2,3,4]. Recent research emphasises accessibility within equity-driven strategies [5,6], while proximity models like the 15 min city offer a compelling yet primarily urban solution [7,33]. Empirical tools designed for dense cities are not always applicable to medium-sized towns, where lower densities, more dispersed land uses, and less connected networks are common [30]. Proximity and cumulative-opportunity measures (e.g., Euclidean buffers and threshold counts) remain popular because they are transparent and straightforward to communicate. However, they can overestimate access in fragmented street layouts, overlook capacity and quality, and are sensitive to administrative boundaries, the modifiable areal unit problem (MAUP), which can lead to misleading classifications of “well-served” areas [3,15,16].
On the other hand, the 2-Step Floating Catchment Area (2SFCA) method improves realism by combining distance decay with balancing supply and demand. Its uses include community healthcare and parks, often supplemented by location-allocation or Huff-type choice [32,34,35,36]. However, these models are sensitive to parameters (catchment size/decay) and depend on reliable, comparable capacity and quality data; when inputs vary across amenity categories common in medium-sized cities, results can differ greatly with plausible parameters. Network-based, multimodal, and schedule-aware approaches estimate door-to-door travel times on real networks (and, where relevant, GTFS timetables), accounting for variations in mode, time, and the influence of urban morphology [12,29,37,38,39,40,41]. Their main limitation is the increased data and computational demand, along with limited coverage for detailed walking and cycling networks outside major urban areas. Lastly, behavioural or choice extensions (e.g., Huff) improve face validity when users select facilities of different qualities, but they require calibration data (surveys, flows, ratings) that are rarely available for the full range of amenities [35,36].
Taken together, these strands highlight a tension between interpretability and realism, as well as between data needs and transferability. For medium-sized cities, three priorities emerge: (i) represent active-mode network travel times at short, context-appropriate thresholds rather than rely on Euclidean proxies [17,42]; (ii) account for amenity diversity, including everyday and micro-scale infrastructures that support inclusive walking [8,9,14]; (iii) use population-normalised, grid-based reporting to reveal demand–supply mismatches and minimise administrative-unit bias [16,17,43].
Methodologically, many urban applications still rely on 2SFCA variants. For health services, Song et al. [34] combine gravity models and location-allocation to enhance coverage, but are limited by population data and unmodelled socio-behavioural factors. For urban green spaces, Xue et al. [32] highlight disparities caused by simplified assumptions about quality and use frequency, while Xing et al. [35] incorporate Huff-based attraction to reflect youth preferences but depend on walking-only modes and partial quality indicators. For parks, Mao et al. [27] develop a Comprehensive Multimodal 2SFCA (CM2SFCA) with variable catchments and user ratings, complemented by spatial hot-spotting; however, heterogeneity in user behaviour and socio-economic demand remains only partly captured.
Beyond the 2SFCA method, studies on network/service-area and location-allocations [16,43,44], identify imbalances but are limited by static routing and generic datasets. Meanwhile, sidewalk-specific pedestrian networks [45] highlight local shortcomings but face limited coverage. Research on urban morphology and behaviour reveals how form and daily routines impact access. For example, Tannier et al. [26] find that fractal layouts enhance access to green spaces but increase trips to commercial areas. Elldér et al. [8] show that proximity and diversity reduce reliance on cars, and Wang et al. [12] employ multimodal, schedule-aware analysis to expose inequalities at test sites. Although tools like Urban Access and GTFS pipelines have reduced barriers [12,40,42], Euclidean proxies and single-mode assumptions remain common, especially in smaller cities.

2.2. Amenity Typologies and Scoring Strategies in Spatial Accessibility Analysis

Amenities serve as the core elements around which accessibility is assessed; their presence, capacity, quality, and spatial arrangement influence service provision, fairness, mobility, and daily well-being [5,9,46,47]. Since metrics rely on how amenities are chosen, categorised, and scored, a consistent typology is vital for interpretation and comparison. Building on previous research, we identify seven domains: healthcare, education, green and recreation, public transport, everyday amenities, micro-scale supports, and cultural facilities, covering both routine and occasional needs, alongside the micro-infrastructure essential for inclusive walking (Table 1).
Current scoring practices often favour what is easy to measure rather than what matters for equitable, everyday use. In healthcare, capacity-weighted indicators are useful for coverage audits but often overlook socio-demographic vulnerabilities (ageing, deprivation), risking systematic underestimation of need [34]. Education is frequently reduced to binary proximity, and even with hexagonal grids, the lack of quality or capacity weakens equity assessment [16,44]. Green/recreation studies commonly adopt advanced 2SFCA/Huff variants that weight size and attractiveness but rarely integrate aesthetics or perceived safety, inflating practical access [27,35,36,46,48,49]. Public transport indices increasingly utilise GTFS and PTAL-type composites (walk + wait + frequency) but still under-represent reliability and intermodal constraints that shape perceived access [13,38,39,40,41,42]. Micro-scale supports, critical for inclusive walkability, are often treated as simple presence or surface ratios, ignoring density, clustering, and quality, despite their importance for older and mobility-limited users [9,10,11]. Overall, these biases explain why models calibrated for high-profile facilities and data-rich environments might misclassify amenity access in city settings. Across domains, three dominant Scoring logics and their implications emerge:
Binary scoring (threshold presence/absence)—transparent but risks misclassification in heterogeneous contexts.
Capacity or size-weighted scoring—links influence volume/area but inherit 2SFCA sensitivity to uncertain capacity/quality.
User-preference or utility-weighted scoring (e.g., Huff [36])—captures attractiveness but requires calibration data, which is rarely available city-wide.
The typology in Table 1 provides a clear foundation for multimodal, equity-focused assessment: everyday amenities are high-frequency, proximity-based destinations [8]; educational and cultural facilities support longer-term opportunities [15,37]; micro-scale supports enable inclusive walking [9,14]; and public transport nodes provide city-wide connectivity [13,42]. However, ongoing measurement biases (binary/Euclidean proxies, uneven capacity/quality data, parameter-sensitive gravity/2SFCA applications) can misclassify access in medium-sized cities [27,32,34,35,36]. Therefore, our analysis (i) utilises short, active-mode network travel times instead of Euclidean distances [12,42]; (ii) systematically includes both everyday and micro-scale amenities alongside major facilities [8,9,10,11,14]; (iii) presents a population-normalised grid to reduce MAUP and reveal demand–supply mismatches [3,16,17,42]. Regarding conceptual positioning relative to 2SFCA, while it measures per capita service availability within a distance-decayed catchment when reliable capacity data exists, our main indicator is a multi-amenity, mode-specific network travel-time index normalised by population, designed to identify demand–supply imbalances in medium-sized urban areas.

3. Materials and Methods

Guided by the literature review and the medium-sized, active-mode context, we operationalise accessibility with a door-to-door network–travel-time approach across a broad set of amenities, using short thresholds (5 and 10 min with decay). 2SFCA is treated as a domain-specific comparator only where reliable capacity/quality attributes exist. We implement a grid-based, multimodal framework for Odense that ingests and cleans spatial data, builds walking and cycling networks, and computes a multi-criteria, population-normalised accessibility score with demand–supply mismatch diagnostics. All analyses are executed in Python 3 within QGIS 3.28 LTR using OSMnx, NetworkX, GeoPandas, and Pandas libraries for spatial data manipulation and analysis.

3.1. Study Area

Odense is Denmark’s third-largest city, situated south of the country on the island of Funen (Figure 1). In this study, we examine the functional urban area of Odense, matching the municipal boundary covering approximately 305.6 km2, with a population of about 211,000 residents [50]. The urban landscape lies on a low-relief plain with minor elevation variations; a network of water bodies and green corridors influences daily routes and explains the placement of passive amenities and recreational paths. Odense experiences an oceanic climate with mild winters (average January temperature ≈ 1–2 °C) and cool summers (average July temperature ≈ 17–18 °C), with rainfall distributed throughout the year, conditions that promote year-round mobility, such as walking and cycling [51]. The population is mainly made up of the working-age group (20–64), followed by a large number of young adults, and an increasing 65+ segment. Their active lifestyles shape daily trip purposes, while climate-related factors dictate mode choices, and equity concerns, providing important context for the following accessibility analyses.
The municipality’s physical and institutional characteristics create a compact, relatively flat environment that encourages walking and cycling for short- to medium-distance trips. These features support the focus on active transport modes and justify the use of 5 and 10 min thresholds, where walking indicates hyper-local accessibility and cycling broadens the practical range across dispersed service clusters. These geographic, climatic, and socio-demographic qualities make Odense a strong testbed for analysing multimodal (walking/cycling) accessibility in a medium-sized European city.

3.2. Data Collection and Preprocessing

Geospatial datasets were obtained from the INSPIRE-Danmark Geoportal [52,53], complemented by data from the Danish Climate Data Agency [54]. These datasets comply with the INSPIRE Directive, ensuring semantic interoperability, data standardisation, and comprehensive nationwide coverage, updated annually and available in vector and raster formats. Key spatial layers collected include multimodal transportation networks, building footprints, land-use classifications, and Points of Interest (POIs) related to public amenities (Table 2). Population density data were obtained from Statistics Denmark [50] at a 1 km × 1 km grid resolution to facilitate detailed demographic and socio-economic equity analyses, as well as to identify underserved high-density regions. This data also formed the foundation for subsequent analytical steps.
All datasets were standardised to the ETRS89/UTM 32N coordinate system and checked for topological consistency to ensure alignment across layers. The dataset also underwent harmonisation, including geometry correction to remove false intersections and junction gaps, as well as cross-checking green-space polygons. Additionally, category harmonisation was applied to reconcile diverse POI taxonomies by mapping source classes to the three-level groups for the research purpose, as outlined in Table 3. Geocoding of tabular information further enabled mapping of building parcels and the assignment of appropriate categories. Network-based multimodal travel-time calculations were conducted to generate spatial accessibility metrics. A uniform spatial analysis grid (1 km × 1 km) was applied across the urban area, matching the resolution of population density data to prevent spatial mismatches. In the accessibility model, each amenity POI acted as an origin, and each grid cell functioned as a destination, enabling spatially precise accessibility evaluations.

3.3. Spatial Analysis and Accessibility Scoring

This study uses a multimodal spatial analysis framework to evaluate accessibility in Odense, focusing on walking and cycling within 5 and 10 min thresholds. These methods follow best practices in urban accessibility modelling [13,42] and utilise open-source routing and network-analysis tools (OSMnx, OpenTripPlanner) to simulate realistic travel conditions [2,27,37]. Accordingly, the amenity set and decay structure are grounded in activity-based travel theory and Odense’s network realities. Everyday amenities generate short, frequent trips and are therefore highly sensitive to proximity, while micro-scale supports influence the perceived usefulness of walking, especially for older adults, so they should be part of an equity-focused index [8,9,10,11,12]. Conversely, healthcare and cultural venues are lower-frequency destinations with flatter time–utility gradients. In a medium-sized European city where door-to-door travel is mainly by walking and cycling, 5 and 10 min catchments are realistically plausible and align with evidence that proximity and diversity suppress car use [8,9,10,11,12,13]. Finally, grid-based, population-normalised reporting enhances comparability and reduces MAUP artefacts [3,16,17,42].
A composite scoring model was developed to evaluate accessibility at the grid-cell level, integrating three interdependent components: (1) decay weighting based on travel time, (2) the functional value of individual amenities, and (3) the density and diversity of accessible services within each catchment area. Accessibility scores are calculated by combining the weighted utilities of reachable amenities for each mode, adjusted for travel time and service type, which are then categorised into three behavioural types: essential, occasional, and passive. This classification reflects usage frequency and mobility expectations, aligned with urban function theory [8,26]. Table 3 outlines the decay weights used, revealing sharper decay curves for essential amenities reflecting routine reliance and proximity sensitivity. In contrast, occasional amenities like healthcare centres and cultural venues are associated with longer acceptable travel times. While passive amenities are analysed only for active modes, emphasising their hyper-localised impact on walkability and spatial inclusiveness [9].
To unify diverse accessibility scores into a policy-relevant measure, the Multimodal Composite Accessibility Index (MCAI) was employed as a weighted indicator that combines access scores across all amenity categories and travel modes. Inspired by frameworks such as the CM2SFCA model [27] and PTAL [38], the MCAI consolidates access to various services within a single spatial framework. Using a network-based travel time analysis, the index was calculated and mapped separately for walking and cycling modes.
For each 1 km grid cell and amenity category, we identify network-reachable POIs (N-count of reachable amenities) within two nested catchments: N0–5 (0–5 min) and N0–10 (0–10 min). We then define the incremental ring N5–10 = N0–10 − N0–5 (subtract 5 min layer from the 10 min layer) and calculate a time-weighted access score S = w0–5·N0–5 + w5–10·N5–10, where time-decay weights (w) are specific to the domain and mode as indicated in Table 3 (e.g., walking to essential services: w0–5 = 1.0, w5–10 = 0.5–0.7; cycling: w0–5 = 1.0, w5–10 = 0.7–0.8) [8,26,37]. Category scores are then summed to derive a mode-specific MCAI per cell.
To compare across categories and locations, scores are min–max normalised to [0, 1] within each amenity type and mode before being aggregated. A combined MCAI for pedestrian and cycling mobility offers a single multimodal indicator of active-mode accessibility throughout the study area. Additionally, population density normalised ratios and composition indices comparing essential, occasional, and passive shares with resident density are used to identify demand–supply mismatches. For visualisation, we employed bivariate choropleth maps, showing population density alongside amenity density. This method effectively highlights cells that are densely populated but have few amenities, or vice versa.

4. Results

4.1. Analysis of the Spatial Distribution Patterns

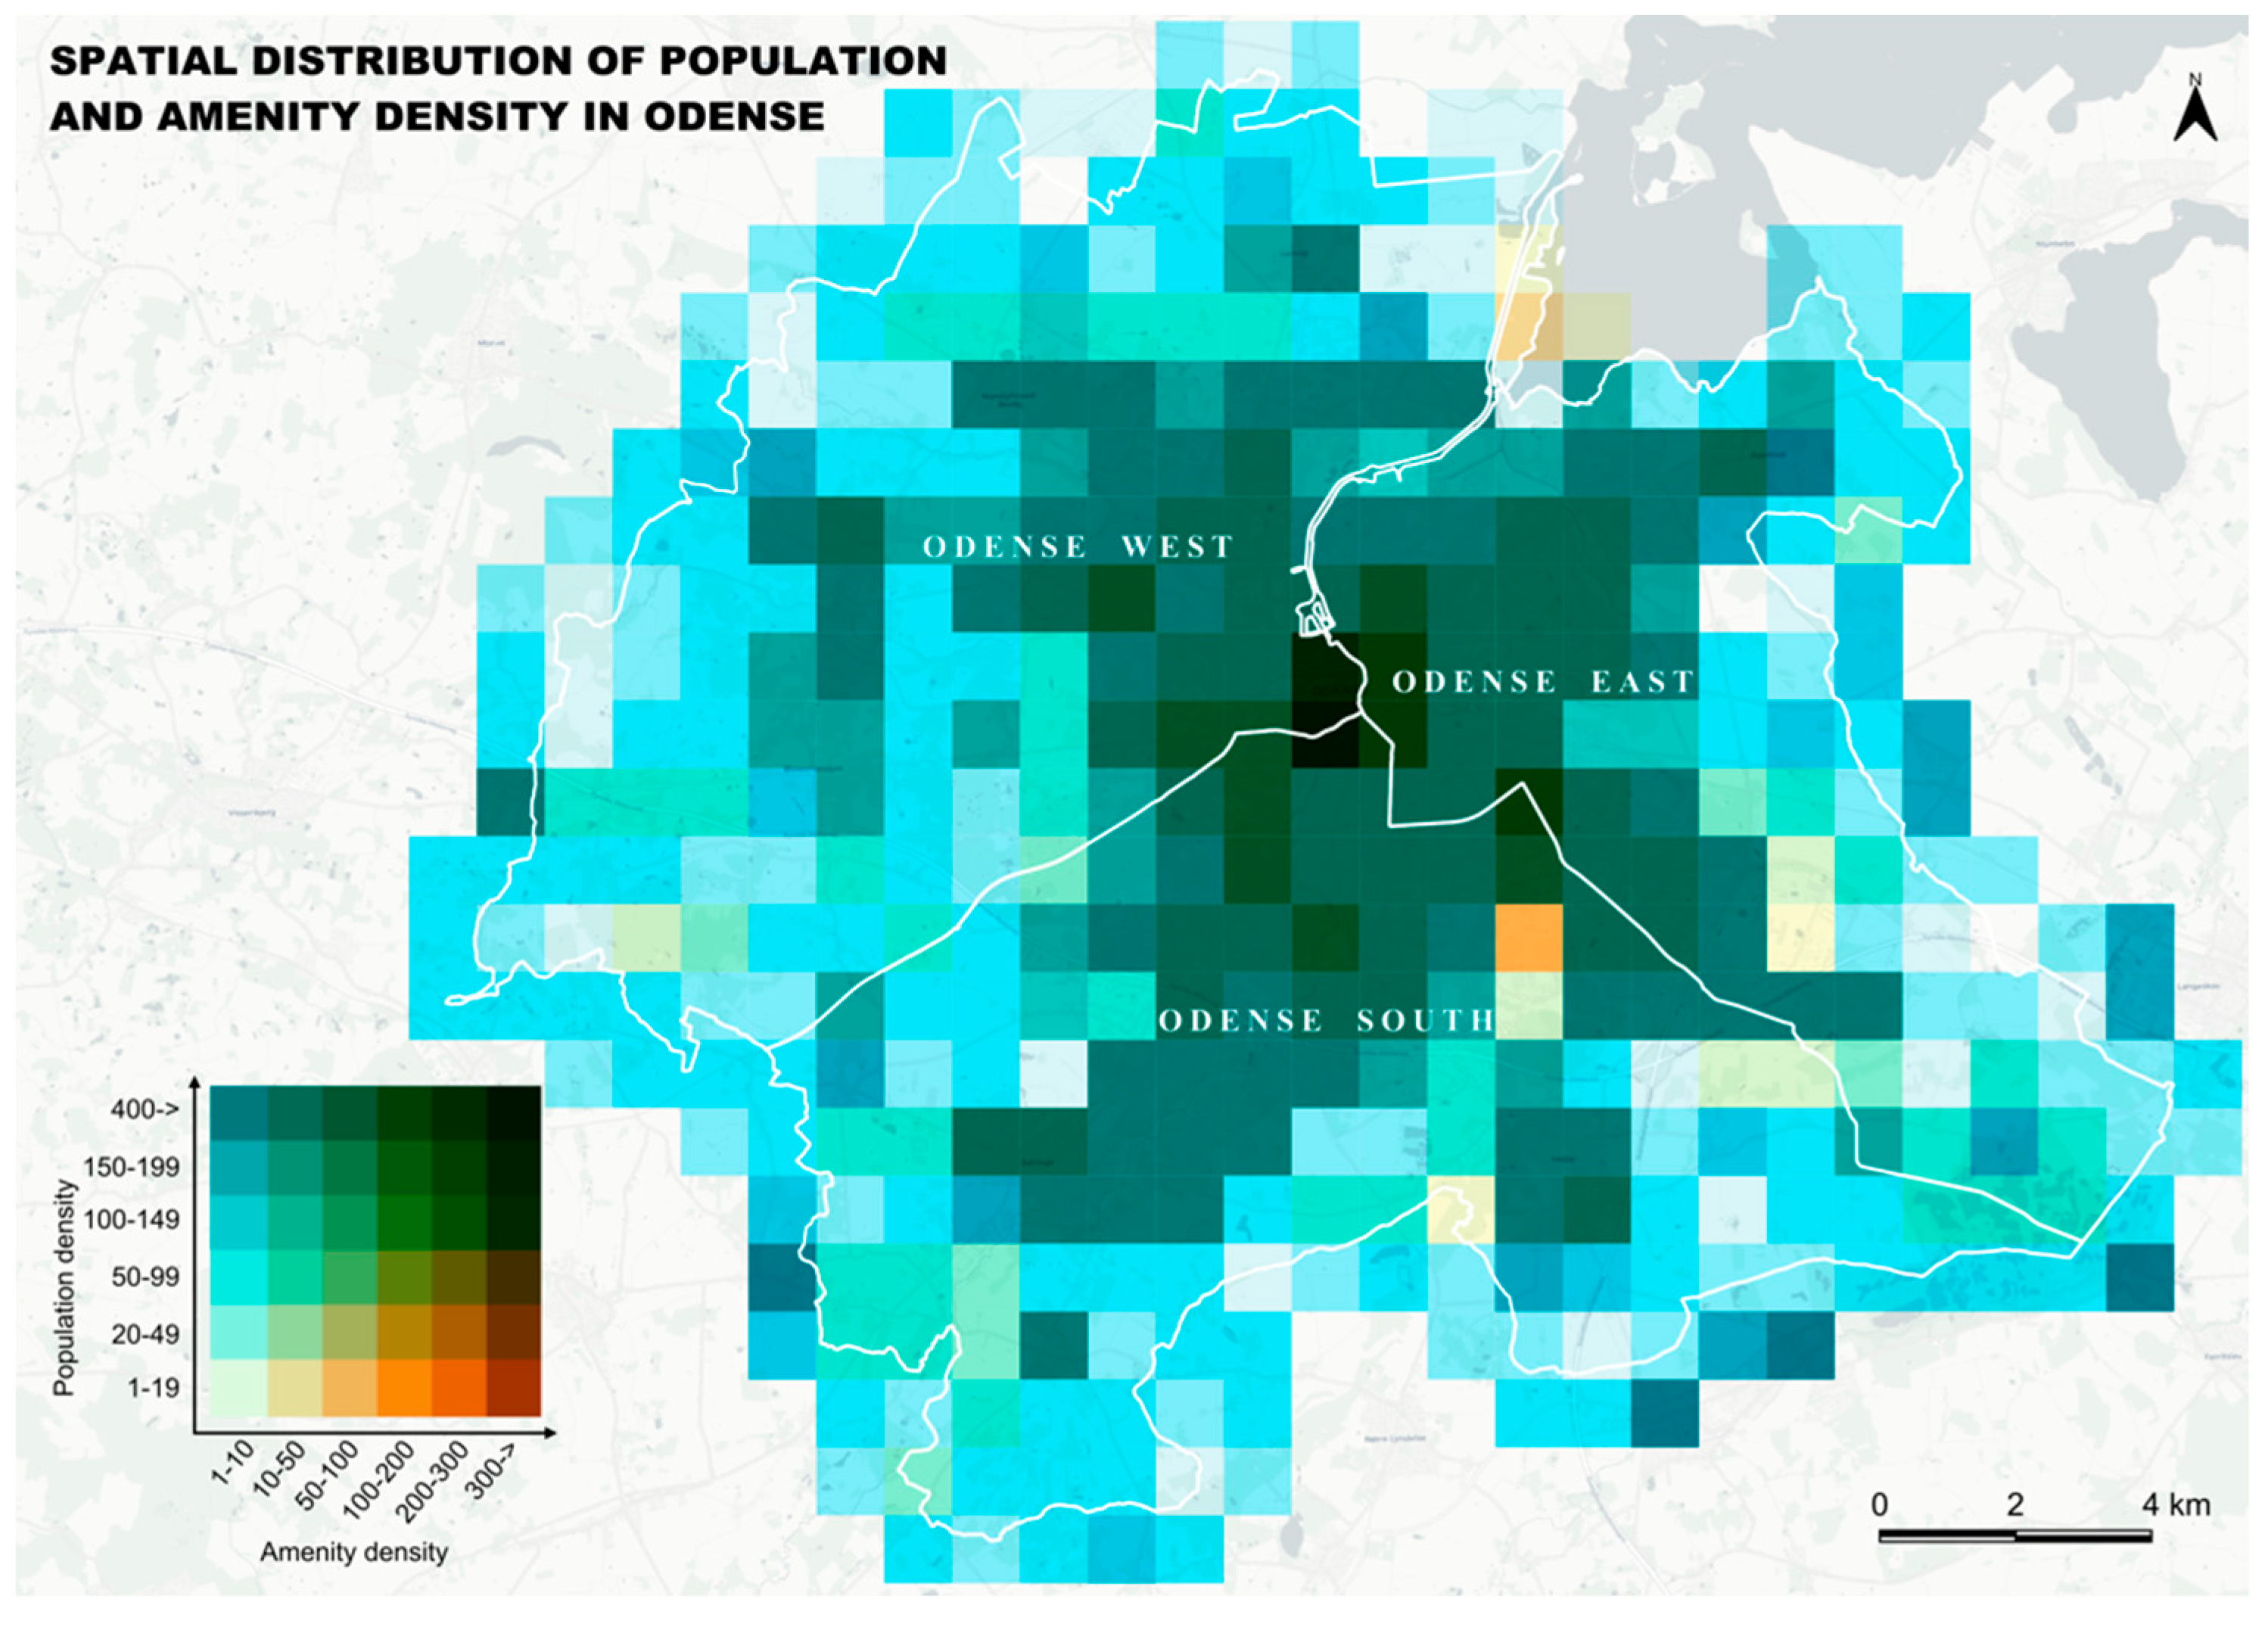
The spatial correlation between population density and amenity distribution in Odense uncovers complex urban patterns, marked by differences between central and peripheral areas. The varied spatial layout shows clear gradients of accessibility, shaping the city’s overall functional geography (Figure 2). Central Odense shows the highest levels of residential density, often surpassing 400 inhabitants per km2, consistently paired with moderate-to-high amenity densities (≥100 amenities per km2). This spatial alignment supports the compact city model, emphasising proximity-based accessibility by effectively combining residential areas with diverse urban amenities. These patterns reflect intentional urban planning strategies aimed at sustainable mobility, notably promoting pedestrian and cycling modes [2]. However, peripheral districts, especially in the southern and eastern sectors, diverge considerably from central patterns. Despite moderate-to-high residential densities (100–200 inhabitants per km2), many peripheral grid cells have disproportionately low amenity densities (≤50 amenities per km2). This spatial misalignment indicates spaces where population clusters lack sufficient local amenities, leading to reliance on alternative modes of mobility, mainly cycling or public transport. This phenomenon highlights a spatial disjunction in peri-central zones, reflecting a broader view on peri-urban amenity scarcity and functional decentralisation.
Several urban areas feature dense clusters of amenities, despite having moderate-to-low residential populations. These functional hubs, which often consist of commercial, educational, or recreational complexes, serve a city-wide audience. While they improve overall access to services, they can negatively impact local metrics related to proximity. This situation creates two types of deficits: (i) an exposure deficit, where high-population areas lack nearby essential services (high population/low amenities), and (ii) an allocation inefficiency, where amenities are poorly allocated in relation to the residents (low population/high amenities). The bivariate grid maps reflects this structure: approximately 35–40% of cells are categorised as high population/high amenities (mostly in central areas); around 25% exhibit an exposure deficit; about 20% show allocation inefficiency (often found in institutional or commercial areas); and the remaining roughly 20% are low population/low amenities located at the fringe.
Overall, these percentages indicate a city-wide mismatch between where people live and the local availability of services. It is notable that these imbalanced categories demonstrate how the placement of amenities can hinder accessibility in suburban neighbourhoods. This summary operationalises the interaction between population and services, highlighting where demand–supply mismatches occur. The high-high core aligns with a CPT baseline, while the significant shares of exposure deficits and allocation inefficiencies quantify systematic deviations from a uniform CPT gradient. This provides the first empirical support for our hypothesis and motivates a mode-specific MCAI analysis.
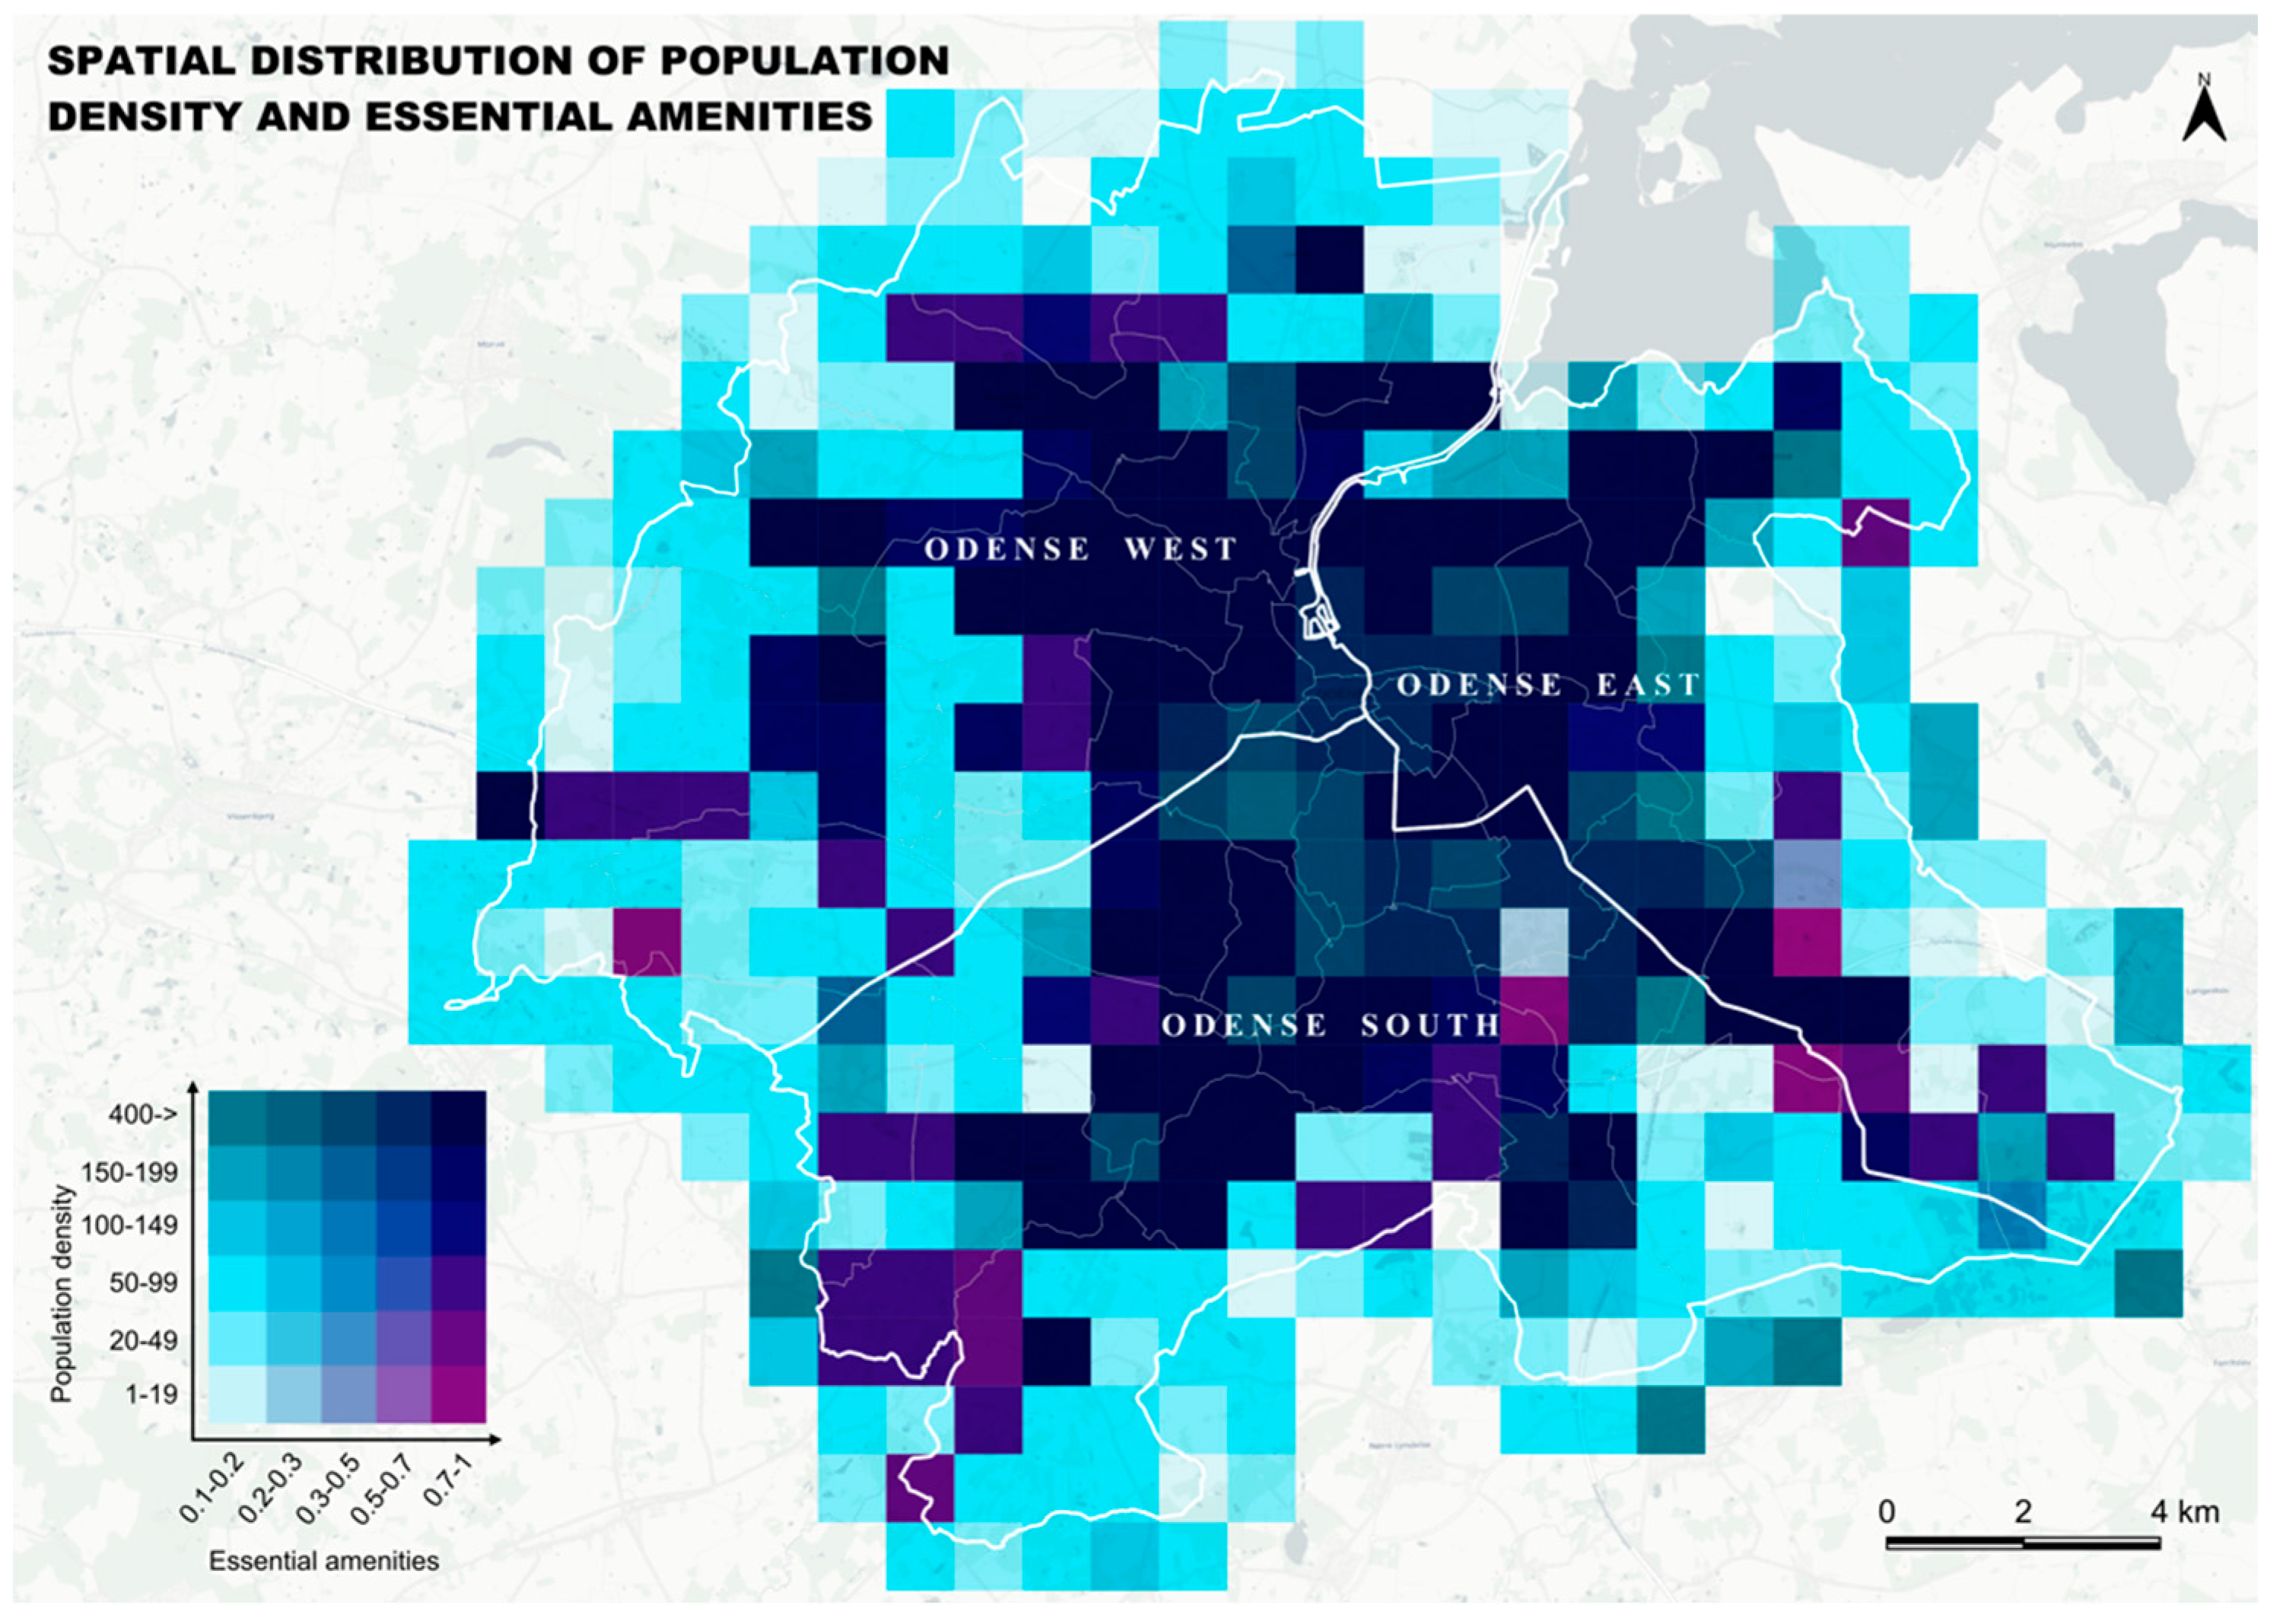
The disaggregated bivariate map for essential services reveals a decentralised pattern rather than a solely monocentric one (Figure 3). While the city centre contains the largest cluster of high-population/high-essential (≈40%) cells, sizeable peri-central pockets, most notably in Odense East/Southeast, fall into a high-population/low-essential (≈25%) class, indicating exposure-based gaps. About ≈15–20% of cells are low-population/high-essential, aligning with city-wide hubs whose catchments extend beyond the host neighbourhood, while the rest are low-population/low-essential peripheral cells. District summaries support this view: essential amenities are most prevalent in the South (42.4%), then West (31.8%), and least in the East (25.8%), highlighting an east-side deficit (Table 4). Under CPT, a clear centre-to-periphery gradient would be expected; our data partly support this baseline (the high–high core) but show systematic deviations in peri-central areas with high population and limited essential amenities, and in specialised hubs with low resident populations but abundant services. These deviations match our hypothesis of amenity-specific, uneven departures from the CPT gradient and justify the mode-specific tests to determine if walking versus cycling alleviates or worsens these mismatches.
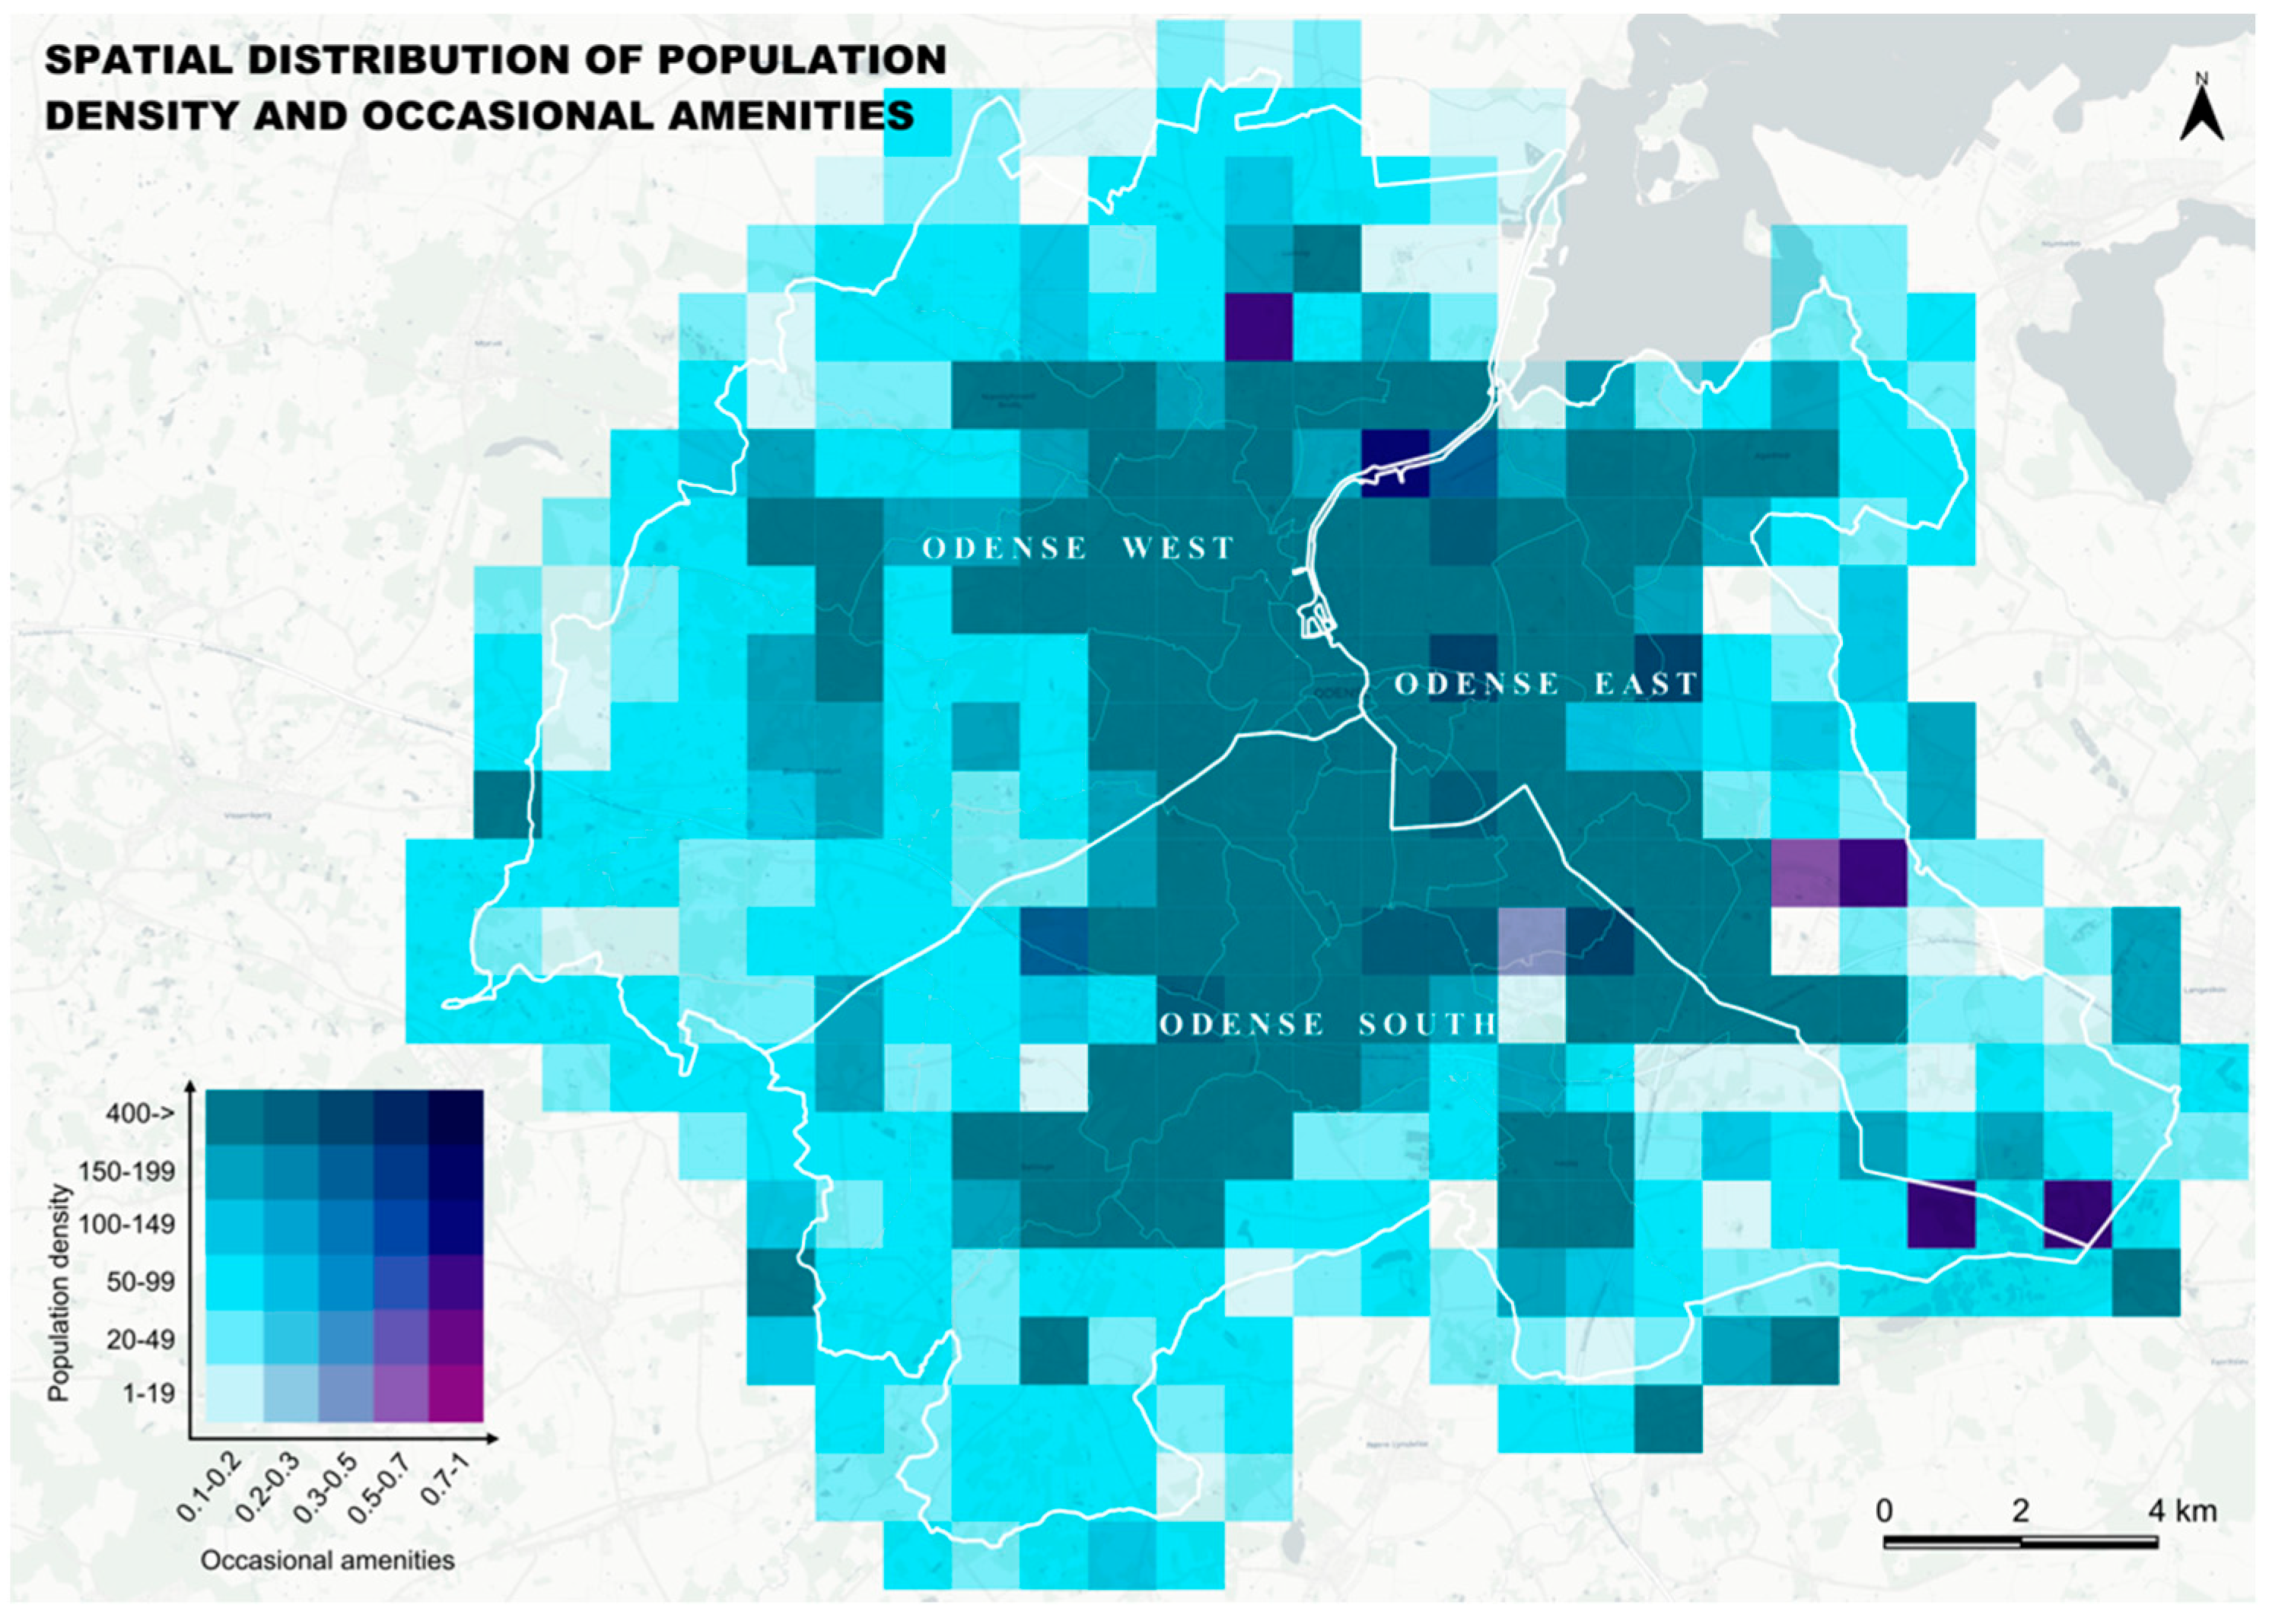
In contrast, the spatial distribution of occasional amenities displays a fragmented, population-linked pattern (Figure 4). Most high-population cells in the east and south fall into low/medium occasional-amenity categories, while high ratios of occasional amenities appear in scattered outer south-eastern and north-eastern cells, consistent with institutional or commercial hubs that serve city-wide catchments rather than nearby residents. District totals support this decoupling: the South holds the largest share of occasional amenities (~40.5%), the West about a third (~34.6%), and the East the smallest share (~24.9%; Table 4), aligning with its visible under-provision on the map. Overall, the spatial separation of occasional services from dense residential clusters departs from a simple CPT-style centre–periphery gradient and suggests greater reliance on cycling and transit (more than walking) to ensure equitable access to these less frequent, destination-oriented amenities and activities.
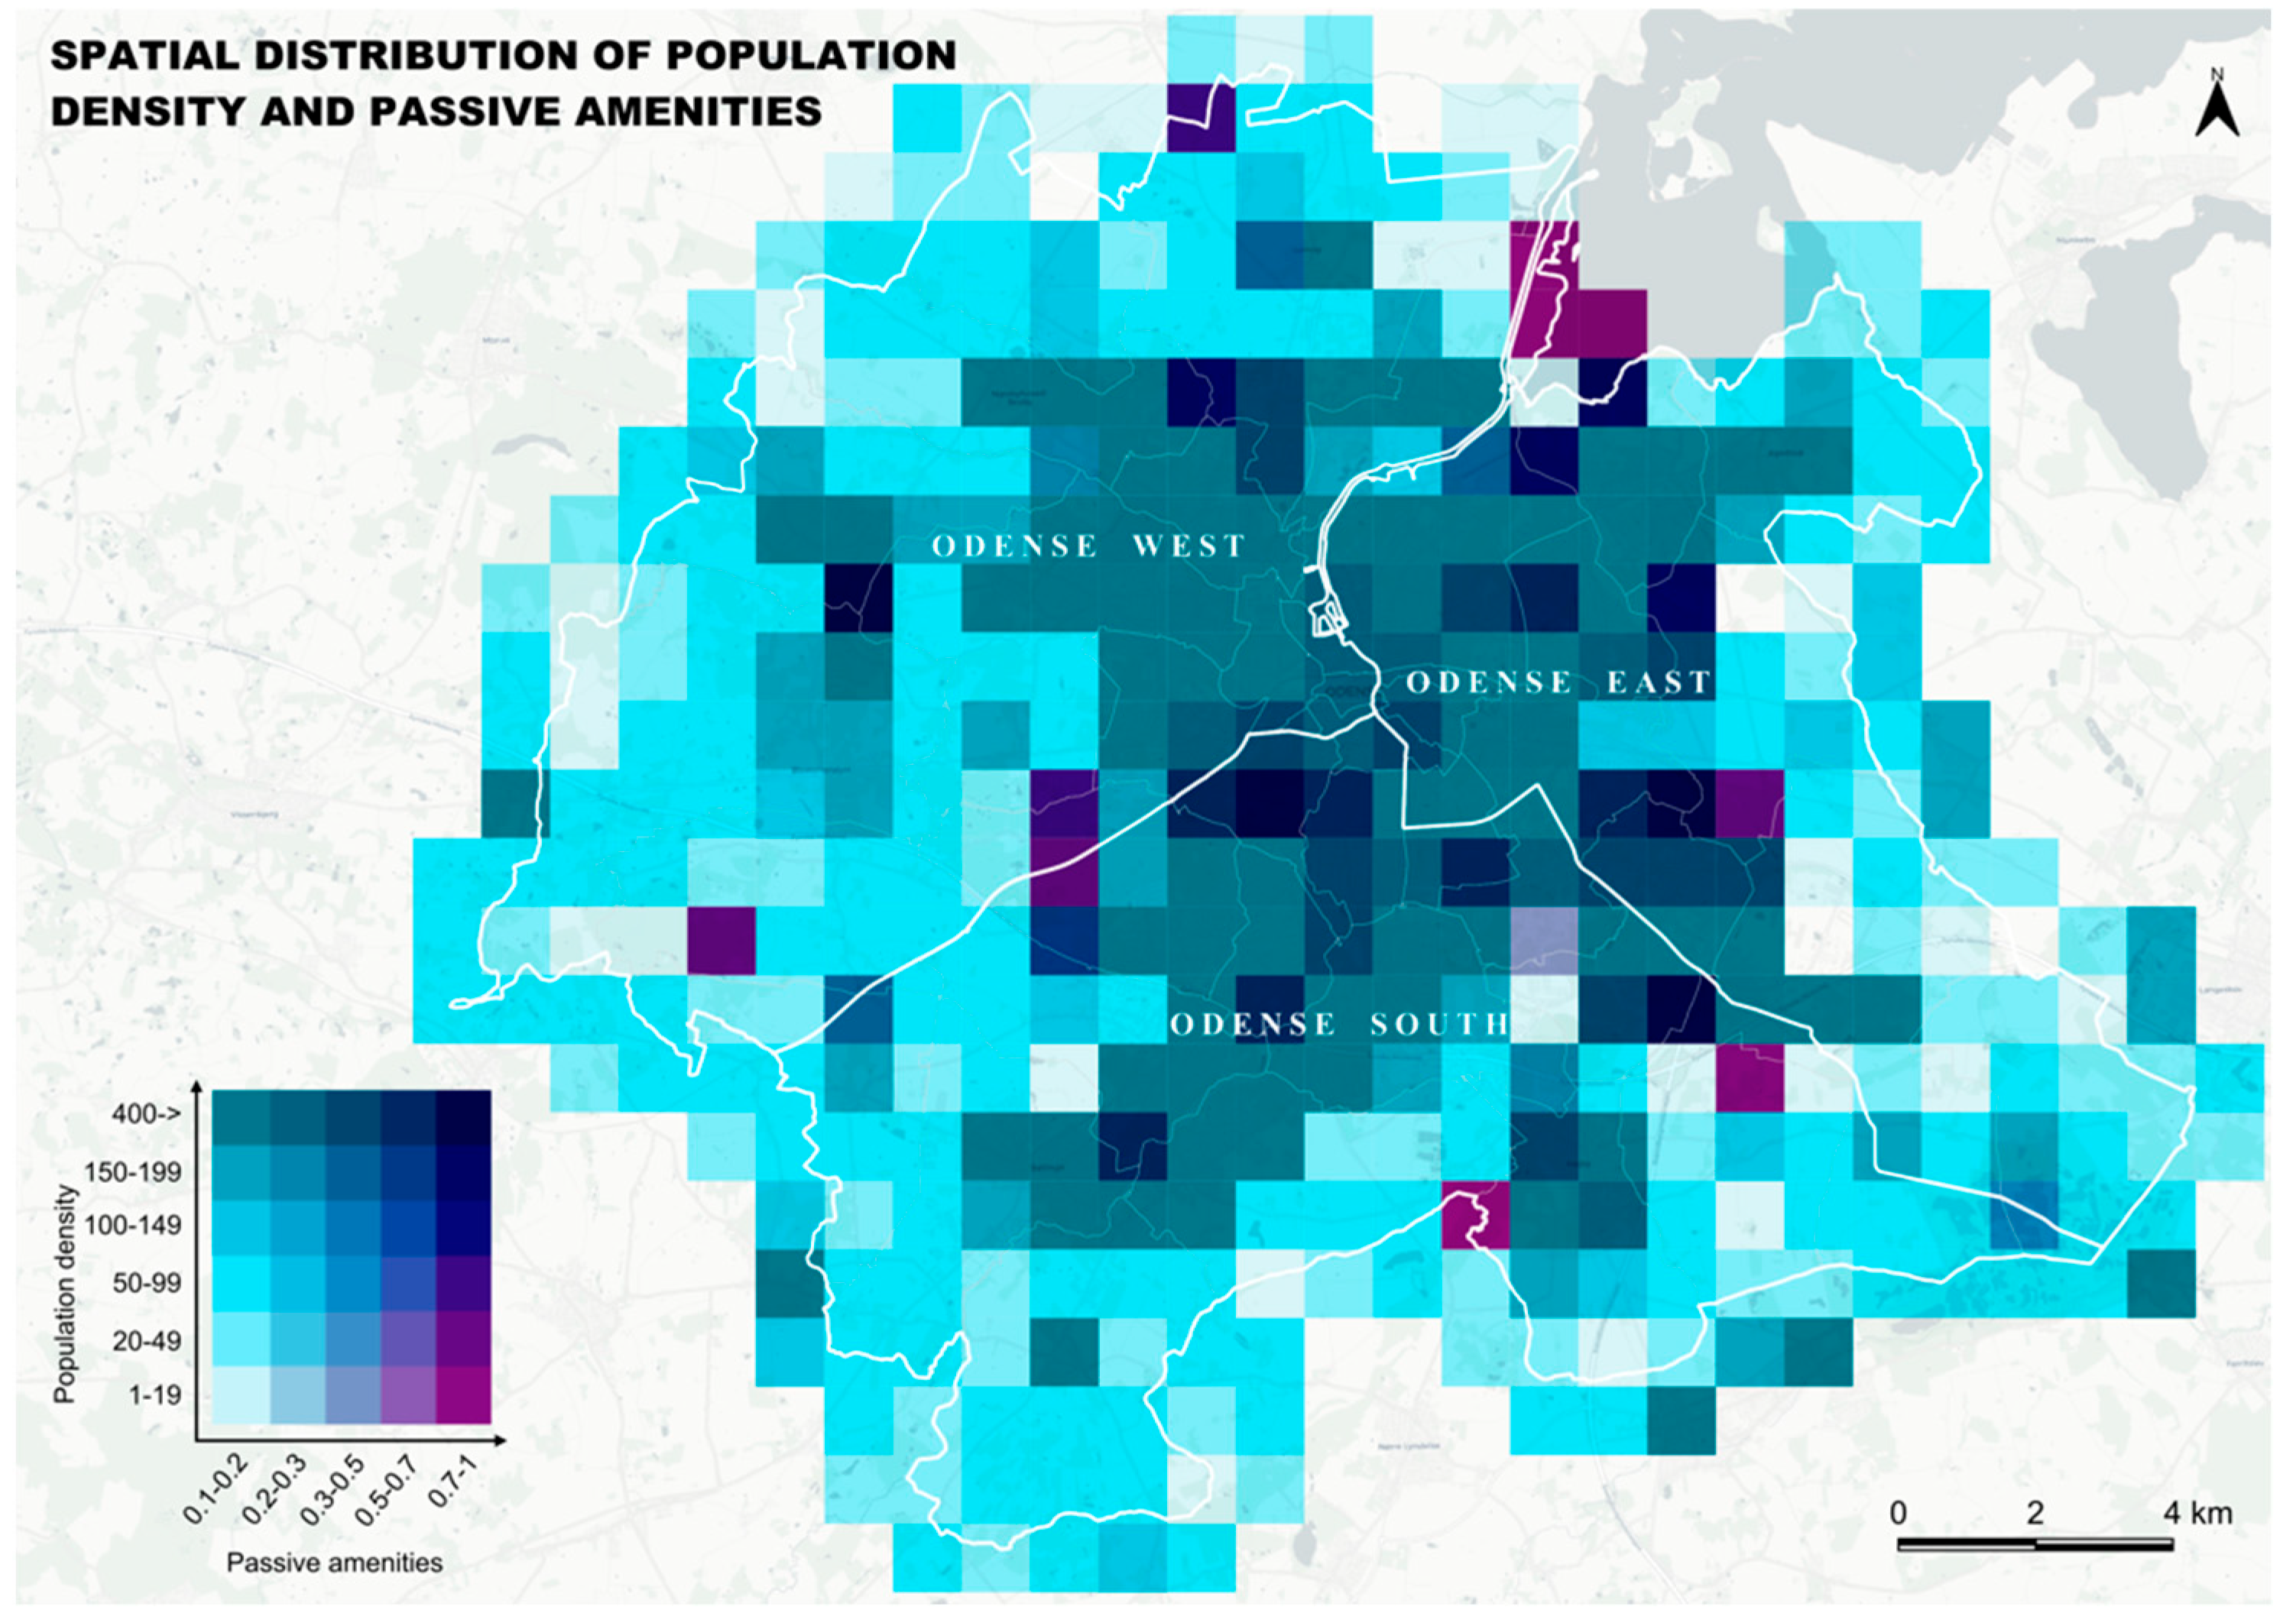
Passive amenities show an inverse relationship with population (Figure 5). Most high-density central cells are in a high-population/low-passive class, while many outer-ring cells are low-population/high-passive, creating two clear clusters in the north-east and south (aligned with peripheral parks and green corridors). A few areas in Odense West and Odense East break this pattern, likely due to recent, targeted greening efforts, but they do not compensate for the overall lack of amenities in dense neighbourhoods. This pattern differs from the CPT expectation of greater central provision and increases environmental-justice concerns: areas with the highest reliance on walking and densification pressures are also the ones with the thinnest supply of micro-infrastructure that supports age-friendly and inclusive mobility. Practically, the map highlights priority cells in the inner East and West where passive-to-population ratios are lowest and where small-scale interventions could produce the largest equity improvements.
These findings underscore the functional differentiation of amenity types and their spatial relationships within the urban fabric. Across districts, service composition reflects city-wide patterns. Odense South hosts the largest share of amenities (44.5%) and leads in both essential (42.4%) and passive (51.7%) services, resulting in the city’s most balanced provision (Table 4). Odense West has 29.5% of all amenities but is more specialised in occasional services (34.6%) and less in passive offerings (21.5%), indicating reliance on city-wide destinations for leisure and green spaces. Odense East has the smallest overall supply (26.0%) and the lowest proportion of occasional services (24.9%), supporting the idea of under-provision relative to its residential density noted earlier. Across the city, the bivariate matrix shows about 25% of cells with high population and low amenities (mainly in East and peri-central zones) and approximately 20% with low population and high amenities (institutional and commercial hubs).
These asymmetries highlight clear priorities: (i) densify everyday and micro-scale support in East; (ii) expand passive and green offerings in West; and (iii) manage demand and network access around South’s hubs to prevent over-reliance.
Analysing districts, the evidence supports our hypothesis of a non-uniform CPT gradient, while the core performs well for walking-based access; equitable provision in peripheral areas depends on targeted additions and robust cycling connectivity.

4.2. Mode-Specific Accessibility Patterns

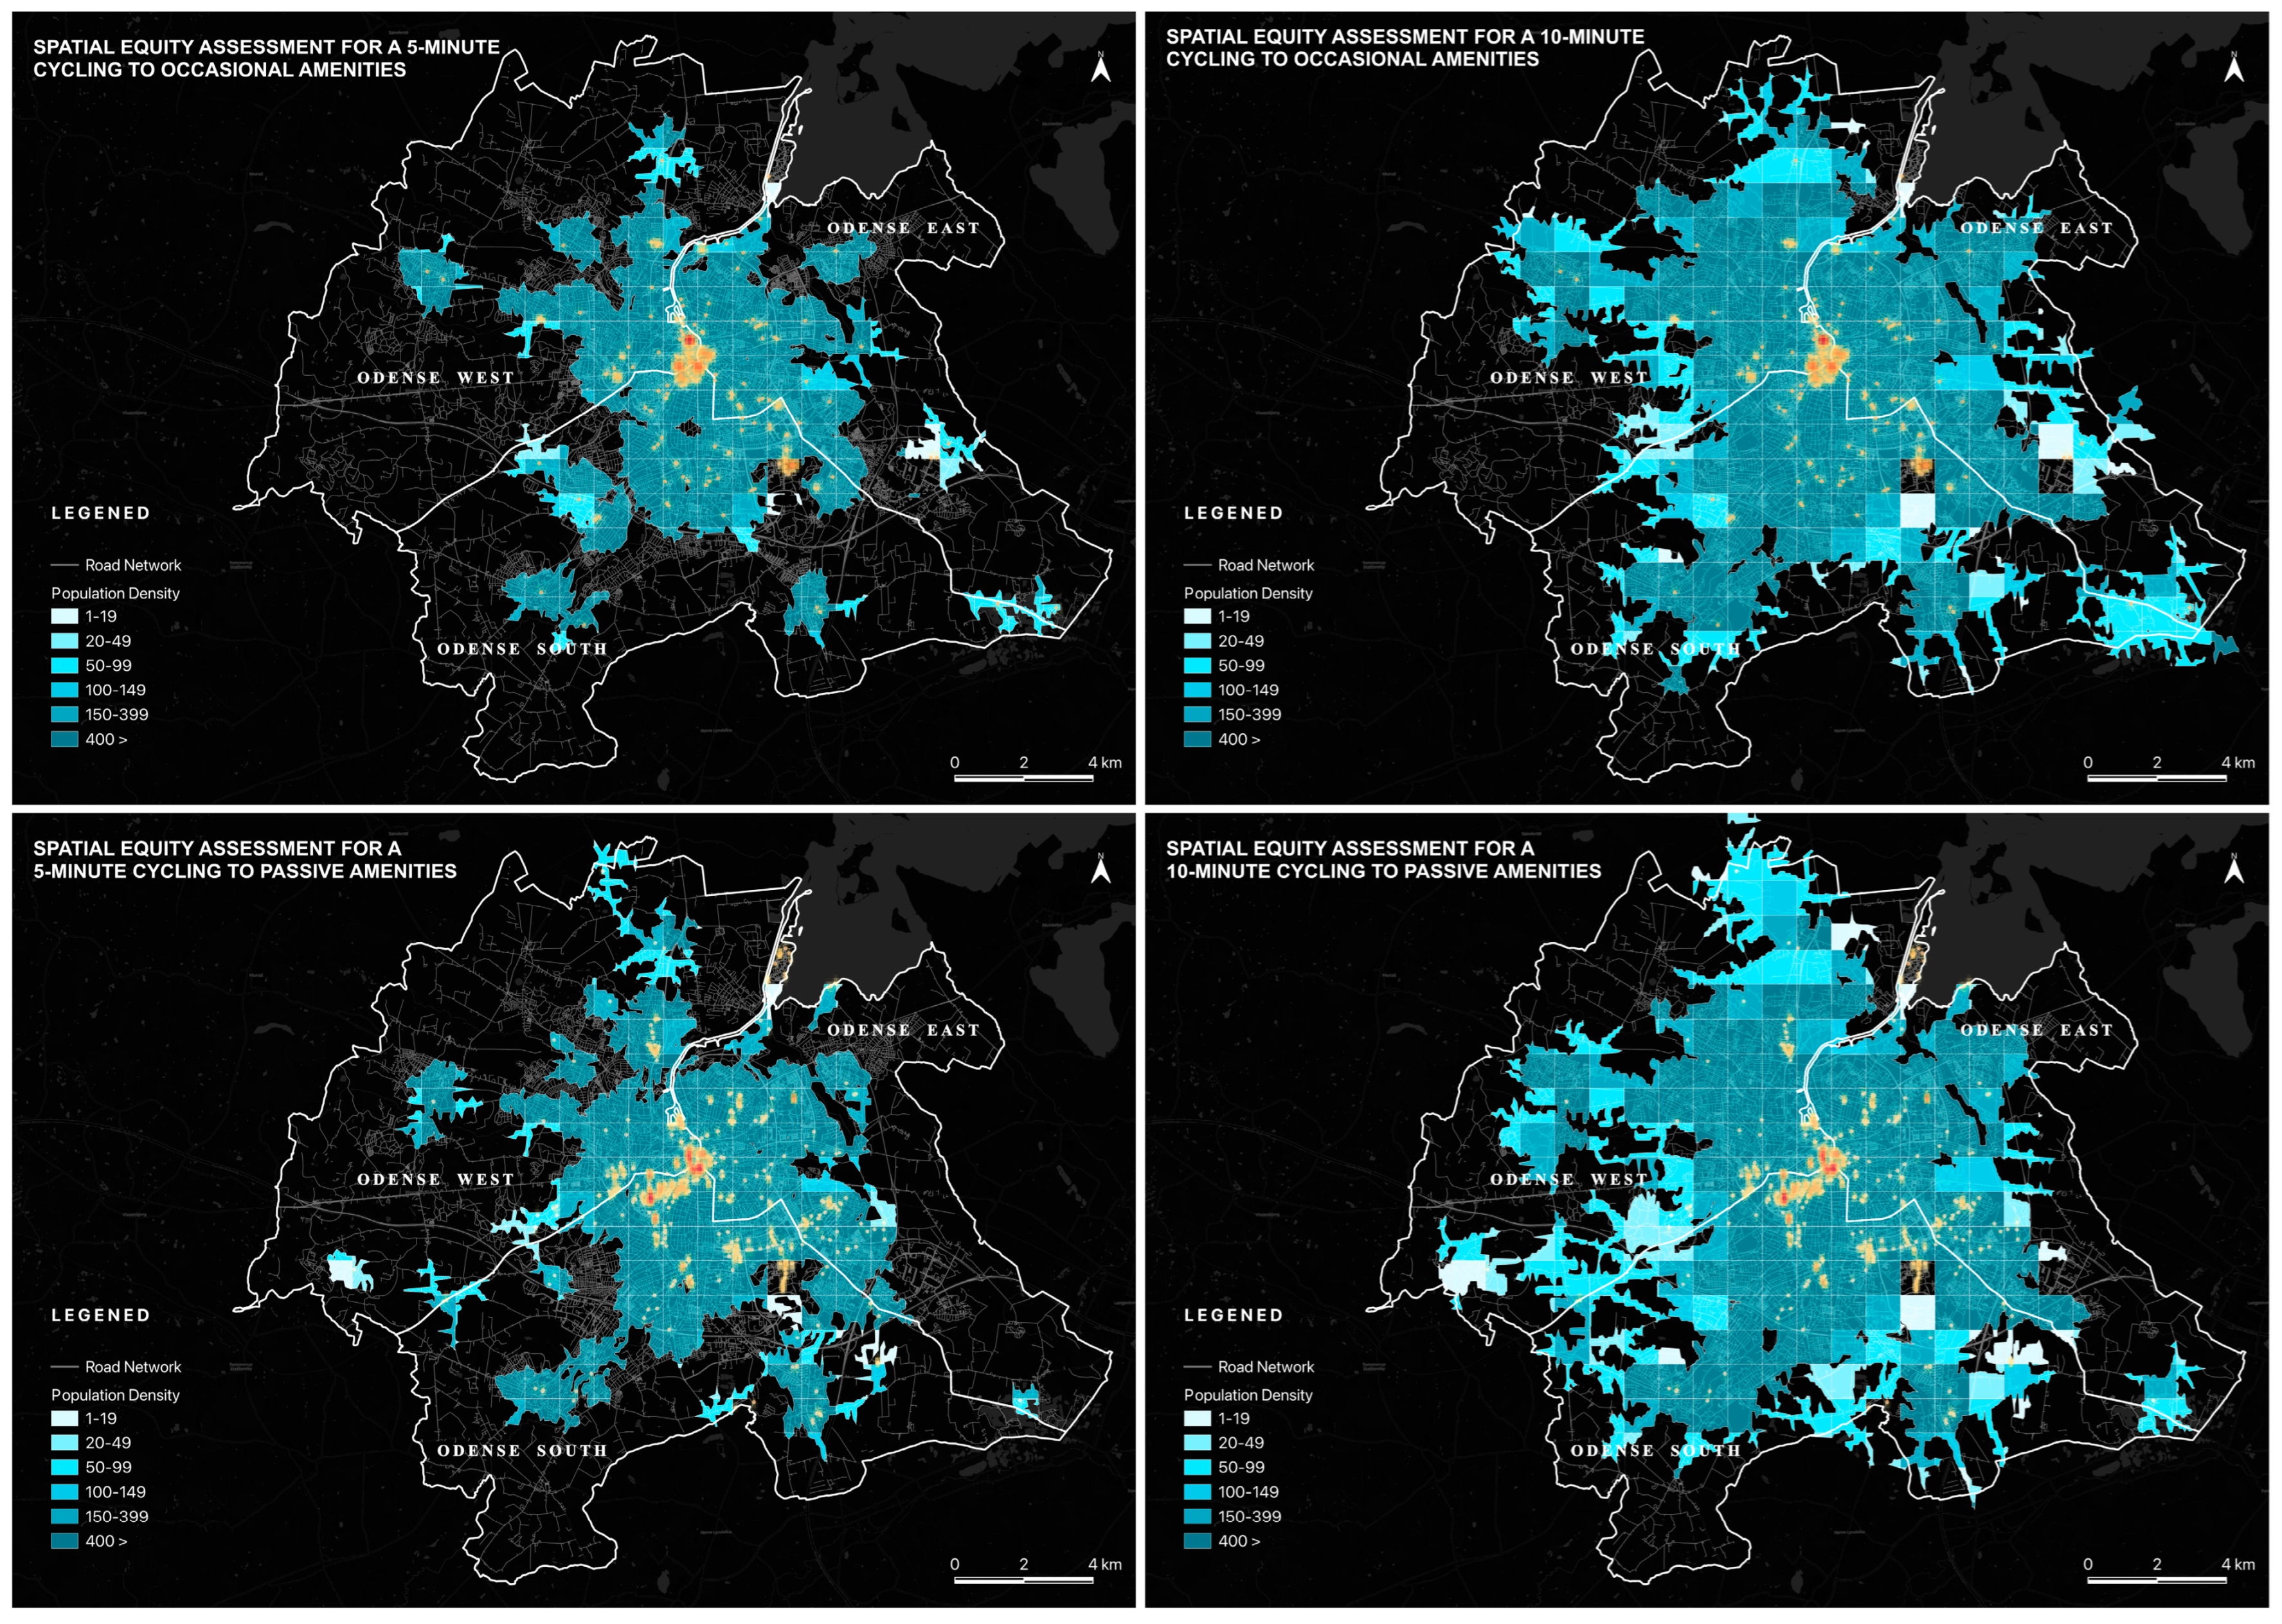
Building on the disparities in spatial distribution identified through the bivariate analysis, this section explores how walking and cycling modes influence accessibility inequalities. Network-based assessments of service areas for 5 min walking isochrones demonstrate that access to essential, occasional and passive amenities is highly centralised: contiguous catchments cluster around the inner core and rail hub, closely matching the highest amenity densities (Figure 6). Outside this core, only small, discontinuous “islands” of walk access appear, with the East especially patchy. Extending the time budget to 10 min on foot yields limited fringe gains; catchments extend along a few radial corridors and expand slightly into the West/South, but large parts of the outer districts remain outside walkable reach, particularly for occasional amenities. Passive amenities display a somewhat broader inner spread than occasional ones, yet still show gaps along dense residential edges, indicating that micro-scale supports are not continuously distributed along everyday walking routes. Overall, pedestrian results uphold the CPT-like central advantage while revealing equity-relevant shortfalls at the core–periphery interface, directly motivating the multimodal MCAI to quantify where walk access alone cannot meet demand.
Compared to walking, cycling greatly expands and connects catchments (Figure 7). Within 5 min, continuous bicycle isochrones extend far beyond the core, with strong coverage in Odense West and South; however, Odense East remains patchy, with several dense blocks outside overlapping catchments. At 10 min, cycling catchments cover nearly the entire city, reaching most suburban and peri-urban areas. Nevertheless, the co-location with amenity density is uneven: several eastern and south-eastern corridors show broad reach but limited amenity availability, indicating coverage without sufficient supply. In contrast, parts of the West and South combine large catchments with richer amenity fields, demonstrating effective multimodal access to passive and occasional destinations. These patterns partly reduce the CPT-style central advantage observed for walking by expanding practical reach to the periphery, but they also reveal mode-specific limitations where cycling access is high and amenities are scarce.
As hypothesised, the results show consistent differences by mode and amenity type: cycling lessens but does not eliminate inequalities, supporting the MCAI’s multimodal approach and the subsequent demand–supply diagnostics.

4.3. Multimodal Accessibility Analysis: A Comparative Assessment

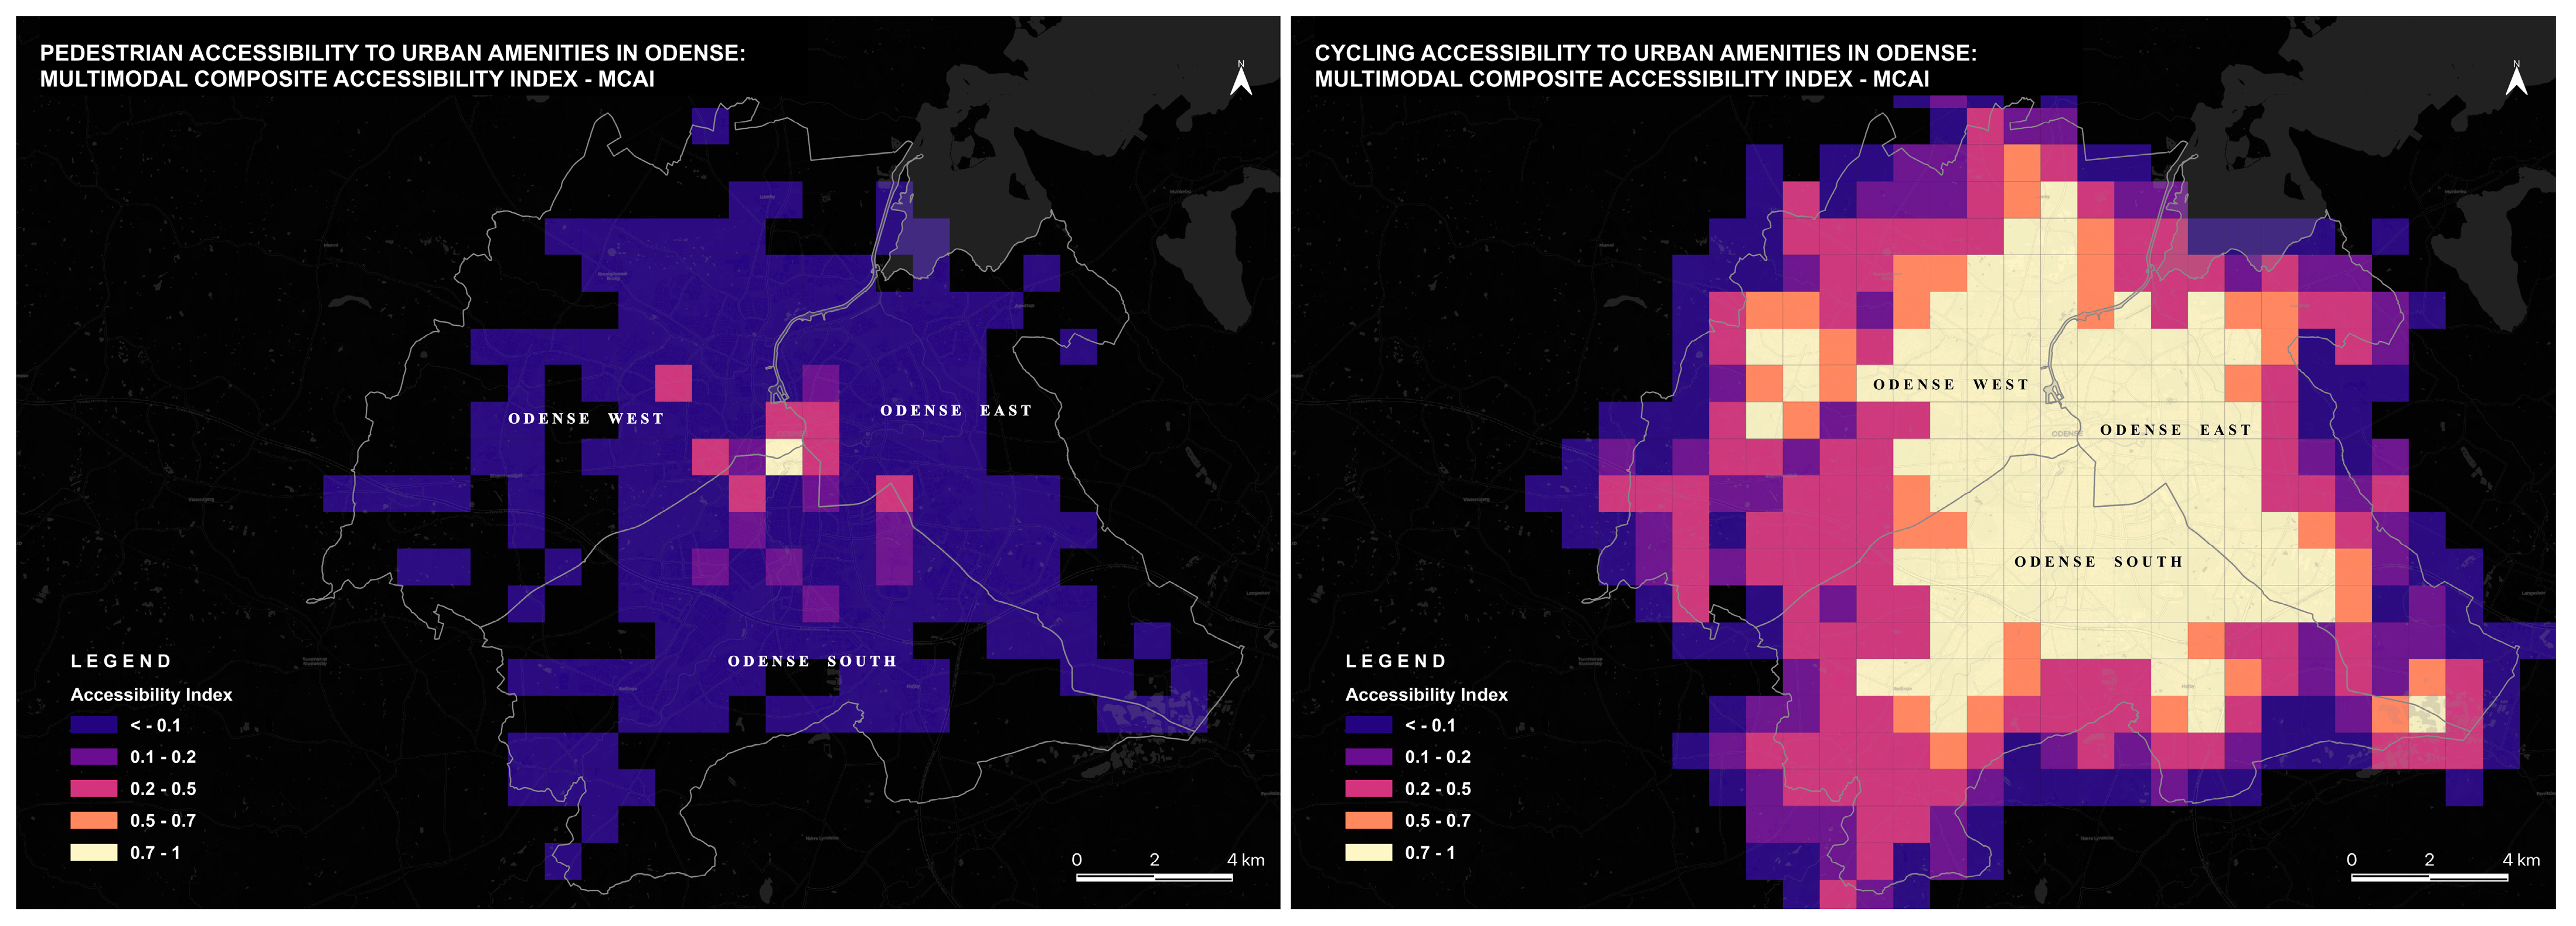
The spatial distribution of pedestrian and cycling accessibility in Odense, as shown by the MCAI maps in Figure 8, reveals two distinct but complementary accessibility patterns. Walking accessibility is concentrated and steep: scores above 0.7 are limited to a compact core around Odense Station and nearby mixed-use blocks, where dense amenity clusters coincide with a fine-grained street network. Beyond this core, values decline rapidly—large parts of the West and South areas record less than 0.1—indicating the limited functional radius for pedestrian travel and an increased risk of service exclusion for households relying on walking. This pattern represents the closest empirical example of a CPT-type gradient in our study and mirrors the density/amenity bivariate results in Section 4.1.
With cycling, the gradient becomes flatter and the area of moderate to high accessibility expands considerably. Most built-up cells fall within the 0.2–0.5 range, with several corridors and clusters exceeding 0.7 that extend along the primary cycle network. Cycling thus helps to bridge many of the pedestrian shortfalls identified in South and East, reflecting Odense’s supportive terrain, continuous links, and the more dispersed placement of occasional and green/recreational amenities. However, low-score pockets remain on the peripheral edges where services are limited or links are broken, indicating that network reach cannot fully replace missing local supply.
The cross-modal comparison clarifies where CPT holds and where it diverges from an equity perspective. In the historic core, both modes perform well, but in the inner-ring districts, especially parts of East and South, walking MCAI remains low while cycling MCAI is significantly higher, signalling reliance on cycling access to compensate for limited local provision. Conversely, scattered blocks with low scores on both modes highlight genuine demand–supply deficits rather than pure network effects. Overall, the maps support our hypothesis: CPT provides a useful baseline for short-walk access, while systematic, mode-specific differences emerge once cycling is considered, resulting in a more polycentric accessibility landscape.

5. Discussion

The MCAI was crafted to align measurement with the equity objectives outlined in Section 2 by emphasising behaviourally realistic access patterns and population needs within an urban and GIScience context. It utilises network travel time rather than Euclidean distance, capturing real-world network friction and accessibility. The model systematically integrates everyday and micro-scale amenities that facilitate routine, age-friendly mobility, and reflects GIS-based spatial analysis principles. Results are presented on a population-normalised grid, reducing boundary artefacts and illuminating demand–supply mismatches. When reliable capacity or quality data are available, a 2SFCA layer serves as a sensitivity analysis; otherwise, MCAI provides a behaviourally grounded baseline across categories with variable data inputs. This approach directly addresses the gaps identified in Section 2.2, contributing to urban GIScience methodologies for equitable mobility measurement.
It is noteworthy that, when contextualised within the CPT baseline framework, the findings substantiate the existence of a central–peripheral gradient in urban accessibility, while also elucidating the spatial loci and underlying reasons for its attenuation. A robust central accessibility core is identified (pedestrian MCAI > 0.7 within the historic city centre), consistent with principles of compact urban form and the role of spatial proximity and land-use diversity in mitigating automobile reliance [8,9,21,22,23,24,25]. Conversely, extensive peripheral corridors in the Western and Southern sectors display accessibility values below 0.1 on foot, despite moderate population densities, signposting limited pedestrian reach. These patterns support evidence that network connectivity metrics and the heterogeneity of local amenities serve as more salient determinants of pedestrian accessibility than mere Euclidean proximity [9,42]. Thus, although CPT remains a valuable normative baseline, its spatial explanatory power is context-dependent, varying markedly by mode of travel and amenity typology.
Mode comparisons elucidate the urban equity mechanisms at play within GIScience frameworks. Cycling emerges as a pivotal mode, serving as a spatially compensatory transport function that extends high MCAI scores into southern districts and eastern neighbourhoods, aligning with schedule-aware transit research indicating that non-pedestrian modes can effectively bridge spatial and infrastructural gaps [38,40,41,42]. From a spatial justice perspective, walking facilitates hyper-local equity by enhancing walkability within neighbourhoods, while cycling functions as a spatial bridging mode, mitigating place-based disadvantages for residents beyond traditional walkable catchments, thereby supporting more equitable urban mobility [6,29,37].
Amenity logics exhibit systematic variation. Certain destinations function as city-wide nodes with tenuous ties to residential configurations [12,36], whereas passive amenities tend to cluster in peripheral belts or targeted central districts, influencing perceived walkability and social inclusiveness more than mere quantitative counts [14,26]. These spatial patterns elucidate why a standardised 15 min neighbourhood metric may serve as a coarse heuristic in medium-scale urban systems [7]: localised daily needs are optimally met within 5–10 min walking buffers, yet achieving equitable accessibility across entire urban extents necessitates integration of cycling and transit networks, coupled with strategic spatial siting.
Positioned in relation to existing urban studies, MCAI enhances traditional gravity/2SFCA methodologies by incorporating capacity and rating-based assessments for specific service types, such as CM2SFCA for parks [20], youth-centric park equity analyses [35], and multimodal transit accessibility metrics [38]. Our contribution advances this framework by capturing city-wide, micro-scale dynamics through short, mode-specific thresholds and population normalisation, thereby enhancing the content validity of equity assessments while maintaining the robustness of 2SFCA where data reliability permits [6,37]. The characteristic pattern of core strengths amid peripheral gaps, observed in other multimodal spatial analyses [12,38], is further nuanced in our results, illustrating more distinctly how mode selection influences spatial equity diagnostics within a cycling-oriented, medium-sized urban context.
Finally, the socio-spatial implications become evident: the critical question pertains to the demographic composition of low-MCAI cells and the synergistic effects of service siting and network infrastructure enhancements in mitigating spatial inequities [6,29,37]. Population-normalised mismatch surface analyses identify Odense East and southern locales as priority zones where walking accessibility underperforms, and cycling serves only as a partial compensatory modality. In these urban cells, disparities in accessibility risk exacerbate socio-economic disadvantages related to healthcare access, daily logistics, and social engagement. Such patterns are confirmed across disciplines, including health geography, urban planning, and transportation geographies [27,35,37,38].

6. Conclusions

This research introduces the MCAI, a behaviourally grounded, network-normalised metric designed to quantify the presence and variation in central-to-peripheral gradients within a medium-sized urban context, with an emphasis on mode-specific and amenity type disparities. Applied to the city of Odense, the MCAI corroborates the existence of a core pedestrian zone characterised by values exceeding 0.7 confined to select central grid cells and delineates persistent peripheral zones with pedestrian access values below 0.1 despite moderate population densities, notably in the western and southern sectors. Bivariate classifications reveal that approximately 35–40% of urban cells constitute high-population/high-amenity areas (predominantly in the city centre), around 25% represent high-population/low-amenity zones (indicative of potential equity hotspots), roughly 20% are low-population/high-amenity locales (specialised hubs), with the remaining areas classified as low/low. The analysis highlights that cycling infrastructure substantially mitigates spatial inequities: 10 min cycling catchment areas markedly enhance accessibility in peripheral districts, especially in Odense South and parts of the eastern neighbourhoods. Category patterning underscores the spatial distribution of amenities: everyday services are more evenly dispersed; occasional amenities related to health and culture function as city-wide hubs with weak ties to residential density; passive amenities, such as green micro-supports, predominantly cluster in outer belts with designated pockets within the city core.
These findings answer the research questions by showing where and to what extent CPT holds and where it deviates, translating those deviations into actionable priorities. Equity in a medium-sized, cycling-oriented city cannot rely on a single, universal “15 min” heuristic. Instead, targets should be specific to mode and category: for everyday and micro-scale amenities, a 5 min walk to at least one grocery–pharmacy cluster supported by benches, shade, water, and toilets at age-sensitive densities; for occasional amenities, 10 min cycling access to at least one health and one cultural facility for most residents. The MCAI operationalises these goals through siting and network rules: ranking candidate locations by population × MCAI shortfall to place small amenities and micro-supports, and identifying critical sidewalk or bikeway links whose upgrade closes access gaps between hubs and residential areas; where transit co-produces access, layering headway-aware analytics to prioritise reliability improvements. Annual MCAI reporting on a 1 km grid provides a transparent way to monitor progress consistently.
Despite its effective application, several constraints limit our inferences. Inputs are diverse: POI completeness and capacity/quality attributes vary by amenity class; MCAI was therefore used for universal coverage, and 2SFCA only where reliable capacity data exist. Parameter sensitivity remains: short, mode-specific thresholds and simple, piece-wise decay enhance face validity but do not eliminate uncertainty. Network representation outside the core may overlook sidewalk continuity, crossing delays, and cycling-facility classes; transit schedules and reliability were not incorporated into the MCAI. The analysis is temporally static, and behavioural preference is not modelled. Finally, while a 1 km grid reduces MAUP compared to administrative units, it still smooths sub-neighbourhood variation. Methodological extensions can directly address these gaps: (1) integrate GTFS and co-produce a walk–bike–transit MCAI; (2) add sidewalk-specific graphs and cycling-facility typologies to better capture friction; (3) run global and individual sensitivity analyses on thresholds/decay and report uncertainty bands; (4) embed Huff-type destination choice or user ratings where available, and expand 2SFCA to domains with credible capacity/quality; (5) adopt multi-scale grids and test cross-scale consistency; (6) couple MCAI with critical-link analysis to quantify the marginal equity gain of candidate sidewalk/bikeway upgrades; (7) overlay socio-economic vulnerability to prioritise populations facing transport poverty.
Despite the limitations, MCAI offers a replicable, city-wide, multi-amenity, mode-specific, population-normalised index that functions as a complement to 2SFCA methodologies in contexts where data availability permits. The index reveals equity-related disparities that are often obscured by simple proximity counts, thereby enriching spatial analysis. Conceptually, MCAI advances the CPT paradigm for medium-sized urban environments: walking remains predominantly localised and sensitive to micro-scale variations, while cycling functions as a strategic bridging mode to address spatial gaps. This framework operationalises diagnostic insights into targeted siting and network development priorities, providing urban planners with a practical GIS-based tool to evaluate and address spatial accessibility gaps. However, future work could include a construct-aware benchmarking of MCAI against 2SFCA for categories with reliable capacity or quality attributes, along with decay-parameter sensitivity tests and small-area user validation, to enhance external validity and comparability.

Funding

This research received no external funding.

Data Availability Statement

The data presented in this study are openly available in INSPIRE Denmark at https://inspire-danmark.dk/ (accessed on 16 September 2025).

Conflicts of Interest

The author declares no conflict of interest.

References

  1. Lucas, K.; Mattioli, G.; Verlinghieri, E.; Guzman, A. Transport poverty and its adverse social consequences. Proc. Inst. Civ. Eng.—Transp. 2016, 169, 353–365. [Google Scholar] [CrossRef]
  2. Geurs, K.T.; van Wee, B. Accessibility evaluation of land-use and transport strategies: Review and research directions. J. Transp. Geogr. 2004, 12, 127–140. [Google Scholar] [CrossRef]
  3. Halden, D. Accessibility: Review of Measuring Techniques and Their Application. Edinburgh: Scottish Executive Central Research Unit, 2000. Available online: https://search.worldcat.org/title/45899730 (accessed on 20 June 2025).
  4. Curtis, C.; Scheurer, J. Planning for sustainable accessibility: Developing tools to aid discussion and decision-making. Prog. Plan. 2010, 74, 53–106. [Google Scholar] [CrossRef]
  5. Boisjoly, G.; El-Geneidy, A.M. The insider: A planners’ perspective on accessibility. J. Transp. Geogr. 2017, 64, 33–43. [Google Scholar] [CrossRef]
  6. Brown, A. From aspiration to operation: Ensuring equity in transportation. Transp. Rev. 2022, 42, 409–414. [Google Scholar] [CrossRef]
  7. Pozoukidou, G.; Chatziyiannaki, Z. 15-Minute City: Decomposing the New Urban Planning Eutopia. Sustainability 2021, 13, 928. [Google Scholar] [CrossRef]
  8. Elldér, E.; Haugen, K.; Vilhelmson, B. When local access matters: A detailed analysis of place, neighbourhood amenities and travel choice. Urban Stud. 2020, 59, 120–139. [Google Scholar] [CrossRef]
  9. Ottoni, C.A.; Sims-Gould, J.; Winters, M.; Heijnen, M.; McKay, H.A. Benches become like porches: Built and social environment influences on older adults’ experiences of mobility and well-being. Soc. Sci. Med. 2016, 169, 33–41. [Google Scholar] [CrossRef] [PubMed]
  10. Liu, D.; Wang, R.; Grekousis, G.; Liu, Y.; Lu, Y. Detecting older pedestrians and aging-friendly walkability using computer vision technology and street view imagery. Comput. Environ. Urban Syst. 2023, 105, 102027. [Google Scholar] [CrossRef]
  11. Moreira, F.D.; Rezende, S.; Passos, F. On-street toilets for sanitation access in urban public spaces: A systematic review. Util. Policy 2021, 70, 101186. [Google Scholar] [CrossRef]
  12. Wang, J.; Kwan, M.-P.; Liu, D.; Peng, X. Assessing the spatial distribution of and inequality in 15-minute PCR test site accessibility in Beijing and Guangzhou, China. Appl. Geogr. 2023, 154, 102925. [Google Scholar] [CrossRef]
  13. Alessandretti, L.; Orozco, L.G.N.; Saberi, M.; Szell, M.; Battiston, F. Multimodal urban mobility and multilayer transport networks. Environ. Plan. B Urban Anal. City Sci. 2022, 50, 2038–2070. [Google Scholar] [CrossRef]
  14. Siu, B.W. Assessment of physical environment factors for mobility of older adults: A case study in Hong Kong. Res. Transp. Bus. Manag. 2019, 30, 100370. [Google Scholar] [CrossRef]
  15. Talen, E. Measuring Urbanism: Issues in Smart Growth Research. J. Urban Des. 2003, 8, 195–215. [Google Scholar] [CrossRef]
  16. Burdziej, J. Using hexagonal grids and network analysis for spatial accessibility assessment in urban environments—A case study of public amenities in Toruń. Misc. Geogr.—Reg. Stud. Dev. 2019, 23, 99–110. [Google Scholar] [CrossRef]
  17. Li, T.; Fang, X.; Zhu, J.; Peng, Q.; Zhao, W.; Fu, X. Horizontal and Vertical Spatial Equity Analysis Based on Accessibility to Living Service Amenities: A Case Study of Xi’an, China. Land 2024, 13, 1113. [Google Scholar] [CrossRef]
  18. Tome, A.; Santos, B.; Carvalheira, C. GIS-Based Transport Accessibility Analysis to Community Facilities in Mid-Sized Cities. IOP Conf. Ser. Mater. Sci. Eng. 2019, 471, 062034. [Google Scholar] [CrossRef]
  19. Gonçalves, G.M.; Maraschin, C.; Maffini, A.L. An adapted centrality index to assess spatial accessibility in street networks: Application to two medium-sized cities in Brazil. J. Transp. Geogr. 2025, 126, 104238. [Google Scholar] [CrossRef]
  20. Campos-Sánchez, F.S.; Abarca-Álvarez, F.J.; Reinoso-Bellido, R. Assessment of open spaces in inland medium-sized cities of eastern Andalusia (Spain) through complementary approaches: Spatial-configurational analysis and decision support. Eur. Plan. Stud. 2019, 27, 1270–1290. [Google Scholar] [CrossRef]
  21. Dauphiné, A. Theories of Geographical Locations. Geogr. Models Math. 2017, 115–128. [Google Scholar] [CrossRef]
  22. Goodchild, M.F. Quantitative Methodologies. Int. Encycl. Hum. Geogr. 2009, 1–12, 27–32. [Google Scholar] [CrossRef]
  23. Næss, P. Residential location affects travel behavior—But how and why? The case of Copenhagen metropolitan area. Prog. Plan. 2005, 63, 167–257. [Google Scholar] [CrossRef]
  24. Horner, M.W. Location Analysis. Int. Encycl. Hum. Geogr. 2009, 1–12, 263–269. [Google Scholar] [CrossRef]
  25. Malczewski, J. Central Place Theory. Int. Encycl. Hum. Geogr. 2009, 1–12, 26–30. [Google Scholar] [CrossRef]
  26. Tannier, C.; Vuidel, G.; Houot, H.; Frankhauser, P. Spatial accessibility to amenities in fractal and nonfractal urban patterns. Environ. Plan. B Plan. Des. 2012, 39, 801–819. [Google Scholar] [CrossRef]
  27. Mao, K.; Li, J.; Yan, H. Measuring the Spatial Accessibility of Parks in Wuhan, China, Using a Comprehensive Multimodal 2SFCA Method. ISPRS Int. J. Geo-Information 2023, 12, 357. [Google Scholar] [CrossRef]
  28. Beatley, T. Biophilic Cities; Island Press: Washington, DC, USA, 2011. [Google Scholar]
  29. Lucas, K. Transport and social exclusion: Where are we now? Transp. Policy 2012, 20, 105–113. [Google Scholar] [CrossRef]
  30. Boisjoly, G.; El-Geneidy, A.M. How to get there? A critical assessment of accessibility objectives and indicators in metropolitan transportation plans. Transp. Policy 2017, 55, 38–50. [Google Scholar] [CrossRef]
  31. Sharifi, A. A critical review of selected smart city assessment tools and indicator sets. J. Clean. Prod. 2019, 233, 1269–1283. [Google Scholar] [CrossRef]
  32. Xue, K.; Yu, K.; Zhang, H. Accessibility analysis and optimization strategy of urban green space in Qingdao City Center, China. Ecol. Indic. 2023, 156, 111087. [Google Scholar] [CrossRef]
  33. Moreno, C.; Allam, Z.; Chabaud, D.; Gall, C.; Pratlong, F. Introducing the “15-Minute City”: Sustainability, Resilience and Place Identity in Future Post-Pandemic Cities. Smart Cities 2021, 4, 93–111. [Google Scholar] [CrossRef]
  34. Song, G.; He, X.; Kong, Y.; Li, K.; Song, H.; Zhai, S.; Luo, J. Improving the Spatial Accessibility of Community-Level Healthcare Service toward the ‘15-Minute City’ Goal in China. ISPRS Int. J. Geo-Inf. 2022, 11, 436. [Google Scholar] [CrossRef]
  35. Xing, L.; Liu, Y.; Wang, B.; Wang, Y.; Liu, H. An environmental justice study on spatial access to parks for youth by using an improved 2SFCA method in Wuhan, China. Cities 2020, 96, 102405. [Google Scholar] [CrossRef]
  36. Huff, D.L. A Probabilistic Analysis of Shopping Center Trade Areas. Land Econ. 1963, 39, 81. [Google Scholar] [CrossRef]
  37. El-Geneidy, A.; Levinson, D.; Diab, E.; Boisjoly, G.; Verbich, D.; Loong, C. The cost of equity: Assessing transit accessibility and social disparity using total travel cost. Transp. Res. Part A Policy Pr. 2016, 91, 302–316. [Google Scholar] [CrossRef]
  38. Żochowska, R.; Kłos, M.J.; Soczówka, P.; Pilch, M. Assessment of Accessibility of Public Transport by Using Temporal and Spatial Analysis. Sustainability 2022, 14, 16127. [Google Scholar] [CrossRef]
  39. Samovar, D.W.; Araldo, A.; El Yacoubi, M.A. AccEq-DRT: Planning Demand-Responsive Transit to Reduce Inequality of Accessibility. October 2023. Available online: https://arxiv.org/pdf/2310.04348 (accessed on 28 June 2025).
  40. Liu, D.; Guo, J.; Gu, Y.; King, M.; Han, L.D.; Brakewood, C. Analyzing Transit Systems Using General Transit Feed Specification (GTFS) by Generating Spatiotemporal Transit Networks. Information 2025, 16, 24. [Google Scholar] [CrossRef]
  41. Twardzik, E.; Schrack, J.A.; Porter, K.M.P.; Coleman, T.; Washington, K.; Swenor, B.K. TRansit ACessibility Tool (TRACT): Developing a novel scoring system for public transportation system accessibility. J. Transp. Health 2023, 34, 101742. [Google Scholar] [CrossRef]
  42. Blanchard, S.D.; Waddell, P. UrbanAccess: Generalized Methodology for Measuring Regional Accessibility with an Integrated Pedestrian and Transit Network. Transp. Res. Rec. J. Transp. Res. Board 2017, 2653, 35–44. [Google Scholar] [CrossRef]
  43. Deliry, S.I.; Uyguçgil, H. Accessibility assessment of urban public services using GIS-based network analysis: A case study in Eskişehir, Türkiye. Geo J. 2023, 88, 4805–4825. [Google Scholar] [CrossRef]
  44. Burdziej, J. A Web-based spatial decision support system for accessibility analysis—Concepts and methods. Appl. Geomat. 2011, 4, 75–84. [Google Scholar] [CrossRef]
  45. Stefanidis, R.-M.; Bartzokas-Tsiompras, A. Pedestrian Accessibility Analysis of Sidewalk-Specific Networks: Insights from Three Latin American Central Squares. Sustainability 2024, 16, 9294. [Google Scholar] [CrossRef]
  46. Gosal, A.; Ziv, G. Landscape aesthetics: Spatial modelling and mapping using social media images and machine learning. Ecol. Indic. 2020, 117, 106638. [Google Scholar] [CrossRef]
  47. Amin, A. Collective culture and urban public space. City 2008, 12, 5–24. [Google Scholar] [CrossRef]
  48. Zavadskas, E.K.; Bausys, R.; Mazonaviciute, I. Safety evaluation methodology of urban public parks by multi-criteria decision making. Landsc. Urban Plan. 2019, 189, 372–381. [Google Scholar] [CrossRef]
  49. Aceves-González, C.; Rizo-Corona, L.; Rosales-Cinco, R.; Rey-Galindo, J.; Ekambaram, K.; Ramos-Tachiquín, M. Assessing accessibility and safety conditions in an urban environment: What do pedestrians perceive? Adv. Intell. Syst. Comput. 2020, 954, 215–225. [Google Scholar] [CrossRef]
  50. Statistics Denmark. Available online: https://www.dst.dk/en/Statistik/emner/borgere/befolkning/befolkningstal (accessed on 18 January 2023).
  51. Danish Meteorological Institute. DMI. Available online: https://www.dmi.dk/ (accessed on 5 February 2023).
  52. INSPIRE Danmark. Available online: https://inspire-danmark.dk/ (accessed on 29 June 2025).
  53. INSPIRE Geoportal. Available online: https://inspire-geoportal.ec.europa.eu/srv/eng/catalog.search#/datathemes (accessed on 29 June 2025).
  54. Dataforsyningen. Available online: https://dataforsyningen.dk/ (accessed on 28 June 2025).
Figure 1. Odense’s geographic location, road network, population distribution, and other relevant features are shown on the open-source topographical map.
Urbansci 09 00407 g001
Figure 2. The spatial distribution of population density and amenity density in Odense delineates overall distinct spatial accessibility patterns and underscores disparities between central and peripheral urban regions. Population and amenity densities are depicted using a bivariate colour scheme legend at a grid-cell resolution, facilitating the identification of high-density zones with limited amenity availability and potential service deficiencies for Odense municipality, shown within the white boundaries.
Urbansci 09 00407 g002
Figure 3. The map shows the bivariate spatial relationship between population density and the ratio of essential amenities to passive and occasional amenities within grid cells for Odense municipality, shown within the white boundaries.
Urbansci 09 00407 g003
Figure 4. The map shows the bivariate spatial relationship between population density and the ratio of occasional amenities to essential and passive amenities within grid cells for Odense municipality, shown within the white boundaries.
Urbansci 09 00407 g004
Figure 5. The map shows the bivariate spatial relationship between population density and the ratio of passive amenities to essential and occasional amenities within grid cells for Odense municipality, shown within the white boundaries.
Urbansci 09 00407 g005
Figure 6. Pedestrian accessibility to occasional and passive amenities within 5 and 10 min walking distances across Odense. The blue colour on the maps indicates catchment areas, while the yellow-orange colour represents the density of the corresponding amenities.
Urbansci 09 00407 g006
Figure 7. Bicycle accessibility to occasional and passive amenities within 5 and 10 min cycling distances across Odense. The blue colour on the maps indicates catchment areas, while the yellow-orange colour represents the density of the corresponding amenities.
Urbansci 09 00407 g007
Figure 8. The MCAI represents standardised, time-weighted accessibility to urban amenities. The map values do not show raw decay weights from Table 3 but rather the final, normalised accessibility scores obtained after applying those weights and combining data across all amenity types and both time thresholds. Higher scores indicate grid cells with comparatively greater multimodal accessibility, while lower scores reflect areas with limited access via walking and cycling modes.
Urbansci 09 00407 g008
Table 1. Overview of amenity categories and sub-categories as identified in the scientific literature.
CategoriesSub-CategoryAccess FrequencyUrban ScalePrimary Function
HealthcareHospitals, general clinics, dental clinics, nursing homesOccasional/EmergencyCity/DistrictPhysical health and emergency response
EducationKindergartens, primary/secondary schools, universitiesRegular (daily/scheduled)Neighbourhood/DistrictLong-term social equity
Green SpacePublic parks, forest paths, urban nature areasFrequent (weekly/daily)Neighbourhood/CityRecreation, environmental quality, mental health
Public TransportBus stops, metro stations, train stations, transfer hubsHigh frequency/dailyNeighbourhood/CityMobility, urban connectivity, transit equity
Everyday AmenitiesGrocery stores, corner shops, bakeries, convenience shops, pharmacies, etc.DailyNeighbourhoodFulfilling routine errands and basic daily needs
Micro-ScaleBenches, drinking water fountains, public toilets, etc.Passive/
continuous
Street/BlockWalkability support, comfort, inclusivity
CulturalLibraries, museums, theatres, religious sites, monumentsOccasionalCity/Districtleisure, civic participation, social equity
Table 2. The table summarises the datasets employed in this study, detailing their format, spatial resolution, key characteristics, relevance to the research objectives, and the respective data providers.
Spatial LayersResolutionFormatCharacteristicsRelevance Source
BoundariesMunicipality/sub-municipalityVectorHierarchical structure, boundary geometries.Study area extent.INSPIRE-Danmark, klimadatastyrelsen
Road NetworkDetail street-levelGPKGCycling, pedestrian, urban, secondary, highways, etc.Road network for analyses.INSPIRE-Danmark, klimadatastyrelsen
Population1 km × 1 km grid resolution, GPKGContains population counts and densities.Population distribution for weighting accessibility.Statistics Denmark
BuildingParcel levelGPKGBuildings footprint area and typeUrban structure, density proxies, etc.INSPIRE-Danmark, klimadatastyrelsen
Land-UseParcel levelGPKGResidential, commercial, industrial, etc.Contextualising accessibility patterns.INSPIRE-Danmark, klimadatastyrelsen
Points of Interest (POIs)Point-basedGPKGLocations and type of public amenities.Destination in the accessibility model.INSPIRE-Danmark, klimadatastyrelsen
Table 3. Travel time-decay weights by mode and amenity type as used to compute the final combined MCAI score (the combined MCAI is derived as the mean value of walking and cycling access scores per amenity category and time threshold, and is represented in Figure 7), providing a holistic indicator of active mobility accessibility for spatial planning.
Amenity TypeAmenity CategoryTravel Time (min)Walking WeightCycling Weight
Essential Everyday
Education
Green space
Public transport
0–51.01.0
5–100.5–0.70.7–0.8
Occasional Healthcare
Cultural
0–51.01.0
5–100.5–0.70.7–0.8
PassiveMicro-scale0–51.01.0
5–100.50.6
Table 4. The counts and percentage shares of each amenity type across the administrative districts of Odense. These ratios illustrate the relative abundance or scarcity of amenities in districts throughout the urban zones.
Amenity TypeDistrictCountRatio (%)
EssentialWest59031.8
East47825.8
South78542.4
PassiveWest15921.5
East19926.9
South38351.7
OccasionalWest10734.6
East7724.9
South12540.5
Disclaimer/Publisher’s Note: The statements, opinions and data contained in all publications are solely those of the individual author(s) and contributor(s) and not of MDPI and/or the editor(s). MDPI and/or the editor(s) disclaim responsibility for any injury to people or property resulting from any ideas, methods, instructions or products referred to in the content.